08 10 FORM 10K - Herman Miller
69
Form 10-K 1 United States Securities and Exchange Commission Washington, DC 20549 Form 10-K Annual Report Under Section 13 or 15(d) of the Securities Exchange Act of 1934 Transition Report Pursuant to Section 13 or 15(d) of the Securities Exchange Act of 1934 For Fiscal Year Ended May 29, 2004 Commission File No. 001-15141 Herman Miller, Inc. (Exact name of registrant as specified in its charter) Michigan (State or other jurisdiction of incorporation or organization) 38-0837640 (I.R.S. Employer Identification No.) 855 East Main Avenue, PO Box 302, Zeeland, Michigan 49464-0302 (Address of principal executive offices) (Zip Code) Registrant’s telephone number, including area code: (616) 654 3000 Securities registered pursuant to Section 12(b) of the Act: None Securities registered pursuant to Section 12(g) of the Act: Common Stock, $.20 Par Value (Title of Class) Indicate by check mark whether the registrant (1) has filed all reports required to be filed by Section 13 or 15(d) of the Securities Exchange Act of 1934 during the preceding 12 months (or for such shorter period that the registrant was required to file such reports), and (2) has been subject to such filing requirements for the past 90 days. Yes No Indicate by check mark if disclosure of delinquent filers pursuant to Item 405 of Regulation S-K is not contained herein, and will not be contained, to the best of registrant’s knowledge, in definitive proxy or information statements incorporated by reference in Part III of this Form 10-K or any amendment to this Form 10-K. Indicate by check mark whether the registrant is an accelerated filer (as defined in Rule 12b-2 of the Act). Yes No The aggregate market value of the voting stock held by “nonaffiliates” of the registrant (for this purpose only, the affiliates of the registrant have been assumed to be the executive officers and directors of the registrant and their associates) as of November 29, 2003, was $1,845,866,973 (based on $26.05 per share which was the closing sale price as reported by NASDAQ). The number of shares outstanding of the registrant’s common stock, as of July 30, 2004: Common stock, $.20 par value—71,253,605 shares outstanding. Documents Incorporated by Reference Certain portions of the Registrant’s Proxy Statement for the Annual Meeting of Shareholders to be held on September 27, 2004, are incorporated into Part III of this report. X X X X L
Transcript of 08 10 FORM 10K - Herman Miller
Form 10-K 1
United States Securities and Exchange Commission Washington, DC 20549
Form 10-K
Annual Report Under Section 13 or 15(d) of the Securities Exchange Act of 1934
Transition Report Pursuant to Section 13 or 15(d) of the Securities Exchange Act of 1934
For Fiscal Year Ended May 29, 2004Commission File No. 001-15141Herman Miller, Inc.(Exact name of registrant as specified in its charter)Michigan(State or other jurisdiction of incorporation or organization)38-0837640(I.R.S. Employer Identification No.)855 East Main Avenue, PO Box 302, Zeeland, Michigan 49464-0302(Address of principal executive offices) (Zip Code)Registrant’s telephone number, including area code: (616) 654 3000Securities registered pursuant to Section 12(b) of the Act: NoneSecurities registered pursuant to Section 12(g) of the Act: Common Stock, $.20 Par Value
(Title of Class)
Indicate by check mark whether the registrant (1) has filed all reports required to be filed by Section 13 or 15(d) of theSecurities Exchange Act of 1934 during the preceding 12 months (or for such shorter period that the registrant wasrequired to file such reports), and (2) has been subject to such filing requirements for the past 90 days. Yes No
Indicate by check mark if disclosure of delinquent filers pursuant to Item 405 of Regulation S-K is not contained herein,and will not be contained, to the best of registrant’s knowledge, in definitive proxy or information statementsincorporated by reference in Part III of this Form 10-K or any amendment to this Form 10-K.
Indicate by check mark whether the registrant is an accelerated filer (as defined in Rule 12b-2 of the Act). Yes No
The aggregate market value of the voting stock held by “nonaffiliates” of the registrant (for this purpose only, theaffiliates of the registrant have been assumed to be the executive officers and directors of the registrant and theirassociates) as of November 29, 2003, was $1,845,866,973 (based on $26.05 per share which was the closing saleprice as reported by NASDAQ).
The number of shares outstanding of the registrant’s common stock, as of July 30, 2004:
Common stock, $.20 par value—71,253,605 shares outstanding.
Documents Incorporated by Reference
Certain portions of the Registrant’s Proxy Statement for the Annual Meeting of Shareholders to be held on September27, 2004, are incorporated into Part III of this report.
X
X
X
X
L
Table of Contents
Part IPage Number in the Form 10-K3 Item 1 Business6 Item 2 Properties6 Item 3 Pending Legal Proceedings6 Item 4 Submission of Matter to a Vote of Security Holders7 Executive Officers of the Registrant
Part IIPage Number in the Form 10-K8 Item 5 Market for the Registrant’s Common Equity and Related Shareholder Matters10 Item 6 Selected Financial Data12 Item 7 Management’s Discussion and Analysis of Financial Condition and Results of Operations26 Item 7A Quantitative and Qualitative Disclosures about Market Risk27 Item 8 Financial Statements and Supplementary Data62 Item 9 Changes in and Disagreements with Accountants on Accounting and Financial Disclosures62 Item 9A Controls and Procedures
Part IIIPage Number in the Form 10-K62 Item 10 Directors and Executive Officers of the Registrant62 Item 11 Executive Compensation63 Item 12 Security Ownership of Certain Beneficial Owners and Management63 Item 13 Certain Relationships and Related Transactions63 Item 14 Principal Accountant Fees and Services
Part IVPage Number in the Form 10-K63 Item 15 Exhibits, Financial Statement Schedule, and Reports on Form 8-K65 Signatures66 Report of Independent Registered Public Accounting Firm on Financial Statement Schedule67 Schedule II Valuation and Qualifying Accounts68 Exhibit Index
2 Herman Miller, Inc., and Subsidiaries
Part 1
Item 1 Business
General Development of Business
The company researches, designs, manufactures and distributes interior furnishings and provides related services thatsupport companies all over the world. The company’s products are sold primarily to or through independent contractoffice furniture dealers. Through research, the company seeks to define and clarify customer needs and problemsexisting in its markets and to design, through innovation where appropriate and feasible, products, systems, andservices as solutions to such problems. Ultimately, the company seeks to assist its customers in creating great placesto work.
Herman Miller, Inc., was incorporated in Michigan in 1905. One of the company’s major plants and its corporate officesare located at 855 East Main Avenue, PO Box 302, Zeeland, Michigan, 49464-0302, and its telephone number is(616) 654-3000. Unless otherwise noted or indicated by the context, the term “company” includes Herman Miller, Inc.,its predecessors, majority-owned subsidiaries, and as of May 29, 2004, consolidated variable interest entities. Furtherinformation relating to principles of consolidation is provided in the Significant Accounting and Reporting Policiesdisclosure in Note 1 to the Consolidated Financial Statements included in Item 8 of this report.
Financial Information About Industry Segments
Information relating to industry segments is provided in the Operating Segments disclosure in Note 21 to theConsolidated Financial Statements included in Item 8 of this report.
Narrative Description of Business
The company’s principal business consists of the research, design, development, manufacture, and sale of officefurniture systems, products, and related services. Most of these systems and products are designed to be used together.
The company is a leader in design and development of furniture and furniture systems. This leadership is exemplified bythe innovative concepts introduced by the company in its modular systems Action Office®, Q™ System, Ethospace®, andResolve®. Action Office, the company’s series of three freestanding office partition and furnishing systems, is believed tobe the first such system to be introduced and nationally marketed and, as such, popularized the “open plan” approachto office space utilization. Ethospace is a system of movable full- and partial height walls, with panels and individualwall segments that interchangeably attach to a wall framework. It includes wall attached work surfaces and storage/display units, electrical distribution, lighting, organizing tools, and freestanding components. Resolve is a more flexiblesystems solution based on 120-degree angles around a steel pole and uses fabric screens and canopies for spacedefinition. The company also offers a broad array of seating (including Aeron®, Mirra™, Equa®, Ergon®, Ambi®, andReaction® office chairs), storage (including Meridian® filing products), wooden casegoods (including Geiger products),and freestanding furniture products (including Passage® and Abak).
The company’s products are marketed worldwide by its own sales staff, its owned dealer network, independent dealersand retailers, and via the Internet. Salespersons work with dealers, the design and architectural community, as well as directly with end-users. Independent dealerships concentrate on the sale of Herman Miller products and somecomplementary product lines of other manufacturers. Approximately 66 percent of the company’s sales in the fiscalyear ended May 29, 2004 were made to or through independent dealers. The remaining sales were made directlyto end users, including federal, state, and local governments, and several major corporations, by either the company’sown sales staff, its owned dealer network, or independent retailers.
The company is also a recognized leader within its industry for the use, development, and integration of customer-centered technologies that enhance the reliability, speed, and efficiency of its operations. This includes proprietary salestools, interior design and product specification software, order entry and manufacturing scheduling and productionsystems, and direct connectivity to the company’s suppliers.
The company’s furniture systems, seating, storage, casegoods and freestanding furniture products, and relatedservices are used in (1) office/institution environments including offices and related conference, lobby and lounge
Form 10-K 3
areas, and general public areas including transportation terminals; (2) health/science environments includinghospitals and other healthcare facilities; (3) clinical, industrial, and educational laboratories; and (4) residential andother environments.
New Product and Industry Segment InformationDuring the past 12 months, the company has not made any public announcement of, or otherwise made publicinformation about, a new product or a new industry segment that would require the investment of a material amountof the company’s assets or that would otherwise result in a material cost.
Raw MaterialsThe company’s manufacturing materials are available from a significant number of sources within the United States,Canada, Europe, and Asia. To date, the company has not experienced any difficulties in obtaining its raw materials.The raw materials used are neither unique to the industry nor are they rare. As a result of market conditions, steelprices have risen dramatically in recent months. This trend has not affected the company’s ability to obtain such rawmaterials; however, there is a risk that the increasing prices could potentially affect the supply of steel in the future.Further information relating to raw material costs is provided in Management’s Discussion and Analysis of FinancialCondition and Results of Operations included in Item 7 hereof.
Patents, Trademarks, Licenses, Etc.The company has approximately 170 active United States utility patents on various components used in its productsand approximately 101 active United States design patents. Many of the inventions covered by the United Statespatents also have been patented in a number of foreign countries. Various trademarks, including the name andstyle “Herman Miller” and the “Herman Miller Symbolic M” trademark are registered in the United States and manyforeign countries. The company does not believe that any material part of its business depends on the continuedavailability of any one or all of its patents or trademarks, or that its business would be materially adverselyaffected by the loss of any thereof, except the “Herman Miller,” “Action Office,” “Aeron,” “Mirra,” “PostureFit,”“Ergon,” “Equa,” “Ethospace,” “Resolve,” “Geiger,” and “Herman Miller Symbolic M,” and “Eames Lounge ChairConfiguration” trademarks. The average remaining life of such patents and trademarks is approximately 6 yearsand 10 years, respectively.
Working Capital PracticesInformation concerning the company’s inventory levels relative to its sales volume can be found under the ExecutiveBusiness Overview section in Item 7 of this report. Beyond this discussion, the company does not believe that it or theindustry in general has any special practices or special conditions affecting working capital items that are significantfor understanding the company’s business.
Customer BaseNo single dealer accounted for more than 4 percent of the company’s net sales in the fiscal year ended May 29, 2004.For fiscal 2004, the United States Government, through its General Services Administration (GSA), was the largestsingle end user customer accounting for 10.0 percent of the company’s net sales. By comparison, GSA accounted for9.6 percent and 8.1 percent of the company’s net sales for fiscal 2003 and fiscal 2002, respectively. The 10 largestcustomers accounted for approximately 19.9 percent of net sales. The company does not believe that its businessdepends on any single or small number of customers, the loss of which would have a materially adverse effect uponthe company.
Backlog of OrdersAs of May 29, 2004, the company’s backlog of unfilled orders was $209.5 million. At May 31, 2003, the company’sbacklog totaled $182.0 million. It is expected that substantially all the orders forming the backlog at May 29, 2004,will be filled during the current fiscal year. Many orders received by the company are reflected in the backlog for onlya short period while other orders specify delayed shipments and are carried in the backlog for up to one year.Accordingly, the amount of the backlog at any particular time does not necessarily indicate the level of net sales for aparticular succeeding period.
Government ContractsOther than standard price reduction and other provisions contained in contracts with the United States Government,the company does not believe that any significant portion of its business is subject to material renegotiation of profitsor termination of contracts or subcontracts at the election of various government entities.
CompetitionAll aspects of the company’s business are highly competitive. The company competes largely on design, product and
4 Herman Miller, Inc., and Subsidiaries
service quality, speed of delivery, and product pricing. Though the company is one of the largest office furnituremanufacturers in the world, in several of the markets it competes with many smaller companies and with severalmanufacturers that have significantly greater resources and sales.
Research, Design and DevelopmentThe company draws great competitive strength from its research, design and development programs. Accordingly, thecompany believes that its research and design activities are of significant importance. Through research, the companyseeks to define and clarify customer needs and problems and to design, through innovation where feasible andappropriate, products and services as solutions to these customer needs and problems. The company uses bothinternal and independent research and design resources. Exclusive of royalty payments, the company spentapproximately $34.6 million, $33.3 million, and $33.9 million on design and research activities in fiscal 2004,2003, and 2002, respectively. Generally, royalties are paid to designers of the company’s products as the productsare sold and are not included in research and development costs since they are variable based on product sales.
Environmental MattersThe company does not believe, based on current facts known to management, that existing environmental laws andregulations have had or will have any material effects upon the capital expenditures, earnings, or competitive positionof the company. Further, the company continues to rigorously reduce, recycle, and reuse solid wastes generated by itsmanufacturing processes. Its accomplishments and these efforts have been widely recognized.
Human ResourcesThe company considers its employees to be another of its major competitive strengths. The company stresses individualemployee participation and incentives, believing that this emphasis has helped to attract and retain a competent andmotivated workforce. The company’s human resources group provides employee recruitment, education anddevelopment, and compensation planning and counseling. There have been no work stoppages or labor disputes in the company’s history, and its relations with its employees are considered good. Approximately 361 of the company’semployees are represented by collective bargaining agents, most of whom are employees of its Integrated MetalTechnology, Inc., and Herman Miller Limited (U.K.) subsidiaries. As such, these subsidiaries are parties to collectivebargaining agreements with these employees.
As of May 29, 2004, the company employed 6,081 full time and 205 part time employees, representing a 0.5 percentdecrease in full time employees and a 0.5 percent decrease in part time employees compared with May 31, 2003. Inaddition to its employee work force, the company uses purchased labor to meet uneven demand in its manufacturingoperations.
Information About International OperationsThe company’s sales in international markets primarily are made to office/institutional customers. Foreign salesconsist mostly of office furniture products such as Ethospace and Action Office systems, seating, and storageproducts. The company conducts business in the following major international markets: Canada, Europe, LatinAmerica, and the Asia/Pacific region. In certain foreign markets, the company’s products are offered throughlicensing of foreign manufacturers on a royalty basis.
The company’s products currently sold in international markets are manufactured by wholly owned subsidiaries in theUnited States and the United Kingdom. Sales are made through wholly owned subsidiaries or branches in Canada,France, Germany, Italy, Japan, Mexico, the Netherlands, and the United Kingdom. The company’s products are offeredin the Middle East, South America, and Asia through dealers.
In several other countries, the company licenses manufacturing and selling rights. Historically, these licensingarrangements have not required a significant investment of funds or personnel by the company and, in the aggregate,have not produced material net earnings for the company.
Additional information with respect to operations by geographic area appears in Note 21, Operating Segments, of theNotes to the Consolidated Financial Statements included in Item 8 of this report. Fluctuating exchange rates andfactors beyond the control of the company, such as tariff and foreign economic policies, may affect future results ofinternational operations.
Available InformationThe company’s annual report on Form 10-K, quarterly reports on Form 10-Q, current reports on Form 8-K, and allamendments to those reports are made available free of charge through the “Investors” section of the company’sInternet Web site at www.HermanMiller.com, as soon as practicable after such material is electronically filed with orfurnished to the Securities and Exchange Commission.
Form 10-K 5
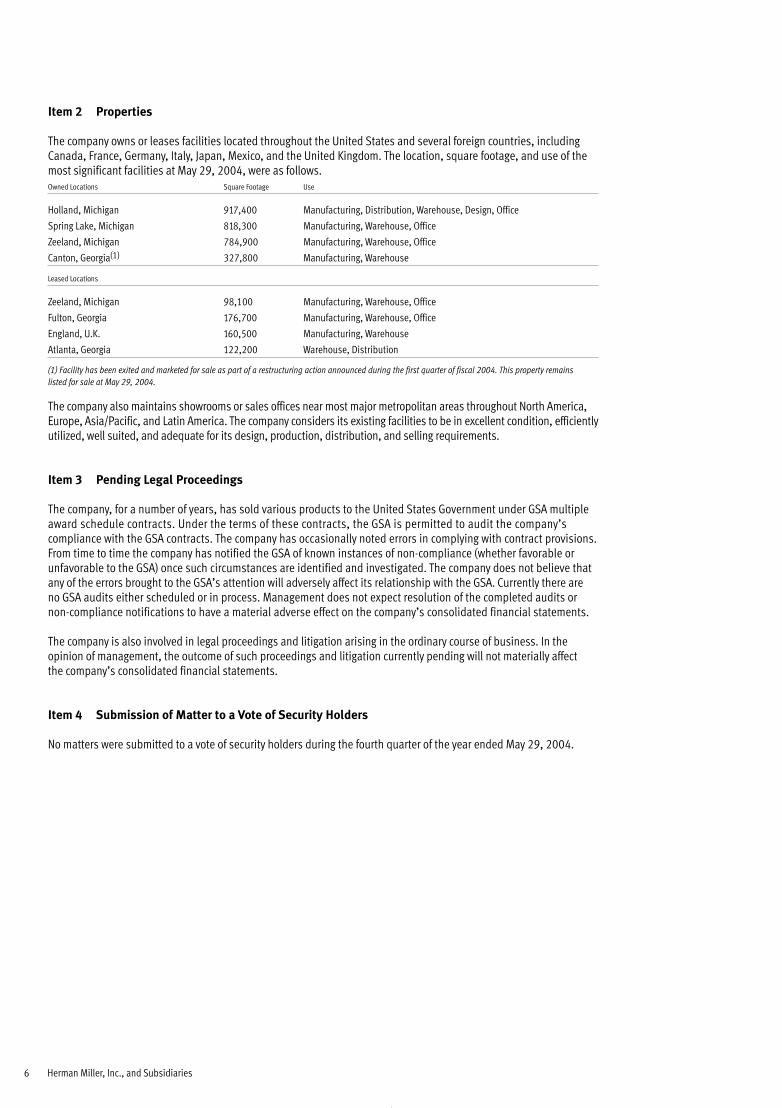
Item 2 Properties
The company owns or leases facilities located throughout the United States and several foreign countries, includingCanada, France, Germany, Italy, Japan, Mexico, and the United Kingdom. The location, square footage, and use of themost significant facilities at May 29, 2004, were as follows.Owned Locations Square Footage Use
Holland, Michigan 917,400 Manufacturing, Distribution, Warehouse, Design, Office
Spring Lake, Michigan 818,300 Manufacturing, Warehouse, Office
Zeeland, Michigan 784,900 Manufacturing, Warehouse, Office
Canton, Georgia(1) 327,800 Manufacturing, Warehouse
Leased Locations
Zeeland, Michigan 98,100 Manufacturing, Warehouse, Office
Fulton, Georgia 176,700 Manufacturing, Warehouse, Office
England, U.K. 160,500 Manufacturing, Warehouse
Atlanta, Georgia 122,200 Warehouse, Distribution
(1) Facility has been exited and marketed for sale as part of a restructuring action announced during the first quarter of fiscal 2004. This property remainslisted for sale at May 29, 2004.
The company also maintains showrooms or sales offices near most major metropolitan areas throughout North America,Europe, Asia/Pacific, and Latin America. The company considers its existing facilities to be in excellent condition, efficientlyutilized, well suited, and adequate for its design, production, distribution, and selling requirements.
Item 3 Pending Legal Proceedings
The company, for a number of years, has sold various products to the United States Government under GSA multipleaward schedule contracts. Under the terms of these contracts, the GSA is permitted to audit the company’scompliance with the GSA contracts. The company has occasionally noted errors in complying with contract provisions.From time to time the company has notified the GSA of known instances of non-compliance (whether favorable orunfavorable to the GSA) once such circumstances are identified and investigated. The company does not believe thatany of the errors brought to the GSA’s attention will adversely affect its relationship with the GSA. Currently there are no GSA audits either scheduled or in process. Management does not expect resolution of the completed audits ornon-compliance notifications to have a material adverse effect on the company’s consolidated financial statements.
The company is also involved in legal proceedings and litigation arising in the ordinary course of business. In theopinion of management, the outcome of such proceedings and litigation currently pending will not materially affectthe company’s consolidated financial statements.
Item 4 Submission of Matter to a Vote of Security Holders
No matters were submitted to a vote of security holders during the fourth quarter of the year ended May 29, 2004.
6 Herman Miller, Inc., and Subsidiaries
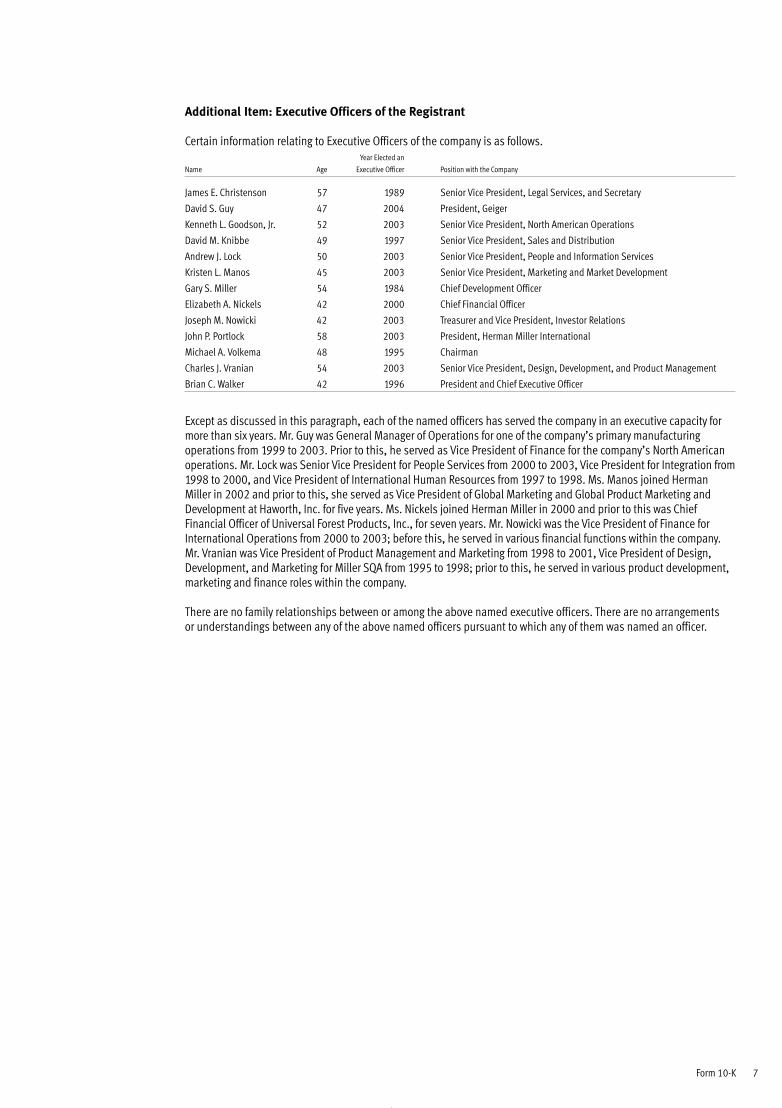
Additional Item: Executive Officers of the Registrant
Certain information relating to Executive Officers of the company is as follows.Year Elected an
Name Age Executive Officer Position with the Company
James E. Christenson 57 1989 Senior Vice President, Legal Services, and Secretary
David S. Guy 47 2004 President, Geiger
Kenneth L. Goodson, Jr. 52 2003 Senior Vice President, North American Operations
David M. Knibbe 49 1997 Senior Vice President, Sales and Distribution
Andrew J. Lock 50 2003 Senior Vice President, People and Information Services
Kristen L. Manos 45 2003 Senior Vice President, Marketing and Market Development
Gary S. Miller 54 1984 Chief Development Officer
Elizabeth A. Nickels 42 2000 Chief Financial Officer
Joseph M. Nowicki 42 2003 Treasurer and Vice President, Investor Relations
John P. Portlock 58 2003 President, Herman Miller International
Michael A. Volkema 48 1995 Chairman
Charles J. Vranian 54 2003 Senior Vice President, Design, Development, and Product Management
Brian C. Walker 42 1996 President and Chief Executive Officer
Except as discussed in this paragraph, each of the named officers has served the company in an executive capacity formore than six years. Mr. Guy was General Manager of Operations for one of the company’s primary manufacturingoperations from 1999 to 2003. Prior to this, he served as Vice President of Finance for the company’s North Americanoperations. Mr. Lock was Senior Vice President for People Services from 2000 to 2003, Vice President for Integration from1998 to 2000, and Vice President of International Human Resources from 1997 to 1998. Ms. Manos joined HermanMiller in 2002 and prior to this, she served as Vice President of Global Marketing and Global Product Marketing andDevelopment at Haworth, Inc. for five years. Ms. Nickels joined Herman Miller in 2000 and prior to this was ChiefFinancial Officer of Universal Forest Products, Inc., for seven years. Mr. Nowicki was the Vice President of Finance forInternational Operations from 2000 to 2003; before this, he served in various financial functions within the company.Mr. Vranian was Vice President of Product Management and Marketing from 1998 to 2001, Vice President of Design,Development, and Marketing for Miller SQA from 1995 to 1998; prior to this, he served in various product development,marketing and finance roles within the company.
There are no family relationships between or among the above named executive officers. There are no arrangementsor understandings between any of the above named officers pursuant to which any of them was named an officer.
Form 10-K 7
Part II
Item 5 Market for the Registrant’s Common Equity and Related Shareholder Matters
Share Price, Earnings, and Dividends Summary
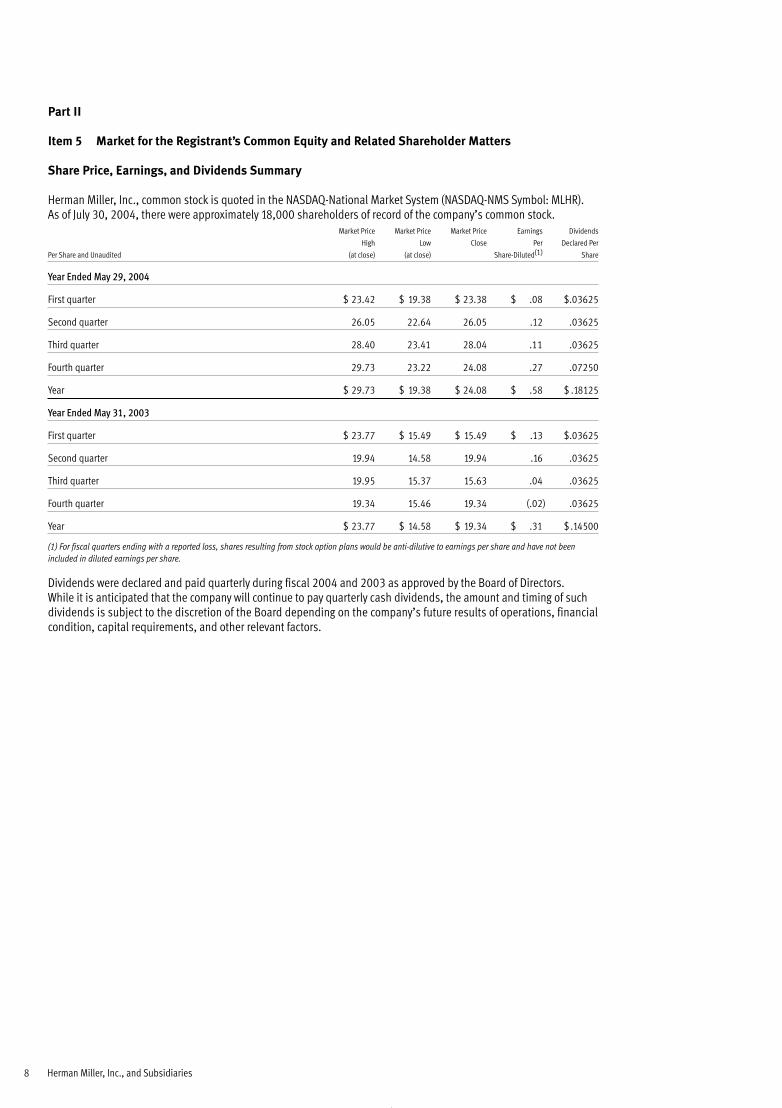
Herman Miller, Inc., common stock is quoted in the NASDAQ-National Market System (NASDAQ-NMS Symbol: MLHR). As of July 30, 2004, there were approximately 18,000 shareholders of record of the company’s common stock.
Market Price Market Price Market Price Earnings Dividends
High Low Close Per Declared Per
Per Share and Unaudited (at close) (at close) Share-Diluted(1) Share
Year Ended May 29, 2004
First quarter $ 23.42 $ 19.38 $ 23.38 $ .08 $.03625
Second quarter 26.05 22.64 26.05 .12 .03625
Third quarter 28.40 23.41 28.04 .11 .03625
Fourth quarter 29.73 23.22 24.08 .27 .07250
Year $ 29.73 $ 19.38 $ 24.08 $ .58 $ .18125
Year Ended May 31, 2003
First quarter $ 23.77 $ 15.49 $ 15.49 $ .13 $.03625
Second quarter 19.94 14.58 19.94 .16 .03625
Third quarter 19.95 15.37 15.63 .04 .03625
Fourth quarter 19.34 15.46 19.34 (.02) .03625
Year $ 23.77 $ 14.58 $ 19.34 $ .31 $ .14500
(1) For fiscal quarters ending with a reported loss, shares resulting from stock option plans would be anti-dilutive to earnings per share and have not beenincluded in diluted earnings per share.
Dividends were declared and paid quarterly during fiscal 2004 and 2003 as approved by the Board of Directors. While it is anticipated that the company will continue to pay quarterly cash dividends, the amount and timing of suchdividends is subject to the discretion of the Board depending on the company’s future results of operations, financialcondition, capital requirements, and other relevant factors.
8 Herman Miller, Inc., and Subsidiaries

Issuer Purchases of Equity Securities
The following is a summary of share repurchase activity during the fourth quarter ended May 29, 2004.(a) (b) (c) (d)
Total Number Average price Total Number of Shares Maximum Number (or Approximate
of Shares Paid per (or Units) Purchased as Part Dollar Value) of Shares (or Units)
(or Units) Share or of Publicly Announced that May Yet be Purchased
Plan Category Purchased(2) Unit Plans or Programs Under the Plans or Programs
2/29/04–3/27/04 486,323 $26.24 486,323 $113,773,129
3/28/04–4/24/04 831,468 26.38 831,468 91,838,903
4/25/04–5/29/04 80,080 26.79 80,080 89,693,623
Total 1,397,871 $26.35 1,397,871 $89,693,623
(2) No shares were purchased outside of a publicly announced plan or program.
The company repurchases shares under two previously announced plans authorized by the Board of Directors asfollows.
• Plan announced on July 17, 2001, providing share repurchase authorization of $100,000,000 with no specifiedexpiration date.
• Plan announced on January 13, 2004, providing share repurchase authorization of $100,000,000 with no specifiedexpiration date.
During the period covered by this report the company did not sell any of its equity shares that were not issued underthe Securities Act of 1933. No repurchase plans expired or were terminated during the fourth quarter of fiscal 2004,nor do any plans exist under which the company does not intend to make further purchases.
Form 10-K 9
10 2004 Report to Shareholders Herman Miller, Inc., and Subsidiaries
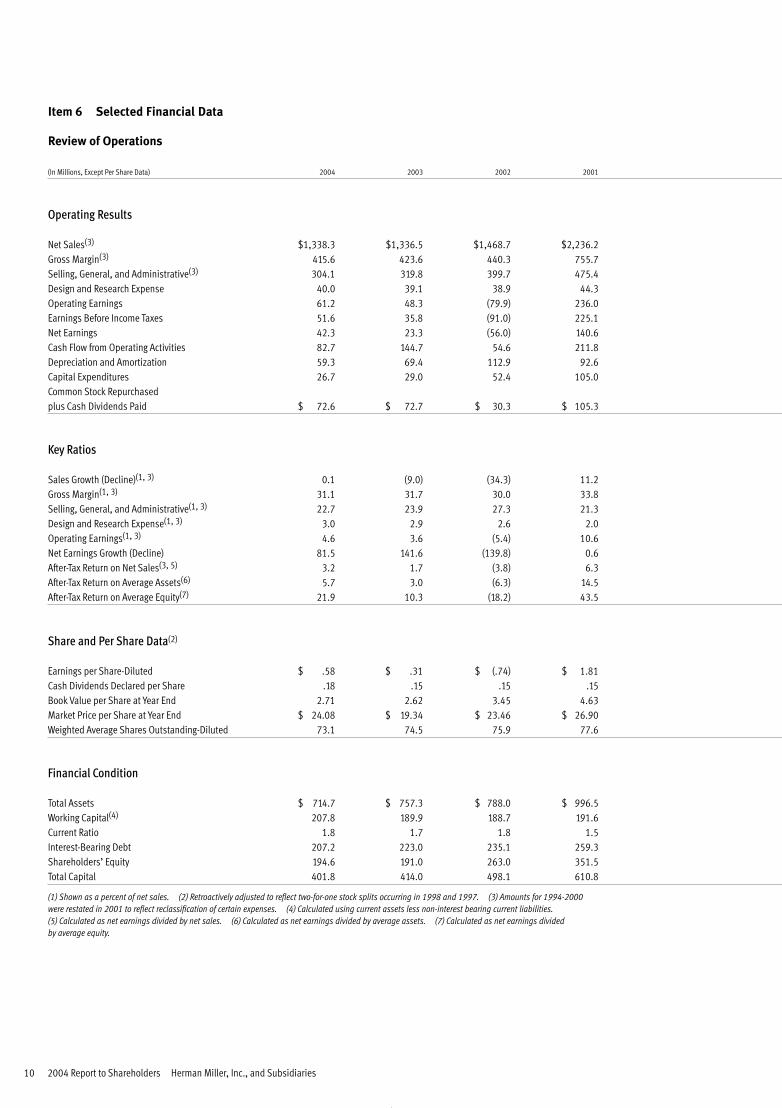
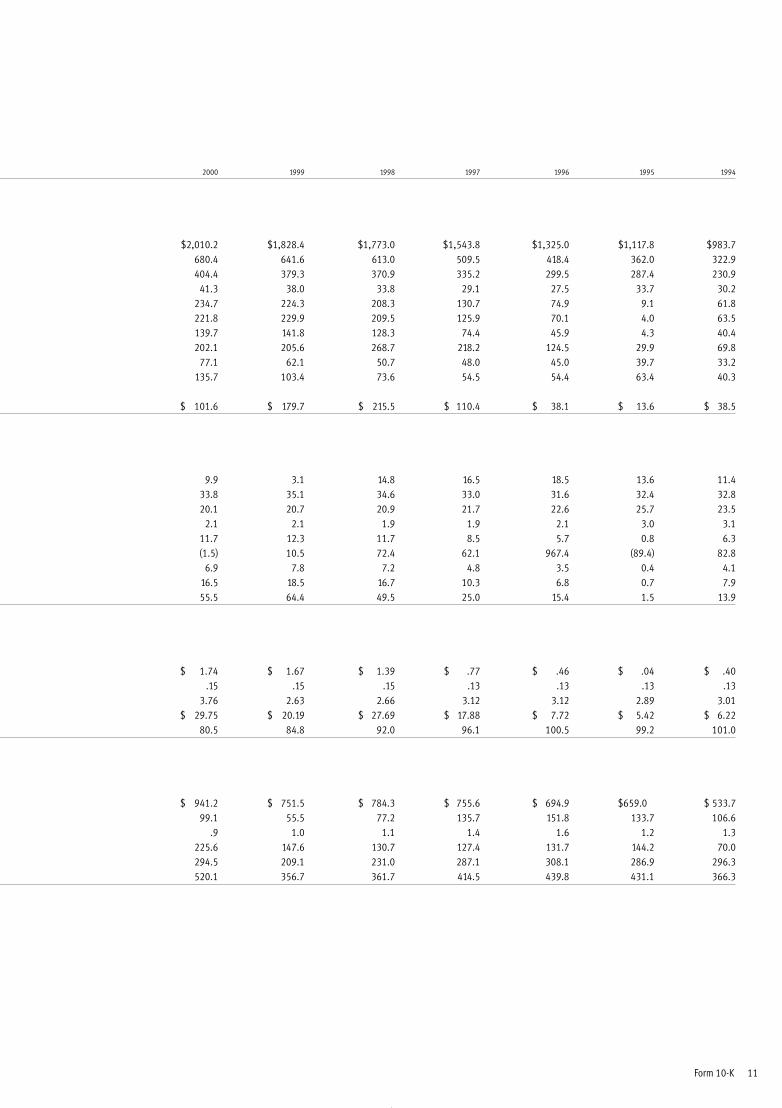
Item 6 Selected Financial Data
Review of Operations
(In Millions, Except Per Share Data) 2004 2003 2002 2001
Operating Results
Net Sales(3) $1,338.3 $1,336.5 $1,468.7 $2,236.2Gross Margin(3) 415.6 423.6 440.3 755.7Selling, General, and Administrative(3) 304.1 319.8 399.7 475.4Design and Research Expense 40.0 39.1 38.9 44.3Operating Earnings 61.2 48.3 (79.9) 236.0Earnings Before Income Taxes 51.6 35.8 (91.0) 225.1Net Earnings 42.3 23.3 (56.0) 140.6Cash Flow from Operating Activities 82.7 144.7 54.6 211.8Depreciation and Amortization 59.3 69.4 112.9 92.6Capital Expenditures 26.7 29.0 52.4 105.0Common Stock Repurchased plus Cash Dividends Paid $ 72.6 $ 72.7 $ 30.3 $ 105.3
Key Ratios
Sales Growth (Decline)(1, 3) 0.1 (9.0) (34.3) 11.2Gross Margin(1, 3) 31.1 31.7 30.0 33.8Selling, General, and Administrative(1, 3) 22.7 23.9 27.3 21.3Design and Research Expense(1, 3) 3.0 2.9 2.6 2.0Operating Earnings(1, 3) 4.6 3.6 (5.4) 10.6Net Earnings Growth (Decline) 81.5 141.6 (139.8) 0.6After-Tax Return on Net Sales(3, 5) 3.2 1.7 (3.8) 6.3After-Tax Return on Average Assets(6) 5.7 3.0 (6.3) 14.5After-Tax Return on Average Equity(7) 21.9 10.3 (18.2) 43.5
Share and Per Share Data(2)
Earnings per Share-Diluted $ .58 $ .31 $ (.74) $ 1.81Cash Dividends Declared per Share .18 .15 .15 .15Book Value per Share at Year End 2.71 2.62 3.45 4.63Market Price per Share at Year End $ 24.08 $ 19.34 $ 23.46 $ 26.90Weighted Average Shares Outstanding-Diluted 73.1 74.5 75.9 77.6
Financial Condition
Total Assets $ 714.7 $ 757.3 $ 788.0 $ 996.5Working Capital(4) 207.8 189.9 188.7 191.6Current Ratio 1.8 1.7 1.8 1.5Interest-Bearing Debt 207.2 223.0 235.1 259.3Shareholders’ Equity 194.6 191.0 263.0 351.5Total Capital 401.8 414.0 498.1 610.8
(1) Shown as a percent of net sales. (2) Retroactively adjusted to reflect two-for-one stock splits occurring in 1998 and 1997. (3) Amounts for 1994-2000were restated in 2001 to reflect reclassification of certain expenses. (4) Calculated using current assets less non-interest bearing current liabilities.(5) Calculated as net earnings divided by net sales. (6) Calculated as net earnings divided by average assets. (7) Calculated as net earnings divided by average equity.
Form 10-K 11
2000 1999 1998 1997 1996 1995 1994
$2,010.2 $1,828.4 $1,773.0 $1,543.8 $1,325.0 $1,117.8 $983.7680.4 641.6 613.0 509.5 418.4 362.0 322.9404.4 379.3 370.9 335.2 299.5 287.4 230.9
41.3 38.0 33.8 29.1 27.5 33.7 30.2234.7 224.3 208.3 130.7 74.9 9.1 61.8221.8 229.9 209.5 125.9 70.1 4.0 63.5139.7 141.8 128.3 74.4 45.9 4.3 40.4202.1 205.6 268.7 218.2 124.5 29.9 69.8
77.1 62.1 50.7 48.0 45.0 39.7 33.2135.7 103.4 73.6 54.5 54.4 63.4 40.3
$ 101.6 $ 179.7 $ 215.5 $ 110.4 $ 38.1 $ 13.6 $ 38.5
9.9 3.1 14.8 16.5 18.5 13.6 11.433.8 35.1 34.6 33.0 31.6 32.4 32.820.1 20.7 20.9 21.7 22.6 25.7 23.5
2.1 2.1 1.9 1.9 2.1 3.0 3.111.7 12.3 11.7 8.5 5.7 0.8 6.3(1.5) 10.5 72.4 62.1 967.4 (89.4) 82.8
6.9 7.8 7.2 4.8 3.5 0.4 4.116.5 18.5 16.7 10.3 6.8 0.7 7.955.5 64.4 49.5 25.0 15.4 1.5 13.9
$ 1.74 $ 1.67 $ 1.39 $ .77 $ .46 $ .04 $ .40.15 .15 .15 .13 .13 .13 .13
3.76 2.63 2.66 3.12 3.12 2.89 3.01$ 29.75 $ 20.19 $ 27.69 $ 17.88 $ 7.72 $ 5.42 $ 6.22
80.5 84.8 92.0 96.1 100.5 99.2 101.0
$ 941.2 $ 751.5 $ 784.3 $ 755.6 $ 694.9 $659.0 $ 533.799.1 55.5 77.2 135.7 151.8 133.7 106.6
.9 1.0 1.1 1.4 1.6 1.2 1.3225.6 147.6 130.7 127.4 131.7 144.2 70.0294.5 209.1 231.0 287.1 308.1 286.9 296.3520.1 356.7 361.7 414.5 439.8 431.1 366.3
12 2004 Report to Shareholders Herman Miller, Inc., and Subsidiaries
Item 7 Management’s Discussion and Analysis of Financial Condition and Results of Operations
Management’s Discussion and Analysis
You should read the issues discussed in Management’s Discussion and Analysis in conjunction with thecompany’s consolidated financial statements and the notes to the consolidated financial statements included in the company’s Form 10-K.
Executive Business Overview
The principal focus of our business is to provide workplace solutions to our customers worldwide through the research,design, manufacture, and sale of office furniture products. These products include office furniture systems, seating,storage solutions, freestanding furniture, and casegoods. We also offer our end-user customers related services such asfurniture asset management and office layout design. Our products and services are offered to most of our customersunder standard trade credit terms of between 30 and 45 days and are sold through the following distribution channels.
• Independent Contract Furniture Dealers and LicenseesMost of our product sales are made to a network of independently owned and operated contract furniture dealershipsdoing business in more than 40 countries. These dealers purchase our products and distribute them to end customers. We recognize revenue on product sales through this channel once our products are shipped and title passesto the dealer. Many of these dealers also offer furniture-related services including product installation.
• Owned Contract Furniture DealersWe own and operate 11 contract furniture dealerships. The financial results of these owned dealers are included in our consolidated financial statements. Product sales to these dealerships are eliminated as inter-companytransactions from our consolidated financial results. Product and service revenue is recognized only when the dealership completes delivery of product and related services to the end customer.
• Direct Customer SalesWe sometimes sell products and services directly to end customers without an intermediary. In most of theseinstances, we contract separately with a dealership or third-party installation company to provide sales-relatedservices. We recognize revenue on these sales once products are shipped and installation is substantially complete.
• Independent RetailersSome products are sold to end customers through independently owned retail operations. Revenue is recognized on these sales once products are shipped and title passes to the independent retailer.
We consider our owned and independent dealer network one of the most important competitive factors vital to thelong-term success of our business. General economic and industry conditions in recent years have placed significantfinancial pressure on several of our dealers. We have provided financial assistance to some dealers either thoughdirect loans or loan guarantees. We view the primary risks to our business resulting from the dealers’ economicpressures as the potential disruption of our distribution channels, the resulting adverse impact on our customers,and the credit risk associated with our dealer financing arrangements. While we cannot avoid these risks withcertainty, we believe that the overall condition of the network is stable and our reserves are adequate to coverthe credit risk.
We are committed to developing aesthetically and functionally innovative new products and have a history of doingso. We believe our skills and experience in matching problem-solving furniture design with the workplace needsof our customers provide us with a competitive advantage in the marketplace. An important component of our businessstrategy is to actively pursue a program of new product research, design, and development. We accomplish thisthrough the use of an internal research and design staff as well as external design resources that are generallycompensated on a royalty basis.
We manufacture our products using a system of lean manufacturing techniques collectively referred to as the HermanMiller Production System (HMPS). One key element of our manufacturing strategy is to limit fixed production costsby sourcing component parts from strategic suppliers. This strategy has allowed us to increase the variable nature of ourcost structure while at the same time retaining proprietary control over those production processes that we believeprovide us a competitive advantage. As a result of this strategy, our manufacturing operations are largely assembly-based. Additionally, during fiscal years 2002 and 2003, we actively pursued a program of supplier rationalization and consolidation in an effort to reduce procurement costs and improve quality levels. Generally this effort, in connectionwith HMPS, has resulted in improved efficiency, costs, and reliability. Despite these benefits, the strategy doesincrease the risks associated with supplier transitions and dependence upon fewer suppliers. We continue to seek
Form 10-K 13
financially strong suppliers interested in long-term business relationships to minimize the risk of interruption to our business.
We strive to maintain efficiencies and cost savings by minimizing the amount of inventory on-hand under HMPS.Accordingly, production is order-driven with raw materials purchased as needed to meet demand. The standard lead-time for the majority of our products is 10 to 20 days. As a result, the rate of our inventory turns is high. These combined factors could cause our inventory levels to appear relatively low in relation to sales volume.
Our primary domestic manufacturing operations are located in Michigan and Georgia. We also have a significantmanufacturing presence in the United Kingdom, which represents our largest marketplace outside the United States. In addition to sales in the United Kingdom, our products are sold internationally through wholly-owned subsidiariesor branches in Canada, France, Germany, Italy, Japan, Mexico, and the Netherlands. Our products are offered elsewherein the world primarily through independent dealerships and licensees.
We believe that respecting the environment in the way we do business is simply the right thing to do, and we arecommitted to developing sustainable business practices. A goal of sustainability demands that we pay attention to theentire life cycle of our products. We develop strategies that enable us to move toward sustainability while enhancingthe value offered to our customers. We measure and monitor progress toward our environmental goals as a key metricof our business success.
While the office furniture industry is subject to a multitude of macro-economic influences, we generally considerthe following to be the leading economic indicators of our industry’s performance:
• Corporate Profitability• White-Collar Employment• New Office Construction Starts• Office Space Vacancy Rates
The Business and Institutional Furniture Manufacturers Association (BIFMA) is the trade association for the U.S. domesticoffice furniture industry. We closely monitor the trade statistics reported by BIFMA and consider them among the keyindicators of industry-wide sales and order performance. We also analyze BIFMA statistical information over severalquarters as a benchmark comparison against the performance of our domestic business. Finally, BIFMA regularly providesits members with industry forecast information, which we use internally as one of many considerations in our shortand long-range planning process.
Discussion of Business Conditions
The completion of our 2004 fiscal year marks the first time in three years that we have been able to report year-over-year growth in annual sales and net earnings. It represents for us, symbolically if not statistically, the official end of an economic recession that led to the elimination of thousands of jobs across our industry. This was a difficult time in our history; however, we are pleased with the changes we made to our business model as a result of the challenge.The net effect of these changes is that we now operate as a leaner and more financially agile enterprise than we did at the beginning of the downturn. Our financial results, particularly in the second half of this year, give us confidencethat overall business conditions are gaining momentum—and that we have the ability to grow profitably as a result.
Throughout fiscal 2004, we saw improvement in a majority of the major economic indicators for our industry. Corporateprofits, which began to show sequential-quarter growth last year, continued that trend during the current fiscal year.(1)
The employment situation has also improved. Unemployment rates across most statistical categories, includinggeneral sales and office occupations, have fallen from the previous year.(2) Finally, while new office construction rateshave yet to increase, the level of office space vacancies appears to have stabilized.(3, 4)
This economic data is encouraging for the industry as a whole. However, we are even more energized by what theperformance of our business suggests about the recovery outlook. The fourth quarter ended May 29, 2004 representedonly the second time in three years that we reported year-over-year growth in net sales. It was also the thirdconsecutive period of year-over-year growth in quarterly order levels. In total, our fourth quarter order entry rate wasthe highest level experienced in the past 11 quarters. Overall business activity, as measured by client visits to our
(1) U.S. Dept. of Commerce, Bureau of Economic Analysis; National Income and Product Accounts (NIPA) Tables; June 28, 2004; Table 1.14 (2) U.S. Dept. of Labor, Bureau of Labor Statistics; May 2004 employment statistics; Table A-10. (3) U.S. Dept. of Commerce, U.S. Census Bureau; seasonally adjustedconstruction statistics as of April 2004. (4) Grubb & Ellis white paper research, “Bubble Re(w)rapped, Retesting the Theory of Rational Exuberancein the Office Market”; March 2004.
14 2004 Report to Shareholders Herman Miller, Inc., and Subsidiaries
West Michigan headquarters, increased by more than 60 percent between the third and fourth quarters of 2004. Finally, showroom attendance at the June 2004 NeoCon® trade show in Chicago was up from the prior year.
We believe the changes made to our business model in recent years, the overall macro-economic environment, andour own sales and earnings performance during fiscal 2004 suggest a positive outlook. We are also confident thatwe have the resources available to fund our future capital needs. During 2004, we completed an in-depth review of our capital structure. As a result of this work, we announced a 100 percent increase in our quarterly cash dividend.We also received additional authorization from our Board of Directors to continue our share repurchase program.
Our markets remain intensely competitive. We have continued our product differentiation strategy to limit, to theextent possible, the impact of negative pricing pressure. Despite these efforts, price competition remains a businessreality. In fiscal 2004 it reduced both net sales and gross margin in relation to the prior year.
Consistent with this differentiation strategy, we have continued to invest heavily in new product development. Our fiscal 2004 spending in the area of design and research, including royalty payments, totaled $40 million. This represents an increase both in terms of dollars and percent-of-sales from fiscal 2003 and 2002 levels.
Two innovations that gained significant attention during the year were the Mirra™ chair and the Abak desk system. In the first quarter, we began taking orders for Mirra, the newest addition to our seating portfolio. Market acceptance of this award-winning product has been much better than we expected, and we believe our recently announcedupholstered version will further enhance its popularity. The second innovation was unveiled at the June 2004 NeoContrade show with the introduction of Abak, a freestanding desking product. This newly redesigned product, which hasbeen successful in recent years in Europe and Asia, will be made available to our North American customers. Theintroduction captured significant attention and earned Abak a Gold award in the Best of NeoCon 2004 competition.
Rising material costs, particularly for raw steel, continue to be an area of concern. Increasing steel costs began to affectour business in earnest during the second half of the year. Prior to this, we were partially insulated from rising marketprices by favorable pricing contracts and additional safety-stock inventory built in connection with our facilityconsolidation efforts. These contracts are now expired and the inventory has been used. As a result, we expect theimpact of steel prices to be more significant in the near term. In fact, we estimate the negative impact of rising steelcosts to be between $4 million and $4.5 million per quarter during the upcoming fiscal year.
In response to these higher production costs, most competitors announced some form of price increase duringfiscal 2004. We announced a general price increase during the fourth quarter. This change, which varies byproduct line but averages approximately 4 percent of list price, was effective August 2, 2004. Due to the ongoingbusiness reality of price competition, however, this increase alone may not fully offset the negative impactof rising material costs in the upcoming year due to increased discounting. That said, we believe that we can covera large portion of the increased costs through our ongoing HMPS initiatives.
On June 23, 2004, we announced that Brian Walker, then our President and Chief Operating Officer, would succeedMike Volkema as Chief Executive Officer, effective July 26, 2004. Mike continues in his role as Board Chairman and in addition is devoting time to the Herman Miller Creative Office, assisting with commercialization of new innovationsand related business development. Having served in a number of senior executive positions during his 16 yearswith the company, Brian brings to the CEO’s role an in-depth knowledge of our industry and a high-energy leadershipstyle well suited to a new era. This evolution of roles maintains the continuity of a strong leadership team, enables greater focus in their respective responsibilities, and reflects a growing trend in corporate governance practiceto separate the CEO and Chairman’s responsibilities.
Restructuring Activities
During the fiscal year, we completed substantially all of our outstanding restructuring initiatives. First, in the secondquarter we completed the sale of the Holland, Michigan, Chair Plant. Cash proceeds received from the sale totaledapproximately $6 million. The sale resulted in the recognition of a $0.8 million gain, which was treated as a reduction to our second quarter restructuring expenses. We also completed the relocation of our Canton, Georgia, manufacturingoperation to our Spring Lake, Michigan, campus. While the Canton manufacturing facility remains listed for sale, the move itself proceeded as planned and on schedule. The carrying values of the Canton assets were written down to their estimated fair market values in fiscal 2003 and remain classified under the balance sheet caption, “Net Propertyand Equipment.” Finally, we completed the consolidation of our Holland, Michigan, Formcoat operation into existing spaceat one of our facilities located in nearby Zeeland, Michigan. The lease on the Formcoat facility has been terminated.
Form 10-K 15
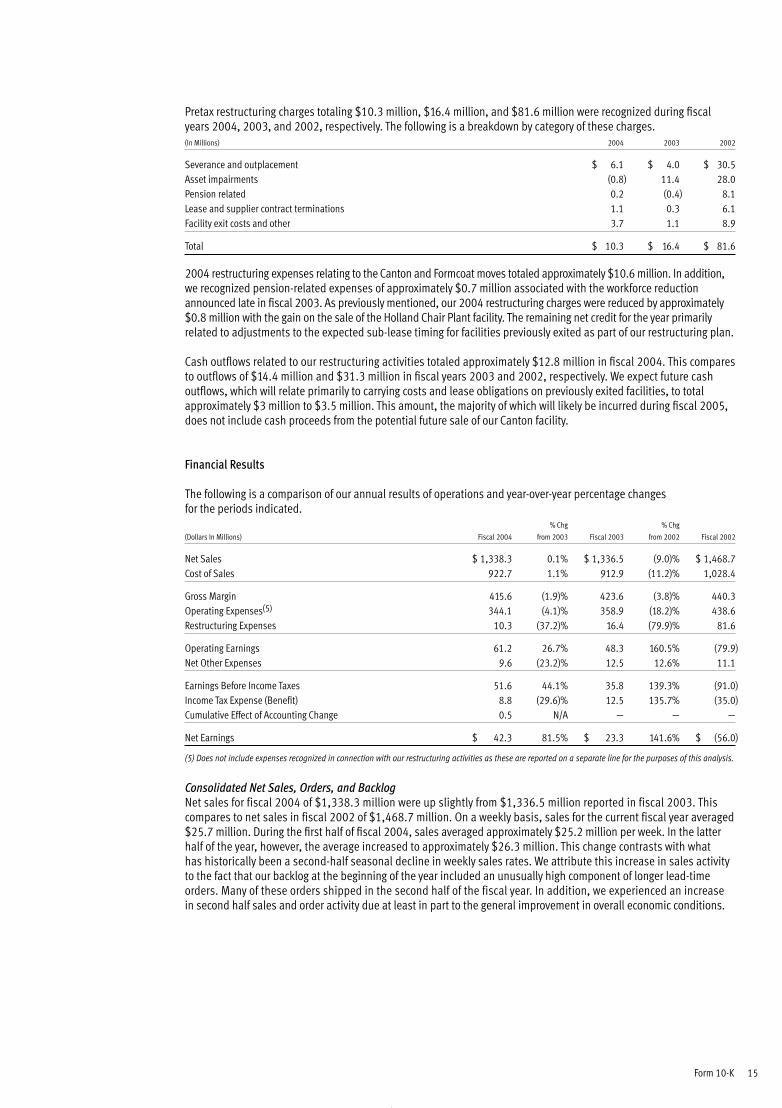
Pretax restructuring charges totaling $10.3 million, $16.4 million, and $81.6 million were recognized during fiscalyears 2004, 2003, and 2002, respectively. The following is a breakdown by category of these charges.(In Millions) 2004 2003 2002
Severance and outplacement $ 6.1 $ 4.0 $ 30.5Asset impairments (0.8) 11.4 28.0Pension related 0.2 (0.4) 8.1Lease and supplier contract terminations 1.1 0.3 6.1Facility exit costs and other 3.7 1.1 8.9
Total $ 10.3 $ 16.4 $ 81.6
2004 restructuring expenses relating to the Canton and Formcoat moves totaled approximately $10.6 million. In addition,we recognized pension-related expenses of approximately $0.7 million associated with the workforce reductionannounced late in fiscal 2003. As previously mentioned, our 2004 restructuring charges were reduced by approximately$0.8 million with the gain on the sale of the Holland Chair Plant facility. The remaining net credit for the year primarilyrelated to adjustments to the expected sub-lease timing for facilities previously exited as part of our restructuring plan.
Cash outflows related to our restructuring activities totaled approximately $12.8 million in fiscal 2004. This comparesto outflows of $14.4 million and $31.3 million in fiscal years 2003 and 2002, respectively. We expect future cashoutflows, which will relate primarily to carrying costs and lease obligations on previously exited facilities, to totalapproximately $3 million to $3.5 million. This amount, the majority of which will likely be incurred during fiscal 2005,does not include cash proceeds from the potential future sale of our Canton facility.
Financial Results
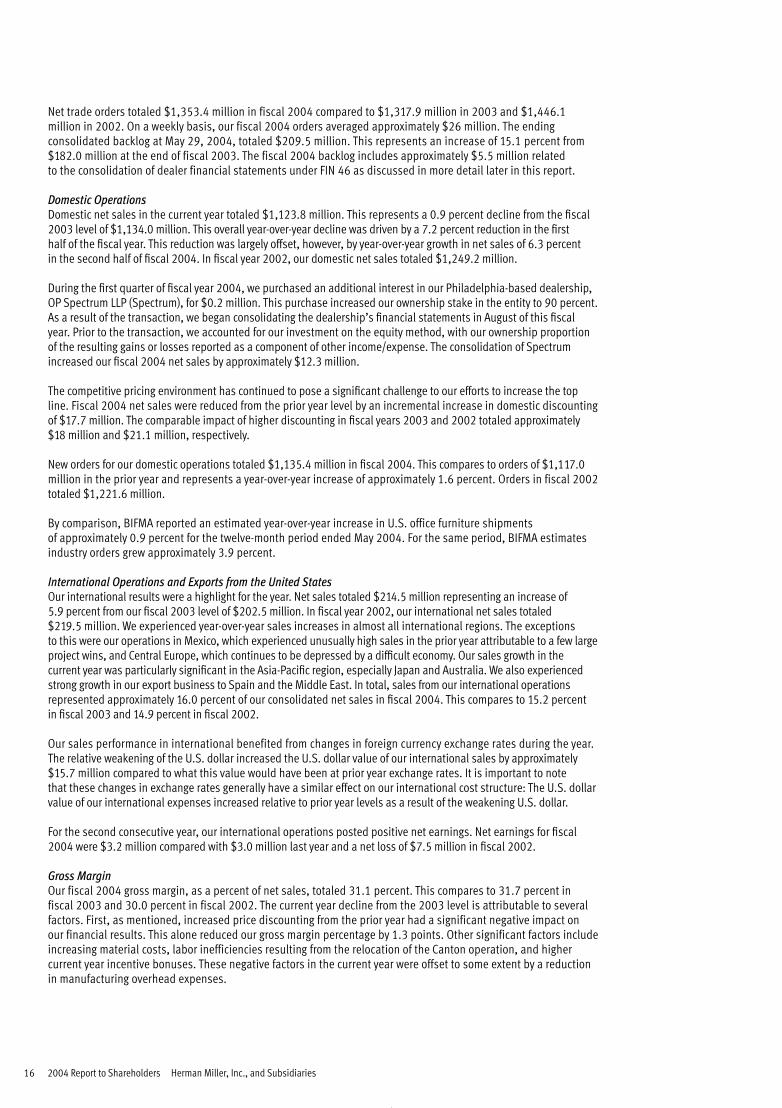
The following is a comparison of our annual results of operations and year-over-year percentage changesfor the periods indicated.
% Chg % Chg
(Dollars In Millions) Fiscal 2004 from 2003 Fiscal 2003 from 2002 Fiscal 2002
Net Sales $ 1,338.3 0.1% $ 1,336.5 (9.0)% $ 1,468.7Cost of Sales 922.7 1.1% 912.9 (11.2)% 1,028.4
Gross Margin 415.6 (1.9)% 423.6 (3.8)% 440.3Operating Expenses(5) 344.1 (4.1)% 358.9 (18.2)% 438.6Restructuring Expenses 10.3 (37.2)% 16.4 (79.9)% 81.6
Operating Earnings 61.2 26.7% 48.3 160.5% (79.9)Net Other Expenses 9.6 (23.2)% 12.5 12.6% 11.1
Earnings Before Income Taxes 51.6 44.1% 35.8 139.3% (91.0)Income Tax Expense (Benefit) 8.8 (29.6)% 12.5 135.7% (35.0)Cumulative Effect of Accounting Change 0.5 N/A — — —
Net Earnings $ 42.3 81.5% $ 23.3 141.6% $ (56.0)
(5) Does not include expenses recognized in connection with our restructuring activities as these are reported on a separate line for the purposes of this analysis.
Consolidated Net Sales, Orders, and BacklogNet sales for fiscal 2004 of $1,338.3 million were up slightly from $1,336.5 million reported in fiscal 2003. Thiscompares to net sales in fiscal 2002 of $1,468.7 million. On a weekly basis, sales for the current fiscal year averaged$25.7 million. During the first half of fiscal 2004, sales averaged approximately $25.2 million per week. In the latterhalf of the year, however, the average increased to approximately $26.3 million. This change contrasts with whathas historically been a second-half seasonal decline in weekly sales rates. We attribute this increase in sales activityto the fact that our backlog at the beginning of the year included an unusually high component of longer lead-timeorders. Many of these orders shipped in the second half of the fiscal year. In addition, we experienced an increase in second half sales and order activity due at least in part to the general improvement in overall economic conditions.
16 2004 Report to Shareholders Herman Miller, Inc., and Subsidiaries
Net trade orders totaled $1,353.4 million in fiscal 2004 compared to $1,317.9 million in 2003 and $1,446.1million in 2002. On a weekly basis, our fiscal 2004 orders averaged approximately $26 million. The endingconsolidated backlog at May 29, 2004, totaled $209.5 million. This represents an increase of 15.1 percent from$182.0 million at the end of fiscal 2003. The fiscal 2004 backlog includes approximately $5.5 million related to the consolidation of dealer financial statements under FIN 46 as discussed in more detail later in this report.
Domestic OperationsDomestic net sales in the current year totaled $1,123.8 million. This represents a 0.9 percent decline from the fiscal2003 level of $1,134.0 million. This overall year-over-year decline was driven by a 7.2 percent reduction in the firsthalf of the fiscal year. This reduction was largely offset, however, by year-over-year growth in net sales of 6.3 percentin the second half of fiscal 2004. In fiscal year 2002, our domestic net sales totaled $1,249.2 million.
During the first quarter of fiscal year 2004, we purchased an additional interest in our Philadelphia-based dealership,OP Spectrum LLP (Spectrum), for $0.2 million. This purchase increased our ownership stake in the entity to 90 percent.As a result of the transaction, we began consolidating the dealership’s financial statements in August of this fiscalyear. Prior to the transaction, we accounted for our investment on the equity method, with our ownership proportion of the resulting gains or losses reported as a component of other income/expense. The consolidation of Spectrumincreased our fiscal 2004 net sales by approximately $12.3 million.
The competitive pricing environment has continued to pose a significant challenge to our efforts to increase the topline. Fiscal 2004 net sales were reduced from the prior year level by an incremental increase in domestic discounting of $17.7 million. The comparable impact of higher discounting in fiscal years 2003 and 2002 totaled approximately$18 million and $21.1 million, respectively.
New orders for our domestic operations totaled $1,135.4 million in fiscal 2004. This compares to orders of $1,117.0million in the prior year and represents a year-over-year increase of approximately 1.6 percent. Orders in fiscal 2002totaled $1,221.6 million.
By comparison, BIFMA reported an estimated year-over-year increase in U.S. office furniture shipmentsof approximately 0.9 percent for the twelve-month period ended May 2004. For the same period, BIFMA estimatesindustry orders grew approximately 3.9 percent.
International Operations and Exports from the United StatesOur international results were a highlight for the year. Net sales totaled $214.5 million representing an increase of5.9 percent from our fiscal 2003 level of $202.5 million. In fiscal year 2002, our international net sales totaled $219.5 million. We experienced year-over-year sales increases in almost all international regions. The exceptionsto this were our operations in Mexico, which experienced unusually high sales in the prior year attributable to a few largeproject wins, and Central Europe, which continues to be depressed by a difficult economy. Our sales growth in thecurrent year was particularly significant in the Asia-Pacific region, especially Japan and Australia. We also experiencedstrong growth in our export business to Spain and the Middle East. In total, sales from our international operationsrepresented approximately 16.0 percent of our consolidated net sales in fiscal 2004. This compares to 15.2 percentin fiscal 2003 and 14.9 percent in fiscal 2002.
Our sales performance in international benefited from changes in foreign currency exchange rates during the year. The relative weakening of the U.S. dollar increased the U.S. dollar value of our international sales by approximately$15.7 million compared to what this value would have been at prior year exchange rates. It is important to note that these changes in exchange rates generally have a similar effect on our international cost structure: The U.S. dollarvalue of our international expenses increased relative to prior year levels as a result of the weakening U.S. dollar.
For the second consecutive year, our international operations posted positive net earnings. Net earnings for fiscal 2004 were $3.2 million compared with $3.0 million last year and a net loss of $7.5 million in fiscal 2002.
Gross MarginOur fiscal 2004 gross margin, as a percent of net sales, totaled 31.1 percent. This compares to 31.7 percent infiscal 2003 and 30.0 percent in fiscal 2002. The current year decline from the 2003 level is attributable to severalfactors. First, as mentioned, increased price discounting from the prior year had a significant negative impact on our financial results. This alone reduced our gross margin percentage by 1.3 points. Other significant factors includeincreasing material costs, labor inefficiencies resulting from the relocation of the Canton operation, and highercurrent year incentive bonuses. These negative factors in the current year were offset to some extent by a reductionin manufacturing overhead expenses.
Form 10-K 17
In comparison to the prior year, our fiscal 2004 direct material costs increased on both a dollar and percent-of-sales basis. The biggest reason for this increase as a percentage of sales was price discounting. While unit volumesales in 2004 were higher than the prior year, the revenue generated from those sales was depressed due tocompetitive price discounting. The result of this is higher total expenses for direct materials on nearly the samesales dollars. This was further compounded during the year as we began to experience significant increasesin the cost of certain direct materials. This was not only the case for raw steel, which in total negatively affectedgross margin by approximately $1.7 million for the year, but also resulted from the impact of higher oil priceson petroleum-based components such as plastics.
Direct labor expenses in fiscal 2004 increased slightly as a percent of sales when compared to the prior year. As we hadexpected, the closure and relocation of our Canton, Georgia operation resulted in short-term labor inefficiencies. As this transition effort was ongoing for most of the fiscal year, we experienced the increased costs over that same time.The Canton move is now complete, and beginning in the fourth quarter of this year, we began to realize some of theexpected labor and overhead benefits resulting from this move.
Our manufacturing overhead expenses, both in dollar and percent-of-sales terms, were lower in fiscal 2004 comparedto the prior year. This reduction, which totaled approximately $2.3 million, was achieved despite an increase in current year incentive bonus expenses of approximately $5.1 million. Pretax variable compensation expense includedin our fiscal 2004 cost of sales totaled $6.1 million compared to $1.0 million in 2003. In fiscal 2002, we recognizedcredits of $(0.9) million related to the reduction of variable compensation accruals that had been established in a prior period.
Operating Expenses and Operating EarningsWe continue to demonstrate year-over-year improvement in operating expenses. In fiscal 2004, total operating expenseswere $354.4 million compared to $375.3 million in the prior year and $520.2 million in 2002. These amounts includerestructuring expenses as previously described as well as selling, general, and administrative (SG&A) charges of$304.1 million, $319.8 million, and $399.7 million, respectively. Design and research costs included in total operatingexpenses were $40.0 million, $39.1 million, and $38.9 million for 2004, 2003, and 2002, respectively.
The decline in SG&A expense from fiscal 2003 of $15.7 million or 4.9 percent was primarily the result of lower overallcompensation, benefit, and depreciation expenses. The majority of these savings are a direct result of our restructuringactions in recent years. We also experienced a reduction in customer bad debt expenses in the current year ascompared to fiscal 2003. This reduction resulted from an overall improvement in the aging of our accounts receivable,which reduced the level of required reserves in the current year. Partially offsetting these declines were increasedcurrent year expenses totaling $3.6 million resulting from the consolidation of OP Spectrum.
Our fiscal 2002 SG&A expenses included a pretax charge totaling $4.3 million related to a legal judgment from a 1999 lawsuit. Early in fiscal 2004, we received a favorable court ruling on the matter. Accordingly, we reduced our 2004SG&A expenses by $5.2 million from the reversal of the related legal and interest accruals.
Pretax variable compensation expense/(credits) included in our current year operating expenses totaled $9.4 million.This compares to $3.7 million last year and $(3.1) million in fiscal 2002. The credits recognized in 2002 related to thereduction of incentive bonus accruals that were established in a prior period.
Our fiscal 2002 operating expenses included $15.6 million in charges from the accelerated depreciation of certaintechnology-related assets. Also included in that year was approximately $3.1 million in goodwill asset amortizationexpense. Under an accounting rule that became effective in fiscal 2003, amortization expense of goodwill assetsis no longer recognized.
Expenses for design and research within total operating expenses include royalty payments paid to designersof our products as the products are sold. These payments, which totaled $5.4 million, $5.8 million, and $5.0 million,in fiscal years 2004, 2003, and 2002, respectively, are considered to be variable costs of the products being sold.Accordingly, we do not consider them research and development costs as discussed in Note 1 of the ConsolidatedFinancial Statements.
Operating earnings in fiscal year 2004 of $61.2 million improved by $12.9 million over our fiscal 2003 level. On apercent-of-sales basis, operating earnings totaled 4.6 percent in fiscal 2004 compared to 3.6 percent in 2003. In fiscal2002, we posted an operating loss of $79.9 million or negative 5.4 percent of net sales.
18 2004 Report to Shareholders Herman Miller, Inc., and Subsidiaries
Other Expenses and IncomeNet other expenses totaled $9.6 million in fiscal 2004 compared to $12.5 million in 2003 and $11.1 million in 2002.The year-over-year decline between 2003 and 2004 was caused primarily by an accounting charge related to ourinvestment in Spectrum as discussed below. Lower current year interest charges also contributed to the decline.Changes in foreign exchange rates and the resulting transaction gains between years partially offset the decline.
During 2003, we recognized a $2.2 million pretax charge related to the impairment of our equity investmentin Spectrum. As previously discussed, we increased our ownership stake in this dealer during the first quarter of this year,and its financial statements are now being consolidated.
Interest expense in the current year was $1.6 million lower than in 2003. Lower year-over-year debt levels andincreased savings resulting from our interest rate swap arrangements were the reason for this decline.
Finally, we recorded a foreign currency transaction gain in fiscal 2004 of $0.1 million compared to $0.9 million in the prior year.
Income TaxesIn the fourth quarter of 2004, we recorded a benefit from the release of tax reserves totaling $6.9 million. Thesereserves were released as a result of the closure of IRS audits for the years 1999, 2000, and 2001. As a result of thisadjustment, we reported a 17.1 percent effective tax rate for the full fiscal year. Excluding the impact of this reserveadjustment, our effective tax rate for the year totaled 30.3 percent. This adjusted rate was lower than our earlierestimates for the full year due to year-end state tax true-ups on the actual full year results. We expect our long-termeffective tax rate to be approximately 36 percent. Our effective tax rate was 34.9 percent in fiscal 2003 and 38.5percent in 2002.
Cumulative Effect of Accounting ChangeWe adopted the revised provisions of Financial Accounting Standards Board Interpretation No. 46, “Consolidation of Variable Interest Entities” (FIN 46(R)) at the end of fiscal 2004. This new accounting standard broadens therequirements for determining whether a company is required to consolidate the financial statements of another entity.In adopting FIN 46(R), we determined the need to consolidate the financial statements of two independent contractfurniture dealerships to which we have provided ongoing financial support through loans and/or financial guarantees.
As a result of this consolidation, we recorded a non-cash cumulative effect loss of $0.5 million, or slightly lessthan $0.01 per share, net of tax. As this new accounting standard was adopted at the end of the current fiscal year, the consolidation had no material impact on our fiscal 2004 Consolidated Statement of Operations beyond thatof the cumulative effect. In the future, the results of operations of these two dealers will be included in our ConsolidatedStatement of Operations. The effect of adoption on our Consolidated Balance Sheet as of May 29, 2004, was anincrease to assets of approximately $2.0 million and liabilities of $2.6 million. Refer to Note 4 of the ConsolidatedFinancial Statements for additional information on FIN 46(R).
Change in Accounting PrincipleAt the beginning of fiscal 2004, we converted a portion of our remaining FIFO-based domestic inventories to LIFO for inventory valuation purposes. Due to the facility rationalization and consolidation resulting from our restructuringactivities in recent years, we determined it was more appropriate to account for these inventories using the LIFOmethod. There was no cumulative effect of this change in accounting principle, and the impact on our fiscal 2004results was not material.
Net EarningsNet earnings totaled $42.3 million in fiscal 2004 or $0.58 per share after the impact of the cumulative effectof accounting change. This compares to net earnings of $23.3 million or $0.31 per share in 2003. In fiscal 2002, we reported a net loss of $56.0 million or $0.74 per share. The per-share impact of restructuring charges recognizedduring fiscal years 2004, 2003, and 2002 totaled approximately $0.09, $0.14, and $0.68, net of taxes, respectively.
Form 10-K 19
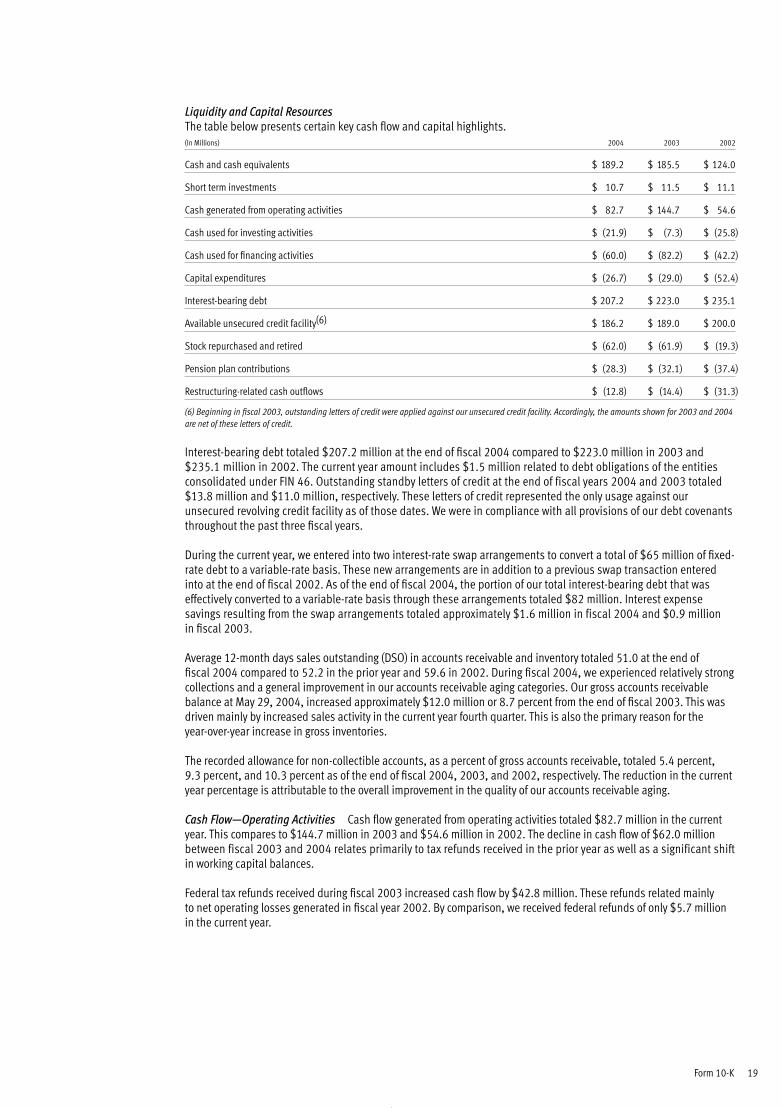
Liquidity and Capital ResourcesThe table below presents certain key cash flow and capital highlights.(In Millions) 2004 2003 2002
Cash and cash equivalents $ 189.2 $ 185.5 $ 124.0
Short term investments $ 10.7 $ 11.5 $ 11.1
Cash generated from operating activities $ 82.7 $ 144.7 $ 54.6
Cash used for investing activities $ (21.9) $ (7.3) $ (25.8)
Cash used for financing activities $ (60.0) $ (82.2) $ (42.2)
Capital expenditures $ (26.7) $ (29.0) $ (52.4)
Interest-bearing debt $ 207.2 $ 223.0 $ 235.1
Available unsecured credit facility(6) $ 186.2 $ 189.0 $ 200.0
Stock repurchased and retired $ (62.0) $ (61.9) $ (19.3)
Pension plan contributions $ (28.3) $ (32.1) $ (37.4)
Restructuring-related cash outflows $ (12.8) $ (14.4) $ (31.3)
(6) Beginning in fiscal 2003, outstanding letters of credit were applied against our unsecured credit facility. Accordingly, the amounts shown for 2003 and 2004are net of these letters of credit.
Interest-bearing debt totaled $207.2 million at the end of fiscal 2004 compared to $223.0 million in 2003 and$235.1 million in 2002. The current year amount includes $1.5 million related to debt obligations of the entitiesconsolidated under FIN 46. Outstanding standby letters of credit at the end of fiscal years 2004 and 2003 totaled$13.8 million and $11.0 million, respectively. These letters of credit represented the only usage against ourunsecured revolving credit facility as of those dates. We were in compliance with all provisions of our debt covenantsthroughout the past three fiscal years.
During the current year, we entered into two interest-rate swap arrangements to convert a total of $65 million of fixed-rate debt to a variable-rate basis. These new arrangements are in addition to a previous swap transaction enteredinto at the end of fiscal 2002. As of the end of fiscal 2004, the portion of our total interest-bearing debt that waseffectively converted to a variable-rate basis through these arrangements totaled $82 million. Interest expensesavings resulting from the swap arrangements totaled approximately $1.6 million in fiscal 2004 and $0.9 million in fiscal 2003.
Average 12-month days sales outstanding (DSO) in accounts receivable and inventory totaled 51.0 at the end offiscal 2004 compared to 52.2 in the prior year and 59.6 in 2002. During fiscal 2004, we experienced relatively strongcollections and a general improvement in our accounts receivable aging categories. Our gross accounts receivablebalance at May 29, 2004, increased approximately $12.0 million or 8.7 percent from the end of fiscal 2003. This wasdriven mainly by increased sales activity in the current year fourth quarter. This is also the primary reason for the year-over-year increase in gross inventories.
The recorded allowance for non-collectible accounts, as a percent of gross accounts receivable, totaled 5.4 percent, 9.3 percent, and 10.3 percent as of the end of fiscal 2004, 2003, and 2002, respectively. The reduction in the currentyear percentage is attributable to the overall improvement in the quality of our accounts receivable aging.
Cash Flow—Operating Activities Cash flow generated from operating activities totaled $82.7 million in the currentyear. This compares to $144.7 million in 2003 and $54.6 million in 2002. The decline in cash flow of $62.0 millionbetween fiscal 2003 and 2004 relates primarily to tax refunds received in the prior year as well as a significant shiftin working capital balances.
Federal tax refunds received during fiscal 2003 increased cash flow by $42.8 million. These refunds related mainlyto net operating losses generated in fiscal year 2002. By comparison, we received federal refunds of only $5.7 millionin the current year.
20 2004 Report to Shareholders Herman Miller, Inc., and Subsidiaries
As a reminder, in fiscal 2003 we made cash payments totaling $20.4 million for taxes and interest related to our2002 settlement with the IRS concerning our COLI program. These payments reduced operating cash flows, partiallyoffsetting the favorable changes in working capital balances discussed below.
From a working capital perspective, we received a much larger cash flow benefit in fiscal 2003 as compared to thecurrent year. Most of this benefit was driven by a significant increase in accrued income taxes and declinesin accounts receivable and inventory balances between 2002 and 2003. By contrast, in fiscal 2004 these working capital balances moved in the opposite direction, resulting in a year-over-year decrease in accrued income taxesand increases in both accounts receivable and inventories. These negative factors were partially offset in 2004 by a production-driven increase in accounts payable, higher relative compensation and benefit accruals, and favorablechanges in deferred taxes.
We made cash contributions to our employee pension funds totaling $28.3 million in fiscal 2004. In fiscal years 2003and 2002, such contributions totaled $32.1 million and $37.4 million, respectively. These payments reducedoperating cash flows in each of these years. Subsequent to the end of fiscal 2004, in July 2004, we made additionalcash contributions totalling $23 million to our domestic pension plans.
Again in fiscal 2004, we incurred operating cash outflows related to our restructuring activities. Cash paymentsin the year totaled $12.8 million. We made similar cash payments in 2003 and 2002 totaling $14.4 million and $31.3million, respectively.
Cash Flow—Investing ActivitiesCash outflows for investing activities in fiscal 2004 totaled $21.9 million and were driven primarily by capitalexpenditures offset by proceeds from the sale of fixed assets. These same factors combined in fiscal 2003 to generatethe majority of the $7.3 million outflow in that year. In fiscal year 2002, cash outflows totaling $25.8 million, whichrelated mainly to capital expenditures, were offset by a $14.0 million cash receipt from the net surrender value of our COLI policies.
Capital expenditures in the current year totaled $26.7 million; down slightly from $29.0 million in fiscal 2003. In fiscal2002, our spending was substantially higher in this area totaling $52.4 million. We have made significant progressin recent years adjusting our annual capital spending to be in line with business levels. We will continue to carefullymonitor and challenge our spending in this area while at the same time taking care not to eliminate investmentsthat are important to the long-term success of our operations and overall strategy.
As of the end of fiscal 2004, we had outstanding commitments for future capital purchases of approximately $2.7million. We expect fiscal 2005 capital expenditures to total between $40 million and $50 million.
During the second quarter of fiscal 2004, we completed the sale of our Holland, Michigan, Chair Plant. This facilitywas exited in connection with our restructuring plan, and its sale generated net proceeds of approximately $6.0 million. In fiscal 2003, we received proceeds totaling $20.2 million from the sale of our Rocklin, California, and West MichiganPowder Coat Technology facilities. Both of these facilities were exited in connection with prior restructuring actions.
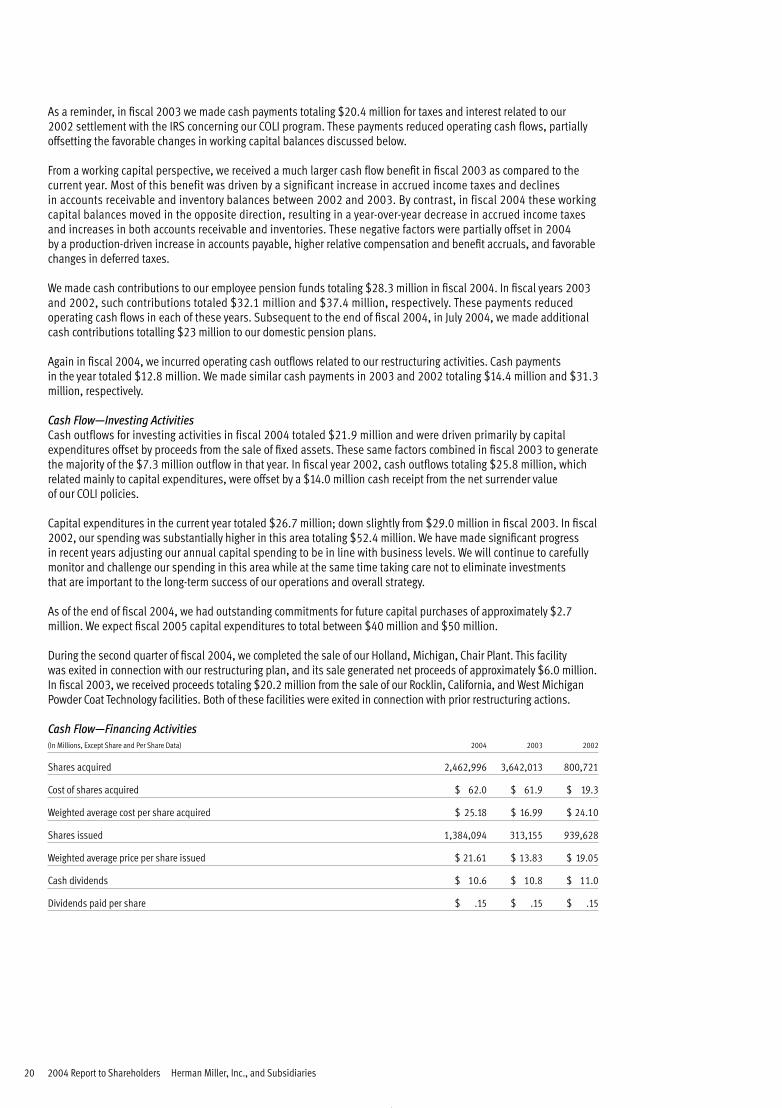
Cash Flow—Financing Activities(In Millions, Except Share and Per Share Data) 2004 2003 2002
Shares acquired 2,462,996 3,642,013 800,721
Cost of shares acquired $ 62.0 $ 61.9 $ 19.3
Weighted average cost per share acquired $ 25.18 $ 16.99 $ 24.10
Shares issued 1,384,094 313,155 939,628
Weighted average price per share issued $ 21.61 $ 13.83 $ 19.05
Cash dividends $ 10.6 $ 10.8 $ 11.0
Dividends paid per share $ .15 $ .15 $ .15
Form 10-K 21
Cash outflows for financing activities totaled $60.0 million in fiscal 2004 compared to $82.2 million in 2003 and $42.2 million in 2002.
As was the case in 2003, share repurchases in the current year accounted for a majority of the outflows in this category.In 2004, we repurchased fewer shares than in the prior year; however, they were acquired at a significantly higherweighted average cost. This resulted in essentially the same total cash outflow for repurchases between years. Duringthe current year, our Board of Directors gave us approval to continue our share repurchase program with an additional$100 million authorization limit. As of the end of fiscal 2004, we had approximately $89.7 million available on ourauthorization to be used for future share repurchases. We continue to believe this is an effective means of returningvalue to our shareholders.
During fiscal 2004 we received cash totaling $27.4 million related to the issuance of our common stock. This wasdriven mainly by the exercise of stock options, the volume of which increased significantly from last year presumablydue to the current year increase in our stock price. In fiscal 2003, cash received from the issuance of stock totaledonly $3.9 million and related primarily to issuances in connection with employee benefit plans.
Repayments of long-term debt totaled $14.8 million in fiscal 2004. The majority of this related to the current yearscheduled payment on our private placement notes. We also repaid approximately $1.8 million in remaining debtrelated to a prior dealer acquisition. In fiscal 2003, repayments totaled $13.4 million with the majority again related to the private placement. Also included in our 2003 repayments was approximately $2.8 million related to short-term bank debt associated with our former Australian business. Debt repayments in fiscal 2002 were $25.6million. Our next scheduled debt repayment totals $13.0 million and will be made in the fourth quarter of fiscal 2005.
We paid cash dividends of $10.6 million, $10.8 million, and $11.0 million during fiscal 2004, 2003, and 2002,respectively. In April 2004, we announced a 100 percent increase in our quarterly dividend rate, bringing it to $0.0725per share. We will begin paying at this new rate in the first quarter of fiscal 2005.
We believe cash on hand, cash generated from operations, and our credit facilities will provide adequate liquidityto fund near term and future business operations and capital needs.
Contingencies
The company, for a number of years, has sold various products to the United States Government under GeneralServices Administration (“GSA”) multiple award schedule contracts. Under the terms of these contracts, the GSAis permitted to audit the company’s compliance with the GSA contracts. The company has occasionally noted errorsin complying with contract provisions. From time to time the company has notified the GSA of known instancesof non-compliance (whether favorable or unfavorable to the GSA) once such circumstances are identified andinvestigated. The company does not believe that any of the errors brought to the GSA’s attention will adverselyaffect its relationship with the GSA. Currently no GSA audits are either scheduled or in process. Management doesnot expect resolution of the completed audits or non-compliance notifications to have a material adverse effecton the company’s consolidated financial statements.
On March 19, 2003, a settlement was reached in mediation concerning an audit of the company’s compliance with its international GSA contract for the years 1991, 1992, and 1993. The terms of the settlement required the companyto pay $0.6 million to the United States Government. This payment was made during the fourth quarter of fiscal 2003.The financial impact of this settlement was previously reserved for, and consequently, it had no impacton fiscal 2003 net earnings.
The company is also involved in legal proceedings and litigation arising in the ordinary course of business. In theopinion of management, the outcome of such proceedings and litigation currently pending will not materially effectthe company’s consolidated financial statements.
Basis of Presentation
Fiscal years 2004, 2003, and 2002 each contained 52 weeks. This is the basis upon which all of the above weeklyaverage data is presented.
22 2004 Report to Shareholders Herman Miller, Inc., and Subsidiaries
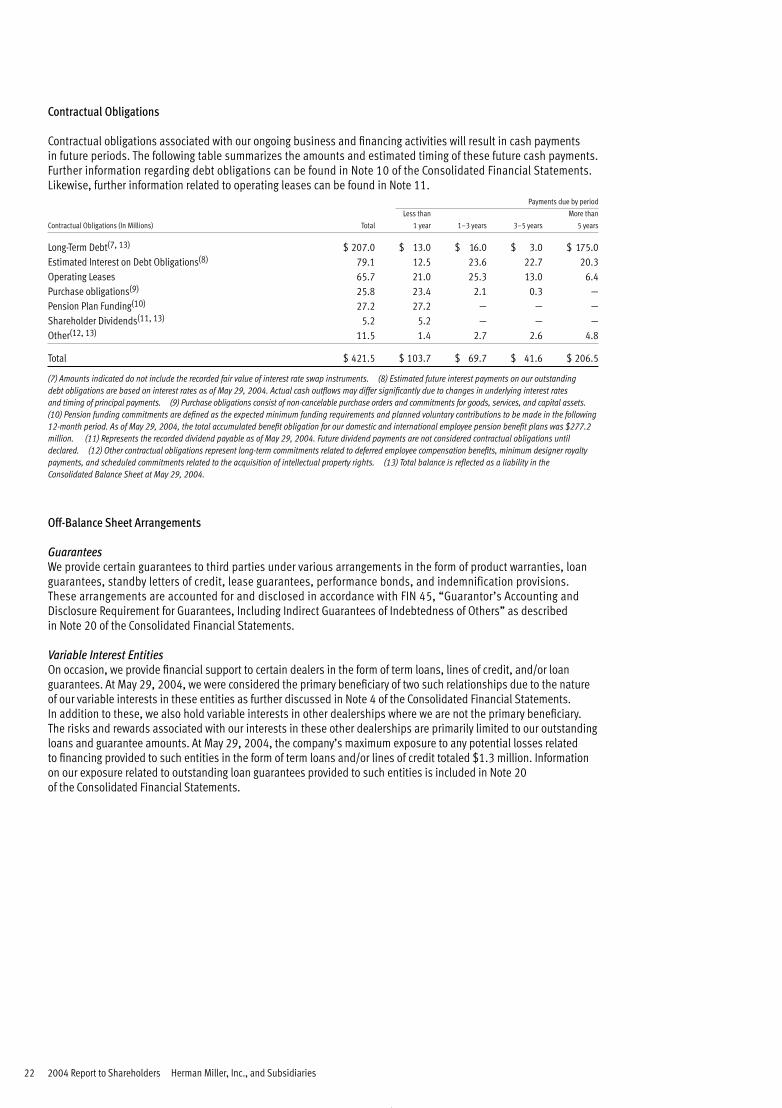
Contractual Obligations
Contractual obligations associated with our ongoing business and financing activities will result in cash paymentsin future periods. The following table summarizes the amounts and estimated timing of these future cash payments.Further information regarding debt obligations can be found in Note 10 of the Consolidated Financial Statements.Likewise, further information related to operating leases can be found in Note 11.
Payments due by period
Less than More than
Contractual Obligations (In Millions) Total 1 year 1–3 years 3–5 years 5 years
Long-Term Debt(7, 13) $ 207.0 $ 13.0 $ 16.0 $ 3.0 $ 175.0Estimated Interest on Debt Obligations(8) 79.1 12.5 23.6 22.7 20.3Operating Leases 65.7 21.0 25.3 13.0 6.4Purchase obligations(9) 25.8 23.4 2.1 0.3 —Pension Plan Funding(10) 27.2 27.2 — — —Shareholder Dividends(11, 13) 5.2 5.2 — — —Other(12, 13) 11.5 1.4 2.7 2.6 4.8
Total $ 421.5 $ 103.7 $ 69.7 $ 41.6 $ 206.5
(7) Amounts indicated do not include the recorded fair value of interest rate swap instruments. (8) Estimated future interest payments on our outstanding debt obligations are based on interest rates as of May 29, 2004. Actual cash outflows may differ significantly due to changes in underlying interest ratesand timing of principal payments. (9) Purchase obligations consist of non-cancelable purchase orders and commitments for goods, services, and capital assets.(10) Pension funding commitments are defined as the expected minimum funding requirements and planned voluntary contributions to be made in the following12-month period. As of May 29, 2004, the total accumulated benefit obligation for our domestic and international employee pension benefit plans was $277.2million. (11) Represents the recorded dividend payable as of May 29, 2004. Future dividend payments are not considered contractual obligations untildeclared. (12) Other contractual obligations represent long-term commitments related to deferred employee compensation benefits, minimum designer royaltypayments, and scheduled commitments related to the acquisition of intellectual property rights. (13) Total balance is reflected as a liability in theConsolidated Balance Sheet at May 29, 2004.
Off-Balance Sheet Arrangements
GuaranteesWe provide certain guarantees to third parties under various arrangements in the form of product warranties, loanguarantees, standby letters of credit, lease guarantees, performance bonds, and indemnification provisions. These arrangements are accounted for and disclosed in accordance with FIN 45, “Guarantor’s Accounting andDisclosure Requirement for Guarantees, Including Indirect Guarantees of Indebtedness of Others” as described in Note 20 of the Consolidated Financial Statements.
Variable Interest EntitiesOn occasion, we provide financial support to certain dealers in the form of term loans, lines of credit, and/or loanguarantees. At May 29, 2004, we were considered the primary beneficiary of two such relationships due to the natureof our variable interests in these entities as further discussed in Note 4 of the Consolidated Financial Statements. In addition to these, we also hold variable interests in other dealerships where we are not the primary beneficiary. The risks and rewards associated with our interests in these other dealerships are primarily limited to our outstandingloans and guarantee amounts. At May 29, 2004, the company’s maximum exposure to any potential losses related to financing provided to such entities in the form of term loans and/or lines of credit totaled $1.3 million. Informationon our exposure related to outstanding loan guarantees provided to such entities is included in Note 20 of the Consolidated Financial Statements.
Form 10-K 23
Critical Accounting Policies
We strive to report our financial results clearly and understandably. We follow accounting principles generally acceptedin the U.S. in preparing our consolidated financial statements, which require us to make certain estimates and applyjudgments that affect our financial position and results of operations. We continually review our accounting policiesand financial information disclosures. Following is a summary of our more significant accounting policies that requirethe use of estimates and judgments in preparing the financial statements.
Receivable AllowancesWe base our allowances related to receivables on known customer exposures, historical credit experience, and the specific identification of other potential problems, including the economic climate. These methods are appliedto all major receivables, including trade, lease, and notes receivables. In addition to known or judgmentalcomponents of our allowances, we follow a policy that consistently applies reserve rates based on the age ofoutstanding accounts receivable. Actual collections can differ from our historical experience, and if economicor business conditions deteriorate significantly, adjustments to these reserves could be required.
The accounts receivable allowance totaled $8.1 million and $12.9 million at May 29, 2004, and May 31, 2003,respectively. This year-over-year reduction is attributable to the overall improvement in the quality of our accountsreceivable aging. The notes receivable allowance totaled $1.4 million and $4.4 million at May 29, 2004, and May 31, 2003,respectively. This year-over-year reduction is attributable to current year collections and the elimination of intercompanybalances with OP Spectrum LLP consolidated upon the acquisition as further described in Note 2 and with certain dealerships consolidated upon the adoption of FIN 46(R) as further described in Note 4 of the ConsolidatedFinancial Statements.
GoodwillThe net carrying value of our goodwill at May 29, 2004, totaled $39.1 million. Beginning in fiscal year 2003, we ceasedrecognizing amortization expense on these goodwill assets in accordance with the accounting guidance in Statementof Financial Accounting Standards No. 142. Under this new rule, we are required to perform an annual test on ourgoodwill assets, by reporting unit, to determine whether the asset values are impaired. If impairment is determined,we are required to recognize a charge sufficient to reduce the net carrying value of the assets to their estimated fair market value.
We performed this test in the fourth quarter of fiscal 2004 and determined that no impairment exists. Our estimate of reporting unit fair value was based on discounted cash flows. Accordingly, we were required to make certainassumptions regarding future profitability and cash flows. It also required us to use an assumed discount rate, whichwe set at 10 percent. We believe this level is conservative in that it exceeds our estimated weighted average cost ofcapital. Changes to the discount rate used in this analysis have a significant impact on the results of the impairmenttest. Our analysis indicates that we could increase this discount rate by more than 2 full percentage pointsbefore the results of the test indicated impairment.
Warranty ReserveWe stand behind our products and keep our promises to customers. From time to time, issues arise resulting in the need to incur costs to correct or replace problems with products or services. We have established warranty reservesfor the various costs associated with these guarantees. General warranty reserves are based on historical claimsexperience and periodically adjusted for business levels. Specific reserves are established once an issue is identified.The valuations of such reserves are based on the estimated costs to correct the problem. Actual costs may varyand result in an adjustment to our reserves.
Inventory ReservesInventories are valued at the lower of cost or market. The inventories of certain subsidiaries are valued using the last-in, first-out (LIFO) method. The inventories of other subsidiaries are valued using first-in, first-out method. We establish reserves for excess and obsolete inventory, based on material movement and a component of judgmentfor consideration of current events, such as economic conditions, that may affect inventory. The amount of reserverequired to record inventory at lower of cost or market may be adjusted as conditions change.
24 2004 Report to Shareholders Herman Miller, Inc., and Subsidiaries
Income TaxesDeferred tax assets and liabilities are recognized for the expected future tax consequences attributable to differencesbetween the financial statement carrying amounts of existing assets and liabilities, and their respective tax bases.Deferred tax assets and liabilities are measured using the enacted tax rates expected to apply to taxable income in the years in which those temporary differences are expected to reverse.
We have net operating loss (NOL) carryforwards available in certain jurisdictions to reduce future taxable income.Future tax benefits for NOL carryforwards are recognized to the extent that realization of these benefits is consideredmore likely than not. We base this determination on the expectation that related operations will be sufficientlyprofitable or various tax planning strategies available to us will enable us to utilize the NOL carryforwards. When information becomes available that raises doubts about the realization of a deferred income tax asset, a valuationallowance is established.
Self-Insurance ReservesWith the assistance of independent actuaries, we establish reserves for workers’ compensation and general liabilityexposures. The reserves are established based on actuarially determined expected future claims. We also establishedreserves for health benefit exposures based on historical claims information along with certain assumptions aboutfuture trends. The methods and assumptions used to determine the liabilities are applied consistently, although actualclaim experience can vary. We maintain certain insurance coverage for risk exposures through traditional premium-based insurance policies.
Pension and other Post-Retirement BenefitsThe determination of the obligation and expense for pension and other post-retirement benefits depends on certainactuarial assumptions used in calculating such amounts. Among the most significant of these assumptionsare the discount rate, expected long-term rate of return on plan assets, and expected rate of increases in compensationand healthcare costs. These assumptions are reviewed annually based on internal and external factors. Adjustmentsto the assumptions could result in changes to the future expense and liabilities. Refer to Note 12 of the ConsolidatedFinancial Statements for more information regarding costs and assumptions used for employee benefit plans.
Long-Lived AssetsWe evaluate long-lived assets and acquired businesses for indicators of impairment when events or circumstancesindicate that a risk may be present. Our judgments regarding the existence of impairment are based on marketconditions, operational performance, and estimated future cash flows. If the carrying value of a long-lived asset isconsidered impaired, an impairment charge is recorded to adjust the asset to its estimated fair value.
New Accounting Standards
In May 2003, the Emerging Issues Task Force issued its consensus on Issue No. 03-04, “Determining the Classificationand Benefit Attribution Method for a ‘Cash Balance’ Pension Plan” (EITF 03-04). In this consensus, the Task Forceconcluded that the actuarially determined pension expense for cash balance plans that have fixed-interest credit ratesand are not pay-related, be determined using the traditional unit credit method of accounting. The company adopted the provisions of EITF 03-04 effective at the beginning of the first quarter of fiscal 2004. The adoption of EITF 03-04 did not have a material impact on the company’s consolidated financial statements.
In May 2003, the FASB issued SFAS No. 150, “Accounting for Certain Financial Instruments with Characteristics of BothLiabilities and Equity” (SFAS 150). SFAS 150 modified the traditional definition of “liabilities” to encompass certainobligations that must be settled through the issuance of equity shares. These obligations are considered liabilitiesas opposed to equity or mezzanine financing under the provisions of SFAS 150. In addition, SFAS 150 increased the required disclosures of alternate settlement methods related to these obligations. This new standard was effectiveimmediately for financial instruments entered into or modified after May 31, 2003, and for all other financialinstruments beginning in the second quarter of fiscal 2004. The adoption of SFAS 150 did not have an impacton the company’s consolidated financial statements.
In May 2003, the Emerging Issues Task Force issued its consensus on Issue No. 00-21, “Revenue Arrangements withMultiple Deliverables” (EITF 00-21). In this consensus, the Task Force addressed certain aspects of the accounting by a vendor for arrangements under which it will perform multiple revenue-generating activities. The company adopted
Form 10-K 25
the provisions of EITF 00-21 effective at the beginning of the second quarter of fiscal 2004. The adoption of EITF 00-21did not have a material impact on the company’s consolidated financial statements.
In December 2003, the FASB issued a revision to Interpretation No. 46, “Consolidation of Variable Interest Entities”(FIN 46(R)). This new rule requires that companies consolidate a variable interest entity if the company is deemed the primary beneficiary subject to a majority of the risk of loss from the variable interest entity’s activities, or is entitledto receive a majority of the entity’s residual returns, or both. The company has no special purpose entities, as defined, nor has it acquired a variable interest in an entity where the company is the primary beneficiary sinceJanuary 31, 2003. The provisions of FIN 46(R) are required to be applied as of the end of the first reporting periodthat ends after March 15, 2004, for the variable interest entities in which the company holds a variable interest thatit acquired on or before January 31, 2003. The company adopted FIN 46(R) at end of the fourth quarter of fiscal 2004.Refer to Note 4, Variable Interest Entities, for further discussion.
In December 2003, the FASB issued SFAS No. 132 revised 2003, “Employers’ Disclosures about Pensions and OtherPostretirement Benefits” (SFAS 132(R)). This standard increases the existing disclosure requirements by requiring moredetails about pension plan assets, benefit obligations, cash flows, benefit costs and related information. Companieswill be required to segregate plan assets by category, such as debt, equity and real estate, and to provide certainexpected rates of return and other informational disclosures. SFAS 132(R) also requires companies to disclose variouselements of pension and post-retirement benefit costs in interim-period financial statements for quarters beginningafter December 15, 2003. The company adopted the additional annual disclosure provisions of SFAS 132(R) in thefourth quarter of fiscal 2004. Refer to Note 12, Employee Benefit Plans, for further disclosures regarding pension and other post-retirement benefits.
In March 2004, the Emerging Issues Task Force issued a consensus on Issue No. 03-01, “The Meaning of Other-Than-Temporary Impairment and Its Application to Certain Investments” (EITF 03-01). In this consensus, the Task Forcerequired certain quantitative and qualitative disclosures related to debt and marketable equity securities classified as available-for-sale or held-to-maturity under SFAS 115 that are in an unrealized loss position at the balance sheet datebut for which an other-than-temporary impairment has not been recognized. In addition, the Task Force developed abasic model in evaluating whether investments within the scope of EITF 03-01 have other-than-temporary impairment.The company adopted provisions of EITF 03-01 in the fourth quarter of fiscal 2004. Adoption of EITF 03-01 did not have a material impact on the company’s consolidated financial statements. Refer to Note 1, Significant Accounting and Reporting Policies, for further disclosures regarding short-term investments.
In May 2004, the FASB issued Staff Position No. 106-2, “Accounting and Disclosure Requirements Related to theMedicare Prescription Drug, Improvement and Modernization Act of 2003” (FSP 106-2) in response to the Act that wassigned into law on December 8, 2003. The Act introduced a prescription drug benefit under Medicare (Medicare Part D)as well as a federal subsidy to sponsors of retiree healthcare plans that provide a benefit that is at least actuariallyequivalent to Medicare Part D. The provisions of FSP 106-2 provide guidance on the accounting treatment and requireddisclosures relating to the effects of the Act. This guidance supersedes FASB Staff Position No. 106-1, “Accounting andDisclosure Requirements Related to the Medicare Prescription Drug, Improvement and Modernization Act of 2003”(FSP 106-1). Currently, specific regulatory guidance does not exist regarding how to determine whether a plan isconsidered actuarially equivalent, a key criterion under FSP 106-2. Accordingly, the company is currently in the processof evaluating existing plan benefits to determine actuarial equivalency and the corresponding impact of the FSP on thefinancial statements. The company expects to adopt the provisions of FSP 106-2 in the second quarter of fiscal 2005.
Forward-Looking Statements
This discussion and other sections of our Annual Report contain forward-looking statements within the meaning of Section 27A of the Securities Act of 1933, as amended, and Section 21E of the Securities Exchange Act, as amended,that are based on management’s beliefs, assumptions, current expectations, estimates, and projections about theoffice furniture industry, the economy, and the company itself. Words like “anticipates,” “believes,” “confident,”“estimates,” “expects,” “forecasts,” “likely,” “plans,” “projects,” “should,” variations of such words, and similarexpressions identify such forward-looking statements. These statements do not guarantee future performance and involve certain risks, uncertainties, and assumptions that are difficult to predict with regard to timing, extent,likelihood, and degree of occurrence. Therefore, actual results and outcomes may materially differ from what weexpress or forecast. Furthermore, Herman Miller, Inc., undertakes no obligation to update, amend, or clarify forward-looking statements.
26 2004 Report to Shareholders Herman Miller, Inc., and Subsidiaries
Item 7A Quantitative and Qualitative Disclosures about Market Risk
The company manufactures, markets, and sells its products throughout the world and, as a result, is subjectto changing economic conditions, which could reduce the demand for its products.
Favorable foreign currency fluctuations during fiscal 2004 resulted in increased earnings from continuing operationsbefore income taxes of $0.1 million. Additionally, the accumulated other comprehensive loss component of totalshareholders’ equity was reduced during fiscal 2004 by $3.4 million as a result of these changes. By comparison,currency fluctuations in fiscal 2003 resulted in increased pretax earnings of $0.9 million and reduced accumulatedother comprehensive loss by $7.7 million. Because the company conducts business internationally, it will continue to be subject to related currency exchange rate fluctuations.
The company maintains fixed-rate debt. For fixed-rate debt, changes in interest rates generally affect fair market valuebut not earnings or cash flows. The company does not have an incentive to prepay fixed rate debt prior to maturity, and as a result, interest rate risk and changes in fair market value should not have a significant impact on such debt untilthe company would be required to refinance it. The company has three separate interest rate swap agreements thateffectively convert $82 million in total of fixed-rate debt to a variable-rate basis at the end of the fiscal year. This debtis subject to changes in interest rates, which could have a material impact on the company’s financial results. The interest rate swap derivative instruments are held and used by the company as a tool for managing interest rate risk.They are not used for trading or speculative purposes. The counterparties to these swap instruments are large majorfinancial institutions that the company believes are of high-quality creditworthiness. While the company may beexposed to potential losses due to the credit risk of non-performance by these counterparties, such losses are notanticipated. The swap arrangements resulted in the reduction of net interest expense by approximately $1.6 millionand $0.9 million in fiscal years 2004 and 2003, respectively. In fiscal 2002, the effect on net interest expense was notmaterial. As of May 29, 2004, the swap instruments had a combined negative fair value of approximately $1.3 million.All cash flows related to the company’s interest rate swap agreements are denominated in U.S. dollars. For furtherinformation, refer to Fair Value of Financial Instruments and Financial Instruments with Off-Balance-Sheet Risk in Notes17 and 18 to the Consolidated Financial Statements.
Expected cash flows (notional amounts) over the next five years and thereafter related to debt instrumentsare as follows.(In Millions) 2005 2006 2007 2008 2009 Thereafter Total (1)
Long-term Debt:Fixed Rate $ 13.0 $ 13.0 $ 3.0 $ 3.0 $ — $ 175.0 $207.0
Weighted Average Interest Rate =7.02%
Derivative Financial InstrumentsRelated to Debt—Interest Rate Swaps:
Pay Variable/Receive Fixed $ 10.0 $ 10.0 $ — $ — $ — $ — $ 20.0Pay Interest Rate = 3.49% (at May 29, 2004)Received Interest Rate = 6.37%
Pay Variable/Receive Fixed $ 3.0 $ 3.0 $ 3.0 $ 3.0 $ — $ — $ 12.0Pay Interest Rate = 5.30% (at May 29, 2004)Received Interest Rate = 6.52%
Pay Variable/Receive Fixed $ — $ — $ — $ — $ — $ 50.0 $ 50.0Pay Interest Rate = 4.79% (at May 29, 2004)Receive Interest Rate = 7.125%
(1) Amount does not include the recorded fair value of the swap instruments, which totaled $(1.3) million at the end of fiscal 2004.
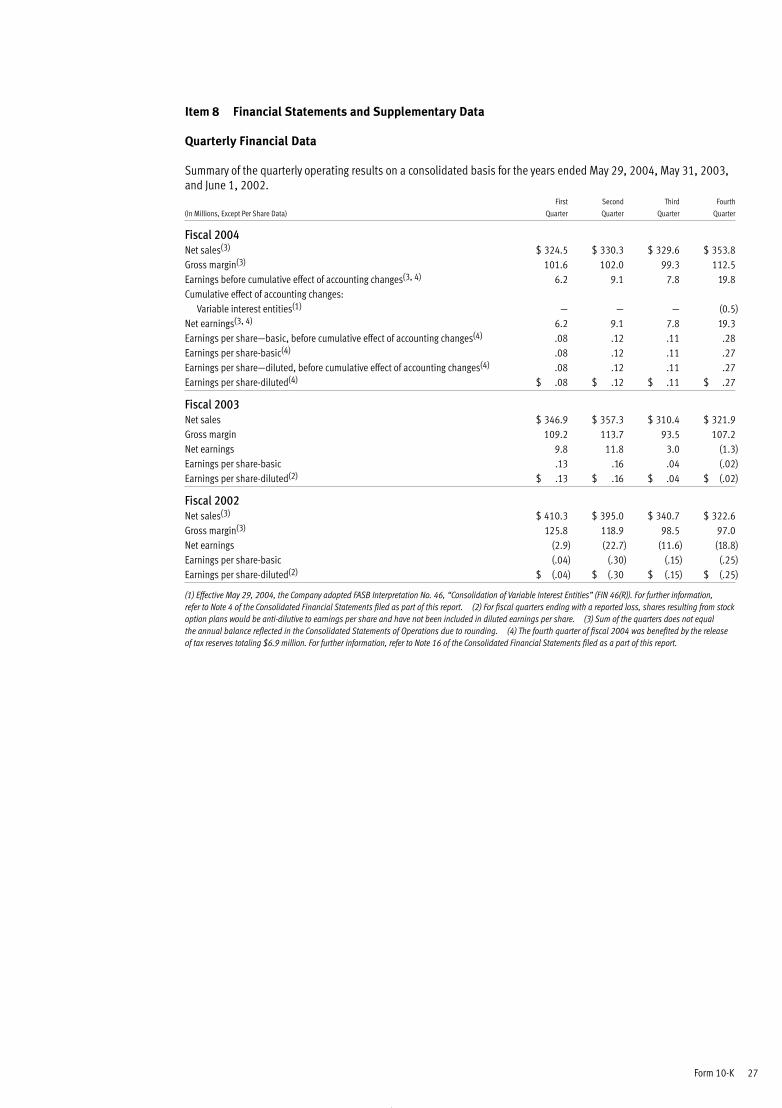
Form 10-K 27
Item 8 Financial Statements and Supplementary Data
Quarterly Financial Data
Summary of the quarterly operating results on a consolidated basis for the years ended May 29, 2004, May 31, 2003,and June 1, 2002.
First Second Third Fourth
(In Millions, Except Per Share Data) Quarter Quarter Quarter Quarter
Fiscal 2004Net sales(3) $ 324.5 $ 330.3 $ 329.6 $ 353.8Gross margin(3) 101.6 102.0 99.3 112.5Earnings before cumulative effect of accounting changes(3, 4) 6.2 9.1 7.8 19.8Cumulative effect of accounting changes:
Variable interest entities(1) — — — (0.5)Net earnings(3, 4) 6.2 9.1 7.8 19.3Earnings per share—basic, before cumulative effect of accounting changes(4) .08 .12 .11 .28Earnings per share-basic(4) .08 .12 .11 .27Earnings per share—diluted, before cumulative effect of accounting changes(4) .08 .12 .11 .27Earnings per share-diluted(4) $ .08 $ .12 $ .11 $ .27
Fiscal 2003Net sales $ 346.9 $ 357.3 $ 310.4 $ 321.9Gross margin 109.2 113.7 93.5 107.2Net earnings 9.8 11.8 3.0 (1.3)Earnings per share-basic .13 .16 .04 (.02)Earnings per share-diluted(2) $ .13 $ .16 $ .04 $ (.02)
Fiscal 2002Net sales(3) $ 410.3 $ 395.0 $ 340.7 $ 322.6Gross margin(3) 125.8 118.9 98.5 97.0Net earnings (2.9) (22.7) (11.6) (18.8)Earnings per share-basic (.04) (.30) (.15) (.25)Earnings per share-diluted(2) $ (.04) $ (.30 $ (.15) $ (.25)
(1) Effective May 29, 2004, the Company adopted FASB Interpretation No. 46, “Consolidation of Variable Interest Entities” (FIN 46(R)). For further information, refer to Note 4 of the Consolidated Financial Statements filed as part of this report. (2) For fiscal quarters ending with a reported loss, shares resulting from stockoption plans would be anti-dilutive to earnings per share and have not been included in diluted earnings per share. (3) Sum of the quarters does not equal the annual balance reflected in the Consolidated Statements of Operations due to rounding. (4) The fourth quarter of fiscal 2004 was benefited by the releaseof tax reserves totaling $6.9 million. For further information, refer to Note 16 of the Consolidated Financial Statements filed as a part of this report.
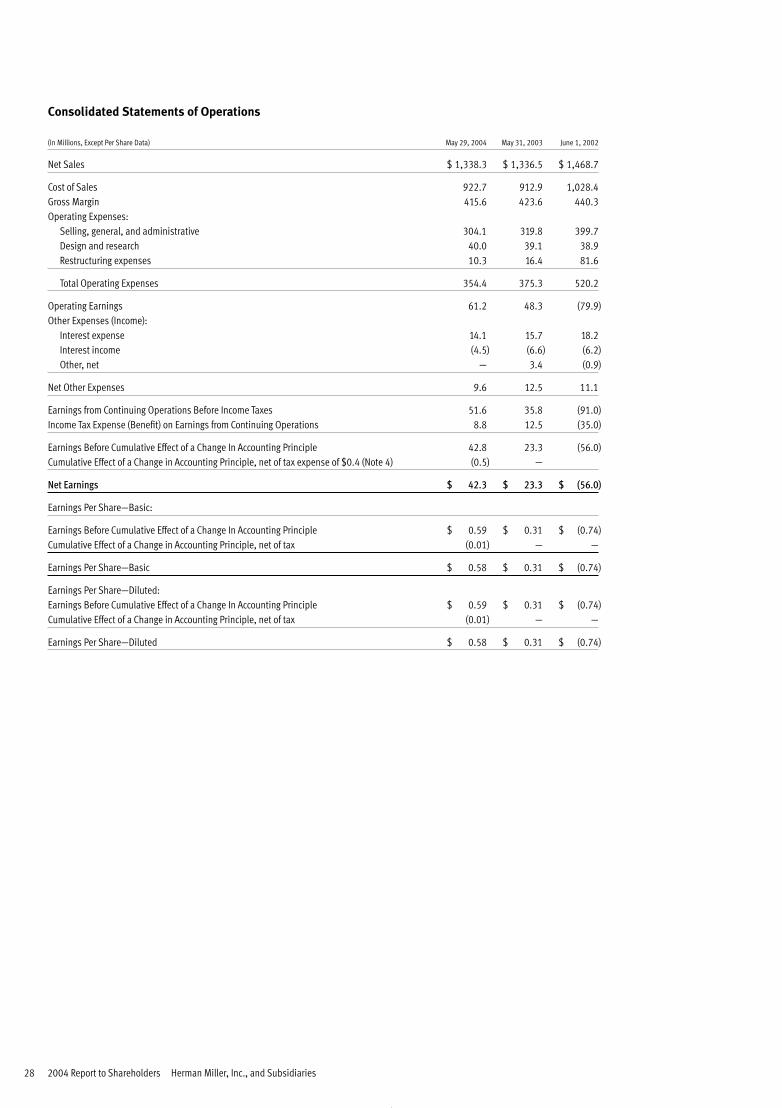
28 2004 Report to Shareholders Herman Miller, Inc., and Subsidiaries
Consolidated Statements of Operations
(In Millions, Except Per Share Data) May 29, 2004 May 31, 2003 June 1, 2002
Net Sales $ 1,338.3 $ 1,336.5 $ 1,468.7
Cost of Sales 922.7 912.9 1,028.4Gross Margin 415.6 423.6 440.3Operating Expenses:
Selling, general, and administrative 304.1 319.8 399.7Design and research 40.0 39.1 38.9Restructuring expenses 10.3 16.4 81.6
Total Operating Expenses 354.4 375.3 520.2
Operating Earnings 61.2 48.3 (79.9)Other Expenses (Income):
Interest expense 14.1 15.7 18.2Interest income (4.5) (6.6) (6.2)Other, net — 3.4 (0.9)
Net Other Expenses 9.6 12.5 11.1
Earnings from Continuing Operations Before Income Taxes 51.6 35.8 (91.0)Income Tax Expense (Benefit) on Earnings from Continuing Operations 8.8 12.5 (35.0)
Earnings Before Cumulative Effect of a Change In Accounting Principle 42.8 23.3 (56.0)Cumulative Effect of a Change in Accounting Principle, net of tax expense of $0.4 (Note 4) (0.5) —
Net Earnings $ 42.3 $ 23.3 $ (56.0)
Earnings Per Share—Basic:
Earnings Before Cumulative Effect of a Change In Accounting Principle $ 0.59 $ 0.31 $ (0.74)Cumulative Effect of a Change in Accounting Principle, net of tax (0.01) — —
Earnings Per Share—Basic $ 0.58 $ 0.31 $ (0.74)
Earnings Per Share—Diluted:Earnings Before Cumulative Effect of a Change In Accounting Principle $ 0.59 $ 0.31 $ (0.74)Cumulative Effect of a Change in Accounting Principle, net of tax (0.01) — —
Earnings Per Share—Diluted $ 0.58 $ 0.31 $ (0.74)
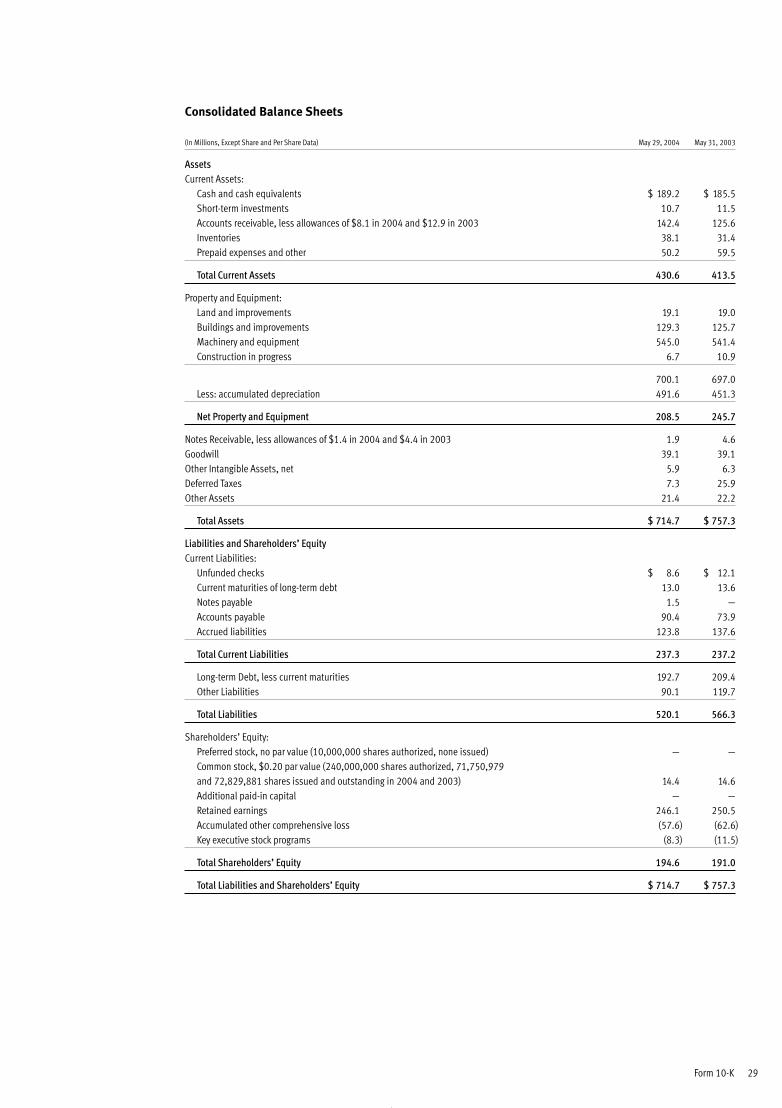
Form 10-K 29
Consolidated Balance Sheets
(In Millions, Except Share and Per Share Data) May 29, 2004 May 31, 2003
AssetsCurrent Assets:
Cash and cash equivalents $ 189.2 $ 185.5Short-term investments 10.7 11.5Accounts receivable, less allowances of $8.1 in 2004 and $12.9 in 2003 142.4 125.6Inventories 38.1 31.4Prepaid expenses and other 50.2 59.5
Total Current Assets 430.6 413.5
Property and Equipment:Land and improvements 19.1 19.0Buildings and improvements 129.3 125.7Machinery and equipment 545.0 541.4Construction in progress 6.7 10.9
700.1 697.0Less: accumulated depreciation 491.6 451.3
Net Property and Equipment 208.5 245.7
Notes Receivable, less allowances of $1.4 in 2004 and $4.4 in 2003 1.9 4.6Goodwill 39.1 39.1Other Intangible Assets, net 5.9 6.3Deferred Taxes 7.3 25.9Other Assets 21.4 22.2
Total Assets $ 714.7 $ 757.3
Liabilities and Shareholders’ EquityCurrent Liabilities:
Unfunded checks $ 8.6 $ 12.1Current maturities of long-term debt 13.0 13.6Notes payable 1.5 —Accounts payable 90.4 73.9Accrued liabilities 123.8 137.6
Total Current Liabilities 237.3 237.2
Long-term Debt, less current maturities 192.7 209.4Other Liabilities 90.1 119.7
Total Liabilities 520.1 566.3
Shareholders’ Equity:Preferred stock, no par value (10,000,000 shares authorized, none issued) — —Common stock, $0.20 par value (240,000,000 shares authorized, 71,750,979 and 72,829,881 shares issued and outstanding in 2004 and 2003) 14.4 14.6Additional paid-in capital — —Retained earnings 246.1 250.5Accumulated other comprehensive loss (57.6) (62.6)Key executive stock programs (8.3) (11.5)
Total Shareholders’ Equity 194.6 191.0
Total Liabilities and Shareholders’ Equity $ 714.7 $ 757.3
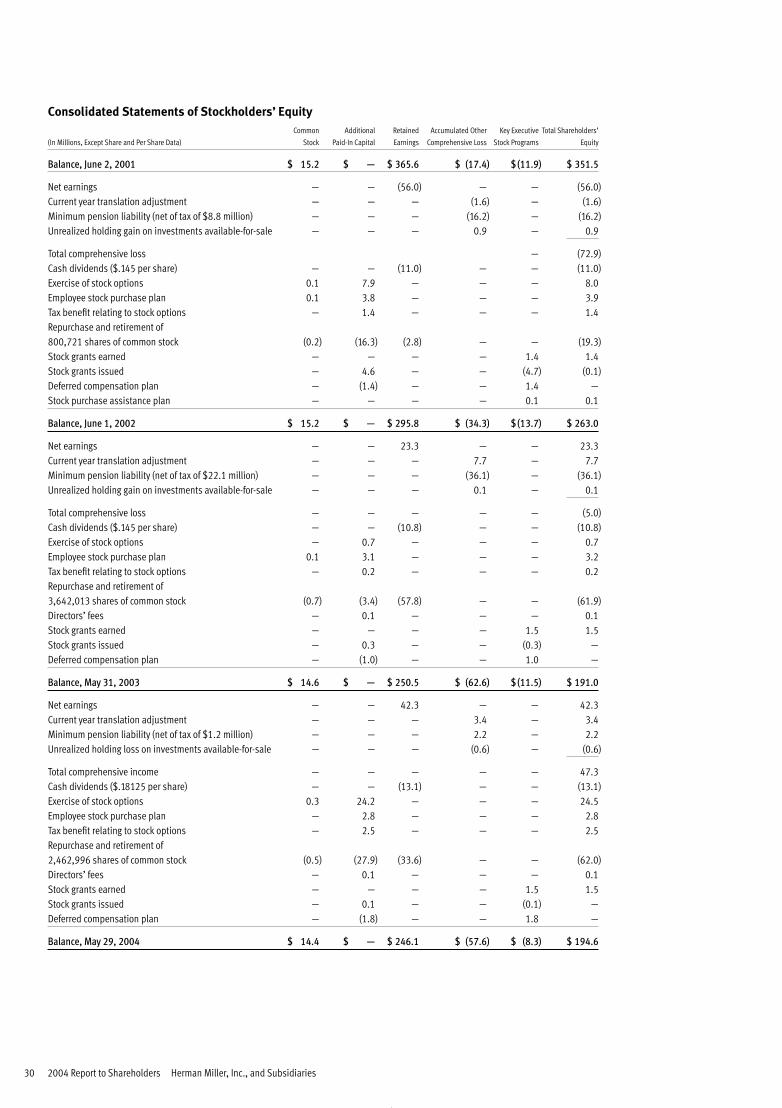
30 2004 Report to Shareholders Herman Miller, Inc., and Subsidiaries
Consolidated Statements of Stockholders’ Equity
Common Additional Retained Accumulated Other Key Executive Total Shareholders’
(In Millions, Except Share and Per Share Data) Stock Paid-In Capital Earnings Comprehensive Loss Stock Programs Equity
Balance, June 2, 2001 $ 15.2 $ — $ 365.6 $ (17.4) $ (11.9) $ 351.5
Net earnings — — (56.0) — — (56.0)Current year translation adjustment — — — (1.6) — (1.6)Minimum pension liability (net of tax of $8.8 million) — — — (16.2) — (16.2)Unrealized holding gain on investments available-for-sale — — — 0.9 — 0.9
Total comprehensive loss — (72.9)Cash dividends ($.145 per share) — — (11.0) — — (11.0)Exercise of stock options 0.1 7.9 — — — 8.0Employee stock purchase plan 0.1 3.8 — — — 3.9Tax benefit relating to stock options — 1.4 — — — 1.4Repurchase and retirement of800,721 shares of common stock (0.2) (16.3) (2.8) — — (19.3)Stock grants earned — — — — 1.4 1.4Stock grants issued — 4.6 — — (4.7) (0.1)Deferred compensation plan — (1.4) — — 1.4 —Stock purchase assistance plan — — — — 0.1 0.1
Balance, June 1, 2002 $ 15.2 $ — $ 295.8 $ (34.3) $ (13.7) $ 263.0
Net earnings — — 23.3 — — 23.3Current year translation adjustment — — — 7.7 — 7.7Minimum pension liability (net of tax of $22.1 million) — — — (36.1) — (36.1)Unrealized holding gain on investments available-for-sale — — — 0.1 — 0.1
Total comprehensive loss — — — — — (5.0)Cash dividends ($.145 per share) — — (10.8) — — (10.8)Exercise of stock options — 0.7 — — — 0.7Employee stock purchase plan 0.1 3.1 — — — 3.2Tax benefit relating to stock options — 0.2 — — — 0.2Repurchase and retirement of3,642,013 shares of common stock (0.7) (3.4) (57.8) — — (61.9)Directors’ fees — 0.1 — — — 0.1Stock grants earned — — — — 1.5 1.5Stock grants issued — 0.3 — — (0.3) —Deferred compensation plan — (1.0) — — 1.0 —
Balance, May 31, 2003 $ 14.6 $ — $ 250.5 $ (62.6) $ (11.5) $ 191.0
Net earnings — — 42.3 — — 42.3Current year translation adjustment — — — 3.4 — 3.4Minimum pension liability (net of tax of $1.2 million) — — — 2.2 — 2.2Unrealized holding loss on investments available-for-sale — — — (0.6) — (0.6)
Total comprehensive income — — — — — 47.3Cash dividends ($.18125 per share) — — (13.1) — — (13.1)Exercise of stock options 0.3 24.2 — — — 24.5Employee stock purchase plan — 2.8 — — — 2.8Tax benefit relating to stock options — 2.5 — — — 2.5Repurchase and retirement of2,462,996 shares of common stock (0.5) (27.9) (33.6) — — (62.0)Directors’ fees — 0.1 — — — 0.1Stock grants earned — — — — 1.5 1.5Stock grants issued — 0.1 — — (0.1) —Deferred compensation plan — (1.8) — — 1.8 —
Balance, May 29, 2004 $ 14.4 $ — $ 246.1 $ (57.6) $ (8.3) $ 194.6
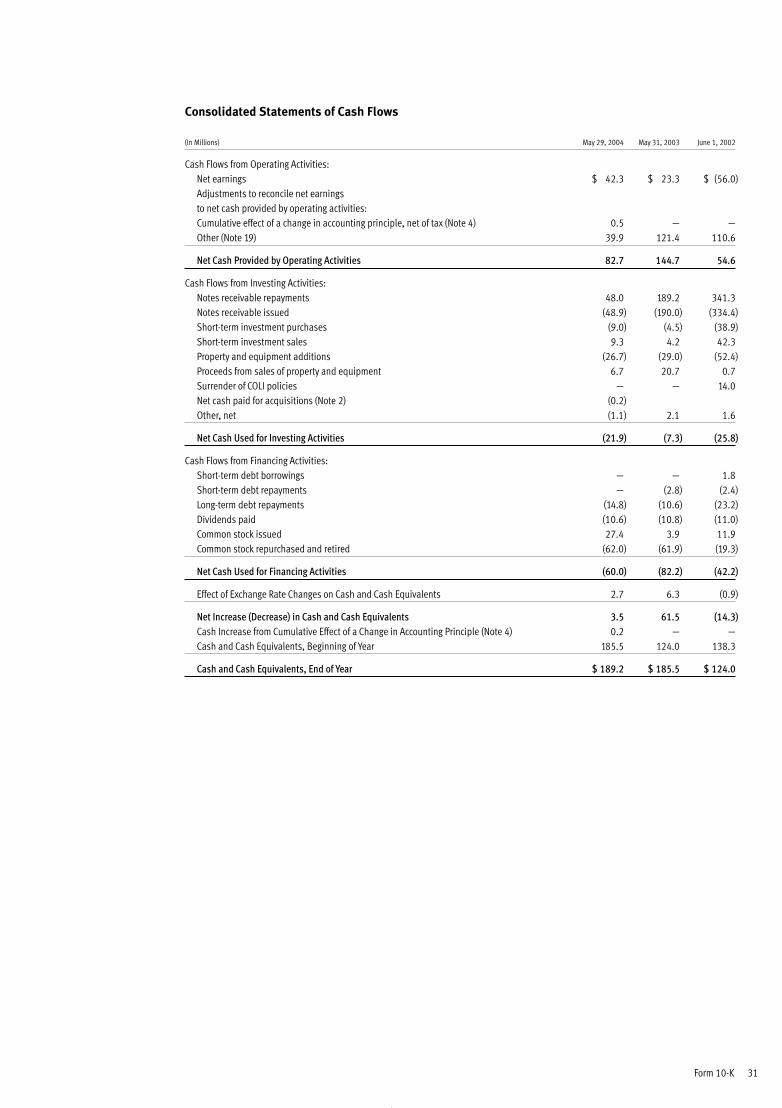
Form 10-K 31
Consolidated Statements of Cash Flows
(In Millions) May 29, 2004 May 31, 2003 June 1, 2002
Cash Flows from Operating Activities:Net earnings $ 42.3 $ 23.3 $ (56.0)Adjustments to reconcile net earningsto net cash provided by operating activities:Cumulative effect of a change in accounting principle, net of tax (Note 4) 0.5 — —Other (Note 19) 39.9 121.4 110.6
Net Cash Provided by Operating Activities 82.7 144.7 54.6
Cash Flows from Investing Activities:Notes receivable repayments 48.0 189.2 341.3Notes receivable issued (48.9) (190.0) (334.4)Short-term investment purchases (9.0) (4.5) (38.9)Short-term investment sales 9.3 4.2 42.3Property and equipment additions (26.7) (29.0) (52.4)Proceeds from sales of property and equipment 6.7 20.7 0.7Surrender of COLI policies — — 14.0Net cash paid for acquisitions (Note 2) (0.2)Other, net (1.1) 2.1 1.6
Net Cash Used for Investing Activities (21.9) (7.3) (25.8)
Cash Flows from Financing Activities:Short-term debt borrowings — — 1.8Short-term debt repayments — (2.8) (2.4)Long-term debt repayments (14.8) (10.6) (23.2)Dividends paid (10.6) (10.8) (11.0)Common stock issued 27.4 3.9 11.9Common stock repurchased and retired (62.0) (61.9) (19.3)
Net Cash Used for Financing Activities (60.0) (82.2) (42.2)
Effect of Exchange Rate Changes on Cash and Cash Equivalents 2.7 6.3 (0.9)
Net Increase (Decrease) in Cash and Cash Equivalents 3.5 61.5 (14.3)Cash Increase from Cumulative Effect of a Change in Accounting Principle (Note 4) 0.2 — —Cash and Cash Equivalents, Beginning of Year 185.5 124.0 138.3
Cash and Cash Equivalents, End of Year $ 189.2 $ 185.5 $ 124.0
32 2004 Report to Shareholders Herman Miller, Inc., and Subsidiaries
Notes to the Consolidated Financial Statements
1 Significant Accounting and Reporting Policies
The following is a summary of significant accounting and reporting policies not reflected elsewhere in the accompanyingfinancial statements.
Principles of ConsolidationThe consolidated financial statements include the accounts of Herman Miller, Inc., and its majority-owned domesticand foreign subsidiaries. Effective May 29, 2004, the consolidated financial statements also include variableinterest entities (VIEs) of which Herman Miller, Inc. is the primary beneficiary as further described in Note 4,Variable Interest Entities. The consolidated entities are collectively referred to as the “company.” All significantintercompany accounts and transactions, including those involving VIEs, have been eliminated in the consolidatedfinancial statements.
Description of BusinessThe company researches, designs, manufactures, and distributes interior furnishings and provides related servicesthat support companies all over the world. The company’s products are sold primarily to or through independentcontract office furniture dealers. Accordingly, accounts and notes receivable in the accompanying balance sheetsare principally amounts due from the dealers.
Fiscal YearThe company’s fiscal year ends on the Saturday closest to May 31. The years ended May 29, 2004, May 31, 2003, and June 1, 2002, each contained 52 weeks.
Foreign Currency TranslationThe functional currency for foreign subsidiaries is the local currency. The cumulative effects of translating the balancesheet accounts from the functional currency into the United States dollar at current exchange rates and revenue andexpense accounts using average exchange rates for the period are included as a separate component of shareholders’equity. Gains or losses arising from remeasuring foreign currency transactions into the appropriate currency areincluded in determining net earnings. Gains (losses) arising from remeasuring foreign currency transactions into theappropriate functional currency, which were included in determining net earnings, totaled $0.1 million, $0.9 million,and $(0.5) million for the years ended May 29, 2004, May 31, 2003, and June 1, 2002, respectively.
Cash EquivalentsThe company holds cash equivalents as part of its cash management function. Cash equivalents include money marketfunds, time deposit investments, and treasury bills with original maturities of less than three months at the time of purchase. The carrying value of cash equivalents, which approximates fair value, totaled $131.9 million and $141.5million as of May 29, 2004, and May 31, 2003, respectively. All cash and cash equivalents are high-credit qualityfinancial instruments, and the amount of credit exposure to any one financial institution or instrument is limited.
Short-Term InvestmentsThe company maintains a portfolio of short-term investments comprised of investment grade fixed-income and equitysecurities. These investments are held at the company’s wholly owned insurance captive and are considered“available-for-sale” as defined in Statement of Financial Accounting Standards No. 115, “Accounting for CertainInvestments in Debt and Equity Securities.” Accordingly, they have been recorded at fair market value based on quotedmarket prices, with the resulting net unrealized holding gains or losses reflected as a component of comprehensiveincome/(loss) in the Consolidated Statements of Shareholders’ Equity. Net investment income recognized in theConsolidated Statements of Operations resulting from these investments totaled $0.5 million, $0.9 million, and $0.9million for the years ended May 29, 2004, May 31, 2003, and June 1, 2002, respectively.
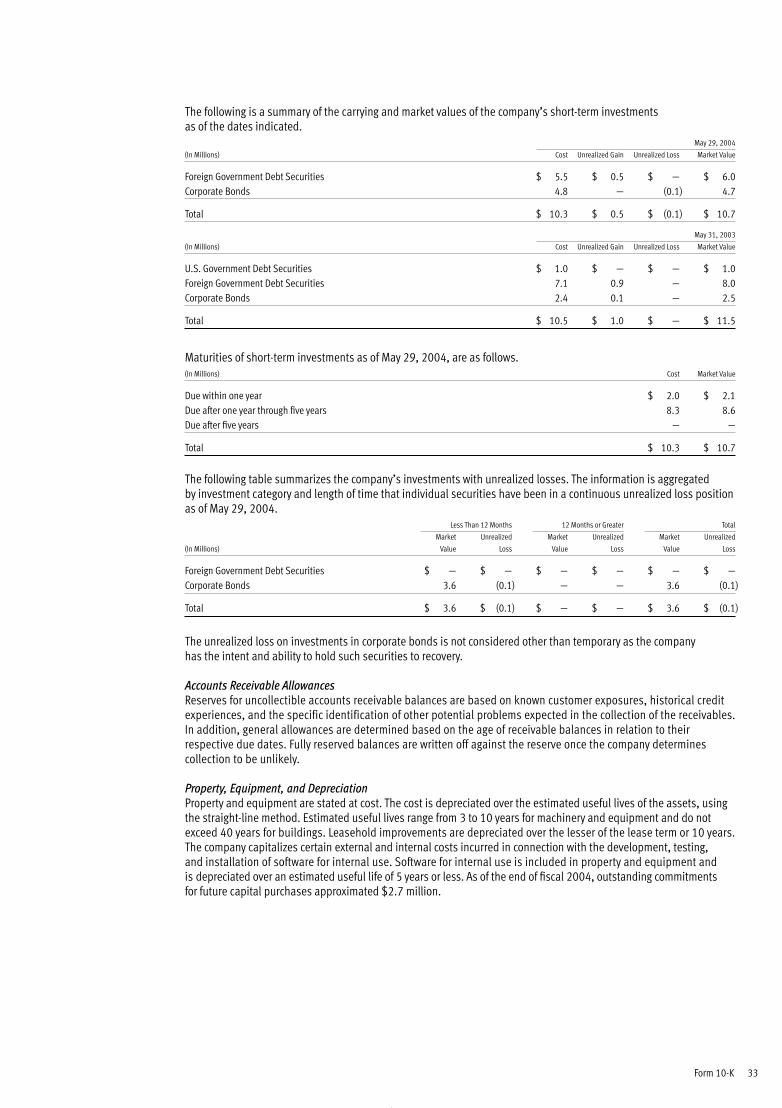
Form 10-K 33
The following is a summary of the carrying and market values of the company’s short-term investmentsas of the dates indicated.
May 29, 2004
(In Millions) Cost Unrealized Gain Unrealized Loss Market Value
Foreign Government Debt Securities $ 5.5 $ 0.5 $ — $ 6.0 Corporate Bonds 4.8 — (0.1) 4.7
Total $ 10.3 $ 0.5 $ (0.1) $ 10.7
May 31, 2003
(In Millions) Cost Unrealized Gain Unrealized Loss Market Value
U.S. Government Debt Securities $ 1.0 $ — $ — $ 1.0Foreign Government Debt Securities 7.1 0.9 — 8.0 Corporate Bonds 2.4 0.1 — 2.5
Total $ 10.5 $ 1.0 $ — $ 11.5
Maturities of short-term investments as of May 29, 2004, are as follows.(In Millions) Cost Market Value
Due within one year $ 2.0 $ 2.1Due after one year through five years 8.3 8.6Due after five years — —
Total $ 10.3 $ 10.7
The following table summarizes the company’s investments with unrealized losses. The information is aggregated by investment category and length of time that individual securities have been in a continuous unrealized loss positionas of May 29, 2004.
Less Than 12 Months 12 Months or Greater Total
Market Unrealized Market Unrealized Market Unrealized
(In Millions) Value Loss Value Loss Value Loss
Foreign Government Debt Securities $ — $ — $ — $ — $ — $ —Corporate Bonds 3.6 (0.1) — — 3.6 (0.1)
Total $ 3.6 $ (0.1) $ — $ — $ 3.6 $ (0.1)
The unrealized loss on investments in corporate bonds is not considered other than temporary as the companyhas the intent and ability to hold such securities to recovery.
Accounts Receivable AllowancesReserves for uncollectible accounts receivable balances are based on known customer exposures, historical creditexperiences, and the specific identification of other potential problems expected in the collection of the receivables. In addition, general allowances are determined based on the age of receivable balances in relation to theirrespective due dates. Fully reserved balances are written off against the reserve once the company determinescollection to be unlikely.
Property, Equipment, and DepreciationProperty and equipment are stated at cost. The cost is depreciated over the estimated useful lives of the assets, usingthe straight-line method. Estimated useful lives range from 3 to 10 years for machinery and equipment and do notexceed 40 years for buildings. Leasehold improvements are depreciated over the lesser of the lease term or 10 years.The company capitalizes certain external and internal costs incurred in connection with the development, testing, and installation of software for internal use. Software for internal use is included in property and equipment and is depreciated over an estimated useful life of 5 years or less. As of the end of fiscal 2004, outstanding commitmentsfor future capital purchases approximated $2.7 million.
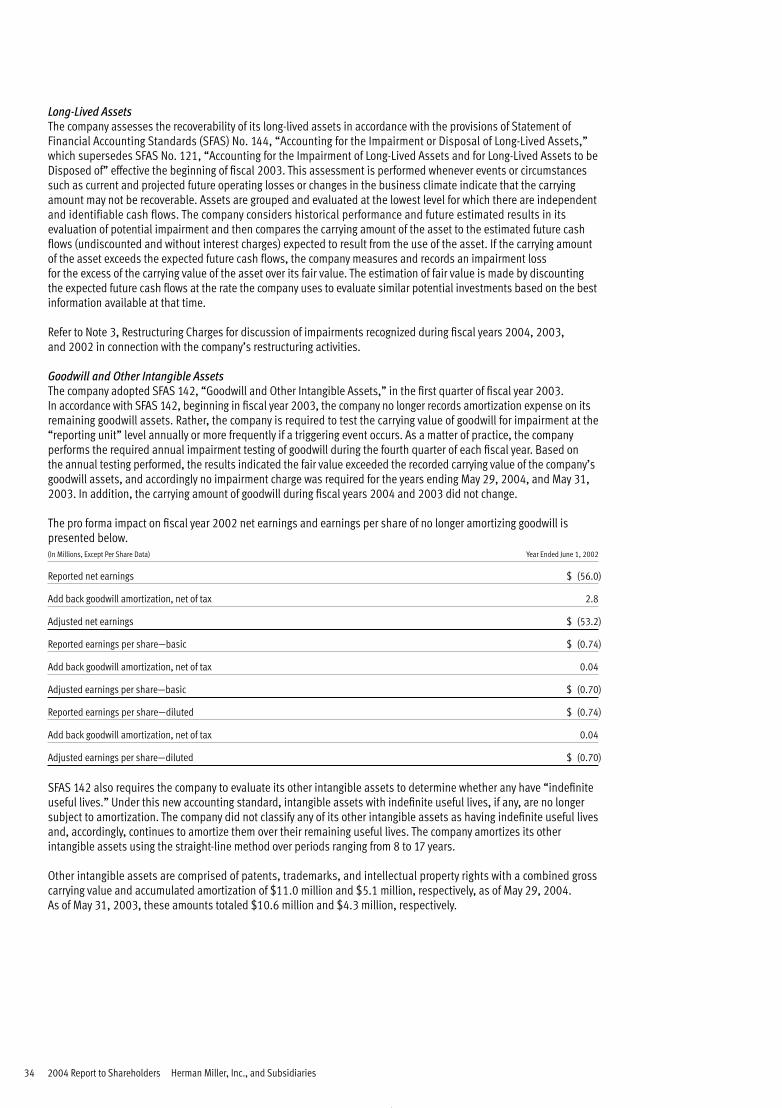
34 2004 Report to Shareholders Herman Miller, Inc., and Subsidiaries
Long-Lived AssetsThe company assesses the recoverability of its long-lived assets in accordance with the provisions of Statement ofFinancial Accounting Standards (SFAS) No. 144, “Accounting for the Impairment or Disposal of Long-Lived Assets,”which supersedes SFAS No. 121, “Accounting for the Impairment of Long-Lived Assets and for Long-Lived Assets to beDisposed of” effective the beginning of fiscal 2003. This assessment is performed whenever events or circumstancessuch as current and projected future operating losses or changes in the business climate indicate that the carryingamount may not be recoverable. Assets are grouped and evaluated at the lowest level for which there are independentand identifiable cash flows. The company considers historical performance and future estimated results in itsevaluation of potential impairment and then compares the carrying amount of the asset to the estimated future cashflows (undiscounted and without interest charges) expected to result from the use of the asset. If the carrying amountof the asset exceeds the expected future cash flows, the company measures and records an impairment lossfor the excess of the carrying value of the asset over its fair value. The estimation of fair value is made by discountingthe expected future cash flows at the rate the company uses to evaluate similar potential investments based on the bestinformation available at that time.
Refer to Note 3, Restructuring Charges for discussion of impairments recognized during fiscal years 2004, 2003, and 2002 in connection with the company’s restructuring activities.
Goodwill and Other Intangible AssetsThe company adopted SFAS 142, “Goodwill and Other Intangible Assets,” in the first quarter of fiscal year 2003. In accordance with SFAS 142, beginning in fiscal year 2003, the company no longer records amortization expense on itsremaining goodwill assets. Rather, the company is required to test the carrying value of goodwill for impairment at the“reporting unit” level annually or more frequently if a triggering event occurs. As a matter of practice, the companyperforms the required annual impairment testing of goodwill during the fourth quarter of each fiscal year. Based on the annual testing performed, the results indicated the fair value exceeded the recorded carrying value of the company’sgoodwill assets, and accordingly no impairment charge was required for the years ending May 29, 2004, and May 31,2003. In addition, the carrying amount of goodwill during fiscal years 2004 and 2003 did not change.
The pro forma impact on fiscal year 2002 net earnings and earnings per share of no longer amortizing goodwill ispresented below.(In Millions, Except Per Share Data) Year Ended June 1, 2002
Reported net earnings $ (56.0)
Add back goodwill amortization, net of tax 2.8
Adjusted net earnings $ (53.2)
Reported earnings per share—basic $ (0.74)
Add back goodwill amortization, net of tax 0.04
Adjusted earnings per share—basic $ (0.70)
Reported earnings per share—diluted $ (0.74)
Add back goodwill amortization, net of tax 0.04
Adjusted earnings per share—diluted $ (0.70)
SFAS 142 also requires the company to evaluate its other intangible assets to determine whether any have “indefiniteuseful lives.” Under this new accounting standard, intangible assets with indefinite useful lives, if any, are no longersubject to amortization. The company did not classify any of its other intangible assets as having indefinite useful livesand, accordingly, continues to amortize them over their remaining useful lives. The company amortizes its otherintangible assets using the straight-line method over periods ranging from 8 to 17 years.
Other intangible assets are comprised of patents, trademarks, and intellectual property rights with a combined grosscarrying value and accumulated amortization of $11.0 million and $5.1 million, respectively, as of May 29, 2004. As of May 31, 2003, these amounts totaled $10.6 million and $4.3 million, respectively.
Form 10-K 35
Estimated amortization expense for intangible assets as of May 29, 2004, for each of the succeeding five fiscal yearsis as follows.(In Millions)
2005 $ 0.92006 0.92007 0.92008 0.92009 0.9
Notes ReceivableThe notes receivable are primarily from certain independent contract office furniture dealers. These notes are the resultof dealers in transition either through a change in ownership or general financial difficulty. The notes are collateralizedby the assets of the dealers and bear interest based on the prevailing prime rate. Recorded reserves are based on historical credit experience, collateralization levels, and the specific identification of other potential collectionproblems. Interest income relating to these notes was $0.5 million, $0.7 million, and $0.8 million in 2004, 2003, and 2002, respectively.
Unfunded ChecksAs a result of maintaining a consolidated cash management system, the company utilizes controlled disbursementbank accounts. These accounts are funded as checks are presented for payment, not when checks are issued. Any resulting book overdraft position is included in current liabilities as unfunded checks.
Self-InsuranceThe company is partially self-insured for general liability, workers’ compensation, and certain employee health benefitsunder insurance arrangements that provide for third-party coverage of claims exceeding the company’s loss retentionlevels. The company’s retention levels designated within significant insurance arrangements as of May 29, 2004, are as follows:
Retention Levels
General Liability and Auto Liability/Physical Damage $1.00 million per occurrenceWorkers’ Compensation and Property $0.75 million per occurrenceHealth Benefits Varies by plan(1)
(1) The majority of health benefits are provided under plans with retention levels ranging between $0.15 million per person to $0.20 million per employee.
The general and workers’ compensation liabilities are managed through a wholly owned insurance captive; the relatedliabilities are included in the accompanying consolidated financial statements. The company’s policy is to accrueamounts equal to the actuarially determined liabilities. The actuarial valuations are based on historical informationalong with certain assumptions about future events. The company also accrues an estimated liability for healthbenefits in the accompanying consolidated financial statements based on historical claims information along withcertain assumptions about future trends. Changes in assumptions for such matters as legal actions, medical costs, and changes in actual experience could cause these estimates to change in the near term.
Research, Development, Advertising, and Other Related CostsResearch, development, advertising materials, pre-production and start-up costs are expensed as incurred.Research and development (R&D) costs consist of expenditures incurred during the course of planned search andinvestigation aimed at discovery of new knowledge useful in developing new products or processes. R&D costsalso include the significant enhancement of existing products or production processes, and the implementation of such through design, testing of product alternatives, or construction of prototypes. Royalty payments made todesigners of the company’s products as the products are sold are not included in research and development costs,as they are a variable cost based on product sales. Research and development costs, included in design andresearch expense in the accompanying Consolidated Statements of Operations, were $34.6 million, $33.3 million,and $33.9 million in 2004, 2003, and 2002, respectively. Advertising costs, included in selling, general, andadministrative expense in the accompanying Consolidated Statements of Operations, were $1.9 million, $0.8million, and $2.1 million in 2004, 2003, and 2002, respectively.

36 2004 Report to Shareholders Herman Miller, Inc., and Subsidiaries
Income TaxesDeferred tax assets and liabilities are recognized for the expected future tax consequences attributable to differencesbetween the financial statement carrying amounts of existing assets and liabilities, and their respective tax bases.Deferred tax assets and liabilities are measured using the enacted tax rates expected to apply to taxable income in theyears in which those temporary differences are expected to reverse.
Stock-Based CompensationAt May 29, 2004, the company had several stock-based compensation plans, which are described fully in Notes 14 and 15, Stock Plans and Key Executive and Director Stock Programs. The company accounts for its stock-basedcompensation plans under the recognition and measurement principles of Accounting Principles Board Opinion No. 25, “Accounting for Stock Issued to Employees,” and related Interpretations. Under this method, which continuesto be acceptable under Statement of Financial Accounting Standards (SFAS) No. 148, “Accounting for Stock-BasedCompensation—Transition and Disclosure—An Amendment of FASB Statement No. 123,” (SFAS 148), no compensationexpense is recognized when stock options are granted to employees and directors at fair market value as of the grant date.
The following table illustrates the effect on fiscal year net earnings and earnings per share if the company had appliedthe fair value recognition provisions of SFAS No. 123, “Accounting for Stock-Based Compensation,” (SFAS 123) to stock-based employee compensation during the periods indicated with the Black-Scholes pricing model used for valuation of stock options.(In Millions, Except Per Share Data) 2004 2003 2002
Net earnings, as reported $ 42.3 $ 23.3 $ (56.0)Less: Incremental stock-based employee compensation expense determined under fair value based method for all awards, net of related tax effects (11.4) (11.1) (7.2)
Pro forma net earnings $ 30.9 $ 12.2 $ (63.2)
Total stock-based employee compensation expense included in net earnings, as reported, net of related tax effects $ 0.9 $ 1.0 $ 0.9Earnings per share:
Basic, as reported $ 0.58 $ 0.31 $ (0.74)Basic, pro forma $ 0.43 $ 0.16 $ (0.83)Diluted, as reported $ 0.58 $ 0.31 $ (0.74)Diluted, pro forma $ 0.42 $ 0.16 $ (0.83)
Earnings per ShareBasic earnings per share (EPS) excludes the dilutive effect of common shares that could potentially be issued, due to the exercise of stock options or the vesting of restricted shares, and is computed by dividing net earnings bythe weighted-average number of common shares outstanding for the period. Diluted EPS for fiscal years 2004 and2003 was computed by dividing net earnings by the sum of the weighted-average number of shares outstanding, plusall dilutive shares that could potentially be issued. As the company reported a net loss for the year ended June 1, 2002,shares resulting from stock option plans would be anti-dilutive to EPS and, consequently, have not been included in determining diluted EPS.
Revenue RecognitionThe company recognizes revenue on sales through its network of independent contract furniture dealers and independentretailers once the related product is shipped and title passes to the dealer. Sales made through its subsidiary dealershipsare recognized when delivery of the product and related services is made to the end customer. In situations whereproducts are sold directly to the end customer, outside of the company’s independent and owned dealer network, revenueis recognized once the related product is shipped and installation is substantially complete. Offers such as rebates anddiscounts are recorded as reductions to net sales. Unearned revenue arises as a normal part of business from advancepayments from customers for future delivery of product and service.
Shipping and Handling ExpensesThe company records shipping and handling related expenses under the caption “Cost of Sales” in the ConsolidatedStatements of Operations.
Form 10-K 37
Comprehensive Income/(Loss)The company’s comprehensive income/(loss) consists of net earnings, foreign currency translation adjustments,minimum pension liability, and unrealized holding gains/(losses) on available-for-sale investments. The componentsof “Accumulated Other Comprehensive Loss” in each of the last three fiscal years are as follows.
Total
Unrealized Accumulated
Foreign Currency Minimum Holding Other
Translation Pension Liability Period Comprehensive
(In Millions) Adjustments (Net of tax) Gains/(Losses) Income/(Loss)
Balance, June 2, 2001 $ (17.4) $ — $ — $ (17.4)
Other comprehensive gain/(loss) in fiscal 2002 (1.6) (16.2) 0.9 (16.9)
Balance, June 1, 2002 (19.0) (16.2) 0.9 (34.3)
Other comprehensive gain/(loss) in fiscal 2003 7.7 (36.1) 0.1 (28.3)
Balance, May 31, 2003 (11.3) (52.3) 1.0 (62.6)
Other comprehensive gain/(loss) in fiscal 2004 3.4 2.2 (0.6) 5.0
Balance, May 29, 2004 $ (7.9) $ (50.1) $ 0.4 $ (57.6)
Use of Estimates in the Preparation of Financial StatementsThe preparation of financial statements in conformity with accounting principles generally accepted in the UnitedStates requires management to make estimates and assumptions that affect the reported amounts of assets andliabilities and disclosure of contingent assets and liabilities at the date of the financial statements and the reportedamounts of revenues and expenses during the reporting period. Actual results could differ from those estimates.
Change in Accounting EstimateFiscal 2002 operating expenses included $15.6 million of accelerated depreciation related to certain sales technologyassets. This charge reduced earnings per share by $0.13 in 2002. At the time the company decided to replace theseassets, they had an estimated remaining useful life of approximately eighteen months. These assets were completelydepreciated by June 1, 2002, at which time the replacement assets were placed in service. This change in service lifeconstituted a change in accounting estimate under Accounting Principles Board Opinion No. 20, “Accounting Changes.”
Fiscal 2004 operating expenses included a $5.2 million pretax credit related to the reversal of an accrued legalliability. Refer to Note 20, Guarantees, Indemnifications, and Contingencies, for further discussion regarding this legal contingency.
Change in Accounting PrincipleAt the beginning of fiscal 2004, the company converted a portion of its remaining FIFO-based domestic inventoriesto the LIFO method for inventory valuation purposes. Due to the facility rationalization and consolidation resultingfrom the company’s restructuring activities in recent years, the company determined it was more appropriate to account for this inventory using the LIFO method. There was no cumulative effect of this change in accountingprinciple and the impact on the company’s fiscal 2004 consolidated financial statements was not material.
In addition, as noted below under New Accounting Standards, the company adopted FIN 46(R), which wasrecognized as a cumulative effect of a change in accounting principle as of May 29, 2004. Refer to Note 4,Variable Interest Entities, for further discussion.
New Accounting StandardsIn May 2003, the Emerging Issues Task Force issued its consensus on Issue No. 03-04, “Determining the Classificationand Benefit Attribution Method for a ’Cash Balance’ Pension Plan” (EITF 03-04). In this consensus, the Task Forceconcluded that the actuarially determined pension expense for cash balance plans be determined using the traditionalunit credit method of accounting. The company adopted the provisions of EITF 03-04 effective at the beginning of thefirst quarter of fiscal 2004. The adoption of EITF 03-04 did not have a material impact on the company’s consolidatedfinancial statements.
38 2004 Report to Shareholders Herman Miller, Inc., and Subsidiaries
In May 2003, the FASB issued SFAS No. 150, “Accounting for Certain Financial Instruments with Characteristicsof Both Liabilities and Equity” (SFAS 150). SFAS 150 modified the traditional definition of “liabilities” to encompasscertain obligations that must be settled through the issuance of equity shares. These obligations are consideredliabilities as opposed to equity or mezzanine financing under the provisions of SFAS 150. In addition, SFAS 150increased the required disclosures of alternate settlement methods related to these obligations. This new standardwas effective immediately for financial instruments entered into or modified after May 31, 2003, and for all otherfinancial instruments beginning in the second quarter of fiscal 2004. The adoption of SFAS 150 did not have an impacton the company’s consolidated financial statements.
In May 2003, the Emerging Issues Task Force issued its consensus on Issue No. 00-21, “Revenue Arrangements withMultiple Deliverables” (EITF 00-21). In this consensus, the Task Force addressed certain aspects of the accounting by a vendor for arrangements under which it will perform multiple revenue-generating activities. The company adoptedthe provisions of EITF 00-21 effective at the beginning of the second quarter of fiscal 2004. The adoption of EITF 00-21did not have a material impact on the company’s consolidated financial statements.
In December 2003, the FASB issued a revision to Interpretation No. 46, “Consolidation of Variable Interest Entities”(FIN 46(R)). This rule requires that companies consolidate a variable interest entity if the company is deemed theprimary beneficiary subject to a majority of the risk of loss from the variable interest entity’s activities, or is entitled to receive a majority of the entity’s residual returns, or both. The company has no special purpose entities, as defined,nor has it acquired a variable interest in an entity where the company is the primary beneficiary since January 31,2003. The provisions of FIN 46(R) are required to be applied as of the end of the first reporting period that ends afterMarch 15, 2004, for the variable interest entities in which the company holds a variable interest that it acquired on orbefore January 31, 2003. The company adopted FIN 46(R) at end of the fourth quarter of fiscal 2004. Refer to Note 4,Variable Interest Entities, for further discussion.
In December 2003, the FASB issued SFAS No. 132 revised 2003, “Employers’ Disclosures about Pensions and OtherPost-Retirement Benefits” (SFAS 132(R)). This standard increases the existing disclosure requirements by requiringmore details about pension plan assets, benefit obligations, cash flows, benefit costs and related information.Companies will be required to segregate plan assets by category, such as debt, equity and real estate, and to providecertain expected rates of return and other informational disclosures. SFAS 132(R) also requires companies to disclosevarious elements of pension and post-retirement benefit costs in interim-period financial statements for quartersbeginning after December 15, 2003. The company adopted the additional annual disclosure provisions of SFAS132(R) in the fourth quarter of fiscal 2004. Refer to Note 12, Employee Benefit Plans, for further disclosures regardingpension and other post-retirement benefits.
In March 2004, the Emerging Issues Task Force issued a consensus on Issue No. 03-01, “The Meaning of Other-Than-Temporary Impairment and Its Application to Certain Investments” (EITF 03-01). In this consensus, the Task Forcerequired certain quantitative and qualitative disclosures related to debt and marketable equity securities classified as available-for-sale or held-to-maturity under SFAS 115 that are in an unrealized loss position at the balance sheet datebut for which an other-than-temporary impairment has not been recognized. In addition, the Task Force developed abasic model in evaluating whether investments within the scope of EITF 03-01 have other-than-temporary impairment.The company adopted provisions of EITF 03-01 in the fourth quarter of fiscal 2004. Adoption of EITF 03-01 did nothave a material impact on the company’s consolidated financial statements. Refer to Note 1, Significant Accountingand Reporting Policies, for further disclosures regarding short-term investments.
In May 2004, the FASB issued Staff Position No. 106-2, “Accounting and Disclosure Requirements Related to theMedicare Prescription Drug, Improvement and Modernization Act of 2003” (FSP 106-2), in response to the Act signedinto law on December 8, 2003. The Act introduced a prescription drug benefit under Medicare (Medicare Part D) as well as a federal subsidy to sponsors of retiree healthcare plans that provide a benefit that is at least actuariallyequivalent to Medicare Part D. The provisions of FSP 106-2 provide guidance on the accounting treatment and requireddisclosures relating to the effects of the Act. This guidance supersedes FASB Staff Position No. 106-1, “Accounting andDisclosure Requirements Related to the Medicare Prescription Drug, Improvement and Modernization Act of 2003”(FSP 106-1). Currently, specific regulatory guidance does not exist regarding how to determine whether a plan isconsidered actuarially equivalent, a key criterion under FSP 106-2. Accordingly, the company is currently in the processof evaluating existing plan benefits to determine actuarial equivalency and the corresponding impact of the FSP on thefinancial statements. The company expects to adopt the provisions of FSP 106-2 in the second quarter of fiscal 2005.
ReclassificationsCertain prior year information has been reclassified to conform to the current year presentation.
Form 10-K 39
2 Acquisitions and Divestitures
During the first quarter of fiscal 2004, the company acquired for $0.2 million an additional ownership interest in OP Spectrum LLP, a contract furniture dealership based in Philadelphia, Pennsylvania. As a result of this transaction,which increased the company’s ownership interest from 50 percent to 90 percent, the dealership’s balance sheetand results of operations were consolidated in the company’s fiscal 2004 financial statements since the date ofacquisition. Prior to the transaction, the company’s investment in this dealership was accounted for under the equitymethod, with the company’s proportionate share of resulting earnings reported as a component of other income/expense. Consolidation of this dealership increased net sales and net earnings for the year ended May 29, 2004, by approximately $12.3 million and $0.4 million, respectively.
During the past three years, the company purchased and/or divested other various privately owned domesticand international dealers. The results of these transactions were not material, either individually or in the aggregate,to the company’s consolidated financial statements.
3 Restructuring Charges
The following discussion provides a summary of the restructuring actions taken by the company during fiscal years2002, 2003, and 2004. These actions are referred to collectively as the “Plan.”
Fiscal 2002During the first quarter of fiscal 2002, the company recorded a $9.6 million pretax charge to operations, primarilyrelated to work force reductions. This charge represented costs associated with an early-retirement offer and non-voluntary termination benefits for targeted work force reductions in West Michigan, Europe, Mexico, and SouthAmerica. Approximately 274 positions were eliminated as a result of these combined actions, which affected a widerange of job classifications across the company.
In the second quarter of fiscal 2002, the company’s Board of Directors approved a comprehensive operational and coststructure realignment and restructuring plan intended to improve operating performance, ensure financial strength,and position the company as a more focused competitor. This plan involved the key action items described below.
• Additional non-voluntary termination benefits for targeted work force reductions in both the U.S. and international operations.
• Consolidation of the Rocklin, California, SCR operation into the West Michigan GreenHouse facility and sale of the Rocklin facility.
• Consolidation of three leased facilities in West Michigan into other existing West Michigan facilities.• Outsourcing of certain dedicated production processes in connection with the company’s paint operations.• Outsourcing of the over-the-road transportation fleet.
In connection with the Plan, the company recorded additional pretax restructuring charges of $38.8 million and $9.8million for the quarters ended December 1, 2001, and March 2, 2002, respectively.
In the fourth quarter of fiscal 2002, the company’s Board of Directors amended the Plan by approving the followingadditional restructuring actions.
• Consolidation of the Holland, Michigan, Chair Plant into the West Michigan GreenHouse facility. This action includedpreparing the Chair Plant for sale.
• Closure and elimination of the Herman Miller RED initiative.• Phase-out of the SQA brand and separate distribution channel.• Consolidation of two manufacturing facilities into one within the Geiger operation in Georgia.
In connection with these actions, the company recorded pretax restructuring charges of $23.4 million during the fourthquarter of fiscal 2002.
40 2004 Report to Shareholders Herman Miller, Inc., and Subsidiaries
Fiscal 2003During the fourth quarter, the company amended the Plan to include additional work force reductions of approximately150 employees as well as the consolidation of the Holland, Michigan, Formcoat operation into existing space locatedin Zeeland, Michigan.
The Plan was further amended subsequent to the end of fiscal 2003 with the company’s announcement of a plannedfacility consolidation involving its Canton, Georgia, operation. This action includes the relocation of the Cantonoperation to the company’s existing Spring Lake, Michigan, campus.
Of the $16.4 million total fiscal 2003 pretax restructuring charges, $15.9 million was recognized in the fourth quarter.Fixed asset impairments related to the Canton, Georgia, and Formcoat consolidation projects totaled $13.5 million. The company recorded charges totaling $3.6 million related to the work force reduction announced in the fourthquarter. Accrual adjustments totaling $1.2 million reduced fourth quarter restructuring expenses and were primarilyrelated to the final sale of the Rocklin, California, facility.
The remaining fiscal 2003 charges totaled approximately $0.5 million and related principally to changes in assumptionsaround carrying costs and sub-lease timing for previously exited facilities. Also included in this remaining charge werecredits recognized in the first quarter of fiscal 2003 related to the re-deployment of certain fixed assets in the company’songoing manufacturing operation. These assets were previously impaired in fiscal 2002 in connection with the Plan.
Fiscal 2004The company completed substantially all of its remaining restructuring initiatives during fiscal year 2004. The sale of the Chair Plant was completed in the second quarter and the Canton consolidation was completed by the end of the third quarter. Finally, the consolidation of the Formcoat operation was completed and the related facility leasewas terminated in the second quarter of fiscal 2004.
Restructuring expenses in fiscal 2004 relating to the Canton and Formcoat moves totaled approximately $10.6 million.Pension-related expenses of approximately $0.7 million were recognized associated with the workforce reductionannounced late in fiscal 2003. The Chair Plant sale resulted in the recognition of a $0.8 million gain, which was treatedas a reduction of restructuring expenses. The remaining net credit for the year related to adjustments of the expectedsub-lease timing for facilities previously exited as part of the Plan.
The following table presents the pretax restructuring charges, by category, recorded pursuant to the Plan.(In Millions) 2004 2003 2002
Severance and Outplacement $ 6.1 $ 4.0 $ 30.5Asset Impairments (0.8) 11.4 28.0Pension Related 0.2 (0.4) 8.1Lease and Supplier Contract Terminations 1.1 0.3 6.1Facility Exit Costs and Other 3.7 1.1 8.9
Total $ 10.3 $ 16.4 $ 81.6
Including actions taken since the beginning of fiscal 2002, approximately 2,100 employees, across a wide range of job classifications, have been terminated as a result of the Plan. This includes approximately 300 employees fromthe company’s international operations.
Asset impairment charges recorded in connection with the Plan during fiscal years 2004, 2003, and 2002 wereaccounted for in accordance with SFAS No. 144 and SFAS No. 121, as appropriate. These impairments consisted of long-lived assets, including real estate, fixed assets and manufacturing equipment from the facilities thecompany intends to dispose of or discontinue. The assets were written-down to the lower of their carrying amountsor estimated fair values, less the cost to dispose. Fair value estimates were determined by the company’smanagement, with the assistance of independent appraisers, and were based on estimated proceeds from sale and other relevant factors. These asset impairments resulted as a consequence of the Plan.
During the second quarter of fiscal 2004, the company successfully completed the sale of its Chair Plant which resultedin net sale proceeds of approximately $6.0 million. The carrying value of this facility had been previously written down to its estimated fair value of $5.2 million.
Form 10-K 41
The company’s Canton, Georgia, facility remains listed for sale. As a consequence of the Plan, this facilitywas previously written down to its expected fair value of $8.2 million. This carrying value remains classified under thecaption “Net property and equipment” on the company’s condensed consolidated balance sheet as of May 29, 2004.
During fiscal 2003, the company completed the sale of its Rocklin, California, and Spring Lake, Michigan, Powder CoatTechnology (PCT) facilities. These facilities, which were exited during fiscal 2002, generated total proceedsof $20.2 million.
Restructuring charges also include certain estimated qualifying exit costs. Those costs related to the restructuringactions announced during fiscal years 2003 and 2004 were recorded in accordance with SFAS 146. Expensesresulting from actions announced during fiscal year 2002 were recorded in accordance with Emerging Issues TaskForce Issue No. 94-3, “Liability Recognition for Certain Employee Termination Benefits and Other Costs to Exit anActivity (including Certain Costs Incurred in a Restructuring).” For all periods presented, these costs include lease and supplier contract terminations and certain facility exit costs.
The following summarizes the restructuring accrual activity since the beginning of the Plan. This summary does notinclude restructuring activity related to the impairment of fixed assets or the effect on the company’s employeeretirement plans since these items are not accounted for through the restructuring accrual on the Consolidated BalanceSheet but are included as a component of “Restructuring Expenses” on the Consolidated Statement of Operations. In addition, facility costs associated with the movement of inventory and equipment, as well as employee relocationand training related to the consolidation of production processes, are recognized as incurred and are not included in the ending restructuring accrual balance.
Lease and
Severance and Supplier Facility
Outplacement Contract Exit Costs
(In Millions) Costs Terminations and Other Total
Accrual Balance, June 2, 2001 $ — $ — $ — $ —Restructuring Charges 30.5 6.1 8.9 45.5Cash Payments (24.5) (2.6) (4.2) (31.3)
Accrual Balance, June 1, 2002 $ 6.0 $ 3.5 $ 4.7 $ 14.2
Restructuring Charges 4.0 0.3 1.1 5.4Cash Payments (8.1) (2.5) (3.8) (14.4)
Accrual Balance, May 31, 2003 $ 1.9 $ 1.3 $ 2.0 $ 5.2
Restructuring Charges 6.4 1.3 4.0 11.7Adjustments (0.3) (0.2) (0.3) (0.8)Cash Payments (7.0) (1.4) (4.4) (12.8)
Accrual Balance, May 29, 2004 $ 1.0 $ 1.0 $ 1.3 $ 3.3
4 Variable Interest Entities
Effective May 29, 2004, the company adopted FIN 46(R). This resulted in the consolidation of two variable interestentities (VIEs) of which the company is considered the primary beneficiary. The company’s variable interests in theseVIEs are the result of providing subordinated debt to and/or guarantees on behalf of two independent dealershipscreated prior to January 31, 2003. The consolidation of the VIEs resulted in loss of $0.5 million or $.01 per share, net of $0.4 million tax expense, recognized as a cumulative effect of a change in accounting principle as ofMay 29, 2004. As permitted under FIN 46(R), prior periods were not restated.
Due to the company’s history of providing on-going subordinated financial support to these dealerships, throughconsolidation the company absorbs all net losses of the variable interest entities in excess of the equity at thedealerships. The company recognizes all net earnings of these variable interest entities to the extent of recoupingthe company’s losses. Earnings in excess of the company’s losses are attributed to equity owners of the dealershipsand shown as minority interest on the company’s financial statements.
42 2004 Report to Shareholders Herman Miller, Inc., and Subsidiaries
The cumulative effect adjustment represents the difference between the fair value of the VIEs assets, liabilities, and minority interests recorded upon consolidation (determined as if those entities were previously consolidated)and the carrying value of the interests in the VIEs previously recorded by the company. Since the consolidation of the VIEs was performed as of May 29, 2004, there was no other significant impact to the Consolidated Statementsof Operations and the Consolidated Statements of Cash Flows other than the cumulative effect adjustment. In thefuture, the company will include the results of operations of the VIEs in its Consolidated Statement of Operations.
The impact of consolidating the VIEs on the company’s Consolidated Balance Sheet at May 29, 2004, was an increasein the company’s assets and liabilities of approximately $2.0 million and $2.6 million, respectively. The liabilities ofthe VIEs consolidated by the company do not represent additional claims on the company’s general assets; ratherthey represent claims against the specific assets of the VIEs. Likewise, the assets of the VIEs consolidated by thecompany do not represent additional assets available to satisfy claims against the company’s general assets. To offsetthe credit risk associated with the company’s variable interests in the VIEs, the company holds a security interest in the assets of the VIEs subordinate only to third-party bank interests.
5 Inventories(In Millions) May 29, 2004 May 31, 2003
Finished products $ 16.4 $ 13.5Work in process 10.5 6.7Raw materials 11.2 11.2
Total $ 38.1 $ 31.4
Inventories are valued at the lower of cost or market and include material, labor, and overhead. The inventories of themajority of domestic manufacturing subsidiaries are valued using the last-in, first-out (LIFO) method. The inventoriesof all other subsidiaries are valued using the first-in, first-out method. Inventories valued using the LIFO methodamounted to $15.4 million and $11.5 million as of May 29, 2004, and May 31, 2003, respectively. At the beginning of fiscal 2004, the company converted a portion of the remaining FIFO-based domestic inventories to the LIFO method for inventory valuation purposes. Refer to Note 1, Significant Accounting and Reporting Policies, for further discussionregarding the change in accounting principle.
If all inventories had been valued using the first-in, first-out method, inventories would have been $9.5 million and $9.3 million higher than reported at May 29, 2004, and May 31, 2003, respectively.
6 Prepaid Expenses and Other(In Millions) May 29, 2004 May 31, 2003
Current deferred income taxes $ 17.3 $ 27.3Other 32.9 32.2
Total $ 50.2 $ 59.5
7 Accrued Liabilities(In Millions) May 29, 2004 May 31, 2003
Compensation and employee benefits $ 53.3 $ 41.8Restructuring 3.3 5.2Income taxes (4.3) 17.7Other taxes 14.7 12.2Unearned revenue 16.6 13.2Warranty reserves 14.6 17.8Other 25.6 29.7
Total $ 123.8 $ 137.6
Form 10-K 43
8 Other Liabilities(In Millions) May 29, 2004 May 31, 2003
Pension benefits $ 43.2 $ 74.3Post-retirement benefits 8.5 8.7Other 38.4 36.7
Total $ 90.1 $ 119.7
9 Notes Payable(In Millions) May 29, 2004 May 31, 2003
U.S. dollar currencies $ 1.5 $ —Non-U.S. dollar currencies — —
Total $ 1.5 $ —
The company has available an unsecured revolving credit facility that provides for $200 million of borrowingsin multiple currencies and matures on April 16, 2005. Outstanding borrowings bear interest, at the option of thecompany, at rates based on the prime rate, certificates of deposit, LIBOR, or negotiated rates. Interest is payableperiodically throughout the period a borrowing is outstanding. As of May 29, 2004, the only usage against thisfacility related to outstanding standby letters of credit totaling approximately $13.8 million. At May 31, 2003, the only usage against this facility related to outstanding standby letters of credit totaling approximately $11 million.
One of the variable interest entities consolidated by the company under FIN 46(R) had outstanding notes payable of $1.5 million at May 29, 2004.
10 Long-Term Debt(In Millions) May 29, 2004 May 31, 2003
Series A senior notes, 6.37%, due March 5, 2006 $ 20.0 $ 30.0Series C senior notes, 6.52%, due March 5, 2008 12.0 15.0Debt securities, 7.125%, due March 15, 2011 175.0 175.0Other, including fair value of interest rate swap arrangements (1.3) 3.0
Subtotal 205.7 223.0Less current portion 13.0 13.6
Total $ 192.7 $ 209.4
The company previously issued $100.0 million of senior notes in a private placement to seven insurance companies, of which $32.0 million was outstanding at May 29, 2004.
Provisions of the senior notes and the unsecured senior revolving credit loan restrict, without prior consent, thecompany’s borrowings, long-term leases, and sale of certain assets. In addition, the company has agreed to maintaincertain financial performance ratios, which are based on earnings before taxes, interest expense, depreciation andamortization. At May 29, 2004, the company was in compliance with all of these restrictions and performance ratios.
On March 6, 2001, debt securities totaling $175 million, of the $300 million registered with the Securities and ExchangeCommission (SEC), were sold. These notes mature on March 15, 2011, and bear an annual interest rate of 7.125 percent,with interest payments due semi-annually. The net proceeds from the sale of these securities were used for therepayment of outstanding domestic borrowings under the company’s revolving credit facility and for general corporatepurposes. On September 13, 2002, the company cancelled the remaining $125 million associated with the shelf registration.
44 2004 Report to Shareholders Herman Miller, Inc., and Subsidiaries
Annual maturities of long-term debt for the five years subsequent to May 29, 2004, are as follows (in millions): 2005–$13.0; 2006–$13.0; 2007–$3.0; 2008–$3.0; 2009–$—; thereafter $175.0. These amounts exclude the recorded fair value of the company’s interest rate swap arrangements, which had a negative combined fair value of $1.3 millionas of May 29, 2004. Additional information regarding interest rate swaps is provided in Note 18, Financial Instrumentswith Off-Balance Sheet Risk.
11 Operating Leases
The company leases real property and equipment under agreements that expire on various dates. Certain leasescontain renewal provisions and generally require the company to pay utilities, insurance, taxes, and otheroperating expenses.
Future minimum rental payments required under operating leases that have initial or remaining noncancellable leaseterms in excess of one year as of May 29, 2004, are as follows (in millions): 2005–$21.0; 2006–$15.4; 2007–$9.9;2008–$8.0; 2009–$5.0; thereafter–$6.4.
Total rental expense charged to operations was $25.6 million, $26.9 million, and $36.2 million in 2004, 2003, and 2002, respectively. Substantially all such rental expense represented the minimum rental payments underoperating leases.
12 Employee Benefit Plans
The company maintains plans that provide retirement benefits for substantially all employees.
Pension Plans and Post-Retirement Medical and Life InsuranceThe principal domestic plan is a defined-benefit plan with benefits determined by a cash balance calculation. Benefitsunder this plan are based upon an employee’s years of service and earnings. The company provides healthcare and life insurance benefits for employees who retired from service on or before a qualifying date in 1998. Benefits underthis plan are based on the employee’s years of service and age at the date of retirement.
In addition to the domestic cash balance and the retiree healthcare and life insurance plans, one of the company’swholly owned foreign subsidiaries has a defined-benefit pension plan based upon an average final pay benefitcalculation. The plan has not been amended and is included in the following information.
The measurement date for the company’s principal domestic and international pension plans, as well as its post-retirement medical and life insurance plan, is the last day of the fiscal year.
In fiscal 2002, the company recognized an additional pretax minimum pension liability of $25.0 million primarilyas a result of unfavorable plan asset performance and the effects of an early retirement offer and other workforcereductions. During fiscal 2003, again primarily due to unfavorable plan asset performance, the pretax minimumpension liability was increased by $58.2 million. In fiscal 2004, the increase in the market value of the company’spension plan assets resulted in a reduction to this pretax minimum pension liability of $3.4 million. In each ofthese years, the company recorded the adjustment to its minimum pension liability, net of taxes, as a componentof accumulated other comprehensive loss in the Consolidated Statements of Shareholders’ Equity.
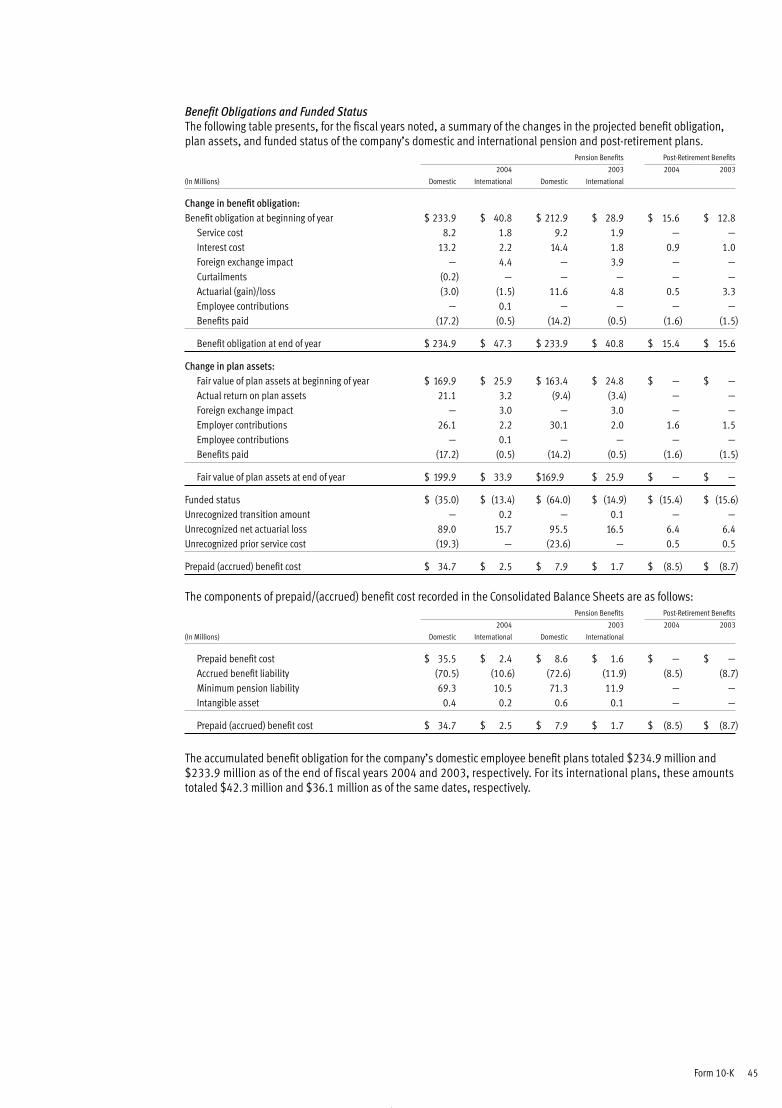
Form 10-K 45
Benefit Obligations and Funded StatusThe following table presents, for the fiscal years noted, a summary of the changes in the projected benefit obligation,plan assets, and funded status of the company’s domestic and international pension and post-retirement plans.
Pension Benefits Post-Retirement Benefits
2004 2003 2004 2003
(In Millions) Domestic International Domestic International
Change in benefit obligation:Benefit obligation at beginning of year $ 233.9 $ 40.8 $ 212.9 $ 28.9 $ 15.6 $ 12.8
Service cost 8.2 1.8 9.2 1.9 — —Interest cost 13.2 2.2 14.4 1.8 0.9 1.0Foreign exchange impact — 4.4 — 3.9 — —Curtailments (0.2) — — — — —Actuarial (gain)/loss (3.0) (1.5) 11.6 4.8 0.5 3.3Employee contributions — 0.1 — — — —Benefits paid (17.2) (0.5) (14.2) (0.5) (1.6) (1.5)
Benefit obligation at end of year $ 234.9 $ 47.3 $ 233.9 $ 40.8 $ 15.4 $ 15.6
Change in plan assets:Fair value of plan assets at beginning of year $ 169.9 $ 25.9 $ 163.4 $ 24.8 $ — $ —Actual return on plan assets 21.1 3.2 (9.4) (3.4) — —Foreign exchange impact — 3.0 — 3.0 — —Employer contributions 26.1 2.2 30.1 2.0 1.6 1.5Employee contributions — 0.1 — — — —Benefits paid (17.2) (0.5) (14.2) (0.5) (1.6) (1.5)
Fair value of plan assets at end of year $ 199.9 $ 33.9 $169.9 $ 25.9 $ — $ —
Funded status $ (35.0) $ (13.4) $ (64.0) $ (14.9) $ (15.4) $ (15.6)Unrecognized transition amount — 0.2 — 0.1 — —Unrecognized net actuarial loss 89.0 15.7 95.5 16.5 6.4 6.4Unrecognized prior service cost (19.3) — (23.6) — 0.5 0.5
Prepaid (accrued) benefit cost $ 34.7 $ 2.5 $ 7.9 $ 1.7 $ (8.5) $ (8.7)
The components of prepaid/(accrued) benefit cost recorded in the Consolidated Balance Sheets are as follows:Pension Benefits Post-Retirement Benefits
2004 2003 2004 2003
(In Millions) Domestic International Domestic International
Prepaid benefit cost $ 35.5 $ 2.4 $ 8.6 $ 1.6 $ — $ —Accrued benefit liability (70.5) (10.6) (72.6) (11.9) (8.5) (8.7)Minimum pension liability 69.3 10.5 71.3 11.9 — —Intangible asset 0.4 0.2 0.6 0.1 — —
Prepaid (accrued) benefit cost $ 34.7 $ 2.5 $ 7.9 $ 1.7 $ (8.5) $ (8.7)
The accumulated benefit obligation for the company’s domestic employee benefit plans totaled $234.9 million and$233.9 million as of the end of fiscal years 2004 and 2003, respectively. For its international plans, these amountstotaled $42.3 million and $36.1 million as of the same dates, respectively.
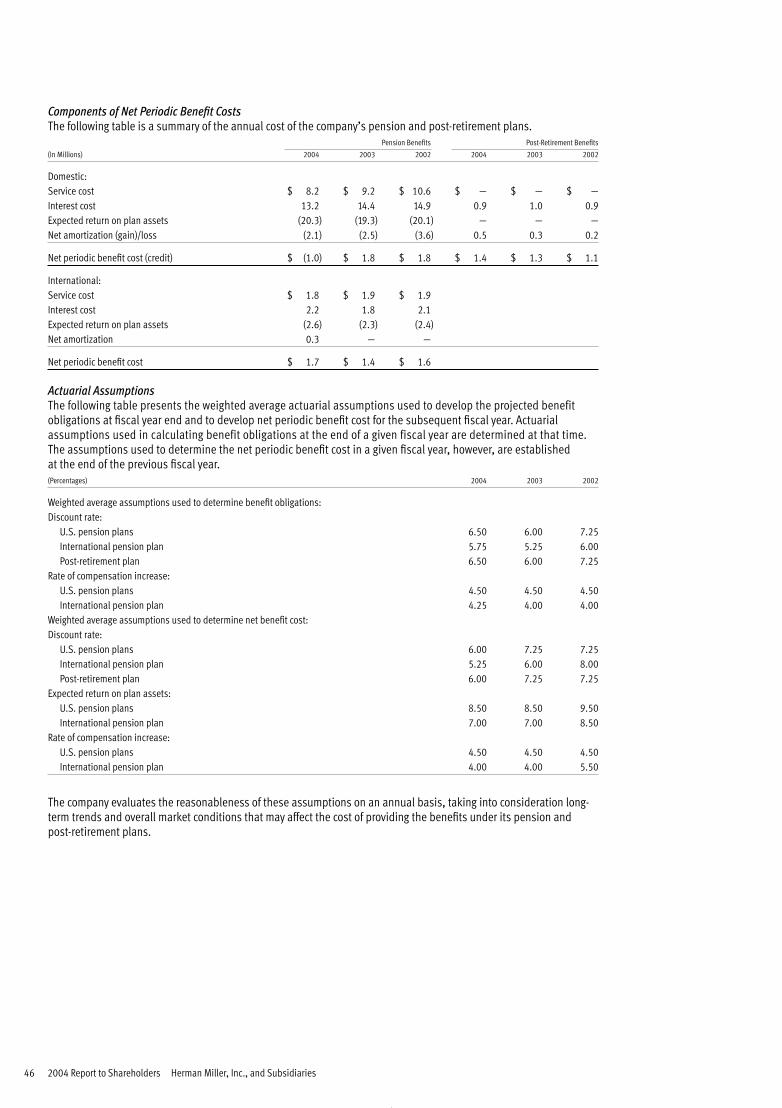
46 2004 Report to Shareholders Herman Miller, Inc., and Subsidiaries
Components of Net Periodic Benefit CostsThe following table is a summary of the annual cost of the company’s pension and post-retirement plans.
Pension Benefits Post-Retirement Benefits
(In Millions) 2004 2003 2002 2004 2003 2002
Domestic:Service cost $ 8.2 $ 9.2 $ 10.6 $ — $ — $ —Interest cost 13.2 14.4 14.9 0.9 1.0 0.9Expected return on plan assets (20.3) (19.3) (20.1) — — —Net amortization (gain)/loss (2.1) (2.5) (3.6) 0.5 0.3 0.2
Net periodic benefit cost (credit) $ (1.0) $ 1.8 $ 1.8 $ 1.4 $ 1.3 $ 1.1
International:Service cost $ 1.8 $ 1.9 $ 1.9Interest cost 2.2 1.8 2.1Expected return on plan assets (2.6) (2.3) (2.4)Net amortization 0.3 — —
Net periodic benefit cost $ 1.7 $ 1.4 $ 1.6
Actuarial AssumptionsThe following table presents the weighted average actuarial assumptions used to develop the projected benefitobligations at fiscal year end and to develop net periodic benefit cost for the subsequent fiscal year. Actuarialassumptions used in calculating benefit obligations at the end of a given fiscal year are determined at that time. The assumptions used to determine the net periodic benefit cost in a given fiscal year, however, are established at the end of the previous fiscal year. (Percentages) 2004 2003 2002
Weighted average assumptions used to determine benefit obligations:Discount rate:
U.S. pension plans 6.50 6.00 7.25International pension plan 5.75 5.25 6.00Post-retirement plan 6.50 6.00 7.25
Rate of compensation increase:U.S. pension plans 4.50 4.50 4.50International pension plan 4.25 4.00 4.00
Weighted average assumptions used to determine net benefit cost:Discount rate:
U.S. pension plans 6.00 7.25 7.25International pension plan 5.25 6.00 8.00Post-retirement plan 6.00 7.25 7.25
Expected return on plan assets:U.S. pension plans 8.50 8.50 9.50International pension plan 7.00 7.00 8.50
Rate of compensation increase:U.S. pension plans 4.50 4.50 4.50International pension plan 4.00 4.00 5.50
The company evaluates the reasonableness of these assumptions on an annual basis, taking into consideration long-term trends and overall market conditions that may affect the cost of providing the benefits under its pension andpost-retirement plans.
Form 10-K 47
The expected rate of return assumption represents the company’s long-term expectation of market returns on investedplan assets. Because this assumption is long-term in nature, it is only changed based on significant shifts in economicand financial market conditions. In developing this rate, the company considers risk factors specific to the variousclasses of investments as well as advice from independent actuaries. The overall expected long-term rate of return forthe company’s primary domestic and international pension plans is derived as the weighted average of the expectedreturns on the different asset classes, weighted by holdings. Asset allocations for the company’s primary domesticpension plan are periodically updated using asset/liability studies, and the determination of the company’s estimatesof long-term rates of return is consistent with these studies. Peer data and historical market returns are also reviewed for reasonableness.
In calculating post-retirement benefit costs and obligations, an 8.65 percent annual rate of increase in the per capitacost of covered healthcare benefits was assumed for 2004. The rate was assumed to decrease gradually to 5.5 percentby 2010 and remain at that level thereafter.
Assumed health care cost-trend rates have a significant effect on the amounts reported for retiree health care costs. A one-percentage-point change in the assumed health care cost-trend rates would have the following effects:
1 Percent 1 Percent
(In Millions) Increase Decrease
Effect on total fiscal 2004 service and interest cost components $ 0.1 $ (0.1)Effect on post-retirement benefit obligation at May 29, 2004 $ 0.9 $ (0.8)
Plan Assets and Investment StrategiesThe company’s primary domestic and international plan assets consist mainly of listed common stocks, mutualfunds, and fixed income obligations. Plan assets as of May 29, 2004, and May 31, 2003, included 644,766 shares of Herman Miller, Inc., common stock. As of May 29, 2004, the market value of Herman Miller, Inc., sharesincluded in plan assets was approximately $15.5 million. Dividends paid during fiscal 2004 on these shares totaledapproximately $0.1 million.
The company’s primary objective for invested pension plan assets is to provide for sufficient long-term growth and liquidity to satisfy all of its benefit obligations over time. Accordingly, the company has developed an investmentstrategy that it believes maximizes the probability of meeting this overall objective. This strategy includes thedevelopment of a target investment allocation by asset category in order to provide guidelines for making investmentdecisions. This target allocation emphasizes the long-term characteristics of individual asset classes as well as thediversification among multiple asset classes. In developing its strategy, the company considered the need to balance the varying risks associated with each asset class with the long-term nature of its benefit obligations. The company’sstrategy places an emphasis on the philosophy that, over the long-term, equities will outperform fixed incomeinvestments. Accordingly, the majority of plan assets are managed within various forms of equity investments.
The company utilizes independent investment managers to assist with investment decisions within the overallguidelines of the strategy.
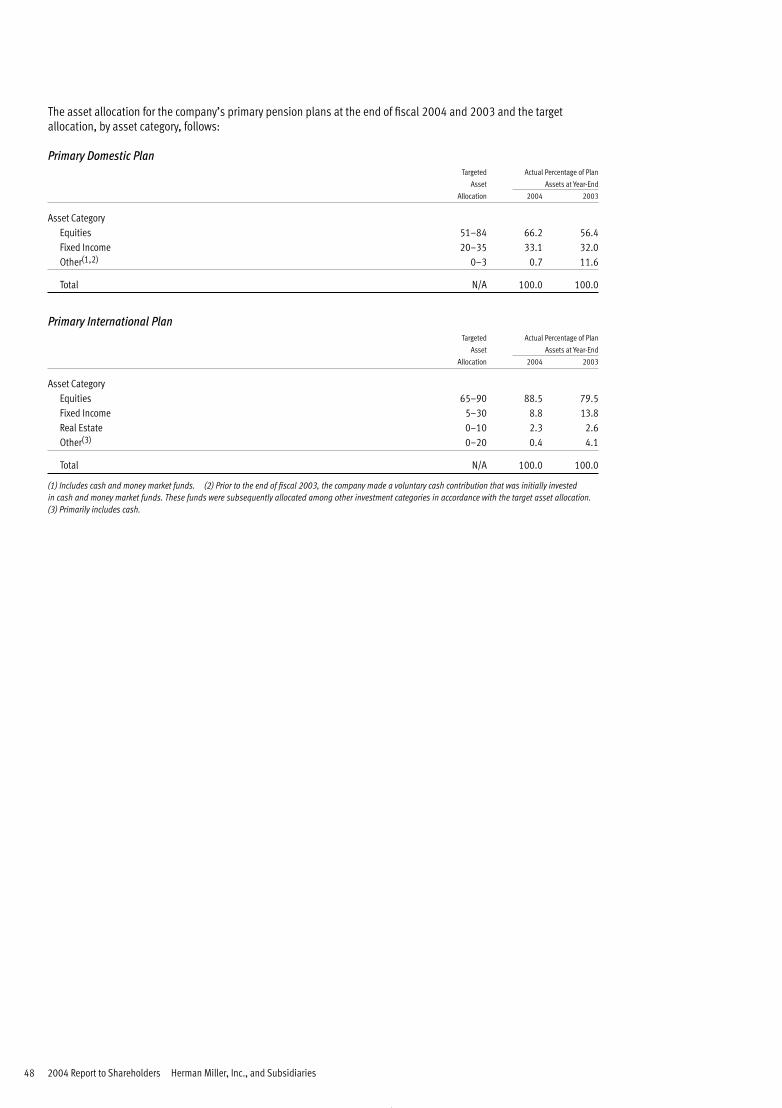
48 2004 Report to Shareholders Herman Miller, Inc., and Subsidiaries
The asset allocation for the company’s primary pension plans at the end of fiscal 2004 and 2003 and the targetallocation, by asset category, follows:
Primary Domestic PlanTargeted Actual Percentage of Plan
Asset Assets at Year-End
Allocation 2004 2003
Asset CategoryEquities 51–84 66.2 56.4Fixed Income 20–35 33.1 32.0Other(1,2) 0–3 0.7 11.6
Total N/A 100.0 100.0
Primary International PlanTargeted Actual Percentage of Plan
Asset Assets at Year-End
Allocation 2004 2003
Asset CategoryEquities 65–90 88.5 79.5Fixed Income 5–30 8.8 13.8Real Estate 0–10 2.3 2.6Other(3) 0–20 0.4 4.1
Total N/A 100.0 100.0
(1) Includes cash and money market funds. (2) Prior to the end of fiscal 2003, the company made a voluntary cash contribution that was initially invested in cash and money market funds. These funds were subsequently allocated among other investment categories in accordance with the target asset allocation.(3) Primarily includes cash.
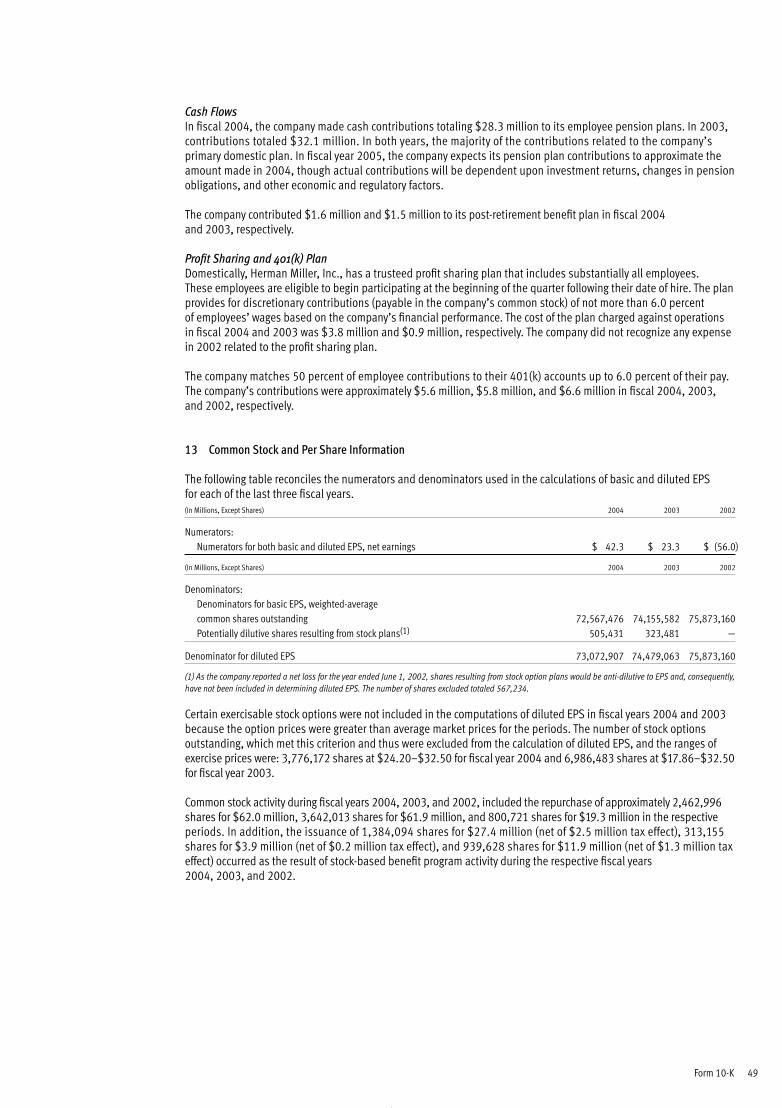
Form 10-K 49
Cash FlowsIn fiscal 2004, the company made cash contributions totaling $28.3 million to its employee pension plans. In 2003,contributions totaled $32.1 million. In both years, the majority of the contributions related to the company’sprimary domestic plan. In fiscal year 2005, the company expects its pension plan contributions to approximate theamount made in 2004, though actual contributions will be dependent upon investment returns, changes in pensionobligations, and other economic and regulatory factors.
The company contributed $1.6 million and $1.5 million to its post-retirement benefit plan in fiscal 2004 and 2003, respectively.
Profit Sharing and 401(k) PlanDomestically, Herman Miller, Inc., has a trusteed profit sharing plan that includes substantially all employees. These employees are eligible to begin participating at the beginning of the quarter following their date of hire. The planprovides for discretionary contributions (payable in the company’s common stock) of not more than 6.0 percentof employees’ wages based on the company’s financial performance. The cost of the plan charged against operationsin fiscal 2004 and 2003 was $3.8 million and $0.9 million, respectively. The company did not recognize any expense in 2002 related to the profit sharing plan.
The company matches 50 percent of employee contributions to their 401(k) accounts up to 6.0 percent of their pay. The company’s contributions were approximately $5.6 million, $5.8 million, and $6.6 million in fiscal 2004, 2003,and 2002, respectively.
13 Common Stock and Per Share Information
The following table reconciles the numerators and denominators used in the calculations of basic and diluted EPSfor each of the last three fiscal years. (In Millions, Except Shares) 2004 2003 2002
Numerators:Numerators for both basic and diluted EPS, net earnings $ 42.3 $ 23.3 $ (56.0)
(In Millions, Except Shares) 2004 2003 2002
Denominators: Denominators for basic EPS, weighted-average common shares outstanding 72,567,476 74,155,582 75,873,160Potentially dilutive shares resulting from stock plans(1) 505,431 323,481 —
Denominator for diluted EPS 73,072,907 74,479,063 75,873,160
(1) As the company reported a net loss for the year ended June 1, 2002, shares resulting from stock option plans would be anti-dilutive to EPS and, consequently,have not been included in determining diluted EPS. The number of shares excluded totaled 567,234.
Certain exercisable stock options were not included in the computations of diluted EPS in fiscal years 2004 and 2003because the option prices were greater than average market prices for the periods. The number of stock optionsoutstanding, which met this criterion and thus were excluded from the calculation of diluted EPS, and the ranges ofexercise prices were: 3,776,172 shares at $24.20–$32.50 for fiscal year 2004 and 6,986,483 shares at $17.86–$32.50for fiscal year 2003.
Common stock activity during fiscal years 2004, 2003, and 2002, included the repurchase of approximately 2,462,996shares for $62.0 million, 3,642,013 shares for $61.9 million, and 800,721 shares for $19.3 million in the respectiveperiods. In addition, the issuance of 1,384,094 shares for $27.4 million (net of $2.5 million tax effect), 313,155shares for $3.9 million (net of $0.2 million tax effect), and 939,628 shares for $11.9 million (net of $1.3 million taxeffect) occurred as the result of stock-based benefit program activity during the respective fiscal years2004, 2003, and 2002.
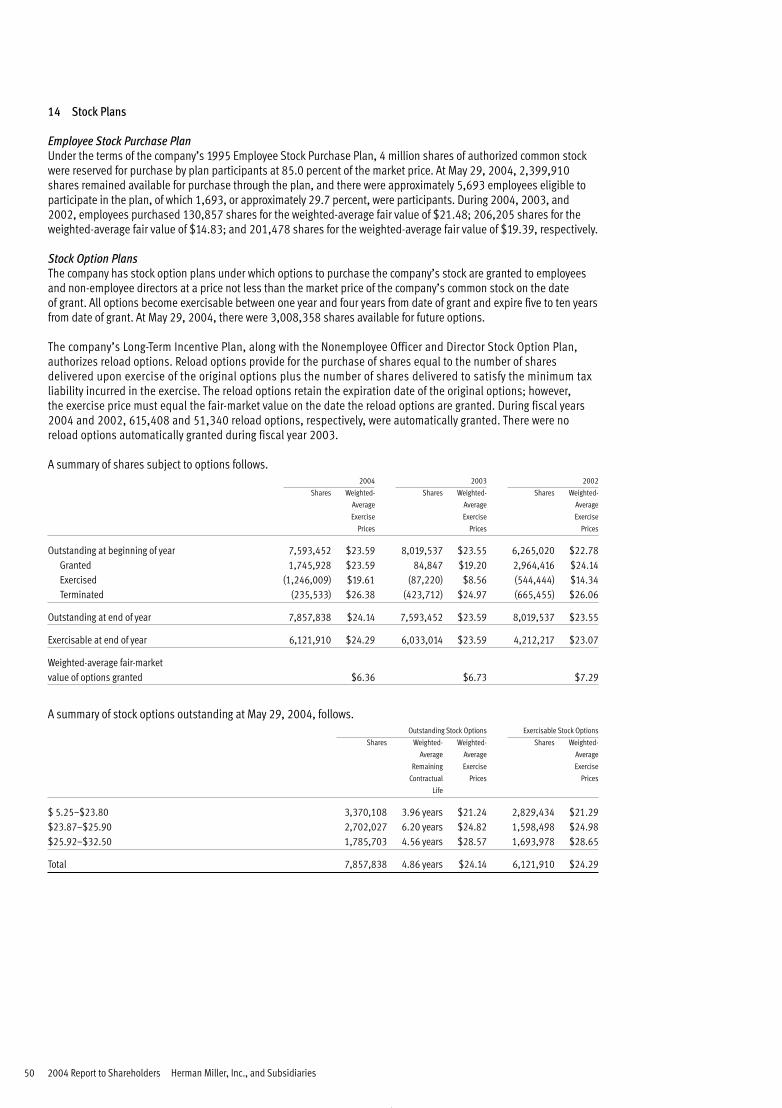
50 2004 Report to Shareholders Herman Miller, Inc., and Subsidiaries
14 Stock Plans
Employee Stock Purchase PlanUnder the terms of the company’s 1995 Employee Stock Purchase Plan, 4 million shares of authorized common stockwere reserved for purchase by plan participants at 85.0 percent of the market price. At May 29, 2004, 2,399,910shares remained available for purchase through the plan, and there were approximately 5,693 employees eligible toparticipate in the plan, of which 1,693, or approximately 29.7 percent, were participants. During 2004, 2003, and2002, employees purchased 130,857 shares for the weighted-average fair value of $21.48; 206,205 shares for theweighted-average fair value of $14.83; and 201,478 shares for the weighted-average fair value of $19.39, respectively.
Stock Option PlansThe company has stock option plans under which options to purchase the company’s stock are granted to employeesand non-employee directors at a price not less than the market price of the company’s common stock on the date of grant. All options become exercisable between one year and four years from date of grant and expire five to ten yearsfrom date of grant. At May 29, 2004, there were 3,008,358 shares available for future options.
The company’s Long-Term Incentive Plan, along with the Nonemployee Officer and Director Stock Option Plan,authorizes reload options. Reload options provide for the purchase of shares equal to the number of sharesdelivered upon exercise of the original options plus the number of shares delivered to satisfy the minimum taxliability incurred in the exercise. The reload options retain the expiration date of the original options; however, the exercise price must equal the fair-market value on the date the reload options are granted. During fiscal years2004 and 2002, 615,408 and 51,340 reload options, respectively, were automatically granted. There were noreload options automatically granted during fiscal year 2003.
A summary of shares subject to options follows.2004 2003 2002
Shares Weighted- Shares Weighted- Shares Weighted-
Average Average Average
Exercise Exercise Exercise
Prices Prices Prices
Outstanding at beginning of year 7,593,452 $23.59 8,019,537 $23.55 6,265,020 $22.78Granted 1,745,928 $23.59 84,847 $19.20 2,964,416 $24.14Exercised (1,246,009) $19.61 (87,220) $8.56 (544,444) $14.34Terminated (235,533) $26.38 (423,712) $24.97 (665,455) $26.06
Outstanding at end of year 7,857,838 $24.14 7,593,452 $23.59 8,019,537 $23.55
Exercisable at end of year 6,121,910 $24.29 6,033,014 $23.59 4,212,217 $23.07
Weighted-average fair-marketvalue of options granted $6.36 $6.73 $7.29
A summary of stock options outstanding at May 29, 2004, follows.Outstanding Stock Options Exercisable Stock Options
Shares Weighted- Weighted- Shares Weighted-
Average Average Average
Remaining Exercise Exercise
Contractual Prices Prices
Life
$ 5.25–$23.80 3,370,108 3.96 years $21.24 2,829,434 $21.29$23.87–$25.90 2,702,027 6.20 years $24.82 1,598,498 $24.98$25.92–$32.50 1,785,703 4.56 years $28.57 1,693,978 $28.65
Total 7,857,838 4.86 years $24.14 6,121,910 $24.29
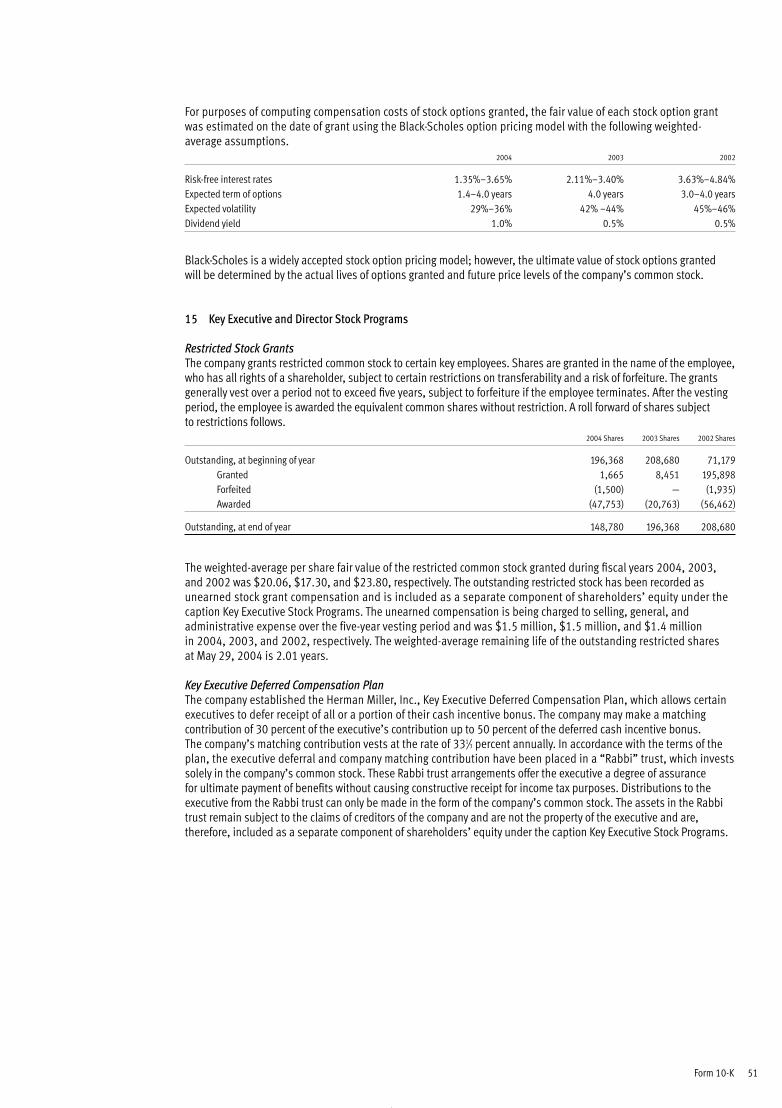
Form 10-K 51
For purposes of computing compensation costs of stock options granted, the fair value of each stock option grantwas estimated on the date of grant using the Black-Scholes option pricing model with the following weighted-average assumptions.
2004 2003 2002
Risk-free interest rates 1.35%–3.65% 2.11%–3.40% 3.63%–4.84% Expected term of options 1.4–4.0 years 4.0 years 3.0–4.0 yearsExpected volatility 29%–36% 42% –44% 45%–46%Dividend yield 1.0% 0.5% 0.5%
Black-Scholes is a widely accepted stock option pricing model; however, the ultimate value of stock options granted will be determined by the actual lives of options granted and future price levels of the company’s common stock.
15 Key Executive and Director Stock Programs
Restricted Stock GrantsThe company grants restricted common stock to certain key employees. Shares are granted in the name of the employee,who has all rights of a shareholder, subject to certain restrictions on transferability and a risk of forfeiture. The grantsgenerally vest over a period not to exceed five years, subject to forfeiture if the employee terminates. After the vestingperiod, the employee is awarded the equivalent common shares without restriction. A roll forward of shares subjectto restrictions follows.
2004 Shares 2003 Shares 2002 Shares
Outstanding, at beginning of year 196,368 208,680 71,179Granted 1,665 8,451 195,898Forfeited (1,500) — (1,935)Awarded (47,753) (20,763) (56,462)
Outstanding, at end of year 148,780 196,368 208,680
The weighted-average per share fair value of the restricted common stock granted during fiscal years 2004, 2003, and 2002 was $20.06, $17.30, and $23.80, respectively. The outstanding restricted stock has been recorded asunearned stock grant compensation and is included as a separate component of shareholders’ equity under thecaption Key Executive Stock Programs. The unearned compensation is being charged to selling, general, andadministrative expense over the five-year vesting period and was $1.5 million, $1.5 million, and $1.4 million in 2004, 2003, and 2002, respectively. The weighted-average remaining life of the outstanding restricted sharesat May 29, 2004 is 2.01 years.
Key Executive Deferred Compensation PlanThe company established the Herman Miller, Inc., Key Executive Deferred Compensation Plan, which allows certainexecutives to defer receipt of all or a portion of their cash incentive bonus. The company may make a matchingcontribution of 30 percent of the executive’s contribution up to 50 percent of the deferred cash incentive bonus. The company’s matching contribution vests at the rate of 331⁄3 percent annually. In accordance with the terms of theplan, the executive deferral and company matching contribution have been placed in a “Rabbi” trust, which investssolely in the company’s common stock. These Rabbi trust arrangements offer the executive a degree of assurance for ultimate payment of benefits without causing constructive receipt for income tax purposes. Distributions to theexecutive from the Rabbi trust can only be made in the form of the company’s common stock. The assets in the Rabbitrust remain subject to the claims of creditors of the company and are not the property of the executive and are,therefore, included as a separate component of shareholders’ equity under the caption Key Executive Stock Programs.
52 2004 Report to Shareholders Herman Miller, Inc., and Subsidiaries
Key Executive Stock Purchase Assistance PlanThe company previously adopted a key executive stock purchase assistance plan that was used to assist them inattaining their stock ownership requirements. Under the terms of this plan, loans were made to key executives forthe purpose of purchasing company stock. All loans are full recourse loans. Each loan is evidenced by a promissory notefrom the participating executive and is secured by all or a portion of the shares purchased with the loan proceeds. The sale or transfer of shares is restricted for five years after the loan is fully paid. The plan provides for the key executivesto earn repayment of a portion of the notes, including interest, based on meeting annual performance objectives as setby the Executive Compensation Committee of the Board of Directors. During the course of the loans, the plan prohibitsparticipants from earning repayment of more than eighty percent of the original principal amount, plus accrued interest,prior to maturity of the loans.
No loans under this plan have been extended by the company during the past three fiscal years. Moreover, followingthe enactment of the Sarbanes-Oxley Act of 2002, the company’s Executive Compensation Committee will notpermit any new loans to be granted under the plan. Existing loans may be paid in accordance with their prevailingterms but may not be materially modified.
The notes bear interest at 7.0 percent per annum. Interest is payable annually, and principal is due on various datesthrough September 1, 2008. As of May 29, 2004, the notes outstanding relating to the exercise of options were $0.02million. Notes outstanding related to open-market purchases were $1.0 million and are recorded in other assets.Compensation expense related to earned repayment was $0.2 million in 2004. There was no such expense in 2003and it was not material in 2002.
In fiscal 2003 and 2002 the annual performance objectives related to the earned repayment provision of these loans were not attained, resulting in payment obligations for current plan participants. In fiscal 2003, no deferralsof these payment obligations were granted. Accordingly, principal payments of $0.25 million and interest paymentsof $0.1 million were paid in fiscal 2004 by participants of the plan. In fiscal 2002, the Executive CompensationCommittee of the Board of Directors agreed to allow the participants to defer the fiscal 2002 payments to a futuredate without extending the maturities on the loans. In total, principal payments of $0.2 million and interestpayments of $0.1 million were deferred for four executives in fiscal 2002.
Director FeesDuring fiscal 2000, the Board of Directors approved a plan that allows the Board members to elect to receive theirdirector fees in one or more of the following forms: cash, deferred compensation in the form of shares, unrestrictedcompany stock at the market value at the date of election, or stock options that vest in one year and expire in tenyears. The exercise price of the stock options granted may not be less than the market price of the company’scommon stock on the date of grant. Under the plan, the Board members received 45,907 options and 4,728 sharesof common stock during fiscal 2004. In fiscal 2003, Board members received 74,847 options, 5,230 shares ofcommon stock, and 5,346 shares through the deferred compensation program. In 2002, board members received47,020 options and 11,266 shares through the deferred compensation program.
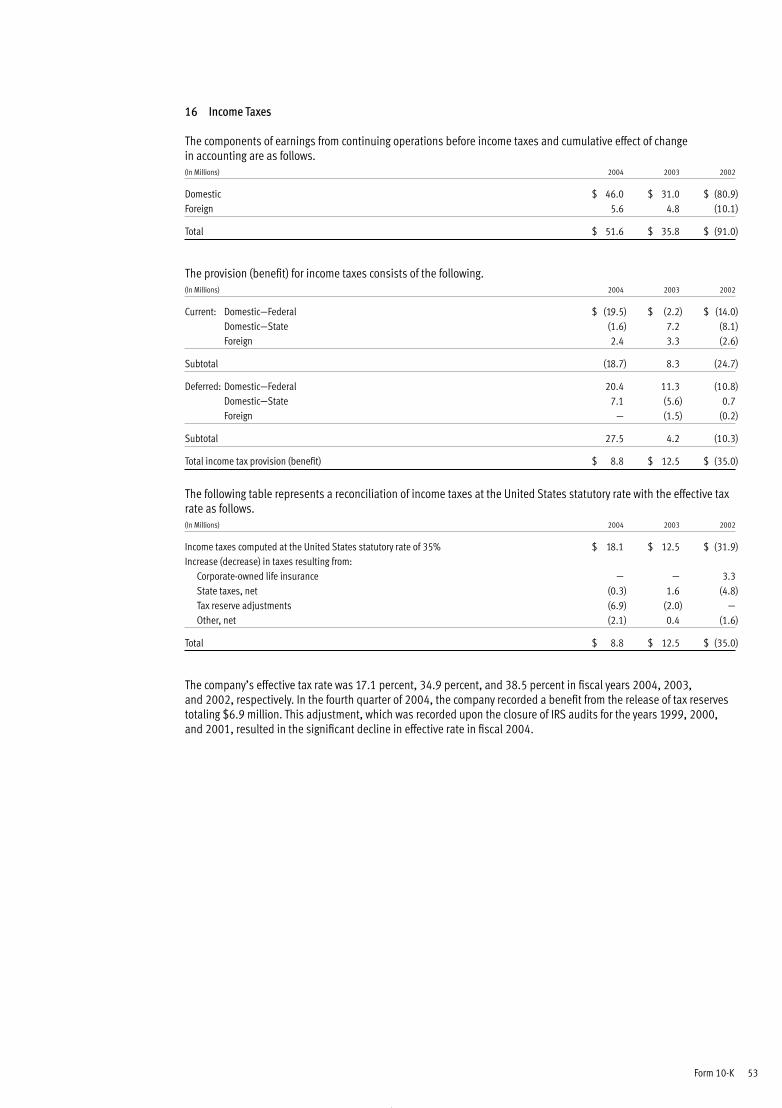
Form 10-K 53
16 Income Taxes
The components of earnings from continuing operations before income taxes and cumulative effect of change in accounting are as follows. (In Millions) 2004 2003 2002
Domestic $ 46.0 $ 31.0 $ (80.9)Foreign 5.6 4.8 (10.1)
Total $ 51.6 $ 35.8 $ (91.0)
The provision (benefit) for income taxes consists of the following.(In Millions) 2004 2003 2002
Current: Domestic—Federal $ (19.5) $ (2.2) $ (14.0)Domestic—State (1.6) 7.2 (8.1)Foreign 2.4 3.3 (2.6)
Subtotal (18.7) 8.3 (24.7)
Deferred: Domestic—Federal 20.4 11.3 (10.8)Domestic—State 7.1 (5.6) 0.7Foreign — (1.5) (0.2)
Subtotal 27.5 4.2 (10.3)
Total income tax provision (benefit) $ 8.8 $ 12.5 $ (35.0)
The following table represents a reconciliation of income taxes at the United States statutory rate with the effective taxrate as follows.(In Millions) 2004 2003 2002
Income taxes computed at the United States statutory rate of 35% $ 18.1 $ 12.5 $ (31.9)Increase (decrease) in taxes resulting from:
Corporate-owned life insurance — — 3.3State taxes, net (0.3) 1.6 (4.8)Tax reserve adjustments (6.9) (2.0) —Other, net (2.1) 0.4 (1.6)
Total $ 8.8 $ 12.5 $ (35.0)
The company’s effective tax rate was 17.1 percent, 34.9 percent, and 38.5 percent in fiscal years 2004, 2003, and 2002, respectively. In the fourth quarter of 2004, the company recorded a benefit from the release of tax reservestotaling $6.9 million. This adjustment, which was recorded upon the closure of IRS audits for the years 1999, 2000,and 2001, resulted in the significant decline in effective rate in fiscal 2004.
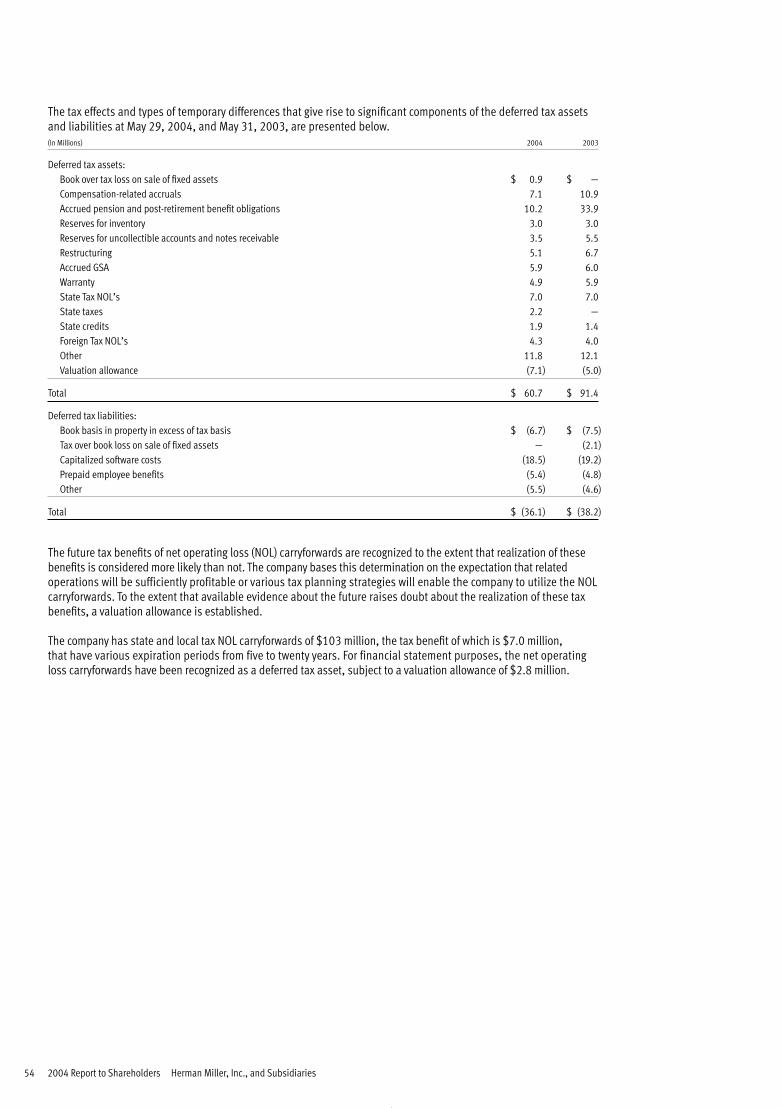
54 2004 Report to Shareholders Herman Miller, Inc., and Subsidiaries
The tax effects and types of temporary differences that give rise to significant components of the deferred tax assetsand liabilities at May 29, 2004, and May 31, 2003, are presented below.(In Millions) 2004 2003
Deferred tax assets:Book over tax loss on sale of fixed assets $ 0.9 $ —Compensation-related accruals 7.1 10.9Accrued pension and post-retirement benefit obligations 10.2 33.9Reserves for inventory 3.0 3.0Reserves for uncollectible accounts and notes receivable 3.5 5.5Restructuring 5.1 6.7Accrued GSA 5.9 6.0Warranty 4.9 5.9State Tax NOL’s 7.0 7.0State taxes 2.2 —State credits 1.9 1.4Foreign Tax NOL’s 4.3 4.0Other 11.8 12.1Valuation allowance (7.1) (5.0)
Total $ 60.7 $ 91.4
Deferred tax liabilities:Book basis in property in excess of tax basis $ (6.7) $ (7.5)Tax over book loss on sale of fixed assets — (2.1)Capitalized software costs (18.5) (19.2)Prepaid employee benefits (5.4) (4.8)Other (5.5) (4.6)
Total $ (36.1) $ (38.2)
The future tax benefits of net operating loss (NOL) carryforwards are recognized to the extent that realization of thesebenefits is considered more likely than not. The company bases this determination on the expectation that relatedoperations will be sufficiently profitable or various tax planning strategies will enable the company to utilize the NOLcarryforwards. To the extent that available evidence about the future raises doubt about the realization of these taxbenefits, a valuation allowance is established.
The company has state and local tax NOL carryforwards of $103 million, the tax benefit of which is $7.0 million, that have various expiration periods from five to twenty years. For financial statement purposes, the net operating loss carryforwards have been recognized as a deferred tax asset, subject to a valuation allowance of $2.8 million.
Form 10-K 55
The company has foreign net operating loss carryforwards of $12 million, the tax benefit of which is $4.3 million, that have expiration periods which are unlimited in term. For financial statement purposes, the tax benefit of theforeign net operating loss carryforwards has been recognized as a deferred tax asset, subject to a valuation allowanceof $4.3 million.
The company has not provided for United States income taxes on undistributed earnings of foreign subsidiariestotaling approximately $73 million. Recording of deferred income taxes on these undistributed earnings is notrequired, because these earnings have been deemed to be permanently reinvested. These amounts would be subjectto possible U.S. taxation only if remitted as dividends. The determination of the hypothetical amount of unrecognizeddeferred U.S. taxes on undistributed earnings of foreign entities is not practicable.
During fiscal 2002, the company entered into a settlement agreement with the Internal Revenue Service related to the disallowance of deductions for its corporate owned life insurance (COLI) policy loan interest and administrativefees. This settlement was for all years of the insurance programs since their inception in fiscal 1994.
The company’s settlement provided for the surrender of its COLI program policies. As a result, the company cancelledthe related life insurance policies resulting in a $1.8 million pretax charge to earnings in the quarter ended March 2, 2002.The company also received cash in the third quarter of fiscal 2002 totaling $14.0 million for the net cash surrendervalue of the related policies. Additionally, the settlement agreement required the company to pay taxes and interestrelated to the disallowance of the deductions for the tax years between 1994 and 1999. Since the company hadpreviously reserved for the disallowance of these deductions, no further impact to net earnings was required. Taxes and interest related to the settlement totaling $20.4 million were paid during fiscal 2003. Future remaining taxand interest payments totaling $1.8 million are expected to be made in the first half of fiscal 2005.
17 Fair Value of Financial Instruments
The carrying amount of the company’s financial instruments included in current assets and current liabilitiesapproximates fair value due to their short-term nature. The fair value of the notes receivable is estimated bydiscounting expected future cash flows using current interest rates at which similar loans would be made to borrowerswith similar credit ratings and remaining maturities. As of May 29, 2004, and May 31, 2003, the fair value of the notesreceivable approximated the carrying value. The company intends to hold these notes to maturity and has recordedallowances to reflect the terms negotiated for carrying value purposes. As of May 29, 2004, the carrying value ofthe company’s long-term debt including both current maturities and the fair value of the company’s interest rate swaparrangements was $205.7 million with a corresponding fair market value of $226.2 million. At May 31, 2003, the carrying value and fair market value were $223.0 million and $256.8 million, respectively.
56 2004 Report to Shareholders Herman Miller, Inc., and Subsidiaries
18 Financial Instruments with Off-Balance Sheet Risk
The company has periodically utilized financial instruments to manage its foreign currency volatility at thetransactional level as well as its exposure to interest rate fluctuations.
Foreign Currency ContractsThe majority of the foreign currency contracts relate to major currencies such as the Japanese yen, the Australiandollar, and the British pound. The exposure to credit risk from these currency contracts is minimal, because the counterparties are major financial institutions. The market risk exposure is essentially limited to currency ratemovements. The gains or losses arising from these financial instruments are applied to offset exchange gainsor losses on the related hedged exposures. At May 29, 2004, and May 31, 2003, the company had no outstandingderivative financial instruments resulting from foreign currency hedge contracts.
Interest Rate SwapsIn May 2002, the company entered into a fixed-to-floating interest rate swap agreement which expires March 6, 2006,effectively converting $40 million of fixed-rate private placement debt to a floating-rate basis. The fair value of thisswap instrument was approximately $0.4 million and $1.2 million as of May 29, 2004, and May 31, 2003,respectively. This fair value amount is recorded in the Consolidated Balance Sheets as an addition to long-term debtand an offsetting addition to other noncurrent assets. The floating interest rate, which is based on the 90-day LIBOR,set in advance of each quarterly period, was approximately 3.5 percent and 3.7 percent as of May 29, 2004, and May 31, 2003, respectively.
In November 2003, the company entered into two additional fixed-to-floating interest rate swap agreements. One agreement that expires March 15, 2011, effectively converts $50 million of fixed-rate debt securities to a floating-ratebasis. The fair value of this swap instrument was approximately $(1.5) million as of May 29, 2004. The secondagreement, which expires March 5, 2008, effectively converts $15 million of fixed-rate private placement debt to afloating-rate basis. The fair value of this swap instrument was approximately $(0.2) million as of May 29, 2004. Thesefair value amounts are recorded in the Consolidated Balance Sheet as a reduction to long-term debt and an offsettingaddition to other long-term liabilities. The floating interest rate for these two agreements is based on the six-monthLIBOR, set in-arrears at the end of each semi-annual period.
As of May 29, 2004, the company’s outstanding debt that was effectively converted to a variable-rate basis totaled $82million as a result of these interest rate swap arrangements. These swaps are fair-value hedges and qualify for hedge-accounting treatment using the “short-cut” method under the provisions of Statement of Financial Accounting StandardsNo. 133, “Accounting for Derivative Instruments and Hedging Activities.” Under this accounting treatment, the change in the fair value of the interest rate swap is equal to the change in value of the related hedged debt and, as a result, there is no net effect on earnings. These agreements require the company to pay floating-rate interest payments in returnfor receiving fixed-rate interest payments that coincide with the semi-annual payments to the debt holders at the same rate.The counterparties to these swap instruments are large major financial institutions which the company believes are ofhigh-quality creditworthiness. While the company may be exposed to potential losses due to the credit risk of non-performance by these counterparties, such losses are not anticipated. The swap arrangements resulted in the reduction of net interest expense by approximately $1.6 million and $0.9 million in fiscal years 2004 and 2003, respectively. In fiscal 2002, the effect on net interest expense was not material.
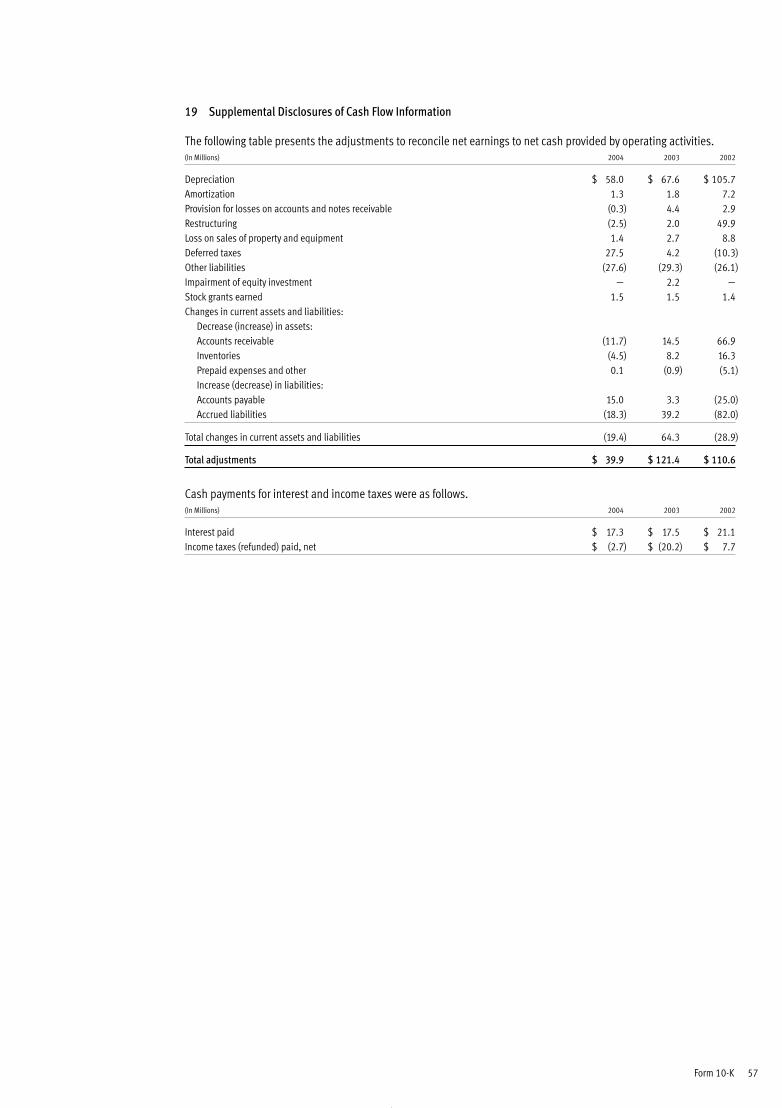
Form 10-K 57
19 Supplemental Disclosures of Cash Flow Information
The following table presents the adjustments to reconcile net earnings to net cash provided by operating activities.(In Millions) 2004 2003 2002
Depreciation $ 58.0 $ 67.6 $ 105.7Amortization 1.3 1.8 7.2Provision for losses on accounts and notes receivable (0.3) 4.4 2.9Restructuring (2.5) 2.0 49.9Loss on sales of property and equipment 1.4 2.7 8.8Deferred taxes 27.5 4.2 (10.3)Other liabilities (27.6) (29.3) (26.1)Impairment of equity investment — 2.2 —Stock grants earned 1.5 1.5 1.4Changes in current assets and liabilities:
Decrease (increase) in assets:Accounts receivable (11.7) 14.5 66.9Inventories (4.5) 8.2 16.3Prepaid expenses and other 0.1 (0.9) (5.1)Increase (decrease) in liabilities:Accounts payable 15.0 3.3 (25.0)Accrued liabilities (18.3) 39.2 (82.0)
Total changes in current assets and liabilities (19.4) 64.3 (28.9)
Total adjustments $ 39.9 $ 121.4 $ 110.6
Cash payments for interest and income taxes were as follows.(In Millions) 2004 2003 2002
Interest paid $ 17.3 $ 17.5 $ 21.1Income taxes (refunded) paid, net $ (2.7) $ (20.2) $ 7.7
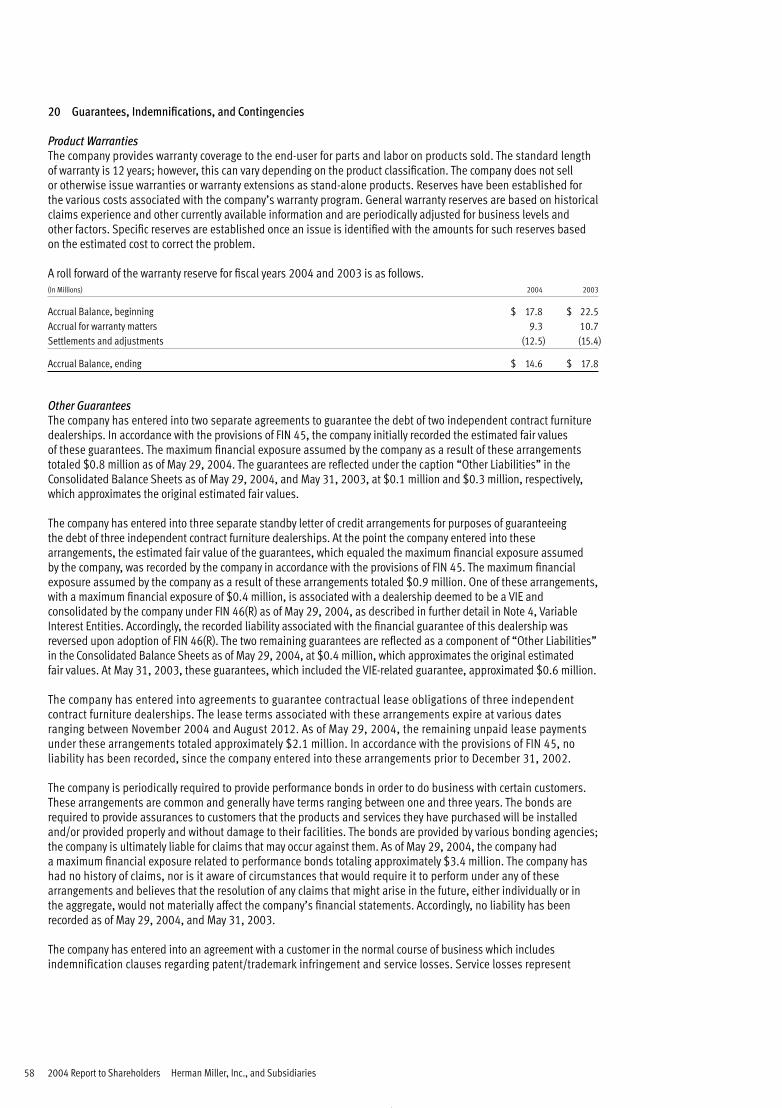
58 2004 Report to Shareholders Herman Miller, Inc., and Subsidiaries
20 Guarantees, Indemnifications, and Contingencies
Product WarrantiesThe company provides warranty coverage to the end-user for parts and labor on products sold. The standard length of warranty is 12 years; however, this can vary depending on the product classification. The company does not sell or otherwise issue warranties or warranty extensions as stand-alone products. Reserves have been established forthe various costs associated with the company’s warranty program. General warranty reserves are based on historicalclaims experience and other currently available information and are periodically adjusted for business levels and other factors. Specific reserves are established once an issue is identified with the amounts for such reserves based on the estimated cost to correct the problem.
A roll forward of the warranty reserve for fiscal years 2004 and 2003 is as follows.(In Millions) 2004 2003
Accrual Balance, beginning $ 17.8 $ 22.5Accrual for warranty matters 9.3 10.7Settlements and adjustments (12.5) (15.4)
Accrual Balance, ending $ 14.6 $ 17.8
Other GuaranteesThe company has entered into two separate agreements to guarantee the debt of two independent contract furnituredealerships. In accordance with the provisions of FIN 45, the company initially recorded the estimated fair valuesof these guarantees. The maximum financial exposure assumed by the company as a result of these arrangementstotaled $0.8 million as of May 29, 2004. The guarantees are reflected under the caption “Other Liabilities” in theConsolidated Balance Sheets as of May 29, 2004, and May 31, 2003, at $0.1 million and $0.3 million, respectively,which approximates the original estimated fair values.
The company has entered into three separate standby letter of credit arrangements for purposes of guaranteeing the debt of three independent contract furniture dealerships. At the point the company entered into thesearrangements, the estimated fair value of the guarantees, which equaled the maximum financial exposure assumed by the company, was recorded by the company in accordance with the provisions of FIN 45. The maximum financialexposure assumed by the company as a result of these arrangements totaled $0.9 million. One of these arrangements,with a maximum financial exposure of $0.4 million, is associated with a dealership deemed to be a VIE andconsolidated by the company under FIN 46(R) as of May 29, 2004, as described in further detail in Note 4, VariableInterest Entities. Accordingly, the recorded liability associated with the financial guarantee of this dealership wasreversed upon adoption of FIN 46(R). The two remaining guarantees are reflected as a component of “Other Liabilities”in the Consolidated Balance Sheets as of May 29, 2004, at $0.4 million, which approximates the original estimated fair values. At May 31, 2003, these guarantees, which included the VIE-related guarantee, approximated $0.6 million.
The company has entered into agreements to guarantee contractual lease obligations of three independentcontract furniture dealerships. The lease terms associated with these arrangements expire at various datesranging between November 2004 and August 2012. As of May 29, 2004, the remaining unpaid lease paymentsunder these arrangements totaled approximately $2.1 million. In accordance with the provisions of FIN 45, noliability has been recorded, since the company entered into these arrangements prior to December 31, 2002.
The company is periodically required to provide performance bonds in order to do business with certain customers.These arrangements are common and generally have terms ranging between one and three years. The bonds arerequired to provide assurances to customers that the products and services they have purchased will be installedand/or provided properly and without damage to their facilities. The bonds are provided by various bonding agencies;the company is ultimately liable for claims that may occur against them. As of May 29, 2004, the company had a maximum financial exposure related to performance bonds totaling approximately $3.4 million. The company hashad no history of claims, nor is it aware of circumstances that would require it to perform under any of thesearrangements and believes that the resolution of any claims that might arise in the future, either individually or in the aggregate, would not materially affect the company’s financial statements. Accordingly, no liability has beenrecorded as of May 29, 2004, and May 31, 2003.
The company has entered into an agreement with a customer in the normal course of business which includesindemnification clauses regarding patent/trademark infringement and service losses. Service losses represent
Form 10-K 59
all direct or consequential loss, liability, damages, costs and expenses incurred by the customer or others resultingfrom services rendered by the company, the dealer, or certain sub-contractors due to a proven negligent act. The maximum financial exposure assumed by the company as a result of this arrangement is $10 million in anyqualifying instance. The company has had no history of claims, nor is it aware of circumstances that would require it to perform under this arrangement and believes that the resolution of any claims that might arise in the future, either individually or in the aggregate, would not materially affect the company’s financial statements. Accordingly, no liability has been recorded as of May 29, 2004.
The company has entered into standby letter of credit arrangements for the purpose of protecting various insurancecompanies against default on the payment of certain premiums and claims. A majority of these arrangements arerelated to the company’s wholly owned captive insurance company. As of May 29, 2004, the company had a maximumfinancial exposure from these insurance-related standby letters of credit totaling approximately $12.9 million. Thecompany has had no history of claims, nor is it aware of circumstances that would require it to perform under any ofthese arrangements and believes that the resolution of any claims that might arise in the future, either individuallyor in the aggregate, would not materially affect the company’s financial statements. Accordingly, no liability has beenrecorded as of May 29, 2004, and May 31, 2003.
ContingenciesThe company leases a facility in the UK under an agreement that expires in June 2005. Under the terms of the lease,the company is required to perform the maintenance and repairs necessary to address the general dilapidation of the facility over the lease term. The ultimate cost of this provision to the company is dependent on a number offactors including, but not limited to, the future use of the facility by the lessor and whether the company choosesand is permitted to renew the lease term. The company has estimated the cost of these maintenance and repairsto be between $0 and $1 million, depending on the outcome of future plans and negotiations. Based on existingcircumstances, it is considered probable that these costs will approximate $0.5 million. As a result, this amounthas been recorded as a liability reflected under the caption “Other Liabilities” in the Consolidated Balance Sheetsas of May 29, 2004.
The company, for a number of years, has sold various products to the United States Government under GeneralServices Administration (GSA) multiple award schedule contracts. Under the terms of these contracts, the GSAis permitted to audit the company’s compliance with the GSA contracts. The company has occasionally noted errorsin complying with contract provisions. From time to time the company has notified the GSA of known instancesof non-compliance (whether favorable or unfavorable to the GSA) once such circumstances are identified andinvestigated. The company does not believe that any of the errors brought to the GSA’s attention will adversely affectits relationship with the GSA. Currently there are no GSA audits either scheduled or in process. Management doesnot expect resolution of the completed audits or non-compliance notifications to have a material adverse effecton the company’s consolidated financial statements.
On March 19, 2003, a settlement was reached in mediation concerning an audit of the company’s compliance with itsinternational GSA contract for the years 1991, 1992, and 1993. The terms of the settlement required the companyto pay $0.6 million to the United States Government. This payment was made during the fourth quarter of fiscal 2003.The financial impact of this settlement was previously reserved for, and consequently, it had no impact on fiscal 2003 net earnings.
In the fiscal 2003 “Subsequent Event” footnote disclosure, the company reported its plan to reverse an accrued legalliability totaling approximately $5.2 million in the first quarter of fiscal 2004. The liability related to a lawsuit involvingone of the company’s wholly owned contract furniture dealerships. The company’s intention to reverse the accrual was based on a favorable legal judgment issued in July 2003 by the Florida Court of Appeals. However, during the firstquarter ended August 30, 2003, the plaintiff in the lawsuit filed for an appeal to the Supreme Court of Florida. As a result, the company did not reverse the accrual at that time as initially planned. During the second quarter of fiscal2004, the Supreme Court of Florida denied the plaintiff’s appeal. Based on this, the company reversed the accrual in the second quarter resulting in a $5.2 million pretax credit to “Operating Expenses” in the Consolidated Statementsof Operations.
The company is also involved in legal proceedings and litigation arising in the ordinary course of business. In theopinion of management, the outcome of such proceedings and litigation currently pending will not materially affectthe company’s consolidated financial statements.
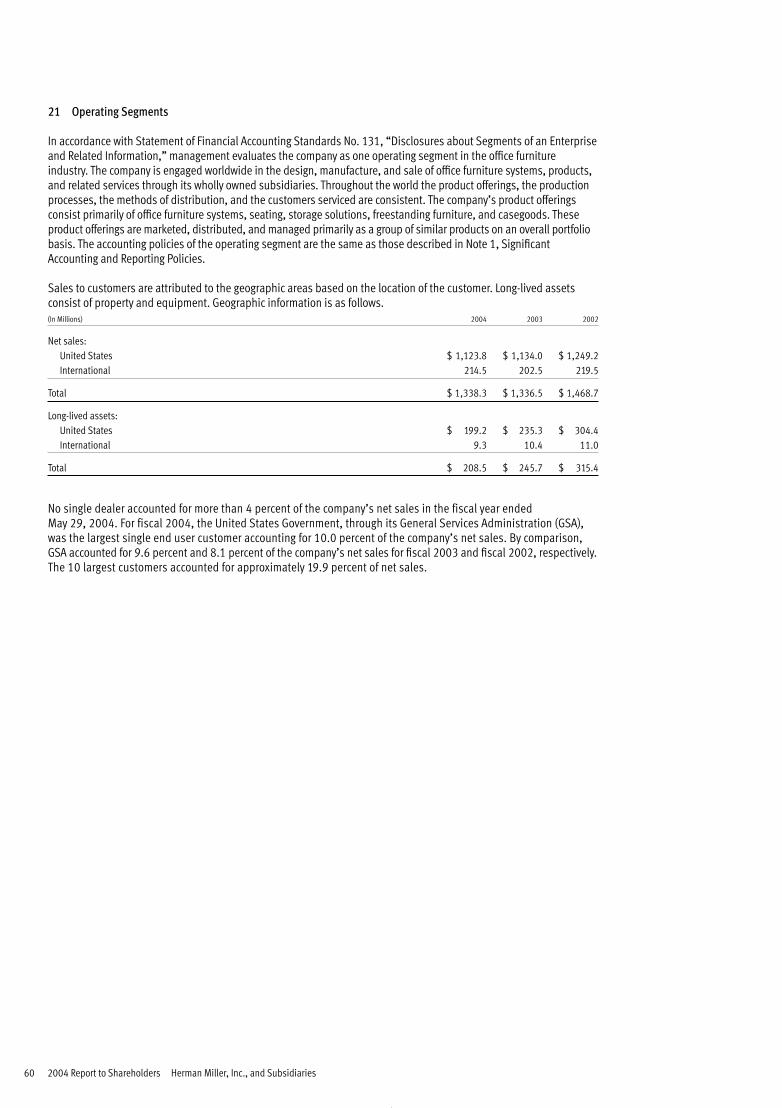
60 2004 Report to Shareholders Herman Miller, Inc., and Subsidiaries
21 Operating Segments
In accordance with Statement of Financial Accounting Standards No. 131, “Disclosures about Segments of an Enterpriseand Related Information,” management evaluates the company as one operating segment in the office furnitureindustry. The company is engaged worldwide in the design, manufacture, and sale of office furniture systems, products,and related services through its wholly owned subsidiaries. Throughout the world the product offerings, the productionprocesses, the methods of distribution, and the customers serviced are consistent. The company’s product offeringsconsist primarily of office furniture systems, seating, storage solutions, freestanding furniture, and casegoods. Theseproduct offerings are marketed, distributed, and managed primarily as a group of similar products on an overall portfoliobasis. The accounting policies of the operating segment are the same as those described in Note 1, SignificantAccounting and Reporting Policies.
Sales to customers are attributed to the geographic areas based on the location of the customer. Long-lived assetsconsist of property and equipment. Geographic information is as follows.(In Millions) 2004 2003 2002
Net sales:United States $ 1,123.8 $ 1,134.0 $ 1,249.2International 214.5 202.5 219.5
Total $ 1,338.3 $ 1,336.5 $ 1,468.7
Long-lived assets:United States $ 199.2 $ 235.3 $ 304.4International 9.3 10.4 11.0
Total $ 208.5 $ 245.7 $ 315.4
No single dealer accounted for more than 4 percent of the company’s net sales in the fiscal year ended May 29, 2004. For fiscal 2004, the United States Government, through its General Services Administration (GSA),was the largest single end user customer accounting for 10.0 percent of the company’s net sales. By comparison,GSA accounted for 9.6 percent and 8.1 percent of the company’s net sales for fiscal 2003 and fiscal 2002, respectively.The 10 largest customers accounted for approximately 19.9 percent of net sales.
Form 10-K 61
Report of Independent Registered Public Accounting Firm
To the Shareholders and Board of Directors of Herman Miller, Inc.
We have audited the accompanying consolidated balance sheets of Herman Miller, Inc. and subsidiaries as of May 29,2004 and May 31, 2003, and the related consolidated statements of operations, shareholders’ equity, and cash flows for each of the three years in the period ended May 29, 2004. These financial statements are the responsibilityof the company’s management. Our responsibility is to express an opinion on these financial statements based on our audits.
We conducted our audits in accordance with the standards of the Public Company Accounting Oversight Board (UnitedStates). Those standards require that we plan and perform the audit to obtain reasonable assurance about whetherthe financial statements are free of material misstatement. An audit includes examining, on a test basis, evidencesupporting the amounts and disclosures in the financial statements. An audit also includes assessing the accountingprinciples used and significant estimates made by management, as well as evaluating the overall financial statementpresentation. We believe that our audits provide a reasonable basis for our opinion.
In our opinion, the financial statements referred to above present fairly, in all material respects, the consolidatedfinancial position of Herman Miller, Inc. and subsidiaries at May 29, 2004 and May 31, 2003, and the consolidatedresults of their operations and their cash flows for each of the three years in the period ended May 29, 2004, in conformity with U.S. generally accepted accounting principles.
As discussed in Note 1 to the consolidated financial statements, the company on May 29, 2004 adopted FASBInterpretation No. 46(R), “Consolidation of Variable Interest Entities,” on June 1, 2003 changed its method of accounting for certain domestic inventories, and in fiscal 2003 changed its method of accounting for goodwill.
Grand Rapids, MI June 21, 2004
Item 9 Changes in and Disagreements with Accountants on Accounting and Financial Disclosures
As defined in Item 304 of Regulation S-K, there have been no changes in, or disagreements with, accountants duringthe 24month period ended May 29, 2004.
Item 9A Controls and Procedures
Evaluation of Disclosure Controls and Procedures
With the participation of management, the company’s Chief Executive Officer and Chief Financial Officer, after evaluatingthe effectiveness of the company’s disclosure controls and procedures [as defined in Exchange Act Rules 13a-15(e) and15d-15(e)] as of May 29, 2004 (the “Evaluation Date”), have concluded that, as of such date, the company’s disclosurecontrols and procedures were adequate and effective to ensure that material information relating to the company and itsconsolidated subsidiaries would be made known to them by others within those entities in connection with thecompany’s filing of its Annual Report on Form 10-K for the annual period ended May 29, 2004.
There were no changes in our internal controls over financial reporting, identified in connection with the evaluation ofsuch internal control over financial reporting that occurred during our last fiscal quarter, that have materially affected,or are reasonably likely to materially affect our internal controls over financial reporting.
Part III
Item 10 Directors and Executive Officers of the Registrant
Directors, Executive Officers, Promoters, and Control Persons
Information relating to directors and director nominees of the registrant is contained under the caption “Directorand Executive Officer Information” in the company’s definitive Proxy Statement, dated August 30, 2004, relating to the company’s 2004 Annual Meeting of Shareholders, and the information within that section is incorporated byreference. Information relating to Executive Officers of the company is included in Part I hereof entitled “ExecutiveOfficers of the Registrant.”
Information relating to the identification of the audit committee, audit committee financial expert, and directornomination procedures of the registrant is contained under the captions “Board Committees” and “DirectorNominations” in the company’s definitive Proxy Statement, dated August 30, 2004, relating to the company’s 2004Annual Meeting of Shareholders, and the information within these sections are incorporated by reference.
Compliance with Section 16(A) of the Exchange Act
Information relating to compliance with Section 16(A) of the Exchange Act is contained under the caption “Section 16(A) Beneficial Ownership Reporting Compliance” in the company's definitive Proxy Statement, dated August 30,2004, relating to the company's 2004 Annual Meeting of Shareholders, and the information within that section isincorporated by reference.
Code of Ethics
The company has adopted a Code of Conduct that serves as the code of ethics for the executive officers and as the code of business conduct for all directors and employees of the registrant. This code is made available electronically or maybe requested in printed form free of charge through the “Investors” section of the company’s internet website atwww.hermanmiller.com. Any amendments to, or waivers from, a provision of this code also will be posted to thecompany’s internet website.
Item 11 Executive Compensation
Information relating to management remuneration is contained under the captions “Compensation of Board Membersand Non-Employee Officers,” “Executive Compensation Committee Report,” “Summary Compensation Table,” “OptionGrants in Last Fiscal Year,” “Aggregated Stock Option Exercises in Fiscal 2004 and Year End Option Values,” and
62 Herman Miller, Inc., and Subsidiaries
“Long-Term Incentive Plans-Awards in Last Fiscal Year” in the company's definitive Proxy Statement, dated August 30,2004, relating to the company’s 2004 Annual Meeting of Shareholders, and the information within these sections areincorporated by reference. However, the information under the caption “Shareholder Return Performance Graph” isspecifically excluded.
Item 12 Security Ownership of Certain Beneficial Owners and Management
The sections entitled “Voting Securities and Principal Shareholders” and “Director and Executive Officer Information”and “Equity Compensation Plan Information” in the definitive Proxy Statement, dated August 30, 2004, relating to the company’s 2004 Annual Meeting of Shareholders and the information within those sections are incorporated by reference.
Item 13 Certain Relationships and Related Transactions
Information concerning certain relationships and related transactions contained under the captions “Voting Securitiesand Principal Shareholders,” “Director and Executive Officer Information,” and “Other Arrangements” in the definitiveProxy Statement, dated August 30, 2004, relating to the company’s 2004 Annual Meeting of Shareholders and theinformation within these sections are incorporated by reference.
Item 14 Principal Accountant Fees and Services
Information concerning the payments to our principal accountants and the services provided by our principalaccounting firm set forth under the caption “Disclosure of Fees Paid to Independent Auditors” in the Definitive ProxyStatement, dated August 30, 2004, relating to the company’s 2004 Annual Meeting of Shareholders’, and theinformation within that section is incorporated by reference.
Part IV
Item 15 Exhibits, Financial Statement Schedule, and Report on Form 8K
(a) The following documents are filed as a part of this report:
1. Financial Statements
The following consolidated financial statements of the company are included in this Form 10-K on the pages noted:Page Number in the Form 10-K28 Consolidated Statements of Operations29 Consolidated Balance Sheets30 Consolidated Statements of Shareholders’ Equity31 Consolidated Statements of Cash Flows32 Notes to the Consolidated Financial Statements61 Report of Independent Registered Public Accounting Firm
2. Financial Statement Schedule
The following financial statement schedule and related Report of Independent Public Accountants on the FinancialStatement Schedule are included in this Form 10-K on the pages noted:
Page Number in this Form 10-K66 Report of Independent Registered Public Accounting Firm on Financial Statement Schedule67 Schedule II—Valuation and Qualifying Accounts and Reserves for the Years Ended May 29, 2004, May 31, 2003,and June 1, 2002
All other schedules required by Form 10-K Annual Report have been omitted because they were inapplicable, includedin the Notes to the Consolidated Financial Statements, or otherwise not required under instructions contained inRegulation S X.
Form 10-K 63
3. Exhibits
Reference is made to the Exhibit Index which is included on pages 68-69.
(b) Reports on Form 8-K
During the fourth quarter of fiscal 2004, the company furnished the following Form 8-K Current Reports to theSecurities and Exchange Commission:
The company’s Current Report on Form 8-K, dated March 17, 2004 (Commission File No. 001-15141), under Items 7and 12.
The company’s Current Report on Form 8-K, dated April 29, 2004 (Commission File No. 001-15141), under Items 5 and 7.
64 Herman Miller, Inc., and Subsidiaries
Signatures
Pursuant to the requirements of Section 13 or 15(d) of the Securities Exchange Act of 1934, the Registrant has dulycaused this report to be signed on its behalf by the undersigned, thereunto duly authorized.
Herman Miller, Inc.
/s/ Brian C. Walker
By Brian C. WalkerPresident and Chief Executive Officer
Date: August 10, 2004
Pursuant to the requirements of the Securities Exchange Act of 1934, this report has been signed below on August 10,2004, by the following persons on behalf of the Registrant in the capacities indicated. Each Director of the Registrant,whose signature appears below, hereby appoints Brian C. Walker as his attorney in fact, to sign in his or her name andon his or her behalf, as a Director of the Registrant, and to file with the Commission any and all amendments to thisReport on Form 10-K.
/s/ Michael A. Volkema
Michael A. VolkemaChairman of the Board
/s/ David O. Ulrich
David O. UlrichDirector
/s/ Dorothy A. Terrell
Dorothy A. TerrellDirector
/s/ C. William Pollard
C. William PollardDirector
/s/ Douglas D. French
Douglas D. FrenchDirector
/s/ J. Barry Griswell
J. Barry GriswellDirector
Form 10-K 65
/s/ Elizabeth A. Nickels
Elizabeth A. NickelsChief Financial Officer
/s/ Thomas C. Pratt
Thomas C. PrattDirector
/s/ E. David Crockett
E. David CrockettDirector
/s/ Lord Griffiths of Fforestfach
Lord Griffiths of FforestfachDirector
/s/ Mary Vermeer Andringa
Mary Vermeer AndringaDirector
/s/ James R. Kackley
James R. KackleyDirector
/s/ Brian C. Walker
Brian C. WalkerPresident, Chief Executive Officer, and Director
Report of Independent Registered Public Accounting Firm on Financial Statement Schedule
To the Shareholders and Board of Directors of Herman Miller, Inc.
We have audited the consolidated financial statements of Herman Miller, Inc. and subsidiaries as of May 29, 2004,and May 31, 2003, and for each of the three years in the period ended May 29, 2004, and have issued our reportthereon dated June 21, 2004 (included elsewhere in this Form 10-K). Our audits also included the financial statementschedule listed in Item 15(a) of this Form 10-K. This schedule is the responsibility of the company’s management. Ourresponsibility is to express an opinion based on our audits.
In our opinion, the financial statement schedule referred to above, when considered in relation to the basic financialstatements taken as a whole, present fairly in all material respects the information set forth therein.
/s/ Ernst & Young LLP Grand Rapids, MI June 21, 2004
66 Herman Miller, Inc., and Subsidiaries
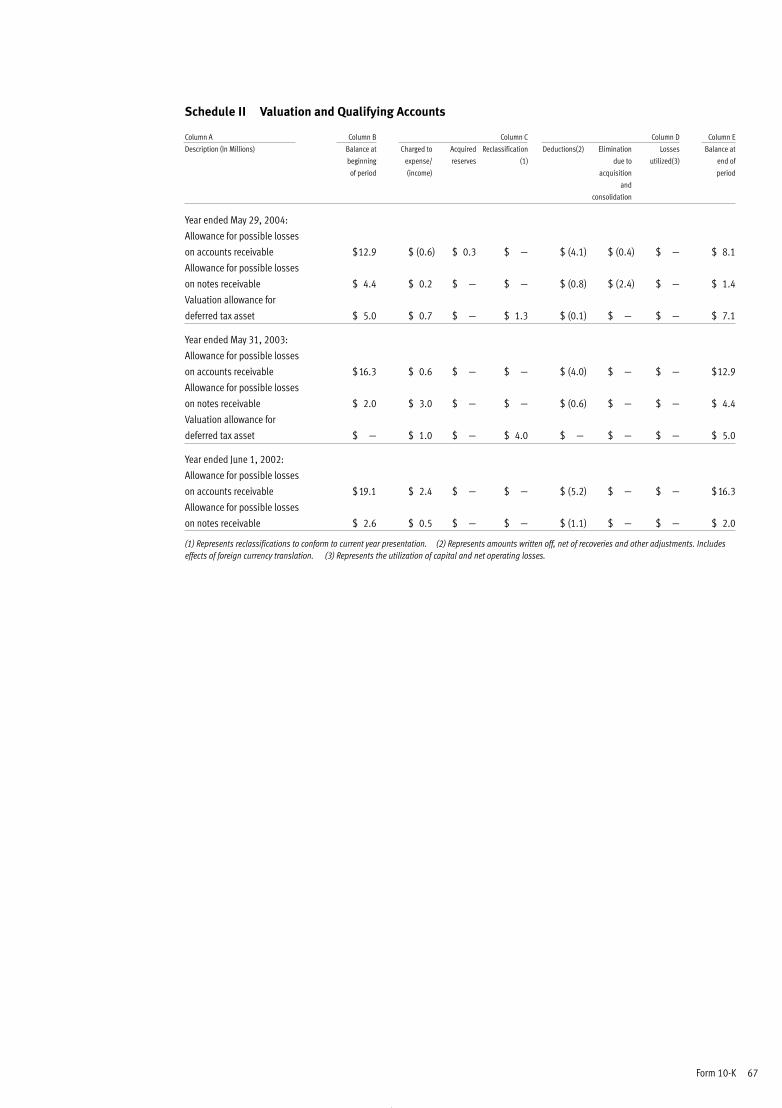
Schedule II Valuation and Qualifying Accounts
Column A Column B Column C Column D Column E
Description (In Millions) Balance at Charged to Acquired Reclassification Deductions(2) Elimination Losses Balance at
beginning expense/ reserves (1) due to utilized(3) end of
of period (income) acquisition period
and
consolidation
Year ended May 29, 2004:
Allowance for possible losses
on accounts receivable $12.9 $ (0.6) $ 0.3 $ — $ (4.1) $ (0.4) $ — $ 8.1
Allowance for possible losses
on notes receivable $ 4.4 $ 0.2 $ — $ — $ (0.8) $ (2.4) $ — $ 1.4
Valuation allowance for
deferred tax asset $ 5.0 $ 0.7 $ — $ 1.3 $ (0.1) $ — $ — $ 7.1
Year ended May 31, 2003:
Allowance for possible losses
on accounts receivable $ 16.3 $ 0.6 $ — $ — $ (4.0) $ — $ — $12.9
Allowance for possible losses
on notes receivable $ 2.0 $ 3.0 $ — $ — $ (0.6) $ — $ — $ 4.4
Valuation allowance for
deferred tax asset $ — $ 1.0 $ — $ 4.0 $ — $ — $ — $ 5.0
Year ended June 1, 2002:
Allowance for possible losses
on accounts receivable $ 19.1 $ 2.4 $ — $ — $ (5.2) $ — $ — $ 16.3
Allowance for possible losses
on notes receivable $ 2.6 $ 0.5 $ — $ — $ (1.1) $ — $ — $ 2.0
(1) Represents reclassifications to conform to current year presentation. (2) Represents amounts written off, net of recoveries and other adjustments. Includeseffects of foreign currency translation. (3) Represents the utilization of capital and net operating losses.
Form 10-K 67
Exhibit Index (Exhibits available through the SEC Edgar Database.)
(3) Articles of Incorporation and Bylaws
(a) Articles of Incorporation are incorporated by reference from Exhibit 3(a) and 3(b) of the Registrant’s 1986Form 10-K Annual Report.
(b) Certificate of Amendment to the Articles of Incorporation, dated October 15, 1987, are incorporated byreference from Exhibit 3(b) of the Registrant’s 1988 Form 10-K Annual Report.
(c) Certificate of Amendment to the Articles of Incorporation, dated May 10, 1988, are incorporated byreference from Exhibit 3(c) of the Registrant’s 1988 Form 10-K Annual Report.
(d) Amended and Restated Bylaws, dated October 1, 2002, are incorporated by reference from Exhibit 3(d) of the Registrant’s 2003 Form 10-K Annual Report.
(4) Instruments Defining the Rights of Security Holders
(a) Specimen copy of Herman Miller, Inc., common stock is incorporated by reference from Exhibit 4(a) of Registrant’s 1981 Form 10-K Annual Report.
(b) Note Purchase Agreement dated March 1, 1996, is incorporated by reference from Exhibit 4(b) of theRegistrant’s 1996 Form 10-K Annual Report.
(c) First Amendment to the Note Purchase Agreement dated February 11, 1999, is incorporated by referencefrom Exhibit 4(c) of the Registrant’s 1999 Form 10-K Annual Report.
(d) Second Amendment to the Note Purchase Agreement dated May 15, 2002, is incorporated by reference fromExhibit 4(d) of the Registrant’s 2003 Form 10-K Annual Report.
(e) Other instruments which define the rights of holders of long term debt individually represent debt of lessthan 10 percent of total assets. In accordance with item 601(b)(4)(iii)(A) of regulation S K, the Registrantagrees to furnish to the Commission copies of such agreements upon request.
(f) Dividend Reinvestment Plan for Shareholders of Herman Miller, Inc., dated January 6, 1997, is incorporatedby reference from Exhibit 4(d) of the Registrant’s 1997 Form 10-K Annual Report.
(g) Shareholder Protection Rights Agreement dated as of June 30, 1999 is incorporated by reference from Exhibit1 of the Registrant’s 8-K/A filed July 16, 1999.
(10) Material Contracts
(a) Officers’ Supplemental Retirement Income Plan is incorporated by reference from Exhibit 10(f) of theRegistrant’s 1986 Form 10-K Annual Report.*
(b) Officers’ Salary Continuation Plan is incorporated by reference from Exhibit 10(g) of the Registrant’s 1982Form 10-K Annual Report.*
(c) Herman Miller, Inc., 1994 Key Executive Stock Purchase Assistance Plan, dated October 6, 1994, isincorporated by reference from Appendix C of the Registrant’s 1994 Proxy Statement.*
(d) First Amendment to the Herman Miller, Inc., 1994 Key Executive Stock Purchase Assistance Plan, dated April28, 1998, is incorporated by reference from Exhibit 10(g) of the Registrant’s 1998 Form 10-K Annual Report.*
(e) Second Amendment to the Herman Miller, Inc., 1994 Key Executive Stock Purchase Assistance Plan, datedOctober 1, 2001, is incorporated by reference from Exhibit 10(e) of the Registrant’s 2003 Form 10-K AnnualReport.*
(f) Herman Miller, Inc. 1994 Nonemployee Officer and Director Stock Option Plan (as amended through October4, 2000), is incorporated by reference from Exhibit 10(f) of the Registrant’s 2003 Form 10-K Annual Report.*
(g) Herman Miller, Inc. Nonemployee Officer and Director Deferred Compensation Stock Purchase Plan datedNovember 1, 1999, is incorporated by reference from Exhibit 10(g) of the Registrant’s 2003 Form 10-KAnnual Report.*
(h) Restricted Share Grant Agreement dated June 5, 2001, between the company and Michael A. Volkema, is incorporated by reference from Exhibit 10(h) of the Registrant’s 2003 Form 10-K Annual Report.*
(i) Herman Miller, Inc., Key Executive Deferred Compensation Plan and form of Deferred CompensationAgreement, dated February 28, 1997, is incorporated by reference from Exhibit 10(i) of the Registrant’s 1997Form 10-K Annual Report.*
68 Herman Miller, Inc., and Subsidiaries
(j) First Amendment to the Herman Miller, Inc., Key Executive Deferred Compensation Plan, dated January 20,1998, is incorporated by reference from Exhibit 10(o) of the Registrant’s 1998 Form 10-K Annual Report.*
(k) Herman Miller, Inc., Incentive Cash Bonus Plan, dated September 29, 1998, is incorporated by referencefrom Appendix A of the Registrant’s 1998 Proxy Statement.*
(l) Credit Agreement dated April 16, 1999, is incorporated by reference from Exhibit 10(o) of the Registrant’s1999 Form 10-K Annual Report.
(m) First Amendment to the Credit Agreement dated March 9, 2000, is incorporated by reference from Exhibit10(m) of the Registrant’s 2003 Form 10-K Annual Report.
(n) Second Amendment to the Credit Agreement dated May 15, 2002, is incorporated by reference from Exhibit10(n) of the Registrant’s 2003 Form 10-K Annual Report.
(o) Third Amendment to the Credit Agreement dated May 13, 2003, is incorporated by reference from Exhibit10(o) of the Registrant’s 2003 Form 10-K Annual Report.
(p) Form of Change in Control Agreement is incorporated by reference from Exhibit 10(p) of the Registrant’s 2001Form 10-K Annual Report.
(q) Change in Control Agreement for Michael A. Volkema is incorporated by reference from Exhibit 10(q) of theRegistrant’s 2001 Form 10-K Annual Report.
(r) Herman Miller, Inc., Executive Incentive Plan dated April 23, 2002, is incorporated by reference from Exhibit10(r) of the Registrant’s 2003 Form 10-K Annual Report.*
(s) Herman Miller, Inc., Long Term Incentive Plan (as amended through September 30, 2002), is incorporated byreference from Exhibit 10(s) of the Registrant’s 2003 Form 10-K Annual Report.*
(t) Herman Miller, Inc., Executive Incentive Plan dated April 22, 2003, is incorporated by reference from Exhibit10(t) of the Registrant’s 2003 Form 10-K Annual Report.*
(u) Amended and Restated Swap Transaction Confirmation dated May 21, 2002, is incorporated by referencefrom Exhibit 10(u) of the Registrant’s 2003 Form 10-K Annual Report.
(v) Swap Transaction Confirmation dated November 19, 2003, is incorporated by reference from Exhibit 10(v) of the Registrant’s Form 10-Q Quarterly Report for quarter ended November 29, 2003.
(w) Swap Transaction Confirmation dated November 20, 2003, is incorporated by reference from Exhibit 10(w) of the Registrant’s Form 10-Q Quarterly Report for quarter ended November 29, 2003.
(x) Restricted Share Grant Agreement for Brian Walker dated July 27, 2004.*
* Denotes compensatory plan or arrangement.
(18) Letter Regarding Change in Accounting Principles
(21) Subsidiaries
(23)(a) Consent of Independent Auditors
(31)(a) Certificate of the Chief Executive Officer of Herman Miller, Inc., pursuant to Section 302 of the Sarbanes-OxleyAct of 2002
(31)(b) Certificate of the Chief Financial Officer of Herman Miller, Inc., pursuant to Section 302 of the Sarbanes-OxleyAct of 2002
(32)(a) Certificate of the Chief Executive Officer of Herman Miller, Inc. pursuant to Section 906 of the Sarbanes-OxleyAct of 2002
(32)(b) Certificate of the Chief Financial Officer of Herman Miller, Inc. pursuant to Section 906 of the Sarbanes-OxleyAct of 2002
Form 10-K 69
© 2004 Herman Miller, Inc., Zeeland, Michigan® L, Action Office, Aeron, Ambi, Eames Lounge Chair Configuration, Equa, Ergon, Ethospace, Meridian, Passage, PostureFit,
Reaction, Prospects, Resolve, and ServiceNet are among the registered trademarks of Herman Miller, Inc.® Geiger is a registered trademark of Geiger International, Inc.™ Mirra and Q are among the trademarks of Herman Miller, Inc.