07. THE APPLICATION OF IMAGE PROCESSING TECHNIQUES … · The Application of Image Processing...
5
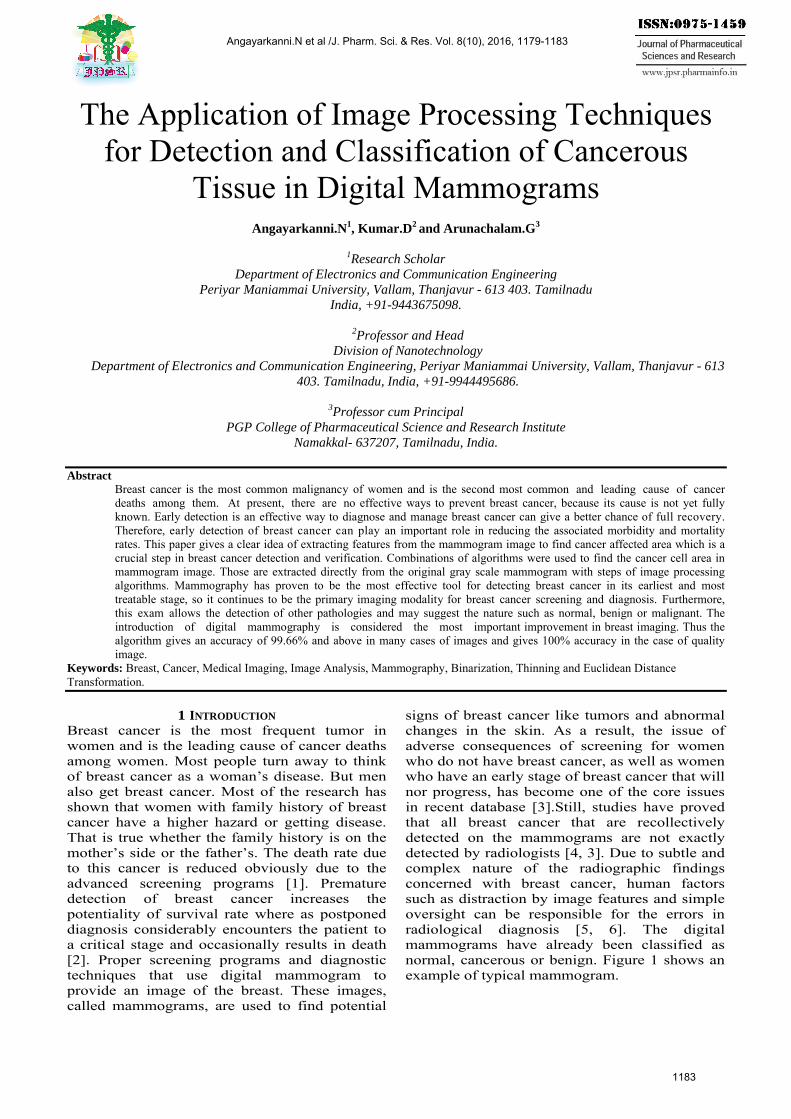
The Application of Image Processing Techniques for Detection and Classification of Cancerous Tissue in Digital Mammograms Angayarkanni.N 1 , Kumar.D 2 and Arunachalam.G 3 1 Research Scholar Department of Electronics and Communication Engineering Periyar Maniammai University, Vallam, Thanjavur - 613 403. Tamilnadu India, +91-9443675098. 2 Professor and Head Division of Nanotechnology Department of Electronics and Communication Engineering, Periyar Maniammai University, Vallam, Thanjavur - 613 403. Tamilnadu, India, +91-9944495686. 3 Professor cum Principal PGP College of Pharmaceutical Science and Research Institute Namakkal- 637207, Tamilnadu, India. Abstract Breast cancer is the most common malignancy of women and is the second most common and leading cause of cancer deaths among them. At present, there are no effective ways to prevent breast cancer, because its cause is not yet fully known. Early detection is an effective way to diagnose and manage breast cancer can give a better chance of full recovery. Therefore, early detection of breast cancer can play an important role in reducing the associated morbidity and mortality rates. This paper gives a clear idea of extracting features from the mammogram image to find cancer affected area which is a crucial step in breast cancer detection and verification. Combinations of algorithms were used to find the cancer cell area in mammogram image. Those are extracted directly from the original gray scale mammogram with steps of image processing algorithms. Mammography has proven to be the most effective tool for detecting breast cancer in its earliest and most treatable stage, so it continues to be the primary imaging modality for breast cancer screening and diagnosis. Furthermore, this exam allows the detection of other pathologies and may suggest the nature such as normal, benign or malignant. The introduction of digital mammography is considered the most important improvement in breast imaging. Thus the algorithm gives an accuracy of 99.66% and above in many cases of images and gives 100% accuracy in the case of quality image. Keywords: Breast, Cancer, Medical Imaging, Image Analysis, Mammography, Binarization, Thinning and Euclidean Distance Transformation. 1 INTRODUCTION Breast cancer is the most frequent tumor in women and is the leading cause of cancer deaths among women. Most people turn away to think of breast cancer as a woman’s disease. But men also get breast cancer. Most of the research has shown that women with family history of breast cancer have a higher hazard or getting disease. That is true whether the family history is on the mother’s side or the father’s. The death rate due to this cancer is reduced obviously due to the advanced screening programs [1]. Premature detection of breast cancer increases the potentiality of survival rate where as postponed diagnosis considerably encounters the patient to a critical stage and occasionally results in death [2]. Proper screening programs and diagnostic techniques that use digital mammogram to provide an image of the breast. These images, called mammograms, are used to find potential signs of breast cancer like tumors and abnormal changes in the skin. As a result, the issue of adverse consequences of screening for women who do not have breast cancer, as well as women who have an early stage of breast cancer that will nor progress, has become one of the core issues in recent database [3].Still, studies have proved that all breast cancer that are recollectively detected on the mammograms are not exactly detected by radiologists [4, 3]. Due to subtle and complex nature of the radiographic findings concerned with breast cancer, human factors such as distraction by image features and simple oversight can be responsible for the errors in radiological diagnosis [5, 6]. The digital mammograms have already been classified as normal, cancerous or benign. Figure 1 shows an example of typical mammogram. Angayarkanni.N et al /J. Pharm. Sci. & Res. Vol. 8(10), 2016, 1179-1183 1183
Transcript of 07. THE APPLICATION OF IMAGE PROCESSING TECHNIQUES … · The Application of Image Processing...
The Application of Image Processing Techniques for Detection and Classification of Cancerous
Tissue in Digital Mammograms Angayarkanni.N1, Kumar.D2 and Arunachalam.G3
1Research Scholar Department of Electronics and Communication Engineering
Periyar Maniammai University, Vallam, Thanjavur - 613 403. Tamilnadu India, +91-9443675098.
2Professor and Head Division of Nanotechnology
Department of Electronics and Communication Engineering, Periyar Maniammai University, Vallam, Thanjavur - 613 403. Tamilnadu, India, +91-9944495686.
3Professor cum PrincipalPGP College of Pharmaceutical Science and Research Institute
Namakkal- 637207, Tamilnadu, India.
Abstract Breast cancer is the most common malignancy of women and is the second most common and leading cause of cancer deaths among them. At present, there are no effective ways to prevent breast cancer, because its cause is not yet fully known. Early detection is an effective way to diagnose and manage breast cancer can give a better chance of full recovery. Therefore, early detection of breast cancer can play an important role in reducing the associated morbidity and mortality rates. This paper gives a clear idea of extracting features from the mammogram image to find cancer affected area which is a crucial step in breast cancer detection and verification. Combinations of algorithms were used to find the cancer cell area in mammogram image. Those are extracted directly from the original gray scale mammogram with steps of image processing algorithms. Mammography has proven to be the most effective tool for detecting breast cancer in its earliest and most treatable stage, so it continues to be the primary imaging modality for breast cancer screening and diagnosis. Furthermore, this exam allows the detection of other pathologies and may suggest the nature such as normal, benign or malignant. The introduction of digital mammography is considered the most important improvement in breast imaging. Thus the algorithm gives an accuracy of 99.66% and above in many cases of images and gives 100% accuracy in the case of quality image.
Keywords: Breast, Cancer, Medical Imaging, Image Analysis, Mammography, Binarization, Thinning and Euclidean Distance Transformation.
1 INTRODUCTION Breast cancer is the most frequent tumor in women and is the leading cause of cancer deaths among women. Most people turn away to think of breast cancer as a woman’s disease. But men also get breast cancer. Most of the research has shown that women with family history of breast cancer have a higher hazard or getting disease. That is true whether the family history is on the mother’s side or the father’s. The death rate due to this cancer is reduced obviously due to the advanced screening programs [1]. Premature detection of breast cancer increases the potentiality of survival rate where as postponed diagnosis considerably encounters the patient to a critical stage and occasionally results in death [2]. Proper screening programs and diagnostic techniques that use digital mammogram to provide an image of the breast. These images, called mammograms, are used to find potential
signs of breast cancer like tumors and abnormal changes in the skin. As a result, the issue of adverse consequences of screening for women who do not have breast cancer, as well as women who have an early stage of breast cancer that will nor progress, has become one of the core issues in recent database [3].Still, studies have proved that all breast cancer that are recollectively detected on the mammograms are not exactly detected by radiologists [4, 3]. Due to subtle and complex nature of the radiographic findings concerned with breast cancer, human factors such as distraction by image features and simple oversight can be responsible for the errors in radiological diagnosis [5, 6]. The digital mammograms have already been classified as normal, cancerous or benign. Figure 1 shows an example of typical mammogram.
Angayarkanni.N et al /J. Pharm. Sci. & Res. Vol. 8(10), 2016, 1179-1183
1183

Figure 1. Typical mammogram; left: Normal Breast,
right: Cancerous Breast This paper proposes a new algorithm addressed to perform prescreening of digital mammograms. Finally, t h i s study is very effective in decreasing mortal i ty and increasing the quality of treatment of early onset of Breast cancer. The feasibility of the proposed approach was explored on 30 commonly virulent images, and the recognition rate achieved in the detection step is 100 %.
2. PROPOSED DETECTION ALGORITHMS Detection of abnormalities in mammograms is a difficult task, especially due to the high number of normal cases. Also, a closer inspection of mammograms reveals several difficulties for possible cancer detection, for example: the variations in the recording procedure as well as the global appearance may be both inefficient and difficult in detecting abnormalities in mammograms. An overview of the basic steps describing the proposed approach is presented in the following steps. 1. Image segmentation 2. Image Binarization 3. Image Thinning 4. Image Triangulation 5. Euclidean Distance Transformation. 2.1. Image segmentation The main objective of segmentation is to simplify and/or change the representation of an image into meaningful image that is more appropriate and easier to analyze. In mammograms, background objects may even appear brighter. So in this work, preparation phase is needed in order to improve the image quality and make the segmentation results more accurate [7]. Objective of this process is to improve the quality of the image to make it ready for further processing by removing the irrelevant and unwanted parts in the background of the mammogram image. A method based on variance thresholding is used to perform the segmentation. If the variance is less than the threshold, then the block is assigned to be a background region; otherwise, it is assigned to be part of the foreground. The gray scale variance for a block of size 8×8 is defined as: 8-1 8-1
V(x) = ∑ ∑ (1)
i=0 j=0
8 8
M(x) = ∑ ∑ J (a, b) (2)
a=1 b=1 Where V(x) is the variance for block x, M(x) is the mean gray- level value for the block x. I (i, j) and J (a,b) are the gray-level value for pixel i,j and (a,b) respectively in block k. 2.2. Image Binarization The basic principle of converting an image into binary is to decide a threshold value, and then the pixels whose value are more than the threshold are converted to white pixels, and the pixels whose value are below or equal to the threshold value are converted to black pixels[8]. This improves the contrast between the ridges and valleys in a fingerprint image, and consequently facilitates the extraction of minutiae. Average of mean value of each block back ground and foreground pixels are selected as a global threshold.
(3)
Threshold value of each 8×8 block was calculated by using each block .
T = (4)
µ1 is the mean value of the object; µ2 is the mean value of the background. The outcome is a binary image containing two levels of information, the foreground and background. During this phase the gray scale image is transformed into a binary image by computing the mean value of each 8×8 input block matrix and transferring the pixel value to 1 if larger than the mean or to 0 if smaller. 2.3. Image Thinning Thinning is a process that deletes the unwanted pixels and transforms the image pattern one pixel thick. In parallel binary image processing, the value of the pixel element at the n iteration depends on the current pixel value and its neighbor at the (n -l) th iteration. We define non-zero pixels as representing objects and zero-valued as pixels representing the background. To avoid connectivity paradoxes, we define objects with eight-connectivity and background with four connectivity, our algorithm uses the 3 ×3 mask. This algorithm is made by two sub-iterations. In the first one, a pixel I (i , j) is deleted if the following conditions are satisfied : 1. Its connectivity number is one. 2. It has at least two black neighbours and not more than six. 3. At least one of I(i,j+1), I(i-1,j), and I(i,j-1) are white. 4. At least one of I(i-1,j), I(i+1,j), and I(i,j-1) are white. In the second sub-iteration the conditions in steps 3 and 4 change. 1. Its connectivity number is one. 2. It has at least two black neighbours and not more than six. 3. At least one of I(i-1,j), I(i,j+1), and I(i+1,j) are white.
Angayarkanni.N et al /J. Pharm. Sci. & Res. Vol. 8(10), 2016, 1179-1183
1184

4. At least one of I(i,j+1), I(i+1,j), and I(i,j-1) are white. Thinning process increases the speed of extraction. Parallel thinning will work on all pixels simultaneously. This parallel thinning algorithm has two sub iterations. 2.4. Image Triangulation Identifying tumor regions with clear edges is a critical step in image post processing step of image processing algorithm. If we use edge detection method for finding clear edges of mammogram image it will not give efficient result in image with too many edges and non-trivial in producing closed boundary and curve’s. This thesis presents a new approach for preprocessing and segmenting out the infiltration and tumor regions from digital mammograms using two techniques involving iterative and non-iterative algorithms of Delaunay triangulation. The preprocessing involves segmentation and extending image through the intensity of image pixel. The iterative algorithm for segmentation works to get an idea of shape of infiltration/tumor in the breast. The proposed algorithm uses voronoi properties to partition an image into regions of similarity followed by Delaunay triangulation. Algorithm proposed:
1. Take the input image as thinned Binary image. 2. Given a set S of pixels p1,p2….pN. We can
compute the Delaunay Triangulation by Voronoi diagram.
3. The voronoi diagram decomposes the image into number or regions around each pixel, such that the entire pixel in the region around pi closest to pj than they are to any points in S.
4. Let P be a circle free set .Three points p, q and r of P define a Delaunay triangle if there is no further point of P in the interior of the circle which is circumscribed to the triangle p, q, r and its center lies on a voronoi vertex.
5. If any triangle has interior point the triangle is replaced by new triangle.
6. Every time ensure that Triangulation is unique. This algorithm works by growing a current triangulation triangle by triangle. In each iteration, the algorithm seeks a new triangle which attaches to the boundary of current triangulation.
2.5 Euclidean Distance Transformation Squared EDT method works well in an image pixel distance finding in terms of intensity but it involves the time consuming calculation such as square, square root and the minimum over a set of floating point numbers. To overcome these difficulties in finding of distance through Distance transformation between pixels we are going to use two scan recursive algorithms by using 3×3 neighborhoods analysis. This algorithm only requires two image scans that are forward and backward rater scans in a binary image G (p, q): The difference of the relative coordinates of p and q. R (p) the relative coordinates. Rx, Ry of pixel p, which records the horizontal and vertical background pixel distance between p and closet background pixel. It is initialized as all (0, 0).
2Rx (q) +1 if qЄ {q1, q5} H (p, q) = 2Ry (q) +1 if qЄ {q3, q7}
2(Rx (q) +Ry (q) +1if qЄ {q2, q4, q6, q8} (5)
(1, 0) if qЄ {q1, q5} G (p, q) = (0, 1) if qЄ {q3, q7}
(1, 1) if qЄ {q2, q4, q6, q8} (6) In this step the binary image was again converted in to gray scale image with different intensity level than input gray scale image. It helps to find the area of cancer and spreading out of cancer cell in the mammogram image. Thus two scan algorithm using neighborhood Euclidean distance transformation algorithms use only a small image neighborhood and work with in the image itself and do not need any memory. Each pixel value is changed as a distance value shows the mammogram image with high level features to find the cancer cell area.
3. EXPERIMENTAL RESULTS This paper focuses upon the detection of a tumor in the breast from mammogram images. By utilizing various image processing techniques such as segmentation, Binarization, thinning, triangulation and EDT, the demarcation of the tumor in the mammogram is obtained. The following results shows the output received after each step in the algorithm. For our proposed work 10 normal images and 20 tumor affected images are taken as input images and their features are extracted and the classification results are shown below
Fig.2. Original image
Fig.3.Segmented image
Angayarkanni.N et al /J. Pharm. Sci. & Res. Vol. 8(10), 2016, 1179-1183
1185

Fig.4.Binarized image
Fig.5. Thinned image
Fig.6.Trinagulated image
Fig.7. Final image
To evaluate the performance of the proposed approach using evaluation metrics such as sensitivity, specificity and accuracy which are computed using following equations given below:
Sensitivity (%) = × 100 (7)
Specificity (%) = × 100 (8)
Accuracy (%) = × 100 (9)
True Positive (TP) An abnormal classified as abnormal True Negative (TN) A normal classified as normal False Positive (FP) A normal classified as abnormal False Negative (FN) An abnormal classified as normal N Total number of images Calculation Total number of images: 30 True Positive images : 20 True Negative : 09 False Positive : 01 False Negative : 00
Sensitivity (%) = × 100 = 100%
Specificity (%) = × 100 = 90%
Accuracy (%) = × 100 = 99.66 %
0
5
10
15
20
25
30
Totalnumber ofimages
Tumorimages
Non Tumorimages
Obtained Normal Vs Abnormal Images
Figure 8. Obtained Normal Vs Abnormal Tumor Images
Angayarkanni.N et al /J. Pharm. Sci. & Res. Vol. 8(10), 2016, 1179-1183
1186

4. CONCLUSION In this paper, the various steps involved in automatic tumor detection were implemented. The proposed approach in this paper with images processed and classification proved via its performance such as Sensitivity is 100%, Specificity is 100% and its accuracy in classification is 99.66%. Our system gives the better performance when compared existing method, so it is very helpful to the medical people in detecting tumor in breast. Also these proposed algorithms can help rural people to find out the tumor occurrence in mammogram image in case of emergency situations. The purpose of this algorithm is to provide a useful advice to the end user, not to give a final decision concerning presence of cancerous changes in an image. Our system has potential of improving physician diagnostic performance.
4. FUTURE PERSPECTIVES Future we are in corporating the above algorithm for genetic algorithm that mimics the evolution method within the nature could be a heuristic search technique to get the optimum answer in an exceeding immense solution. This work will incorporate on extraction of the clinical utility of mammogram image.
REFERENCES [1]. Peto R, Boreham J, Clarke M, Davies C, Beral V (2000). UK and
USA Breast Cancer Deaths down 25% in year 2000 at ages 20-69 years. International Journal of innovative computing and Applications, Vol.355, No.2, pp.1822–1830.
[2]. Ranadhir G, Ghosh M, Yearwood J (2004). A Modular Framework for multi Category Feature Selection in Digital Mammography. Proceedings of the 12th European Symposium on Artificial Neural Networks -ESANN 2004, Belgium 2004, pp.175-180.
[3]. Elmore JG, Wells CK, Lee CH, Howard, DH, Feinstein AR (1994).Variability in Radiologists Interpretations of mammograms. The New England Journal of Medicine, Vol.331, No.2, pp.1493-1499.
[4]. Thurfjell EL, Lernevall LA, Taube AA (1994). Benefit of Independent Double Reading in a population- Based Mammography screening Program. Journal of Radiology, Vol.191, pp.241-244.
[5]. Murugavalli S, Rajamani V (2006). A high speed parallel fuzzy C-mean algorithm for Brain tumor Segmentation. ICGST International Journal on Bioinformatics and Medical Engineering (BIME), Egypt, Vol.6, pp.29-34.
[6]. Alata M, Molhim M, Ramini A (2008). Optimizing of Fuzzy C-Means Clustering Algorithm Using GA. World Academy of Science, Engineering and Technology International Journal of Computer, Electrical, Automation, Control and Information Engineering, Vol.2, No.3, pp.670-675.
[ 7 ] . Fan J, Zeng G, Body M and Hacid M (2005). Seeded region growing: and extensive and comparative study, Pattern Recognition, Vol.26, pp.1139-1156.
[8]. Niblack W (1986). An Introduction to Digital Image Processing. Prentice-Hall, Englewood Cliffs, NJ, pp.115-116
Angayarkanni.N et al /J. Pharm. Sci. & Res. Vol. 8(10), 2016, 1179-1183
1187