063 Small Cell WiFi Coverage Study
60
www.scf.io/ www.smallcellforum.org DOCUMENT Small cell and Wi-Fi coverage study February 2014 063.06.02 SMALL CELL FORUM RELEASE 6.0 Solving the HetNet puzzle 17:25 RURAL & REMOTE URBAN ENTERPRISE VIRTUALIZATION HOME scf.io
-
Upload
jumanne-ally -
Category
Documents
-
view
20 -
download
1
Transcript of 063 Small Cell WiFi Coverage Study

www.scf.io/ www.smallcellforum.org
DOCUMENT
Small cell and Wi-Fi coverage study
February 2014
063.06.02
SMALL CELL FORUM
RELEASE 6.0
Solving the HetNet puzzle
17:25
RURAL & REM
OTE
URBAN
ENTE
RPRI
SE
VIRTUALIZATION
HOME
scf.io

SMALL CELL FORUM
RELEASE 6.0 scf.io
If you would like more information about Small Cell Forum or would like to be included on our mailing list, please contact:
Email [email protected]
Post Small Cell Forum, PO Box 23, GL11 5WA UK
Member Services [email protected]
Small Cell Forum accelerates small cell adoption to drive the wide-scale adoption of small cells and accelerate the delivery of integrated HetNets.
We are not a standards organization but partner with organizations that inform and determine standards development. We are a carrier-led organization. This means our operator members establish requirements that drive the activities and outputs of our technical groups.
We have driven the standardization of key elements of small cell technology including Iuh, FAPI/SCAPI, SON, the small cell services API, TR-069 evolution and the enhancement of the X2 interface.
Today our members are driving solutions that include small cell/Wi-Fi integration, SON evolution, virtualization of the small cell layer, driving mass adoption via multi-operator neutral host, ensuring a common approach to service APIs to drive commercialisation and the integration of small cells into 5G standards evolution.
The Small Cell Forum Release Program has now established business cases and market drivers for all the main use cases, clarifying market needs and addressing barriers to deployment for residential, enterprise and urban small cells. The theme of Release 6 is Enterprise, with particular emphasis on real world and vertical market deployments, and the role of neutral host solutions to drive the mass adoption of small cells in business environments.
Small Cell Forum Release website can be found here: www.scf.io

Report title: Small cell and Wi-Fi coverage study Issue date: 25 February 2014 Version: 063.06.02
Scope
This technical report summarizes the coverage evaluation and key findings between LTE small cells and Wi-Fi access points. The focus of the analysis has been on the isolated Enterprise deployment scenario, without considering external interference sources and only for the Downlink transmission.
In order to have a like-for-like comparison, several assumptions have been made regarding the LTE and Wi-Fi configurations, trying to simulate the current market standards, unless newer versions of the two technologies are currently available:
• IEEE 802.11n is assumed, compared with IEEE 802.11ac that is now being deployed, including support for MCS:256 QAM
• LTE Rel. 9 is assumed, but many interesting features introduced with LTE-A (Rel.10) have been not simulated, like MU-MIMO with high-order MIMO schemes.
• Wi-Fi Channel Bandwidths are restricted to be comparable with LTE. The case used of 20 MHz is typically only used in 2.4GHz, with 5GHz Wi-Fi installations typically using 40 or 80 GHz bandwidths.
• LTE bandwidths is also restricted, and no carrier aggregation is assumed in order to provide a common framework, as dual carrier cells aggregate two 20MHz carriers.
• WiFi Antenna configurations are restricted to 2x2 to enable comparison with LTE, compared to the 3x3:3 and 4x4:3 that are typically deployed with 11n and 11ac.

Report title: Small cell and Wi-Fi coverage study Issue date: 25 February 2014 Version: 063.06.02
Executive summary
The Radio and PHysical (RPH) working group conducted what we believe is the few independent analysis between LTE small cells and Wi-Fi user experience under the same set of assumptions. We believe it is relevant to point out the technology differences when it comes to comparing them side-by-side.
LTE small cells and Wi-Fi 802.11n simulations were conducted based on ITU-R M.2135, 3GPP TR 36.932, 3GPP TR 36.814 and 3GPP TR 36.872 under isolated enterprise environment and no external interferers. The footprint of the indoor model is 6,000 sq. m (~64,500 sq. ft.) with partitions. It is considered a mid-size enterprise scenario based on the recent Small Cell Forum’s reference [1]
Sparse and dense layouts were illustrated with 2 access points (AP) and 4 APs serving the given indoor area, respectively. Based on the common set of parameter assumption, we selected the 1900 and 2600 MHz bands for LTE and 2.4 GHz and 5 GHz bands for Wi-Fi. We simulated both single channel and multiple channel environments for Wi-Fi and LTE. The distinction of a co-channel simulation allows an understanding of how Wi-Fi and LTE deal with interferences and how carrier sense multiple access with collision avoidance (CSM/CA) contention protocol works in case of Wi-Fi—indicating the Wi-Fi throughput degrades faster in dense environment than LTE throughputs. The problem is exacerbated in reality as the interference level can be quite high. In fact, in the case of Wi-Fi, it is important to point out that spectrum quality is not controlled as in case of LTE and there may, in reality, be several other source of signal, like Bluetooth devices, mobile hotspots, Wi-Fi enabled cameras and other Wi-Fi APs in the vicinity of enterprise operating in the same channel. These will cause performance degradation to the Wi-Fi enterprise network and even worse may make performance unpredictable.
The distinction of multi-channel simulations allows illustrations of the potential peak efficiency of the technology. Note, in a 2.4GHz band, 802.11n can carry a maximum of 3 non-overlapping 20 MHz channels. Thus, in the dense deployment, Wi-Fi user experience is degraded further due to one channel being shared between the two APs, while this is not true under the 5 GHz band.
In term of overall area-spectral efficiency (bps/Hz/building), the area-throughput increases nearly linearly up to the number of orthogonal channels for both Wi-Fi and LTE. For both LTE and Wi-Fi once the orthogonal channels have been exhausted interference limits performance, and do so differently for each technology. In case of LTE, the spectral efficiency will be degraded due to drop in raw SINR (geometry) and having a larger number of cells is beneficial. In case of Wi-Fi, the particular MAC imposes an additional harder limit to media access on the same channel that roughly corresponds to a factor 1/NAP degradation (only one access point uses the media at any given time).
The exercise shows that LTE and Wi-Fi technologies can be integrated/collocated within the enterprise setting and complement each other (e.g. offloading data traffic), thus optimizing customers’ benefits.
Finally, RPH working group will continue the agnostic evaluation between LTE small cells and Wi-Fi radios towards an urban/metro environment.
Report title: Small cell and Wi-Fi coverage study Issue date: 25 February 2014 Version: 063.06.02
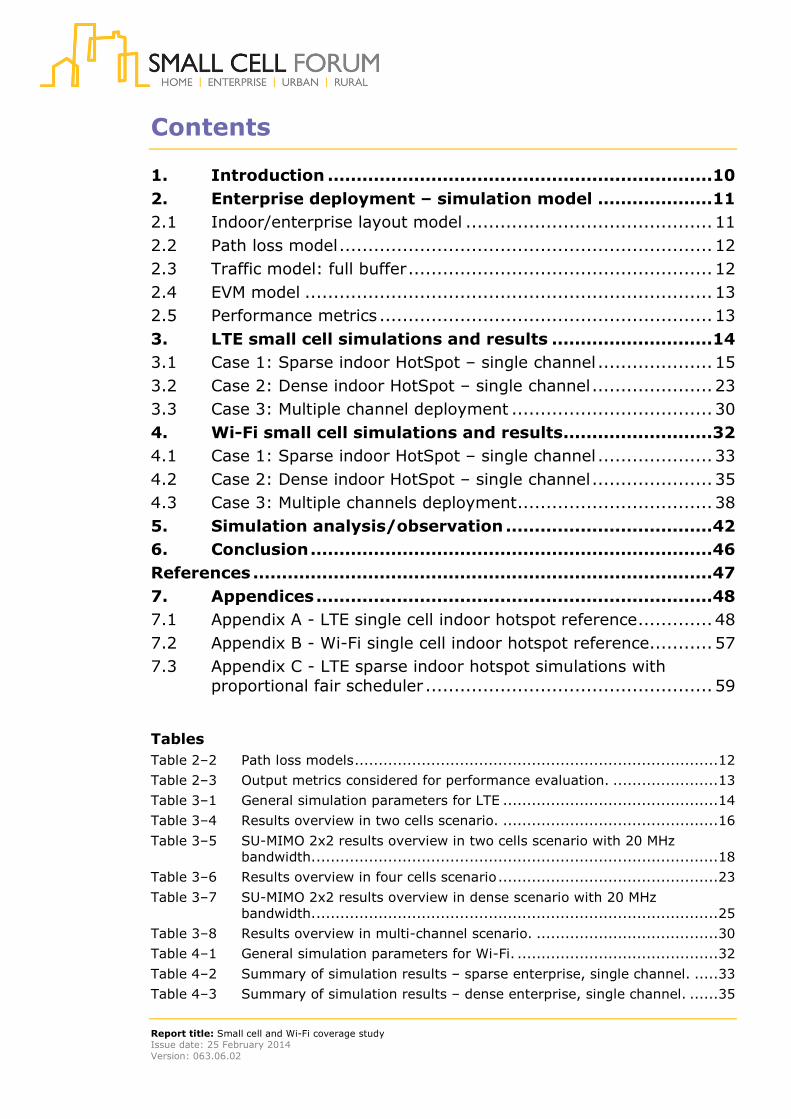
Contents
1. Introduction ................................................................... 10 2. Enterprise deployment – simulation model .................... 11 2.1 Indoor/enterprise layout model ........................................... 11 2.2 Path loss model ................................................................. 12 2.3 Traffic model: full buffer ..................................................... 12 2.4 EVM model ....................................................................... 13 2.5 Performance metrics .......................................................... 13 3. LTE small cell simulations and results ............................ 14 3.1 Case 1: Sparse indoor HotSpot – single channel .................... 15 3.2 Case 2: Dense indoor HotSpot – single channel ..................... 23 3.3 Case 3: Multiple channel deployment ................................... 30 4. Wi-Fi small cell simulations and results .......................... 32 4.1 Case 1: Sparse indoor HotSpot – single channel .................... 33 4.2 Case 2: Dense indoor HotSpot – single channel ..................... 35 4.3 Case 3: Multiple channels deployment .................................. 38 5. Simulation analysis/observation .................................... 42 6. Conclusion ...................................................................... 46 References ................................................................................ 47 7. Appendices ..................................................................... 48 7.1 Appendix A - LTE single cell indoor hotspot reference ............. 48 7.2 Appendix B - Wi-Fi single cell indoor hotspot reference ........... 57 7.3 Appendix C - LTE sparse indoor hotspot simulations with
proportional fair scheduler .................................................. 59
Tables Table 2–2 Path loss models ............................................................................ 12 Table 2–3 Output metrics considered for performance evaluation. ...................... 13 Table 3–1 General simulation parameters for LTE ............................................. 14 Table 3–4 Results overview in two cells scenario. ............................................. 16 Table 3–5 SU-MIMO 2x2 results overview in two cells scenario with 20 MHz
bandwidth. .................................................................................... 18 Table 3–6 Results overview in four cells scenario .............................................. 23 Table 3–7 SU-MIMO 2x2 results overview in dense scenario with 20 MHz
bandwidth. .................................................................................... 25 Table 3–8 Results overview in multi-channel scenario. ...................................... 30 Table 4–1 General simulation parameters for Wi-Fi. .......................................... 32 Table 4–2 Summary of simulation results – sparse enterprise, single channel. ..... 33 Table 4–3 Summary of simulation results – dense enterprise, single channel. ...... 35

Report title: Small cell and Wi-Fi coverage study Issue date: 25 February 2014 Version: 063.06.02
Table 4–4 Summary of simulation results – sparse and dense enterprise, multiple channels (*) Note: A maximum of three channels considered available for 2.4 GHz band .............................................................. 38
Table 5–1 Single Channel results .................................................................... 44 Table 5–2 Multiple channels results ................................................................. 44 Table 5–3 LTE 10 MHz Results ........................................................................ 44 Table 5–4 LTE 20 MHz single channel results in sparse scenario between
proportional fair scheduler vs. Round robin scheduler ......................... 45 Table 7–1 Results overview in single cell scenario ............................................. 49 Table 7–2 SU-MIMO 2x2 results overview in single cell scenario with 20 MHz
bandwidth. .................................................................................... 52 Table 7–3 Summary of simulation results – single Wi-Fi access point – (*) Note:
STA throughput CDF is noisy due to low amount of total users. ........... 57 Table 7–4 Summary of LTE simulations with PF scheduler in a single-channel
InH sparse scenario ....................................................................... 61 Figures Figure 2–1 Sparse indoor HotSpot scenario (see and ) ....................................... 11 Figure 2–4 Dense indoor HotSpot scenario ....................................................... 12 Figure 3–1 CDF of normalised user throughput for sparse scenario with 1900
MHz and 21 dBm ........................................................................... 15 Figure 3–2 CDF of SINR for sparse scenario with 1900 MHz and 21 dBm............... 15 Figure 3–3 CDF of normalized user throughput comparison between SU-MIMO
2x2 and 4x2 .................................................................................. 17 Figure 3–4 CDF of normalised user throughput for sparse scenario with SU-MIMO
2x2 and 20MHz bandwidth .............................................................. 19 Figure 3–5 CDF of SINR for sparse scenario with SU-MIMO 2x2 and 20MHz
bandwidth ..................................................................................... 19 Figure 3–6 Throughput distribution for sparse open scenario ............................... 19 Figure 3–7 SINR distribution for sparse open scenario ........................................ 20 Figure 3–8 Throughput vs Distance 3D graphic for InH sparse scenario with SU-
MIMO 2x2 ..................................................................................... 20 Figure 3–9 Throughput vs Distance floor distribution for InH sparse scenario with
SU-MIMO 2x2 ................................................................................ 20 Figure 3–10 Throughput vs Distance 2D graphic for InH sparse scenario with SU-
MIMO 2x2 ..................................................................................... 21 Figure 3–11 Throughput distribution for two cells considering obstacles ................. 21 Figure 3–12 SINR distribution for two cells considering obstacles ........................... 21 Figure 3–13 Spectral efficiency obstacles comparison in sparse scenario ................ 22 Figure 3–14 SINR obstacles comparison in sparse scenario ................................... 22 Figure 3–15 CDF of Normalised User Throughput for dense scenario with 1900
MHz and 21 dBm ........................................................................... 24 Figure 3–16 CDF of SINR for dense scenario with 1900 MHz and 21 dBm ............... 24 Figure 3–17 CDF of normalised user throughput for dense scenario with 1900
MHz, 21 dBm and 20MHz bandwidth ................................................ 26 Figure 3–18 CDF of SINR for dense scenario with 1900 MHz, 21 dBm and 20MHz
bandwidth ..................................................................................... 26

Report title: Small cell and Wi-Fi coverage study Issue date: 25 February 2014 Version: 063.06.02
Figure 3–19 Throughput distribution in dense open scenario ................................. 26 Figure 3–20 SINR distribution in dense open scenario .......................................... 26 Figure 3–21 Throughput vs Distance 3D graphic for InH dense scenario with SU-
MIMO 2x2 ..................................................................................... 27 Figure 3–22 Throughput vs Distance floor distribution for InH dense scenario with
SU-MIMO 2x2 ................................................................................ 27 Figure 3–23 Throughput vs Distance 2D graphic for InH dense scenario with SU-
MIMO 2x2 ..................................................................................... 28 Figure 3–24 Throughput distribution in dense scenario, considering obstacles ......... 28 Figure 3–25 SINR distribution in dense scenario, considering obstacles .................. 28 Figure 3–26 Spectral efficiency obstacles comparison in dense scenario ................. 29 Figure 3–27 SINR obstacles comparison in dense scenario .................................... 29 Figure 3–28 CDF of normalised user throughput for multi-channel scenario with
two and four cells .......................................................................... 31 Figure 3–29 CDF of SINR for multi-channel scenario with two and four cells............ 31 Figure 4–1 Transmit spectrum mask for 20 MHz . .............................................. 33 Figure 4–2 Downlink packet SINR per STA distribution – sparse indoor, single
channel. ....................................................................................... 34 Figure 4–3 Station downlink throughput distribution – sparse indoor, single
channel. ....................................................................................... 35 Figure 4–4 Downlink packet SINR per STA distribution – dense indoor, single
channel. ....................................................................................... 36 Figure 4–5 Station Downlink throughput distribution – dense indoor, single
channel. ....................................................................................... 37 Figure 4–6 Downlink average throughput as function of the distance between
station and AP. .............................................................................. 37 Figure 4–7 Downlink packet SINR per STA distribution – sparse indoor, two
channels. ...................................................................................... 39 Figure 4–8 Station downlink throughput distribution – sparse indoor, two
channels. ...................................................................................... 39 Figure 4–9 Downlink packet SINR per STA distribution – dense indoor, three or
four channels. ............................................................................... 40 Figure 4–10 Station downlink throughput distribution – dense indoor, three or four
channels. ...................................................................................... 40 Figure 4–11 Downlink average throughput as function of the distance between
station and AP. .............................................................................. 41 Figure 7–1 Modified indoor HotSpot scenario, with only one small cell .................. 48 Figure 7–2 CDF of normalised user throughput for single cell scenario with 1900
MHz and 21 dBm ........................................................................... 50 Figure 7–3 CDF of SINR for single cell scenario with 1900 MHz and 21 dBm .......... 50 Figure 7–4 Cell spectral efficiency for different configurations of SU-MIMO 2x2 ...... 51 Figure 7–5 CDF of normalised user throughput for different configurations of SU-
MIMO 2x2 ..................................................................................... 51 Figure 7–6 CDF of normalised user throughput for single cell scenario with 1900
MHz, 21 dBm and 20MHz bandwidth ................................................ 53 Figure 7–7 CDF of SINR for single cell scenario with 1900 MHz, 21 dBm and
20MHz bandwidth .......................................................................... 53 Figure 7–8 Throughput distribution for single cell open scenario .......................... 53

Report title: Small cell and Wi-Fi coverage study Issue date: 25 February 2014 Version: 063.06.02
Figure 7–9 SINR distribution for single cell open scenario ................................... 54 Figure 7–10 Throughput vs Distance 3D graphic for single cell scenario with SU-
MIMO 2x2 ..................................................................................... 54 Figure 7–11 Throughput vs Distance floor distribution for single cell scenario with
SU-MIMO 2x2 ................................................................................ 54 Figure 7–12 Throughput vs Distance 2D graphic for single cell scenario with SU-
MIMO 2x2 ..................................................................................... 55 Figure 7–13 Throughput distribution for single cell considering obstacles ................ 55 Figure 7–14 SINR distribution for single cell considering obstacles ......................... 55 Figure 7–15 Spectral Efficiency obstacles comparison in single cell scenario ............ 56 Figure 7–16 SINR obstacles comparison in single cell scenario .............................. 56 Figure 7–17 Downlink packet SINR per STA distribution – single access point. ........ 58 Figure 7–18 Station downlink throughput distribution – single access point. ............ 58 Figure 7–19 CDF of normalised user throughput in 20 MHz scenario ...................... 59 Figure 7–20 CDF of SINR in 20 MHz scenario ...................................................... 59 Figure 7–21 CDF of Normalised user throughput in 20 MHz scenario ...................... 60 Figure 7–22 CDF of SINR in 20 MHz scenario ...................................................... 60

Report title: Small cell and Wi-Fi coverage study Issue date: 25 February 2014 Version: 063.06.02 10
1. Introduction
The recent focus on radio frequency (RF) coexistence of Wi-Fi access point (AP) and small cell AP, together with network and functional aspects of integrated small cell and Wi-Fi (ISW), may have skipped the intermediate step of the multi-standard technology baseband story. While much analysis has been performed on individual technology aspects, it was believed that no such combined APs study exists and/or how Wi-Fi should be configured with respect to the cellular coverage, etc.
This study seeks to understand relative coverage differences between small cells and Wi-Fi by extending the simple link budget model (typically used by operators for Wi-Fi) to a more rigorous system and link level simulations as well as using common channel models for both APs during the simulations. The study provides a first assessment under simplified assumptions as compared to real world scenarios, whereby for capacity focused study, it will be revisited in the future once specific use case is warranted.
Section 2 illustrates the simulated small cell enterprise layout and related modeling of the environment, as well as parameters common to both LTE and Wi-Fi.
Sections 3 and 4 describe results for LTE and for Wi-Fi technology, with single and multiple channel simulations, as well as technology-specific parameters based on 3GPP standards for LTE and on IEEE 802.11 for Wi-Fi standards [2].
Section 5 compares the coverage analysis/observations.
Finally, we conclude the key finding and its potential use case to real world application in Section 6.

Report title: Small cell and Wi-Fi coverage study Issue date: 25 February 2014 Version: 063.06.02 11
2. Enterprise deployment – simulation model
2.1 Indoor/enterprise layout model
This section presents the three environments considered for evaluating LTE technology in indoor enterprise scenarios, according to what defined in REP. ITU-R M.2135 Error! Reference source not found., 3GPP TR 36.932 [3] and 3GPP TR 36.872 [4].
Table 2:1 shows the first scenario analysed, referred to as indoor hotspot in [5], Scenario 3 sparse in [4], which defines a layout that consists of one floor of a building. The floor contains 16 rooms of 15 m x 15 m, and a long hall of 120 m x 20 m. Two access points (AP) are placed in the middle of the hall at 30 m and 90 m respectively from the left site of the building, where
• Length = 120 m • Width = 50 m • LTE Small Cell#1 distance = 30 m • LTE Small Cell#2 distance = 30 m
Figure 2–1 Sparse indoor HotSpot scenario (see 1 and 4)
Note: The term ‘base station’ or ‘site’ or ‘access point’ will be used interchangeably in this document.
As second scenario, a dense enterprise deployment according to Scenario 3 in Error! Reference source not found. has been studied, considering the same layout of the building with 4LTE small cells equally spaced along the hall, as presented in 2. Thus,
• Length = 120 m • Width = 50 m • Distance 1 = Distance 5 =15 m • Distance 2 = Distance 3 = Distance 4 = 30 m
In term of the enterprise category, the 120m x 50 m or 6,000 m2 (~64,500 ft2) indoor model can be considered as a mid-size commercial building according to the Small Cell Forum’s enterprise services reference [1], ranges from 50,000 to 100,000 ft2.

Report title: Small cell and Wi-Fi coverage study Issue date: 25 February 2014 Version: 063.06.02 12
Figure 2–2 Dense indoor HotSpot scenario 4
As a reference, a single AP use case is described in the Appendix A as well.
2.2 Path loss model
In these three scenarios, indoor hotspot (InH) channel model was considered for evaluation. Path loss models for the propagation scenario have been developed based on measurement results carried out in references1 [Dong et al., 2007; Fujii, 2003; Lu et al., 2007; Xinying et al., 2007; Xu et al., 2007; Zhang et al., 2007 and 2008], as well as results from the literature [6] [7] [8] [9] [10] [11] [12]. The models can be applied in the frequency range of 2-6 GHz and for different antenna heights. The rural path loss formula can be applied to the desired frequency range from 450 MHz to 6 GHz. The path loss models have been summarized in the following table. Note that the distribution of the shadow fading is log-normal, and its standard deviation for each scenario is given in Table 2:1.
Scenario Path loss (dB) Note: fc is given in GHz and distance in m!
Shadow fading std (dB)
Applicability range, antenna height default values
LoS PL = 16.9 log10(d) + 32.8 + 20 log10(fc) σ = 3 3 m < d < 100 m hBS = 3-6 m hUT = 1-2.5 m
NLoS PL = 43.3 log10(d) + 11.5 + 20 log10(fc) σ = 4 10 m < d < 150 m hBS = 3-6 m hUT = 1-2.5 m
Table 2–1 Path loss models
2.3 Traffic model: full buffer
In the full buffer traffic model (occasionally referred to as a full queue model) there is an infinite amount of data bits awaiting transmission in the transmit buffer associated with each data source. For uplink traffic the transmit buffers exist in the user terminal while for downlink traffic the transmit buffers exist in the network infrastructure, e.g., in the base station or access point.
1 IST-WINNER II Deliverable 1.1.2 v.1.2. WINNER II Channel Models, IST-WINNER2, Tech. Rep., 2008 (http://www.ist-winner.org/deliverables.html)

Report title: Small cell and Wi-Fi coverage study Issue date: 25 February 2014 Version: 063.06.02 13
2.4 EVM model
To perform a highly realistic simulations, the effect of Tx - Rx impairments has been included. A common way to model these impairments is to use error vector magnitude (EVM). EVM describes how much the transmitted signal deviates from the ideal signal, effectively limiting the highest achievable SINR.
2.5 Performance metrics
Table 2 summarizes the performance metrics used to evaluate the simulation results. In addition to average values, the cumulative distribution function (CDF) plot is included in the results in chapters 3 and 4, to provide a more comprehensive analysis.
Performance Metric Definition Average throughput per STA (bps)
The downlink throughput transferred to the STA, averaged over all stations and random seeds
Average throughput per AP (bps)
The downlink throughput transferred from an AP, averaged over all access points and random seeds
Data transmission averaged SINR (dB)
The downlink SINR at the receiving STA during data transmission, averaged over all stations and random seeds
Average PER Packet Error Rate, averaged over all stations and random seeds Cell spectral efficiency (bps/Hz)
The ‘Average Throughput per AP’, divided the considered bandwidth
Cell edge user spectral efficiency (bps/Hz)
The lowest 5%-tile of the statistical distribution of the ‘Throughput per STA’ over all stations and random seeds, divided the considered bandwidth
Table 2–2 Output metrics considered for performance evaluation.
Note: STA or station can be considered as the Wi-Fi UE. AP or access point is used to represent the same element for Wi-Fi AP or LTE small cell. SINR is defined as the ratio between signal and noise plus interference at the receiver.

Report title: Small cell and Wi-Fi coverage study Issue date: 25 February 2014 Version: 063.06.02 14
3. LTE small cell simulations and results
For this study, several MIMO configurations were considered (SIMO 1x2, SU-MIMO 2x2, SU-MIMO 4x2, MU-MIMO 2x2 and MU-MIMO 4x2). In addition, two different carrier frequencies were evaluated (1900 MHz and 2600 MHz) and various transmission powers (21 dBm and 24 dBm) were compared. A variety of simulations were generated for this analysis, obtaining results of cell center and cell edge user spectral efficiency, throughput per cell and user, and SINR measures, considering a MMSE receiver. For having statistical significance, 100 seeds per simulation have been used. Table 3 below summarizes the parameters used in this simulation campaign.
An EVM of 4%, limiting the SNR to a maximum of 28.0 dB, was assumed at the transmitter. In our LTE simulations, this EVM value, also corresponds, more or less, to a mean SNR loss of 0.2 dB with 16QAM rate ¾ (EVM is also modelled as a Gaussian variable). The simulator used a linear MMSE receiver and an LTE turbo codec with HARQ allowing 4 retransmissions.
PARAMETER VALUE
CQI configuration Non-ideal CQI (error modelled by Gaussian variable with mean 0 and variance 1 dB)
CQI periodicity 10 ms
CQI granularity 6 RB (LTE small cell measures CQI every 6 resource blocks.)
EVM 4%
MIMO configuration SIMO 1x2, SU 2x2, 4x2 and MU 2x2 MIMO
HARQ scheme Incremental redundancy
Frequency domain scheduling Round robin
Time domain scheduling Round robin
Users/TTI 8
BW 10 MHz (and 20 MHz)
Frequency reuse Mode Full reuse
Carrier Frequency 1900 MHz, 2600 MHz
Channel Model IMT-A InH
Thermal Noise Level -174dBm/Hz
LTE Tx Power 21, 24 dBm
Users per cell 10
Mobility model Fixed users
Position Uniform per scenario
UE noise figure 7dB
Simulation time 20s
Table 3–1 General simulation parameters for LTE

Report title: Small cell and Wi-Fi coverage study Issue date: 25 February 2014 Version: 063.06.02 15
3.1 Case 1: Sparse indoor HotSpot – single channel
As explained in Section 2.1, the first scenario evaluated consists of one 120 m x 50 m floor of a building with two LTE small cells.
Figure 3-1 and Figure 3-2 show a comparison for different transmission modes, using a carrier frequency of 1900 MHz and a 21 dBm transmission power. From these graphs, it can be seen that the highest throughput occurs when using a SU-MIMO scheme. And, in terms of SINR, the best performance corresponds to MU-MIMO configuration. By contrast, SIMO schemes provide few advantages for both SINR and throughput.
Figure 3–1 CDF of normalised user throughput for sparse scenario with 1900 MHz and 21
dBm
Figure 3–2 CDF of SINR for sparse scenario with 1900 MHz and 21 dBm
0
10
20
30
40
50
60
70
80
90
100
0 0.2 0.4 0.6 0.8 1
CD
F [%
]
Normalized User Throughput [bps/Hz]
SIMO 1x2
SU-MIMO 2x2
SU-MIMO 4x2
0
10
20
30
40
50
60
70
80
90
100
0 5 10 15 20 25 30
CD
F [%
]
SINR [dB]
SIMO 1x2
SU-MIMO 2x2
SU-MIMO 4x2

Report title: Small cell and Wi-Fi coverage study Issue date: 25 February 2014 Version: 063.06.02 16
Table 3:2 shows a results overview for different configurations, in the current scenario with two cells. From this data, it can be seen that variations in transmit power or carrier do not affect the system performance in such scenario, due to propagation conditions and the size of the considered environment.
MIMO configuration
Carrier frequency (MHz)
Tx power (dBm)
Cell spectral efficiency (bps/Hz)
Cell edge user spectral efficiency (bps/Hz)
Throughput per cell (Kbps)
Throughput per user (Kbps)
Median of data Tx SINR (dB)
Data Tx averaged SINR (dB)
Total BLER
SIMO 1x2 1900 21 2.437 0.072 24365.21 2436.52 16.386 16.403 0.000544 SU-MIMO 2x2 1900 21 3.942 0.186 39423.37 3942.34 28 24.27 0.001931 SU-MIMO 4x2 1900 21 4.094 0.19 40937.31 4093.73 28 24.761 0.00285 SIMO 1x2 1900 24 2.437 0.072 24366.81 2436.68 16.776 16.809 0.000549 SU-MIMO 2x2 1900 24 3.944 0.186 39436.95 3943.7 28 24.762 0.001889 SU-MIMO 4x2 1900 24 4.094 0.191 40944.53 4094.45 28 25.366 0.003003 SIMO 1x2 2600 21 2.469 0.073 24686.29 2468.63 16.424 16.795 0.000713 SU-MIMO 2x2 2600 21 3.953 0.186 39530.12 3953.01 27.926 23.87 0.002278 SU-MIMO 4x2 2600 21 4.099 0.194 40993.83 4099.38 28 24.411 0.003364 SIMO 1x2 2600 24 2.469 0.073 24689.53 2468.95 16.883 16.973 0.000709 SU-MIMO 2x2 2600 24 3.956 0.186 39556.33 3955.63 28 24.442 0.002085 SU-MIMO 4x2 2600 24 4.101 0.194 41006.76 4100.68 28 25.049 0.003449
Table 3–2 Results overview in two cells scenario.

Report title: Small cell and Wi-Fi coverage study Issue date: 25 February 2014 Version: 063.06.02
There is also a slight improvement in throughput when a 4x2 antenna configuration is deployed instead of that of 2x2, for SU-MIMO systems, as depicted in Figure 3-3.
Figure 3–3 CDF of normalized user throughput comparison between SU-MIMO 2x2 and 4x2
0
10
20
30
40
50
60
70
80
90
100
0 0.1 0.2 0.3 0.4 0.5 0.6 0.7 0.8 0.9 1
CD
F [%
]
Normalized User Throughput [bps/Hz]
SU-MIMO 2x2 1900MHz 21dBm 2cells
SU-MIMO 2x2 1900MHz 24dBm 2cells
SU-MIMO 2x2 2600MHz 21dBm 2cells
SU-MIMO 2x2 2600MHz 24dBm 2cells
SU-MIMO 4x2 1900MHz 21dBm 2cells
SU-MIMO 4x2 1900MHz 24dBm 2cells
SU-MIMO 4x2 2600MHz 21dBm 2cells
SU-MIMO 4x2 2600MHz 24dBm 2cells

Report title: Small cell and Wi-Fi coverage study Issue date: 25 February 2014 Version: 063.06.02
Considering a bandwidth of 20 MHz, the results obtained for SU-MIMO 2x2 change as follows:
MIMO configuration
Carrier frequency (MHz)
Tx power (dBm)
Cell spectral efficiency (bps/Hz)
Cell edge user spectral efficiency (bps/Hz)
Throughput per cell (Kbps)
Throughput per User (Kbps)
Median of data Tx SINR (dB)
Data Tx averaged SINR (dB)
Total BLER
SU-MIMO 2x2 1900 21 3.923 0.188 78467.6 7846.76 28 24.033 0.005396 SU-MIMO 2x2 1900 24 3.926 0.188 78518.55 7851.86 28 24.609 0.006101 SU-MIMO 2x2 2600 21 3.944 0.191 78889.14 7888.91 27.895 23.668 0.005939 SU-MIMO 2x2 2600 24 3.949 0.193 78985.16 7898.52 28 24.294 0.005795
Table 3–3 SU-MIMO 2x2 results overview in two cells scenario with 20 MHz bandwidth.

Small cell and Wi-Fi coverage study Issue date: 25 February 2014 Version: 063.06.02 19
Figure 3–4 CDF of normalised user throughput for sparse scenario with SU-MIMO 2x2 and 20MHz bandwidth
Figure 3–5 CDF of SINR for sparse scenario with SU-MIMO 2x2 and 20MHz bandwidth
Figure 3-6 and Figure 3-7 show the SINR and throughput distribution for this environment, for a SU-MIMO 2x2 system with 1900 MHz and a transmit power of 21 dBm, considering an open area without obstacles.
Figure 3–6 Throughput distribution for sparse open scenario
0
10
20
30
40
50
60
70
80
90
100
0 0.2 0.4 0.6 0.8 1
CD
F [%
]
Normalized User Throughput [bps/Hz]
SU MIMO 2x2 1900 MHz 21dBm
SU MIMO 2x2 1900 MHz 24 dBm
SU MIMO 2x2 2600MHz 21dBm
SU MIMO 2x2 2600MHz 24 dBm
0
10
20
30
40
50
60
70
80
90
100
0 5 10 15 20 25 30
CD
F [%
]
SINR [dB]
SU-MIMO 2x2 1900MHz 21dBm
SU-MIMO 2x2 1900MHz 24dBm
SU-MIMO 2x2 2600MHz 21dBm
SU-MIMO 2x2 2600MHz 24dBm

Small cell and Wi-Fi coverage study Issue date: 25 February 2014 Version: 063.06.02 20
Figure 3–7 SINR distribution for sparse open scenario
Figure 3–8 Throughput vs Distance 3D graphic for InH sparse scenario with SU-MIMO 2x2
Figure 3–9 Throughput vs Distance floor distribution for InH sparse scenario with SU-MIMO
2x2

Small cell and Wi-Fi coverage study Issue date: 25 February 2014 Version: 063.06.02 21
Figure 3–10 Throughput vs Distance 2D graphic for InH sparse scenario with SU-MIMO 2x2
Note: The red lines in Figure 3-10 indicate the AP locations.
In addition, the same floor was simulated considering the loss caused by the walls of the building. In this case, the attenuation of the external walls is 12 dB, while the internal walls have an attenuation of 6 dB. Figure 3-11 and Figure 3-12 show the throughput and SINR distribution in these simulations for SU-MIMO 2x2, 1900MHz and 21 dBm.
Figure 3–11 Throughput distribution for two cells considering obstacles
Figure 3–12 SINR distribution for two cells considering obstacles
For both cases, with and without obstacles, the area with poorest performance is the centre of the floor, since the users placed between the two existing LTE small cells will

Small cell and Wi-Fi coverage study Issue date: 25 February 2014 Version: 063.06.02 22
experience high values of interference. Numerical results of both simulations are compared in Figure 3-13 and Figure 3-14. Better results are obtained considering the loss of the walls due to the attenuation of the interference, which leads to higher values of SINR, thus, better performance.
Figure 3–13 Spectral efficiency obstacles comparison in sparse scenario
Figure 3–14 SINR obstacles comparison in sparse scenario
As a summary, for this scenario the best MIMO configuration is SU-MIMO 4x2, since it has the best performance in terms of spectral efficiency, with a value around 4.1 bps/Hz for both frequencies and considered transmission powers. On the opposite, SIMO 1x2 scheme provides a spectral efficiency of 2.42 bps/Hz and has a slightly higher value for 2600 MHz than for 1900 MHz, due to the fact that the signal from the non-serving cell becomes more attenuated.
0
0.5
1
1.5
2
2.5
3
3.5
4
4.5
5
Cell Spectral Efficiency (bps/Hz) Cell Edge User Spectral Efficiency (bps/Hz)
Spectral Efficiency
Obstacles No Obstacles
24
24.5
25
25.5
26
26.5
27
27.5
28
28.5
Median of Data Transmission SINR (dB) Data Transmission Averaged SINR (dB)
SINR
Obstacles No Obstacles

Small cell and Wi-Fi coverage study Issue date: 25 February 2014 Version: 063.06.02 23
3.2 Case 2: Dense indoor HotSpot – single channel
As remarked previously, the last scenario analysed in this document consists of four cells equally spaced along the hall of the considered floor. As a consequence, users experience high interference rates and poorer values of SINR and throughput, compared to the previous scenarios studied. Table 3:4 shows the results of the simulations for this scenario, where SU-MIMO 4x2 is the system with the highest spectral efficiency and the lowest values.
MIMO configuration
Carrier frequency
Tx power (dBm)
Cell spectral efficiency (bps/Hz)
Cell Edge User spectral efficiency (bps/Hz)
Throughput per cell (Kbps)
Throughput per User (Kbps)
Median of data Tx SINR (dB)
Data Tx averaged SINR (dB)
Total BLER
SIMO 1x2 1900 21 1.36 0.032 13599.72 1359.97 3.274 5.466 0.000698 SU-MIMO 2x2 1900 21 2.255 0.064 22553.72 2255.37 14.05 14.048 0.002896 SU-MIMO 4x2 1900 21 2.466 0.086 24660.62 2466.06 14.831 15.379 0.004404 SIMO 1x2 1900 24 1.36 0.032 13599.77 1359.98 3.274 5.467 0.000698 SU-MIMO 2x2 1900 24 2.255 0.064 22554.28 2255.43 14.085 14.061 0.002923 SU-MIMO 4x2 1900 24 2.466 0.086 24661.11 2466.11 14.831 15.386 0.004704 SIMO 1x2 2600 21 1.449 0.035 14488.66 1448.87 3.9 6.191 0.001257 SU-MIMO 2x2 2600 21 2.326 0.068 23259.75 2325.97 14.785 14.67 0.003253 SU-MIMO 4x2 2600 21 2.527 0.089 25269.76 2526.98 15.202 15.733 0.004961 SIMO 1x2 2600 24 1.449 0.035 14488.77 1448.88 3.9 6.192 0.001257 SU-MIMO 2x2 2600 24 2.326 0.068 23259.48 2325.95 14.735 14.683 0.003269 SU-MIMO 4x2 2600 24 2.527 0.089 25270.56 2527.06 15.181 15.739 0.005029
Table 3–4 Results overview in four cells scenario

24
The CDF of normalised user throughput and SINR obtained using 1900 MHz and a transmission power of 21 dBm is shown in Figure 3-15 and Figure 3-16, respectively.
Figure 3–15 CDF of Normalised User Throughput for dense scenario with 1900 MHz and 21
dBm
Figure 3–16 CDF of SINR for dense scenario with 1900 MHz and 21 dBm
0
10
20
30
40
50
60
70
80
90
100
0 0.2 0.4 0.6 0.8 1
CD
F [%
]
Normalized User Throughput [bps/Hz]
SIMO 1x2
SU-MIMO 2x2
SU-MIMO 4x2
0
10
20
30
40
50
60
70
80
90
100
0 5 10 15 20 25 30
CD
F [%
]
SINR [dB]
SIMO 1x2
SU-MIMO 2x2
SU-MIMO 4x2

25
Considering a bandwidth of 20 MHz, the results obtained for SU-MIMO 2x2 change as follows:
MIMO configuration
Carrier frequency (MHz)
Tx power (dBm)
Cell spectral efficiency (bps/Hz)
Cell edge user spectral efficiency (bps/Hz)
Throughput per cell (Kbps)
Throughput per user (Kbps)
Median of data Tx SINR (dB)
Data Tx averaged SINR (dB)
Total BLER
SU-MIMO 2x2 1900 21 2.24 0.061 44807.04 4480.7 21.707 20.311 0.007441 SU-MIMO 2x2 1900 24 2.24 0.061 44808.87 4480.89 21.714 20.318 0.00792 SU-MIMO 2x2 2600 21 2.324 0.067 46473.99 4647.4 22.459 20.894 0.007745 SU-MIMO 2x2 2600 24 2.324 0.067 46476.5 4647.65 22.48 20.905 0.007826
Table 3–5 SU-MIMO 2x2 results overview in dense scenario with 20 MHz bandwidth.

Report title: Small cell and Wi-Fi coverage study Issue date: 25 February 2014 Version: 063.06.02 26
Figure 3–17 CDF of normalised user throughput for dense scenario with 1900 MHz, 21 dBm
and 20MHz bandwidth
Figure 3–18 CDF of SINR for dense scenario with 1900 MHz, 21 dBm and 20MHz bandwidth
The SINR and throughput distribution along the floor for this dense scenario are represented in Figure 3-19 and Figure 3-20, respectively, using a SU-MIMO 2x2 scheme, 1900 MHz and a transmission power of 21 dBm.
Figure 3–19 Throughput distribution in dense open scenario
Figure 3–20 SINR distribution in dense open scenario
0
10
20
30
40
50
60
70
80
90
100
0 0.2 0.4 0.6 0.8
CD
F [%
]
Normalized User Throughput [bps/Hz]
SU-MIMO 2X2 1900MHz 21dBm
SU-MIMO 2X2 1900MHz 24dBm
SU-MIMO 2X2 2600MHz 21dBm
SU-MIMO 2X2 2600MHz 24dBm
0102030405060708090
100
0 10 20 30
CD
F [%
]
SINR [dB]
SU-MIMO 2X2 1900MHz21dBm
SU-MIMO 2X2 1900MHz24dBm
SU-MIMO 2X2 2600MHz21dBm
SU-MIMO 2X2 2600MHz24dBm

Report title: Small cell and Wi-Fi coverage study Issue date: 25 February 2014 Version: 063.06.02 27
Figure 3–21 Throughput vs Distance 3D graphic for InH dense scenario with SU-MIMO 2x2
Figure 3–22 Throughput vs Distance floor distribution for InH dense scenario with SU-MIMO
2x2

Report title: Small cell and Wi-Fi coverage study Issue date: 25 February 2014 Version: 063.06.02 28
Figure 3–23 Throughput vs Distance 2D graphic for InH dense scenario with SU-MIMO 2x2
Note: The red lines in Figure 3-23 represent the location of the APs.
If the losses caused by the existing walls are considered in the simulations, the throughput and SINR distributions change as follows.
Figure 3–24 Throughput distribution in dense scenario, considering obstacles
Figure 3–25 SINR distribution in dense scenario, considering obstacles

Report title: Small cell and Wi-Fi coverage study Issue date: 25 February 2014 Version: 063.06.02 29
From figures above, it is clearly seen that this dense scenario is determined by high level of interference. In this case, similarly to sparse scenario, the level of interference decreases due to the loss caused by the walls. As a consequence, higher values of spectral efficiency and SINR are obtained, as shown in Figure 3-26 and Figure 3-27.
Figure 3–26 Spectral efficiency obstacles comparison in dense scenario
Figure 3–27 SINR obstacles comparison in dense scenario
In this scenario, a SU-MIMO 4x2 scheme is preferred as well, achieving values around 2.5 bps/Hz with all configurations. Nevertheless, the cell spectral efficiency obtained with SIMO 1x2 is only 1.4 bps/Hz.
0
0.5
1
1.5
2
2.5
3
Cell Spectral Efficiency (bps/Hz) Cell Edge User Spectral Efficiency (bps/Hz)
Spectral Efficiency
Obstacles No Obstacles
0
2
4
6
8
10
12
14
16
18
20
Median of Data Transmission SINR (dB) Data Transmission Averaged SINR (dB)
SINR
Obstacles No Obstacles

Report title: Small cell and Wi-Fi coverage study Issue date: 25 February 2014 Version: 063.06.02 30
3.3 Case 3: Multiple channel deployment
This section provides the simulation results for multi-channel scenario. In this case, cells transmit using different frequencies from each other and, consequently, non-serving cells do not interfere with the serving cell. Table 3:6 shows the simulation results for sparse (two cells) and dense (four cells) multi-channel scenario using a transmission power of 21 dBm, a 20 MHz bandwidth and 2600 MHz carrier frequency.
Number of cells
MIMO configuration
Carrier frequency (MHz)
Tx power (dBm)
Cell spectral efficiency (bps/Hz)
Cell edge user spectral efficiency (bps/Hz)
Throughput per cell (Kbps)
Throughput per user (Kbps)
Median of data Tx SINR (dB)
Data Tx averaged SINR (dB)
Total BLER
2 cells SU-MIMO 2x2 2600 21 6.086 0.566 121722.13 12172.21 28 27.668 0.001105 4 cells SU-MIMO 2x2 2600 21 6.161 0.498 123219.67 12321.97 28 27.907 0.000552
Table 3–6 Results overview in multi-channel scenario.
In this scenario, due to the absence of interference, the results in terms of throughput and SINR are similar to the ones obtained in Scenario 1, as shown in Figure 3-28 and Figure 3-29.

Report title: Small cell and Wi-Fi coverage study Issue date: 25 February 2014 Version: 063.06.02 31
Figure 3–28 CDF of normalised user throughput for multi-channel scenario with two and four cells
Figure 3–29 CDF of SINR for multi-channel scenario with two and four cells
0
10
20
30
40
50
60
70
80
90
100
0.5 0.52 0.54 0.56 0.58 0.6 0.62 0.64
CD
F [%
]
Normalized User Throughput [bps/Hz]
2 cells multi-channel scenario
4 cells multi-channel scenario
0
10
20
30
40
50
60
70
80
90
100
0 5 10 15 20 25 30 35
CD
F [%
]
SINR [dB]
2 cells multi-channel scenario
4 cells multi-channel scenario

Report title: Small cell and Wi-Fi coverage study Issue date: 25 February 2014 Version: 063.06.02 32
4. Wi-Fi small cell simulations and results
For this study, a Wi-Fi system based on IEEE 802.11n standard and a 2x2 MIMO configuration is considered [2]. In addition, two different carrier frequencies were evaluated (2400 MHz and 5000 MHz) with transmission powers set to 21 dBm. A variety of simulations was generated for this analysis, obtaining results of cell and cell edge user spectral efficiency, throughput per cell and user, and SINR measures. 50 seeds per simulation have been used to achieve significant results. Table below summarizes the parameters used in this simulation campaign.
PARAMETER VALUE
Reference standard 802.11n
Antenna configuration 2x2
EVM 2%
Time domain scheduling Round robin
Channel bandwidth 20 MHz
Media access CSMA/CA – no RTS/CTS
Carrier frequency 2.4 GHz, 5 GHz
Channel model IMT-A InH
Thermal noise level -174 dBm/Hz
Wi-Fi Tx power +21 dBm
Users per cell 10
Mobility model Stationary users
Position Uniform per scenario
UE noise figure 7 dB
Simulation time 20 s
Number of seeds 50
Traffic model Full buffer
Transmit opportunity (TxOP) 3 ms
Table 4–1 General simulation parameters for Wi-Fi.
There is no fine scale event-based simulations as the simulations are run using a slotted synchronous mode: all nodes perform 802.11n procedures every transmit opportunity (TxOP). The nodes that gained medium access and can hence transmit packets over the air transmit an aggregated MAC packet data unit (A-MPDU) which is TxOP long. No explicit preamble is modeled for the A-MPDUs: preamble detection required to arbitrate whether a packet burst is received or not is based upon radio conditions.
To make the model more realistic, it has been decided to include a few impairments in the Wi-Fi simulation model: an error vector magnitude of 2% is considered for the transmitter and contention of the media between access points and stations have been modeled with a small UL traffic. In addition, cross-channel interference is modeled assuming the mask in Figure 32 [4], for multiple channel cases.

Report title: Small cell and Wi-Fi coverage study Issue date: 25 February 2014 Version: 063.06.02 33
Figure 4–1 Transmit spectrum mask for 20 MHz 4.
Such spectrum mask is being considered, as the simulations will use IEEE 802.11n as reference standard: with APs respecting the spectrum mask, some level of cross-talk between channels is expected when channels are adjacent in frequency. This has been modeled as follows:
• Adjacent channels: a flat cross-talk of -25 dBr is considered; • Further separated channels: a flat cross-talk of -45 dBr is considered.
Depending on the scenario, either adjacent channels or separated channels interference will be used. The choice will be discussed when describing the scenario. In scenarios with multiple APs, it is assumed that the channel assignment is planned and the channel between two APs using the same channel is modeled as InH with LOS.
4.1 Case 1: Sparse indoor HotSpot – single channel
As explained in Section 2.1, the first scenario evaluated consists of one 120 m x 50 m floor of a building with two APs. Two simulation sets have been run, one using 2400 MHz band and the other using 5000 MHz band, with the two APs sharing the same channel (multiple channel case is in section 4.3). The results are summarized in the Table 10 below.
Metric 2 APs, single channel – sparse enterprise
Frequency band 2.4 GHz 5 GHz Average throughput per STA (Mbps) 4.74 4.64 Average throughput per AP (Mbps) 47.37 46.36 Data transmission averaged SINR (dB) 33.25 32.67 Average PER (%) 2.0 2.2 Cell spectral efficiency (bps/Hz) 2.37 2.32 Cell edge user spectral efficiency (bps/Hz) 0.142 0.137
Table 4–2 Summary of simulation results – sparse enterprise, single channel.
Figure 4-2and Figure 4-3 show the distributions results for SINR and downlink throughput for a single STA, respectively. From the SINR curves, a difference of 6 dBs

Report title: Small cell and Wi-Fi coverage study Issue date: 25 February 2014 Version: 063.06.02 34
can be seen only at the lower percentiles, where the upper bound due to EVM is not affecting the SINR values: this is due to the higher attenuation of the signal at higher frequencies. On the other hand, in terms of downlink throughput there is no significant difference when using 2400 MHz or 5000 MHz with the exception of the very cell edge, where 2400 MHz system offers slightly better performances. In reality it is expected that 2.4 GHz will suffer more than 5GHz from interference due to surrounding APs that are not modelled here.
The downlink station throughput scales with the number of access points in case of co-channel scenarios. This is due to the CSMA contention of the media: the two access points are close enough to hear each other at every transmission and therefore when one transmission is happening, the other access point will back-off according to the 802.11n procedure and the media is time-shared in average between access points.
Figure 4–2 Downlink packet SINR per STA distribution – sparse indoor, single channel.
0 10 20 30 40 50 60 70 800
0.1
0.2
0.3
0.4
0.5
0.6
0.7
0.8
0.9
1
DL Packets SINR per STA [dB]
cdf
2 AP & 20 STAs - 2x2 System - DL Packets SINR per Station distribution
2.4 GHz5 GHz

Report title: Small cell and Wi-Fi coverage study Issue date: 25 February 2014 Version: 063.06.02 35
Figure 4–3 Station downlink throughput distribution – sparse indoor, single channel.
4.2 Case 2: Dense indoor HotSpot – single channel
In this case, the same building layout is assumed and four APs are deployed, as illustrated in section 4.1. Two simulation sets have been run, one using 2400 MHz band and the other using 5000 MHz band, with the two APs sharing the same channel (multiple channel case is in section 4.3). The results are summarized in the Table 4:3 below.
Metric 4 APs, single channel – sparse enterprise
Frequency band 2.4 GHz 5 GHz Average throughput per STA (Mbps) 2.30 2.27 Average throughput per AP (Mbps) 22.97 22.67 Data transmission averaged SINR (dB) 33.06 32.83
Average PER (%) 4.80 4.89 Cell Spectral efficiency (bps/Hz) 1.15 1.13 Cell edge user spectral efficiency (bps/Hz) 0.068 0.064
Table 4–3 Summary of simulation results – dense enterprise, single channel.
Figure 4-4 and Figure 4-5 show the distributions results for SINR and downlink throughput for a single STA, respectively. From the SINR curves, the distribution is very narrow, towards the upper bound (almost all users are in very good RF conditions) for both bands: as due to CSMA channel assessment, only one AP will
0 2 4 6 8 10 12 14 16 18 200
0.1
0.2
0.3
0.4
0.5
0.6
0.7
0.8
0.9
1
DL STA Throughput [Mbps]
cdf
2 AP & 20 STAs - 2x2 System - DL Station Throughput distribution
2.4 GHz5 GHz

Report title: Small cell and Wi-Fi coverage study Issue date: 25 February 2014 Version: 063.06.02 36
transmit at a given time, the SINR is only limited by the noise and EVM and with path loss being concentrated at even smaller values than in the sparse deployment, the curves are narrow. The results is no difference in downlink throughput between 2400 MHz and 5000 MHz bands. In reality it is expected that 2.4 GHz will suffer more than 5GHz from interference due to surrounding APs that are not modelled here.
The downlink station throughput scales with the number of access points in case of co-channel scenarios, so a factor two is visible when comparing with the sparse enterprise deployment and the number of served stations is doubled (i.e. the system capacity is divided by all stations, which are now 40 in total).
In Figure 4-6, the average throughput of the stations is plotted against the distance between station and serving access point, for single channel deployments. As can be seen, the dependency on the distance is very small for both the sparse and dense enterprise scenarios, with the throughput scaling with the number of access points as explained above. The case of single access point is also included, where longer distances and larger path loss variations can be observed – here there is a more visible dependency on the distance when exceeding 25 m, with throughput reduced by ~30% compared to near access point at 50 m distance.
Figure 4–4 Downlink packet SINR per STA distribution – dense indoor, single channel.
0 10 20 30 40 50 60 70 800
0.1
0.2
0.3
0.4
0.5
0.6
0.7
0.8
0.9
1
DL Packets SINR per STA [dB]
cdf
4 AP & 40 STAs - 2x2 System - DL Packets SINR per Station distribution
2.4 GHz5 GHz

Report title: Small cell and Wi-Fi coverage study Issue date: 25 February 2014 Version: 063.06.02 37
Figure 4–5 Station Downlink throughput distribution – dense indoor, single channel.
Figure 4–6 Downlink average throughput as function of the distance between station and AP.
0 2 4 6 8 10 12 14 16 18 200
0.1
0.2
0.3
0.4
0.5
0.6
0.7
0.8
0.9
1
DL STA Throughput [Mbps]
cdf
4 AP & 40 STAs - 2x2 System - DL Station Throughput distribution
2.4 GHz5 GHz
0 5 10 15 20 25 30 35 40 45 502
3
4
5
6
7
8
9
10
11
Distance between STA and serving AP [m]
Ave
rage
STA
thro
ughp
ut [M
bps]
Average STA throughput vs. distance to serving AP - single channel
1 AP2 APs4 APs

Report title: Small cell and Wi-Fi coverage study Issue date: 25 February 2014 Version: 063.06.02 38
4.3 Case 3: Multiple channels deployment
The same simulations presented in section 4.1 and 4.2 have been repeated for multiple channels. Also in this case, two simulation sets have been run, one using 2400 MHz band and a maximum of three channels (the allocated spectrum will not allow for more when considering 20 MHz channels) and the other using 5000 MHz band and a maximum of four channels. The results are summarized in the Table 4:4 below.
Metric 2 APs, two channels – sparse enterprise
4 APs, 3 or 4 channels – dense enterprise
Frequency band 2.4 GHz 5 GHz 2.4 GHz(*) 5 GHz Average throughput per STA (Mbps) 9.67 9.49 7.31 9.73
Average throughput per AP (Mbps) 96.71 94.95 73.10 97.32
Data transmission averaged SINR (dB) 33.66 33.11 33.70 33.68
Average PER (%) 0.03 0.04 0.26 0.02 Cell spectral efficiency (bps/Hz) 4.84 4.74 3.66 4.87
Cell edge user spectral efficiency (bps/Hz) 0.302 0.281 0.174 0.310
Table 4–4 Summary of simulation results – sparse and dense enterprise, multiple channels (*) Note: A maximum of three channels considered available for 2.4 GHz band
Figure 4-7 and Figure 4-8 show the distributions results for SINR and downlink throughput for a single STA and sparse deployment, while Figure 4-9 and Figure 4-10 refer to the case of dense deployment.
From the SINR curves, the distribution is very narrow, towards the upper bound (almost all users are in very good RF conditions) for both bands, with some difference observable for the sparse deployment on the lower percentile, similar to single channel case (in fact, in both cases only one access point at the time transmit on one channel). In case of multiple channels, the throughput does not scale anymore with the number of access points and some difference on the cell edge is visible for sparse deployment. In case of dense deployment, there is a larger difference in throughput for all users, due to the fact that only 3 channels are available in the 2400 MHz band and therefore two access points share the same channel.
In Figure 4-11, the average throughput of the stations is plotted against the distance between station and serving access point, for multiple channel deployments. In this case, the dependency on the distance is very small for both the sparse and dense enterprise scenarios, with the throughput saturating on the high end at increase number of access points is deployment (good coverage) at all distances. Again, the case of single access point is also included, where longer distances and larger path loss variations can be observed.

Report title: Small cell and Wi-Fi coverage study Issue date: 25 February 2014 Version: 063.06.02 39
Figure 4–7 Downlink packet SINR per STA distribution – sparse indoor, two channels.
Figure 4–8 Station downlink throughput distribution – sparse indoor, two channels.
0 10 20 30 40 50 60 70 800
0.1
0.2
0.3
0.4
0.5
0.6
0.7
0.8
0.9
1
DL Packets SINR per STA [dB]
cdf
2 AP & 20 STAs - 2x2 System - DL Packets SINR per Station distribution
2.4 GHz5 GHz
0 2 4 6 8 10 12 14 16 18 200
0.1
0.2
0.3
0.4
0.5
0.6
0.7
0.8
0.9
1
DL STA Throughput [Mbps]
cdf
2 AP & 20 STAs - 2x2 System - DL Station Throughput distribution
2.4 GHz5 GHz

Report title: Small cell and Wi-Fi coverage study Issue date: 25 February 2014 Version: 063.06.02 40
Figure 4–9 Downlink packet SINR per STA distribution – dense indoor, three or four
channels.
Figure 4–10 Station downlink throughput distribution – dense indoor, three or four channels.
0 10 20 30 40 50 60 70 800
0.1
0.2
0.3
0.4
0.5
0.6
0.7
0.8
0.9
1
DL Packets SINR per STA [dB]
cdf
4 AP & 40 STAs - 2x2 System - DL Packets SINR per Station distribution
2.4 GHz5 GHz
0 2 4 6 8 10 12 14 16 18 200
0.1
0.2
0.3
0.4
0.5
0.6
0.7
0.8
0.9
1
DL STA Throughput [Mbps]
cdf
4 AP & 40 STAs - 2x2 System - DL Station Throughput distribution
2.4 GHz5 GHz

Report title: Small cell and Wi-Fi coverage study Issue date: 25 February 2014 Version: 063.06.02 41
Figure 4–11 Downlink average throughput as function of the distance between station and AP.
0 5 10 15 20 25 30 35 40 45 506.5
7
7.5
8
8.5
9
9.5
10
10.5
11
11.5
Distance between STA and serving AP [m]
Ave
rage
STA
thro
ughp
ut [M
bps]
Average STA throughput vs. distance to serving AP - multiple channels
1 AP2 APs4 APs

Report title: Small cell and Wi-Fi coverage study Issue date: 25 February 2014 Version: 063.06.02 42
5. Simulation analysis/observation
The previous two sections describe an attempt to provide user experience data based on simulation for both LTE small cell and Wi-Fi under the same set of assumptions. This is a difficult problem to tackle and the prior sources are few. A direct comparison between the two technologies would not make a lot of senses as the air interface between 3GPP and IEEE 802.11 are different as well as the typical deployment choices in terms of e.g. frequency channels are also different. However, for the sake of illustrating and understanding the different characteristics between LTE and Wi-Fi radio/physical layer, some distinctions will be pointed out below. In fact, a single channel environment for Wi-Fi can provide a view on how Wi-Fi deals with internal interference (external interference are not modelled), when the interference level is quite high as it occurs in reality. On the other hand, LTE multichannel simulations can show the peak efficiency of the technology in that precise scenario, when sufficient channels are available.
Simulation layouts of both technologies are the same based on the indoor references, ITU-R M.2135, 3GPP TR 36.932, 3GPP TR 36.814 and 3GPP TR 36.872, focusing on enterprises in-building of both sparse and dense layout scenarios (two and four APs, respectively).
Sparse Layout
Dense Layout
Simulation parameters are closely followed with carrier frequencies of 1900 and 2600 MHz for LTE and 2400 and 5000 MHz for Wi-Fi. A round-robin scheduler has been considered for both technologies to ease comparison and remove product specific dependencies (typically this is not the case for LTE, where a proportional fair scheduler would be more suitable).

Report title: Small cell and Wi-Fi coverage study Issue date: 25 February 2014 Version: 063.06.02 43
LTE parameters
Wi-Fi parameters
Error vector magnitude (EVM) was included in both simulations to provide the effect of Tx/Rx impairments, with SINR upper bound limitation at 28 dB for LTE and 34 dB for Wi-Fi. Considering multi-terminal media access effect for Wi-Fi, CSM/CA protocol is modeled as close to the real system as possible with some uplink traffic included to stimulate the media access and trigger channel contention with random back-off time. The other common parameters include full buffer, thermal noise level and noise floor, 10 users per AP, 20 MHz bandwidth, MIMO 2x2, 21 dBm Tx power, fixed uniformly distributed users, same enterprise layouts and same indoor propagation model.
A summary of results from the multiple channel and single channel AP simulations is illustrated below. The finding indicated that LTE throughput experience is more favorable than the Wi-Fi’s when considering the same bandwidth and channel restriction in an isolated enterprise model, in both single and multiple channel

Report title: Small cell and Wi-Fi coverage study Issue date: 25 February 2014 Version: 063.06.02 44
deployments. As for the 2.4 GHz Wi-Fi user throughputs are marginally better than the 5 GHz is due to the pure RF propagation properties. In reality, it is expected that the 2.4 GHz will suffer more than 5 GHz due to other external AP interferences (which is not modeled under the taken assumption).
For co-channel, user experience degrades further under dense environment due to increase interference, but a lot of more users can be served. Note that the Wi-Fi throughput for the co-channel case is scaled down with the increasing number of APs due to the CSMA contention—CCA always spots other APs transmission due to low path loss and available capacity is divided among active APs equally and thereafter among the served stations associated with each AP.
Best effort user throughput (Mbps) Power
Wi-Fi, 802.11n MIMO 2x2 LTE MIMO 2x2 2.4 GHz 5 GHz 1900 MHz 2600 MHz
1 AP 21 dBm 8.61 7.79 11.78 11.44
2 APs 21 dBm 4.74 4.64 7.85 7.89
4 APs 21 dBm 2.3 2.27 4.48 4.65
Table 5–1 Single Channel results
For multiple channels, user experience remains high with the number of APs. As for the 2.4 GHz, Wi-Fi throughput started to degrade under multiple channel (in dense layout) is due to the fact that the 2.4 GHz is limited to 3 available channels when using 4 APs as one channel is used all the time and shared between the 2 APs.
Best effort user throughput (Mbps)
Power Wi-Fi, 802.11n LTE SU MIMO 2x2 2.4 GHz 5 GHz 2.6 GHz
2 APs 21 dBm 9.67 9.49 12.17
4 APs 21 dBm 7.31 9.73 12.32
Table 5–2 Multiple channels results
For completeness, LTE throughput under the same isolated enterprise condition and with 10 MHz channel (a possible deployment today) is illustrated below. As expected performance are lower than for 20 MHz channel cases and for multiple channels.
Best effort user throughput (Mbps)
Power LTE 1900 MHz LTE 2600 MHz SU MIMO 2x2 SIMO 1x2 SU MIMO
2x2 SIMO 1x2
1 AP 21 dBm 6 3.34 5.88 3.33
2 APs 21 dBm 3.94 2.43 3.95 2.46
4 APs 21 dBm 2.27 1.35 2.33 1.44
Table 5–3 LTE 10 MHz Results
For a more indicative of what LTE systems do in real world, Table 16 concludes the performance differences between round robin (RR) scheduler and proportional fair (PF) scheduler for LTE (see Appendix C). It is estimated a 23% improvement with PF scheduler performance over RR scheduler under the same channel condition. In this Table, the PF scheduler simulation assumption is based on a non-ideal Channel Quality Indication (CQI); where CQI is used to select modulation coding scheme, transport block size and SINR to particular users.

Report title: Small cell and Wi-Fi coverage study Issue date: 25 February 2014 Version: 063.06.02 45
MIMO configuration Carrier frequency (MHz)
Tx power (dBm)
Cell spectral efficiency (bps/Hz)
Cell edge user spectral efficiency (bps/Hz)
Throughput per cell (Kbps)
Throughput per user (Kbps)
SU-MIMO 2x2, PF Scheduler 1900 21 5.067 0.262 101,350.23 10,135.02
SU-MIMO 2x2, PF Scheduler 2600 21 5.114 0.268 102,288.01 10,228.8
SU-MIMO 2x2, RR Scheduler 1900 21 3.923 0.188 78,467.6 7,846.76
SU-MIMO 2x2, RR Scheduler 2600 21 3.944 0.191 78,889.14 7,888.91
Table 5–4 LTE 20 MHz single channel results in sparse scenario between proportional fair scheduler vs. Round robin scheduler
Other observations made are: • Two simulations were from different contributors. Exact system calibration
would be unrealistic. • Isolated enterprise environment assumption does not consider external
interferences thus the 2.4 GHz Wi-Fi indicated a slight advantage over the 5 GHz Wi-Fi (a noise limited case).
• Due to the assumed isolated enterprise environment, the coverage is enclosed within the ~ 30 m radius and may be sufficient for an indoor deployment with 2 or 4 APs. If high load from external interferers are included, this may not be true – note that in case of Wi-Fi, it is important to point out that spectrum quality is not controlled as in case of LTE and there are in reality several other source of signal, like Bluetooth devices, mobile hotspots, Wi-Fi enabled cameras and other Wi-Fi APs in the vicinity of enterprise operating in the same channel. These will cause performance degradation to the Wi-Fi enterprise network and even worse will make performance unpredictable.
• Wi-Fi systems have limitations in terms of providing seamless mobility even within enterprise - for real time applications such as voice or video telephony this is going to results in noticeable performance degradation
• Simulations are based on the round robin schedulers thus can be considered as the lower bound performance.
• LTE simulation is based on R8 MIMO and not R10, thus does not include adaptive MU and SU MIMO per TTI. It is expected to include R10 or beyond in future work (and include some proprietary run simulation).
• The area-throughput increases nearly linearly up to the number of orthogonal channels for both Wi-Fi and LTE. For both LTE and Wi-Fi once the orthogonal channels have been exhausted interference limits performance, and do so differently for each technology. In case of LTE, the spectral efficiency will be degraded due to drop in raw SINR (geometry), and having a larger number of cells is beneficial. However, in case of Wi-Fi, the particular MAC imposes an additional harder limit to media access in the same channel that roughly corresponds to a factor 1/NAP degradation (only one access point uses the media at any given time).
• In practise, Wi-Fi performance will be improved by the use of IEEE 802.11ac versus IEEE 802.11n in the simulations, 3x3:3 or 4x4:3 antenna configurations, compared with 2x2 in the simulations and the use of 40 and 80 MHz channel bandwidths in the 5GHz band compared with the 20 MHz limit in the simulations
• The two technologies can be integrated /collocated within the enterprise setting and complement each other (offloading data traffic).

Report title: Small cell and Wi-Fi coverage study Issue date: 25 February 2014 Version: 063.06.02 46
6. Conclusion
Currently, there are not many publications available comparing Wi-Fi and LTE based simulations. The task of evaluating the coverage differences between the two technologies provided several insights and their key characteristics (of what to include and not to include in the simulations). The lessons learned will further drive the Small Cell Forum’s work to include the urban study and capacity evaluation.

Report title: Small cell and Wi-Fi coverage study Issue date: 25 February 2014 Version: 063.06.02 47
References
1 Small Cell Forum Release 2 Document 080.02.01- Enterprise Services Leveraging Small Cells: Enhancing the Mobile Enterprise, December 2013 [http://www.scf.io/en/documents/080_-_Enterprise_services_leveraging_small_cells.php]
2 IEEE 802.11-2012 – Wi-Fi Specification 3 3GPP TR 36.932 - Scenarios and requirements for small cell enhancements for E-
UTRA and E-UTRAN (Release 12). Technical Specification Group Radio Access Network, 2013.
4 3GPP TR 36.872 - Small Cell Enhancements for E-UTRA and E-UTRAN Physical Layer Aspects (Release 12). Technical Specification Group Radio Access Network, 2013. Draft.
5 Report ITU-R M.2135-1 - Guidelines for evaluation of radio interface technologies for IMT-Advanced.
6 DONG, W., ZHANG, J., GAO, X., ZHANG, P. and WU, Y. [2007] Cluster Identification and Properties of Outdoor Wideband MIMO Channel. Vehicular Technology Conference, 2007. VTC-2007 Fall. 2007 IEEE 66th, Sept. 30 2007-Oct. 3 2007, p. 829 – 833.
7 FUJII, T. [2003] Path-loss prediction formula in mobile communication -an expansion of “SAKAGAMI” path-loss prediction formula-. Trans. IEICE, Japan, J86-B, 10, p. 2264-2267.
8 FUJII, T. [2004] Delay profile modelling for wideband mobile propagation. Proc. of IEEE 2004 VTC Fall F.
9 GAO, X., ZHANG, J., LIU, G., XU, D., ZHANG, P., LU Y. and DONG, W. [December 2007] Large-Scale Characteristics of 5.25 GHz Based on Wideband MIMO Channel Measurements. Ant. and Wireless Propag. Lett., Vol.6, p. 263-266.
10 KERMOAL, J. P., SCHUMACHER, L., PEDERSEN, K. L., MOGENSEN, P. E. and FREDERIKSEN, F. [2002] A stochastic MIMO radio channel model with experimental validation. IEEE J. Select. Areas in Comm., Vol. 20, 6, p. 1211-1226.
11 LU, Y., ZHANG, J., GAO, X., ZHANG, P. and WU, Y. [2007] Outdoor-Indoor Propagation Characteristics of Peer-to-Peer System at 5.25 GHz. Vehicular Technology Conference, 2007. VTC-2007 Fall. 2007 IEEE 66th, Sept. 30 2007-Oct. 3 2007, p. 869-873.
12 OHTA. Y. and FUJII,T. [2006] Delay Spread Prediction for wideband mobile propagation. Proc. of IEEE 2006 VTC, Montreal.

Report title: Small cell and Wi-Fi coverage study Issue date: 25 February 2014 Version: 063.06.02 48
7. Appendices
7.1 Appendix A - LTE single cell indoor hotspot reference
The same simulations presented in Section 3 have been repeated
For completeness, a reference scenario described in 3 was also chosen for evaluation. The layout of the building remains the same as in Table 7:1, but there is only one LTE small cell in the middle of the hall, at 60 m from both sides of the building.
Figure 7–1 Modified indoor HotSpot scenario, with only one small cell
In these three scenarios, indoor hotspot (InH) channel model was considered for evaluation.
The main characteristic of this second scenario is the absence of interference due to other cells. This leads to better values of SINR and an increase on spectral efficiency, thus throughput. The results obtained in this scenario are summarised in Table 17.
In addition, Figure 7-2 and Figure 7-3 show the normalised user throughput and SINR CDF for all transmission modes, using a carrier frequency of 1900 MHz and a transmission power of 21 dBm.

Report title: Small cell and Wi-Fi coverage study Issue date: 25 February 2014 Version: 063.06.02 49
MIMO configuration
Carrier frequency
Tx Power (dBm)
Cell spectral efficiency (bps/Hz)
Cell edge user spectral efficiency (bps/Hz)
Throughput per cell (Kbps)
Throughput per user (Kbps)
Median of data transmission SINR (dB)
Data Transmission averaged SINR (dB)
Total BLER
SIMO 1x2 1900 21 3.344 0.328 33442.68 3344.27 28 26.599 0.000004 SU-MIMO 2x2 1900 21 5.994 0.465 59939.77 5993.98 28 24.918 0.000145 SU-MIMO 4x2 1900 21 6.143 0.555 61433.69 6143.37 28 25.449 0.000066 SIMO 1x2 1900 24 3.352 0.333 33523.9 3352.39 28 27.159 0.000001 SU-MIMO 2x2 1900 24 6.09 0.526 60901.63 6090.16 28 25.706 0.000143 SU-MIMO 4x2 1900 24 6.196 0.592 61958.05 6195.81 28 26.246 0.000034 SIMO 1x2 2600 21 3.328 0.318 33280.38 3328.04 28 25.945 0.000018 SU-MIMO 2x2 2600 21 5.863 0.397 58627.77 5862.78 28 24.186 0.000388 SU-MIMO 4x2 2600 21 6.048 0.488 60481.18 6048.12 28 24.701 0.000198 SIMO 1x2 2600 24 3.345 0.328 33447.07 3344.71 28 26.657 0.000009 SU-MIMO 2x2 2600 24 5.993 0.467 59925.46 5992.55 28 24.994 0.00025 SU-MIMO 4x2 2600 24 6.134 0.55 61343.94 6134.39 28 25.516 0.000087
Table 7–1 Results overview in single cell scenario

Report title: Small cell and Wi-Fi coverage study Issue date: 25 February 2014 Version: 063.06.02 50
Figure 7–2 CDF of normalised user throughput for single cell scenario with 1900 MHz and 21
dBm
Figure 7–3 CDF of SINR for single cell scenario with 1900 MHz and 21 dBm
While differences in transmission power and carrier frequencies are hardly noticed in the spectral efficiency results of the sparse scenario, in this single cell environment, the spectral efficiency obtained vary for different values of transmission power and frequency. For instance, as shown in Figure 7-4, in the case of SU-MIMO 2x2, the lowest results occur when utilizing a 2600 MHz carrier frequency and transmitting at 21 dBm, while the highest performance is obtained using 1900 MHz and 24 dBm. CDF of normalised user throughput is presented in Figure 7-5.
0
10
20
30
40
50
60
70
80
90
100
0 0.1 0.2 0.3 0.4 0.5 0.6 0.7
CD
F [%
]
Normalized User Throughput [bps/Hz]
SIMO 1x2
SU-MIMO 2x2
SU-MIMO 4x2
0
10
20
30
40
50
60
70
80
90
100
0 5 10 15 20 25 30
CD
F [%
]
SINR [dB]
SIMO 1x2
SU-MIMO 2x2
SU-MIMO 4x2

Report title: Small cell and Wi-Fi coverage study Issue date: 25 February 2014 Version: 063.06.02 51
Figure 7–4 Cell spectral efficiency for different configurations of SU-MIMO 2x2
Figure 7–5 CDF of normalised user throughput for different configurations of SU-MIMO 2x2
5.7
5.75
5.8
5.85
5.9
5.95
6
6.05
6.1
6.15
1900 MHz 21 dBm 1900 MHz 24 dBm 2600 MHz 21 dBm 2600 MHz 24 dBm
Cell Spectral Efficiency (bps/Hz)
0
10
20
30
40
50
60
70
80
90
100
0 0.1 0.2 0.3 0.4 0.5 0.6 0.7
CD
F [%
]
Normalized User Throughput [bps/Hz]
SU-MIMO 2x2 1900MHz 21dBm 1cell
SU-MIMO 2x2 1900MHz 24dBm 1cell
SU-MIMO 2x2 2600MHz 21dBm 1cell
SU-MIMO 2x2 2600MHz 24dBm 1cell

Report title: Small cell and Wi-Fi coverage study Issue date: 25 February 2014 Version: 063.06.02 52
Considering a bandwidth of 20 MHz, the results obtained for SU-MIMO 2x2 change as follows:
MIMO configuration
Carrier frequency (MHz)
Tx Power (dBm)
Cell Spectral efficiency (bps/Hz)
Cell Edge user spectral efficiency (bps/Hz)
Throughput per cell (Kbps)
Throughput per User (Kbps)
Median of data Tx SINR (dB)
Data Tx averaged SINR (dB)
Total BLER
SU-MIMO 2x2 1900 21 5.888 0.394 117764.75 11776.47 28 26.473 0.000107 SU-MIMO 2x2 1900 24 6.024 0.473 120476.99 12047.7 28 26.98 0.000109 SU-MIMO 2x2 2600 21 5.72 0.324 114409.62 11440.96 28 25.945 0.000276 SU-MIMO 2x2 2600 24 5.891 0.399 117817.62 11781.76 28 26.527 0.000196
Table 7–2 SU-MIMO 2x2 results overview in single cell scenario with 20 MHz bandwidth.

Small cell and Wi-Fi coverage study Issue date: 25 February 2014 Version: 063.06.02 53
Figure 7–6 CDF of normalised user throughput for single cell scenario with 1900 MHz, 21
dBm and 20MHz bandwidth
Figure 7–7 CDF of SINR for single cell scenario with 1900 MHz, 21 dBm and 20MHz
bandwidth
The SINR and throughput distribution for this scenario, simulated as an open area, can be seen in Figure 7-8 and Figure 7-9.
Figure 7–8 Throughput distribution for single cell open scenario
0
10
20
30
40
50
60
70
80
90
100
0 0.1 0.2 0.3 0.4 0.5 0.6 0.7
CD
F [%
]
Normalized User Throughput [bps/Hz]
SU-MIMO 2X2 1900MHz 21dBm
SU-MIMO 2X2 1900MHz 24dBm
SU-MIMO 2X2 2600MHz 21dBm
SU-MIMO 2X2 2600MHz 24dBm
0
10
20
30
40
50
60
70
80
90
100
0 5 10 15 20 25 30
CD
F [%
]
SINR [dB]
SU-MIMO 2X2 1900MHz 21dBm
SU-MIMO 2X2 1900MHz 24dBm
SU-MIMO 2X2 2600MHz 21dBm
SU-MIMO 2X2 2600MHz 24dBm

Small cell and Wi-Fi coverage study Issue date: 25 February 2014 Version: 063.06.02 54
Figure 7–9 SINR distribution for single cell open scenario
Figure 7–10 Throughput vs Distance 3D graphic for single cell scenario with SU-MIMO 2x2
Figure 7–11 Throughput vs Distance floor distribution for single cell scenario with SU-MIMO
2x2

Small cell and Wi-Fi coverage study Issue date: 25 February 2014 Version: 063.06.02 55
Figure 7–12 Throughput vs Distance 2D graphic for single cell scenario with SU-MIMO 2x2
If external and internal wall losses are considered, the throughput and SINR distribution are the ones shown in Figure 7-13 and Figure 7-14, respectively. In this case, the attenuation values assumed are the same as in Section 3.1; that is, 6 dB for inner walls and 12 dB for external walls.
Figure 7–13 Throughput distribution for single cell considering obstacles
Figure 7–14 SINR distribution for single cell considering obstacles
In this single cell environment, the distribution of throughput and SINR is uniform along the scenario, due to the absence of interference. In this case, cell spectral efficiency and SINR does not change significantly if the obstacles are considered, as shown in Figure 7-15 and Figure 7-16.

Small cell and Wi-Fi coverage study Issue date: 25 February 2014 Version: 063.06.02 56
Figure 7–15 Spectral Efficiency obstacles comparison in single cell scenario
Figure 7–16 SINR obstacles comparison in single cell scenario
As a summary, SU-MIMO scheme is preferred in this scenario, since its cell spectral efficiency rises to values higher than 6 bps/Hz in all configurations. In addition, the best configuration uses a 1900 MHz carrier frequency and a transmission power of 24 dBm, achieving a cell spectral efficiency of 6.2 bps/Hz. This is due to propagation conditions and the absence of interference.
0
1
2
3
4
5
6
7
Cell Spectral Efficiency (bps/Hz) Cell Edge User Spectral Efficiency (bps/Hz)
Spectral Efficiency
Obstacles No Obstacles
26.6
26.8
27
27.2
27.4
27.6
27.8
28
28.2
Median of Data Transmission SINR (dB) Data Transmission Averaged SINR (dB)
SINR
Obstacles No Obstacles

Small cell and Wi-Fi coverage study Issue date: 25 February 2014 Version: 063.06.02 57
7.2 Appendix B - Wi-Fi single cell indoor hotspot reference
In this Appendix, the same enterprise building is simulated for a single Wi-Fi access point, as reference. Two simulation sets have been run, one using 2400 MHz band and the other using 5000 MHz band and results are summarized in the Table 19 below.
Metric Single AP Frequency band 2.4 GHz 5 GHz Average throughput per STA (Mbps) 8.61 7.79 Average throughput per AP (Mbps) 86.08 77.93 Data transmission averaged SINR (dB) 31.21 28.97 Average PER (%) 0.06 0.07 Cell Spectral efficiency (bps/Hz) 4.30 3.90 Cell edge user spectral efficiency (bps/Hz) 0.165
(*) 0.087
(*)
Table 7–3 Summary of simulation results – single Wi-Fi access point – (*) Note: STA throughput CDF is noisy due to low amount of total users.
Figure 7-17 and Figure 7-18 show the distributions results for SINR and downlink throughput for a single STA, respectively. From the SINR curves, lower values are visible as compared to results in chapter 4 due to large path loss values (coverage is smaller with single AP) and a difference of 6 dBs can be seen at the lower percentiles, where the upper bound due to EVM is not affecting the SINR values.
In terms of downlink throughput, outside the peak rate region and at cell edge, 2.4 GHz band offers about two times more throughput than 5 GHz band, whilst there is no significant difference in the upper range - in reality it is expected that 2.4 GHz will suffer more than 5GHz from interference due to surrounding APs which are not modelled here.
To summarize, in case of single AP, the system is noise limited and the medium is largely available in DL (contention is triggered by small UL traffic modelled), with system capacity divided among served stations.

Small cell and Wi-Fi coverage study Issue date: 25 February 2014 Version: 063.06.02 58
Figure 7–17 Downlink packet SINR per STA distribution – single access point.
Figure 7–18 Station downlink throughput distribution – single access point.
0 10 20 30 40 50 60 70 800
0.1
0.2
0.3
0.4
0.5
0.6
0.7
0.8
0.9
1
DL Packets SINR per STA [dB]
cdf
1 AP & 10 STAs - 2x2 System - DL Packets SINR per Station distribution
2.4 GHz5 GHz
0 2 4 6 8 10 12 14 16 18 200
0.1
0.2
0.3
0.4
0.5
0.6
0.7
0.8
0.9
1
DL STA Throughput [Mbps]
cdf
1 AP & 10 STAs - 2x2 System - DL Station Throughput distribution
2.4 GHz5 GHz

Small cell and Wi-Fi coverage study Issue date: 25 February 2014 Version: 063.06.02 59
7.3 Appendix C - LTE sparse indoor hotspot simulations with proportional fair scheduler
In this Appendix, the same enterprise building is simulated for a sparse InH scenario with two LTE small cells as reference. Two simulation sets have been run, one using both 1900 MHz and 2600 MHz bands and results are summarized in the Table 19 below.
Proportional fair scheduling algorithm gives more resources to those users that have a better channel in terms of SINR, so CQIs are used not only for choosing the modulation and codification Scheme (MCS) and transport block size (TBS), but for giving more resources to those users that have better channels in comparison with worst ones.
Following the previous considerations, this section provides LTE simulation results using a PF scheduler with 20 MHz bandwidth in order to have a way to compare the performance of this scheduler with the Round Robin one used in the previous sections. Figure 7-19 and Figure 7-20 show the results with 8 users per TTI, for several configurations of carrier frequency (1900 and 2600 MHz) and transmission power (21 and 24 dBm).
If we consider a mean 0 and variance 1 error in CQI measurements, the results do not vary significantly, as shown in Figure 7-21 and Figure 7-22.
Figure 7–19 CDF of normalised user throughput in 20 MHz scenario
Figure 7–20 CDF of SINR in 20 MHz scenario
0
10
20
30
40
50
60
70
80
90
100
0 0.2 0.4 0.6 0.8 1 1.2
CD
F [%
]
Normalized User Throughput [bps/Hz]
1900 MHz - 21 dBm
2600 MHz - 21 dBm
1900 MHz - 24 dBm
2600 MHz - 24 dBm
0
10
20
30
40
50
60
70
80
90
100
0 5 10 15 20 25 30 35
CD
F [%
]
SINR [dB]
1900 MHz - 21dBm
2600 MHz - 21 dBm
1900 MHz - 24 dBm
2600 MHz - 24 dBm

Small cell and Wi-Fi coverage study Issue date: 25 February 2014 Version: 063.06.02 60
Figure 7–21 CDF of Normalised user throughput in 20 MHz scenario
Figure 7–22 CDF of SINR in 20 MHz scenario
0
10
20
30
40
50
60
70
80
90
100
0 0.2 0.4 0.6 0.8 1 1.2
CD
F [%
]
Normalized User Throughput [bps/Hz]
1900 MHz - ideal CQI
1900 MHz - non-ideal CQI
2600 MHz - ideal CQI
2600 Mhz - non-ideal CQI
0
10
20
30
40
50
60
70
80
90
100
0 5 10 15 20 25 30 35
CD
F [%
]
SINR [dB]
1900 MHz - ideal CQI
1900 MHz - non-ideal CQI
2600 MHz - ideal CQI
2600 Mhz - non-ideal CQI

Small cell and Wi-Fi coverage study Issue date: 25 February 2014 Version: 063.06.02 61
A summary of these results can be found in Table 7:4.
MIMO configuration Ideal CQI Carrier frequency (MHz)
Tx power (dBm)
Cell spectral efficiency (bps/Hz)
Cell edge user spectral Eff (bps/Hz)
Throughput per cell (Kbps)
Throughput per user (Kbps)
Median of data Tx SINR (dB)
Data Tx averaged SINR (dB)
Total BLER
SU-MIMO 2x2 YES 1900MHz 21 5.065 0.261 101309.5 10130.95 28 27.942 0.000009 SU-MIMO 2x2 NO 1900MHz 21 5.067 0.262 101350.23 10135.02 28 27.941 0.000003 SU-MIMO 2x2 YES 2600MHz 21 5.113 0.267 102273.81 10227.38 28 27.64 0.000018 SU-MIMO 2x2 NO 2600MHz 21 5.114 0.268 102288.01 10228.8 28 27.639 0.000009 SU-MIMO 2x2 YES 1900MHz 24 5.071 0.262 101420.59 10142.06 28 27.956 0.000001 SU-MIMO 2x2 YES 2600MHz 24 5.122 0.269 102439.54 10243.95 28 27.944 0.000008
Table 7–4 Summary of LTE simulations with PF scheduler in a single-channel InH sparse scenario

![Contents€¦ · .063 Inch [1.59mm] O.D. VINL-063 CLMP-063 TFLN-063 or NYLN-063 NYCLMP-063.125 Inch [3.18mm] O.D. VINL-125 CLMP-125 TFLN-125 NYLN-125HW NYCLMP-125 NYCLMP-125HW Pipe](https://static.fdocuments.us/doc/165x107/6008af2d53ec7b6e9042b7c5/contents-063-inch-159mm-od-vinl-063-clmp-063-tfln-063-or-nyln-063-nyclmp-063125.jpg)