
05558080
7
CiNetView - Graphic Interface for Wireless Sensor Network Deployment and Monitoring Ismo Hakala, Timo Hongell, and Jari Luomala University of Jyv¨ askyl¨ a / Kokkola University Consortium Chydenius P.O.Box 567, FI-67701, Kokkola, Finland Email: {ismo.hakala, timo.hongell, jari.luomala}@chydenius.fi Abstract—Reliable communication is crucial for successful deployment of a wireless sensor network. Many environmental factors can affect the performance of radio links, and the deployment of a network without real-time information about link qualities can be a demanding task. This paper describes the CiNetView application that is intended to support the deploy- ment and monitoring of wireless sensor network. CiNetView is based on diagnostic information collected by sensor nodes, and it allows the user to see a graphical presentation of the network topology and to monitor the network diagnostic information in real time. Keywords-visualization; monitoring; diagnostic; deployment; wireless sensor network I. I NTRODUCTION In recent years, study of wireless sensor networks (WSN) has become a rapidly developing research area. Compared to traditional sensing methods, wireless sensor networks technology offers some benefits: wide areas can be covered with inexpensive energy-efficient battery-powered devices, which make long-term monitoring and real time access to measuring data possible. Often its nodes have also a self- configuration ability, which enable quick and easy system deployment. In spite of that, practical experience shows that the deployment of a network can be a demanding task be- cause of the unpredictable radio link. Environmental factors such as buildings, trees, and variable weather conditions affect the performance of the radio link and the reliability of communication also. When the qualities of links are not known, typically the nodes’ position has to be changed many times during the system deployment. Link quality is affected by many factors, which can be di- vided into device’s internal and external factors. The internal factors are caused by imperfections of the device’s hardware or software. Different radio chips do not behave exactly in the same way, and that can alter both the transmitted and the received signal strength [1]. Also, each node has its own radiation pattern that is not uniform, which means that the node’s angular orientation can greatly affect the performance of the radio link [1][2]. In addition to the internal factors, fading, shadowing, multipath propagation, and dynamic environmental factors affect wireless communi- cation and make it difficult to predict the radio performance beforehand. It is well known that soil and other surfaces, as well as dynamic factors such as movements and the presence of people, affect the radio range by emitting signals and causing reflections [3]. Also weather conditions and foliage can considerably interfere with the radio signal propagation, varying the received signal strength [2][4][5]. Link quality can be evaluated by using the Received Sig- nal Strength Indicator (RSSI), which indicates the strength of the radio signal between two nodes at the receiver’s position. In wireless sensor networks, radios typically operate in the 2.4GHz ISM band and are based on the IEEE 802.15.4 standard due to which RSSI value -85dBm is considered to be an acceptable lower bound. Wireless sensor network nodes can store RSSI values, the number of received packets etc., which can be used to evaluate the performance of the radio link and the reliability of communication. The diagnostic data can be stored in one table, the so-called neighbourtable. Based on the nodes’ neighbourtables, we have developed a graphical real-time application, CiNetView, to make wire- less sensor network deployment and monitoring easier. The CiNetView application works also on laptop and thus it can be used where WSN are being installed. The application visualizes, in real time, the nodes’ relative locations as well as shows the links’ quality, which make the WSN deploy- ment much quicker and easier task. Also other diagnostic data like throughput, battery level, synchronization status etc. can be shown in real time. The relative locations of nodes are estimated by using the Multidimensional scaling based algorithm (MDS) [6]. If there exists a map, aerial photo etc. of the deployment area, the nodes’ locations as well as diagnostic data can be visualized on it. This paper describes the CiNetView application. The paper is organized as follows: First, we provide a brief de- scription of some related research: the use of RSSI values for localization and WSN visualization and diagnostic solutions. Section III presents the CiNetView application and neigh- bourtables construction as well as the algorithm used for estimating the nodes’ relative locations. Other functionalities of the application are described in more detail. Finally, some experiences of the use of the application in real wireless sensor network implementations are discussed. 2010 Fourth International Conference on Sensor Technologies and Applications 978-0-7695-4096-2/10 $26.00 © 2010 IEEE DOI 10.1109/SENSORCOMM.2010.65 395
-
Upload
amelinda-arum-widyasari -
Category
Documents
-
view
2 -
download
1
description
WSN
Transcript of 05558080

CiNetView - Graphic Interface for Wireless Sensor Network Deployment andMonitoring
Ismo Hakala, Timo Hongell, and Jari LuomalaUniversity of Jyvaskyla / Kokkola University Consortium Chydenius
P.O.Box 567, FI-67701, Kokkola, FinlandEmail: {ismo.hakala, timo.hongell, jari.luomala}@chydenius.fi
Abstract—Reliable communication is crucial for successfuldeployment of a wireless sensor network. Many environmentalfactors can affect the performance of radio links, and thedeployment of a network without real-time information aboutlink qualities can be a demanding task. This paper describes theCiNetView application that is intended to support the deploy-ment and monitoring of wireless sensor network. CiNetView isbased on diagnostic information collected by sensor nodes, andit allows the user to see a graphical presentation of the networktopology and to monitor the network diagnostic information inreal time.
Keywords-visualization; monitoring; diagnostic; deployment;wireless sensor network
I. INTRODUCTION
In recent years, study of wireless sensor networks (WSN)has become a rapidly developing research area. Comparedto traditional sensing methods, wireless sensor networkstechnology offers some benefits: wide areas can be coveredwith inexpensive energy-efficient battery-powered devices,which make long-term monitoring and real time access tomeasuring data possible. Often its nodes have also a self-configuration ability, which enable quick and easy systemdeployment. In spite of that, practical experience shows thatthe deployment of a network can be a demanding task be-cause of the unpredictable radio link. Environmental factorssuch as buildings, trees, and variable weather conditionsaffect the performance of the radio link and the reliabilityof communication also. When the qualities of links are notknown, typically the nodes’ position has to be changed manytimes during the system deployment.
Link quality is affected by many factors, which can be di-vided into device’s internal and external factors. The internalfactors are caused by imperfections of the device’s hardwareor software. Different radio chips do not behave exactlyin the same way, and that can alter both the transmittedand the received signal strength [1]. Also, each node hasits own radiation pattern that is not uniform, which meansthat the node’s angular orientation can greatly affect theperformance of the radio link [1][2]. In addition to theinternal factors, fading, shadowing, multipath propagation,and dynamic environmental factors affect wireless communi-cation and make it difficult to predict the radio performance
beforehand. It is well known that soil and other surfaces, aswell as dynamic factors such as movements and the presenceof people, affect the radio range by emitting signals andcausing reflections [3]. Also weather conditions and foliagecan considerably interfere with the radio signal propagation,varying the received signal strength [2][4][5].
Link quality can be evaluated by using the Received Sig-nal Strength Indicator (RSSI), which indicates the strength ofthe radio signal between two nodes at the receiver’s position.In wireless sensor networks, radios typically operate in the2.4GHz ISM band and are based on the IEEE 802.15.4standard due to which RSSI value -85dBm is consideredto be an acceptable lower bound. Wireless sensor networknodes can store RSSI values, the number of received packetsetc., which can be used to evaluate the performance ofthe radio link and the reliability of communication. Thediagnostic data can be stored in one table, the so-calledneighbourtable.
Based on the nodes’ neighbourtables, we have developeda graphical real-time application, CiNetView, to make wire-less sensor network deployment and monitoring easier. TheCiNetView application works also on laptop and thus it canbe used where WSN are being installed. The applicationvisualizes, in real time, the nodes’ relative locations as wellas shows the links’ quality, which make the WSN deploy-ment much quicker and easier task. Also other diagnosticdata like throughput, battery level, synchronization statusetc. can be shown in real time. The relative locations ofnodes are estimated by using the Multidimensional scalingbased algorithm (MDS) [6]. If there exists a map, aerialphoto etc. of the deployment area, the nodes’ locations aswell as diagnostic data can be visualized on it.
This paper describes the CiNetView application. Thepaper is organized as follows: First, we provide a brief de-scription of some related research: the use of RSSI values forlocalization and WSN visualization and diagnostic solutions.Section III presents the CiNetView application and neigh-bourtables construction as well as the algorithm used forestimating the nodes’ relative locations. Other functionalitiesof the application are described in more detail. Finally, someexperiences of the use of the application in real wirelesssensor network implementations are discussed.
2010 Fourth International Conference on Sensor Technologies and Applications
978-0-7695-4096-2/10 $26.00 © 2010 IEEE
DOI 10.1109/SENSORCOMM.2010.65
395

II. RELATED WORK
Node localization and analyzing and monitoring of wire-less sensor networks are highly evolving research topicsin the field of wireless technology. However, real-timebased solutions for visualizing network structures and theperformance of wireless communication are not that widelystudied. Visualization of network structures as well asmany other WSN applications can be based on localizationtechniques. An RSSI-based localization methodology canbe implemented without special hardware on many exist-ing devices, and for that reason it is a very flexible andmuch studied methodology for approximating the distancesbetween nodes. The use of RSSI for node localization isstudied, for example, in articles [7][8][9]. Sensor networkdiagnostics and visualization is discussed in [10]. Differentsensor network visualization applications include SpyGlass[11] and MARWIS [12]. These applications do not use real-time ”on the map” visualization of the network, instead theyuse relative locations to visualize the network topology. Alsoreal-time inspections of the changes in the link qualities inboth uplink and downlink direction in the sensor networkused are not that widely discussed. Other commercial net-work visualization and diagnostic applications are, for ex-ample, MOTE-VIEW [13] and Surge View [14], developedby Crossbow Technology.
III. CINETVIEW
The purpose of the CiNetView application is to supportwireless sensor networks’ deployment and monitoring. Thesystem architecture of a typical wireless sensor networkapplication when using the CiNetView is displayed in Figure1. Typically, in our wireless sensor network study cases, weuse the so-called MSSS-topology (multi source, single sink),where the role of a sink node is significant. The measuringdata collected by sensing nodes is forwarded to the sinknode and the sink node forwards the collected data to thedatabase for later use. In addition to that, the sink node keepsthe wireless sensor network’s nodes synchronized.
The sink node starts a synchronization period by broad-casting a synchronization message which each node broad-casts onward. Our protocol for network diagnostic andmanagement utilizes these synchronization messages. Partof management data is included on the synchronizationmessage, and during the synchronization period every nodestores all diagnostic data to a so-called neighbourtable.After the synchronization period, every node sends theirdiagnostic data to the sink, which forwards it into thedatabase. The database may be on a server or on a PC’s harddrive. The neighbourtable’s data is updated during everysynchronization period, so the database includes real-timeinformation about the network’s performance.
Based on the neighbourtables’ data, the structure of thewireless sensor network can be visualized in real time by theCiNetView application. The application allows the user to
Figure 1. The system structure using the CiNetView application.
drag nodes to match their true locations at some backgroundimage such as a map, or it automatically estimates the nodes’relative locations. In the latter case, the application uses theMDS-algorithm to approximate the nodes’ relative locations.The application shows also the diagnostic information aboutthe performance of wireless communication. During everyupdate period, the application inspects the information fromthe database. If the information is changed, meaning thatthere are changes in the network, the application updates itsgraphical presentation and diagnostic data tables to matchthe latest information about the network. CiNetView is de-veloped with Matlab and many operations of the applicationuse Matlab’s basic data reading commands and methods.
A. Neighbourtable
In our test cases we used CiNet nodes [15][16]. CiNet isa research and development platform for the wireless sensornetwork implemented in Kokkola University ConsortiumChydenius. The hardware in the CiNet node is speciallydesigned for WSNs and consists of inexpensive standard off-the-shelf components. The CiNet node includes all the basiccomponents necessary for wireless sensor networks.
In a CiNet network each node constructs and maintains itsown neighbourtable, as defined in Table I, in which the nodestores information about its neighbours, which are the nodesthat it hears. The neighbourtable of each node is updatedin every synchronization period of the network (see Figure2). The sink node broadcasts the synchronization messageisotropically, and every node that hears it broadcasts that
396

Table INODES’ NEIGHBOURTABLE
U16INT u16NbAddr Neighbour addressS8INT s8RSSI Neighbour link RSSI valueU8INT u4Bat:4 Battery level of the neighbourU8INT u4HopCnt:4 Hop count of the neighbourU16INT u16Received Number of received packets from neighbourU16INT u16Missed Number of missed packets from the neighbourS8INT s8AvgRSSI Average RSSI value of the neighbour linkS8INT s8PathRSSI Path RSSI value, the path’s weakest RSSIU8INT u8PrevSeq Previous sequence numberU8INT u8Ntp Link throughputU8INT u8Ptp Path throughputU32INT u32NbLastSeen Last seen time, used to maintain the entry
(not sent in diagnostic data)U8INT u8Status Sync status (not sent in diagnostic data)
Table IIFORMAT OF THE NEIGHBOURTABLE DATA FILE.
Seq No Node ID 1 Neighbour 1 data Neighbour 2 data · · ·Seq No Node ID 2 Neighbour 1 data Neighbour 2 data · · ·
......
......
...Seq No Node ID N Neighbour 1 data Neighbour 2 data · · ·
message onwards through the network during a predefinedtime period. In this way the whole network can be syn-chronized. Before relaying the synchronization message, thenodes update it with their own information. Based on thereceived synchronization messages and the data included inthe synchronization frames, the nodes update their neigh-bourtables. Note that the synchronization messages are heardby all the nodes’ neighbours, including the predecessors,which means that the neighbourtable information can becollected in both directions. To prevent the ping-pong effect,the nodes broadcast the synchronization message only oncein every synchronization period. Continuous synchronizationof the network is vital to ensure valid operation of thenetwork.
After the synchronization period, the nodes send theneighbourtable information to the sink node during the man-agement period. The management frame includes a sectionwhere the neighbourtable information is sent. Diagnosticand other management data is sent (and acknowledged)as a unicast transmission through a selected route to thesink node. The size of one transmitted management framethat includes the neighbourtables is between 50 and 128bytes, depending on the number of node’s neighbours (1to maximum of 7). If retransmissions are not needed, eachmanagement frame is sent once in every synchronizationperiod. A detailed study of the energy cost caused by theneighbourtables is one of our future research topics.
Neighbourtables are specially used for receiving infor-mation for real-time deployment and for monitoring of thewireless sensor network. The information that it containscan also be used to improve the network’s measurement datarouting.
HOP LEVEL
1
MGMT 3
MGMT 3
MGMT 3
SYNC
SYNC
SYNC
ACK
ACK
ACK
HOP LEVEL
2
HOP LEVEL
3SINK
Time
MGMT 1
ACKMGMT 2
ACKMGMT 2
ACKS
ync periodM
anagement data period
Figure 2. Synchronization, management and ACK messages during onesynchronization period.
B. Application
At the moment the CiNetView application requires acomputer that has Matlab installed, but a standalone exe fileis one of our future options. The CiNetView works also on alaptop and can be used at the WSN deployment area. Whenthe computer has the option for wireless internet connection,for example a wireless local area network (WLAN) or ageneral packet radio service (GPRS), the neighbourtableinformation can be downloaded from a network server. Ifno wireless internet connection is available, then the sinknode needs to be connected with an RS-232 serial cable tothe computer to make real-time monitoring possible.
The CiNetView uses the neighbourtable data that is up-dated at every synchronization period of the network. Thedata is stored in its own data file (see Table II), and theCiNetView application uses this data file to visualize thepresent situation of the network. The data file’s updatingperiod can be user defined, but normally the updating periodis the same as the synchronization period. The CiNetView’sgraphical presentation of the network and the diagnostic dataare always based on the latest information. If the data fileis updated, then the application’s view is also updated.
The application visualizes the network topology by show-ing the nodes’ relative locations and the connectivity be-tween the nodes. It also shows diagnostic data of the wirelesscommunication. Most of the displayed information is fromneighbourtables. However, a single node’s neighbourtablecannot include information about the entire network. By
397

using the neighbourtable information of all nodes, theCiNetView can give statistics and diagnostic information onentire network. For example, the application can calculatethroughput between any two nodes in the entire networkand show the values both in uplink and downlink directions.Also for visualizing the structure of the network topology byusing the MDS-algorithm, the application needs data fromall neighbourtables of the network.
1) Multidimensional scaling algorithm (MDS): If anybackground image is not available from the WSN deploy-ment area, then the MDS-algorithm [6] is used to give agraphical presentation of the network structure. A n × nbinary matrix
D =
0 d12 · · · d1(n−1) d1n
d21 0 · · · d2(n−1) d2n
......
. . ....
...d(n−1)1 d(n−1)2 · · · 0 d(n−1)n
dn1 dn2 · · · dn(n−1) 0
is a connectivity matrix, in which an entry dij is equal to1 if there is a single-hop connection from node i to nodej and equal to 0 otherwise. Thus, the number of rows andcolumns in the connectivity matrix are equal to the numberof nodes in wireless sensor network and the matrix’s maindiagonal is zero. Note that the connectivity matrix is notnecessary symmetric, since all connections between nodesare not necessarily bidirectional, i.e., there is a connectionfrom node i to node j but not vice-versa.
From the neighbourtables we can obtain a connectivitymatrix D with all single-hop connections, but the MDS-algorithm needs to know the shortest paths between allnodes, i.e., the shortest multi-hop connections betweennodes. This is a all-pairs shortest-path problem, and we useFloyd-Warshall algorithm [17] to find a solution for it. Afterthat, the matrix D is updated and then converted to a double-centered distance matrix B as follows (Matlab code):
n = length(D);U = ones(size(D));I = eye(size(D));
B = −0.5(I− 1/nU)D. 2(I− 1/nU);
Then the singular value decomposition of the matrix B iscalculated
[U,S,V] = svd(B)
and finally the nodes coordinate matrix X is obtained by
X = VS12 ,
where the first two columns of X include the 2D-coordinates.
An example of the MDS-algorithm’s graphical presenta-tion of the test network is shown in Figure 3. The figureis defined based on the known link connections between
Figure 3. CiNetView’s MDS-algorithm based topology presentation.
the network’s nodes, without knowing the exact locations ofthem.
The MDS-algorithm can also be used to define approx-imated locations for the sensor nodes, based on the RSSIvalues, by using different signal propagation models. Forexample, we use the log-normal shadowing model [18]. Itis defined as [1]
RSSI(d) = PT − PL(d0)− 10η log10
d
d0+Xσ (1)
where, d is the distance between the sender and receivernode, PT is the transmit power, PL(d0) is the path loss atreference distance d0, η is the path loss exponent and Xσ isa gaussian random variable with zero mean and σ2 variance.
We have chosen to use the widely used log-normalshadowing model, since it is more realistic than the free-space model. The free-space model does not consider severalenvironmental parameters that affect to signal propagation,including scattering, wave reflection and diffraction. Thelog-normal model instead takes these into account.
The log-normal shadowing model can be used to evaluateand estimate the distances between the nodes in a wirelessnetwork. This model can be used in different environmentsby modifying the η and Xσ variables. But it must be statedthat because the environmental conditions tend to changeconstantly, it is quite difficult to get distance results thatwould exactly match the true values. Many other differentradio signal propagation models are published, such as [19],but generally all the propagation models are specified forthe exact modelling situations.
2) User interface: There are two different approachesto the graphic presentation of WSNs in the CiNetViewapplication: 1) if the physical locations of the sensor nodesare not exactly known, the application can use the MDS-algorithm to calculate the graphical presentation; 2) if it ispossible to get an aerial photo, cartogram, map or perhapsa blueprint from the network deployment area, it can then
398

be given as a background image to the application. In thatcase, CiNetView displays all the nodes and their links in thenetwork as a list of dots (nodes) and lines (links) on the leftside of the image, from where the nodes can be draggedto match their true locations on the background image. Thelinks update automatically at the same time. The backgroundimage is given as a picture file, for example in a jpg or bmpformat.
CiNetView stores and displays the monitoring startingtime. It also shows the network’s latest updating time. If thelatest update time does not change, it is a clear indicationthat there is something wrong in the network. The linksbetween the nodes can be unidirectional or bidirectional.Unidirectional link means that only one of the two nodeshears another. This is presented with a red dashed line, andthe node that hears another has the RSSI or throughput valuenext to it. When a link is bidirectional, both of the nodes heareach other. This is displayed with a solid blue connectionline, which has diagnostic data on both ends. The applicationdisplays the average RSSI value, neighbour sync throughput,and data throughput tables, which all can be used to analyzethe network’s performance and link qualities. The averageRSSI table shows the average of all the RSSI values thateach of the nodes has heard since turned on. The neighboursync throughput table shows the ratio between received syncpackets and sync packets that should have been heard fromeach of the neighbour nodes. The data throughput tableindicates the ratio of received management packets from thesensor nodes to the sink node and the number of packetsthat should have been sent to the sink node.
The user can select different variables, such as RSSI andthroughput of the nodes, that are displayed individually overthe link lines by the application. This selection allows theuser to see clearly which of the links need maintenance.Depending on the backgrounds colours used, it may some-times be difficult to distinguish the information displayedby the application. For this reason it is also possible tochange the colours of the nodes and selected values shown.Additionally, one of our future work topics is to display userdefined measurement and management data in CiNetView.
C. Experiences and Future Work
The clear advantage of the CiNetView application isits ability to do real-time monitoring and topographicalmodelling of the wireless sensor network already at thedeployment phase. We have used CiNetView in some WSNdeployment cases. Figure 4 depicts the case in which wedeployed a WSN all around the facilities of UniversityConsortium Chydenius. In indoor situations, such as thisone, the nodes may be connected to each other with orwithout line of sight. We noticed that even a small changein node placement or in the surrounding conditions, such asopening and closing a door or people moving in the area,will affect the network’s behaviour. Dynamic environmental
Figure 5. CiNetView’s MDS-algorithm with the log-normal estimationbased topology presentation (zoomed in).
factors affected also the network topology. A node may havea single hop connection to the sink node but some minordistractions may force it to use multihop connection, or vice-versa.
When the network’s behavior and topology could bemonitored in real time during the deployment phase, it madethe network deployment easier and faster, as any unnecessarymoving of the nodes could be significantly reduced. In addi-tion to the advantages of network deployment, another pointin CiNetView’s favour is that it allows the user to performreal time diagnostics in the network after the deployment.
In outdoor situations, the deploying distances between thenodes are usually longer than in indoor and due to this itis not practical to change the nodes’ placements withoutclear indication of the affect. Since CiNetView works also onlaptops, it can be used outdoor as well. Network deploymentcan be seen in real time on a laptop display, which helpsthe user to see when the nodes are placed wisely andlink connections are established. We have used CiNetViewin its early stage during one of our noise measurementexperiments on a marketplace in Kokkola. This gave uspractical information about the application’s performance inheavily loaded network.
CiNetView also has an option to do range-based nodelocalization, using the MDS-algorithm with the log-normalshadowing model. Experiences of this showed that in openareas the model performs relatively well, as can be seen inFigures 5 and 6 of the same network configuration. Whenthese two figures are compared, one can notice that thereare notable similarities in their network topology. Becauseof the used relative coordinates and their inaccuracies, it isnot yet that important to compare the calculated and truelocations of the nodes. The comparison becomes relevantwith absolute coordinates, when the positioning accuracyimproves.
For future work the idea is to combine MDS and real
399
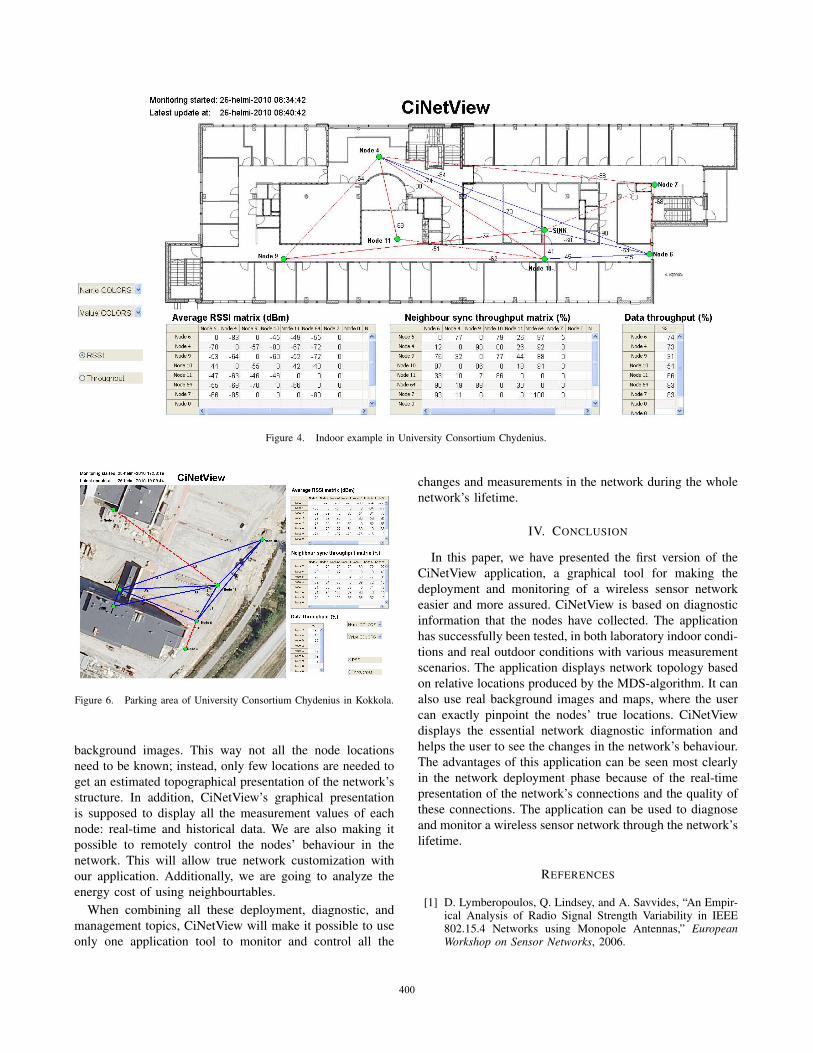
Figure 4. Indoor example in University Consortium Chydenius.
Figure 6. Parking area of University Consortium Chydenius in Kokkola.
background images. This way not all the node locationsneed to be known; instead, only few locations are needed toget an estimated topographical presentation of the network’sstructure. In addition, CiNetView’s graphical presentationis supposed to display all the measurement values of eachnode: real-time and historical data. We are also making itpossible to remotely control the nodes’ behaviour in thenetwork. This will allow true network customization withour application. Additionally, we are going to analyze theenergy cost of using neighbourtables.
When combining all these deployment, diagnostic, andmanagement topics, CiNetView will make it possible to useonly one application tool to monitor and control all the
changes and measurements in the network during the wholenetwork’s lifetime.
IV. CONCLUSION
In this paper, we have presented the first version of theCiNetView application, a graphical tool for making thedeployment and monitoring of a wireless sensor networkeasier and more assured. CiNetView is based on diagnosticinformation that the nodes have collected. The applicationhas successfully been tested, in both laboratory indoor condi-tions and real outdoor conditions with various measurementscenarios. The application displays network topology basedon relative locations produced by the MDS-algorithm. It canalso use real background images and maps, where the usercan exactly pinpoint the nodes’ true locations. CiNetViewdisplays the essential network diagnostic information andhelps the user to see the changes in the network’s behaviour.The advantages of this application can be seen most clearlyin the network deployment phase because of the real-timepresentation of the network’s connections and the quality ofthese connections. The application can be used to diagnoseand monitor a wireless sensor network through the network’slifetime.
REFERENCES
[1] D. Lymberopoulos, Q. Lindsey, and A. Savvides, “An Empir-ical Analysis of Radio Signal Strength Variability in IEEE802.15.4 Networks using Monopole Antennas,” EuropeanWorkshop on Sensor Networks, 2006.
400

[2] I. Hakala, J. Ihalainen, I. Kivela, and M. Tikkakoski, “Eval-uation of Environmental Wireless Sensor Network - CaseFoxhouse,” in International Journal on Advances in Systemand Measurements, submitted for publication, 2010.
[3] Y. Chen, J. Chiang, H. Chu, P. Huang, and A. Tsui, “Sensor-Assisted WI-FI Indoor Location System for Adapting toEnvironmental Dynamics,” in Proceedings of the 8th ACMSymposium on Modeling, Analysis and Simulation of Wirelessand Mobile Systems, Montreal, Quebec, Canada, October 10-13 2005.
[4] J. Thelen, D. Goense, and K. Langendoen, “Radio WavePropagation in Potato Fields,” in Proceedings of the Firstworkshop on Wireless Network Measurements (co-locatedwith WiOpt 2005), Riva del Garda, Italy, April 2005.
[5] M. Hebel, R. Tate, and D. Watson, “Results of WirelessSensor Network Transceiver Testing for Agricultural Appli-cations,” ASABE Paper No. 073077. St.Joseph, Mich.:ASABE,2006.
[6] S. Yi, R. Wheeler, Z. Ying, and M. P. J. Fromherz, “Localiza-tion from Mere Connectivity,” Proceedings of the 4th ACMInternational Symposium on MobileAd Hoc Networking &Computing, pp. 201–212, 2003.
[7] Z. Jianwu and Z. Lu, “Research on Distance MeasurementBased on RSSI of ZigBee,” ISECS International Colloquiumon Computing, Communication, Control, and Management,vol. 3, pp. 210–212, 2009.
[8] E. Elnahrawy, X. Li, and R. P. Martin, “The Limits ofLocalization Using Signal Strength: A Comparative Study,”Sensor and Ad Hoc Communications and Networks, pp. 406–414, 2004.
[9] P. Barsocchi, S. Lenzi, S. Chessa, and G. Giunta, “A NovelApproach to Indoor RSSI Localization by Automatic Calibra-tion of the Wireless Propagation Model,” Vehicular Technol-ogy Conference, pp. 1–5, April 2009.
[10] Y. Hu, D. Li, X. He, T. Sun, and Y. Han, “The Implementationof Wireless Sensor Network Visualization Platform based onWetland Monitoring,” Second International Conference onIntelligent Networks and Intelligent Systems, 2009.
[11] C. Buschmann, D. Pfisterer, S. Fischer, S. P. Fekete, andA. Kroller, “SpyGlass: A Wireless Sensor Network Visual-izer,” 2005.
[12] G. Wagenknecht, M. Anwander, and T. Braun, “MARWIS:A Management Platform for Heterogeneous Wireless SensorNetworks,” ERCIM NEWS, vol. 76, pp. 18–19, January 2009.
[13] M. Turon, “MOTE-VIEW: A Sensor Network Monitoringand Management Tool,” The Second IEEE Workshop onEmbedded Networked Sensors, pp. 11 – 18, 2005.
[14] Wireless Sensor Network: Getting Started Guide, CrossbowTechnology, Inc., Crossbow Technology, Inc. 4145 N. FirstStreet, San Jose, CA 95134, September 2005.
[15] I. Hakala and M. Tikkakoski, “From vertical to horizontalarchitecture: a cross-layer implementation in a sensor networknode,” Proceedings of the first international conference onIntegrated internet ad hoc and sensor networks, vol. 138,no. 6, 2006.
[16] I. Hakala, M. Tikkakoski, and I. Kivela, “Wireless SensorNetwork in Environmental Monitoring - Case Foxhouse,”Second International Conference on Sensor Technologies andApplications, pp. 202–208, August 2008.
[17] R. W. Floyd, “Algorithm 97: Shortest Path,” Communicationsof the ACM, vol. 5, no. 6, p. 345, June 1962.
[18] J. A. Gutirrez, E. H. Callaway Jr., and R. L. Barrett Jr.,Low-Rate Wireless Personal Area Networks Enabling WirelessSensors with IEEE 802.15.4TM . The Institute of Electricaland Electronics Engineers, Inc. 3 Park Avenue, New Yourk,NY 10016-5997, USA: Standards Information Network IEEEPress, November 2003.
[19] W. Feinian and K. Sarabandi, “A Physics-Based StatisticalModel for Wave Propagation Through Foliage,” IEEE Trans-actions on antennas and propagation, vol. 55, no. 3, pp. 958–968, March 2001.
401


