#05 stressedout issuu
76
STRATEGIC CREATIVITY SERIES e Readership in Strategic Creativity at Design Academy Eindhoven Collaborating with: Delft University of Technology, Eindhoven University of Technology, Design Academy Eindhoven, Philips Design In the CRISP project GRIP Mike Thompson Research period April 2011 – May 2012
-
Upload
danielle-arets -
Category
Documents
-
view
213 -
download
0
description
Stress at work may be unhealthy but, also necessary at some level,in order to be agile when required – finding the right balance can differ according to the context and situation. This makes stress a typical topic for Product Service System design – where designers look for a balance between control over the outcome of their work, and flexibility in accommodating a multitude of changing circumstances and contexts. Such designs follow certain principles and are based on models, but have many different (and sometimes unforeseen) outcomes and results. The service model presented in this book is a prime example. Stressed Out? is a project by Mike Thompson, Research Associate at Design Academy Eindhoven, and participant in the GRIP project within CRISP (Creative Industry Scientific Programme).
Transcript of #05 stressedout issuu

Strategic creativity SerieS
The Readership in Strategic Creativityat Design Academy Eindhoven
Collaborating with: Delft University of technology, eindhoven University of technology, Design academy eindhoven, Philips DesignIn the CRISP project GRIP
Mikethompson
Research period April 2011 – May 2012

1
MikeThompson
STRESSEDOUT

2
BurnouT only happens in sick organisaTions,
noT To people who are sick. BurnouT is
noT The proBleM, iT is The syMpToM.

3
BurnouT only happens in sick organisaTions,
noT To people who are sick. BurnouT is
noT The proBleM, iT is The syMpToM.
Maurice de Valk (Intermedic)
4
people possess Their own soluTions,
They jusT need supporT To find TheM.

5
people possess Their own soluTions,
They jusT need supporT To find TheM.
Erik Kuijpers (GGZE)

6

7
Contents
5 Minutes to calm down 9Preface, drs Daniëlle Arets
Servicing stress 11Mike Thompson
Can we fix it? Yes we can! 17Mike Thompson
A decade of personal records 25 A Journey through the Personal Evolution of Quantified Self, Ulrich Atz
Devices for articulate propositions 35Christian Nold
Loosening the GRIP: 41 Students responding to stress Mike Thompson, Ryan Pescatore Frisk and Evelien van De Garde Perik
Getting a GRIP 51Interview with Maurits Martijn (De Correspondent)
A service for all 57Mike Thompson, Dirk Snelders and Evelien van de Garde-Perik
Contributors' biographies 63Glossary 67Colophon 70

8

9
5 Minutes to calm down Preface
Drs Daniëlle Arets
Your adrenaline has reached maximum level – please start your relaxation ex-ercise. In order to do this exercise you need to have a pen, a piece of paper and a stop watch. To register your breathing correctly, please take a relaxed posi-tion and close your eyes. Over the course of two minutes, draw an undulating line on the piece of paper, following the rhythm of your breathing. Breathing in, the wave rises, breathing out, the wave falls...
This exercise was practiced by Evelien van de Garde-Perik, one of the re-searchers in the GRIP project, part of the Creative Industry Scientific Pro-gramme (CRISP). Within CRISP, three Technical Universities, two Amsterdam Universities, Design Academy Eindhoven and over 50 industrial partners, jointly investigate, over the period of 4 year, how designers can play a more strategic role in society and industry. Various experts collaborate, in multi-disciplinary teams, in a total of eight projects, to get a better understanding of designing complex product service systems (PSS). Together with Evelien van de Garde from Eindhoven University of Technology, Luc Geurts, Marie Perez and Helle Ullerup, from Philips Design, and experts from the GGZE Mental Health Service Eindhoven, Mike Thomp-son worked as a Research Associate at Design Academy Eindhoven for one year (2011-2012) in the GRIP project researching the development of a PSS targeting work-related stress. Thompson was specifically interested in the use of data-led technologies in the context of stress and healthcare, and the possible ethical and societal implications occurring when we effectively delegate part of our responsibility for our health to data-led services.
The increased attention to stress reduction should not come as a surprise; stress is, after all, one of the biggest causes of heart problems and mental illnesses in the Western world. At the same time we are seeing a rapid increase of technologies that allow us to measure our physical condition and the many factors that may influence it, such as food and exercise. Smart watches, apps on smartphones and computers, small sensors on our body – all these can pro-vide us with very detailed data on personal conditions, but what exactly does the data tell us? A huge gap exists between data and understanding that cannot
10
be simply bridged by a graph, and even if we do understand the data, how should we respond? If our watch is telling us we are stressed, is that necessar-ily a bad thing? As Thompson explains in this publication, in some situations a bit of stress is needed to be alert and respond accurately. These questions become even harder to answer when we start to look at stress at the workplace. What if employers start measuring their staff, or smart buildings measure the performance of the people working within? Both these things already occur to some extent, but could be taken much further given the technology that is available. Naturally, this calls for a critical reflection on data-led services and that is exactly what Thompson has set out to achieve in this publication. Not only do we need to question what is being measured, who is in control of the data, what the data tells us and what that implies, but more importantly we need to explore what we, as people and as a society, want to do with all these technolo-gies. How can they support and empower us to live the lives we want to lead, as opposed to threatening and undermining our way of life?
Are you getting stressed already? Time to finish your breathing exercise and delve into this book. Enjoy your reading, and remember to breathe normally.

11
Servicing stress
Mike Thompson
We all, inevitably, face some periods of stress in our lives, yet, it is the ability to pinpoint them, and our reactions to such obstacles, that define the short and the long term effects on our health and wellbeing. As it is a very personal mental and emotional response, negative stress (distress) is frequently viewed as an individual problem and a sign of weakness – an association that has led to the view that suffering from stress or burnout is ‘career suicide’. However, to suggest this ignores the positive side of stress (eustress), which allows us to react quickly and decisively to challenges, and gives us a positive sense of ful-filment – something of equally important to our wellbeing. What if stress was not deemed as a unique or individual problem, but rather the symptom of a set of mismanaged circumstances?
A core aim of GRIP is to investigate the issue of flexibility versus control in the design of Product Service Systems (PSS). PSS can be seen as a combination of tangible products and intangible services[1]. Compared to more traditional product design, the design of PSS is characterised by less formalised planning, a greater level of co-creation between stakeholders, and a high level of co-pro-duction by service providers and customers. The implication of this is that the design process for PSS must, by definition, become more flexible, allowing for co-creation by stakeholders, and be more sensitive to the needs and skills of co-producing providers and customers.
It was this perspective – inspired by our conversations with Maurice de Valk of Intermedic, and Erik Kuijpers of the GGZE (Geestelijke Gezondheids Zorg Ein-dhoven – Mental Health Service Eindhoven) – that helped frame the research agenda of GRIP. Here we aspired to use design expertise to give employees the ability to spot symptoms and causes of stress within the workplace, and to empower them to make a positive, collective change. Our concept, unusually, proposed tackling stress from the bottom up, inviting individuals to take an active role in the collection of stress-related data. This collective knowledge could in turn be used to pinpoint challenges and opportunities which allowed individuals to create their own context-based responses.
As we were to discover from our initial conversations with industry professionals, it was frequently assumed that our role as designers would be to

12
merely develop new stress tools for industry. Given that our aim was to inves-tigate the potential for an innovative Product Service System, we were imme-diately forced to ask ourselves what role design might take in this already con-gested field? In even plainer terms, we were confronted with the fundamental question: what value could design possibly bring to this space?
You may have noted the absence so far of the word ‘solution’. The simple rea-son is that I don’t believe there is such a thing as, or need for, a ‘solution’ for stress. As design theorist Michael Dobbins states – solutionism presumes, rather than investigates, the problems that are trying to be solved, reaching “for the answer before the questions have been fully asked”[2]. Simply put, the manner in which a problem is composed, matters every bit as much as how it is resolved. Seen from this perspective, stress is an extremely complex and varied individual mental or emotional response to an equally complex and varied set of circumstances, which can be both beneficial or detrimental to a person’s wellbeing. There is, therefore, no such thing as a one-size-fits-all approach. It would after all, be naïve to presume that what works for a Finance Manager at a New York office would work for an air-traffic-controller at Schiphol airport. Helping employees learn to differentiate between the positive and negative aspects of stress – and gain the abilities to continually assess and manage the borders between the two – lies at the heart of our service concept, and led to the creation of the GRIP Service Model.
In the beginning, this Service Model was conceptualised as a tool to help the GRIP design research team gain a clearer picture of what a data led service may entail – allowing individual partners to foresee where their personal (commercial) focus and design opportunities may lie, and demonstrate to industry where our design expertise would potentially align. The model itself is unusual for a number of reasons, most notably because it positions itself somewhere between the classic user-centred design model and the collabo-rative process of service design. With this framework we could theoretically begin testing the basic service from the outset, using existing technologies such as galvanic skin sensors and heart variability monitors provided by our partners at Philips Design and Eindhoven University of Technology. After much discussion, we felt our knowledge and expertise would be best felt by positioning ourselves in parallel to existing stress-related expertise, compa-nies and services – creating a kind of ‘plug-in’ service that would offer tools for data collection, visualisation and concept development. It was this approach that led to our collaboration with Eric Kuijpers and the GGZE, researching the daily routines and environments of employees working within mental health care, and investigating opportunities for data empowerment.

13
As far as service models go, the GRIP Service Model was unique, as it did not place the classic ‘end-user’ at the centre of the service. Instead, we proposed that this data-led service may in fact, focus upon any of the main stakeholders involved in the field of work-related stress, namely: Stress Experts (e.g. coach-es, psychologists) Technology Providers (e.g. companies developing sensors and monitoring devices) Companies (e.g. Management) and Employees (i.e. end-users). Admittedly, the first time we publicly presented our service con-cept during our workshop at the Service Design Network Conference in San Francisco in November 2011, our GRIP Service Model was perceived by work-shop participants as somewhat counter-intuitive. For this reason, the service model illustrates a slightly unexpected take on the ‘Flexibility Versus Control’ question that defines GRIP. In essence, the model proposes that the way to develop a more flexible role for designers is by developing a service which functions as one complete iterative cycle – a service where data is constantly collected and visualised in a continuous loop in which all four main stakehold-ers are involved. As new concepts emerge, and are then tested and iterated, these new data collection tools and visualisation methods could be absorbed into the GRIP toolkit, offering off-the-shelf instruments that can be adopted and adapted by future customers to suit their specific context, needs and de-sires. Designers are thus continually involved in ongoing iterations to update the GRIP toolkit, rather than to finalise it, keeping the PSS flexible rather than controlling it.
Interestingly, while the model was devised to generate an endless stream of data collection, visualisation, and design tools empowering individuals to tackle stress in the workplace, the focus instead lay on the initial, first phase of the cycle. In fact, as you’ll see throughout this publication, the evidence overwhelmingly suggests that an active approach to data collection, and visualisation by individuals, are positive tools for empowerment and change, and provide a strong platform for any future Product Service System responding to work-related stress.
It could be said that the Service Model was the single most important element created during my 12-month Research Associateship, as it defined a frame-work for what was to come during, and after, my time on the project. It also allowed us to constantly reflect upon and adapt the aims and function of our service its continued importance led to it being the focal point of this publica-tion 2 years after the service model’s conception.
This publication, thus, provides the opportunity to look back on my Research Associateship, and to investigate the potential benefits and flaws of our pro-

14
GRIP. V6
GRIP: JOB-RELATED STRESSCrisp 2011
Design for analysis (Reframing)
Design for research (Probing)
Design for support (Prototyping)
DEFINE DATAPROBE
CO-CREATIONSESSION
IMPLEMENTATION
DATA PROBE:GATHER DATA
VISUALISINGDATA PROBES
PREDESIGNEDTOOLS
PROTOTYPING /DESIGN
PROTOTYPEFEEDBACK
RESEARCH & DEVELOPMENT
SERVICE DESCRIPTION &
MARKETINGESTABLISH CLIENT
COMMITMENT
NETWORKING

15
GRIP. V6
GRIP: JOB-RELATED STRESSCrisp 2011
Design for analysis (Reframing)
Design for research (Probing)
Design for support (Prototyping)
DEFINE DATAPROBE
CO-CREATIONSESSION
IMPLEMENTATION
DATA PROBE:GATHER DATA
VISUALISINGDATA PROBES
PREDESIGNEDTOOLS
PROTOTYPING /DESIGN
PROTOTYPEFEEDBACK
RESEARCH & DEVELOPMENT
SERVICE DESCRIPTION &
MARKETINGESTABLISH CLIENT
COMMITMENT
NETWORKING

16
posed data-led service. Guest contributions from Ulrich Atz (Open Data In-stitute) and designer Christian Nold, discuss the benefits of self monitoring in empowering individuals for change, and generating meaning. We also reflect upon students’ work, conducted in parallel for GRIP at Design Academy Eindhoven and Eindhoven University of Technology, allowing for fresh perspectives and commentary on the proposed service. The interview with investigative journalist Maurits Martijn provides a more critical viewpoint on the moral and societal implications when we effectively delegate responsibility for our health to technology. And finally, drawing upon new insights that have come to light during the writing of the publication, we evaluate what this all means for our data-led service.
references
[1] Tukker, A., & Tischner, U. (2006). Product-services as a research field: past, present and future. Reflections from a decade of research. Journal of Cleaner Production, 14(6): 1552–1556..[2] Dobbins, M. (2009). Design: Design Matters (or There’s No “There” in There). In: Dobbins, M., Urban Design and People. New York: Wiley. pp 182.

17
Can we fix it? Yes we can!
Mike Thompson
GRIP is a collaboration between Philips Design, Eindhoven and Delft Univer-sities of Technology, and Design Academy Eindhoven (with the GGZE - Mental Health Service Eindhoven as external research partner), researching and developing a Product Service System targeting work-related stress. The GRIP project is part of the National Dutch Research Programme, CRISP, that aims to explore a more strategic role for designers. As Research Associate at Design Academy Eindhoven in year one of this project, my primary role was in the area of research and conceptual development. Because of this I would miss the latter stages of prototyping and iterative testing, though the fieldwork generat-ed in this period would contribute greatly to the conceptualisation of the GRIP Service Model and its place within the market.
GRIP kicked off with a Scoping Session, an initial gathering between the pro-ject partners to share existing knowledge and expertise while exploring the topic and discussing possible directions. It was immediately apparent that we urgently needed to connect to industry to gain an understanding of where we, as designers, might offer the greatest value, as well as to expand our knowledge and network. This led to the scheduling of an Expert Day workshop, where stress coaches, psychologists and members of existing occupational health services were invited to explore the topic of work-related stress. While we were aware there are numerous approaches on tackling stress, this event served as a timely reminder as we came face-to-face with professionals championing the merits of breathing, time management, monitoring brainwave activity, general fitness and wellbeing. The workshop also offered a chance to gain feedback on our initial ideas, including concepts for mapping stress in space and time, automated agendas, adaptive environments and the use of the placebo effect to trigger a positive mindset in individuals. Given the broad level of knowledge and expertise present, it was a challenge to establish which of our ideas – if any – interested the experts. This was, in part, as the expectations of “what designers do” i.e. design products or tools for industry, somewhat differ to the aims of GRIP and CRISP at large. It was also true that despite our ideas’ being extremely raw, they were too highly polished and designed for such an ear-ly-stage discussion. Rather than using each idea as a starting point for co-cre-ation as intended, we instead received critique on the merits of each idea. In
18
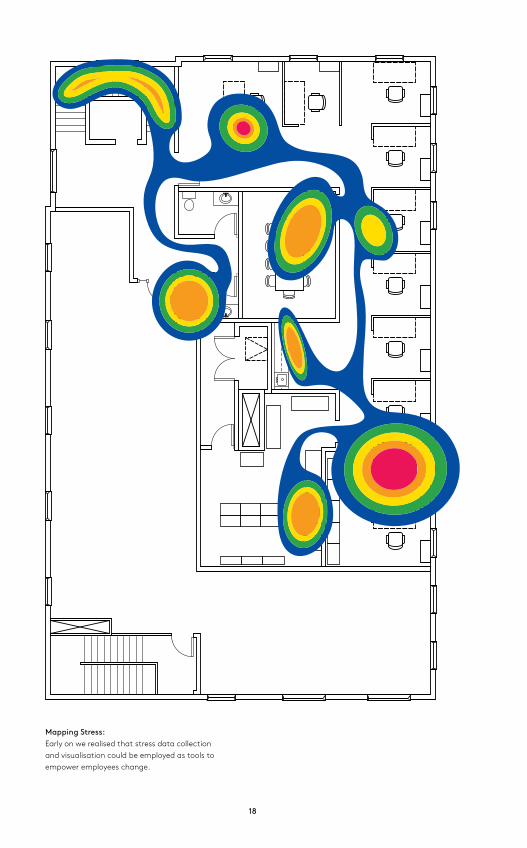
Mapping Stress:Early on we realised that stress data collection and visualisation could be employed as tools to empower employees change.

19
fact, we noticed that the experts tended to gravitate towards ideas proposing new tools for visualising stress.
This perfectly aligned with our own instinct towards using personal data collection and visualisation as tools for raising stress awareness. As both Philips (with their long history in consumer electronics/lifestyle, healthcare and lighting) and Eindhoven University of Technology (TU/e) have access to technologies, including heart rate variability and galvanic skin response, there was great scope for developing new, alternative methods of data collection. Of particular interest to me was an example given by one of the experts, of a crude computer game, in which players were simply required to blow up a balloon. The expert explained that children loved this game because they could ‘feel’ themselves relax while playing. Such an ‘active’ approach to data collection, as opposed to passively wearing a monitoring device, creates a positive feedback loop. This thinking helped form the backbone of our Service Model, developed shortly after the ‘Expert Day’, as a way to understand our position within in-dustry and to begin conceptualising our service.
Kick-started by the Quantified Self Movement, there has been a slowly grow-ing trend towards self-monitoring and diagnosis in healthcare for some years now. What started as a relatively small community of enthusiasts interested in self-knowledge through self-tracking with technology, has spread globally and into the mainstream. A vast number of health and fitness related apps, games and devices already flood the market, most notably the Stress Eraser (Bio Feedback Device), Fit-bit (wireless enabled activity tracker), and Stress Check (App by Azumio). If you believe the hype, the Apple Watch, Apple’s take on the SmartWatch, will single-handedly ignite the market in health and fitness monitoring tools and services. The GRIP Service Model then seems quite timely, as it does not offer technology as an end but, rather, as a means, presenting a contextual framework within which self-monitoring devices could be used to pinpoint moments and causes of stress, and stimulate target-ed responses within the workplace. This last aspect is perhaps most crucial, as it implies the need to analyse and reflect upon the content and context of such data. Put another way, digital technologies may offer a perfect solution to cer-tain problems, but those problems don’t include education, by this I mean, the development of the skills needed to think critically about a given issue[1]. In the context of stress this is doubly important, given the complexity of the issue, and the fact that not all stress is bad.
Due to the complex, overlapping needs of industry stakeholders, it was felt that our service would be best formed by being flexible enough to target any

20
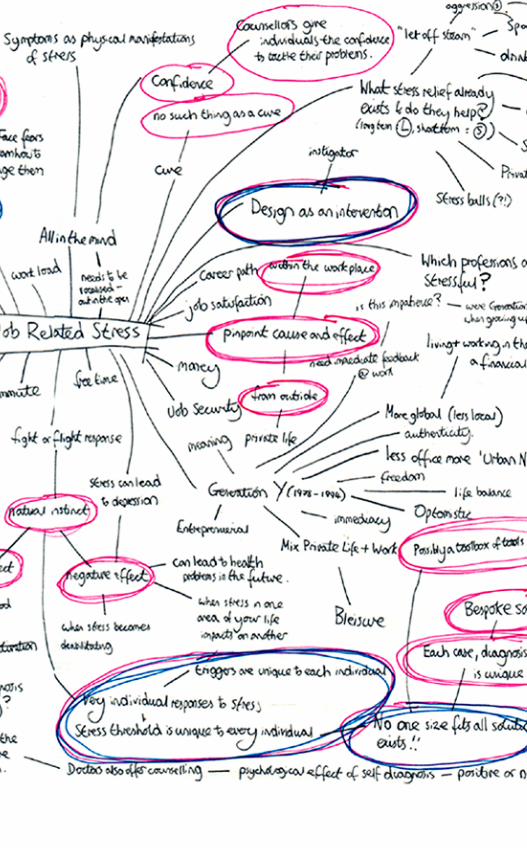
The complexity of stress:Given the complex nature of stress and the stress industry, we were forced to question the added value of design knowledge and expertise.
21

22
of the possible stakeholders, from Stress Experts, Technology Providers and Companies right through to Employees, potentially placing any of them at the core of the service depending on the context at hand. This was quite an unusual but innovative approach, potentially carving out a new (niche) market for design expertise. While we were confident in the platform for our service, we felt it valuable to road-test our service concept with industry profession-als, which led to our workshop at the Global Service Design Network Con-ference in San Francisco, in November 2011. We chose role play as the basis of our workshop – to guide participants through our service model, and to highlight the potential opportunities available to each stakeholder within the industry landscape, as well as to emphasise the potential pitfalls. Considering various data perspectives, such as group versus individual data collection, active versus passive, and public versus private, participants concluded that a data-led service could create new, targeted insights into the stress levels of both individuals and groups within the working environment. Aside from helping to validate our service concept, the workshop highlighted the benefits of role play as a tool for nurturing empathy between partners. Stepping into someone else’s shoes, we learn about, and foresee, opportunities for collab-oration from different perspectives, something that would prove invaluable during design research with our partners at the GGZE in Eindhoven.
Before leaping into a full pilot, we wanted to witness GGZE employees in their daily working environment to pinpoint potential problems or causes of stress that we could further target and monitor. It was therefore agreed we would
The Stress Eraser:One of the health and fitness monitoring devices already on this rapidly increasing market.
23
shadow several employees within the Ambulant Care department. Taking notes, recording video and shooting photos, we scrutinised everything from client meetings and lunch breaks (the lack-of), to how caregivers organise their schedules, or how they break the rules to help their clients. It was important to document literally everything, as any one moment, or cluster of moments, gave valuable insights into the overall culture of stress within the organisa-tion. These insights were compiled into an Experience Flow, presenting the main employee activities, observations and quotes, and whether they were perceived to be positive, negative or neutral. Furthermore, this information was categorised into themes (blue) or activities (red) to pinpoint specific mo-ments that we would later share with our GGZE partners. While it is probably true that a number of our insights had been heard before, the innovative way of presenting these stories encouraged an open dialogue, shedding fresh light on potential causes of stress within the organisation, generating in turn, new, more targeted insights.
It was at this point that my Research Associateship drew to a close, though the groundwork laid over this initial 12 months would later inform the adap-tive relaxation space prototype built and tested by my colleagues from TU/e and Philips Design. Witnessing the fully functioning prototype a year on, it was interesting to see how the service concept had been further interpreted. The adaptive relaxation space was not a ‘data-led’ prototype in the strictest sense, as the calming lights and ambient sounds respond to the position of participants within the room. What it did begin to reveal was that tools re-quiring ‘active’ audience participation are effective in helping people develop a proactive response to the positive and negative signs of stress – creating a physical feedback loop much like the balloon game the children loved so much. This seemed to reflect something that had become increasingly evident throughout my Research Associateship: We had encountered several exam-ples of basic interactions such as breathing (which can be enhanced through drawing) and cueing (training the body to de-stress via a simple action such as making a fist), that could be easily implemented as low-tech tools to positively monitor and alleviate stress. That a proposed ‘data-led service’ may forgo tech-nology altogether is perhaps a radical reflection, but it serves to illustrate the continued importance of the service model in providing the necessary frame-work for analysing and reflecting upon the iterative acts of data collection and visualisation.
reference
[1] Morozov, E. To Save Everything, Click Here. Allen Lane, London, 2013.

24
Quantified Self Gadgets (clockwise from top left):Beddit, Mappiness.org.uk, Jawbone Up, Lumoback, Suunto, Zeo Sleep Manager, and Wakemate.

25
A decade of personal records Ulrich Atz
Measuring your life has entered the mainstream. Emerging new technologies make the tracking of body, mind or environment relatively simple, and an increasing amount of people are enthusiastically embracing the so-called Quantified Self (QS) movement. Ulrich Atz, one of the first members of the London QS community, not only uses gadgets for the sake of tracking, but also in the context of scientific methodology. As the Head of Statistics at the Open Data Institute in London he is looking at the interplay between data, technology and culture, and the ways in which this creates meaning for everyone. He likes to say, “data is a means, not an end”.
introduction
You are the most interesting person. I have not met a single person who isn’t curious to learn something new about themselves. To gather personal data for better behaviours is the essence of the ‘Quantified Self’ (QS). This is not a new movement – people measured their weight and made dietary choices long be-fore it became known as QS.
My aim here is to tell my own journey, so you can more efficiently find what matters to you. If you are already a ‘QS enthusiast’, then I hope to give you new ideas to explore. I want to show that collecting personal data may have unfore-seen reasons, and those reasons may change over time. I will conclude with a look into the future.
Tracking your life was never as easy as it is today because there are now count-less sensors, gadgets and smartphone applications available for data collec-tion. What follows is a personal story, but on occasion I will reflect on QS as a whole. These comments stem from my experience, research and conversations related to the Quantified Self.
The self experiments
The first insight, in the traditional sense, was a confirmation of the way that my happiness depends on people. Seeing this in the data, even though it may seem trivial, convinced me to extend my quantification beyond a short experiment.Most people, including myself, have engaged in some form of QS activity without

26
the label. I can find the earliest signs of QS a decade ago – there are plenty of personal records from 2007 that could be included in a generous definition of data: text documents of weekly retrospectives similar to a diary.*
My first truly quantified data came in the form of spreadsheets. This seems to be a typical starting point for participating in QS. I have seen how tracking with spreadsheets, for example of detailed personal finances, can improve personal consumption patterns. In my case the tangible benefits were minute except for the value of reminiscing. Ironically, the daily summaries (censored in fig. 1) are much more interesting than all the numbers. I experienced that the act of tracking itself, is one of the most powerful aids toward behavioural change.
Figure 1. QS tracking in a large spreadsheet, 2008.
Tracking many measurements on a daily basis looks like a cumbersome task – and it is. In 2009 I learned from the experience and started tracking only one measurement per day, adding a short, qualitative summary. I discontinued this project after six months because the immediate value was not obvious, the mental overhead of remembering every day remained an effort, and I became aware of the exciting new opportunities with smartphones. For many, smart-phones made the holy grail of QS a lot more feasible through an unobtrusive and automatic collection of data.
what is the point?
There are several reasons why people engage in QS: – to be more aware, e.g. tracking sleeping time to reflect on bed hours,– to generate ideas, e.g. what influences my sleep duration, – to test an idea, e.g. does coffee reduce my sleep quality, – to develop an idea, e.g. what is the latest I can drink coffee before it affects my sleep, – to start, change or stop habits, e.g. tracking as a trigger for going to bed earlier.
* Photos, diaries and other unstructured formats arguably become personal data when they are digital and have a timestamp.
27
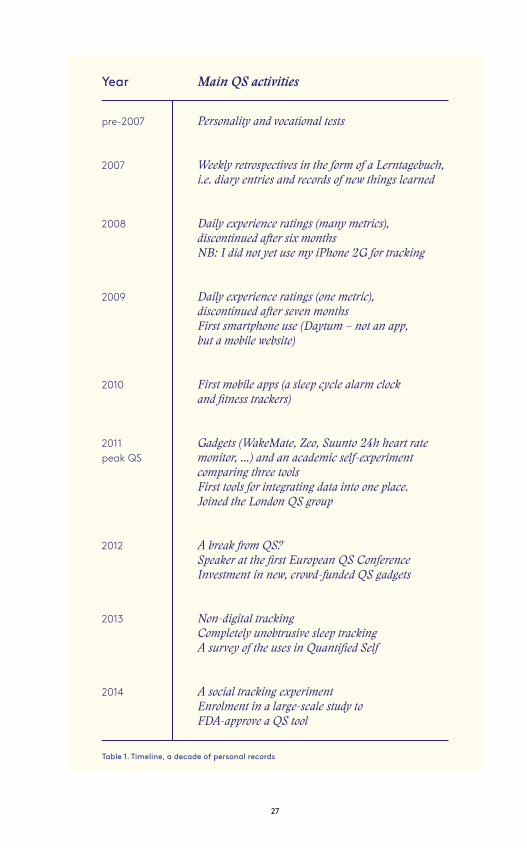
pre-2007 Personali� and voca�onal tests
2007 Weekly re�ospec�ves in the form of a Lerntagebuch, i.e. diary en�ies and records of new things learned
2008 Daily experience ra�ngs (many me�ics), discon�nued a�er six months NB: I did not yet use my iPhone 2G for �acking
2009 Daily experience ra�ngs (one me�ic), discon�nued a�er seven months First smar�hone use (Day�m – not an app, but a mobile website)
2010 First mobile apps (a sleep cycle alarm clock and fi�ess �ackers)
2011 Gadgets (WakeMate, Zeo, Suunto 24h heart rate peak QS monitor, ...) and an academic self-experiment comparing three tools First tools for inte�a�ng data into one place. Joined the London QS �oup
2012 A break �om QS? Speaker at the first European QS Conference Inves�ent in new, crowd-�nded QS gadgets
2013 Non-di�tal �acking Completely unob�usive sleep �acking A survey of the uses in Quan�fied Self
2014 A social �acking experiment Enrolment in a large-scale s�dy to FDA-approve a QS tool
Year Main QS ac�vi�es
Table 1. Timeline, a decade of personal records

28
Sooner or later, data collection ceases to be a goal in itself – what I wanted was better decision making or at least better habits. In 2010 I began using the first mobile apps for, as with most people, health and fitness. They were interesting, but more for their novelty value than their real impact.
In 2011 I joined the newly founded London QS group and my use of tools and gadgets also took off. In an academic project I compared two mobile apps using a scientific diary method and an automatic collection of stress proxy measurements via a 24-hour heart rate monitor.
The results of the study were eventually peer-reviewed in 2012.1 However, with every project it became clearer to me that quantification on its own is not enough. Even in a rigorous self-experiment, where the cycle between data, interpre-tation and improvement is most obvious, I found it hard to justify the effort. The creator of the comic-strip Calvin and Hobbes pinpointed this problem with astonishing foresight in a comic in April 1995! “What’s the point of attaching a number the everything you do?” Hobbes asks, “If your numbers go up, it means you’re having more fun”. More important than the numbers is the con-text. As a consequence, my active tracking cooled off in that year.
Figure 2. Quantified Self gadgets Source: Calvin and Hobbes. 27-04-1995
collecting insightful data is hard
So far, tracking only brought me moments of introspection, as a diary might, and confirmed obvious insights such as ‘exams are stressful’. These sobering experiences led me to invest into new QS tools aimed to record data seam-lessly – more data, less effort! For example, one Finnish startup developed a strip-shaped sensor that lies under the bed sheets and tracks sleep, without requiring any wrist- or headband.

29
Other efforts went into understanding attitudes and needs in the London QS community. We devised a detailed survey and some of the results were surpris-ing – for example, 9 out of 10 people were willing to share personal data with third parties.2 My QS activities, combined with my professional experience with open data, have directly increased my sensitivity concerning the issues surrounding personal data.
In 2013, contrary to all trends, I engaged in non-digital tracking for twelve months. Every day I would cross off one or more daily habits on a single-page calendar, creating a chain of crosses. Rather than analysis and/or introspec-tion, the calendar was a visual daily reminder to keep up with my fitness, health and learning aims. It was simple and surprisingly successful – for example, I learned basic Spanish, a goal that had eluded me with courses and textbooks.
Figure 3. A Year in Review: Non-digital tracking where analysis is not the purpose Source: Ken Snyder.
The latest incarnation of my QS activities embraces social aspects. One is a traditional QS fitness project that I share with several friends – the mutual pro-gress increases motivation and supports staying on track over a long period of time, whilst the tool itself fades into the background. Another one is a large-scale study where the individual’s application of the tool will be evaluated for medical use. Both are arguably a step towards the ‘quantified us’.
The individual evolution of Qs
The interplay between data, technology and personal meaning evolves over time. In figure 3, I have generalised the evolution of my QS activities. It may also work on a micro-level, shown with the example of tracking sleep.

30
Sleep is pivotal for our physical and emotional well-being and therefore track-ing it makes sense. The first records I have are qualitative, unstructured notes concerning my sleep quality, e.g. “woke up early”, “too long” and similar. They were not designed for analysis and I can only describe the purpose as being one of general awareness.
The period which followed involved detailed quantitative entries in a spread-sheet. It continued for some time, but capturing sleep times and quality man-ually requires a lot of effort. It confirmed some facts, but did not create any new learnings.
My solution was, therefore, to use better, more automatic tools and more seemingly objective measurements. This ‘modern’ period led to using so-phisticated sensors that can track movements during sleep, or even brain activity, to find patterns. However, even the most advanced tools require a minimum of administration, e.g. pressing ‘Start’ – a burden outweighing my perceived benefits.
Period Ac�vi� Aim
Proto Uns�uc�red ac�vi�es such as photos, social media and diary en�ies.
Self-discovery, unspecific
Classical Use of gadgets, spreadsheets, un-reflected records, ‘�ack everything’
Generate ideas, experimentation
Modern Con�olled self-experiments, finding insights, �ack of unconven�onal me�ics e.g. glucose, ‘correlate everything’
Test ideas, causal effects
Post-modern Inte�a�ng social aspects, non-di�tal records, �acking for habit forming / self-awareness / interven�on, ‘ques�on everything’
Develop ideas, the quantified us, meta-tracking
Table 2. The individual evolution of QSNote that this is a sketch for an individual over a period of time, not for the community.

31
As a consequence, in the ‘postmodern’ period, I have experimented with track-ing sleep not just on my own, but in parallel with another person, creating so-cial benefits. Further efforts target a good sleep set by employing QS methods for habits that affect sleep, for example, having a routine for going to bed. All of this has improved my sleep quality.
Going through this evolution enables me to make the following recommendations:
Figure 4. Sleep tracking with modern technology
Nightly report via a smartphone app/wristband. I use the numbers for state awareness; e.g. How stressed am I? What is my motivation? Do I feel it’s time to go to bed? The report also links to a coffee tracker for long term analysis.
If you want introspection and learn about yourself
If you want to generate ideas
If you want to test ideas
If you want better sleep quality
Start a daily diary and find a method that suits you. Technolo� can make it simple and remind you.
Masses of data, minimal e�ort. Use tools and data sources that are automa�c and unob�usive. Have low expecta�ons of the e�ec�veness of ‘�acking everything’.
Simplici� is key: isolate �o me�ics, e.g. co�ee consump�on and sleep quali� as outcome variable. Keep everything else constant and vary co�ee consump�on.
Build and maintain habits linked to theory, e.g. a winding-down rou�ne before going to sleep. Use QS to increase mo�va�on and find out what works best for you.
32
The future
The general trends towards more data and more data-driven decisions will bring QS even further into the mainstream. Other barriers, for example data security and privacy, emerge from cultural norms not technological limita-tions. The more insights and integrated tools become available, the more likeli-hood of a future where QS is part of our everyday lives. In the long-term we may end up at the exoself, a digital representation of our-selves.3 Melanie Swan writes, “the individual body becomes a more knowable, calculable, and administrable object through QS activity, and individuals have an increasingly intimate relationship with data as it mediates the experience of reality”. However, without an enormous cultural shift – on the lines of I ♥ data such a future is only possible if quantification leads to an immediate experience of improvement of our lives, at least in some specific parts. In oth-er words: data is a means, not an end.
Did QS change my life? It certainly did, mostly in small ways. Some people with serious illnesses claim QS saved them, but I’m happy with tiny daily im-provements. Many times I’ve reached the limits of quantification and so will you. So remember, that’s okay, because data collection is not the purpose of the experiment – it’s finding out what works for you.
acknowledgments
I wish to thank Tia Pooler and Alex Coutts for helpful comments and the Open Data Institute for continued support.
references
[1] Atz, U. (2013). Evaluating experience sampling of stress in a single-subject research design. Personal and Ubiquitous Computing, 17(4), 639–652. doi:10.1007/s00779-012-0512-7[2] London QS meetup, February 2014. https://github.com/londonqs/qs#february-2014[3] Swan, M. (2013). The Quantified Self: Fundamental Disruption in Big Data Science and Biological Discovery. Big Data, 1(2): 85-99. doi:10.1089/big.2012.0002.

33

34

35
Devices for articulate propositions Christian Nold
One of the central questions of user experience design, is how to build tools and processes for the emotional engagement of users. This text uses the con-cept of propositions as articulated by Whitehead[5] and extended by Latour[2], to describe the importance of tools that sensitise people and allow them to make articulate propositions that would not have been possible without the device. The text examines the Bio Mapping project and proposes a design direction blurring the subjective and objective to create design propositions that are more ‘interesting’ than scientific statements, and have the power to enrol new entities into unfamiliar networks.
articulate propositions vs statements
Latour examines how we talk about smells. He argues that the modernist per-spective has a dualist view of smell that divides between, its “primary qualities – what science sees but that the average human misses”,[2] and its “secondary qualities – that exist only in our minds, imaginations and cultural accounts”[2]. For Latour, this division allows only uninspiring scientific statements to be made about the world that are either true or false, whilst the subjective, emo-tional qualities of experience are “unfortunately of no use to science, since they have no reality, even though they are the stuff out of which dreams and values are made”[3]. To contrast with this view, Latour makes a surprising proposal, which is that in order to sense and experience the world and speak about in an articulate way, we need a body. The bodies that Latour envisions are not only made of flesh and bone but are also technological and institution-al entities that extend and train our existing bodies. For Latour, bodies are de-fined by their ability “to learn to be affected”[2]. Latour gives the example of an odour kit used by trainee perfumers to learn to differentiate a range of smells and to acquire a new body part, ‘a nose’ (a term used to describe a skilled per-fumer). Latour argues that it is the combination of the odour kit the teacher and the training sessions, which together sensitise and articulate the pupil’s perception and, in turn, allow the pupil to state propositions about smells in the world. Latour argues that, in contrast to a reductive scientific statement, which is either true or false, a proposition is either articulate or inarticulate, meaning that the sensory proposition made by a skilled perfumier has more power to engage with others and build new networks. “With statements, one

36
can never compose a world at once solid, interpreted, controversial and mean-ingful. With articulated propositions, this progressive composition of a com-mon world [...] becomes at least thinkable.”[2]
devices for articulating
Moving towards design, there are strong parallels with the Bio Mapping project[4] developed and implemented by the author from 2004–2012, which functions as a tool for sensitising participants to the dynamics of the city. The project first gained prominence through the Locative Media movement in 2004, via long-term participatory workshops in which thousands of people participated. Bio Mapping consists of a workshop methodology as well as a wearable device, which combines a Galvanic Skin Response (GSR) sensor worn on the fingers, a Global Positioning System (GPS) and data storage. Participatory workshops were organised for local people, who were invited to explore their local area whilst wearing the device. On their return, their GSR and GPS data were visualised together as a spiky path projected in Google Earth. The varying heights of the track indicate physiological changes that relate to the wearer’s arousal or affect. With their personal ‘emotion map’, displayed on a projector in a workshop setting, participants took turns to talk about their data in relation to their memory of experiences along the journey.

37
As people described their own tracks, other participants often joined in with their own reflections on the area. All of the tracks and comments were spatially annotated to become part of a collective emotion map of the area, which usu-ally comprised a hundred different people’s experiences and emotions. What was most interesting was the way people’s descriptions tended to blur intimate feelings, events in the physical environment as well as their personal opin-ions about the area. While they were speaking, they were seamlessly blurring subject and object into one powerful cohesive proposition where body and space merged. This presents a new vision of space, which is both relational and material, and where geographical space is the common anchoring point for different people’s propositions. This emotional space would not have become visible or tangible without the Bio Mapping device and the communal work-shop setting. Like Latour’s odour kit, the device co-produced a sensitising and performative setting that allowed the participants to articulate the affective qualities of the environment. For many participants, this blurring of body and space was a totally new way of perceiving the local area, which led to a holistic comprehension, “I now understand an area I didn’t know before, because I have never walked there. I also now understand the place as a whole”.[1] This sense of wholeness captures the way that emotional experiences are not sliced away from the primary qualities of the world but, rather, are intertwined to form a new kind of empiricism that allows articulate propositions to be made about the world. For Latour, ‘interesting’ propositions are ones that create new relationships between people, entities and institutions, which were previously

38
not possible or even thinkable. These unlikely alliances often occurred in the Bio Mapping projects, as in Bethlehem, USA, in 2009, where the local mayor decided to attend every workshop, and be wired up with the Bio Mapping device. He chose to walk through the most politically contested area – the abandoned steel mill that used to be the main employer in the area. The may-or’s map showed his arousal triggered by his childhood experiences of playing near the mill, as well as his desire, in his current role as mayor, to regenerate the area. This story made the local newspaper, and combined with the printed Bethlehem Emotion Map, became a collective proposition based on a hundred people’s experiences about their town. This project and process resulted in a temporary collaboration between the local university, cycling group and local government, and led to a radical proposal to pedestrianise one of the town’s bridges and set up a new community centre. By blurring subjectivity and objectivity in a challenging and new way, a space of emotion became tangible in Bethlehem, and gathered together a network of interested parties around an affective politics of spatial articulation.
implications for further research
Applying Latour’s metaphors to the design of tools is to conceive of devices as sensitising ‘bodies’ which enable or disable people’s sensitivity and ability to make articulate propositions about the world. To make better tools, the researcher, as well as their subjects, needs to go through a mutual process of learning to be affected. To do this requires a commitment on the side of the designer to abandon the goal of creating devices, which produce statements which end discussions. It is by designing for a blurring of mind and matter that a new vision of a shared geographical and emotional space can become tangible and engage new entities. The second challenge involves finding ways to support the further collaboration of these entities that have been brought together by these devices. Left alone, these entities easily resort back to their disciplinary understandings which divide objective from subjective and destroy a shared space of emotion. Further research is thus needed on longer-term methods that can facilitate and manage the ontological and political tensions highlighted by these affective tactics.

39
references
[1] Boraschi, D. Evaluation of the Brentford Biopsy, PhD thesis. Institute of Education, University of London, 2008. Retrieved 15 July, 2014 from www.danielaboraschi.com/boraschi_MA.pdf[2] Latour, B. ‘How to Talk About the Body? the Normative Dimension of Science Studies’, Body & Society 10(2-3)/2004, pp 205–229.[3] Latour, B. What is Given in Experience? A Review of Isabelle Stengers ‘Penser avec Whitehead’, Boundary 2 32(1)/2005, 223–237. [4] Nold, C. (2004). Bio Mapping. Accessed on 7 Jan 2014 at www.biomapping.net [5] Whitehead, A. N. The Concept of Nature. Cambridge University Press, Cambridge, 1920.

40
Chaos vs Stress: Solar Desk (Hannah Vischer, DAE)
41
Loosening the GRIP: Students responding to stress
Mike Thompson, Ryan Pescatore Frisk & Evelien van De Garde-Perik
In addition to its core research activities, CRISP aims to create networks or platforms for sharing and spreading the knowledge generated within the various projects. For both Design Academy Eindhoven (DAE) and Eindhoven University of Technology (TU/e) this presented the opportunity to develop stu-dent projects to facilitate further development of the Service Concept. More importantly, this offered some critical distance from the research, allowing us to road-test the basic data-driven concept in an accelerated manner. Taking a step back, students were encouraged to explore the scope of this latter con-cept, pushing it right to the limits, developing more radical, technocentric, hu-morous, or even moralistic, concepts in response to the theme. Additionally, we could further investigate the pros and cons of collaborative data-collection and visualisation as a strategy. Such an approach enabled us to quickly illus-trate, and more importantly validate, the value that design could bring to this space, while vastly increasing the number of data-collection and visualisation tools at our disposal.
Our own goals aside, we were keen to share our experiences and knowledge, as we felt it could positively inform students on how they might engage within such professional settings. Working in such a concrete, 'live' context, essen-tially gave students the freedom to explore the realm of design research for themselves, reflecting upon the value and meaning for their own professional practice through an iterative process of thinking and making. Student projects carried out at both institutes were developed at slightly different moments of my Research Associateship, and therefore took on slightly differing aims.
changing Behaviour Theme at The department of industrial design at eindhoven university of Technology:
At TU/e, topics for student projects were defined which related to, but some-what differed from, the core of the GRIP project. The idea was that GRIP could become inspired by the student work without being too dependent on their progress or having to fit to the overall project scope. At TU/e, external project partners were involved in the student projects as well. This kept the external partners’ interested in the GRIP project and the potential of design, and

42
allowed students to benefit from their non-design domain expertise. The TU/e students were asked to develop a product or service, which monitored stress in some form and provided feedback accordingly.
Man & communication department at design academy eindhoven:
Often, in the context of design education, the term research is liberally applied to fact-finding, implying everything from reading the newspaper to combing Wikipedia or Google images. Our primary objective in this project was to facilitate an understanding of what can be defined as validated and relevant research. The goal was not to understand research just for research’s sake, or necessarily to make the students into researchers, but to understand how research is conducted, validated and conceptualised within design-thinking, and how such knowledge is able to inform appropriate choices for design and media decisions inherent in contemporary communication practices.
In order to impart this knowledge in an educational context in which the students are also developing individual visions, methodologies, perspectives, and aspirations, it is of the utmost importance that the students develop a re-lationship to research themes within the process of their working methodolo-gies, perspectives, aspirations. This is not to say that we do not challenge their conceptual or operational dogma but, rather, we use the inertia of research to motivate a focused attention to their design efforts. An advantage, in this educational context, is that by working with the students repeatedly over a number of classes, research methodology can be introduced through a pro-cess akin to participatory design. In order to facilitate this we actively employ what ethnomethodology calls a fluid ontological approach[2]. In this case, the research themes and methods are introduced into each individual student’s working process as an ongoing investigation into their influence, utility and overall form. As students incorporate research methodology into their own modes of operation, they are engaging in the process of ‘making sense’ of re-search methods and data. As long as the investigation includes actual research methodology, which can be validated, and is relevant, students are more likely to benefit from the knowledge if they can situate it within their own working process, as opposed to understanding research as an externally applied struc-ture or a shallow collection. By incorporating research into the production of social objects – here primarily objects of communication – the students gain “an enhanced understanding of their contribution as process-oriented facili-tators of knowledge, rather than product-oriented information engineers”.[1]
The CRISP project offered the opportunity to observe a social phenomenon,
43
specifically, one that penetrates the lives of all individuals, albeit in very differ-ent forms. We asked the students to rediscover and redefine their idea of what stress was, looked like or felt like and: a) develop a position, perspective or understanding of what stress is as a social or individual object in the practice of life-living, b) identify indicators and methodology to measure the proposed data, c) develop sites which could serve as points of intervention, to augment social behaviour or perception, and d) conceive, develop and produce the means to communicate the concept.
Reflection:
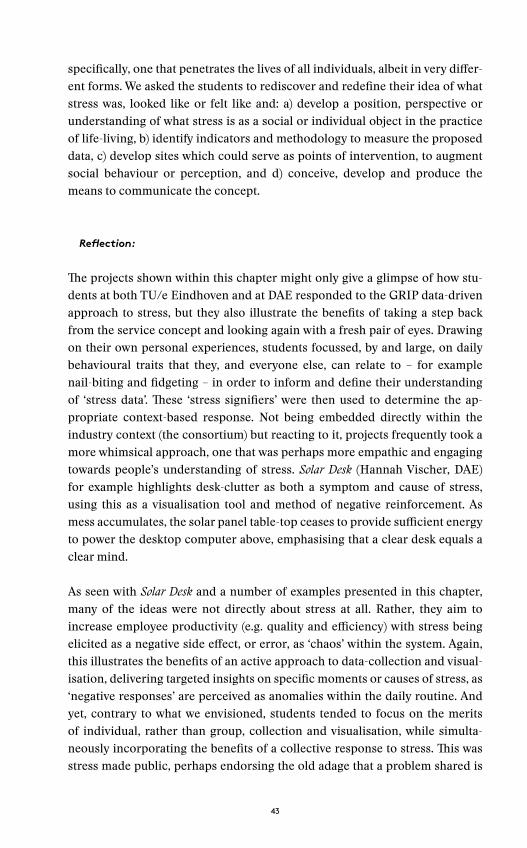
The projects shown within this chapter might only give a glimpse of how stu-dents at both TU/e Eindhoven and at DAE responded to the GRIP data-driven approach to stress, but they also illustrate the benefits of taking a step back from the service concept and looking again with a fresh pair of eyes. Drawing on their own personal experiences, students focussed, by and large, on daily behavioural traits that they, and everyone else, can relate to – for example nail-biting and fidgeting – in order to inform and define their understanding of ‘stress data’. These ‘stress signifiers’ were then used to determine the ap-propriate context-based response. Not being embedded directly within the industry context (the consortium) but reacting to it, projects frequently took a more whimsical approach, one that was perhaps more empathic and engaging towards people’s understanding of stress. Solar Desk (Hannah Vischer, DAE) for example highlights desk-clutter as both a symptom and cause of stress, using this as a visualisation tool and method of negative reinforcement. As mess accumulates, the solar panel table-top ceases to provide sufficient energy to power the desktop computer above, emphasising that a clear desk equals a clear mind.
As seen with Solar Desk and a number of examples presented in this chapter, many of the ideas were not directly about stress at all. Rather, they aim to increase employee productivity (e.g. quality and efficiency) with stress being elicited as a negative side effect, or error, as ‘chaos’ within the system. Again, this illustrates the benefits of an active approach to data-collection and visual-isation, delivering targeted insights on specific moments or causes of stress, as ‘negative responses’ are perceived as anomalies within the daily routine. And yet, contrary to what we envisioned, students tended to focus on the merits of individual, rather than group, collection and visualisation, while simulta-neously incorporating the benefits of a collective response to stress. This was stress made public, perhaps endorsing the old adage that a problem shared is

44
Little Devil(Rhys Duindam, TU/e)
ReSeat (Matthijs Kwak,TU/e)

45
Beauty of Stress (Fabienne van Leiden & Jasper Schenk, TU/e)
46
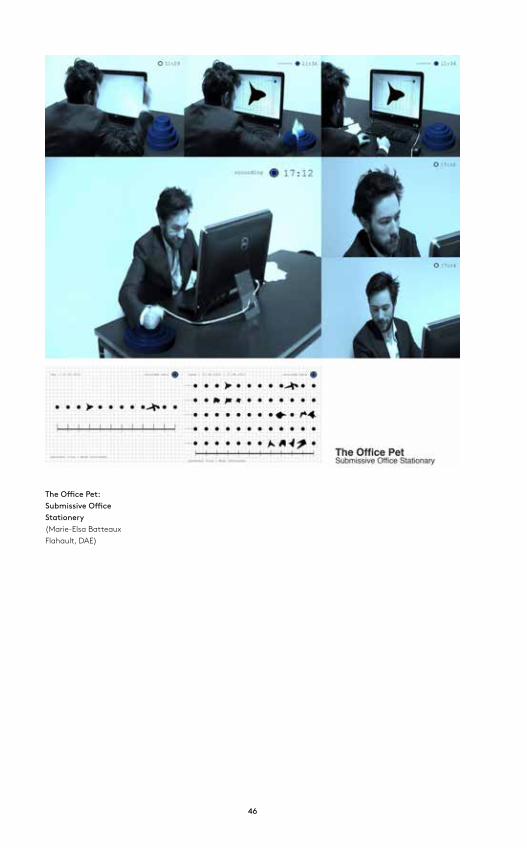
The Office Pet: Submissive Office Stationery (Marie-Elsa Batteaux Flahault, DAE)

47
Typing Stress (Nacor Martina, DAE)
Nacor Martina proposes using products and tools used in our daily work to gather and visualise data on behavioural changes caused by stress. Typing Stress uses the key strokes on an office computer to reveal how stress influences the making of a typed document. Recording both the pressure applied and the sound generated, and paying particular attention to the backspace key, data is continuously gathered and compared with the past to see if your stress levels are better or worse. The tool is thus a way to visualise the effects of stress and pinpoint stressful periods of time.

48
a problem halved. No project better illustrates this than Beauty of Stress by Fa-bienne van Leiden and Jasper Schenk (TU/e). Van Leiden and Schenk propose abstract data-visualisations, derived from group data, and generated via an elaborate system of coloured ink droplets in water, as a tool to stimulate em-ployees to openly discuss stress in the workplace. Of course, it is equally possi-ble that they choose to ignore the signs, and yet it is suggested that the amalga-mation of data be persuasive enough to motivate groups to act. This is, in many respects, an open proposal, leaving the response free to interpretation, similar to the manner in which Christian Nold's work, in his own words, “abandons the goal of creating devices which produce statements that end discussions”, to instead, steer the subject towards “a process of learning to be affected.”[3] This concept though, contrasts with many of the other student projects where a more in-your-face approach was taken.
Refreshingly, students responded to the service concept from a slightly more tongue-in-cheek perspective, bringing a moralistic, even humorous approach. This is visible in the form of feedback loops, responding to recorded signals of stress via positive or negative reinforcement of the causes and effects. There is, after all, a lesson to be learned. For example, Office Pet (Marie-Elsa Batteaux Flahault, DAE) promotes physical aggression, hitting Office Stationery as a means of targeted data collection and stress release. Workers are thus made aware of the effects of stress, acknowledging their emotions while actively highlighting key moments of anxiety. Similarly, the Reseat chair (Matthijs Kwak, TU/e), adjusts itself, and subsequently your posture, based on your mood and behaviour, serving to alleviate or even reinforce stress by making the individual aware that they are illustrating the classic symptoms. Both these examples, as with many of the student projects, aim to educate individuals, by amplifying and visualising behavioural symptoms as a means to illicit change. Individual responses are thus made public, essentially using employees as ‘sensors’ to unearth stress within the workplace, while urging the entire work-force to take responsibility. Little Devil (Rhys Duindam, TU/e) is perhaps the most explicit example of this. The hyperventilating paper bag warns the office worker that it may be time for a break, expanding and increasing in volume the longer the period of work and rise in stress levels. Continually ignoring Little Devil only serves to make its response more extreme, drawing attention from your co-workers, and ultimately stopping everyone from working.
Most crucially though, the student projects serve to illustrate the potential of the data-driven service concept, in delivering proposals that both monitor causes and symptoms of stress, and actively respond to stress in the workplace via public participation. These are concepts that place human behaviour at the

49
centre, using technology to accentuate the visible signs of stress and generate empathy with co-workers. Stress, in this sense, is no longer seen as a negative entity in itself, but as a symptom of an unfavourable set of circumstances and a catalyst for change. This is stress shared, with each and every employee having their own role to play in detecting, treating and preventing stress as an illness within their organisation.
references
[1] Albrechtsen, H., & Jacob, E. The role of classificatory structures as boundary objects in information ecologies. In W. Mustafa- Elhadi & S. Pollitt (Eds.), Proceedings of the Fifth International ISKO Conference. Frankfurt, Germany, 1988. Ergon Verlag, pp 30–36.[2] Srinivasan, Ramesh. Ethnomethodological architectures: Information systems in Journal of the American Society for Information Science, 58/2007, 723–733.[3] Nold, C. (2014). Devices for Articulate Propositions. In: Thompson, M., Raijmakers B. and Arets D. Stressed Out: Reflecting on GRIP. Eindhoven: Design Academy Eindhoven. pp 38.

50

51
Getting a GRIP
Interview with Maurits Martijn (De Correspondent)
Maurits Martijn writes about technology, surveillance, privacy and unneces-sary secrecy for De Correspondent. In June 2014 he was joint recipient, together with his colleague Dimitri Tokmetzis, of the award for best internet journal-ism, VOJN, for their series on digital personal data. In this interview with Maurits, I asked him to reflect critically on the implications of the predicted shift towards self-monitoring within healthcare, and the moral and societal implications of making choices whereby we effectively delegate responsibility for our health, to technology.
Mike Thompson (MT): There’s been much talk about the Quantified Self movement and Apple’s impending entry into the healthcare market, with their Smart-watch and Health app, which is expected to kick-start a boom in mainstream self-diagnosis and monitoring. In the face of this prediction, what challenges do you foresee?
Maurits Martijn (MM): There are obvious privacy issues. If you look at existing apps, apps that monitor the way you walk or run, you see that behind most of these apps there are commercial companies storing data. This means that companies such as Apple, with plans to conquer the healthcare market, will cultivate a lot of very intimate, personal data. One can never tell exactly what such a company will end up doing with your data. In the short term perhaps you can know, because that can be found in their privacy policies, but if you look at the history of privacy with large companies and the way they handle data, it is subject to changes over time.
MT: One of the things I’ve become aware of, is that the use of these techno-logies leads to a kind of merging of experiential and biometric data, whereby such data is more publicly available and becomes shared with other networks through other media including social media. Given the sheer volume of this data, the levels of translation and presentation, how can we determine degrees of truth, reliability and meaning?
MM: An important point is who defines what truth is, or defines what is reliable or meaningful? Take the trend in self-monitoring – is it possible to have fixed ideas on what is healthy, or what is good? Insurance companies predict that

52
in the near future, the insurance premium people pay will depend on their lifestyle and that this will be determined through their personal data. That’s something I’m very concerned about – because who makes the decisions about what is considered healthy? I don’t think that this is something that society unanimously agrees on – it’s more a philosophical kind of question. If insur-ance companies decide what we are to pay, based on the way we live, we will live in a society driven by risk minimalisation. That really scares me because it’s people that take risks who form society and engender progress.
MT: There’s a definition of health from 1948 by the World Health Organisation, that says health is “a state of complete physical, mental, and social well-being and not merely the absence of disease, or infirmity”.
MM: I think that’s a great definition because it captures the notion that there is no such thing as an objective rule or measure for health. The problem with measuring health by quantities of data is that you try to set norms, whereas in fact, health is something subjective. You might be a complete fitness freak and that qualifies as healthy for you, but healthy for me might be smoking every night and contemplating the meaning of life.
MT: As these technologies evolve, our bodies potentially become platforms for exploitation because, as you say, the definition of health is open to interpreta-tion. Do you think there is a need for greater responsibility from individuals concerning their personal data?
MM: In theory that’s a great idea, but in practice it’s impossible because the technological infrastructure we have at present, means that one would have to be a die-hard hacker or skilled professional to know how to take responsibility for your personal data. Most of the technologies we use are not in our own hands – most of the companies building the products we use are in the US, which means that our data is subject to US law – this situation makes it impos-sible to take greater responsibility. The same is true for apps, smartphones, and smartmeters. So, until we start building our own technologies and have our own servers at home, I doubt that it will be possible to take that responsibility into our own hands.
MT: What you’re alluding to here, is that data itself is more or less without bor-ders, but that legislation and laws are not, because what applies in one country doesn’t necessarily apply in another.
MM: Exactly, and even if those companies were in the Netherlands, you are not

53
the person that is accountable in the end. The data is owned, and the techno-logy patented by, the company.
MT: In June 2010, 23andMe, an analysis company for personal genomics and DNA, revealed that a lab mix-up had resulted in as many as 96 of their cus-tomers receiving incorrect data. One of the reasons attention had been called to the mix-up was because a customer (a ‘self tracker’), noticed distressing anomalies in their data. Perhaps this illustrates that we already need to take responsibility for our biometric data, and this is even before such technologies go mainstream. What do you think we can learn from this example, in terms of how we effectively delegate responsibility for our health to technology?
MM: We should learn to not delegate responsibility for our health to technology. Sorry, I’m really pessimistic about this and especially about 23andMe and such other initiatives. I heard about that mix-up, and I also heard, though I don’t know if it was 23andMe or a similar company, that their servers were hacked. It shows once again that when you delegate to another party, your very intimate data – DNA being the most intimate data there is – becomes part of a chain that is only as strong as its weakest link. I think it’s really ridiculous to give your DNA to a commercial company. If I give my DNA to 23andMe and they tell me I have a 10-50% chance of getting Alzheimer’s before the age of 80, what can I do with that information? There is a huge chance that it won’t happen, but the information will change my behaviour and I don’t know that it will change my behaviour for the good. Maybe I won’t have those nice evenings drinking beer with my friends because of the conclusions some company I never met, has deducted from analysing my DNA. DNA research isn’t that sophisticated yet.
MT: This poses the question, how do we educate individuals to gain a sense of… I wrote here ownership and accountability for their data, but I think it’s more than that actually... How are we going to educate people to gain a sense of perspective?
MM: I think there’s a role cut out for journalists in following these trends criti-cally, testing all the claims, and writing about the possible knock-on effects. As far as 23andMe, all the healthcare apps, and the big data healthcare initiatives are concerned, I think that regulation could be useful. In my opinion health-care should be for the public good. That doesn’t mean that the state should control all healthcare but that the government is in charge of the way health-care business is run and that rules and regulations should apply.
MT: There has been talk, in the Netherlands and the UK, of health services

54
selling off patient records, in particular to insurance companies, for research. Traditionally a code of ethics existed, that patients’ records are kept private, but this policy is being challenged. How can individuals grasp the value of, and critically engage with, personal health data, when it is so context-dependent and seemingly ambiguous?
MM: One of the trends I like, is the idea of playing with, and obscuring, your data. There are some people that give away false data or signs to mess with the system. It’s not an absurd thought that within 10 years it will be perfectly nor-mal for us to monitor all of our personal health data, but we may not actually have the time to critically engage with it or to become involved with the tech-nologies used. I’m kind of pessimistic about this.
MT: Does that suggest that we need more people to try and test the system…
MM: Yes, there could be a role there for journalists or artists, or the early adop-ters of the technology or people from the hackers’ scene. Some initiatives are already happening.
MT: I see this as a kind of probing to discover what the meaning of this data actually is or could be. When we are given a new app or piece of technology we are told to use it because A = B, not because A = C or D or all of these things si-multaneously. I see possibilities in testing the limits of the technology in order to understand where its value might really lie, instead of simply taking what we are told at face value.
MM: Exactly.
MT: Currently there’s a lot being written about ‘The Right To Be Forgotten’. In May 2014, the European Court of Justice ruled that, in some circumstances – notably, where personal information online is inaccurate, inadequate, irrel-evant, or excessive in relation to data-processing purposes – links should be removed from Google’s search index. What parallels or lessons can de drawn from The Right to be Forgotten ruling in relation to the subject of healthcare, and how we might apply them in the area of health monitoring?
MM: In theory The Right to be Forgotten is a good step because you have a right to not have your name forever attached to information. The real world forgives and forgets, however, on the internet you can say this is not applicable. There are problems with The Right to be Forgotten ruling though – on the one hand it’s good for privacy, because one has more power over one’s own information,

55
but on the other hand, freedom of speech is compromised because Google is so important in the public realm that even if one article is removed it compro-mises freedom of information. Applying it to healthcare data is interesting too, because you can then say to a data company, “I don’t want you to store that data of mine”. The problem is, you have to know which data the company has. Within the Google search index, you can search and find your personal information easily enough, but what you normally can’t see, are the profiles and conclusions they have made concerning your data, which remain secret. That provides a good reason to use The Right to be Forgotten in the healthcare data debate.
MT: Let’s talk about privacy and self monitoring for something like stress in the workplace. I imagine this could become an even more sensitive issue, but there may also be opportunities, within a clearly defined context, where con-crete rules and regulations could be applied.
MM: Yes, but there is a kind of paradox there because The Right to be Forgotten says I can delete certain parts of my data trail, but if you’re trying to measure stress in the workplace and I say “well I had a bad day on Tuesday so please delete my data” then it becomes quite impossible to measure my stress.
MT: Those holes in the data might say more than actually leaving the data in though...
MM: That’s true, but who interprets the hole? Who gives meaning to the hole? Which truth lies in the hole?
references[1] http://ec.europa.eu/justice/data-protection/files/factsheets/
factsheet_data_protection_en.pdf

56

57
A service for all Mike Thompson, Dirk Snelders and Evelien van de Garde-Perik
Looking back at how the GRIP Service Model has evolved over time, it becomes clear that version 6 of the model still does not sufficiently explain the core aims and placement of GRIP within the existing market. Simply put, earlier iterations were too ambitious – they positioned design too literally at the cen-tre, as if design expertise provides the critical element in generating responses to stress in the workplace. Such a perception would appear to contradict the notion of empowerment central to our concept, namely, stimulating employ-ees to investigate and tackle issues for themselves. It also, to a certain extent, ignores the existing knowledge and skills present within the stress industry. As opposed to offering design as a solution, we have come to think of design as a hub – a potential link in a chain connecting a broad network of expertise, and aiding a greater degree of co-creation with stakeholders. In this way, design no longer leads, but facilitates, providing dedicated data knowledge and expertise in response to the needs and desires of the customer.
Our new, Version 7 of the Service model, thus positions GRIP as a support service for developing specific design capabilities, or design expertise, within social / industrial domains, domains that are becoming increasingly data- intensive and which include the stress and healthcare industries. In this re-spect, characterising GRIP as a ‘plug-in’ service (such as has been proposed), makes perfect sense, and is in fact beneficial to any post data collection or co- creation service. One can therefore argue that the designer’s work does not so much occupy a place at the end of a co-creation process (creating solutions for people), but also, and perhaps more importantly, in designing stimulating impetus, or ‘probes’, for the co-creation process itself.[1]
The most stark evolutionary developments within the model itself are perhaps the changes in terminology, and our claims to innovation within service de-sign. Within the GRIP model, ‘data design’ implies the incorporation of as-pects of data collection, transformation and feedback into the user experience. GRIP proposes the creation of employee-driven data experiences to trigger re-sponsibility. The term ‘data experience’ has been chosen to show that this is not simply about visualising data, but about the manner in which we interact with it – implying that the physical act of collection, and experience of stress in a particular context, are as important as the post production of data. This change in terminology is also extremely potent in the way it implies the creation of
58
new interactive experiences – utilising the senses not only to translate data into other languages and media, but to explore new, derivative, meanings.[2]
What we have come to realise is that GRIP supports the coming together of both experiential and biometric data, and it is the combination of the two that leads to greater understanding, the generation of knowledge and the develop-ment of stress-education. Looking at stress from a collective (as opposed to an individual) perspective, effectively anonymises the collected data. By merging layers of information into a whole, direct lines to individual employees are erased, promoting the feeling of safety in numbers. This approach places the issue of ethics regarding the use of this data into the hands of groups of work-ers themselves, which, in turn, also helps define the notion of stress as a “symp-tom of a sick organisation” as proposed by Maurice de Valk (medical doctor, expert in self management and work / life balance, and owner of Intermedic), and empowers groups of individuals in working toward creating change.
This more modest position (of a hub as opposed to a core), shows a greater understanding of our role and (design-) expertise within the field, and pro-vides us with a more concrete, even niche, position. Furthermore, the model acknowledges that such a ‘plug-in’ service cannot work without a certain amount of after care. In fact, one could even say that this new service model creates an interface of sorts between social and industrial / institutional con-cerns. By repositioning design as a facilitator or guide, the model now alludes to the potential of further steps being taken, both outside of, and as a result of, the ‘develop data design capability’ cycle – for example, professional after-care by psychologists or the design of products in response to insights gained. This follow-up may or may not involve further collaboration with GRIP. Similarly, additional actions may take place ‘in-house’ at the instigation of employees themselves, forgoing professional expertise altogether (in what is perhaps a sign of true empowerment). Thus, one could say that the model itself is not necessarily situated within industry, but rather forms a framework that serves private or social learning, beyond the realm of industry or public institutions. Now how’s that for empowerment?!

59
references:
[1] Thompson, M. Cámara Leret, S. (2013). Does big data alter the way we think?
http://designcolumn.nl/susana-camara-leret-mike-thompsondoes-big-data-alter-
way-think/ Accessed 18th July 2014
[2] De Valk, M. (2011) in: Thompson, M., Raijmakers B. & Arets D. Stressed Out:
Reflecting on GRIP. Eindhoven, NL. Design Academy Eindhoven. pp 2

60
GRIP. V7GRIP model for developing capabilities for data design
= Design led
DEFINEDATA
PROBE
CO-CREATEDATA
EXPERIENCE
GATHERDATA
CO-REFLECTION
RESEARCH & DEVELOPMENT
ESTABLISHCLIENT
COMMITMENTS
EXPLORESTRESS
CONTEXT
NETWORKING
DEVELOPDATA DESIGNCAPABILITY
SOCIAL ANDINDUSTRIAL
INNOVATIONS
ITERATE
KNOWLEDGETRANSFER

61
GRIP. V7GRIP model for developing capabilities for data design
= Design led
DEFINEDATA
PROBE
CO-CREATEDATA
EXPERIENCE
GATHERDATA
CO-REFLECTION
RESEARCH & DEVELOPMENT
ESTABLISHCLIENT
COMMITMENTS
EXPLORESTRESS
CONTEXT
NETWORKING
DEVELOPDATA DESIGNCAPABILITY
SOCIAL ANDINDUSTRIAL
INNOVATIONS
ITERATE
KNOWLEDGETRANSFER

62

63
Contributor biographies
drs daniëlle arets
Drs Daniëlle Arets is Associate Reader (Associate Lector) in the Readership (Lectoraat) Strategic Creativity. She also possesses a key role in disseminating the knowledge that results from CRISP to creative industries and educational establishments as a Knowledge Transfer Manager for Design Academy Eindhoven. Daniëlle has a strong record in organising debates for a wide array of public, educational and commercial institutes, and through this experience she has become a strong advocate for inter-disciplinary research and design. Daniëlle aims to bridge academic and design thinking through the use of strategic, creative tools and techniques and, of course, many debates.
ulrich atz
Ulrich Atz is a researcher, consultant, and data enthusiast based in London. He focuses on the benefits of using data at the Open Data Institute, where he leads research projects, advises startups and governments, and provides training. Ulrich is one of the first members of the London Quantified Self community and he published a peer-reviewed paper of a self-experiment. He holds a Diploma from the University of Mannheim and an MSc from the London School of Economics.
dr evelien van de garde-perik
Since 2014, Dr Evelien van de Garde-Perik has worked for Delft University of Technology as project leader of the GRIP project (part of CRISP). At the start of CRISP, Evelien worked for Eindhoven University of Technology. Her research interests include: design for healthcare and wellbeing, privacy and trust, and the translation of user and stakeholder experiences into design guidelines for socio-technical innovations. She enjoys coaching and super vising students on design projects related to her research interests. In her work she tries to build bridges between industry and academia. As design manager at Philips Design in Eindhoven she is responsible for the coordination of student projects on the topic of Hospital-to-Home.

64
Maurits Martijn
Maurits Martijn (1981) is a journalist and editor of De Correspondent. His writing concentrates on technology, surveillance and privacy. He studied philosophy and communication science in Amsterdam, and worked from 2007 till 2013 for the Dutch weekly, Vrij Nederland.
christian nold
Christian Nold is an artist and academic researcher from London. In response to socio-technical issues, he invents participatory technologies for municipal-ities and grassroots organisations. In the past decade he has set up mapping projects involving thousands of people across the world, and has written the books Mobile Vulgus (2001), Internet of People for a Post Oil World (2011), Autopsy of an Island Currency (2014) and Emotional Cartography (2009) (editor). He is cur-rently a PhD candidate in the Extreme Citizen Science Group at UCL.
dr. Bas raijmakers
Dr Bas Raijmakers PhD (RCA) is Reader (Lector) in Strategic Creativity at Design Academy Eindhoven and leads the in-house CRISP research team. Bas has a background in cultural studies, the internet industry, and interac-tion design. His main passion is to bring the people for whom we design, into the design and innovation processes, through the use of visual storytelling. He holds a PhD in Design Interactions from the Royal College of Art, in London. He is also co-founder and Creative Director of STBY in London and Amsterdam: a design research consultancy specialising in design research for service innovation. Bas works for clients in the public sector and industry, around the globe.
dr. dirk snelders
Dr. Dirk Snelders is associate professor at the Department of Industrial Design at Eindhoven University of Technology, and visiting professor at the Interna-tional Design Business Management (IDBM) programme at Aalto University in Helsinki. He has developed his current research interest on the role of design in business from his background in the fields of psychology and marketing. Dirk Snelders has published on aesthetics, the importance of novelty and surprise in design, cross-cultural design, and service design. His work has appeared in journals such as Design Studies, Design Issues, The Journal of Product Innovation Management and The British Journal of Psychology.

65
Mike Thompson
Mike Thompson was the first Research Associate at Design Academy Eind-hoven and a member of GRIP (part of CRISP). Mike sees design as a tool to confront and reframe societal norms and preconceptions. To this end, his work investigates themes such as energy, biotechnology, health care and Big Data, and he has forged long-standing collaborations with the Netherlands Metabolomics Centre, Leiden University, the Waag Society and MU Gallery Eindhoven. His work has been exhibited worldwide including at The Science Gallery (Dublin), Museum Boijmans Van Beuningen (Rotterdam), and the Museum of Modern Art (New York). In 2014 he co-founded THOUGHT COLLIDER, an experimental, critical art / design research practice based in Amsterdam, the Netherlands. In addition to his practice, Mike teaches at various educational institutes including Eindhoven University of Technology, Willem de Kooning Academy and Design Academy Eindhoven.

66

67
Glossary
creative industry scientific programme
The Readership is embedded in CRISP (Creative Industries Scientific Programme, see crispplatform.nl). CRISP is a Dutch national research pro-gramme of more than 60 organisations, in which Design Academy Eindhoven collaborates with the Technical Universities of Delft, Eindhoven and Twente, VU and UvA in Amsterdam and over fifty design companies and service providers in the Netherlands. CRISP is supported by the Dutch Ministry of Education, Culture and Science. For details about all CRISP projects see www.crispplatform.nl
grip project
When designing a PSS, designers try to find a balance between flexibility and control to create effective and socially responsible value for users and other stakeholders. GRIP is about enabling the creation of such value by helping designers to achieve this balance when designing PSS. When designing from the perspective of a system, the control over the designed creation is structurally lower than in product design. The designers have to deal with complex, dynamic environments and need to negotiate decisions with a range of stakeholders. The PSS development process is less formalised and characteristically has a high level of co-creation and co-production. This raises questions such as how tight the designer’s grip on the processes and outcomes of design should be when working together with end-users and other partners in PSS development?
Scientific partners: Delft University of Technology, Eindhoven University of Technology and Design Academy Eindhoven.Industry partner: Philips Design.
The readership in strategic creativity at design academy eindhoven
The Readership explores how design and creativity can play a strategic role in society and the economy in general, and in service innovation in particular. In the strong design culture of Design Academy Eindhoven, academic knowledge is created through designing. The results of the programme are used within the educational programme of Design Academy Eindhoven by way of Open Design Spaces – a four week design-research module for students around a

68
topic related to the research of a particular Research Associate. Further to this, results are disseminated through public debates, conferences, workshops and publications – the work can be followed via several digital channels. For more details see www.designacademy.nl/strategiccreativity

69

70
Stressed OutThe Readership in Strategic Creativity at Design Academy Eindhoven
Editor: Mike ThompsonEditorial team: Daniëlle Arets, Bas Raijmakers, Ellen Zoete Contributors: Ulrich Atz, Ryan Pescatore Frisk, Evelien van de Garde-Perik, Maurits Martijn, Christian Nold, Dirk SneldersProofreading: Jane Hardjono, Jimini HignettGraphic design: HeyHeydeHaasPrinted by: Lecturis, EindhovenEdition: 500
CRISP GRIP research group:
Evelien van de Garde-Perik, Luc Geurts, Marie Perez, Dirk Snelders,Mike Thompson, Helle Ullerup
CRISP (project) partners:
Delft University of Technology, Eindhoven University of Technology, Geestelijke Gezondheidszorg Eindhoven (GGzE), Philips Design
Guest tutor:
Ryan Pescatore Frisk
Participating students from The Man and Communication Department at
Design Academy Eindhoven, including:
Marie-Elsa Batteaux Flahault, Nacor Martina, Hannah Vischer
Special thanks to:
Ryan Pescatore Frisk, Eric Kuijpers (GGzE), Catelijne van Middelkoop, Maurice de Valk (Intermedic)
Students contributors from Technical University Eindhoven:
Rhys Duindam, Matthijs Kwak, Fabienne van Leiden, Jasper Schenk
Images: Calvin and Hobbes by Bill Watterson, April 27, 1995
Colophon

71
Publisher:
Design Academy EindhovenEmmasingel 14 Eindhoven, the Netherlandswww.designacademyeindhoven.nl/strategiccreativityemail: [email protected]
ISBN: 978-94-91400-18-6Price: 10 euro
The Readership in Strategic Creativity, 2014
Reader (Lector): Dr Bas Raijmakers PhD (RCA)Associate Reader (Associate Lector): drs Daniëlle Arets Visiting Research Fellow: Ré Dubhthaigh MA (RCA)Research Associates: Michelle Baggerman BA, Alessia Cadamuro MDes, Heather Daam MDes, Maartje van Gestel BA, Susana Cámara Leret MDes, Karianne Rygh MDes, Mike Thompson MDes, Jonathan Wray MDes
The Readership Strategic Creativity is partly funded within the Creative Industry Scientific Programme (CRISP). CRISP is supported by the Dutch Ministry of Education, Culture and Science. www.crispplatform.nl
This work is licensed under a Creative Commons Attribution- NonCommercial-ShareAlike 3.0 Unported License.
© 2014 Mike Thompson et al.

72


Stress at work may be unhealthy but is also necessary, at some level, in order to be alert when required – how to find the right balance can differ according to the context and situation. This makes stress a typical topic for Product Service System design – where designers look for a balance between control over the outcome of their work, and flexibility in accommodating a multitude of changing circumstances and contexts. Such designs follow certain principles and are based on models, but have many different (and sometimes unforeseen) outcomes and results. The service model presented in this book is a prime example.
Stressed Out? is a project by Mike Thompson, Research Associate at Design Academy Eindhoven, and participant in the GRIP project within CRISP (Creative Industry Scientific Programme). CRISP focuses on Product Service Systems, requiring designers to think and work more broadly and more strategically in response to large-scale societal challenges. As more stakeholders are also involved, designers are well-positioned to help orchestrate the collaboration between these different professionals, bringing new combinations of thinking and production to strategy development.
This book is part of a series published by the Readership in Strategic Creativity at Design Academy Eindhoven. The Readership explores how designers trained at Design Academy Eindhoven can generate academic knowledge through design.
Bas Raijmakers PhD (RCA)Reader in Strategic Creativity at Design Academy Eindhoven