048-2009: Integrating Financial and Non-Financial ... · financial planning and management is a...
15
1 Paper 048-2009 Integrating Financial and Non-Financial Information to Enhance Strategic Decision-Making Capabilities at McMaster University Debbie Weisensee, McMaster University, Hamilton, ON Anne McInnis, McMaster University, Hamilton, ON Lars Hult, BusinessMinds, Copenhagen, DK ABSTRACT This paper covers the process involved in developing a university-wide decision support system at McMaster University, for both financial and non-financial data. Over the past few years, McMaster has been designing and building a data warehouse based on enterprise-wide information needs. The data warehouse is being built incrementally along with end-user, web-based query and reporting tools using a suite of SAS ® software, with the most recent module implemented being SAS ® Financial Management. Much of the data that is now in place will be integral in providing senior administration with comprehensive reports on both financial and non financial data in a variety of areas across the university. This paper will discuss our experience including: keys to success, challenges, pitfalls, lessons learned and what we would do differently. As well, we will briefly touch on future opportunities to link data to performance and enhanced analytics through future plans to implement SAS ® Strategic Performance Management and SAS ® Enterprise Miner modules. INTRODUCTION McMaster University’s mission statement reflects the institution’s commitment to communication, innovation, excellence and quality. To support these values, the university needs flexible and innovative information technology that will ensure the transfer and sharing of knowledge to inform and enhance all levels of decision making at the institution. Like many other organizations, McMaster University’s transactional applications do not store data in easily accessible data models that can be easily transformed into comprehensive, meaningful information to support fact-based decision-making. More importantly, critical data linkages required to perform integrated analytical reporting often do not exist. To rectify this situation, McMaster has been incrementally building an institutional data warehouse and strategic analytical reporting platform over the past several years using the following suite of SAS ® software: SAS ® Data Integration Studio, BASE SAS ®, SAS Intr/Net ® , SAS/SHARE ® , SAS/CONNECT ® ,SAS ® OLAP Cube Studio, SAS ® Enterprise BI Server, SAS ® Information Map Studio, SAS ® Management Console, SAS ® Information Delivery Portal, SAS ® Add-in for Microsoft Office, SAS ® Enterprise Guide, SAS ® Web Report Studio, SAS ® Enterprise Miner ™, and SAS ® Financial Management. Future plans include the deployment of SAS ® Strategic Performance Management. McMaster’s data warehouse now has integrated data from Research, Student Records, Finance and Payroll thus McMaster is now strategically poised to maximize its data analysis efforts and link all available data (both financial and non financial) to performance. THINKING/PLANNING BACKGROUND The design of McMaster’s institutional data warehouse was driven by a comprehensive detailed requirements analysis for enterprise-wide information needs. Key stakeholders were interviewed in a series of focus group sessions and were asked to provide information on the following: • Issues with current data/reports • Data elements (candidate dimensions) required to support enterprise-wide information needs • Report frequency and desired distribution method and output style (electronic, web-based, excel, pdf, word etc.) • Amount of historical data required • Data hierarchies Business Intelligence User Applications SAS Global Forum 2009
Transcript of 048-2009: Integrating Financial and Non-Financial ... · financial planning and management is a...

1
Paper 048-2009
Integrating Financial and Non-Financial Information to Enhance Strategic Decision-Making Capabilities at McMaster University
Debbie Weisensee, McMaster University, Hamilton, ON
Anne McInnis, McMaster University, Hamilton, ON Lars Hult, BusinessMinds, Copenhagen, DK
ABSTRACT This paper covers the process involved in developing a university-wide decision support system at McMaster University, for both financial and non-financial data. Over the past few years, McMaster has been designing and building a data warehouse based on enterprise-wide information needs. The data warehouse is being built incrementally along with end-user, web-based query and reporting tools using a suite of SAS ® software, with the most recent module implemented being SAS ® Financial Management. Much of the data that is now in place will be integral in providing senior administration with comprehensive reports on both financial and non financial data in a variety of areas across the university. This paper will discuss our experience including: keys to success, challenges, pitfalls, lessons learned and what we would do differently. As well, we will briefly touch on future opportunities to link data to performance and enhanced analytics through future plans to implement SAS ® Strategic Performance Management and SAS ® Enterprise Miner modules.
INTRODUCTION McMaster University’s mission statement reflects the institution’s commitment to communication, innovation, excellence and quality. To support these values, the university needs flexible and innovative information technology that will ensure the transfer and sharing of knowledge to inform and enhance all levels of decision making at the institution. Like many other organizations, McMaster University’s transactional applications do not store data in easily accessible data models that can be easily transformed into comprehensive, meaningful information to support fact-based decision-making. More importantly, critical data linkages required to perform integrated analytical reporting often do not exist. To rectify this situation, McMaster has been incrementally building an institutional data warehouse and strategic analytical reporting platform over the past several years using the following suite of SAS ® software: SAS ® Data Integration Studio, BASE SAS ®, SAS Intr/Net ® , SAS/SHARE ® , SAS/CONNECT ® ,SAS ® OLAP Cube Studio, SAS ® Enterprise BI Server, SAS ® Information Map Studio, SAS ® Management Console, SAS ® Information Delivery Portal, SAS ® Add-in for Microsoft Office, SAS ® Enterprise Guide, SAS ® Web Report Studio, SAS ® Enterprise Miner ™, and SAS ® Financial Management. Future plans include the deployment of SAS ® Strategic Performance Management. McMaster’s data warehouse now has integrated data from Research, Student Records, Finance and Payroll thus McMaster is now strategically poised to maximize its data analysis efforts and link all available data (both financial and non financial) to performance.
THINKING/PLANNING
BACKGROUND The design of McMaster’s institutional data warehouse was driven by a comprehensive detailed requirements analysis for enterprise-wide information needs. Key stakeholders were interviewed in a series of focus group sessions and were asked to provide information on the following:
• Issues with current data/reports
• Data elements (candidate dimensions) required to support enterprise-wide information needs
• Report frequency and desired distribution method and output style (electronic, web-based, excel, pdf, word etc.)
• Amount of historical data required
• Data hierarchies
Business Intelligence User ApplicationsSAS Global Forum 2009

2
• Users of the information
• Security Requirements
• Key financial and non financial performance measures
• Success criteria (to measure project’s deliverables)
This information was summarized and used to develop enterprise-wide hierarchies and a decision support bus matrix. As part of the analysis, the model included an inventory of the underlying data sources required to support the information need, a data quality assessment of the source data and volumetric exercise (required for server sizing and disk space). What we found was that many process issues needed to be addressed. For example, financial planning and management is a decentralized process at the university. Budget managers have a great deal of autonomy in terms of how they classify non salary/benefit expenditures. A team of stakeholders across the university was charged with the task of developing standardized classifications for reporting revenue and expenditures. Training materials were developed and sessions held. As well, standardized templates for financial planning and reporting were developed and mandated by senior management and university committees such as Budget and Finance. This early work greatly facilitated a successful implementation and deployment of the SAS ® Financial Management module this past fall. In terms of Performance Management a set of performance objectives and indicators was identified. The work of Kaplan-Norton was used as a model to guide the thinking involved in the development of a university-wide Strategy Map and Balanced Scorecard which has enabled McMaster to identify and link key Goals, Objectives, and Measures. This work has been cascaded down to the Administration division. The outcome of this work to date leaves McMaster strategically poised to maximize its data analysis efforts in linking both financial and non financial data to performance, and will facilitate future plans for the implementation and utilization of SAS ® Strategic Performance Management software.
SAS ® FINANCIAL MANAGEMENT IMPLEMENTATION
BACKGROUND McMaster’s current budget process extracts data from our 20+ year old corporate Financial Accounting system and requires extensive use of spreadsheets to prepare annual budgets which is time consuming and confusing for most budget managers. Historically, many budget managers maintained shadow spreadsheets. The excessive time spent in manually compiling financial reports resulted in little time available for analysis. McMaster recently chose to implement the SAS ® Financial Management module to alleviate these challenges. In choosing the SAS ® Financial Management software, we felt that it was critical that our financial management decision support be integrated into our broader strategic analytical and performance management environment. Although only in production for less than six months, we have found that this software has enabled us to both structure and integrate our data from our legacy accounting system to provide comprehensive planning, forecasting, analysis, and reporting tools.
Budget Managers access the SAS ® Financial Management software through the SAS ® Information Delivery Portal, which is where they also access other data and reports through our business intelligence (BI) environment which comprises stored processes, and static content running against SAS datasets. Metadata is defined using SAS ® Financial Management studio and this feeds meaningful reports and forms. Once forms and reports are accessed from the SAS ® Information Delivery Portal, the interface used is the SAS ® Add-In for Microsoft Excel. Both form and report creation is done using this interface, making for a very friendly and powerful tool for our Finance power users who are not programmers.
In the dimensions workspace the process administrator defines the different ways to view data including: dimensions, hierarchies and members. This allows us to easily generate reports for different organizational structures of the institution (e.g. internal versus external hierarchies, differing organizational structures at points in time). In the cycles workspace we have defined the granularity of transactions. We have provided budget managers with the ability to drill down from aggregated values to the underlying detailed transactions. In the forms workspace we create and manage forms and form sets. As well as entering projections into the SAS ® Financial Management database, we are also using forms to capture other information which previously existed only on paper (e.g. full-time equivalent’s [FTE’s]). In terms of workflow we have implemented a bottom-up approach. Having an automated, electronic budgeting workflow process has greatly assisted the budgeting department in terms of improved communication and efficiency.
Business Intelligence User ApplicationsSAS Global Forum 2009

3
Example of “Manage Financial Forms” on the SAS ® Information Delivery Portal
Example of a SAS ® Financial Management Cell Data Access (CDA) Report * (NOTE DATA IS FICTITIOUS)
Business Intelligence User ApplicationsSAS Global Forum 2009

4
Example of a data entry form
BENEFITS REALIZED
• Projections are now available in a centralized database instead of residing in stand-alone spreadsheets which previously required manual compilation and reconciling. Projections are entered by budget managers via web based data entry forms.
• Increased accuracy and timeliness of budgets and plans through the pre-population of historical data
• Streamlined process for creating, tracking, consolidating and validating budget information
• Automated multi-tier submission and approval process
• Enables a consistent planning and budgeting process from the university-wide perspective down to individual budget envelopes
• Ability to compare current and past amounts (actual and projections) to quickly identify deviations from plans. Ability to plan and budget from different perspectives (hierarchies, models, comparing changes in hierarchies at a point in time)
• Integration of financial and non-financial information among decision makers
To date only the university’s operating funds have been transformed and loaded into the SAS ® Financial Management detailed data store and solutions data mart. Next steps include the transformation and loading of other funds such as Sponsored Research, Capital and Trust and Endowment. As well, integrated data marts are required for non financial data such as space. The university is planning to move from an incremental budgeting model to an Activity Based Model (also known as Resource Centered Management). The ability of SAS ® Financial Management to perform both simple and complex cost allocations utilizing a variety of methodologies (percentage split, equal split, proportional and fixed values) will be essential to enable this change in methodologies.
Business Intelligence User ApplicationsSAS Global Forum 2009

5
KEYS TO SUCCESS
• Identify and correct any process issues (inconsistent data entry, expense classification, lack of standardized templates) prior to the implementation of the software. Ensure key stakeholders are engaged in the process. Have support of senior management to mandate standardization in terms of data collection and reporting requirements.
• Have an enthusiastic and engaged project sponsor. Involve financial staff (both centralized and decentralized) in requirements gathering and selection of software. Manage expectations by ensuring that stakeholders have a clear understanding of both what the software can and cannot do. Have demonstrations of the software for stakeholder groups, preferably showing sample data for a similar organization.
• Develop a comprehensive training/mentoring plan understanding that stakeholders will have varying degrees of spreadsheet expertise
CHALLENGES
• Our existing hardware infrastructure was not sufficient to support an overlay of SAS ® Financial Management/SAS ® Strategic Performance Management software over our existing SAS ® BI Server Environment. Our SAS ® BI Server data tier runs on a 64 bit operating system which was not supported by the SAS® solution products. As well, our shared mid-tier server was undersized. Additional servers were purchased to provide the solution products with a separate data tier running on a 32 bit operating system and our shared mid-tier server was upgraded.
• Insufficient time/resources allocated for training.
• Difficulties in managing a client component in a decentralized environment, with non-standard desktop
configurations. A Citrex server is presently being implemented to address this challenge.
• Challenges in coordinating McMaster project resources with SAS technical resources from SAS Canada and SAS US.
NEXT STEPS – FUTURE IMPLEMENTATION OF SAS ® STRATEGIC PERFORMANCE MANAGEMENT
WHY IS THIS IMPORTANT FOR MCMASTER UNIVERSITY? A frequently-asked question is: why performance management? Experts argue that performance management is necessary to clarify the Mission and Vision of an organization and assist in translating its strategies for achieving goals into measurable objectives, thus allowing the organization to not only measure its progress, but also understand what improves results. In addition, advocates list several other benefits, including improved accountability and decision-making, an alignment of operational activities and resources with strategic objectives, encouragement of dialogue, a shared understanding of activities planned to deliver objectives, and clear communication of expectations to all organizational levels. It is also argued that “what gets measured gets done”1, or at least gets the attention when the indicators show a deviation from what was expected. Furthermore, performance measurement allows comparisons between organizations sharing the same objectives. While several reasons for engaging in performance measurement can be cited, the fundamental argument is that, once strategic goals have been identified, there should be some mechanism by which an organization can measure its success against those goals. Indeed, one of McMaster University’s key strategic planning documents, Refining Directions, stresses evaluation as an important success factor:
Measurement and evaluation are necessary for effective planning and enable us to determine how we are doing with respect to our goals.
BACKGROUND WORK
In an effort to create an effective strategic performance management system, McMaster engaged key individuals in a process to develop a University-level Strategy Map and
Business Intelligence User ApplicationsSAS Global Forum 2009

6
Balanced Scorecard, using the Kaplan-Norton model2. Although the Strategy Map and accompanying Scorecard are more often found in the corporate arena, the University believed several of its principles and benefits were transferable to the academic sector. For example: • Allow the University to clarify specific academic, scholarship and financial outcomes
necessary to achieve the Refining Directions vision • Clarify strategies and communicate them to stakeholders • Clearly identify key internal processes in which the University must excel to achieve
strategic success • Align investments in people, technology, and organisational capital for the greatest
impact • Expose gaps in strategies and point to early corrective action • Be supported by a key performance indicator report – a Balanced Scorecard The diagram below illustrates the various components of the University’s overall framework:
Having identified its Mission, Vision, strategic goals and objectives, McMaster was well-poised to begin developing a University-level Strategic Map and Scorecard. The process involved regular weekly meetings with key individuals (both academic and support staff) over a six-month period. Early meetings involved becoming familiar with the traditional “corporate” Strategy Map, which incorporates the following four main focus areas or perspectives: 1) FINANCIAL 2) CUSTOMER
Mission/Vision
Main Strategic Goals
Build an Evaluative Framework for each GoalMeasure Performance against Benchmarks/Targets
Key PerformanceIndicatorsfor each
Benchmark/Target
Report to University Planning Committee
Understand and evaluate our performance
(inputs, outputs, processes, outcomes)
Improve our Performance(Strategies and Initiatives)
DER
IVA
TIO
NU
SE IN
PL
AN
NIN
G
Challenge:Ensure we
identify theappropriateIndicators
Business Intelligence User ApplicationsSAS Global Forum 2009

7
3) INTERNAL 4) LEARNING & GROWTH Since it is important for corporations to be profitable, it is not surprising that the corporate model’s primary perspective is identified as “Financial” and normally appears at the top of the Strategy Map:
Once the four perspectives are in place, further work is done to identify key objectives and performance indicators for each perspective. McMaster’s challenge would be to adapt the traditional corporate model in such a way that it would appropriately reflect the Mission, Vision, Goals, and Objectives of an academic institution. McMaster began with the following structure:
FINANCIAL PERSPECTIVE
CUSTOMER PERSPECTIVE
INTERNAL PERSPECTIVE
LEARNING & GROWTH PERSPECTIVE
Mission/VisionRefining Directions Goals
To translate our vision into measurable goals and trackperformance, build a Strategy Map and Balanced
Scorecard
Deliver desiredoutcomes tostudents, faculty,staff & partners
Ensure financialsustainability
Provide excellentservices and excelat internalprocesses
Develop human,information &organizationalcapital
STAKEHOLDER FINANCIAL INTERNAL LEARNING &GROWTH
Business Intelligence User ApplicationsSAS Global Forum 2009

8
As seen above, McMaster retains four main perspectives, as was seen in the corporate model, but changes the name of the “Customer” perspective to “Stakeholder” and will place this perspective first, in order to emphasize its importance. The “Stakeholder” perspective is much more multi-dimensional in the university setting, thereby increasing the challenge of achieving such a diverse set of objectives identified by its many constituents. The number of stakeholders is large, covering both internal and external, all of whom have their own interests and values, in other words, their own “objectives”. The University’s challenge is to recognize, and be accountable to, all its stakeholders.
As discussions progressed, the following would become the fundamental design of McMaster’s Strategy Map:
Now that the four perspectives were in place, extensive discussions ensued in order to identify key
G o v ern m e n t (F ed era l &P r o v in c ia l)
S tu d en t s(C u r ren t &P ro sp ec tiv e )
F a cu lty
E x tern a l A g en c ie s
U n iv ers ityB o a rd o f
G o v ern or s
S u p p o r t S ta ff
D on or s
A lu m n i
G en era l P u b lic
P ar en t s
I n tere s ts,V a lu e s
U N IV E R S IT Y “S T A K E H O LD E R S ”
In teres ts ,V a lu es
In t eres ts ,V a lu es
In t eres ts ,V a lu es
In teres ts ,V a lu es
In tere st s,V a lu e s
In ter es ts,V a lu e s
In ter es ts,V a lu es
In ter es ts,V a lu es
E m p loy e rs
McMaster Strategy Map
VISION
MISSION
Stakeholders Financial
Internal Processes
Learning & Growth (People & Tools)
Identify Objectives for all
Perspectives
Business Intelligence User ApplicationsSAS Global Forum 2009
9
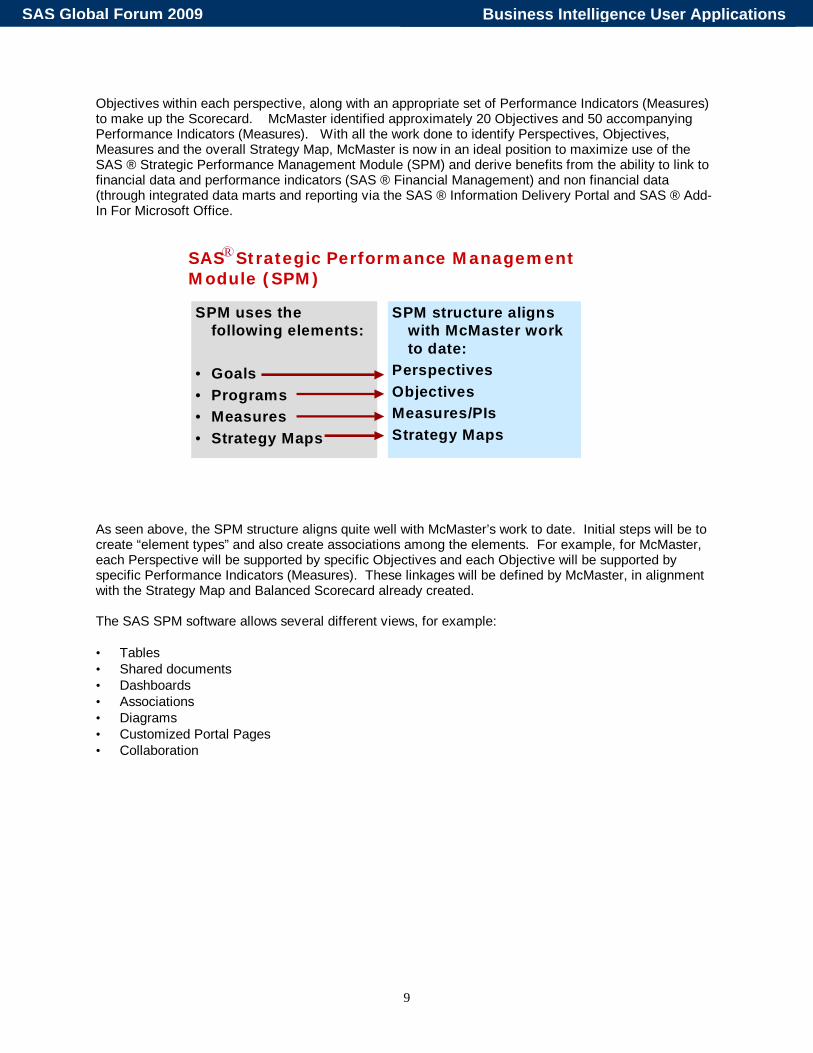
Objectives within each perspective, along with an appropriate set of Performance Indicators (Measures) to make up the Scorecard. McMaster identified approximately 20 Objectives and 50 accompanying Performance Indicators (Measures). With all the work done to identify Perspectives, Objectives, Measures and the overall Strategy Map, McMaster is now in an ideal position to maximize use of the SAS ® Strategic Performance Management Module (SPM) and derive benefits from the ability to link to financial data and performance indicators (SAS ® Financial Management) and non financial data (through integrated data marts and reporting via the SAS ® Information Delivery Portal and SAS ® Add-In For Microsoft Office.
As seen above, the SPM structure aligns quite well with McMaster’s work to date. Initial steps will be to create “element types” and also create associations among the elements. For example, for McMaster, each Perspective will be supported by specific Objectives and each Objective will be supported by specific Performance Indicators (Measures). These linkages will be defined by McMaster, in alignment with the Strategy Map and Balanced Scorecard already created. The SAS SPM software allows several different views, for example: • Tables • Shared documents • Dashboards • Associations • Diagrams • Customized Portal Pages • Collaboration
SAS Strategic Performance ManagementModule (SPM)
SPM uses thefollowing elements:
• Goals• Programs• Measures• Strategy Maps
SPM structure alignswith McMaster workto date:
PerspectivesObjectivesMeasures/PIsStrategy Maps
R
Business Intelligence User ApplicationsSAS Global Forum 2009

10
The following slide shows a SPM Scorecard page where a table is shown that has links to supporting documents: (screenshot from SAS Marketing material)
McMaster will provide a similar view such as:
Dashboards such as the following can also be created:
T a b le + A d d it io n a l l in k sto s u p p o r t in g d o c u m e n ts
McMaster use of SPM Tables – Research Example
XXXXXX IndustrialContract Income
XXXXXX Patent/LicenseIncom e
XXXXXX
Average TotalFunding pereligible facultymember
XXXXXX Federal Funding
PerformanceTargetActualPeriodDocMeasures
Link toBackground
Information onFederalFunding
Business Intelligence User ApplicationsSAS Global Forum 2009
11
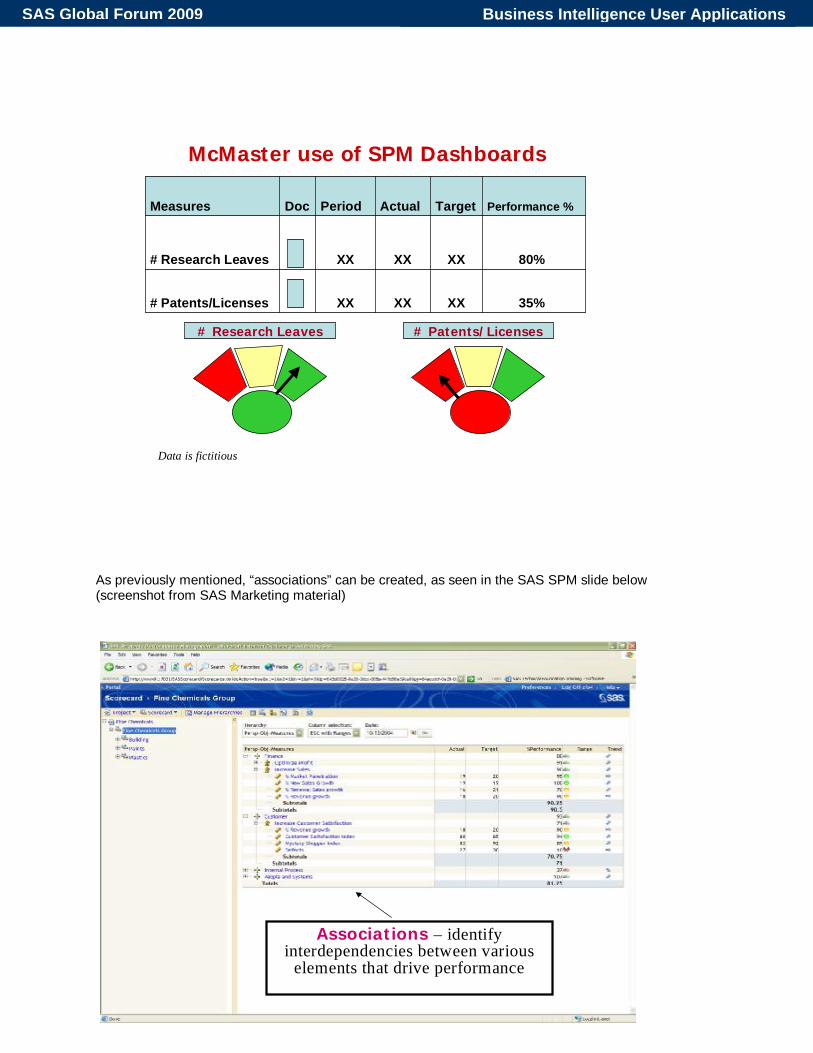
As previously mentioned, “associations” can be created, as seen in the SAS SPM slide below (screenshot from SAS Marketing material)
McMaster use of SPM Dashboards
35% XXXXXX # Patents/Licenses
80% XXXXXX # Research Leaves
Performance %TargetActualPeriodDocMeasures
# Research Leaves # Patents/Licenses
Data is fictitious
Associations – identifyinterdependencies between various
elements that drive performance
Business Intelligence User ApplicationsSAS Global Forum 2009

12
Since McMaster has built its University-level Map and Scorecard, it is now able to create the following linkages, in keeping with the specifications of the SAS SPM software:
In addition, diagrams can be used to show “cause and effect” analyses, reflecting how Objectives support Perspectives and how Measures support Objectives and also how effects can “cross over” into other Perspectives (red line) as shown in the following McMaster scenario:
Creating Associations
STAKEHOLDERS
FINANCIAL
INTERNAL
LEARNING & GROWTH
Research activity that establishesMcMaster as an international ornational leader
Average funding per faculty member
Perspective
Objective
Measure
Linked
Linked
Linked
Linked
Diagrams
Research activity thatestablishes McMaster… Strong & diversified resource base
Recruit & retain highly-qualified staff
Enhancing transfer of knowledge
STAKEHOLDERS FINANCIAL
INTERNAL
LEARNING & GROWTH
Federal Funding
xxxxxx # Patents
xxxxxxxxxxx
xxxxxx
Business Intelligence User ApplicationsSAS Global Forum 2009

13
One of the most exciting features of the SPM software for McMaster is the ability to create customized Portal Pages. We envision such pages being set up according to “Profile” and/or “Purpose/Audience”. For example, Board of Governors, President, Provost, VP Research, VP Admin, Deans, Faculty Directors of Admin, Chairs of Departments, etc. A SAS SPM example shows the possible components of a Portal Page: (screenshot from SAS Marketing material)
Other opportunities include: • Setting up “Alerts” • Monitoring “Thresholds” • Adding “Comments”
Portal Pages – customizedby user to focus on critical KPIs
O p e ra tin g P ro f it_ A ct u a l 3 0 -J u n -2 0 0 4 1 6 :5 4 :0 9C u st om e r F e e d b a c k_ A c tu a l 3 0 -J u n -2 0 0 4 1 6 :5 8 :3 5
C o lla b o ra tio n – in se r tco m m e n ts , m o n ito rth re sh o ld s a n d is su e
a le r ts
Business Intelligence User ApplicationsSAS Global Forum 2009
14
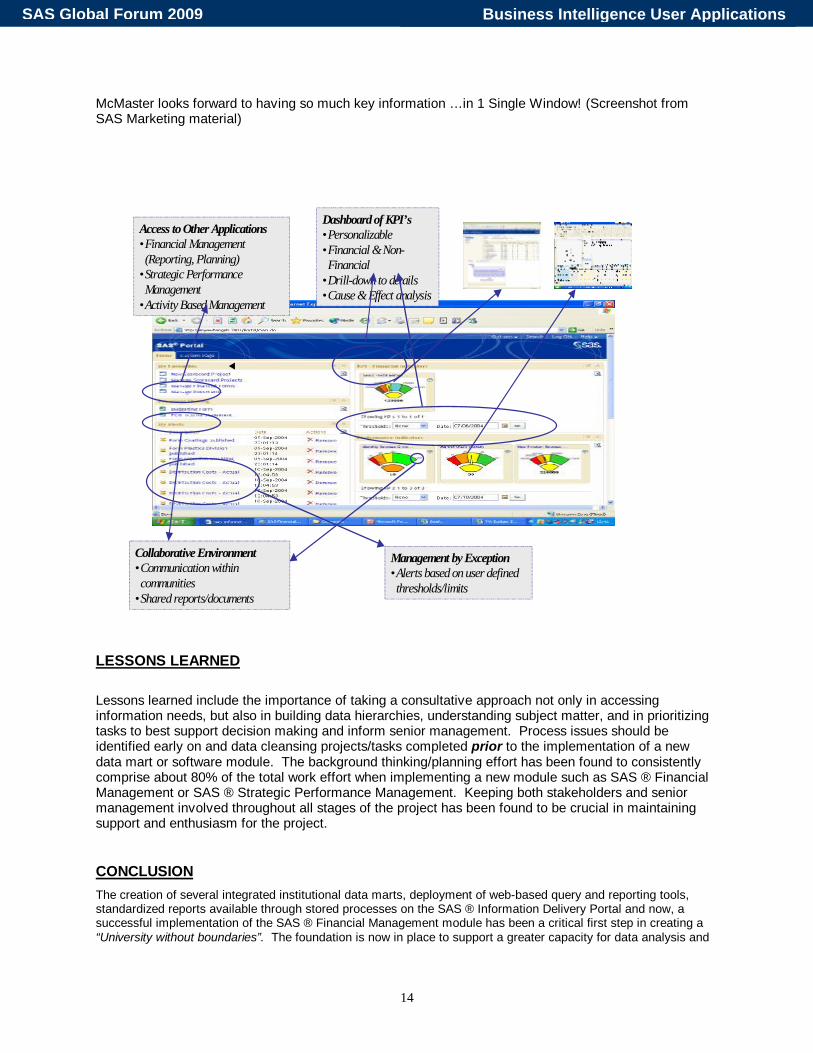
McMaster looks forward to having so much key information …in 1 Single Window! (Screenshot from SAS Marketing material)
LESSONS LEARNED Lessons learned include the importance of taking a consultative approach not only in accessing information needs, but also in building data hierarchies, understanding subject matter, and in prioritizing tasks to best support decision making and inform senior management. Process issues should be identified early on and data cleansing projects/tasks completed prior to the implementation of a new data mart or software module. The background thinking/planning effort has been found to consistently comprise about 80% of the total work effort when implementing a new module such as SAS ® Financial Management or SAS ® Strategic Performance Management. Keeping both stakeholders and senior management involved throughout all stages of the project has been found to be crucial in maintaining support and enthusiasm for the project.
CONCLUSION The creation of several integrated institutional data marts, deployment of web-based query and reporting tools, standardized reports available through stored processes on the SAS ® Information Delivery Portal and now, a successful implementation of the SAS ® Financial Management module has been a critical first step in creating a “University without boundaries”. The foundation is now in place to support a greater capacity for data analysis and
Access to Other Applications•Financial Management(Reporting, Planning)
•Strategic PerformanceManagement
•Activity Based Management
Dashboard of KPI’s•Personalizable•Financial & Non-Financial
•Drill-down to details•Cause & Effect analysis
Collaborative Environment•Communication withincommunities
•Shared reports/documents
Management by Exception•Alerts based on user definedthresholds/limits
Business Intelligence User ApplicationsSAS Global Forum 2009
15
integrated strategic reporting. Implementation of SAS ® Financial Management and SAS ® Strategic Performance Management will facilitate greater accountability for the institution in an environment of devolved authority. The “project” is now seen as a critical decision support team for the institution.
REFERENCES 1 Discussion drawn partly from B.D. Ruben, Toward a Balanced Scorecard for Higher Education: Rethinking the College and University Excellence Indicators Framework, Rutgers University, 1999, pp. 2-3, citing Kaplan & Norton (1996), Using the Balanced Scorecard as a Strategic Management System (Harvard Business Review), p. 10. 1 T. H. Poister, Measuring Performance in Public and Nonprofit Organizations, San Francisco, CA Jossey-Bass, 2003, p.4, citing D. Osborne, T. Gaebler, Reinventing Government: How the Entrepreneurial Spirit is Transforming the Public Sector, Reading, Mass: Addison-Wesley, 1992, p. 146. 22 The Balanced Scorecard was developed in 1992 by Harvard School Business professors Robert Kaplan and David Norton. Palkoski, Suzanne, A New Dimension in Financial Planning and Budgeting (white paper), SAS Institute, Cary NC
SAS ® Financial Management: Comprehensive Training Course Notes, SAS Institute, Cary NC, 2006
SAS ® Financial Management: Data Administration Course Notes, SAS Institute, Cary NC, 2007
SAS ® Strategic Performance Management: Creating and Administering Scorecard Projects, Carey NC, 2005
ACKNOWLEDGMENTS The authors would like to sincerely thank Joseph Szigeti, Technical Architect (SAS US), Andy Peredery, Senior Consultant (SAS Canada), Carl Paluszkiewicz, Director Services, Business Development (SAS Canada) and Rune Lind, Senior Consultant Financial Intelligence (SAS Denmark) for all of your support, encouragement, expertise, dedication and superb mentoring skills. Your dedication and willingness to always go “above and beyond” is greatly appreciated.
CONTACT INFORMATION Your comments and questions are valued and encouraged. Contact the author at:
Debbie Weisensee McMaster University 1280 Main Street West, BSB room 222 Hamilton, ON Canada L8S 4L8 (905) 525-9140 x26408 Fax: (905) 528-3773 Email: [email protected] SAS and all other SAS Institute Inc. product or service names are registered trademarks or trademarks of SAS Institute Inc. in the USA and other countries. ® indicates USA registration.
Other brand and product names are trademarks of their respective companies.
Business Intelligence User ApplicationsSAS Global Forum 2009