04.2013, REPORT, Regional Economic Outlook Asia and Pacific, International Monetary Fund
69
-
Upload
the-business-council-of-mongolia -
Category
Business
-
view
433 -
download
1
Transcript of 04.2013, REPORT, Regional Economic Outlook Asia and Pacific, International Monetary Fund


World Economic and Financial Surveys
Reg iona l Economic Out look
I N T E R N A T I O N A L M O N E T A R Y F U N D
Asia and Pacifi cShifting Risks,
New Foundations for Growth
13AP
R

Cataloging-in-Publication Data
Regional economic outlook. Asia and Pacifi c. – Washington, D.C. : International Monetary Fund, 2005-
v. ; cm. – (World economic and fi nancial surveys, 0258-7440)
Once a year.Began in 2005.Some issues have also thematic titles.
1. Economic forecasting – Asia – Periodicals. 2. Economic forecasting – Pacifi c Area – Periodicals. 3. Asia – Economic conditions – 1945- – Periodicals. 4. Pacifi c Area – Economic conditions – Periodicals. 5. Economic development – Asia – Periodicals. 6. Economic development – Pacifi c Area – Periodicals. I. Title: Asia and Pacifi c. II. International Monetary Fund. III. Series: World economic and fi nancial surveys.
HC412.R445
ISBN: 978-1-48436-083-5
Publication orders may be placed online, by fax, or through the mail:International Monetary Fund, Publication ServicesP.O. Box 92780, Washington, D.C. 20090, U.S.A.
Tel.: (202) 623-7430 Fax: (202) 623-7201E-mail: [email protected]
www.imf.orgwww.elibrary.imf.org
©2013 International Monetary FundApril 2013

iii
Conten ts
Defi nitions vi
Executive Summary ix
1. Managing Shifting Risks 1
Signs of Pickup amid Receding Tail Risks 1 Stronger Prospects in the Period Ahead Hinge on Internal Demand Dynamics 4 More Balanced, but Shifting Risks 12 A Transition to Rebuilding Policy Space 19 Laying Foundations for Sustained and Shared Prosperity 29
2. Fiscal Policy: Dampening Cyclical Fluctuations and Supporting Inclusive Growth 37
The Role of Fiscal Policy in Dampening Cyclical Fluctuations in Asia 37 Increasing Space to Support Sustained and Inclusive Growth 40
3. Is Middle-Income Asia at Risk of a Sustained Growth Slowdown? 47
What Is a Sustained Growth Slowdown? 47 Are Middle-Income Economies Different? 49 What Explains the Likelihood of Getting Trapped? 50 Are Middle-Income Asian Economies at Risk of a Sustained Growth Slowdown? 51 Can Emerging Asia Get Old before It Gets Rich? 53
References 55
Boxes
1.1 ASEAN-5 Integration as a Source of Resilience 8 1.2 Asia’s Electronics Sector: An Engine of Growth for All? 9 1.3 Effects and Spillover Channels of a Successful Refl ation in Japan 10 1.4 Remittances: Shock Amplifi er or Absorber for Emerging and Developing Asia? 14 1.5 Macroprudential Measures and Capital Flow Measures: The Experience in Asia 22 1.6 Chinese Capital Account Liberalization and the Internationalization of the Renminbi 25 1.7 How Will the Basel III Capital and Liquidity Requirements Affect Asian Banks? 27 1.8 Myanmar—Reintegrating with the World 30 1.9 Is Emerging Asia Shifting to Lower Trend Growth? 31 1.10 Lifting Potential Growth in the Pacifi c Islands: Structural Impediments
and the Role of Policies 33 2.1 Cash Transfers in India 46 3.1 Identifying Sustained Slowdowns in Growth 50

iv
REGIONAL ECONOMIC OUTLOOK: ASIA AND PACIFIC
Table
1.1 Asia and Pacifi c: Real GDP 6
Figures
1.1 GDP Growth and Financial Market Conditions 1 1.2 Selected Asia: Equity and Bond Funds––Quarterly Net Flows during 2010–13 1 1.3 Asia: Stock Markets 2 1.4 Asia: Change in Credit to GDP, 2012 2 1.5 Asia: Effective Exchange Rates 2 1.6 Asia: Changes in Real GDP at Market Prices 2 1.7 Selected Asia: Exports to Major Destinations 3 1.8 Asia: Headline Infl ation 3 1.9 Asia: Contributions to 2012 Change in Headline Infl ation Rate 3 1.10 Asia: Current Account Balances 4 1.11 Indicator Model for Asia: Projected vs. Actual Real GDP Growth 5 1.12 Selected Asia: Contributions to Projected Growth 5 1.13 Asia: Financial Conditions Index (FCI) 5 1.14 Emerging Asia: Response of Credit Growth and Long-Term
Interest Rate to Non-FDI Infl ows 6 1.15 Emerging Asia: Response of Domestic Demand to Portfolio Equity Flows 6 1.16 Selected Asia: External Dependence and Role of U.S. and EU Demand
versus Japan and China 7 1.17 Asia: Headline Consumer Price Infl ation 7 1.18 Asia: Real GDP Growth 12 1.19 Asia Financial Stability Heat Map 13 1.20 Asia: Nonfi nancial Corporate Debt-to-Equity Ratio 13 1.21 Corporate Debt-to-Equity Ratio 16 1.22 Selected Asia: Nonfi nancial Corporate Sector––Return on Assets 16 1.23 Selected Asia: Tier 1 Capital Ratio 17 1.24 Selected Asia: Liquidity Ratio 17 1.25 Selected Asia: Return on Assets 17 1.26 Selected Asia: Nonperforming Loans Ratio 17 1.27 Selected Asia: Commercial Banks’ Loss-Absorbing Buffers 17 1.28 Selected Asia: Contribution to Export Growth 18 1.29 Selected Asia: Links to Japan and Export Growth in 2011:Q2 18 1.30 China Slowdown Scenario: Impact on Real GDP after Two Years 18 1.31 Japan Risk Contagion Scenario: Impact on Real GDP after Two Years 19 1.32 Selected Asia: Policy Rates 19 1.33 Selected Asia: Monetary Policy Stances 20

v
CONTENTS
1.34 Output Gap vs. Credit Gap, Latest 20 1.35 Selected Asia: FX Reserve Accumulation 21 1.36 Selected Asia: Cyclically Adjusted Fiscal Balance 24 1.37 Selected Asia: Size of Automatic Stabilizers and Vulnerabilities to a
Slowdown in the United States and European Union 24 1.38 There Seems to Be a Middle-Income Trap 29 2.1 Correlation between Government Spending and GDP 38 2.2 Fiscal Impulse, 2007–12 38 2.3 Procyclicality and Institutional Strength, 1980–2011 39 2.4 Multipliers for Government Spending and Public Investment in Asia, Four-Quarters 40 2.5 Automatic Stabilizers, 2001–11 40 2.6 General Government Revenue and GDP per Capita, 2011 41 2.7 Yields from Personal Income Tax 41 2.8 Yields from Corporate Income Tax 42 2.9 Yields from VAT and Sales Tax 42 2.10 Selected Tax Revenues by Category 43 2.11 Public Investment and Infrastructure 43 2.12 Public Social Spending: Health and Education 44 2.13 Subsidies and Social Benefi ts 44 2.14 Food and Energy Subsidies 44 3.1 Past Growth Trajectories 48 3.2 GDP per Capita Convergence in the Four Asian “Tigers” 48 3.3 GDP per Capita Convergence in Seven Emerging Asian Economies 48 3.4 Contributions to ASEAN Growth before and after the Global Financial Crisis 49 3.5 Frequency of Past Sustained Growth Slowdown Episodes by Region 49 3.6 There Seems to Be a Middle-Income Trap 49 3.7 The Impact of Changes in Fundamentals on the Probability of a Sustained Slowdown 51 3.8 Strengths and Weaknesses of Asian MIEs 52 3.9 Strengths and Weaknesses of Asian MIEs Relative to Other Emerging Regions 52 3.10 Overall Dependency Ratios 53 3.11 Tertiary Education Enrollment 54 3.12 Research and Development Expenditure 54

vi
Definitions
In this Regional Economic Outlook: Asia and Pacifi c, the following groupings are employed:
• “ASEAN” refers to Brunei Darussalam, Cambodia, Indonesia, Lao People’s Democratic Republic, Malaysia, Myanmar, the Philippines, Singapore, Thailand, and Vietnam, unless otherwise specifi ed.
• “East Asia” refers to China, Hong Kong SAR, the Republic of Korea, and Taiwan Province of China.
• “Emerging Asia” refers to China, Hong Kong SAR, India, Indonesia, the Republic of Korea, Malaysia, the Philippines, Singapore, Taiwan Province of China, Thailand, and Vietnam.
• “Industrial Asia” refers to Australia, Japan, and New Zealand.
• “South Asia” refers to Bangladesh, India, and Sri Lanka.
• “Asia” refers to ASEAN, East Asia, Industrial Asia, and South Asia.
• “EU” refers to the European Union.
• “G-7” refers to Canada, France, Germany, Italy, Japan, the United Kingdom, and the United States.
• “G-20” refers to Argentina, Australia, Brazil, Canada, China, the European Union, France, Germany, India, Indonesia, Italy, Japan, the Republic of Korea, Mexico, the Russian Federation, Saudi Arabia, South Africa, Turkey, the United Kingdom, and the United States.
The following abbreviations are used:
AEs advanced economiesAEC ASEAN Economic CommunityASEAN Association of Southeast Asian NationsCCT programs conditional cash transfer programsCDS credit default swapCPI consumer price indexECCU Eastern Caribbean Currency UnionFDI foreign direct investmentFESR Framework for Economic and Social ReformFY fi scal yearGDP gross domestic productGIMF Global Integrated Monetary and FiscalIT information technologyLICs low-income countriesMIEs middle-income economiesOECD Organisation for Economic Co-operation and DevelopmentPICs Pacifi c Island countriesSMP Staff-monitored programVAR vector autoregressionVIX Chicago Board Options Exchange Market Volatility IndexWEO World Economic Outlook

vii
DEFINITIONS
This Regional Economic Outlook: Asia and Pacifi c was prepared by a team coordinated by Romain Duval of the IMF’s Asia and Pacifi c Department, under the overall direction of Anoop Singh. Contribu-tors include Shekhar Aiyar, Dennis Botman, Ezequiel Cabezon, Kevin C. Cheng, Julian Chow, R. Sean Craig, Christian Ebeke, Keiko Honjo, Changchun Hua, André Meier, Kum Hwa Oh, Alexander Pitt, Damien Puy, Phurichai Rungcharoenkitkul, Sampawende Tapsoba, Patrizia Tumbarello, Tao Sun, Olaf Unteroberdoerster, Yiqun Wu, Longmei Zhang, and Edda Zoli. Sidra Rehman and Dulani Seneviratne provided research assistance. Lesa Yee provided production assistance. Joseph Procopio of the IMF’s Communications Department edited the volume with Gregg Forte and Martha Bonilla, and coordinated its publication and release. This report is based on data available as of April 8 and includes comments from other departments and some Executive Directors.
The following conventions are used:
• In tables, a blank cell indicates “not applicable,” ellipsis points (. . .) indicate “not available,” and 0 or 0.0 indicates “zero” or “negligible.” Minor discrepancies between sums of constituent fi gures and totals are due to rounding.
• In fi gures and tables, shaded areas show IMF projections.
• An en dash (–) between years or months (for example, 2007–08 or January–June) indicates the years or months covered, including the beginning and ending years or months; a slash or virgule (/) between years or months (for example, 2007/08) indicates a fi scal or fi nancial year, as does the abbreviation FY (for example, FY2009).
• An em dash (—) indicates the fi gure is zero or less than half the fi nal digit shown.
• “Billion” means a thousand million; “trillion” means a thousand billion.
• “Basis points” refer to hundredths of 1 percentage point (for example, 25 basis points are equivalent to ¼ of 1 percentage point).
As used in this report, the term “country” does not in all cases refer to a territorial entity that is a state as understood by international law and practice. As used here, the term also covers some territorial entities that are not states but for which statistical data are maintained on a separate and independent basis.


ix
The global economy shows signs of improving as major tail risks emanating from advanced economies have receded. Asia also faces better prospects. After a year of subdued economic performance, growth in Asia is set to pick up gradually in the course of 2013, to about 5¾ percent, on strengthening external demand and continued robust domestic demand. Consumption and private investment are expected to be supported by favorable labor market conditions—unemployment is at multiyear lows in several economies—and relatively easy fi nancial conditions. The latter refl ect a combination of accommodative monetary policies; rapid credit growth, particularly in China and some ASEAN economies; and the rebound of capital infl ows since the summer of 2012. Asia is also expected to benefi t from intraregional demand spillovers; they mainly refl ect growing Chinese demand and the near-term fi scal stimulus in Japan but also, in the case of ASEAN economies, growing integration in fi nal consumer goods trade. Consistent with the moderate pickup in growth and absent shocks to global food and commodity prices, infl ation is expected to remain broadly unchanged from 2012 and generally within central banks’ explicit or implicit comfort zones.
Risks to the outlook have become more balanced since the October 2012 Asia and Pacifi c Regional Economic Outlook Update (IMF, 2012d), mainly because the risk of an acute euro area crisis has diminished and the U.S. “fi scal cliff ” has been alleviated. However, the potential impact of external shocks on Asia’s open economies remains considerable, and risks and challenges from within the region have come into clearer focus in recent months. To begin with, fi nancial imbalances and rising asset prices, fueled by strong credit growth and easy fi nancing conditions, are building in several economies. A number of other regional risks are more diffi cult to anticipate but could prove disruptive given Asia’s highly integrated supply-chain network and growing dependence on regional demand and fi nance. These include trade disruptions from a natural disaster or geopolitical tensions, a loss of confi dence in Japan’s efforts to restore economic health, or an unexpected slowdown in China.
Asia’s policymakers face a delicate balancing act in the near term: guarding against a buildup of fi nancial imbalances and managing a transition to rebuilding policy space while delivering appropriate support for growth. Against the backdrop of uncertain growth prospects, Asian central banks in 2012 maintained their already low policy rates or reduced them further. With infl ation remaining low and stable, this accommodative stance has been welcome. But fi nancial imbalances are often persistent and cannot be easily unwound, and output levels are close to or slightly above trend in most economies; hence, monetary policymakers should stand ready to respond early and decisively to any prospective risks of overheating. However, the need and direction for future monetary policy action differs substantially across economies, mainly in line with differing exposures to shifting growth risks and risks to fi nancial stability from past stimulus. In emerging Asia, macroprudential measures will also have to play an important role where credit growth remains too rapid and could pose problems for fi nancial stability, especially if accompanied by persistently strong capital infl ows. In general, Asia has buffers to cope with such risks, as banking and corporate sector balance sheets remain generally sound, but these imbalances require careful monitoring and adequate supervision.
Executive Summary
(continued )

x
REGIONAL ECONOMIC OUTLOOK: ASIA AND PACIFIC
Country circumstances—including the need for demand rebalancing and the available policy space—will also determine the appropriate pace of fi scal consolidation. In many Asian economies, structural defi cits that are higher than precrisis levels imply the need for greater efforts to rebuild fi scal space, especially as projected improvements in structural fi scal balances remain small on current policy. Some fi scal consolidation could also help preempt the potential overheating pressures from continued strong capital infl ows. With risks more balanced than they were six months ago, automatic stabilizers should provide a suffi cient fi rst line of defense if, and as long as, growth were to disappoint only somewhat.
Strengthening fi scal space and frameworks is also needed to achieve sustained inclusive growth over the medium term. As highlighted in Chapter 2, bold discretionary action in Asia during the global recession was emblematic of the region’s increasingly effective fi scal management over the past decade in responding to shocks and thereby in helping to smooth GDP fl uctuations. However, there is the growing need to make revenue and expenditure policies more growth-friendly, make growth more resilient through automatic stabilizers, and ensure that Asia’s growing prosperity is shared across all income groups.
Furthermore, as fl agged in Chapter 3, emerging Asia is potentially susceptible to the “middle-income trap,” a phenomenon whereby economies risk stagnation at middle-income levels and fail to graduate into the ranks of advanced economies. To sustain high rates of per capita income growth across the region, the policy agenda will have to vary by jurisdiction across a range of priorities, including economic rebalancing, strengthening infrastructure investment, reforms in goods and labor markets, and meeting the challenges from rapid demographic change.
1
1. Managing Shifting Risks
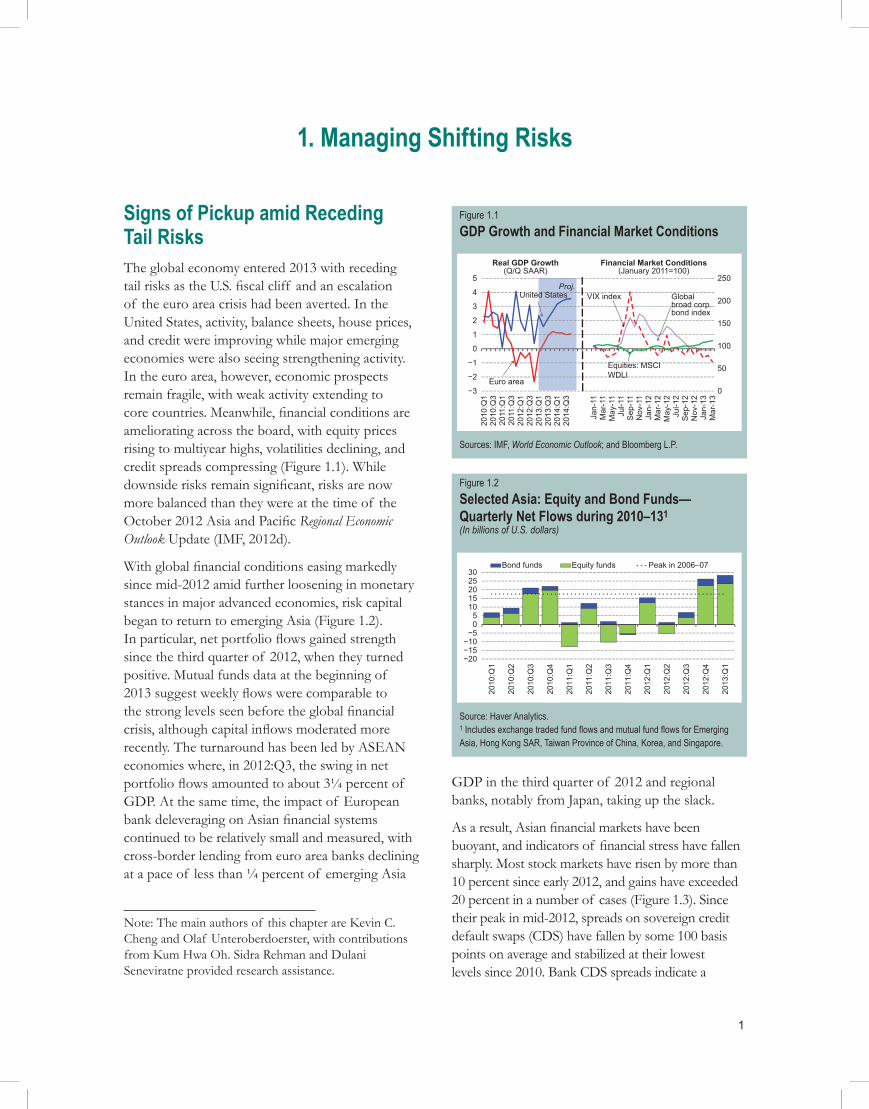
Signs of Pickup amid Receding Tail RisksThe global economy entered 2013 with receding tail risks as the U.S. fi scal cliff and an escalation of the euro area crisis had been averted. In the United States, activity, balance sheets, house prices, and credit were improving while major emerging economies were also seeing strengthening activity. In the euro area, however, economic prospects remain fragile, with weak activity extending to core countries. Meanwhile, fi nancial conditions are ameliorating across the board, with equity prices rising to multiyear highs, volatilities declining, and credit spreads compressing (Figure 1.1). While downside risks remain signifi cant, risks are now more balanced than they were at the time of the October 2012 Asia and Pacifi c Regional Economic Outlook Update (IMF, 2012d).
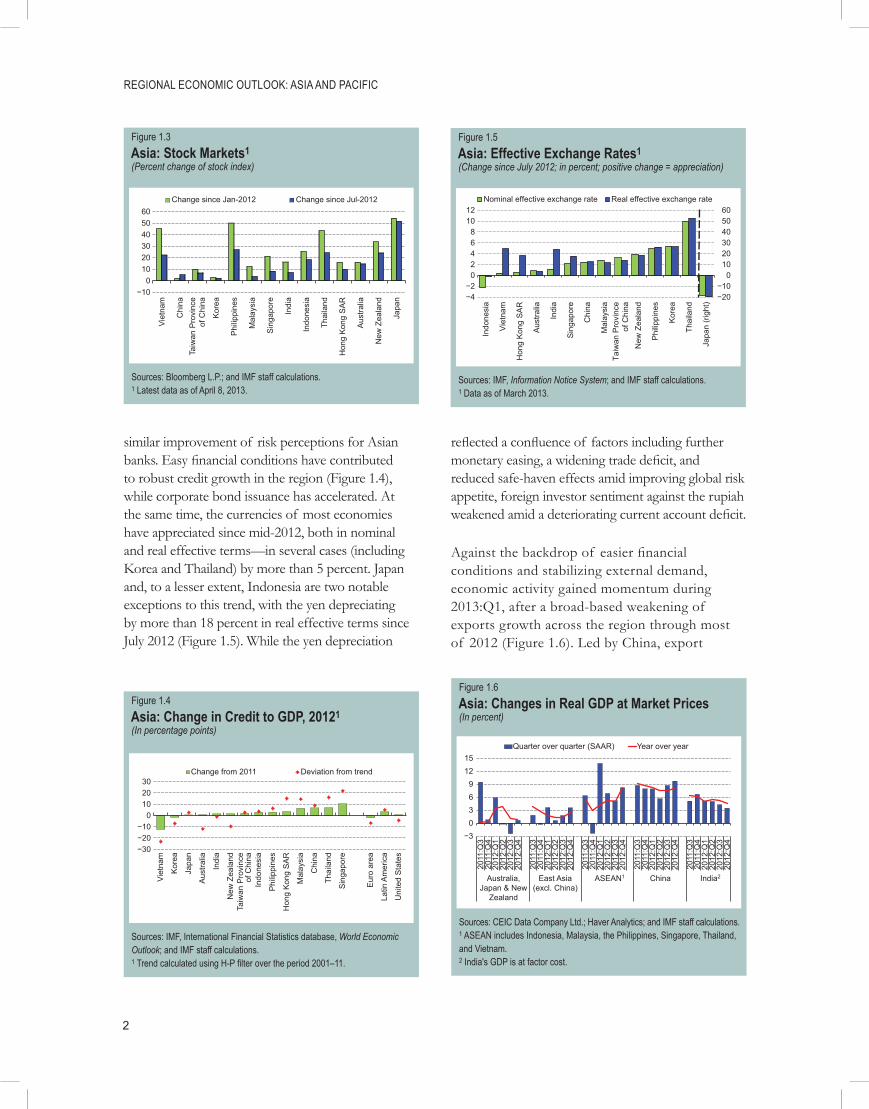
With global fi nancial conditions easing markedly since mid-2012 amid further loosening in monetary stances in major advanced economies, risk capital began to return to emerging Asia (Figure 1.2). In particular, net portfolio fl ows gained strength since the third quarter of 2012, when they turned positive. Mutual funds data at the beginning of 2013 suggest weekly fl ows were comparable to the strong levels seen before the global fi nancial crisis, although capital infl ows moderated more recently. The turnaround has been led by ASEAN economies where, in 2012:Q3, the swing in net portfolio fl ows amounted to about 3¼ percent of GDP. At the same time, the impact of European bank deleveraging on Asian fi nancial systems continued to be relatively small and measured, with cross-border lending from euro area banks declining at a pace of less than ¼ percent of emerging Asia
Note: The main authors of this chapter are Kevin C. Cheng and Olaf Unteroberdoerster, with contributions from Kum Hwa Oh. Sidra Rehman and Dulani Seneviratne provided research assistance.
Figure 1.1GDP Growth and Financial Market Conditions
0
50
100
150
200
250
−3
−2
−1
0
1
2
3
4
5
2010
:Q1
2010
:Q3
2011
:Q1
2011
:Q3
2012
:Q1
2012
:Q3
2013
:Q1
2013
:Q3
2014
:Q1
2014
:Q3
Jan-
11M
ar-1
1M
ay-1
1Ju
l-11
Sep
-11
Nov
-11
Jan-
12M
ar-1
2M
ay-1
2Ju
l-12
Sep
-12
Nov
-12
Jan-
13M
ar-1
3
Real GDP Growth(Q/Q SAAR)
Financial Market Conditions(January 2011=100)
Euro area
VIX index
Equities: MSCIWDLI
Globalbroad corp.bond index
United StatesProj.
Sources: IMF, World Economic Outlook; and Bloomberg L.P.
GDP in the third quarter of 2012 and regional banks, notably from Japan, taking up the slack.
As a result, Asian fi nancial markets have been buoyant, and indicators of fi nancial stress have fallen sharply. Most stock markets have risen by more than 10 percent since early 2012, and gains have exceeded 20 percent in a number of cases (Figure 1.3). Since their peak in mid-2012, spreads on sovereign credit default swaps (CDS) have fallen by some 100 basis points on average and stabilized at their lowest levels since 2010. Bank CDS spreads indicate a
Figure 1.2Selected Asia: Equity and Bond Funds—Quarterly Net Flows during 2010–131(In billions of U.S. dollars)
−20−15−10−5
05
1015202530
2010
:Q1
2010
:Q2
2010
:Q3
2010
:Q4
2011
:Q1
2011
:Q2
2011
:Q3
2011
:Q4
2012
:Q1
2012
:Q2
2012
:Q3
2012
:Q4
2013
:Q1
Bond funds Equity funds Peak in 2006–07
Source: Haver Analytics.1 Includes exchange traded fund fl ows and mutual fund fl ows for Emerging Asia, Hong Kong SAR, Taiwan Province of China, Korea, and Singapore.
REGIONAL ECONOMIC OUTLOOK: ASIA AND PACIFIC
2
similar improvement of risk perceptions for Asian banks. Easy fi nancial conditions have contributed to robust credit growth in the region (Figure 1.4), while corporate bond issuance has accelerated. At the same time, the currencies of most economies have appreciated since mid-2012, both in nominal and real effective terms—in several cases (including Korea and Thailand) by more than 5 percent. Japan and, to a lesser extent, Indonesia are two notable exceptions to this trend, with the yen depreciating by more than 18 percent in real effective terms since July 2012 (Figure 1.5). While the yen depreciation
Figure 1.3Asia: Stock Markets1(Percent change of stock index)
−100
102030405060
Viet
nam
Chi
na
Kor
ea
Phi
lippi
nes
Mal
aysi
a
Sin
gapo
re
Indi
a
Indo
nesi
a
Thai
land
Hon
g K
ong
SA
R
Aus
tralia
New
Zea
land
Japa
n
Change since Jan-2012 Change since Jul-2012Ta
iwan
Pro
vinc
eof
Chi
na
Sources: Bloomberg L.P.; and IMF staff calculations.1 Latest data as of April 8, 2013.
Figure 1.4Asia: Change in Credit to GDP, 20121(In percentage points)
−30−20−10
0102030
Viet
nam
Kor
ea
Japa
n
Aus
tralia
Indi
a
New
Zea
land
Indo
nesi
a
Phi
lippi
nes
Hon
g K
ong
SA
R
Mal
aysi
a
Chi
na
Thai
land
Sin
gapo
re
Eur
o ar
ea
Latin
Am
eric
a
Uni
ted
Sta
tes
Change from 2011 Deviation from trend
Taiw
an P
rovi
nce
of C
hina
Sources: IMF, International Financial Statistics database, World Economic Outlook; and IMF staff calculations.1 Trend calculated using H-P fi lter over the period 2001–11.
Figure 1.6Asia: Changes in Real GDP at Market Prices(In percent)
−30369
1215
2011
:Q3
2011
:Q4
2012
:Q1
2012
:Q2
2012
:Q3
2012
:Q4
2011
:Q3
2011
:Q4
2012
:Q1
2012
:Q2
2012
:Q3
2012
:Q4
2011
:Q3
2011
:Q4
2012
:Q1
2012
:Q2
2012
:Q3
2012
:Q4
2011
:Q3
2011
:Q4
2012
:Q1
2012
:Q2
2012
:Q3
2012
:Q4
2011
:Q3
2011
:Q4
2012
:Q1
2012
:Q2
2012
:Q3
2012
:Q4
Australia,Japan & New
Zealand
East Asia(excl. China)
ASEAN1 China India2
Quarter over quarter (SAAR) Year over year
Sources: CEIC Data Company Ltd.; Haver Analytics; and IMF staff calculations.1 ASEAN includes Indonesia, Malaysia, the Philippines, Singapore, Thailand, and Vietnam.2 India's GDP is at factor cost.
refl ected a confl uence of factors including further monetary easing, a widening trade defi cit, and reduced safe-haven effects amid improving global risk appetite, foreign investor sentiment against the rupiah weakened amid a deteriorating current account defi cit.
Against the backdrop of easier fi nancial conditions and stabilizing external demand, economic activity gained momentum during 2013:Q1, after a broad-based weakening of exports growth across the region through most of 2012 (Figure 1.6). Led by China, export
Figure 1.5Asia: Effective Exchange Rates1(Change since July 2012; in percent; positive change = appreciation)
−20−10
0102030405060
−4−2
02468
1012
Indo
nesi
a
Vie
tnam
Hon
g K
ong
SA
R
Aus
tralia
Indi
a
Sin
gapo
re
Chi
na
Mal
aysi
a
New
Zea
land
Phi
lippi
nes
Kor
ea
Thai
land
Japa
n (r
ight
)
Nominal effective exchange rate Real effective exchange rate
Taiw
an P
rovi
nce
of C
hina
Sources: IMF, Information Notice System; and IMF staff calculations.1 Data as of March 2013.

1. MANAGING SHIFTING RISKS
3
growth has begun to pick up. In part, the rise refl ects a combination of supply-chain links and fi rming demand across Asia and from advanced economies, notably the United States (Figure 1.7). In addition, purchasing managers indexes for manufacturing have improved across the region and reentered expansionary territory in recent months, although they remain below their averages before the global fi nancial crisis. At the same time, notably in China and, to a lesser extent, leading ASEAN economies, private domestic demand has remained robust with relatively favorable fi nancial and labor market conditions supporting stable consumer confi dence, buoyant investment, and robust retail sales.
Across much of Asia, headline infl ation slowed markedly through 2012, in many cases by some 2 percentage points; the notable exceptions were India, Indonesia, and, to a lesser extent, Thailand (Figure 1.8). Declines were generally driven by moderating food and commodity prices, although in several cases, second-round effects from weaker activity also contributed (Figure 1.9). Core infl ation in early 2013 was low and stable, at or below 2 percent in a number of economies, including China, Korea, and Malaysia. At the same time, defl ation persisted in Japan, where headline and core infl ation fell to a negative 0.1 percent and negative 0.2 percent, respectively, at end-2012.
Consistent with weak external demand and relatively strong domestic conditions, the region’s trade and current account balances continued to shrink substantially in 2012. While China has played a prominent role in this decline, balances have also declined substantially in Japan, leading ASEAN economies, and India (Figure 1.10).
Against the broad regional trends, the dynamics and composition of growth have varied signifi cantly across Asia in 2012 and early 2013.
Figure 1.9Asia: Contributions to 2012 Change in Headline Infl ation Rate(In percentage points)
−12−9−6−3
0369
12
−4−3−2−1
01234
Indi
a
Indo
nesi
a
Japa
n
Thai
land
Aus
tralia
New
Zea
land
Sin
gapo
re
Phi
lippi
nes
Chi
na
Mal
aysi
a
Hon
g K
ong
SA
R
Kor
ea
Viet
nam
(rig
ht)
Contribution from foodContribution from other pricesContribution from fuelChange in headline inflation rate
Taiw
an P
rovi
nce
of C
hina
Sources: CEIC Data Company Ltd.; Haver Analytics; and IMF staff calculations.
Figure 1.7Selected Asia: Exports to Major Destinations(Three-month percent change of three-month moving average; SAAR)
−40
−20
0
20
40
60
80
Sep
-09
Dec
-09
Mar
-10
Jun-
10S
ep-1
0D
ec-1
0M
ar-1
1Ju
n-11
Sep
-11
Dec
-11
Mar
-12
Jun-
12S
ep-1
2Ja
n-13
Sep
-09
Dec
-09
Mar
-10
Jun-
10S
ep-1
0D
ec-1
0M
ar-1
1Ju
n-11
Sep
-11
Dec
-11
Mar
-12
Jun-
12S
ep-1
2Ja
n-13
to U.S. to Euro area to Japan to China
Sources: CEIC Data Company Ltd; Haver Analytics; and IMF staff calculations.
Figure 1.8Asia: Headline Infl ation(Year-over-year percent change)
−4
0
4
8
12
16
20
24
−2
0
2
4
6
8
10
12
Japa
n
New
Zea
land
Mal
aysi
a
Kor
ea
Aus
tralia
Chi
na
Phi
lippi
nes
Sin
gapo
re
Thai
land
Hon
g K
ong
SA
R
Indo
nesi
a
Indi
a
Viet
nam
(rig
ht)
End-2011 End-2012
Taiw
an P
rovi
nce
of C
hina
Sources: CEIC Data Company Ltd.; Haver Analytics; and IMF staff calculations.

REGIONAL ECONOMIC OUTLOOK: ASIA AND PACIFIC
4
• Activity in Japan entered a short-lived recession after the middle of 2012 as consumption was hit by the expiration of eco-friendly car subsidies, and exports decreased in conjunction with weakening external demand. However, signs of a turnaround emerged in early 2013 due to rising business sentiment and gradually improving industrial production. Growth in Australia was around its trend pace in 2012, after peaking at 4 percent in the fi rst half of 2012, although some non-mining sectors remained under pressure from the strong currency, partly driven by the heightened appetite of international investors for Australia’s government debt. In New Zealand, a modest recovery from the 2012 earthquake, fuelled by reconstruction spending, was held back by high household debt and sluggish private consumption.
• In East Asia, the Chinese government’s effort to achieve a soft landing has been confi rmed with a moderate pickup of growth in the fourth quarter of 2012, led in part by more credit-fi nanced infrastructure investment and a recovery of exports. In Korea, exports that led the sharp slowdown in 2012 have stabilized, but consumption remained subdued notwithstanding a cut in policy rates of 50 basis points and the adoption of two modest fi scal packages.
• In South Asia, a drop of private investment over rising policy uncertainty exacerbated supply bottlenecks in India, which contributed
to headline infl ation that was high compared with that of most other Asian economies, despite a sharp growth slowdown during 2012. In Sri Lanka, tighter policies in early 2012 to rein in credit and import growth contributed to slowing activity last year.
• Many ASEAN economies, especially Indonesia, Malaysia, the Philippines, and Thailand, bucked regional trends—growth held up on robust domestic demand, in part supported by accommodative monetary and fi scal stances and fueled by rapid credit expansion.
• Exports of Asian low-income economies slackened, although external headwinds were mitigated in some cases: by privileged access to advanced economies (such as the European Union in the case of Cambodia), resilient remittances (Bangladesh and Nepal), and rapid domestic credit growth (Cambodia and the Lao People’s Democratic Republic). More recently, export growth has gained momentum for a number of garment manufacturers, while sharply higher exports and imports in Myanmar in the fi rst quarter of 2013 also refl ected an improved business environment and the suspension of sanctions. On the other hand, recovery in the Pacifi c Island economies has continued to be held back by delays in growth-friendly structural reforms and in infrastructure investments to improve connectivity.
Stronger Prospects in the Period Ahead Hinge on Internal Demand DynamicsA small, gradual pickup in growth is expected to continue throughout 2013, underpinned by continued robust domestic demand and some modest strengthening in external demand (Figure 1.11, refl ecting readings from a broad range of high-frequency activity indicators covering industrial Asia, large emerging market economies, and smaller export-dependent economies). Growth for Asia as a whole is forecast to increase to about 5¾ percent in 2013 and 6 percent in 2014 (Table 1.1 and Figure 1.12). The main elements
Figure 1.10Asia: Current Account Balances(In percent of GDP)
−6
−4
−2
0
2
4
6
8
Australia,Japan & New
Zealand
China East Asia(excl. China)
ASEAN1 India
2010 2011 2012 (est.)
Source: IMF, World Economic Outlook.1 ASEAN includes Indonesia, Malaysia, the Philippines, Singapore, Thailand, and Vietnam.

1. MANAGING SHIFTING RISKS
5
supporting this resilient domestic demand are labor markets and capital infl ows:
• Labor market conditions are strong, supporting robust consumer confi dence and household disposable income. Broadly, unemployment rates have fallen further over the past year and are substantially lower than their precrisis averages, in several cases—including Hong Kong SAR and Singapore—by more than 1 percentage point. At the same time, real wages have continued to climb across the region, including in China, where productivity has been strong and the
Figure 1.11Indicator Model for Asia: Projected vs. Actual Real GDP Growth(In percent; q/q seasonally adjusted annualized rate)
−6
−3
0
3
6
9
12
15
2005
:Q1
2005
:Q3
2006
:Q1
2006
:Q3
2007
:Q1
2007
:Q3
2008
:Q1
2008
:Q3
2009
:Q1
2009
:Q3
2010
:Q1
2010
:Q3
2011
:Q1
2011
:Q3
2012
:Q1
2012
:Q3
2013
:Q2
Confidence interval (1 standard deviation) WEO forecastActual growth rate (PPP weighted) Model forecast
Sources: CEIC Data Company Ltd.; Haver Analytics; IMF, World Economic Outlook; and IMF staff calculations.
working-age population as a share of the total population is projected to decline after 2015.
• Capital infl ows to emerging Asia are likely to remain buoyant, in light of push factors (easy monetary conditions in Western advanced economies and reduced risk aversion) and pull factors (notably growth and return differentials vis-à-vis advanced economies). Financial conditions have generally eased in early 2013, mainly as a result of the higher stock prices and rapid credit growth (Figure 1.13), thereby providing an impetus to economic activity going forward. In particular, portfolio equity fl ows are estimated to boost private consumption and investment in Asia mainly by raising asset prices and boosting credit growth. For emerging Asia as a whole, an increase of 1 percent of GDP in such portfolio fl ows is estimated to translate into a rise of about ½ percentage point in private consumption growth, and a 1½ percentage point increase in investment growth after three to four quarters (Figures 1.14 and 1.15).
Regional economies are also expected to benefi t from growing spillovers of internal demand. For some of the more advanced open economies, such as Korea and Taiwan Province of China, direct and indirect exposure to demand from China and Japan is as important as exposure to demand from
Figure 1.12Selected Asia: Contributions to Projected Growth(In percentage points; year over year)
−4−2
02468
1012
2012 2013 2012 2013 2012 2013 2012 2013 2012 2013
Australia,Japan & New
Zealand
China East Asia(excl. China)
India ASEAN1
Net exports Public domestic demand
Private domestic demand Growth
Sources: IMF, World Economic Outlook; and IMF staff calculations.1 ASEAN includes Indonesia, Malaysia, the Philippines, Singapore, Thailand, and Vietnam.
Figure 1.13Asia: Financial Conditions Index (FCI)(Index; increase = loosening of fi nancial conditions)
−10−8−6−4−2
02468
Jan-
07A
pr-0
7Ju
l-07
Oct
-07
Jan-
08A
pr-0
8Ju
l-08
Oct
-08
Jan-
09A
pr-0
9Ju
l-09
Oct
-09
Jan-
10A
pr-1
0Ju
l-10
Oct
-10
Jan-
11A
pr-1
1Ju
l-11
Oct
-11
Jan-
12A
pr-1
2Ju
l-12
Sep
-12
Nov
-12
Feb-
13
Australia, Japan & New Zealand ChinaEast Asia (excl. China) IndiaASEAN1
Source: IMF staff estimates (see Osorio, Pongsaparn, and Unsal, 2011, "A Quantitative Assessment of Financial Conditions in Asia," IMF Working Paper 11/170, for details). 1 ASEAN includes Indonesia, Malaysia, the Philippines, Singapore, and Thailand.

REGIONAL ECONOMIC OUTLOOK: ASIA AND PACIFIC
6
Figure 1.15Emerging Asia: Response of Domestic Demand to Portfolio Equity Flows1(In percentage points)
−0.6
0
0.6
1.2
1.8
−0.2
0.0
0.2
0.4
0.6
1 2 3 4 5 6 7 8 9 10 1 2 3 4 5 6 7 8 9 10Quarters
Private consumption(left scale)
Gross fixed investment(right scale)
Source: IMF staff estimates.1 Includes the Philippines, Malaysia, Thailand, Indonesia, India, Korea, and Taiwan Province of China. Response of quarter-on-quarter annualized growth to 1 percentage point of GDP increase in net infl ows.
Figure 1.14Emerging Asia: Response of Credit Growth and Long-Term Interest Rate to Non-FDI Infl ows1(In percentage points)
−0.4−0.3−0.2−0.1
0.00.10.2
−0.40.00.40.81.21.6
1 2 3 4 5 6 7 8 9 10 1 2 3 4 5 6 7 8 9 10
Period change Cumulative change 1 S.D.
Quarters
Credit growth (left scale) Long-term interest rate(right scale)
Source: IMF staff estimates.1 Includes the Philippines, Malaysia, Thailand, Indonesia, India, Korea, and Taiwan Province of China. Response of quarter-on-quarter annualized growth to 1 percentage point of GDP increase in net infl ows of each type.
Table 1.1. Asia and Pacific: Real GDP(Year-over-year percent change)
Actual Data and Latest ProjectionsDifference from
October 2012 WEO
2010 2011 2012 2013 2014 2012 2013 2014Australia 2.6 2.4 3.6 3.0 3.3 0.3 0.0 0.1Japan 4.7 –0.6 2.0 1.6 1.4 –0.2 0.4 0.3New Zealand 1.8 1.4 2.5 2.7 2.6 0.3 –0.3 –0.1
East Asia 9.9 8.2 6.7 7.1 7.5 –0.1 –0.3 –0.3China 10.4 9.3 7.8 8.0 8.2 0.0 –0.2 –0.3Hong Kong SAR 6.8 4.9 1.4 3.0 4.4 –0.4 –0.5 0.1Korea 6.3 3.6 2.0 2.8 3.9 –0.7 –0.8 –0.1Taiwan Province of China 10.8 4.1 1.3 3.0 3.9 –0.1 –0.9 –0.6
South Asia 10.9 7.7 4.2 5.7 6.3 –0.8 –0.3 –0.2Bangladesh 6.4 6.5 6.1 6.0 6.4 0.0 –0.1 –0.4India 11.2 7.7 4.0 5.7 6.2 –0.9 –0.3 –0.2Sri Lanka 8.0 8.2 6.4 6.3 6.7 –0.3 –0.5 0.3
ASEAN 7.6 4.6 5.7 5.5 5.5 0.5 0.0 0.0Brunei Darussalam 2.6 2.2 1.3 1.2 6.0 –1.4 –0.4 1.1Cambodia 6.1 7.1 6.5 6.7 7.2 0.0 0.0 0.0Indonesia 6.2 6.5 6.2 6.3 6.4 0.2 0.0 –0.1Lao People's Democratic Republic
8.1 8.0 8.3 8.0 7.7 0.0 0.0 0.0
Malaysia 7.2 5.1 5.6 5.1 5.2 1.2 0.4 0.2Myanmar 5.3 5.5 6.3 6.5 6.6 0.1 0.2 0.2Philippines 7.6 3.9 6.6 6.0 5.5 1.8 1.2 0.5Singapore 14.8 5.2 1.3 2.0 5.1 –0.8 –0.9 1.5Thailand 7.8 0.1 6.4 5.9 4.2 0.9 –0.1 –0.3Vietnam 6.8 5.9 5.0 5.2 5.2 –0.1 –0.6 –1.2
Small States1 3.7 4.5 3.8 3.6 3.5 –0.1 –0.3 0.0Pacific Island Countries2 2.5 3.2 2.6 2.2 2.5 –0.3 –0.3 0.2Emerging Asia3 10.1 8.2 6.7 7.2 7.4 –0.1 –0.2 –0.2Asia, Total 8.6 6.1 5.3 5.7 6.0 –0.2 –0.2 –0.1Source: IMF staff projections.1 Small states include Bhutan, Fiji, Kiribati, Maldives, Marshall Islands, Micronesia, Palau, Samoa, Solomon Islands, Timor-Leste, Tonga, Tuvalu, and Vanuatu.2 Pacific Island Countries include Fiji, Kiribati, Marshall Islands, Micronesia, Palau, Papua New Guinea, Samoa, Solomon Islands, Tonga, Tuvalu, and Vanuatu.3 Emerging Asia includes China, India, Indonesia, Malaysia, the Philippines, Thailand, and Vietnam.

1. MANAGING SHIFTING RISKS
7
the United States and Europe (Figure 1.16). They should therefore benefi t from the ongoing recovery in China and the stimulus measures in Japan. Recent exchange rate movements are unlikely to materially affect this outlook, as they have been generally moderate, and supply-chain links tend to dampen their impact on external competitiveness (see IMF, 2011b: April 2011 Regional Economic Outlook: Asia and Pacifi c). From a historical perspective, export market shares of Asian economies remained close to trend despite large swings in real effective exchange rates in the aftermath of the global fi nancial crisis.2 Moreover, in the case of ASEAN economies, growing integration in fi nal consumer goods trade may also contribute to favorable intraregional demand dynamics (Box 1.1).
While leading indicators also point to a recovery of Asia’s electronics exports, the role of the information technology (IT) sector as Asia’s traditional engine of industrial growth is becoming more varied across the region. As highlighted in Box 1.2, the IT sectors in East Asia, led by China and Taiwan Province of China, have had a relatively
2 Since mid-2012 the yen depreciated by over 18 percent in real effective terms, while many other regional currencies appreciated by about 3–6 percent. This follows real effective exchange rate movements of more than 20 percent between mid-2008 and 2010 for a number of economies, including Japan (increase) and Korea (decrease).
strong recovery, with exports exceeding precrisis trends as early as 2011. In these economies, IT sectors have undergone a longer-term upgrading with a steady rise in the share of high-tech outputs, such as semiconductors, fl ash drives, and fi ber-optical devices. By contrast, in economies where the share of medium-tech output continues to play a dominant role, export growth has been weaker, and often the share of IT in overall exports has shrunk, including in the Philippines, and to a lesser extent Indonesia and Thailand.
Infl ation is expected to remain generally within central banks’ explicit or implicit comfort zones, with the notable exception of India. Consistent with the moderate pickup in growth and a stable outlook for global food and commodity prices, headline infl ation would average 3.3 percent in 2013, only slightly higher than the 2012 average of 3.2 percent and would rise to 3.7 percent in 2014 (Figure 1.17).
In addition to these general trends, important country-specifi c factors infl uence this outlook:
• In Japan, a sizable fi scal stimulus—about 1½ percent of GDP over two years—will boost growth by some 0.6 percentage point in 2013, and growth will be further supported by a recovery in external demand and the substantial further monetary easing under the recently announced quantitative and qualitative
Figure 1.16Selected Asia: External Dependence and Role of U.S. and EU Demand versus Japan and China(Value-added basis; average 2005–10)
Indonesia
Malaysia
Philippines
Singapore
Thailand
TaiwanProvinceof China Korea
0.3
0.4
0.5
0.6
0.7
0.8
0.9
1.0
1.1
1.2
15 25 35 45 55 65 75
Dem
and
from
Jap
an a
nd C
hina
rela
tive
to d
eman
d fro
m U
.S. a
nd E
U
Total export value added in percent of GDP
Greater opennessand reliance on China
and Japan
Sources: U.N. Comtrade database; and IMF staff calculations.
Figure 1.17Asia: Headline Consumer Price Infl ation1(Year over year; in percent)
−1
0
1
2
3
−4
0
4
8
12
New
Zea
land
Thai
land
Kor
ea
Mal
aysi
a
Aus
tralia
Phi
lippi
nes
Chi
na
Hon
g K
ong
SA
R
Sin
gapo
re
Indo
nesi
a
Vie
tnam
Indi
a
Japa
n (r
ight
)
Latest 2014 forecast 2013 forecast Target
Taiw
an P
rovi
nce
of C
hina
Sources: CEIC Data Company Ltd.; Haver Analytics; and IMF, World Economic Outlook; and IMF staff projections.1 Target refers to mid-point of headline infl ation target band (Australia, Korea, New Zealand, Indonesia, Japan and Philippines). Core infl ation and core infl ation target band mid-point (Thailand). For India WPI is used. Japan 2014 projection includes effects of consumption tax increase.

REGIONAL ECONOMIC OUTLOOK: ASIA AND PACIFIC
8
Box 1.1
ASEAN-5 Integration as a Source of Resilience1
Intraregional trade among ASEAN-5 economies currently accounts for more than 20 percent of this region’s total trade with the world, a larger share than trade with China, Japan, the United States, or the European Union. The large rise in the countries’ trade with China over the past decade can largely be attributed to increasing trade in intermediate goods, as ASEAN-5 and China have integrated to form a new supply-chain network.2 On the other hand, trade in fi nal consumption goods within ASEAN-5 economies has seen a remarkable uptrend (fi gure, top), pointing to the growing signifi cance of domestic consumption as a source of short-term growth and resilience for the region.Besides global demand, intraregional demand is indeed empirically found to be an important driver of ASEAN-5 growth (excluding Indonesia, which has a lower trade-to-GDP ratio and whose major exports, including commodities, are outside ASEAN). A Bayesian vector autoregression analysis highlights the importance of trade shocks (global growth) and fi nancial channels (VIX, a measure of global risk aversion) of global spillovers, over and above shocks to ASEAN-5 trading partners’ growth in determining the region’s growth (fi gure, middle). The increasing role of intraregional trade in fi nal consumption goods, together with a large domestic market, especially in Indonesia, appears to provide the region with a potential source of resilience against global demand shocks.3
Despite the softening of global growth in 2012, robust domestic demand in many ASEAN economies has continued to lend support to growth momentum. Can domestic demand continue to be resilient in the face of external headwinds? A threshold model is estimated for each country, whereby the spillover from external to domestic demand can potentially intensify once the former deteriorates beyond a certain threshold. In relatively open economies such as Malaysia and Thailand, domestic demand is able to withstand external shocks, provided they are not too large; domestic demand in these countries is almost immune to a one-standard-deviation external shock, but is substantially affected once the shock size is doubled (fi gure, bottom).4 For ASEAN as a bloc, there are also signifi cant threshold effects, but it takes a much larger external shock to materially affect the aggregate domestic demand—even a two-standard-deviations shock does not exceed the estimated threshold (fi gure, bottom). Domestic demand for ASEAN as a whole is therefore more resilient than the sum of its parts, refl ecting a boost to resilience afforded by greater intraregional trade integration and pooling of risks among country members.
Note: The main author of this box is Phurichai Rungcharoenkitkul.1 Cubero and others (forthcoming). For purposes here, ASEAN-5 consists of Indonesia, Malaysia, the Philippines, Singapore, and Thailand.2 See Unteroberdoerster and others (2010).3 The effect of China’s growth shocks on ASEAN’s GDP growth appears to be more mixed. While China serves as conduit in transmitting global shocks through the supply chain, shocks to Chinese investment are found to have adverse spillovers.4 External shocks are innovations of exports equations assumed to follow a simple autoregressive process.
Intraregional Exports by Category(In percent of total exports in each category)
10121416182022242628
1990
1991
1992
1993
1994
1995
1996
1997
1998
1999
2000
2001
2002
2003
2004
2005
2006
2007
2008
2009
2010
2011
Capital goods Consumption goods Intermediate goods
Sources: U.N. Comtrade database; and IMF staff calculations.
Accumulated Response of ASEAN-5 (excl. Indonesia) GDP Growth to Cholesky One Standard Deviation Innovations1
0.000
0.004
0.008
0.012
0.016
1 2 3 4 5 6 7 8 9 10
VIX
Global growth
ASEAN-5 growth (excl. IDN)
Indonesia GDP growth
Source: IMF staff estimates.1 The chart includes statistically signifi cant variables only. The model is identifi ed using a standard Cholesky decomposition with lag length of the VAR based on standard information criterion. The variables in the model are ordered as follows, starting with the most exogenous shock: VIX, external GDP growth, global oil prices, other exogenous variables, real ASEAN-4 GDP growth (excluding domestic economy), and domestic real GDP growth. The VIX is included in levels while all other variables are in log fi rst differences.
Next-Quarter Impulse Responses of Domestic Demand to Export Shocks(Percent change; annualized)
−25
−20
−15
−10
−5
0
5
ASEAN IDN MYS PHL THA SGP
2-Standard deviation shock1-Standard deviation shock
Source: IMF staff estimates.

1. MANAGING SHIFTING RISKS
9
Box 1.2
Asia’s Electronics Sector: An Engine of Growth for All?The incipient recovery of Asia’s electronics sector has encompassed all segments, including electrical machinery and telecom equipment (fi gure, top right). Looking at major destinations, exports to China, Japan, and the United States have picked up, while exports to Europe remain depressed. China and other East Asian economies have been the main benefi ciaries of the recovery of electronics exports so far, which is also evident in a broader measure of new orders (manufacturing purchasing managers index), while other economies, including Japan and the Philippines, have been lagging (fi gure, middle right).
The varying strength in the recovery across the region is symptomatic of a longer-term trend whereby the role of electronics as an engine to propel overall growth has been shifting across Asian economies. Indeed, over the past decade, China and closely linked economies in East Asia have become increasingly dependent on electronics exports, while all other economies have diversifi ed away from this sector. For the former, the share of electronics in total exports has increased by some 10–20 percentage points, while for the latter it has fallen by roughly the same order of magnitude (fi gure, bottom left).
This shift in the relative importance of the information technology sector can be partly mapped against the change in the technology mix of exports. Some Asian economies have been able to climb up the value chain to produce a growing share of electronics that are classifi ed as high-tech (parts and components of computers, tablets, smart phones), which also tend to exhibit high growth. Although different economies’ electronics sectors have experienced unique recovery trajectories since the global recession, a common characteristic of the strong recoveries is that they coincided with a general increase in the R&D intensity of exports—notably in China, Hong Kong SAR, Korea, and Thailand (fi gure, bottom right). These trends can also be observed at the fi rm level, where East Asian fi rms have generally experienced faster revenue growth coupled with larger stock price increases.
Asia: Share of Electronics in Total Exports(In percent)
Greater reliance
on electronics
exports
Vietnam
Indonesia
Singapore
ThailandKorea
Japan Malaysia
ChinaPhilippines
TaiwanProvince of
China
Hong Kong SAR
0
10
20
30
40
50
60
70
0 10 20 30 40 50 60 70
Sha
re o
f ele
ctro
nics
in to
tal
expo
rt ba
sket
in 2
012
Share of electronics in total export basket in 2000
Less reliance
on electronics
exports
Sources: CEIC Data Company Ltd.; Haver Analytics; and IMF staff calculations.
Selected Asia: Export Performance and R&D Intensity of the Electronics Sector(In percent)
ASEAN Thailand
Indonesia
China
Singapore
Philippines
Korea
Japan
Hong Kong SAR
−20−10
010203040506070
−60 −40 −20 0 20 40 60Ele
ctro
nics
exp
orts
rela
tive
to p
recr
isis
Pea
k
Change in share of high tech inTotal electronics export basket since 1980s (avg)
Indonesia
Malaysia
Source: U.N. Comtrade database, SITC Rev. 2.1 Based on OECD Technology Intensity Defi nition.
Note: The main author of this box is Sidra Rehman.
Selected Asia: Contribution to Electronics Export Growth1 (Year-over-year; in percent)
−30
−15
0
15
30
45
Jan-
08A
pr-0
8Ju
l-08
Oct
-08
Jan-
09A
pr-0
9Ju
l-09
Oct
-09
Jan-
10A
pr-1
0Ju
l-10
Oct
-10
Jan-
11A
pr-1
1Ju
l-11
Oct
-11
Jan-
12A
pr-1
2Ju
l-12
Oct
-12
Jan-
13
Other Office machines Telecom equipmentElectrical machinery Export growth rate
Sources: CEIC Data Company Ltd; Haver Analytics; and IMF staff calculations.1 China, Hong Kong SAR, Japan, Korea, Indonesia, Malaysia, the Philippines, and Thailand.
Selected Asia: Contribution to Electronics Export Growth (Year-over-year; in percent)
−40−30−20−10
01020304050
Jan-
08A
pr-0
8Ju
l-08
Oct
-08
Jan-
09A
pr-0
9Ju
l-09
Oct
-09
Jan-
10A
pr-1
0Ju
l-10
Oct
-10
Jan-
11A
pr-1
1Ju
l-11
Oct
-11
Jan-
12A
pr-1
2Ju
l-12
Oct
-12
Jan-
13
China ASEAN1
East Asia (excl. China) Japan
Export Growth
Sources: CEIC Data Company Ltd; Haver Analytics; and IMF staff calculations.1 ASEAN includes Indonesia, Malaysia, the Philippines, Singapore, Thailand, and Vietnam.

REGIONAL ECONOMIC OUTLOOK: ASIA AND PACIFIC
10
Box 1.3
Effects and Spillover Channels of Successful Refl ation in Japan Ending defl ation is one of the cornerstones of Prime Minister Abe’s economic policies. The government is pursuing a three-pronged approach (“Three Arrows of Abenomics”) to revive the economy: fl exible fi scal policy, a higher infl ation target and more aggressive monetary easing, and structural reforms to raise long-term growth.
Immediate action has included the setting of a 2 percent infl ation target and fi scal stimulus amounting to about 1½ percent of GDP in effective terms in fi scal year 2013/14. To achieve its infl ation objectives, the Bank of Japan recently adopted a new quantitative and qualitative monetary easing (QQE) framework. In a sweeping change, it announced a shift to the monetary base as its new operational target in an effort to achieve the infl ation target within two years. Under the new regime, the Bank of Japan seeks to double the monetary base to ¥270 trillion (55 percent of GDP) by 2014, implemented through asset purchases of ¥7 trillion per month primarily of government bonds (the quantity aspect). In addition, the Bank of Japan widened the scope of purchases to include bonds of all maturities with the goal of doubling the average remaining maturity of outstanding bonds from three to seven years. It also increased planned purchases of private assets, mainly exchange-traded funds (ETFs) and real estate investment trusts (REITs) to stimulate activity directly (the quality aspect).
Expectations and the announcement of the new policy direction have had immediate effects, particularly on asset markets. Equity markets have risen with the improved outlook, especially for exporters and banks, and longer-dated government bond yields have declined to record lows. The new monetary policy framework also contributed to the weakening of the exchange rate, although other factors have also played a role: a reversal of safe-haven effects following an improving global outlook, sustained trade defi cits and, recently, the widening of the expected interest rate differential with the United States.
The medium-term effects of the new policies on the Japanese economy and hence the resulting spillovers on other economies in the region depend on a number of factors, including the stickiness of infl ation expectations and the details of the new fi scal and growth strategy:
• Simulations using the IMF’s Global Integrated Monetary and Fiscal Model (GIMF) suggest that the faster infl ation expectations rise toward the new target, the greater the growth and fi scal dividends. In GIMF, we simulate a shift in the infl ation target, with fi scal policy assumed to adjust throughout the simulation period as needed to meet the new target over the medium term. In a hypothetical case where infl ation expectations immediately jump to the new target compared to one where a rise occurs only gradually over the next fi ve years and the sovereign risk premium goes up, real GDP would be higher by 2 percent and the net debt-to-GDP ratio would be lower by 10 percentage points by 2015. In this favorable scenario, debt dynamics would improve due to lower real funding costs and higher growth. However, in light of the large holdings of sovereign debt by Japanese banks, this transition needs to be carefully managed given possible repercussions on fi nancial stability if yields were to spike. In addition, fi scal risks would increase if infl ation expectations adjust more gradually. A comprehensive package of reforms including an ambitious medium-term fi scal and growth strategy would increase the likelihood that infl ation expectations rise quickly and in a sustainable manner and an increase in the sovereign risk premium is avoided.
• Refl ating the economy in a sustainable manner also depends crucially on the details of a new fi scal and growth strategy due this summer. The more ambitious structural reforms are, the more likely infl ation expectations will
Note: The main authors of this box are Dennis Botman and Keiko Honjo.
Bank of Japan: Monetary Base Target and Balance Sheet Projection(In trillions of yen (LHS); and in percent of GDP (RHS))
0
10
20
30
40
50
60
0
50
100
150
200
250
300
350
Dec-12 Dec-13 Dec-14Proejction
JGBsCommercial papersCorporate bonds Exchange-traded funds (ETFs)Japan real estate investment trusts (J-REITs)Loan support programOthers Monetary base in percent of GDP (RHS)
Source: Bank of Japan.

1. MANAGING SHIFTING RISKS
11
Box 1.3 (concluded )
rise; the more credible fi scal reforms are, the lower the risks of a sudden rise in bond yields. At present, the authorities’ medium-term fi scal goals are based on commitments to the G-20—halving the defi cit-to-GDP ratio between FY 2010 and FY 2015, and achieving surplus by FY 2020 of the national and local governments’ primary balances. In the short term, fi scal consolidation reduces demand for imports from trading partners, but in the long term, it boosts global saving, thereby reducing interest rates and stimulating activity in trading partners (IMF, 2011c). Growth-enhancing structural reforms are likely to have positive spillovers. For example, Japan’s participation in the Trans-Pacifi c Partnership agreement could yield positive welfare gains for countries in the region and for emerging market economies more generally (IMF, 2011c).
Spillover channels of a successful effort to refl ate Japan are likely to operate through the exchange rate as well as higher growth in Japan but are complicated by supply-chain considerations.1 Prior to Japan’s new macroeconomic policies, the medium-term outlook for Japan’s economy included a very gradual recovery with mild infl ation, trend real currency appreciation, and limited nominal wage growth; it also held the prospect of rising government bond yields, as the investor base would increasingly become nonresident given the rising fi nancing requirement amid population aging. Compared with this baseline, a successful refl ation would entail higher growth, a more depreciated currency, and possibly lower interest rates. Spillovers could occur through several channels:
• Financial spillovers: Greater monetary easing in Japan, together with a rising current account surplus over the medium term, would imply capital outfl ows. On past trends, only a modest share of these fl ows would go to the rest of Asia, where they would put downward pressure on interest rates and upward pressure on the exchange rate. However, a successful exit from defl ation and persistent yen depreciation could reduce the home bias of domestic investors and lead to a rebalancing of their portfolios to include a larger share of foreign assets, especially from Asia. Japanese banks and businesses have already been increasingly active overseas, replacing retreating European banks in the region and diversifying their activities in the process, and increasing foreign direct investment (FDI)—a rise of 1 percent of GDP in Japanese FDI boosts growth by 0.5–0.7 percentage point in recipient countries (IMF, 2012c). Outward FDI is a long-term trend and unlikely to change in a fundamental way, as fi rms aim to locate where the demand is growing and take advantage of cost differentials. The fi scal dividends of a successful refl ation could also reduce the medium-term risk of a sharp rise in yields on Japanese government bonds (see Chapter 1), which could adversely affect growth around the world through a tightening in lending conditions from the rise in risk premiums.
• Trade spillovers: Stronger growth in Japan would benefi t other countries, especially those that supply fi nal goods to Japan. A weaker yen has more complicated and mixed implications. For countries that directly compete with Japan in third markets, this may undermine their competitiveness. However, this effect is mitigated, as yen depreciation also raises production costs in Japan through higher costs of imported intermediate inputs, including energy. Likewise, many countries in the region import intermediate goods from Japan, which become cheaper with yen depreciation, although possibly at the expense of domestic suppliers to exporters. For example, Japan accounts for one-fi fth of the world’s semiconductor production (constituting more than 50 percent of U.S. and Chinese imports) and for more than one-third of global exports of machinery and wafers (more than 35 percent of U.S. and Chinese imports) (IMF, 2011c). Hence, the spillover effect of yen depreciation is far from uniform and depends on a country’s position in the supply chain.
1 The 2013 IMF Spillover Report (IMF, 2012c) will attempt to quantify these spillovers.
monetary easing framework in pursuit of the 2 percent infl ation target (Box 1.3).
• In East Asia, growth is projected to be 8 percent in China resulting from continued
robust domestic demand, both consumption and investment, and some improvement in external demand in the course of 2013. Nevertheless, given signifi cant, albeit

REGIONAL ECONOMIC OUTLOOK: ASIA AND PACIFIC
12
uncertain, slack in the economy, infl ation is expected to pick up only modestly by about 1⁄3 percentage point and average 3 percent in 2013. In Korea, an improved outlook for exports would support private investment, with growth projected to rebound moderately while infl ation, although rising, would remain at the lower bound of the target band.
• In South Asia, notwithstanding a modest growth recovery in India on a more favorable external demand environment, deep-rooted structural challenges are expected to exert a substantial drag on potential growth while keeping infl ation at elevated levels by regional standards. In Sri Lanka, growth is expected to remain broadly stable, as continued macroeconomic stabilization should restrain domestic demand, while export growth is projected to remain tepid.
• Growth in ASEAN economies is expected to remain robust, mainly on account of resilient domestic demand. Over and above the supportive factors discussed above, in Malaysia, a large number of projects under the Economic Transformation Plan will propel strong investment; in the Philippines, robust remittance fl ows are expected to underpin private consumption and investment; and in Indonesia, demand would likely benefi t from an external source—a recovery of Chinese demand for commodities.
• A modest pickup of growth, generally less than ½ percentage point, is also expected for Asia’s low-income economies, in part because of stable or improving external demand for energy and related commodities (the Lao People’s Democratic Republic and Mongolia) and garments (Bangladesh and Cambodia). In Myanmar, moving to a higher potential growth trajectory will depend on ongoing reform momentum to promote private investment, while the return to higher growth in Vietnam assumes further consolidation of recent gains in macroeconomic stability and fi nancial sector restructuring.
More Balanced, but Shifting RisksRisks to this forecast have become more balanced since the October 2012 Asia and Pacifi c Regional Economic Outlook Update (Figure 1.18). In particular, global tail risks have receded, as highlighted in the April 2013 World Economic Outlook. Nevertheless, the considerable risks of a stalled or incomplete achievement of euro area policy commitments could derail the global economic recovery. The impact of external risks on Asia remains substantial. In the event of a severe global slowdown, capital fl ow reversals and falling external demand would exert a powerful drag on Asia’s most open economies, including through the second-round impact of lower investment and employment in export-oriented sectors. For example, a reassessment of sovereign risks in advanced economies, possibly linked to setbacks in resolving the euro area crisis and prompting further fi scal tightening and lower growth (see the April 2013 World Economic Outlook, Chapter 1), would reduce growth in emerging Asia by about 1 percentage point per year over 2013–14. Given that many developing and low-income economies in the region are dependent on income remitted from abroad, a severe global slowdown could also be transmitted through lower remittances, although there are certain mitigating factors that would dampen the spillover effects (Box 1.4).
While global risks have receded, risks and challenges from within the region come into clearer focus. One
Figure 1.18Asia: Real GDP Growth(Central forecast and selected confi dence intervals; in percent)
0123456789
2009 2010 2011 2012 2013 2014
50 percent confidence interval 70 percent confidence interval90 percent confidence interval90 percent confidence interval (2012)
Central forecast
Sources: IMF, World Economic Outlook; and IMF staff estimates.

1. MANAGING SHIFTING RISKS
13
such risk, in particular in emerging Asia, stems from the gradual buildup of fi nancial imbalances related to rapid credit growth and rising asset prices on the back of continued strong capital infl ows. Although country circumstances differ and could worsen relatively quickly, fi nancial stability risks do not appear to raise major immediate concerns at this stage:
• The buildup of fi nancial imbalances has generally not been large. New fi nancial heat maps suggest that risks of price bubbles are forming in the housing, equity, and credit markets in certain economies. While they generally appear to be moderate at the aggregate level by historical standards, the heat maps do not pick up excessive pressures in specifi c subsegments of asset markets. Markets have clearly warmed up, notably in several ASEAN economies, although they are not yet overheating (Figure 1.19).
• The corporate and household sector balance sheets appear generally robust. For most economies in the region, leverage has picked up recently but has remained moderate by historical standards; the debt-to-equity ratio remains below its median level recorded during 2002–07, refl ecting
signifi cant deleveraging in the aftermath of the global fi nancial crisis (Figure 1.20). Compared with other regions, debt-to-equity ratios for corporate sectors in Asian economies are generally below levels observed in the United
Figure 1.19Asia Financial Stability Heat Map1
Z-score at or above 2; momentum increasing Z-score at or above 0.5, but less than 1Z-score at or above 2; momentum decreasing or no change Z-score at or above −0.5, but less than 0.5Z-score at or above 1, but less than 2; momentum increasing. Z-score at or above −2, but less than −0.5Z-score at or above 1, but less than 2; momentum decreasing or no change Z-score less than −2
AUSCHNHKG IDN IND JPNKORMYSNZL PHLSGPTHA AUSCHNHKG IDN IND JPNKORMYSNZL PHLSGPTHA AUSCHNHKG IDN IND JPNKORMYSNZL PHLSGPTHA08:Q2 1 1 1 -1 3 -1 2 -1 1 2 3 -1 0 0 0 0 0 1 3 -1 0 1 3 0 0 0 0 1 -1 0 1 -1 0 1 0 008:Q3 0 1 0 -1 3 0 2 -1 1 2 1 -1 -1 0 0 0 0 1 3 -1 0 3 3 0 0 0 0 -1 -1 -1 0 -1 0 -1 -1 008:Q4 -1 1 0 -1 2 -1 1 -1 0 2 0 -1 -1 0 3 0 0 3 3 0 1 2 3 0 -1 0 -1 -1 -1 -1 -1 -1 -1 -1 -1 -109:Q1 -1 2 0 -1 2 -1 1 -1 0 3 -1 -1 -1 3 0 -1 -1 5 2 1 1 3 2 1 -1 0 -1 -1 -1 -1 0 -1 -1 -1 0 -109:Q2 0 2 0 -1 1 -1 1 -1 0 2 -1 -1 -1 5 0 -1 0 4 1 3 0 2 2 1 1 0 0 2 2 2 2 1 2 0 2 009:Q3 0 2 1 -1 0 -1 1 -1 0 1 0 -1 -1 2 0 -1 0 5 0 5 0 1 1 1 3 0 0 3 3 2 1 3 3 1 2 009:Q4 1 2 1 -1 0 -1 1 -1 0 1 0 -1 -1 2 0 -1 0 2 0 4 -1 3 0 1 1 0 0 1 3 1 0 3 2 0 -1 110:Q1 1 2 2 -1 -1 -1 1 -1 0 0 1 -1 -1 0 1 -1 -1 2 -1 4 -1 1 0 0 1 0 0 1 1 2 0 2 1 1 -1 110:Q2 1 1 2 -1 -1 -1 0 -1 0 0 2 -1 -1 0 3 0 -1 0 -1 2 -1 0 0 0 0 0 0 1 1 -1 0 1 -1 1 0 110:Q3 1 1 3 -1 -1 -1 0 0 0 0 2 -1 -1 0 5 0 -1 0 -1 0 -1 0 0 0 0 0 0 2 2 -1 0 2 -1 2 0 210:Q4 1 0 3 -1 -1 -1 0 1 0 0 1 -1 -2 0 5 0 -1 -1 -1 0 -1 0 0 0 0 0 0 1 1 -1 1 2 0 1 0 111:Q1 0 0 3 -1 -1 -1 0 1 0 0 1 -1 -2 0 5 0 -1 -1 -1 0 -1 0 1 1 0 0 0 1 1 -1 1 2 0 1 0 111:Q2 0 -1 4 -1 -1 -1 1 2 0 0 1 -1 -2 0 4 0 0 0 -1 1 -1 3 3 3 0 -1 -1 1 0 -1 1 2 0 0 0 211:Q3 0 -1 2 -1 -1 -1 1 2 0 0 1 -1 -1 -1 1 0 -1 1 0 1 -1 3 3 3 -1 -1 -1 1 -1 -1 0 1 -1 -1 -1 111:Q4 0 -1 2 -1 1 0 1 3 0 0 0 -1 -1 0 1 0 -1 3 0 1 -1 3 3 3 -1 -1 -1 1 -1 -1 0 2 -1 -1 0 112:Q1 0 -1 2 -1 0 1 1 1 0 0 0 -1 -1 0 0 0 -1 2 0 1 -1 5 3 3 -1 -1 -1 1 -1 -1 0 1 0 -1 1 212:Q2 -1 -1 3 -1 -1 1 1 3 0 0 0 -1 -1 0 0 0 0 0 0 3 -1 2 2 3 -1 -1 -1 1 -1 -1 1 1 0 -1 2 212:Q3 -1 -1 4 -1 0 1 1 1 0 1 0 -1 -1 3 0 0 -1 0 0 3 -1 2 2 3 -1 -1 -1 1 0 -1 0 1 0 0 2 112:Q4 -1 -1 4 -1 2 1 0 … 0 1 0 -1 -1 1 0 0 -1 0 0 2 0 3 3 1 0 -1 -1 1 0 -1 0 2 0 0 3 2
Residential real estate2 Credit to GDP growth3 Equity Markets4
Source: IMF staff calculations.1 Colors represent the extent of the deviation from the long-term median expressed in the number of median-based standard deviations (median-based Z-scores) as well as momentum (whether variables are increasing or decreasing). Medians and standard deviations are for the period starting 2000:Q1, where data are available. 2 Estimated using the simple average of ratios of house-price-to-rent and price-to-income.3 Year-over-year growth of credit-to-GDP ratio. 4 Estimated using the simple average of ratios of price-to-earnings and price-to-book value.
Figure 1.20Asia: Nonfi nancial Corporate Debt-to-Equity Ratio(In precent; market-cap weighted mean)
0306090
120150180
Hon
g K
ong
SA
RA
ustra
lia
New
zea
land
Indo
nesi
aM
alay
sia
Kor
eaTh
aila
ndIn
dia
Japa
nV
ietn
amC
hina
Sin
gapo
reP
hilip
pine
s
Asi
a2
Eur
o ar
ea4
Uni
ted
Sta
tes
2011 2012 (est.)1 Median (2002–07)
Taiw
an P
rovi
nce
of C
hina
Latin
Am
eric
a3
Sources: IMF, Corporate Vulnerability Utility (CVU); Thomson Reuters Datastream; Moody's Analytics, Credit Edge; and IMF staff calculations.1 New Zealand, India, Australia, and Japan 2012 estimate from CVU. Others 2012 estimate based on Credit Edge.2 Asia 2012 is weighted by market-cap of 2011 from CVU.3 Latin America is a market-cap weighted mean of Argentina, Brazil, Chile, Colombia, Peru, and Venezuela. 4 Euro Area 2012 estimate excludes Cyprus, Slovenia, and Malta.

REGIONAL ECONOMIC OUTLOOK: ASIA AND PACIFIC
14
Box 1.4
Remittances: Shock Amplifi er or Absorber for Emerging and Developing Asia?
Asia is a major recipient of global remittances, and many emerging market and developing economies in the region rely heavily on them. With infl ows of about $110 billion (fi gure, top left), Asia and the Pacifi c accounted for about one-fourth of all remittances sent worldwide in 2010.1 For many economies, remittances rival public aid and dwarf other fl ows such as net exports or net portfolio and foreign direct investment (FDI) infl ows. Overall, remittances received during the past decade equaled 6½ percent of GDP of the countries covered here, on par with net aid and double the amount of net FDI receipts. In relative terms, the Pacifi c Island countries are most dependent on income remitted from abroad (fi gure, top right).
Remittances Infl ows in Selected Regions (In billions of U.S. dollars)
0
20
40
60
80
100
120
2000 2001 2002 2003 2004 2005 2006 2007 2008 2009 2010
Asia and PacificEastern Europe and Central AsiaLatin America and CaribbeanMiddle East and North AfricaSub-Saharan Africa
Source: World Bank, World Development Indicators.
Net Foreign Earnings in Selected Asia and Pacifi c Countries (Net fl ows in percent of GDP, 2000–11)
−20−15−10−5
05
1015202530
Middle income Low income Pacific islands
RemittancesFDI
Official aidPortfolio Net exports
Source: World Bank, World Development Indicators.
Overall, remittances have helped stabilize domestic business cycles, although they also increase exposure to external shocks originating in host countries.
• To assess business cycle stabilization achieved via remittances, the determinants of output growth volatility have been estimated while controling for other determinants of volatility, such as openness, the level of development, and population. The econometric fi ndings show that, on average, remittances act as an important hedging instrument for developing economies in general and for those in Asia and the Pacifi c in particular (table).
• Looking at synchronicity between host and recipient countries’ business cycles instead of output volatility, we fi nd that remittance fl ows play an important role in propagating home-country shocks to recipient countries.2 The size of this effect is similar to that of the impact of trade (table). By contrast, aid and FDI are not found to be statistically signifi cant determinants of business cycle comovements.
• However, external spillovers from remittances are subject to threshold effects and are stronger the larger the fl ows between the host and recipient countries (fi gure, bottom). The positive impact of remittances on the synchronization
Note: The main authors of this box are Christian Ebeke and Sampawende Tapsoba.1 Asian and Pacifi c countries covered in this note comprise six middle-income countries (India, Indonesia, Malaysia, Philippines, Sri Lanka, and Thailand), seven low-income states (Bangladesh, Cambodia, Lao People’s Democratic Republic, Maldives, Mongolia, Nepal, and Vietnam), and seven Pacifi c Island countries (Fiji, Kiribati, Papua New Guinea, Samoa, Solomon Islands, Tonga, and Vanuatu).2 Estimated over a sample of 18 Asian and Pacifi c countries (India and Vietnam are excluded in the sample mentioned above) over the period 1990–2010. For a given home country X, host country real GDP growth is calculated as the average across the major destinations for outward migration from X, using the migration shares as weights.

1. MANAGING SHIFTING RISKS
15
Box 1.4 (concluded ) of output growth
materializes only once the remittances-to-GDP ratio exceeds 8 percent; it remains fl at beyond this threshold. If a home country receives remittances of at least 8 percent of GDP per year (e.g., Bangladesh, Kiribati, Mongolia, Nepal, Philippines, Samoa, Tonga, Vanuatu), a 1 percentage-point increase in the host country’s real growth is estimated to increase the home country’s real growth by about ½ percentage point that same year.
• A mitigating factor on external spillovers is that Asia has more geographically diversifi ed sources of remittances than other regions, making it less sensitive to shocks originating in a particular host country. Indeed, despite the dominance of the intraregional fl ows—accounting for more than half of the total—the share of remittances channeled from the Middle East and North Africa and Europe remained fairly sizable and roughly evenly distributed.
What are the implications for emerging market and developing economies in the Asia-Pacifi c region? When remittance fl ows are considered, the region is more connected to the global economy and is therefore more vulnerable to external spillovers—in particular from host-country economic shocks—than traditional indicators of connectedness would imply.
• In large recipients—such as many Pacifi c Island economies, developing economies such as Bangladesh, and even emerging market economies like the Philippines—the design and implementation of near-term policies could be signifi cantly improved by closely monitoring and gaining a better grasp of business cycle features in countries where outward migrants are predominant.
• For central bankers, managing remittance fl ows could be challenging. Large and sudden infl ows may exert contradictory effects on infl ation and competitiveness and may weaken monetary policy transmission via excess liquidity. The task is even harder when infl ows are not funneled through offi cial channels; the scope for fi ne-tuning monetary operations is then quite limited. For fi scal authorities, remittances sent by the diaspora could be an alternative and credible source of budget and project fi nancing via diaspora bonds.
Nonlinear Effect of Remittances on Output Synchronicity(Asia and Pacifi c countries)
−1.5
−1.0
−0.5
0.0
0.5
1.0
1.5
2.0
1% 5% 9% 13% 17% 21% 25% 29% 33%
95% confidence interval Spillover coefficient
Home countries with remittance/GDP ratiosat least as great as values above
Effe
ct o
n ho
me
coun
try G
DP
grow
th(p
erce
ntag
e po
ints
)
Source: IMF staff estimates.
Remittances, Output Volatility, and Output Synchronicity
Dependent variableVolatility (10-year moving
window, 1990–2010)
Synchronicity (yearly, host and recipient countries,
1980–2010), standardized coefficients
Full sample Asia and Pacific Full sample Asia and Pacific
Remittances-to-GDP –1.169** –3.260** 0.0807* 0.207*
(0.546) (1.215) (0.0452) (0.110)
Trade openness 0.226* 0.235 0.171*** 0.277**
(0.127) (0.223) (0.0479) (0.127)
FDI-to-GDP –0.911** –1.084 0.0937*** 0.0444
(0.361) (1.600) (0.0264) (0.0484)
Aid-to-GDP 0.295 0.908 –0.152** –0.0518
(0.264) (0.754) (0.0610) (0.0929)
Log (Real GDP pc) –0.579*** –1.028***
(0.173) (0.346)
Log (Pop.) –1.480*** –2.539**
(0.463) (1.202)
Observations 1821 279 2392 360
Number of countries 120 18 120 18
Source: IMF staff estimates.Note: Includes intercept and country and time fixed effects. Robust standard errors are in parentheses. *** p < 0.01, ** p < 0.05, * p < 0.1.

REGIONAL ECONOMIC OUTLOOK: ASIA AND PACIFIC
16
States, the euro area, and, to a lesser extent, emerging economies in Latin America (Figure 1.21). Furthermore, for most economies, Asian businesses have stronger liquidity positions than those in other regions, as indicated by higher quick ratios (the liquid assets of a fi rm net of inventories divided by liquid liabilities). The share of foreign currency debt is generally moderate in the region, despite some rapid growth in the issuance of foreign currency debt in Indonesia in 2011, and to a lesser extent 2012. Finally, profi tability ratios for Asia’s corporate sector also remain rather solid and stable (Figure 1.22). For the household sector, leverage has picked up, particularly in Malaysia, New Zealand, and Korea, where lending by banks to households at around 60 percent or more of GDP is relatively high for the region, but household debt-to-income ratios remain broadly in line with historical averages.
• The banking sector has weathered the global fi nancial crisis intact. Banks in Asia have generally strengthened their capital positions over the past few years, even though Tier 1 capital ratios in most emerging Asia economies remain below capital ratios found in advanced economies and emerging market economies of Latin America (Figure 1.23). Furthermore, the global fi nancial crisis also generally did relatively little damage to
Asian banks’ profi tability and liquidity, although many Asian banks did not fare as well as their counterparts in Latin America and the United States in these areas (Figures 1.24 and 1.25). Finally, the prevalence of nonperforming loans has declined and is also generally small compared with other regions, although this does not refl ect the potential adverse impact of the recent credit expansion on asset quality (Figure 1.26).
That said, fi nancial imbalances can worsen relatively quickly and are often diffi cult to unwind. While banks in the region have built up buffers—Tier 1 capital in excess of regulatory levels plus loan-loss reserves minus bad loans—which should help contain the impact of potential imbalances, buffers in a number of Asian economies remain somewhat below those found in the United States and emerging market economies in Latin America (Figure 1.27). Moreover, a full assessment of risks is complicated where fi nancial intermediation undergoes rapid change. In China, in particular, the use of more market based fi nancial instruments means that total social fi nancing is growing fast and about half of fi nancial intermediation now takes place outside traditional banking channels in less well supervised parts of the fi nancial system.
A number of other regional risks to growth are more diffi cult to anticipate. But Asia’s highly
Figure 1.21Corporate Debt-to-Equity Ratio1(Cap-weighted mean; in percent; 2011)
Australia
China
Hong Kong SAR
India
Indonesia
Japan
Korea
Malaysia
New zealand Philippines
Singapore
Taiwan Provinceof China
Thailand
Vietnam
Asia
Euro area
United States
Latin America
0
50
100
150
200
250
300
350
400
450
0 50 100 150 200
Fina
ncia
l sec
tor
Nonfinancial sector
Sources: IMF, Corporate Vulnerability Utility (CVU); Thomson Reuters Datastream; and IMF staff calculations. 1 Latin America is a market-cap-weighted average of Argentina, Brazil, Chile, Colombia, Peru, and Venezuela. Vietnam's data start in 2006. For the Philippines, an outlier is excluded from the calculation of the cap-weighted mean for the fi nancial sector.
Figure 1.22Selected Asia: Nonfi nancial Corporate Sector—Return on Assets(In percent; cap-weighted mean)
05
101520
Japa
n
New
Zea
land
Kor
ea
Sin
gapo
re
Chi
na
Mal
aysi
a
Aus
tralia
Hon
g K
ong
SA
R
Phi
lippi
nes
Thai
land
Indi
a
Viet
nam
2
Indo
nesi
a
Eur
o ar
ea
Asi
a3
Uni
ted
Sta
tes
Latin
Am
eric
a4
2011 2012 (est.)1 Median (2002–2007)
Taiw
an P
rovi
nce
of C
hina
Sources: IMF, Corporate Vulnerability Utility; Thomson Reuters Datastream; Bloomberg L.P.; and IMF staff calculations. 1 New Zealand, India, Australia and Japan 2012 data from CVU. Others latest available quarterly data from Bloomberg L.P.2 Vietnam's data starts in 2006.3 Asia 2012 is weighted by market-cap of 2011 from CVU.4 Latin America is a market-cap weighted average of Argentina, Brazil, Chile, Colombia, Peru, and Venezuela.

1. MANAGING SHIFTING RISKS
17
integrated supply-chain network and growing dependence on regional demand and fi nance could make those risks disruptive. They include disruptions to trade; and, over the medium term, an unexpected slowdown in China, and in Japan a rise in the sovereign risk premium in the absence of a credible medium-term fi scal and growth strategy.
• Trade disruptions from, for example, a natural disaster or geopolitical tensions. Asian economies have formed highly integrated supply-chain networks. Across the region, intermediate goods have been the primary driver of export growth for the past two decades, accounting for
Figure 1.23Selected Asia: Tier 1 Capital Ratio (In percent)
02468
1012141618
Indi
a
Chi
na
Aus
tralia
Kor
ea
Thai
land
New
Zea
land
Mal
aysi
a
Japa
n
Hon
g K
ong
SA
R
Indo
nesi
a
Sin
gapo
re
Phi
lippi
nes
Latest Median1 (2002–07) United StatesLatin America Euro area
Taiw
an P
rovi
nce
of C
hina
Sources: Bankscope; and IMF staff calculations.1 For Korea and Malaysia median (2000-latest).
Figure 1.24Selected Asia: Liquidity Ratio1(In percent)
05
1015202530354045
Indi
a
Kor
ea
Japa
n
New
Zea
land
Aus
tralia
Thai
land
Sin
gapo
re
Mal
aysi
a
Phi
lippi
nes
Indo
nesi
a
Chi
na
Hon
g K
ong
SA
R
Latest Median2 (2002–07) United StatesLatin America Euro area
Taiw
an P
rovi
nce
of C
hina
Sources: Bankscope; and IMF staff calculations.1 Total liquid assets to total deposits plus borrowing.2 For Korea and Malaysia median (2000-latest).
Figure 1.26Selected Asia: Nonperforming Loans Ratio(In percent; asset-weighted mean)
0
2
4
6
8
10
12H
ong
Kon
g S
AR
Chi
na
Aus
tralia
Sin
gapo
re
New
Zea
land
Kor
ea
Indo
nesi
a
Mal
aysi
a
Japa
n
Indi
a
Thai
land
Phi
lippi
nes
Latest Median1 (2002–07) United StatesLatin America Euro area
Taiw
an P
rovi
nce
of C
hina
Sources: Bankscope; and IMF staff calculations.1 For Korea and Malaysia median (2000-latest).
Figure 1.27Selected Asia: Commercial Banks' Loss-Absorbing Buffers1(In percent of risk-weighted assets; asset-weighted mean)
−202468
Indi
a
Aus
tralia
Japa
n
New
Zea
land
Kor
ea
Thai
land
Chi
na
Mal
aysi
a
Hon
g K
ong
SA
R
Phi
lippi
nes
Indo
nesi
a
Sin
gapo
re
Tier-1 capital in excess of 8.5%Loan loss reserves less nonperforming loans
Effective bufferLatin America
Taiw
an P
rovi
nce
of C
hina
United States Euro areaAsia
Sources: Bankscope; and IMF staff calculations.1 Loss absorbing buffers are calculated as Tier 1 capital in excess of 8.5 percent plus loan loss reserves less impaired loans as percent of total risk-weighted assets.
Figure 1.25Selected Asia: Return on Assets(In percent; asset-weighted mean)
0.0
0.5
1.0
1.5
2.0
2.5
Japa
n
Kor
ea
Aus
tralia
New
Zea
land
Indi
a
Sin
gapo
re
Chi
na
Mal
aysi
a
Hon
g K
ong
SA
R
Thai
land
Phi
lippi
nes
Indo
nesi
a
Latest Median1 (2002–07) United StatesLatin America Euro area
Taiw
an P
rovi
nce
of C
hina
Sources: Bankscope; and IMF staff calculations.1 For Korea and Malaysia median (2000-latest).

REGIONAL ECONOMIC OUTLOOK: ASIA AND PACIFIC
18
about 70 percent of annual export growth, or more than double the combined contribution of fi nal capital and consumer goods (Figure 1.28). As Asian economies increasingly depend on each other to cater to fi nal markets, a break in part of the chain can ripple through the whole network and disrupt exports across Asia. The 2011 earthquake and tsunami that hit Japan illustrates this effect. In the aftermath, industrial production and exports slowed sharply across the region, and more so in those economies that depended heavily on intermediate inputs from Japan (Figure 1.29).
• Chinese slowdown led by sharply lower investment. While the near-term outlook has improved, China remains vulnerable to a renewed growth slowdown further down the road. This could be triggered by fi nancial stress related to rapid growth in alternative fi nancial products or uneven progress in reforms that would affect confi dence, foreign direct investment (FDI), and private investment. In all cases except, notably, Japan, regional central banks would make use of their sizable monetary policy space to cut policy rates, thereby mitigating the impact of an external shock originating in China. Taking into account this policy response, if Chinese investment, the main engine of domestic demand growth so far, were to fall 10 percent below the baseline––an illustrative
low-probability but high-impact scenario—output across the region would decline by about ½ to 2 percent relative to the baseline forecast at a two-year horizon (Figure 1.30). A more broad-based slowdown across all major emerging economies (including Brazil, India, Russia, and South Africa) would have a somewhat bigger impact (see the April 2013 World Economic Outlook, Chapter 1). Economies like Korea and Japan, which have strong capital-export links to China, would
Figure 1.28Selected Asia: Contribution to Export Growth(In percent of total of total export growth; 1998–2011 average)
0
20
40
60
80
Japan China East Asia (excl.China)
ASEAN1
Capital goods Consumption goods Intermediate goods
Source: U.N. Comtrade database.1 ASEAN includes Indonesia, Malaysia, the Philippines, Singapore, Thailand, and Vietnam.
Figure 1.29Selected Asia: Links to Japan and Export Growth in 2011:Q2(In percent)
Indonesia
Malaysia
Singapore
Thailand
China Taiwan Provinceof ChinaKorea
Philippines−30
−20
−10
0
10
20
30
40
0 2 4 6 8 10 12 14
Dev
iatio
n fr
om tr
end
expo
rt g
row
th1
Share of value added imported fromJapan in total value added
Sources: CEIC Data Company Ltd.; Haver Analytics; and IMF staff calculations.1 Quarterly data used to calculate deviation from trend growth (using HP fi lter over the period 2009:Q1–2012:Q2).
Figure 1.30China Slowdown Scenario: Impact on Real GDP after Two Years (Percent deviation from baseline)
−4.0−3.5−3.0−2.5−2.0−1.5−1.0−0.5
0.0
Chi
na
Japa
n
Kor
ea
Em
ergi
ng A
sia1
Indo
nesi
a
Aus
tralia
Indi
a
Source: IMF staff calculations based on G20MOD.1 Emerging Asia includes Hong Kong SAR, Malaysia, the Philippines, Singapore, Taiwan Province of China, Thailand, and Vietnam.
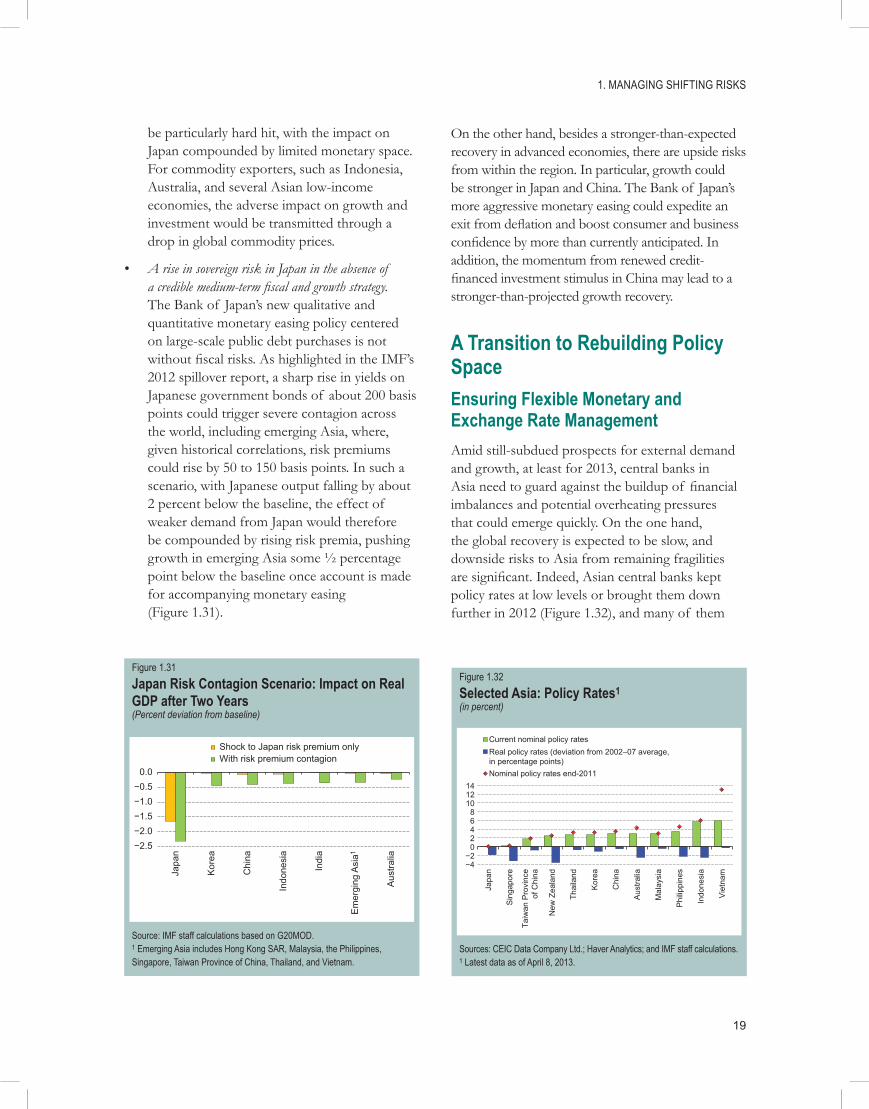
1. MANAGING SHIFTING RISKS
19
be particularly hard hit, with the impact on Japan compounded by limited monetary space. For commodity exporters, such as Indonesia, Australia, and several Asian low-income economies, the adverse impact on growth and investment would be transmitted through a drop in global commodity prices.
• A rise in sovereign risk in Japan in the absence of a credible medium-term fi scal and growth strategy. The Bank of Japan’s new qualitative and quantitative monetary easing policy centered on large-scale public debt purchases is not without fi scal risks. As highlighted in the IMF’s 2012 spillover report, a sharp rise in yields on Japanese government bonds of about 200 basis points could trigger severe contagion across the world, including emerging Asia, where, given historical correlations, risk premiums could rise by 50 to 150 basis points. In such a scenario, with Japanese output falling by about 2 percent below the baseline, the effect of weaker demand from Japan would therefore be compounded by rising risk premia, pushing growth in emerging Asia some ½ percentage point below the baseline once account is made for accompanying monetary easing (Figure 1.31).
On the other hand, besides a stronger-than-expected recovery in advanced economies, there are upside risks from within the region. In particular, growth could be stronger in Japan and China. The Bank of Japan’s more aggressive monetary easing could expedite an exit from defl ation and boost consumer and business confi dence by more than currently anticipated. In addition, the momentum from renewed credit-fi nanced investment stimulus in China may lead to a stronger-than-projected growth recovery.
A Transition to Rebuilding Policy SpaceEnsuring Flexible Monetary and Exchange Rate ManagementAmid still-subdued prospects for external demand and growth, at least for 2013, central banks in Asia need to guard against the buildup of fi nancial imbalances and potential overheating pressures that could emerge quickly. On the one hand, the global recovery is expected to be slow, and downside risks to Asia from remaining fragilities are signifi cant. Indeed, Asian central banks kept policy rates at low levels or brought them down further in 2012 (Figure 1.32), and many of them
Figure 1.31Japan Risk Contagion Scenario: Impact on Real GDP after Two Years (Percent deviation from baseline)
−2.5−2.0−1.5−1.0−0.5
0.0
Japa
n
Kor
ea
Chi
na
Indo
nesi
a
Indi
a
Em
ergi
ng A
sia1
Aus
tralia
Shock to Japan risk premium onlyWith risk premium contagion
Source: IMF staff calculations based on G20MOD.1 Emerging Asia includes Hong Kong SAR, Malaysia, the Philippines, Singapore, Taiwan Province of China, Thailand, and Vietnam.
Figure 1.32Selected Asia: Policy Rates1(in percent)
−4−2
02468
101214
Japa
n
Sin
gapo
re
New
Zea
land
Thai
land
Kor
ea
Chi
na
Aus
tralia
Mal
aysi
a
Phi
lippi
nes
Indo
nesi
a
Vie
tnam
Current nominal policy ratesReal policy rates (deviation from 2002–07 average,in percentage points)Nominal policy rates end-2011
Taiw
an P
rovi
nce
of C
hina
Sources: CEIC Data Company Ltd.; Haver Analytics; and IMF staff calculations.1 Latest data as of April 8, 2013.
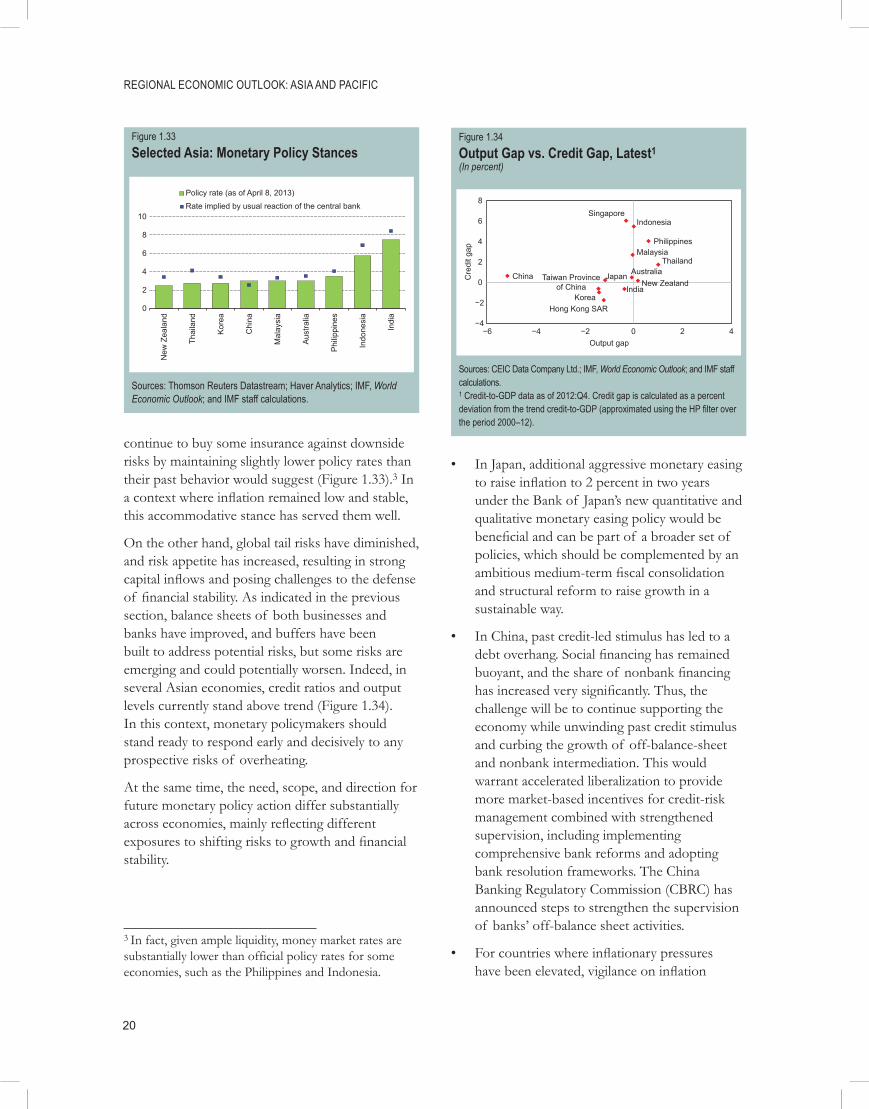
REGIONAL ECONOMIC OUTLOOK: ASIA AND PACIFIC
20
continue to buy some insurance against downside risks by maintaining slightly lower policy rates than their past behavior would suggest (Figure 1.33).3 In a context where infl ation remained low and stable, this accommodative stance has served them well.
On the other hand, global tail risks have diminished, and risk appetite has increased, resulting in strong capital infl ows and posing challenges to the defense of fi nancial stability. As indicated in the previous section, balance sheets of both businesses and banks have improved, and buffers have been built to address potential risks, but some risks are emerging and could potentially worsen. Indeed, in several Asian economies, credit ratios and output levels currently stand above trend (Figure 1.34). In this context, monetary policymakers should stand ready to respond early and decisively to any prospective risks of overheating.
At the same time, the need, scope, and direction for future monetary policy action differ substantially across economies, mainly refl ecting different exposures to shifting risks to growth and fi nancial stability.
3 In fact, given ample liquidity, money market rates are substantially lower than official policy rates for some economies, such as the Philippines and Indonesia.
• In Japan, additional aggressive monetary easing to raise infl ation to 2 percent in two years under the Bank of Japan’s new quantitative and qualitative monetary easing policy would be benefi cial and can be part of a broader set of policies, which should be complemented by an ambitious medium-term fi scal consolidation and structural reform to raise growth in a sustainable way.
• In China, past credit-led stimulus has led to a debt overhang. Social fi nancing has remained buoyant, and the share of nonbank fi nancing has increased very signifi cantly. Thus, the challenge will be to continue supporting the economy while unwinding past credit stimulus and curbing the growth of off-balance-sheet and nonbank intermediation. This would warrant accelerated liberalization to provide more market-based incentives for credit-risk management combined with strengthened supervision, including implementing comprehensive bank reforms and adopting bank resolution frameworks. The China Banking Regulatory Commission (CBRC) has announced steps to strengthen the supervision of banks’ off-balance sheet activities.
• For countries where infl ationary pressures have been elevated, vigilance on infl ation
Figure 1.33Selected Asia: Monetary Policy Stances
0
2
4
6
8
10
New
Zea
land
Thai
land
Kor
ea
Chi
na
Mal
aysi
a
Aus
tralia
Phi
lippi
nes
Indo
nesi
a
Indi
a
Policy rate (as of April 8, 2013)Rate implied by usual reaction of the central bank
Sources: Thomson Reuters Datastream; Haver Analytics; IMF, World Economic Outlook; and IMF staff calculations.
Figure 1.34Output Gap vs. Credit Gap, Latest1(In percent)
Japan Australia New Zealand
China
Hong Kong SARKorea
Taiwan Provinceof China
Indonesia
Malaysia Philippines
Singapore
Thailand
India
−4
−2
0
2
4
6
8
−6 −4 −2 0 2 4
Cre
dit g
ap
Output gap
Sources: CEIC Data Company Ltd.; IMF, World Economic Outlook; and IMF staff calculations.1 Credit-to-GDP data as of 2012:Q4. Credit gap is calculated as a percent deviation from the trend credit-to-GDP (approximated using the HP fi lter over the period 2000–12).

1. MANAGING SHIFTING RISKS
21
will pay dividends for long-term growth. For example, in India, monetary policy can best support growth by putting infl ation on a clear downward trend. Similarly, in Indonesia, with infl ation close to the upper bound of the target band, a closed output gap, and a widening current account defi cit, there might be a case for higher policy rates over the projection horizon.
Greater exchange rate flexibility would play a useful role in curbing future overheating pressures and speculative capital inflows. Most exchange rate movements since the October 2012 Asia and Pacific Regional Economic Outlook Update have been consistent with fundamentals, with real effective exchange rates rising in many emerging Asian economies amid narrowed current account surpluses—although weak external demand and other cyclical factors have played a role underpinning these adjustments. As a result, and subject to a more comprehensive assessment in the IMF’s forthcoming External Stability Report, the degree of currency undervaluation among Asian surplus economies appears to have generally diminished. More specifically:
• In Japan, the recent depreciation began from a moderately overvalued level and refl ects a number of factors such as the widening trade defi cit, lower global risk aversion, and new monetary policy initiatives that are appropriately focused on correcting domestic imbalances.
• In some of emerging Asia’s surplus economies, greater exchange rate fl exibility would discourage a one-way bet and thus provide more room to cope with speculative capital fl ows. In some cases, greater exchange rate fl exibility would also dampen the pressures of reserve accumulation on monetary aggregates, which has helped fuel rapid credit growth (Figure 1.35). That said, ad hoc interventions throughout the adjustment process may be warranted to avoid disorderly overshooting.
Safeguarding Financial Stability amid Volatile Capital FlowsMacroprudential and capital fl ow measures will also have a role to play where conventional monetary management proves insuffi cient to address specifi c fi nancial stability issues. Many Asian economies have resorted to a broad range of prudential measures in recent years, which have often been focused on stability risks arising from overheating property markets, such as caps on loan-to-value (LTV) ratios for mortgages (Box 1.5). When prudential measures took the form of capital fl ow measures, they were aimed at safeguarding fi nancial system stability in the face of surging capital infl ows, often with a view to affect the composition and duration of fl ows. While macroprudential and capital fl ow measures have generally been seen as a useful addition to the authorities’ toolkit, their effectiveness has varied across countries, in part according to the degree of economic and fi nancial development, exchange rate regime, vulnerability to certain shocks, and the accompanying macroeconomic policies.
• For example, credit-related measures such as tightening LTV ratios have helped curb the rapid growth of property prices in a number of
Figure 1.35Selected Asia: FX Reserve Accumulation(Change since October 2012)
−5−4−3−2−1
0123456
−20−15−10−5
05
10152025
Japa
n
Indo
nesi
a
Thai
land
Indi
a
Mal
aysi
a
Phi
lippi
nes
Hon
g K
ong
SA
R
Kor
ea
Sin
gapo
re
Chi
na
In billions of U.S. dollars Percentage change (right)
Taiw
an P
rovi
nce
of C
hina
Sources: CEIC Data Company Ltd.; Haver Analytics; and IMF staff calculations.

REGIONAL ECONOMIC OUTLOOK: ASIA AND PACIFIC
22
Box 1.5
Macroprudential Measures and Capital Flow Measures: The Experience in Asia
Macroprudential policy measures aim to enhance systemic fi nancial stability by constraining the incentives for excessive risk taking. They are usually classifi ed into three types: credit related (e.g., caps on the loan-to-value [LTV] ratio), liquidity related (e.g., reserve requirements), and capital related (e.g., countercyclical or time-varying capital requirements). Capital fl ow management policies are designed to address risks associated with specifi c types of capital fl ows, in particular their potential impact on certain asset markets or their short-term nature. Capital fl ow management involves two sets of policies: residency-based capital controls and other policies that do not discriminate on the basis of residency but are nonetheless designed to infl uence fl ows. Where macroprudential measures infl uence capital fl ows, they are considered a subset of capital fl ow policies.
A Brief Survey of Policies
Asian countries have resorted to a broad range of macroprudential measures, but in recent years most of them have focused on stability risks arising from overheating property markets (table). In particular, LTV caps for mortgage loans and debt-to-income limits have been used (e.g., China, Hong SAR, Singapore), often together with other real estate lending restrictions and real estate taxes. To address broader-based banking system risks, several economies have also imposed capital measures (Australia), tightened provisioning rules (India), and varied reserve requirements (China, India, Sri Lanka). A number of Asian economies have also resorted to capital fl ow management when they were faced with macroeconomic and fi nancial stability risks in the face of surging capital infl ows. Such measures, which have often overlapped with macroprudential measures, have focused on limiting external borrowing by the corporate and banking sectors through restrictions on derivative positions (e.g., Korea) or interest rate caps (e.g., India). Other capital fl ow management policies have sought to reduce volatility by shifting the composition away from short-term fl ows, including by setting minimum holding periods for securities (e.g., central bank bills in the case of Indonesia since mid-2010) or discouraging infl ows through withholding taxes on foreign holdings of government securities (e.g., Thailand and Korea, where they apply equally to residents). In some instances, measures were also taken to ease certain existing restrictions on outfl ows (e.g., China, Malaysia).
Selected Asia: Use of Macroprudential and Capital Flow Management Measures, 2010–13
Total measures1 Percent share
Macroprudential measures 47 57
Credit measures
LTV 13 16
Other 15 18
Capital measures 6 7
Liquidity measures 3 4
Noncredit real estate measures 9 11
Other 1 1
Capital flow measures 35 43
Limits on foreign exchange exposure and borrowing 11 13
Restriction on foreign access 7 9
Taxation on nonresident holdings 2 2
Other inflow measures 3 4
Liberalization of inflows 6 7
Liberalization of outflows 6 7
Sources: IMF (2012); IMF country teams; and country authorities.1 Measures are defined as changes to existing regulations or new regulations, and can include multiple measures per country during observation period. Based on a sample including Australia, Bangladesh, China, Hong Kong SAR, India, Indonesia, Japan, Korea, Malaysia, New Zealand, the Philippines, Singapore, Sri Lanka, Taiwan Province of China, Thailand, and Vietnam.

1. MANAGING SHIFTING RISKS
23
Box 1.5 (concluded )
Lessons from Recent Experience
According to an IMF survey, most country authorities that have used macroprudential instruments believe that they are effective. In fact, in many instances they are considered a necessary complement to more conventional monetary tools and can offset undesirable side effects. Such is the case in Singapore, where monetary tightening through faster future exchange rate increases may induce domestic interest rates to fall today and stimulate interest-sensitive demand for real estate assets. Another case is China, where stimulus in response to the global fi nancial crisis generated rapid credit growth, prompting the authorities to use macroprudential measures to contain house price increases. In addition, empirical estimates suggest that some macroprudential measures may help dampen business cycle fl uctuations (Lim and others, 2011). Similarly, capital fl ow measures have offered economies a swift way to safeguard fi nancial system stability and enhance resilience to a sudden reversal of fl ows. After the global fi nancial crisis, surges in capital infl ows occurred when economies in the region had begun raising policy rates to more neutral levels; the scope for sterilized exchange rate intervention was limited by already high levels of reserves and costly interest rate differentials. The capital fl ow measures helped strengthen banks’ balance sheets by reducing dependence on foreign wholesale funding, such as in the case of Korea, and in a number of other instances helped slow the infl ow into short-term government bond markets. However, there have also been instances where other regulations, such as double-taxation treaties, have limited the impact of withholding tax measures.
The experience of Asian economies with macroprudential policies and capital fl ow measures has been an important factor shaping the evolving institutional view of the IMF. Whether these measures are appropriate mainly depends on the need and room for macroeconomic policy adjustment, the time required for policies to become effective, and the degree of uncertainty surrounding the source of fi nancial sector risks and their impact on the real economy. As such, these measures should be clearly targeted and communicated and generally be temporary—they can only buy time but cannot substitute for longer-term macroeconomic and fi nancial sector policies.
Note: The main authors of this box are Tao Sun and Olaf Unteroberdoerster.
cases (China, Hong Kong SAR, Singapore, and Malaysia); but when price pressures resurfaced and domestic credit constraints became less binding, they often had to be complemented by additional measures, such as higher stamp duties or restrictions on ownership of investment properties.
• For China, new supervisory challenges have arisen with the rapid expansion in off-balance-sheet bank and nonbank fi nancing. While this marks a move toward more market-based instruments playing a larger role in fi nancial intermediation, it also amplifi es risk taking, given the administrative controls in the fi nancial environment. With intermediation migrating to less-supervised parts of the system, it can also blunt the effectiveness of more conventional bank-based macroprudential measures.
• In other instances, capital fl ow measures may have affected the composition and types of risks associated with exposures to large foreign capital infl ows (such as efforts in Indonesia to impose minimum holding periods on central bank securities), but they seem to have been less effective in curbing the overall size of fl ows in the face of attractive yield differentials. As a result, a number of jurisdictions, including China and Thailand, have also chosen to further liberalize outfl ows.
Implementation of macroprudential and capital fl ow measures will thus need to be carefully calibrated with the shifting stances in monetary and exchange rate policies. Specifi c challenges will vary depending on country circumstances, but credibility and effectiveness of measures will be enhanced if they are well targeted and

REGIONAL ECONOMIC OUTLOOK: ASIA AND PACIFIC
24
communicated and are not perceived as a substitute for necessary adjustment in macroeconomic stances. Ongoing fi nancial sector reforms will also constitute an important parameter for the effectiveness and the appropriate mix of measures, such as China’s steps to liberalize the capital account. The channels for cross-border renminbi fl ows are gradually opening, with a sizable off-shore market infrastructure being built in Hong Kong SAR. There remains substantial scope for further integrating the on-shore and off-shore renminbi markets (Box 1.6). Furthermore, remaining capital controls can exacerbate a sudden tightening of liquidity conditions and potentially disrupt markets when large shocks cause a sudden shift in capital fl ows.
The timely phasing in of Basel III requirements provides an opportunity to strengthen the macroprudential toolkit and further the development of Asian fi nancial markets. Asian banks are generally well positioned to comply with the new rules that make banks hold more and higher-quality capital and establish more robust funding structures (Box 1.7). The limited supply of high-quality local bonds could pose a challenge to many Asian fi nancial systems in meeting tighter liquidity-coverage ratios, but the latter may also encourage the development of new instruments
that constitute a reliably safe and liquid pool of assets for banks to hold.
Rebuilding Fiscal SpaceRebuilding fi scal space to better cope with future shocks should remain a priority for many Asian economies. For a number of economies, structural defi cits that are higher than before the crisis imply the need for greater consolidation efforts; that is especially so as improvements in structural fi scal balances in 2013 are generally expected to remain small despite a gradual pickup in economic growth, pointing to limited countercyclicality (Figure 1.36). Such a stance would not only be consistent with the projected recovery but in some cases could also help preempt potential overheating pressures from continued strong capital infl ows. Moreover, with risks more balanced than six months ago, automatic stabilizers should be a suffi cient line of defense if growth were to disappoint somewhat. In fact, those economies in Asia where automatic stabilizers are smaller—in part refl ecting the lack of social safety nets and relatively narrow tax bases—such as several Asian low-income economies and Indonesia and India, also tend to have smaller external trade and fi nancial exposures, including to risks from a sharp slowdown of growth in advanced economies (Figure 1.37).
Figure 1.36Selected Asia: Cyclically Adjusted Fiscal Balance(In percent of GDP)
−10−8−6−4−2
02468
Indi
a
Japa
n
Viet
nam
Mal
aysi
a
Thai
land
Hon
g K
ong
SA
R
Phi
lippi
nes
New
Zea
land
Indo
nesi
a
Aus
tralia
Chi
na
Kor
ea
Sin
gapo
re
2012 2013 Average: 2002–07
Taiw
an P
rovi
nce
of C
hina
Sources: IMF, World Economic Outlook; and IMF staff calculations.
Figure 1.37Selected Asia: Size of Automatic Stabilizers and Vulnerabilities to a Slowdown in the United States and European Union1(In percent)
Korea
Singapore
Indonesia
Malaysia
Philippines Thailand
China
India
0.00.10.20.30.40.50.60.70.80.9
0 0.5 1 1.5 2 2.5
Cor
rela
tion
betw
een
outp
ut g
aps
and
cycl
ical
fisc
al b
alan
ce
Estimated change (in percentage point) in year–over–yearGDP growth following a slowdown in growth in the U.S. and
EU by 1 percentage point
Larg
e au
tom
atic
stab
ilize
rs Increasing vulnerabilityto slowdown in US & EU
Source: IMF staff estimates.1 Response to a slowdown in U.S. and EU growth are based on regression estimates, and includes effects of discretionary policy measures.

1. MANAGING SHIFTING RISKS
25
Box 1.6
Chinese Capital Account Liberalization and the Internationalization of the Renminbi
The development of an offshore market is facilitating renminbi internationalization, even as China maintains comprehensive capital controls. The offshore renminbi (quoted as CNH) is not subject to the capital controls that limit foreign use of the onshore renminbi (quoted as CNY).This box presents a novel method for assessing progress in renminbi internationalization by estimating the integration of the onshore and offshore markets. It concludes that that there is still substantial scope for currency internationalization through further capital account liberalization to strengthen arbitrage between the CNY and CNH markets.
The CNH was established in Hong Kong SAR in 2003–04 with the creation of a settlement infrastructure and offshore renminbi banking business. Use of the offshore RMB did not take off until 2010, with the launch of a pilot scheme for cross-border trade settlement. International use of the RMB grew rapidly, boosted by additional measures; but in mid-2011 it leveled off, with off-shore RMB deposits peaking at RMB 629 billion ($98 billion) (fi gure, top). This slowdown raises the question of whether the CNH has become an effective substitute for the CNY.1
Full integration exists when the CNY-CNH differential (the basis) is small enough to remain within a band consistent with no arbitrage between onshore and offshore markets (fi gure, bottom). A lack of such integration would imply that CNH is not an effective substitute for CNY; when the basis is “large,” investors and fi rms could incur signifi cant losses from using CNH in place of CNY owing to volatility in the basis (that is, from “basis risk”). Many would avoid CNH, using only CNY instead, making it hard for the renminbi to develop an international role.
The width of the no-arbitrage band is estimated assuming that, within the band, the basis is a random walk but, outside the band, it follows an autoregressive process. Within the band, the basis is too narrow for arbitrage to be profi table owing to transaction costs. When the basis is outside the band, arbitrage is profi table and moves the basis back to the band. The speed of this convergence back to the band refl ects the volume of the arbitraging capital fl ows between onshore and offshore markets possible under existing capital controls, and it can be estimated.
Note: The main authors of this box are R. Sean Craig and Changchun Hua.1 For a full discussion of the tests in this box and policy implications, see Craig and others (forthcoming).
Renminbi Deposits in Hong Kong SAR(In billions of RMB)
0
100
200
300
400
500
600
700
2004 2005 2006 2007 2008 2009 2010 2011 2012 2013
RMB time deposits
RMB demand & saving depositsJanuary 2013:RMB 624 bn
Source: CEIC Data Company Ltd.
CNY and CNH Spot Exchange Rate Differentials (In pips)
−1500
−1000
−500
0
500
1000
1500
2000
Sep
-10
Nov
-10
Jan-
11
Mar
-11
May
-11
Jul-1
1
Sep
-11
Nov
-11
Jan-
12
Mar
-12
May
-12
Jul-1
2
Sep
-12
Nov
-12
Jan-
13
Spot exchange rate difference (CNY – CNH)
Band: (−32, 221)1
Sources: Bloomberg L.P.; and IMF staff estimates.1 Band is estimated with the TAR model on the sample of September 1, 2010–January 31, 2013. About 56 percent of observations are within the band.

REGIONAL ECONOMIC OUTLOOK: ASIA AND PACIFIC
26
Box 1.6 (concluded )
A threshold autoregressive (TAR) model is applied to the daily spot CNY and CNH differential beginning in September 2010. The estimated band width is 253 pips (that is, about one-fourth of a percentage point), with the basis trading within this band only 56 percent of the time (fi gure, bottom). Statistical tests confi rm that the basis follows a random walk within the band and an autoregressive process outside it (table).
The estimation results imply that integration between onshore and offshore markets is still relatively limited. The substantial share of time that the basis trades outside the no-arbitrage band (44 percent), and the large absolute positive and negative values for the basis (which peak at 1,795 and –1,235 pips, respectively), suggest that investors and fi rms face relatively high basis risk, which discourages them from using CNH in place of CNY. The results also indicate that arbitrage is much slower when CNH is stronger than CNY.
For example, when CNH trades at a premium to CNY (fi rst episode, November 2010–May 2011) arbitrage takes an average of 25 days to close half the gap to the band (the “half life”). By contrast, when the CNH trades at a discount to CNY (second episode, September 2011–October 2012) the half life is only six days. In the fi rst episode, capital outfl ows from the mainland are needed for arbitrage as this increases the supply of CNH offshore. In the second episode, arbitrage involves capital infl ows to the mainland that reduces the supply of offshore CNH. These infl ows occur through a “conversion window” that allows (the weaker) CNH to be converted into CNY at parity. But capital controls allow it only for certain types of transactions, such as trade-related payments, which effectively limits the size of arbitraging capital fl ows. This faster rate of convergence implies that capital controls are less restrictive on capital infl ows than on outfl ows during this period, suggesting that liberalization measures may need to focus more on outfl ow to lessen the future risk of a large, persistent widening of the basis.
The estimation results show only limited integration of the onshore and offshore markets for the renminbi. Liberalizing the capital account to facilitate faster arbitrage between the two markets would reduce basis risk and encourage greater use of the CNH. The results here also indicate that liberalization to expand the use of arbitrage for capital outfl ows may be more effective in reducing this basis risk. Recent liberalization measures have focused more on easing constraints on infl ows; thus, this asymmetry may have become even more pronounced recently.
That said, country circumstances will also determine the appropriate pace of fi scal consolidation.
• In Japan, while the recently adopted fi scal stimulus will help support a quick exit from recession, the overarching priority remains a credible strategy for bringing down debt and implementing growth-enhancing reforms. In this regard, confi rming consumption tax
increases planned for 2014 and 2015 remains an important starting point. By contrast, in China, a broadly unchanged fi scal stance appears appropriate. There is also ample space to use the budget as a primary means to fi nance infrastructure in order to improve the transparency of quasi-fi scal activities and targeting of infrastructure spending. This would help mitigate the further build-up of fi nancial stability risks related to local
TAR Model Estimation: Summary of Results
CNY weaker than CNH (positive basis) 15% of time
Autoregressive coefficient 0.97***
Implied “half life” 25 days
CNY–CNH basis trades within band 56% of time
CNY stronger than CNH (negative basis) 29% of time
Autoregressive coefficient 0.88***
Implied “half life” 6 days
Source: IMF staff estimates.Note: *** indicates significance at the 1% level.

1. MANAGING SHIFTING RISKS
27
Box 1.7
How Will the Basel III Capital and Liquidity Requirements Affect Asian Banks?
As of early 2013, most of the larger Asian economies started implementing Basel III or were set to do so shortly. Some have even opted to go beyond the internationally agreed minimum standards by, for example, setting more conservative capital defi nitions or surcharges for systemic institutions. Asia’s lead role refl ects the relatively strong starting position of its banks and a track record of prudent regulatory oversight. Nonetheless, the new requirements are likely to affect Asian banks. Some critics even worry that Basel III might pose a serious risk to the region’s fi nancial and economic development. This box attempts a tentative assessment of the question.1
There is little doubt that Asian banks are in a good position to meet the new capital requirements right from the outset. Tier 1 capital ratios generally remained well above Basel II benchmarks in 2012, and indeed in many cases the Basel III standard of 8.5 percent (including capital conservation buffers) that will be gradually phased in by 2019.
Even so, continued fast credit growth could outpace internal capital generation, creating a medium-term need to raise fresh capital. Illustrative staff projections confi rm the consensus view among analysts that the capital needs will be concentrated on banks in India and China and should be manageable. Only if banks were shut out of the equity market for an extended period—perhaps because of low valuations that make shareholders reluctant to dilute their holdings—could capital become a serious constraint on new bank lending (fi gure). Of course, in cases where credit growth exceeds prudent rates, that would be a welcome development.
The precise path for future capital needs depends on a number of uncertain variables, including bank profi ts, payout ratios, and the pace at which nonbank sources of credit will expand. The latter trend, in particular, could provide considerable relief. Recent data show a marked pick-up in corporate bond issuance across Asia that more than offsets a slump in syndicated bank lending. In China, other nontraditional sources of credit, such as trust loans, have also been growing at high double-digit rates. Although these new funding channels pose risks that need to be monitored carefully, they clearly widen the range of fi nancing options for businesses.
Meanwhile, concerns have been raised over the impact on trade fi nance of the simple 3 percent leverage ratio that is part of the new capital framework. The argument is that the indiscriminate 100 percent “credit conversion factor” for off-balance-sheet exposures will penalize trade credit, potentially creating a critical shortage of funding for Asian industry. However, the Basel Committee on Banking Supervision in 2011 decided to maintain the original leverage ratio rules, which serve as a simple backstop to the more sophisticated, risk-weighted capital requirements.
Should we expect a signifi cant retrenchment of trade fi nance? Even assuming a very high cost of capital and a strictly binding leverage ratio, the relevant increase in capital charges should not exceed 30–50 basis points at most—a manageable magnitude given historical fl uctuations in credit pricing. Anecdotal evidence also suggests
Note: The main authors of this box are Julian Chow and André Meier.1 See also Financial Stability Board (2012).
Projected Medium-Term Capital Needs for Asian Banking Systems under Different Growth Scenarios1 (In billions of U.S. dollars)
0.4 1.7
0.3 0.4 0.3 05
101520253035
Indi
a
Chi
na
Kor
ea
Phi
lippi
nes
Thai
land
Sin
gapo
re
Mal
aysi
a
Indo
nesi
a
Strong growth Weak growth WEO baseline growth
Capital needs under stronggrowth scenario in percent of GDP
Sources: Bankscope; Bloomberg L.P.; and IMF staff calculations.1 Projected amounts of capital raising by major banks (comprising at least half of domestic banking system assets) through end-2018 to meet Basel III Tier 1 capital requirement, including conservation buffer. Strong-growth scenario raises capital needs because of higher growth in risk-weighted assets (informed by historical panel data regression). Higher capital needs in weak-growth scenario are driven by lower bank earnings. Projected return on equity based on 10-year historical averages, adjusted by +1 and –2 standard deviations under strong and weak growth scenario, respectively.

REGIONAL ECONOMIC OUTLOOK: ASIA AND PACIFIC
28
Box 1.7 (concluded )
that (less highly leveraged) nonbanks are entering the market for Asian trade fi nance. This supports the view expressed by some analysts that trade fi nance will thrive even under Basel III, as it represents a capital-effi cient, profi table, and liquidity-friendly line of business. In any event, the leverage ratio will not be enforced until 2018, giving time to evaluate its real impact during the intervening review period.
The strongest repercussions for Asian banks might ultimately come not from the Basel III capital rules but from the new liquidity requirements, although these will not be fully phased in until 2018 either. Because they have no precedent in earlier Basel standards, both the liquidity coverage ratio (LCR) and the net stable funding ratio (NSFR) are much harder to evaluate than the capital requirements.
The LCR, which was revised in January 2013, prescribes minimum holdings of highly liquid assets to ensure that banks can weather a temporary liquidity squeeze. For some Asian economies, it raises the well-known problem that the supply of eligible domestic assets is too small. Regulators have devised ways around this problem in line with the Basel agreement, notably by creating committed central bank liquidity facilities (e.g., in Australia) or by considering the eligibility of assets denominated in foreign currencies (e.g., in Hong Kong SAR). Still, some observers worry that the need for banks to hold large amounts of liquid assets could further reduce the depth of domestic debt markets. However, many Asian banking systems—ranging from India to Singapore—have a history of liquidity rules. Although those rules were defi ned differently from the LCR, the buffers built up in the past mean that most banking systems may not face any binding constraint under the new regime. Even Korean banks, whose liquidity buffers were generally seen to be limited, now appear to be in a good position to meet the revised LCR requirement.
The NSFR, whose details remain under review, requires banks to fi nance illiquid assets from an adequate pool of stable, longer-term funding, thus limiting the extent of maturity transformation. One likely effect is that banks may reduce the supply, or at least raise the price of, certain longer-term credit facilities. More broadly, analysts point out that a slower creation of deposits could constrain overall balance sheet growth as Asia’s high saving rates ease and fi nancial diversifi cation induces savers to invest in a broader range of assets. A trend increase in loan-to-deposit ratios has already been apparent in many Asian economies in recent years (fi gure). Still, loan-to-deposit ratios mostly remain moderate, and in those countries with traditionally high ratios (Australia and Korea) have actually come down of late.
Mitigation is possible even where slower deposit growth emerges as a constraint. Specifi cally, Asian banks appear well positioned to scale up their use of longer-dated wholesale funding, perhaps beginning with the dollar bond market. Over time, such funding could include not only senior unsecured debt but also covered bonds (recently launched in Korea) and other forms of high-quality securitization. Greater diversifi cation of funding sources would arguably raise the average cost of funding. However, it could also make banks more robust, especially when there is some justifi ed concern that retail deposit bases may become less stable amid intensifi ed competition. Increasing corporate reliance on bond fi nance would, in turn, underpin the development of Asian capital markets.
In sum, Asian banks generally appear to be prepared for the new Basel standards, which will help preserve the region’s hard-earned fi nancial stability. Over time, however, the new requirements are likely to become binding in some cases. While this could pose challenges to the banks, fi nancial systems should prove adaptable enough to avoid an undue curtailment of credit. In this vein, the recent period has already brought clear signs of faster development in regional bond markets, which could progressively lead to more diverse funding structures for corporates and banks. Still, there is no denying the remaining uncertainty over the precise effects of Basel III. It is therefore crucial to use the current transition period for careful study of actual market adjustments.
Growth in Loans and Deposits and Resulting Loan-to-Deposit Ratios, 2007–12(In percent)
AUS
CHN
HKG
IND
IDN
KOR
SGPPHL
THA
0
30
60
90
120
150
180
0 30 60 90 120 150 180
Cum
ulat
ive
depo
sit g
row
th o
ver t
hefiv
e ye
ars
thro
ugh
end-
2012
Cumulative loan growth over the five years through end-2012
Bubble size: Loan-to-deposit ratio at end-2012:red: > 100%orange: 80% < x < 100%green: < 80%
For observationsbelow diagonal line,loans outpacedeposits, andvice versa
MYS
TWN
Sources: CEIC Data Company Ltd; and IMF staff calculations.

1. MANAGING SHIFTING RISKS
29
government budgets and a rapidly growing shadow banking system.
• Among major ASEAN economies, buoyant domestic demand and robust capital infl ows in the Philippines warrant ongoing fi scal consolidation; the consolidation critically depends on broadening the tax base by streamlining incentives and strengthening tax administration. In other economies, such as Malaysia and Indonesia, achieving fi scal consolidation or creating more fi scal space will also depend on reforming energy-related subsidies and, more broadly, enhancement to public expenditure management, including for capital projects.
• Low-income economies in the region should intensify their efforts to rebuild their fi scal space to dampen the effect of any adverse shocks on living standards and poverty. In fact, many of them are found to have weaker fi scal balances currently than before the crisis. In the case of Myanmar, there is a need to contain fi scal defi cits to set the stage for higher and stable revenues to fund the country’s considerable development needs. The government’s plans to strengthen revenue administration, simplify tax rates, broaden the tax base, and improve public fi nancial management are welcome (Box 1.8).
Over the medium term, strengthening fi scal institutions and frameworks will also play an important role in achieving sustained and more inclusive growth. As highlighted in Chapter 2, fi scal management across Asia has become more effective over the past decade in cushioning the impact of cyclical fl uctuations and even severe shocks, as evidenced during the global fi nancial crisis. Nevertheless, signifi cant fi scal challenges remain for emerging market, developing, and advanced economies alike: make growth more resilient and inclusive, including by broadening tax revenue and reducing widespread costly tax incentives, and streamline subsidies, and introduce better targeted social transfers. In many of Asia’s low-income
and emerging economies, deploying the fi scal space thus gained for high-impact social and infrastructure spending will also play a critical role in sustaining growth and making it more inclusive. In the more advanced economies, increased fi scal space will be crucial to ensure sustainable social safety nets in the face of aging populations.
Laying Foundations for Sustained and Shared ProsperitySustaining growth and making it more inclusive over the medium term remain top priorities. As a region with a high share of rapidly growing middle-income countries, emerging Asia is particularly susceptible to the “middle-income trap,” in which economies risk stagnation once they reach middle-income levels and struggle to advance into the ranks of high-income economies. Indeed, empirical evidence indicates that middle-income economies are signifi cantly more at risk of experiencing a sustained growth slowdown than their lower- and higher-income counterparts (Figure 1.38). Various statistical approaches indicate that trend growth rates have slowed in both China and India, although results are mixed for many ASEAN economies (Box 1.9). A main conclusion of Chapter 3 is that Asian economies could stimulate
Figure 1.38There Seems to Be a Middle-Income Trap1
02468
101214
Low income Middle income High income
Freq
uenc
y of
slo
wdo
wns
(In p
erce
nt)
Source: IMF staff calculations. See Aiyar and others (2013) for details.1 The fi gure considers a low-income threshold of $2,000 and a high-income threshold of $15,000 in PPP terms, but is robust to a range of alternative thresholds.

REGIONAL ECONOMIC OUTLOOK: ASIA AND PACIFIC
30
Box 1.8
Myanmar—Reintegrating with the World
Over the last year, Myanmar has continued to make rapid progress on its ambitious set of reforms, which aim to comprehensively modernize the economy and re-integrate it into the global economy. Joining the ASEAN Economic Community (AEC) at its planned launch in 2015 is a key pillar in this strategy, as is the resumption of orderly fi nancial relations with the international community. Early 2013 saw the completion of a number of critical steps along this road.
The government’s broad economic goals—the Framework for Economic and Social Reforms (FESR)—were presented to the international community in January 2013. In addition to opening the economy, they include raising growth in a sustainable way, reducing poverty, and achieving greater equity. Donors supported the goals and, through the Nay Pyi Taw Accord, pledged to support them in a coordinated manner. The key challenge for the authorities will lie in managing the economic reform program; and coping with strong aid infl ows.
The authorities’ key macroeconomic policy priorities are to maintain low and stable infl ation within a consistent macroeconomic framework; and build international reserve buffers in light of the ongoing liberalization of imports and the foreign exchange regime. The IMF is assisting the authorities with monitoring the progress toward these objectives through a Staff-Monitored Program (SMP). To build the institutions and instruments needed to ensure macroeconomic stability, the SMP focuses on the following areas: (1) eliminating remaining exchange restrictions and multiple currency practices in line with Myanmar’s AEC commitments; (2) modernizing the fi nancial sector, including the Central Bank of Myanmar, to facilitate macroeconomic management and growth; and (3) laying the foundations for improving fi scal revenues in the medium term for sustainable development spending.
The FESR and SMP helped lay the foundations for the normalization of Myanmar’s fi nancial relations with the international community. Early 2013 saw the clearance of Myanmar’s arrears to the Asian Development Bank and World Bank, and agreement on the concessional rescheduling of its arrears with Paris Club creditors. International sanctions were also further relaxed and the fi nancial sector strengthened its links through the establishment of international transactions.
The coming months will see further progress. The 2013/14 budget will be the fi rst to refl ect the priorities of the FESR, a new central bank law is expected to be passed by Parliament and international fi nancial relations will be strengthened through the completion of the Paris Club rescheduling process. With these achievements and provided the reform momentum is maintained, growth over the next fi ve years is projected to rise to around 7 percent.
An SMP is an informal and fl exible instrument for dialogue between the IMF and a member country on its economic policies. It is not accompanied by fi nancial support from the IMF. In Myanmar’s case, it will involve joint monitoring of progress on the government’s reform plans.
Note: The main author of this box is Alexander Pitt.
potential growth and reduce risks of a persistent slowdown through, among other things, regulatory reforms (product-labor markets), infrastructure spending, and further regional trade integration. As for low-income economies such as Pacifi c Island
countries, steadfast implementation of structural reforms—including to improve the investment climate and infrastructure—would play an equally crucial role in lifting potential growth over the medium term (Box 1.10).

1. MANAGING SHIFTING RISKS
31
Box 1.9
Is Emerging Asia Shifting to Lower Trend Growth?
Medium-term growth prospects for China, India, and other emerging Asia economies have recently become a focus of economic debates in the region. Indeed, growth in both China and India has declined since the global fi nancial crisis—in China, from more than 10 percent before the crisis to less than 8 percent; for India, from 8 percent to 6 percent. This begs an important policy question: to what extent do these recent growth patterns refl ect permanent rather than just temporary factors? This box attempts to shed light on this question by estimating trend growth rates for these two economies as well as other key emerging Asia economies.
To ensure robustness of the results, three distinct methods—statistical fi ltering, model-based multivariate fi ltering, and a production function approach—are used to estimate trend growth for China, India, and fi ve ASEAN countries (Indonesia, Malaysia, the Philippines, Thailand, and Vietnam) during 1993–2012. These various approaches capture different aspects of “trend growth”: the statistical fi ltering approach is consistent with a purely statistical estimation of tendencies in the economic growth data; the model-based multivariate fi lter method aims to capture the growth rate that would be consistent with keeping unemployment at its natural rate and infl ation at the central bank’s target; and the production function approach derives an estimate of potential growth from the trend contributions to growth of technology and factor inputs (labor, physical capital and, here, human capital as well).
Keeping in mind the limitations of all these estimation techniques—not least their intrinsically backwardlooking nature—results for all three approaches tentatively suggest that trend growth has declined in China and India since the global fi nancial crisis—although each approach can produce markedly different results from the others on an annual basis.
Note: The main authors of this box are Kevin C. Cheng and Longmei Zhang.
Trend Growth by Various Approaches
68
10121416
1993
1994
1995
1996
1997
1998
1999
2000
2001
2002
2003
2004
2005
2006
2007
2008
2009
2010
2011
2012
China
Model-basedStatistical filtersProduction function Average
44.5
55.5
66.5
77.5
88.5
9
1993
1994
1995
1996
1997
1998
1999
2000
2001
2002
2003
2004
2005
2006
2007
2008
2009
2010
2011
2012
IndiaModel-basedStatistical filters
Production function Average
Production function Average
012345678
1993
1994
1995
1996
1997
1998
1999
2000
2001
2002
2003
2004
2005
2006
2007
2008
2009
2010
2011
2012
ASEAN1
Statistical filters Model-based
Source: IMF staff estimates.1 Includes Indonesia, Malaysia, the Philippines, Thailand, and Vietnam.

REGIONAL ECONOMIC OUTLOOK: ASIA AND PACIFIC
32
Box 1.9 (concluded )
China’s trend growth appears to have peaked around 2006–07 at about 11 percent and to have slowly declined thereafter to slightly more than 8 percent by 2012. Similarly, the analysis suggests that India’s trend growth peaked just before the global fi nancial crisis at about 8 percent and has recently declined to about 6–7 percent. By contrast, trend growth for most ASEAN countries seems to have remained stable or to have increased somewhat, with the notable exception of Vietnam. Even so, trend GDP growth for the fi ve ASEAN countries taken as a whole remains signifi cantly below its pre-Asian crisis level and marginally below its level preceding the global crisis (fi gure, top), except in the Philippines where it gradually picked up in the last two decades.
Using the production function approach, a growth accounting exercise sheds light on the proximate factors that drive the evolution of trend growth over time (fi gure, bottom). For China and India, the slowdown appears to have been driven largely by a decline in trend total factor productivity (TFP) growth. While declining capital utilization may have also played a role in the estimates, an alternative growth accounting exercise incorporating capital utilization also yields similar fi ndings for TFP growth. For the fi ve ASEAN economies as a whole, the small recent uptick in estimated trend growth seems to have largely refl ected an increased pace of capital accumulation amid projects sponsored and fi nanced by the government. Trend TFP growth appears to be stable or to pick up for most of these economies.
Estimated Trend Growth and Components
02468
1012
1994
1995
1996
1997
1998
1999
2000
2001
2002
2003
2004
2005
2006
2007
2008
2009
2010
2011
2012
China Human capital stockTFP
LaborPhysical capital stockPotential growth rate
−2−1
0123456
1994
1995
1996
1997
1998
1999
2000
2001
2002
2003
2004
2005
2006
2007
2008
2009
2010
2011
2012
ASEAN1
Human capital stock
TFP
Labor
Physical capital stockPotential growth rate
02468
10
1994
1995
1996
1997
1998
1999
2000
2001
2002
2003
2004
2005
2006
2007
2008
2009
2010
2011
2012
IndiaHuman capital stockTFP
LaborPhysical capital stockPotential growth rate
Source: IMF staff estimates.1 Includes Indonesia, Malaysia, the Philippines, Thailand, and Vietnam.
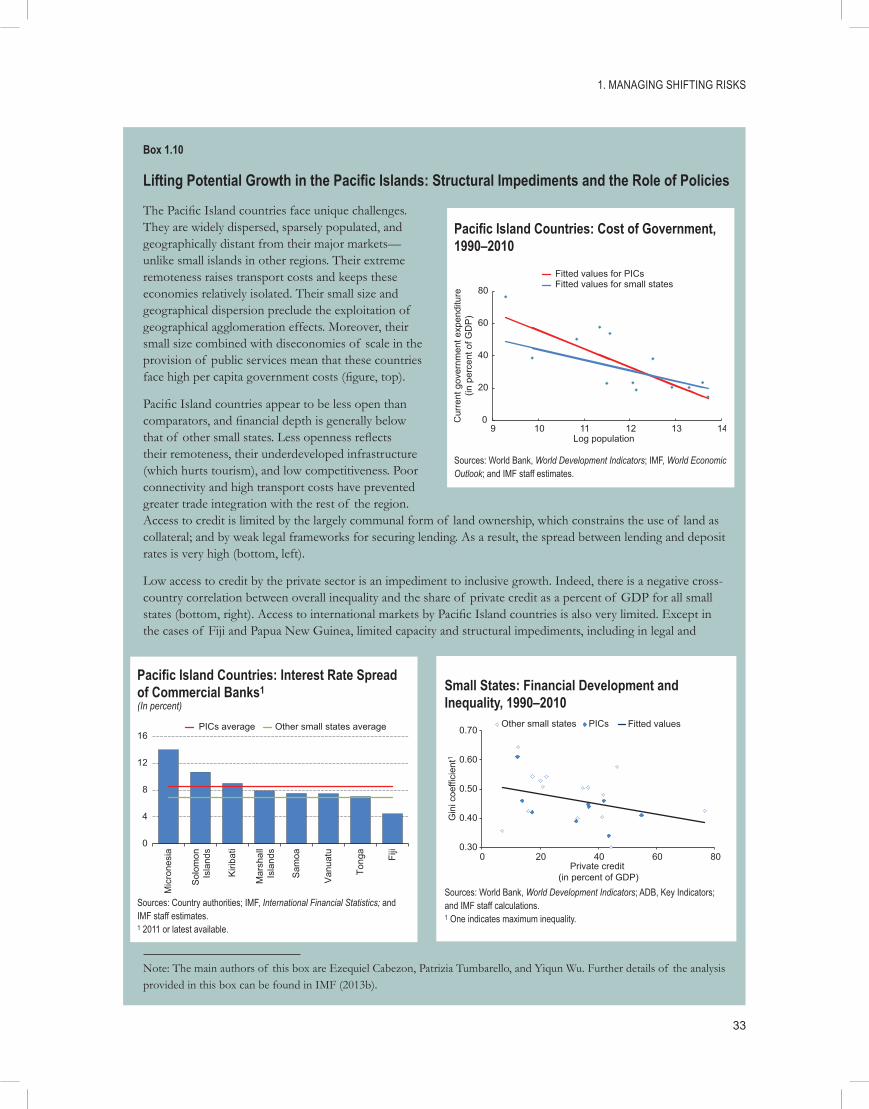
1. MANAGING SHIFTING RISKS
33
Box 1.10
Lifting Potential Growth in the Pacifi c Islands: Structural Impediments and the Role of Policies
The Pacifi c Island countries face unique challenges. They are widely dispersed, sparsely populated, and geographically distant from their major markets—unlike small islands in other regions. Their extreme remoteness raises transport costs and keeps these economies relatively isolated. Their small size and geographical dispersion preclude the exploitation of geographical agglomeration effects. Moreover, their small size combined with diseconomies of scale in the provision of public services mean that these countries face high per capita government costs (fi gure, top).
Pacifi c Island countries appear to be less open than comparators, and fi nancial depth is generally below that of other small states. Less openness refl ects their remoteness, their underdeveloped infrastructure (which hurts tourism), and low competitiveness. Poor connectivity and high transport costs have prevented greater trade integration with the rest of the region. Access to credit is limited by the largely communal form of land ownership, which constrains the use of land as collateral; and by weak legal frameworks for securing lending. As a result, the spread between lending and deposit rates is very high (bottom, left).
Low access to credit by the private sector is an impediment to inclusive growth. Indeed, there is a negative cross-country correlation between overall inequality and the share of private credit as a percent of GDP for all small states (bottom, right). Access to international markets by Pacifi c Island countries is also very limited. Except in the cases of Fiji and Papua New Guinea, limited capacity and structural impediments, including in legal and
Note: The main authors of this box are Ezequiel Cabezon, Patrizia Tumbarello, and Yiqun Wu. Further details of the analysis provided in this box can be found in IMF (2013b).
Pacifi c Island Countries: Cost of Government, 1990–2010
0
20
40
60
80
9 10 11 12 13 14
Cur
rent
gov
ernm
ent e
xpen
ditu
re(in
per
cent
of G
DP
)
Log population
Fitted values for PICsFitted values for small states
Sources: World Bank, World Development Indicators; IMF, World Economic Outlook; and IMF staff estimates.
Pacifi c Island Countries: Interest Rate Spread of Commercial Banks1(In percent)
0
4
8
12
16
Mic
rone
sia
Sol
omon
Isla
nds
Kiri
bati
Mar
shal
lIs
land
s
Sam
oa
Van
uatu
Tong
a
Fiji
PICs average Other small states average
Sources: Country authorities; IMF, International Financial Statistics; and IMF staff estimates.1 2011 or latest available.
Small States: Financial Development and Inequality, 1990–2010
0.30
0.40
0.50
0.60
0.70
0 20 40 60 80
Gin
i coe
ffici
ent1
Private credit (in percent of GDP)
Other small states PICs Fitted values
Sources: World Bank, World Development Indicators; ADB, Key Indicators; and IMF staff calculations.1 One indicates maximum inequality.
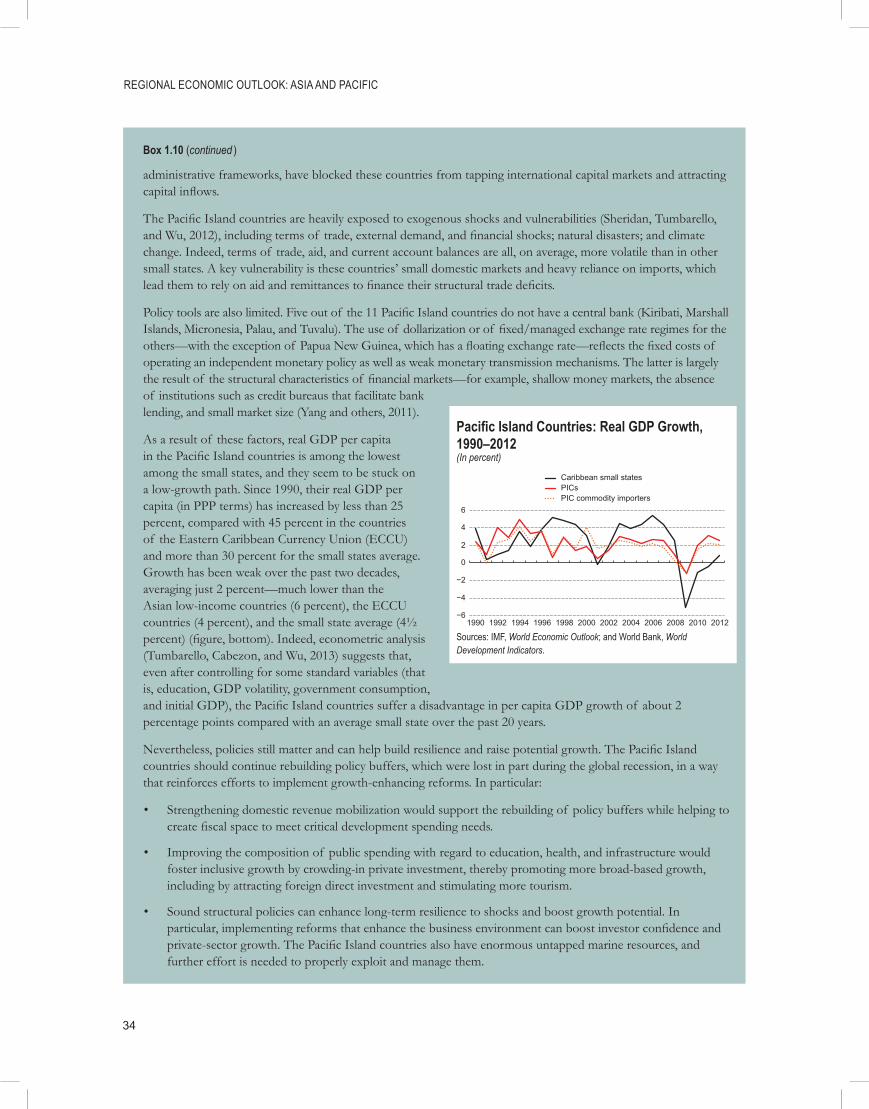
REGIONAL ECONOMIC OUTLOOK: ASIA AND PACIFIC
34
Box 1.10 (continued )
administrative frameworks, have blocked these countries from tapping international capital markets and attracting capital infl ows.
The Pacifi c Island countries are heavily exposed to exogenous shocks and vulnerabilities (Sheridan, Tumbarello, and Wu, 2012), including terms of trade, external demand, and fi nancial shocks; natural disasters; and climate change. Indeed, terms of trade, aid, and current account balances are all, on average, more volatile than in other small states. A key vulnerability is these countries’ small domestic markets and heavy reliance on imports, which lead them to rely on aid and remittances to fi nance their structural trade defi cits.
Policy tools are also limited. Five out of the 11 Pacifi c Island countries do not have a central bank (Kiribati, Marshall Islands, Micronesia, Palau, and Tuvalu). The use of dollarization or of fi xed/managed exchange rate regimes for the others—with the exception of Papua New Guinea, which has a fl oating exchange rate—refl ects the fi xed costs of operating an independent monetary policy as well as weak monetary transmission mechanisms. The latter is largely the result of the structural characteristics of fi nancial markets—for example, shallow money markets, the absence of institutions such as credit bureaus that facilitate bank lending, and small market size (Yang and others, 2011).
As a result of these factors, real GDP per capita in the Pacifi c Island countries is among the lowest among the small states, and they seem to be stuck on a low-growth path. Since 1990, their real GDP per capita (in PPP terms) has increased by less than 25 percent, compared with 45 percent in the countries of the Eastern Caribbean Currency Union (ECCU) and more than 30 percent for the small states average. Growth has been weak over the past two decades, averaging just 2 percent—much lower than the Asian low-income countries (6 percent), the ECCU countries (4 percent), and the small state average (4½ percent) (fi gure, bottom). Indeed, econometric analysis (Tumbarello, Cabezon, and Wu, 2013) suggests that, even after controlling for some standard variables (that is, education, GDP volatility, government consumption, and initial GDP), the Pacifi c Island countries suffer a disadvantage in per capita GDP growth of about 2 percentage points compared with an average small state over the past 20 years.
Nevertheless, policies still matter and can help build resilience and raise potential growth. The Pacifi c Island countries should continue rebuilding policy buffers, which were lost in part during the global recession, in a way that reinforces efforts to implement growth-enhancing reforms. In particular:
• Strengthening domestic revenue mobilization would support the rebuilding of policy buffers while helping to create fi scal space to meet critical development spending needs.
• Improving the composition of public spending with regard to education, health, and infrastructure would foster inclusive growth by crowding-in private investment, thereby promoting more broad-based growth, including by attracting foreign direct investment and stimulating more tourism.
• Sound structural policies can enhance long-term resilience to shocks and boost growth potential. In particular, implementing reforms that enhance the business environment can boost investor confi dence and private-sector growth. The Pacifi c Island countries also have enormous untapped marine resources, and further effort is needed to properly exploit and manage them.
Pacifi c Island Countries: Real GDP Growth, 1990–2012(In percent)
−6
−4
−2
2
0
4
6
1990 1992 1994 1996 1998 2000 2002 2004 2006 2008 2010 2012
Caribbean small statesPICsPIC commodity importers
Sources: IMF, World Economic Outlook; and World Bank, World Development Indicators.

1. MANAGING SHIFTING RISKS
35
Box 1.10 (concluded )
• Strengthening institutions and improving governance should be a key part of governments’ reform agenda and of their development partners’ capacity building programs. Bolstering public institutions, in particular through public fi nance management reforms, would also improve the effi ciency of spending. Strengthening public fi nance by introducing a multiyear budget framework will help in the design of realistic fi scal plans. Fiji, Solomon Islands, and Vanuatu have recently taken commendable steps to strengthen public fi nance management and promote budget transparency and accountability.
• Regional solutions to common problems should also continue to be pursued to help individual countries mitigate the challenges associated with their small size and high dispersion. Regional approaches can encourage the alignment of regulations and laws, lower transaction costs, and reduce the need for country-specifi c knowledge on regulatory approaches. Key sectors in this regard include fi sheries, information and communication technology, and aviation safety. Progress has been made in the fi shery sector, through the Nauru Agreement, to strengthen regional capacity to increase the bargaining power of license-issuing countries. The seasonal employment scheme, introduced by New Zealand in 2006 and more recently by Australia, is a successful case of enhanced integration with neighboring countries that has generated income opportunities and enhanced the skills of Pacifi c Island workers. Further integration with the Asia and Pacifi c region, through trade and investment, should help raise potential growth.


37
2. Fiscal Policy: Dampening Cyclical Fluctuations and Supporting Inclusive Growth
Sustained rapid growth, macroeconomic stability, and improvements in living standards are some of the remarkable achievements of Asian economies over the past decade. Nevertheless, important challenges remain, as countries strive to maintain robust long-term growth, reduce income inequality, and fi ght poverty. Against this background, this chapter assesses whether fi scal policy has contributed to lower output volatility in Asia in the last decade and discusses how it can help address the critical challenges ahead.
A number of conclusions emerge from the analysis. Fiscal policy has become more countercyclical in the past 10 years, and discretionary policies have been effective in dampening the business cycle. Indeed, for the period 2001–11, when real GDP per capita fell by 1 percentage point relative to its trend, real government expenditure is estimated to have responded by an increase of 1 percentage point on average, compared to a softer response of 0.3 percentage points over 1980–2011. Moreover, fi scal multipliers are typically positive across the region and in some cases above 1.
Building on the progress achieved over the past decade, fi scal policy can play a key role in laying the foundations for sustainable and inclusive growth in Asia. In many economies, public investment could help more to fi ll the considerable infrastructure gaps, especially in Indonesia, Nepal, the Philippines, and Sri Lanka. At the same time, fi scal risks stem from investment spending conducted outside of the general government budget and from public-private partnerships in some economies; countering those risks requires that public spending management and fi scal transparency be enhanced, in particular, by fully reporting all forms of investment expenditure in the general government accounts. In most of
Asia, public spending on education and health—typically about 4 percentage points of GDP lower than in peers in other regions and not offset by higher private spending—could be scaled up to enhance human capital and living conditions. Expenditures could also be better targeted to the poor. Distortive food and energy subsidies, which impose a direct fi scal cost of more than 2 percent of GDP per year in China, Indonesia, Korea, Malaysia, and South Asia, could be gradually phased out and replaced by targeted programs such as direct cash transfers.
Further space for social spending and continued countercyclical fi scal policies could also be created by reducing complex and poorly targeted tax incentives. In a number of Asian economies, revenue administration could be enhanced by boosting the capacity of revenue agencies and strengthening their powers in accessing information and conducting audits. Some economies could also consider making their current revenue structure more growth-friendly by expanding the use of general consumption taxes and property taxes and reducing their reliance on corporate income taxation.
The Role of Fiscal Policy in Dampening Cyclical Fluctuations in Asia1
In the last decade, most Asian economies have pursued more countercyclical fi scal policies than in the 1980s and 1990s (Figure 2.1). In the aftermath of the 2008–09 global fi nancial crisis, for example, policymakers took several fi scal measures to cushion the downturn, in contrast with the 1997–98 Asian crisis, when they had to cut spending in the
1 This section is based on a forthcoming IMF working paper by Roberto Guimarães and Phurichai Rungcharoenkitkul.
Note: The main author of this chapter is Edda Zoli. Statistical support and analytical inputs were provided by Roberto Guimarães, Phurichai Rungcharoenkitkul, and Dulani Seneviratne.

REGIONAL ECONOMIC OUTLOOK: ASIA AND PACIFIC
38
midst of collapsing activity (Figure 2.2).2 Indeed, econometric analysis based on a panel of the 14 largest economies in Asia fi nds that in 2001–11, when real GDP per capita declined by 1 percentage point relative to its trend, real government expenditure per capita increased on average by 1 percentage point, versus only 0.3 percentage point for the period 1980–2011.3 This countercyclical response over the past decade was three times stronger than that estimated for non-Asian
2 Discretionary fiscal measures introduced in Asian economies in 2009 imparted an average stimulus of about 2.5 percent of GDP, larger than the G-20 average (2.0 percent of GDP) and higher than in past recessions (see IMF, 2009).3 The empirical analysis focuses on government spending, in line with most of the literature (see Kaminsky and others, 2005, for a discussion on this issue). To address the simultaneity between government spending and economic activity, the model is estimated by panel GMM, and domestic GDP is instrumented by (trade-weighted) trading partner GDP. To a very large extent, changes in government expenditure reflect discretionary fiscal policy, as automatic stabilizers embedded in public spending are not very sizable, especially in Asia.
advanced economies, which have long followed countercyclical policies.4 It is also in contrast with the procyclical fi scal policy behavior that continued to prevail in other regions, where only a minority of countries appears to have graduated from long-standing procyclicality seen in emerging market economies (EMEs) and low-income countries (LICs) (Frankel, Vegh, and Vuletin, 2011; Guimãres and Rungcharoenkitkul, forthcoming). India and Vietnam, having become more procyclical in the past decade, stand out as exceptions within emerging Asia.
What can explain the ability of some economies, in particular Asian ones, to run countercyclical fi scal policies? Two factors may have played a role:
• More ample fi scal space. In bad times emerging economies have often been unable to borrow—or only at very high interest rates—and hence have been forced to cut spending. Thanks to sound macroeconomic policies over the past
4 For both Asian economies and non-Asian advanced economies, the degree of countercyclicality is found to be symmetric during booms and recessions.
Figure 2.1Correlation between Government Spending and GDP1
−0.8−0.6−0.4−0.2
00.20.40.6
Japa
nH
ong
Kon
g S
AR
Aus
tralia
Sin
gapo
reP
hilip
pine
sN
ew Z
eala
ndIn
done
sia
Chi
naM
alay
sia
Thai
land
Viet
nam
Kor
eaIn
dia
Latin
Am
eric
a
EM
E/C
IS2
Adv
ance
d2
2001–11 1980–2011Ta
iwan
Pro
vinc
eof
Chi
na
Sources: IMF, World Economic Outlook database; and IMF staff estimates.1 Correlations between the cyclical components of real government expen-diture per capita and real GDP per capita. A positive (negative) correlation indicates procyclical (countercyclical) fi scal policy. 2 Advanced economies excluding Asia. EME/CIS stands for Emerging Europe and Commonwealth of Independent States.
Figure 2.2Fiscal Impulse, 2007–121(In percent of potential GDP)
−6
−4
−2
0
2
Aus
tralia
Chi
naH
ong
Kon
g S
AR
Indi
aIn
done
sia
Japa
nK
orea
Mal
aysi
aN
ew Z
eala
ndP
hilip
pine
s
Thai
land
Cam
bodi
aLa
o P.
D.R
.M
yanm
arN
epal
Viet
nam
Adv
ance
d2
EM
E/C
IS2
Latin
Am
eric
a
2007–09 2009–12
Taiw
an P
rovi
nce
of C
hina
Source: IMF staff estimates.1 Changes in general government cyclically adjusted fi scal balance in percent of potential GDP. A negative (positive) number indicates a stimulus (withdrawal of fi scal stimulus). 2 Advanced economies excluding Asia. EME/CIS stands for Emerging Europe and Commonwealth of Independent States.

2. FISCAL POLICY: DAMPENING CYCLICAL FLUCTUATIONS AND SUPPORTING INCLUSIVE GROWTH
39
decade, public debt ratios and fi scal defi cits declined or remained relatively low in nearly all Asian economies, allowing room for countercyclical support during downturns. Moreover, cushions were built to address external fi nancing shocks, thus reducing external borrowing constraints. For example, current account balances increased from an average of –2.0 percent of GDP in the 1990s to an average of 2.9 percent in the 2000s, while offi cial reserves rose to 6.1 months of imports from 3.8 months over the same period.
• Stronger institutions. Countries with greater political stability—stemming from government unity, strong parliament and/or popular support—less corruption, and a better bureaucracy are more likely to resist the temptation to expand public spending during booms, thus also creating more fi scal space for countercyclical fi scal policies during downturns.5 Indeed, in Asia there is a negative relationship between an index of institutional strength and procyclicality of fi scal policy (Figure 2.3)—a result also confi rmed by the econometric analysis. Thus, stronger institutions in the past decade may have contributed to increased countercyclicality of fi scal policy.6
Has Discretionary Fiscal Policy Helped Dampen Business Cycles?More countercyclical fi scal policies have been effective in smoothing output fl uctuations since the mid-1990s. New evidence based on structural
5 Theoretical models and empirical evidence on the relationship between institutional strength and procyclicality of fiscal policy are presented, for example, in Tornell and Lane (1999); and Alesina, Campante, and Tabellini (2008).6 The International Country Risk Guide Index, for instance, points to stronger institutions in Asia in the past 10 years (www.prsgroup.com/icrg.aspx).
VARs suggests that government spending and investment multipliers in Asian economies are typically positive, and in some case above 1 (Figure 2.4).7 The estimated range of multiplier values is in line with that found in the literature for advanced economies and higher than that typically estimated for EMEs and LICs (Spilimbergo, Symansky, and Schindler, 2009). These multipliers are larger than in previous studies on Asia (Ducanes and others, 2006; Jha and others, 2010; Tang, Liu, and Cheung, 2010), possibly refl ecting the effectiveness of the stimulus extended in 2008–09, whose effect was not fully captured due to an earlier sample period.
7 The VAR model includes the following variables: international oil prices, the consumer price index, real GDP at market prices, the three-month nominal interest rate, and real government spending (or public investment). Consistent with Blanchard and Perotti (2002), the key identification assumption is that government expenditure does not react to shocks to GDP within a quarter, owing to delays in spending decisions.
Figure 2.3Procyclicality and Institutional Strength, 1980–2011
AUSCHN
HKG
IND
IDN JPN
KORMYS
NZL
PHL
SGP
TWNTHA
VNM
Latin America
EME/CIS3
Advanced3
−0.6
−0.4
−0.2
0.0
0.2
0.4
50 60 70 80 90Cor
rela
tion
betw
een
gove
rnm
ent
expe
nditu
re a
nd G
DP
1
Institutional strength2
Sources: IMF, World Economic Outlook; International Country Risk Guide; and IMF staff estimates.1 Correlations between the cyclical components of real government expenditure per capita and real GDP per capita. A positive (negative) correlation indicates procyclical (countercyclical) fi scal policy. 2 Index ranging between 0 and 100, with a higher score indicating higher political stability, better bureaucracy quality, fewer confl icts and less corruption.3 Advanced economies excluding Asia. EME/CIS stands for Emerging Europe and Commonwealth of Independent States.

REGIONAL ECONOMIC OUTLOOK: ASIA AND PACIFIC
40
Figure 2.4Multipliers for Government Spending and Public Investment in Asia, Four-Quarters(1996:Q2–2012:Q1)
0.0
0.2
0.4
0.6
0.8
1.0
1.2
1.4
Japan1 East Asia ASEAN2 India1
Government spending Public investment
Sources: IMF, World Economic Outlook database; Tapsoba (forthcoming); and IMF staff estimates.1 For Japan and India, multipliers are the average of VAR estimates and DSGE model simulations. 2 ASEAN includes Indonesia, Malaysia, the Philippines, Singapore, and Thailand.
The size of multipliers seems to be associated with country characteristics that are consistent with theoretical predictions and the empirical evidence for countries in other regions (Spilimbergo, Symansky, and Schindler, 2009; Ilzetzki, Mendoza, and Végh, 2011). Specifi cally, multipliers are generally small in very open economies, such as Singapore and Hong Kong SAR, owing to their high propensity to import, which creates “leakages” in the impact of discretionary measures. Multipliers also tend to be lower in countries with higher public debt, such as Japan and India. Multipliers are typically larger for investment than for government spending, as the former directly contributes to GDP and often has a smaller import content than the latter (e.g., construction). In China, Hong Kong SAR, and Indonesia the multiplier for public investment is positive, while that for government spending does not appear to be signifi cant. For Indonesia, a low estimated government spending multiplier may be due to the large subsidy component of public expenditure, which is typically acyclical or even procyclical.
While discretionary fi scal policy appears to have been effective in smoothing economic fl uctuations, countercyclicality could be enhanced by strengthening automatic stabilizers, which
remain relatively small in emerging Asia (Figure 2.5). This would require boosting revenues and spending components (e.g., unemployment benefi ts) that are more sensitive to the cycle. Countercyclicality will also need to remain equally strong in booms and recessions, which requires building adequate fi scal space during periods of favorable cyclical conditions. In this respect, well-designed fi scal rules and fi scal councils—independent agencies providing unbiased budget forecasts and nonpartisan assessments of fi scal policy—can help foster fi scal discipline (April 2013 Fiscal Monitor, IMF, 2013c).
Increasing Space to Support Sustained and Inclusive GrowthFiscal policy management in Asia has improved, but important challenges remain. In the near term, budget consolidation has to proceed as the recovery takes hold in order to rebuild the fi scal space needed both for future countercyclical measures and for addressing forthcoming fi scal pressures—not least related to aging. At the same time, several Asian EMEs and LICs have to create room for higher infrastructure and social spending to support long-term growth and inclusiveness. In China, there is the need to strengthen household income and consumption for economic rebalancing, which is
Figure 2.5Automatic Stabilizers, 2001–11(Correlation between output gaps and cyclical fi scal balances)
0.0
0.2
0.4
0.6
0.8
1.0
Indo
nesi
a
Indi
a
Mal
aysi
a
Hon
g K
ong
SA
R
Sin
gapo
re
Viet
nam
Aus
tralia
Chi
na
Phi
lippi
nes
Thai
land
Kor
ea
New
Zea
land
Japa
n
Advanced economies excluding Asia (average)
EME/CIS1 (average) Emerging Latin America (average)
Taiw
anP
rovi
nce
of C
hina
Source: IMF staff estimates.1 EME/CIS = Emerging Europe and Commonwealth of Independent States.

2. FISCAL POLICY: DAMPENING CYCLICAL FLUCTUATIONS AND SUPPORTING INCLUSIVE GROWTH
41
key to growth sustainability.8 Against this backdrop, this section identifi es common areas where the design and implementation of tax and expenditure policies could be enhanced in view of the critical challenges ahead. The focus is primarily on EMEs and some LICs in the region, while other critical reforms, such as addressing fi scal pressures from aging, are not discussed here.
Boosting Revenue IntakeAcross most of Asia, tax revenues are low in comparison with other economies at the same income level (Figure 2.6). In Asian EMEs and LICs, the average ratio of revenues to GDP in 2011 was 19 percent, compared with 30 percent in Latin America and 37 percent in emerging Europe/Community of Independent States. The relatively low revenue intake partly refl ects an explicit policy choice favoring a low tax environment; but tax yields, which broadly control for differences in tax rates, also tend to be small in several Asian EMEs and LICs. Specifi cally:
• Income tax yields—as measured by the ratio of income tax revenue in percent of GDP to the tax rate—in most of ASEAN and in South Asia are lower than in peers and advanced economies (Figure 2.7). Corporate income tax yields are particularly weak in some LICs (Bangladesh, Cambodia, and Nepal), Sri Lanka, and Japan (Figure 2.8).
• Yields from the value added tax (VAT) or sales taxes are especially low in Lao People’s Democratic Republic, Malaysia, the Philippines, and South Asia (Figure 2.9). VAT yields are remarkable, however, in Thailand, where the system allows only very few exemptions, and in Vietnam thanks to the 2006–10 tax reform.
8 See IMF (2011d) for evidence on poverty and inequality in Asia; Budina and Tuladhar (2010) and Seneviratne and Sun (2013) for evidence on infrastructure shortages in the region; and IMF (2012b) for a discussion of economic rebalancing in China.
Three broad factors help explain low tax yields:
• Narrow tax bases. Tax bases tend to be small because of tax incentives and widespread tax exemptions that often refl ect explicit policy choices, but are sometimes ineffi cient. For instance, for the Philippines a number of studies found the tax incentive system too generous and unnecessarily complex. Tax holidays and reduced corporate tax rates
Figure 2.6General Government Revenue and GDP per Capita, 2011
AUS
KHM
CHN HKGIND
IDN
JPN
KORLAO MYS
NPL
NZL
PHL
SGP
TWN
THA VNM
Advanced1
EME/CIS1
Latin America10152025303540455055
60
5 6 7 8 9 10 11 12
Rev
enue
(in
perc
ent o
f GD
P)
GDP per capita (U.S. dollars, in logs)
Source: IMF, World Economic Outlook database.1 Advanced economies excluding Asia. EME/CIS stands for Emerging Europe and Commonwealth of Independent States.
Figure 2.7Yields from Personal Income Tax1(2011 or latest, in percent)
01020304050
Aus
tralia
New
Zea
land
Hon
g K
ong
SA
RJa
pan
Sin
gapo
reM
alay
sia
Kor
eaM
yanm
arP
hilip
pine
sIn
done
sia
Indi
aTh
aila
ndB
angl
ades
hLa
o P.
D.R
.N
epal
Viet
nam
Chi
naC
ambo
dia
Sri
Lank
aA
dvan
ced2
EM
E/C
IS2
Latin
Am
eric
aYields based on middle personal income tax ratesYields based on maximum personal income tax rates
Sources: IMF, Government Finance Statistics database; World Economic Outlook database; World Bank, World Development Indicators database; taxrates.cc; OECD; and IMF staff calculations.1 Defi ned as tax revenue in percent of GDP divided by the middle or maxi-mum tax rate. 2 Advanced economies excluding Asia. EME/CIS stands for Emerging Europe and Commonwealth of Independent States.

REGIONAL ECONOMIC OUTLOOK: ASIA AND PACIFIC
42
are particularly ineffective, as they create distortions between and within sectors, provide opportunities for tax abuse (e.g., transfer pricing), attract uncommitted fi rms that leave as soon as the incentive expires, and have been unable to boost FDI to the country (Aldaba, 2006; Botman, Klemm, and Baqir, 2008; Reside, 2006, 2007; and IMF, 2012a). In Sri Lanka, the growing number of exemptions in consumption and corporate taxation has eroded the tax base (World Bank, 2012a).
• Defi ciencies in tax administration. Despite reform efforts (e.g., in Indonesia starting in 2001), tax administration remains weak in a number of countries because of understaffi ng and insuffi cient training, among other issues. For instance, the number of tax offi ce personnel per 1,000 people is 0.2 on average in Asian EMEs and LICs, compared with 0.8 in non-Asian advanced economies and 0.6 in peers in other regions.
• Sizable informal sector. The shadow economy was estimated to average 21 percent of GDP in Asian EMEs and LICs in 2007, larger than the 14 percent estimated for non-Asian advanced economies, but smaller than in other emerging economies (38 percent) (Schneider, Buehn, and Montenegro, 2010).
While there is room for enhancing the effi ciency of individual taxes in Asia, is there also scope for improving the overall tax revenue structure to make it more growth-friendly? Theoretical considerations and empirical evidence suggest that property and consumption taxes tend to have comparatively more benign effects on growth than other tax instruments (Johansson and others, 2008; Arnold and others, 2011). At the other end of the spectrum, corporate income taxes—a form of capital taxation affecting investment decisions—are typically most harmful to growth.
A well-implemented value added tax (VAT), in particular, is considered a relatively effi cient tax since it avoids creating large distortions between the relative prices of goods and in saving decisions (Ebrill and others, 2001). Such benefi ts are best reaped when the VAT features a broad base, a
Figure 2.8Yields from Corporate Income Tax1(2011 or latest; in percent)
05
101520253035
Hon
g K
ong
SA
RM
alay
sia
Vie
tnam
Sin
gapo
reTh
aila
ndIn
done
sia
Kor
eaA
ustra
liaC
hina
New
Zea
land
Phi
lippi
nes
Indi
aLa
o P
.D.R
.C
ambo
dia
Nep
alJa
pan
Sri
Lank
aB
angl
ades
hA
dvan
ced2
EM
E/C
IS2
Latin
Am
eric
a Sources: IMF, Government Finance Statistics database; World Economic Outlook database; World Bank, World Development Indicators database; taxrates.cc; OECD; and IMF staff calculations.1 Defi ned as tax revenue in percent of GDP divided by the tax rate.2 Advanced economies excluding Asia. EME/CIS stands for Emerging Europe and Commonwealth of Independent States.
Figure 2.9Yields from VAT and Sales Tax1(In percent)
020406080
100120
Vie
tnam
New
Zea
land
Thai
land
Japa
nK
orea
Sin
gapo
reC
ambo
dia
Nep
alIn
done
sia
Aus
tralia
Chi
naS
ri La
nka
Lao
P.D
.R.
Ban
glad
esh
Phi
lippi
nes
Mal
aysi
aA
dvan
ced4
EM
E/C
IS4
Latin
Am
eric
a
Yields from VAT or sales tax (overall)2
Yields from VAT or sales tax (consumption based)3
Sources: IMF, Government Finance Statistics database; World Economic Outlook database; taxrates.cc; World Competitiveness Online; OECD; and IMF staff calculations.1 For economies that have both VAT and sales tax, data refer to the VAT.2 VAT or sale tax revenues in percent of GDP, divided by the standard tax rate.3 VAT or sale tax revenues in percent of private consumption, divided by the standard tax rate. 4 Advanced economies excluding Asia. EME/CIS stands for Emerging Europe and Commonwealth of Independent States.

2. FISCAL POLICY: DAMPENING CYCLICAL FLUCTUATIONS AND SUPPORTING INCLUSIVE GROWTH
43
single rate, and a fairly high threshold to exclude traders with little revenue potential relative to the administration and compliance costs involved.
Property taxes are also deemed to be an effi cient and equitable mode of collection. Due to a relatively immobile tax base, they are less vulnerable to international tax competition and entail smaller distortions than others. Since real estate values are often boosted by public spending on infrastructure in the surrounding area, property taxes may also help recover some of the costs thereby incurred (IMF, 2011a). As real estate values refl ect the provision of local services, they are especially appropriate for local governments and can be an important autonomous source of revenues for them.
Against these arguments, the broad mix of taxes in some Asian economies appears to be suboptimal. Indeed, in a number of economies, corporate income taxation makes up a relatively larger share of tax revenues than general consumption and property taxes, in contrast with the revenue structure in advanced economies and EMEs in other regions (Figure 2.10). For countries rich in natural resources (e.g., Indonesia, Malaysia, and Mongolia), the importance of corporate income taxation refl ects a reliance on revenues from the oil or mineral sectors which, although easy to administer, can be volatile and procyclical. Reliance on corporate income tax revenues is also sizable in Hong Kong SAR, India, the Philippines, Singapore, Thailand, and Vietnam.
Enhancing the Effi ciency and Composition of Public SpendingPublic spending can play a crucial role in supporting more inclusive growth, and fostering human and physical capital accumulation (IMF, 2004). What resources do Asian economies devote to key public expenditure components, and do they use them effi ciently to achieve those goals?
Fiscal policy could help fi ll the infrastructure gaps in a number of countries through public investment and the promotion of public-private
partnerships. For example, sustained public investment over the past decade appears to have helped Malaysia attain and maintain an edge in infrastructure. Public investment levels in China seem exceptionally large, also considering the infrastructure improvements already achieved (Figure 2.11). By contrast, government investment has been relatively low in 2011–12 in Indonesia, the Philippines, and Sri Lanka despite signifi cant infrastructure shortages. Furthermore, even execution of already budgeted investment projects
Figure 2.10Selected Tax Revenues by Category(In percent of total tax revenue, 2011 or latest available)
020406080
100
Sri
Lank
aLa
o P
.D.R
.In
dia
Nep
alB
angl
ades
hP
hilip
pine
sC
ambo
dia
Thai
land
Kor
eaS
inga
pore
Mon
golia
Mal
aysi
aJa
pan
Aus
tralia
Vie
tnam
Chi
na
Indo
nesi
aN
ew Z
eala
ndA
dvan
ced2
EM
E/C
IS2
Latin
Am
eric
a
Other1
Individual income taxProperty tax
General tax on goods and servicesCorporate income tax
Hon
g K
ong
SA
R
Sources: IMF, Government Finance Statistics database, and World Economic Outlook database; OECD; and IMF staff calculations.1 Includes excise tax, international trade and transactions tax, tax on profi ts of fi scal monopolies, unallocated taxes on profi t/income, and other taxes.2 Advanced economies excluding Asia. EME/CIS stands for Emerging Europe and Commonwealth of Independent States.
Figure 2.11Public Investment and Infrastructure
AUS BGD
KHM
HKGIND
IDNJPNKOR
MYSMNG
NPLNZL
PHLSGPLKA
TWNTHAVNM
0
5
10
15
20
1 2 3 4 5 6 7
Pub
lic in
vest
men
t to
GD
P, 2
011–
12
Infrastructure score, 2010 (1–7, 7 = best)
Asian economiesAdvanced and emerging market economies outside Asia
CHN
Sources: IMF, World Economic Outlook database; and World Economic Forum.

REGIONAL ECONOMIC OUTLOOK: ASIA AND PACIFIC
44
has been slow in some cases (e.g., Indonesia). In a number of economies, infrastructure spending and public-private partnerships activities outside of the general government budget are creating fi scal risks. In China, for instance, public investment is often fi nanced through nontransparent local government fi nancing vehicles which require close monitoring. In Malaysia, government contingent liabilities related to public-private partnerships and special purpose vehicles for fi nancing infrastructure projects are on the rise. This underscores the need to strengthen the management of public expenditures and enhance budget reporting and overall fi scal transparency.
In spite of still relatively poor health conditions, low education levels, and the surge in per capita income of the past decade,9 government expenditure on health and education has barely increased in Asian EMEs and LICs (Figure 2.12). Furthermore, in most of these economies both government health and education expenditure remain smaller than in peers in other regions and advanced economies. Private health expenditure—a possible substitute for public spending—is also nearly 1 percentage point of GDP lower in Asian EMEs and LICs than in other EMEs (World Bank, 2012c).
9 See OECD (2012) and OECD and WHO (2012) for recent evidence on health and education in Asia.
In several Asian EMEs and LICs, subsidies represent a larger share of total government expenditure than in peers in other regions, while the weight of social benefi ts (including for sickness, invalidity, and unemployment) is typically lower (Figure 2.13). Expenditure on food and, especially, energy subsidies continue to impose substantial budgetary costs in a number of Asian economies (Figure 2.14). For example, in Indonesia the direct
Figure 2.12Public Social Spending: Health and Education(In percent of GDP)
0
4
8
12
16
Mya
nmar
Sri
Lank
aB
angl
ades
hP
hilip
pine
sIn
done
sia
Indi
aC
ambo
dia
Sin
gapo
reLa
o P.
D.R
.C
hina
Hon
g K
ong
SA
RN
epal
Thai
land
Viet
nam
Mon
golia
Mal
aysi
aK
orea
Aus
tralia
Japa
nN
ew Z
eala
ndA
dvan
ced1
EM
E/C
IS1
Latin
Am
eric
a
Education, latest Health, latestEducation and health, 2001 Health, 2001
Sources: IMF, Government Finance Statistics database; World Economic Outlook database; World Bank, World Development Indicators database; and IMF staff calculations.1 Advanced economies excluding Asia. EME/CIS stands for Emerging Europe and Commonwealth of Independent States.
Figure 2.13Subsidies and Social Benefi ts1(In percent of total expenditure, 2011 or latest available)
0
10
20
30
40
50
Lao
P.D
.R.
Nep
al
Hon
g K
ong
SA
R
Thai
land
Sri
Lank
a
Indo
nesi
a
Ban
glad
esh
Mal
aysi
a
New
Zea
land
Indi
a
Kor
ea
Aus
tralia
Japa
n
Adv
ance
d2
EM
E/C
IS2
Latin
Am
eric
a
Social benefits Subsidies
Sources: IMF, Government Finance Statistics database; and World Economic Outlook database.1 Social benefi ts include current transfers such as sickness and invalidity benefi ts, family allowances, unemployment benefi ts. Subsidies are current transfers to enterprises.2 Advanced economies excluding Asia. EME/CIS stands for Emerging Europe and Commonwealth of Independent States.
Figure 2.14Food and Energy Subsidies1(Percent of GDP, 2012 or latest)
0.0
1.02.03.04.0
5.0
Phi
llipp
ines
Viet
anam
Aus
tralia
Hon
g K
ong
SA
RN
ew Z
eala
nd
Mon
golia
Japa
n
Nep
al
Thai
land
Indi
a
Kor
ea
Sri
Lank
a
Ban
glad
esh
Chi
na
Mal
aysi
a
Indo
nesi
a
Adv
ance
d2
Energy Food and fertilizer
Taiw
an P
rovi
ceof
Chi
na
Sources: Country authorities; OECD (2012); and IMF staff estimates.1 For non-OECD economies refer to fi scal costs reported in the budget, including transfers to loss making energy producing companies. For OECD economies and China, food subsidies are from OECD and include also foregone revenues.2 Includes the United States, European Union, and Canada.

2. FISCAL POLICY: DAMPENING CYCLICAL FLUCTUATIONS AND SUPPORTING INCLUSIVE GROWTH
45
fi scal cost of oil and food subsidies, at more than 4 percent of GDP, is close to total government spending on health and education. Furthermore, the direct expenses reported in fi scal accounts do not even fully capture the total fi scal burden of subsidies. Foregone revenues due to preferential tax treatment of energy products can also be quite sizable. For instance, for India the total cost of energy subsidies is estimated to be 1.4 percent of GDP higher than that reported in the fi scal accounts after foregone revenues are factored in (Mohommad and others, forthcoming).
Energy subsidies create distortions and other economic costs, are damaging to the environment, and in practice, often benefi t higher income groups more than the poor.10 Estimates for Indonesia, for example, suggest that about 45 percent of fuel subsidies benefi t the richest 10 percent of households, who consume more fuel in absolute value (Agustina and others, 2008). The effectiveness of subsidy programs can also be compromised by implementation problems. For India, the largest food subsidy program (the Targeted Public Distribution System) is so weighed down by targeting errors, illegal diversions, and procurement ineffi ciencies that only an estimated 10 percent of outlays are directly transferred to the poor (Jha and Ramaswami, 2010).
How can subsidies, which are often used as social policy devices, be reduced, better targeted, or phased out? Lessons from subsidy reforms around the world and in Asia (e.g., the 2004–05 energy reform in the Philippines) suggest that key elements for success include setting up a comprehensive plan with clear objectives, an effective communication strategy to generate wide political and public support, and gradual implementation of pricing adjustments (IMF, 2013a).
Any reform to scale down food and energy subsidies would also need to include compensatory measures to alleviate the adverse impact of price increases on poor households, which could be
10 See IMF (2013a) for a comprehensive discussion of the economic costs of energy subsidies.
substantial. For example, according to some estimates, a $0.25 per liter rise in fuel prices could reduce household real income by about 4 percent in Bangladesh and 3 percent in Sri Lanka (Arze del Granado, Coady, and Grillingham, 2012).
Cash transfers or vouchers targeted to the poor can compensate them for the loss of generalized subsidies while increasing effi ciency. As such they can also contribute to overcoming social and political opposition to subsidy reforms. However, these programs need careful preparation and monitoring, requiring a considerable amount of data and administrative capacity. Identifying the most vulnerable households is particularly challenging. Indonesia, for example, set up a cash transfer program (Bantuan Langsun Tunai )—together with other compensatory measures—during its 2005 fuel reform. However, because of defi ciencies in identifying potential benefi ciaries, over half of poor and vulnerable households were not reached (World Bank, 2012b). India is planning to enhance its existing cash transfer program and identifi cation system in connection with the ongoing subsidy reform (Box 2.1).
Conditional cash transfer (CCT) programs can also be effective instruments for assisting the poor. The programs transfer cash to households at the bottom of the income distribution, subject to conditions such as school attendance or use of health care facilities, with the double objective of alleviating poverty and addressing underinvestment in health and education. Large-scale CCT schemes are in place, for instance, in Latin America (e.g., Bolsa Familia in Brazil and Oportunidades in Mexico).11 In 2007, the Philippines launched a CCT program that is becoming a cornerstone of its social protection system (Usui, 2011b). CCT programs have had positive effects on household consumption and poverty as well as on the use of education and health services by the poor in a number of countries (Fiszbein and Schady, 2009). Nevertheless, they are not appropriate for all poor households. For example, they cannot serve the
11 For an overview of CCT schemes, see Fiszbein and Schady (2009).
REGIONAL ECONOMIC OUTLOOK: ASIA AND PACIFIC
46
Box 2.1
Cash Transfers in India
India has initiated a wide-ranging project to shift many subsidy programs away from in-kind delivery toward direct cash transfers. Currently, India maintains large subsidy programs for food, fertilizer, and fuels. Subsidized food and kerosene are available from government-owned stores at below-market prices for eligible residents, while all fertilizer sales are at subsidized prices, and LPG cylinders are distributed directly, with a limit on each household’s subsidized purchase.
In 2011, the Indian government asked a high-level commission to examine whether direct cash transfers could be used to replace subsidized sales of fuels and fertilizer. The commission’s interim report pointed out that “a subsidy, by its very nature, introduces two or more prices for the same good, and creates incentives for pilferage and diversion. As a result, the underprivileged suffer the most. Ensuring that goods move in the supply chain at market prices can minimize the incentives for diversion.”1 Direct cash transfers, which entail direct payments from the government to recipients, can bring down costs and diversion by phasing out middlemen and complex bureaucracies. By mid-2012, the government established a pilot scheme replacing subsidized LPG with direct cash transfers in Mysore, Karnataka State, and presented plans to extend the program to another 51 (out of a total of 640) districts across India this year.
In January, the Indian government also began to replace its delivery system for pensions, scholarships, and wages under the national rural employment scheme with direct cash transfers. This shift is also being rolled out gradually, beginning in 43 districts, but with time would drastically simplify how the Indian government makes payments for national programs. Once such a large system is implemented, conditional cash transfers, which are already used on a small scale, could also be expanded.
India has also been rapidly expanding its biometric Uniform Identifi cation system (aadhaar), which will establish an accurate and paperless means of identifying all Indians by 2014. This program will also present large opportunities for savings. A nationally uniform, biometric database would cut down on leakages from outdated biographical information, ghost identifi cation, double registration, and other losses, which have been estimated in the range of 15–20 percent of total spending. Pilot programs delivering subsidized kerosene using aadhaar-based identifi cation of eligible recipients have been set up in Rajasthan. However, given that kerosene is consumed by the poorest in the Indian population, replacing the current system on a broad basis will have to be done with care.
The integration of these two programs, aadhaar and direct cash transfers, promises further savings but will involve many challenges: the timeframe for bringing India’s population of 1.2 billion into the aadhar program could extend beyond 2014, and integrating this database with information on individuals eligible for subsidized fuel will take time. Shifting the fertilizer subsidy from companies to individual farmers and building up the capacity to deliver payments electronically could also be challenging in such a large country. But the total savings could be substantial: if the combination of direct cash transfer and aadhaar eliminates the estimated 15 percent leakage cited above for the programs being integrated, savings could total ½ percent of GDP in addition to the gains from the better targeting of spending on the poor.2
Note: The main author of this box is James Walsh.1 “Interim Report of the Task Force on Direct Transfer of Subsidies on Kerosene, LPG and Fertilizer,” 2011 (June, p. 1), http://fi nmin.nic.in/reports/Interim_report_Task_Force_DTS.pdf.2 Chinoy (2013).
elderly or the childless, and they are not the most effective instruments to address temporary poverty, given the long-term commitment involved. Thus, in many countries, CCT and other transfer programs rightly coexist as complements. Moreover, the
effectiveness of CCT programs may be constrained by the quality of schools and health care facilities accessible to the benefi ciaries, underscoring the need to associate CCT programs with reforms in the provision of education and health care.

47
3. Is Middle-Income Asia at Risk of a Sustained Growth Slowdown?
Slower growth in China, India, and Vietnam; prospects of persistently low growth in advanced economies; imminent demographic aging across large parts of East Asia—all have raised concerns in recent years about risks of a sustained growth slowdown in emerging Asia. In middle-income economies, fears of a “middle-income trap” have been growing.1 And indeed, as highlighted in Chapter 1, although Asia’s potential growth remains higher than that of other regions, various estimation techniques point to a reduction in trend growth since the 2008 global fi nancial crisis.
This chapter examines the question further. It fi rst identifi es empirically the factors that induce sustained growth slowdowns and assesses whether and why middle-income economies may be more at risk than their low- and high-income counterparts. It then reviews the strengths and weaknesses of several emerging Asian economies relative to risks of a sustained slowdown and highlights the policy reforms needed to alleviate such risks. The main fi ndings are the following:
• Taken at face value, economic history suggests that a number of emerging Asian economies run the risk of falling into a middle-income trap. The new estimates in this chapter suggest that the probability of a marked fall in growth that will last for at least a decade is indeed higher—about 1.5 times higher within a given fi ve-year time span—for middle-income economies (MIEs) than for advanced
Note: The main authors of this chapter are Shekhar Aiyar, Romain Duval, Damien Puy, Yiqun Wu, and Longmei Zhang. It is based on Aiyar and others (2013).1 The term “middle-income trap” has been recently popularized by Eichengreen, Park, and Shin (2012, 2013), but it appeared in a number of earlier papers, including the Growth Report of the Commission on Growth and Development (2008).
economies (AEs) or low-income countries (LICs).
• However, whether a country will experience a sustained growth slowdown depends on the quality of its policies and institutions as well as on a range of structural features of its economy. Middle-income Asian economies often compare favorably to their emerging market counterparts on many of these dimensions, such as the structure and intensity of their international trade, the quality of institutions or—for now—demographics. By contrast, some of them perform worse on infrastructure, which remains a key policy priority in a number of emerging market economies and LICs across the region. There remains also room for institutional—not least regulatory—reforms, as well as for fully mobilizing untapped pools of labor to cope with the challenge of an aging population. Reforms in these areas will help alleviate the middle-income trap. To various degrees and under different forms, these institutional reform priorities are also relevant for more advanced Asian economies, such as Japan and Korea.
What Is a Sustained Growth Slowdown?The middle-income trap is the phenomenon of hitherto rapidly growing economies stagnating at middle-income levels and failing to rise to the high-income levels of advanced economies. This has often happened as a result of a sharp and persistent slowdown after a period of relatively strong growth. For instance, several Latin American economies, such as Brazil, Mexico, and Peru, entered a long period of stagnation in relative living standards after growth durably slowed in the late 1970s and early 1980s

48
REGIONAL ECONOMIC OUTLOOK: ASIA AND PACIFIC
(Figure 3.1).2 By contrast, the four Asian Tigers (Hong Kong SAR, Korea, Singapore, and Taiwan Province of China) continued to grow rapidly after attaining middle-income status and thereby reached income levels comparable to those of advanced countries (Figures 3.1 and 3.2). However, over the past two decades, the experience of several other Asian MIEs has been more mixed, refl ecting in part the transitory but large effect on living standards of the Asian crisis of the late 1990s. Malaysia has been more successful than Indonesia, with Thailand falling in between, but in all three cases convergence to living standards in advanced economies stalled for a decade after the Asian crisis, regaining momentum only in recent years. China’s trajectory has so far outstripped even that of the earlier East Asian success stories, but the Chinese economy is still at a rather early stage of its convergence process. With their income per capita currently standing at 10 percent to 40 percent of average G-7 levels, China, India, Indonesia, Malaysia, the Philippines, Thailand, and Vietnam all face the challenge of sustaining their convergence process (Figure 3.3).
2 Figure 3.1 shows GDP per capita—as a logarithm so that the slope can be read as the growth rate—once it has reached $3,000 in 2005 international dollars (data from Heston, Summers, and Alen, 2012). The $3,000 level is chosen as an illustrative threshold for middle-income countries; the analysis elaborates on the definition of a middle-income country more carefully.
The main proximate driver of a sustained slowdown in growth has often been a persistent decline in the growth of total factor productivity (TFP), a crude measure of technological progress. TFP growth can be calculated in various ways; here, contributions to GDP growth are calculated for physical capital, human capital, working-age population, and the residual is called TFP growth (for details, see Aiyar and others, 2013). Growth slowdowns have indeed been concomitant with a fall in TFP growth in, for example, selected Latin American economies in the 1970s and 1980s and, to a lesser extent, in the ASEAN-4 countries (Indonesia, Malaysia, the Philippines, and Thailand) in the aftermath of the Asian crisis. To sum up,
Figure 3.1Past Growth Trajectories1
95
100
105
110
115
120
125
130
1 6 11 16 21 26 31 36 41 46 51 56 61
log
GD
P pe
r cap
ita (p
erio
d 1
= 10
0)
Korea Taiwan Province
of China
China
Indonesia
Mexico
Peru
Malaysia
Brazil
Thailand
Source: Heston and others (2012); and IMF staff calculations.1 GDP per capita is in 2005 PPP adjusted terms. The slope of each series refl ects the growth rate. Period = 1 defi ned as the year when GDP per capita for the country considered reached US$ 3,000 in PPP terms.
Figure 3.2GDP per Capita Convergence in the Four Asian “Tigers”(PPP GDP per capita as percent of G7 average PPP GDP per capita)
180
020406080
100120140160
1970
1972
1974
1976
1978
1980
1982
1984
1986
1988
1990
1992
1994
1996
1998
2000
2002
2004
2006
2008
2010
2012
Hong Kong SARSingapore
Korea Taiwan Provinceof China
Source: Heston and others (2012); and IMF staff calculations.
Figure 3.3GDP per Capita Convergence in Seven Emerging Asian Economies(PPP GDP per capita as percent of G7 average PPP GDP per capita)
05
10152025303540
1970
1972
1974
1976
1978
1980
1982
1984
1986
1988
1990
1992
1994
1996
1998
2000
2002
2004
2006
2008
2010
2012
China
India
Indonesia
Malaysia
Philippines
Thailand
Vietnam
Source: Heston and others (2012); and IMF staff calculations.

3. IS MIDDLE-INCOME ASIA AT RISK OF A SUSTAINED GROWTH SLOWDOWN?
49
even though physical capital, human capital, and employment are key drivers of economic growth, they matter less for sustained slowdowns in growth, which seem to coincide primarily with lower TFP growth. In the ASEAN-4 countries in recent years, TFP gains have been fairly solid but still smaller than before the global fi nancial crisis (Figure 3.4), and therefore the risk of a TFP-driven growth slowdown remains a relevant policy concern.
Are Middle-Income Economies Different?The focus of the remainder of this chapter is on sizable and sustained slowdowns in growth in Asian MIEs, which here are China, India, Indonesia, Malaysia, the Philippines, Thailand, and Vietnam.3 The methodology used to identify sustained slowdowns in growth is described in Box 3.1. Although the methodology captures, as expected, several slowdown episodes in ASEAN economies in the late 1990s, overall the frequency of growth slowdowns has been lower in Asia than in any other region over the past fi ve decades (Figure 3.5).
3 These countries all have GDP per capita above the $2,000 threshold (2005 PPP), used here to discriminate between low- and middle-income economies.
There seems to be a middle-income trap, as MIEs turn out to be disproportionately likely to experience growth slowdowns (Figure 3.6). Indeed the probability of an MIE experiencing such an episode within a given fi ve-year time span is about 1.5 times greater than for low- or high-income countries, and this ratio is greater the longer the time horizon considered. This fi nding is illustrated here assuming a GDP per capita threshold for low-income economies of $2,000 (2005 PPP) or
Figure 3.4Contributions to ASEAN Growth before and after the Global Financial Crisis1(In percentage points of GDP)
01234567
2003
–07
2010
–12
2003
–07
2010
–12
2003
–07
2010
–12
2003
–07
2010
–12
Contribution from labor Contribution from human capitalContribution from physical capital Contribution from TFPGDP per capita growth (in percent)
Philippines Thailand Indonesia Malaysia
Source: IMF staff calculations.1 Calculations rely on specifi c methodological assumptions and are subject to limitations, e.g., they do not account for hours worked. See Aiyar and others (2013) for details.
Figure 3.6There Seems to Be a Middle-Income Trap1
(In percent)
02468
101214
Low-income
Freq
uenc
y of
slo
wdo
wns
Middle-income High-income
Source: IMF staff calculations. See Aiyar and others (2013) for details.1 The fi gure considers a low income threshold of US$2,000 and a high income threshold of US$15,000 in PPP terms, but is robust to a range of alternative thresholds.
Figure 3.5Frequency of Past Sustained Growth Slowdown Episodes by Region(In percent)
02468
1012141618
Asi
a &
Pac
ific
Sub
-Sah
aran
Afri
ca
Tota
l
Latin
Am
eric
a&
the
Car
ribea
n
Mid
dle
Eas
t &N
orth
Afri
ca
Eur
ope
&N
orth
Am
eric
a
Source: IMF staff calculations. See Aiyar and others (2013) for details.

50
REGIONAL ECONOMIC OUTLOOK: ASIA AND PACIFIC
less and a threshold for high-income economies of $15,000 or more, as these particular cut-off points generate a country classifi cation that is close to the World Bank’s gross national income (GNI) per capita classifi cation.4 However, it is robust to a wide
4 The most recent World Bank classification with data for 2010 is as follows in terms of GNI per capita: low income, $1,005 or less; lower middle income, between $1,006 and $3,975; upper middle income, between $3,976 and $12,275; and high income, $12,276 or more. Applying this classification to the sample and comparing it with the $2,000/$15,000 thresholds used in this chapter yields an overlap of 97 percent between the two methodologies; only eight countries are classified differently.
range of alternative income thresholds for defi ning middle income (see Aiyar and others, 2013).
What Explains the Likelihood of Getting Trapped?In order to identify the drivers of growth slowdowns, new empirical analysis is performed over a sample of 138 countries covering in some cases 11 fi ve-year periods (1955–2010). Probit regressions are run to estimate the impact on the likelihood of a sustained slowdown of a wide range of structural, policy, and institutional factors which have been identifi ed as potential
Box 3.1
Identifying Sustained Slowdowns in Growth
So-called conditional convergence growth theory predicts that economies should gradually slow down as they converge to their steady-state GDP per capita path, which in turn depends on a range of country-specifi c factors including, inter alia, rates of investment in physical and human capital. To rule out such gradual, expected slowdowns from the analysis, and also to focus more clearly on TFP-driven shifts in the growth of per capita income, episodes of sizable and sustained slowdowns are identifi ed for a sample of 138 countries over 11 fi ve-year periods (1955–2009) as follows. First, following a conditional convergence framework, per capita GDP growth is regressed on the lagged income level and standard measures of physical and human capital; for any country at any given point in time, the estimated relationship yields a predicted rate of growth, conditional on its level of income and factor endowments. Second, residuals are computed as actual minus predicted rates of growth; a positive (negative) residual means that the country is growing faster (slower) than expected. Third, and fi nally, country i is identifi ed as experiencing a growth slowdown in period t if the following two conditions hold:
residual it – residual it–1 < p(0.20) (1)
residual it+1 – residual it–1 < p(0.20) (2)
Here p (0.20) denotes the 20th percentile of the empirical distribution of differences in residuals from one time period to another. Condition (1) defi nes a growth slowdown: it says that between periods t – 1 and t the country’s performance relative to the expected pattern deteriorated suffi ciently to place the country-period observation in the bottom quintile of changes in the residual between successive time periods. Condition (2) defi nes a sustained slowdown: by examining the difference in residuals between periods t – 1 and t + 1, that is, over a 10-year period, it rules out episodes in which growth slows down in the current period only to recover in the next.
The growth slowdown episodes identifi ed via this conditional convergence framework overlap to a large extent with those that would be derived from an absolute convergence approach under which per capita GDP growth would be regressed only on the lagged income level in the fi rst stage; in fact, the correlation coeffi cient between both sets of episodes is 0.97. This suggests that when it comes to sustained shifts away from the convergence path, growth slowdowns are largely synonymous with TFP slowdowns. This might be because slowdowns in factor accumulation have been either more gradual (e.g., human capital accumulation) than, or concomitant with (e.g., physical capital accumulation) TFP slowdowns.
Note: The main author of this box is Romain Duval.

3. IS MIDDLE-INCOME ASIA AT RISK OF A SUSTAINED GROWTH SLOWDOWN?
51
drivers of economic growth in previous literature.5 Extensive robustness checks for the results are then performed by means of Bayesian averaging techniques.6 Figure 3.7 lists, for the full and MIEs samples, the main explanatory variables found to have a statistically signifi cant and robust impact in the exercise and also reports their impact on the likelihood of a growth slowdown.7 In general, consistent with the focus on the determinants of sustained slowdowns, it is a deterioration in fundamentals that matters. However, the levels of
5 Due to the poor quality or coverage of certain data, a few potential drivers of growth slowdowns could not be tested with a reasonable degree of confidence. One example is income inequality and the broader issue of whether more inclusive growth is likely to be more sustainable, especially in MIEs.6 Two approaches are considered, namely the weighted average least squares (WALS) methodology developed by Magnus, Powell, and Prüfer (2010) and the more standard Bayesian model averaging (BMA) developed by Leamer (1978) and popularized by Sala-i-Martin, Doppelhoffer, and Miller (2004).7 More precisely, Figure 3.7 reports the impact on the likelihood of a growth slowdown from a shift in the value of each explanatory variable from the median to the 75th percentile of the (latest available) cross-country distribution of that variable.
explanatory variables are also infl uential in some cases, pointing to threshold effects—that is, certain fundamentals matter only when they are either very weak or very strong, such as infrastructure.
In a nutshell, sound economic institutions (strong rule of law, limited government involvement in the economy, avoidance of overly stringent regulation of product, labor, and credit markets) as well as favorable demographics (low old-age dependency ratio, in particular, possibly refl ecting its impact on aggregate saving and/or productivity) and trade structure (exports diversifi cation, regional trade integration, proximity to larger markets) can all reduce the likelihood of a growth slowdown. By contrast, strong capital infl ows as well as investment booms, while good for growth, also entail risks of bust further down the road;8 because boom-bust cycles can have long-lasting adverse effects on living standards, avoiding them can support trend growth.
The same factors matter for MIEs, but with notable specifi cities. Reducing government involvement in the economy and easing stringent regulations both matter disproportionately once middle-income status is reached. This may be because they facilitate private sector development and encourage innovation over absorption of existing technology, both of which are key to graduating into the ranks of high-income economies. Likewise, insuffi cient road and telecommunication infrastructure emerges as a potential risk factor for growth, suggesting that infrastructure development matters more once the low-income stage of development has been passed.
Are Middle-Income Asian Economies at Risk of a Sustained Growth Slowdown?The results from the empirical analysis can be used to assess the relative strengths and weaknesses of
8 For similar reasons, a high and growing share of manufacturing in the economy is also found to increase slowdown risks (result not reported here).
Figure 3.7The Impact of Changes in Fundamentals on the Probability of a Sustained Slowdown1(In percent; shift from median to 75th percentile of distribution of explanatory variable)
−6−4−2
02468
L.S
trong
rule
of l
aw
L.S
mal
l gov
ernm
ent
D.S
mal
l gov
ernm
ent
D.L
ight
regu
latio
n
L.D
epen
denc
y ra
tio
L.R
oad
netw
ork
L.Te
leph
one
lines
L.G
ross
cap
ital i
nflo
ws
D.In
vest
men
t sha
re
D.T
rade
ope
nnes
s
D.G
ross
cap
ital i
nflo
ws
L.D
ista
nce
L.R
egio
nal i
nteg
ratio
n
Full sample Middle-income sample
Institutions Demography Infrastructure Macroeconomicfactors
L. W
eak
expo
rtdi
vers
ifica
tion
Trade structure
Source: IMF staff calculations. See Aiyar and others (2013) for details.1 L. stands for the lagged level while D. stands for the lagged difference of the explanatory variable.

52
REGIONAL ECONOMIC OUTLOOK: ASIA AND PACIFIC
Figure 3.9 averages country rankings across each of the Asia, Latin America, and Middle East and North Africa (MENA) regions so as to compare these regions as a whole.
Asian MIEs appear to differ in their risk factors (Figure 3.8). Compared with others in the region,
each Asian MIE in terms of its exposure to risks of a sustained growth slowdown. As an illustration, Figure 3.8 ranks each of the 28 MIEs in the sample, including seven in Asia (China, India, Indonesia, Malaysia, the Philippines, Thailand, and Vietnam), along fi ve broad categories: economic institutions, trade structure, infrastructure, demographics (old-age dependency ratio, as projected by 2020), and macroeconomic factors (investment, capital infl ows). In each category, rankings are computed for simplicity as simple averages of the rankings on the variables belonging to this category. The results are shown in the form of “spider webs:” the larger the area within each country’s “spider web,” the better its current settings in the dimension considered.9
9 Figures 3.8 and 3.9 are qualitatively consistent with, but do not strictly follow, the empirical analysis. First, with the exception of the “macroeconomic factors” category, only the levels of the explanatory variables are used for the computation of rankings, while the empirical analysis identifies a mix of levels and differences as drivers of slowdown probabilities. Second, in each category, the overall ranking is computed as a simple average of rankings on the variables belonging to this category, implicitly assigning them equal weights. Third, they exclude some variables from consideration.
Figure 3.8Strengths and Weaknesses of Asian MIEs1
07
142128Institutions
Dependencyratio
InfrastructureMacroeconomicfactors
Tradestructure
Indonesia Malaysia Philippines Thailand
07
142128
Institutions
Dependencyratio
InfrastructureMacroeconomicfactors
Tradestructure
China India Vietnam
Source: IMF staff calculations. For details on underlying statistics and data sources, see Aiyar and others (2013).1 Latest available observations on each individual variable, with the exception of dependency ratios, which are projected 2020 values. See Aiyar and others (2013) for details. Institutions includes small government involvement in the economy, strong rule of law, and light regulation; infrastructure includes telephone lines and road networks; macroeconomic factors includes low gross capital infl ows, the change over 2008–12 in capital infl ows and trade openness, and the (negative of the) change in the investment-to-GDP ratio; trade structure includes strong regional integration and low GDP-weighted distance. Numbers in the panels represent a simple average of the rankings along each individual variable.
Figure 3.9Strengths and Weaknesses of Asian MIEs Relative to Other Emerging Regions
0
7
14
21
28Institutions
Dependencyratio
InfrastructureMacroeconomicfactors
Tradestructure
Emerging Asia Latin AmericaMiddle East & North Africa
Source: IMF staff calculations. See Aiyar and others (2013) for details.Note: For defi nition of variables, see note to Figure 3.8.
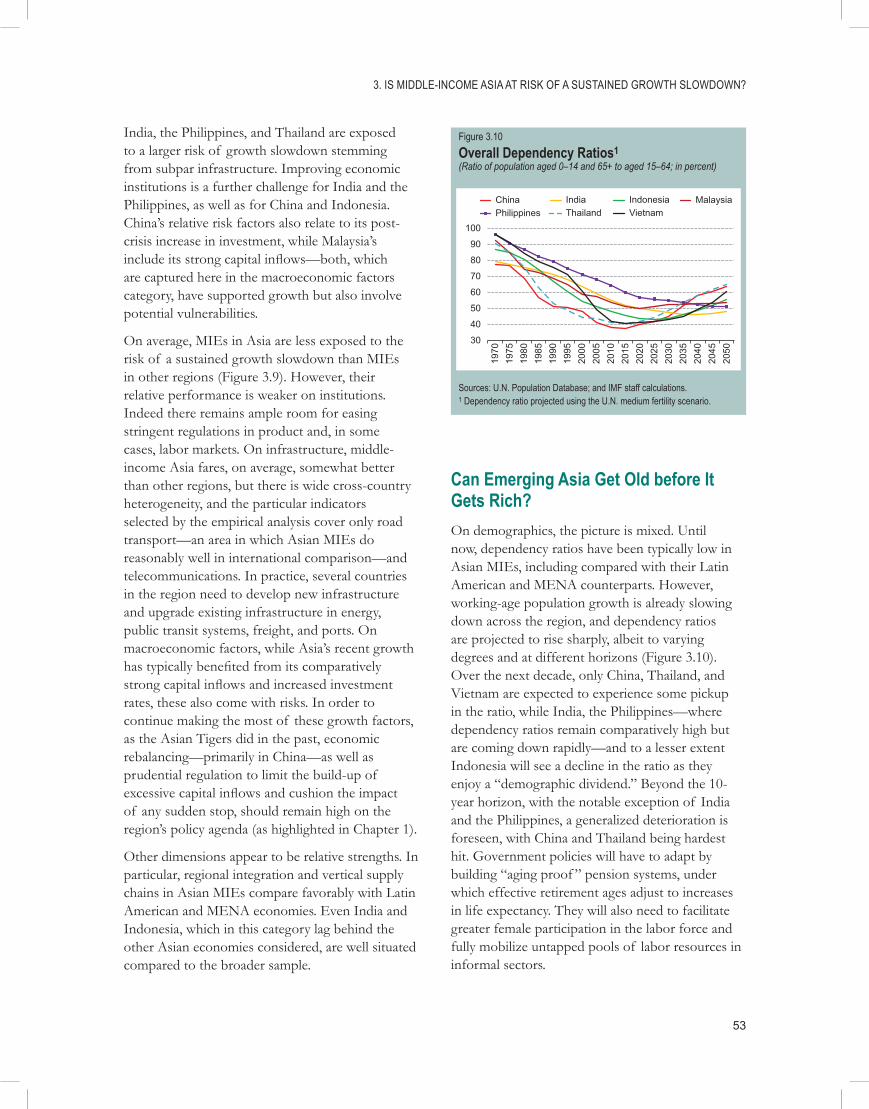
3. IS MIDDLE-INCOME ASIA AT RISK OF A SUSTAINED GROWTH SLOWDOWN?
53
India, the Philippines, and Thailand are exposed to a larger risk of growth slowdown stemming from subpar infrastructure. Improving economic institutions is a further challenge for India and the Philippines, as well as for China and Indonesia. China’s relative risk factors also relate to its post-crisis increase in investment, while Malaysia’s include its strong capital infl ows—both, which are captured here in the macroeconomic factors category, have supported growth but also involve potential vulnerabilities.
On average, MIEs in Asia are less exposed to the risk of a sustained growth slowdown than MIEs in other regions (Figure 3.9). However, their relative performance is weaker on institutions. Indeed there remains ample room for easing stringent regulations in product and, in some cases, labor markets. On infrastructure, middle-income Asia fares, on average, somewhat better than other regions, but there is wide cross-country heterogeneity, and the particular indicators selected by the empirical analysis cover only road transport—an area in which Asian MIEs do reasonably well in international comparison—and telecommunications. In practice, several countries in the region need to develop new infrastructure and upgrade existing infrastructure in energy, public transit systems, freight, and ports. On macroeconomic factors, while Asia’s recent growth has typically benefi ted from its comparatively strong capital infl ows and increased investment rates, these also come with risks. In order to continue making the most of these growth factors, as the Asian Tigers did in the past, economic rebalancing—primarily in China—as well as prudential regulation to limit the build-up of excessive capital infl ows and cushion the impact of any sudden stop, should remain high on the region’s policy agenda (as highlighted in Chapter 1).
Other dimensions appear to be relative strengths. In particular, regional integration and vertical supply chains in Asian MIEs compare favorably with Latin American and MENA economies. Even India and Indonesia, which in this category lag behind the other Asian economies considered, are well situated compared to the broader sample.
Can Emerging Asia Get Old before It Gets Rich?On demographics, the picture is mixed. Until now, dependency ratios have been typically low in Asian MIEs, including compared with their Latin American and MENA counterparts. However, working-age population growth is already slowing down across the region, and dependency ratios are projected to rise sharply, albeit to varying degrees and at different horizons (Figure 3.10). Over the next decade, only China, Thailand, and Vietnam are expected to experience some pickup in the ratio, while India, the Philippines—where dependency ratios remain comparatively high but are coming down rapidly—and to a lesser extent Indonesia will see a decline in the ratio as they enjoy a “demographic dividend.” Beyond the 10-year horizon, with the notable exception of India and the Philippines, a generalized deterioration is foreseen, with China and Thailand being hardest hit. Government policies will have to adapt by building “aging proof ” pension systems, under which effective retirement ages adjust to increases in life expectancy. They will also need to facilitate greater female participation in the labor force and fully mobilize untapped pools of labor resources in informal sectors.
Figure 3.10Overall Dependency Ratios1(Ratio of population aged 0–14 and 65+ to aged 15–64; in percent)
30
40
50
60
70
80
90
100
1970
1975
1980
1985
1990
1995
2000
2005
2010
2015
2020
2025
2030
2035
2040
2045
2050
China India Indonesia MalaysiaPhilippines Thailand Vietnam
Sources: U.N. Population Database; and IMF staff calculations.1 Dependency ratio projected using the U.N. medium fertility scenario.

54
REGIONAL ECONOMIC OUTLOOK: ASIA AND PACIFIC
Catching up to advanced economies’ living standards will ultimately require shifting from a development model based on technology absorption to one that fosters innovation. Indeed, consistent with their current development stage, most Asian MIEs are lagging behind advanced economies on various innovation indicators such as the number of patents per capita or the degree of sophistication of their exports. Many of the areas for further reform highlighted above—for example, improving infrastructure, easing stringent product and labor market regulations, further deepening trade integration—will help on this front, but other policies can also help output move up the value chain. In particular, as Asian MIEs continue to develop, their governments will have a role to play in raising R&D spending and tertiary education attainment, two key areas for innovation outcomes (for their empirical relevance for the middle-income trap, see Eichengreen,
Park, and Shin, 2013). There usually remains signifi cant room for improvement on both fronts, although China appears to outperform regional peers in the innovation area10 and is also catching up rapidly on tertiary education enrollment (Figures 3.11 and 3.12).
Finally, good policies are helpful not only to avoid the middle-income trap, but also in advancing growth elsewhere in Asia. Improvements in infrastructure, regulation, trade openness, and education are all needed to deliver and sustain strong growth in LICs. Likewise, in higher-income economies like Japan and Korea, increasing competition in product markets, improving innovation policies, reducing labor market dualism through job protection reform, and addressing the demographic aging challenge by fostering greater female participation in the labor force are all key challenges to raise trend growth.
10 In this area, China’s performance now compares with some of the advanced economies in terms of both inputs (e.g., R&D spending) and outcomes (e.g., number of triadic patents—those filed simultaneously in Europe, Japan, and the United States—per capita).
Figure 3.11Tertiary Education Enrollment1(In percent of eligible age group)
010203040506070
Indi
a
Indo
nesi
a
Viet
nam
Chi
na
Phi
lippi
nes
Mal
aysi
a
Thai
land
Asi
a
Latin
Am
eric
a
G7
Mid
dle
Eas
t &N
orth
Afri
caSources: UNESCO database.1 Tertiary education enrollment is classfi ed as total enrollment in ISCED 5 and 6 regardless of age. Eligible population is the 5-year age group starting from the offi cial secondary school graduation age. China, Thailand, and Vietnam data are as of 2011; India, Indonesia, and Malaysia, 2010; the Philippines, 2009; Latin America, 2005-11; Middle East and North Africa, 2008-11; G7 (excluding Germany), 2009–10.
Figure 3.12Research and Development Expenditure1(In percent of GDP)
0.0
0.5
1.0
1.5
2.0
2.5
Indo
nesi
a
Phi
lippi
nes
Viet
nam
Thai
land
Mal
aysi
a
Indi
a
Chi
na
Latin
Am
eric
a
Asi
a
G7
Mid
dle
Eas
t &N
orth
Afri
ca
Sources: World Bank, World Development Indicators; UNESCO database; and country authorities.1 Latest available data: Malaysia, 2006; India, the Philippines, and Thailand, 2007; China and Indonesia, 2009; Vietnam, 2010; Latin America, 2006–10; Middle East and North Africa, 2009–11; G7, 2009–10.

55
References
Abeysekera, A., and I. Dissanayake, 2012, “Revenue Mobilization Measures and Current Tax Issues, Sri Lanka,” presented at Third IMF-Japan High-Level Tax Conference for Asia and Pacifi c Countries, January 31–February 3, 2012.
Agustina, C., J. Arze del Granado, T. Bulman, W. Fengler, and M. Ikhsan, 2008, “Black Hole or Black Gold? The Impact of Oil and Gas Prices on Indonesia’s Public Finances,” World Bank Policy Research Working Paper, No. 4718.
Aiyar, S., R. Duval, D. Puy, Y. Wu, and L. Zhang, 2013, “Growth Slowdowns and the Middle-Income Trap,” IMF Working Paper No. 13/71 (Washington: International Monetary Fund).
Aldaba, R., 2006, “FDI Investment Incentive System and FDI Infl ows: The Philippine Experience,” Discussion Paper Series No. 2006–20 (Makati City: Philippine Institute for Development Studies).
Alesina, A., F. Campante, and G. Tabellini, 2008, “Why Is Fiscal Policy Often Procyclical?” Journal of the European Economic Association, Vol. 6, No. 5 (September), pp. 1006–36.
Arnold, J., B. Brys, C. Heady, Å. Johansson, C. Schwellnus, and L. Vartia, 2011, “Tax Policy for Economic Recovery and Growth,” Economic Journal, Vol. 121, pp. F59–F80.
Arnold, J., 2012, “Improving the Tax System in Indonesia,” OECD Economics Department Working Papers, No. 998 (Paris: OECD Publishing).
Arze del Granado, J., D. Coady, and R. Gillingham, 2012, “The Unequal Benefi ts of Fuel Subsidies: A Review of Evidence for Developing Countries,” World Development, Vol. 40, No. 11, pp. 2234–48.
Asia Development Bank, 2012, “Institutional Arrangements for Tax Administration in Asia
and the Pacifi c,” The Governance Brief, Issue 19. http://www.adb.org/sites/default/fi les/pub/2012/governance-brief-tax-administration-asia.pdf.
Blanchard, O., and R. Perotti, 2002, “An Empirical Characterization of the Dynamic Effects of Changes in Government Spending,” Quarterly Journal of Economics, Vol. 117, No. 4, pp. 1329–68.
Botman, D., A. Klemm, and R. Baqir, 2008, “Investment Incentives and Effective Tax Rates in the Philippines: A Comparison with Neighboring Countries,” IMF Working Paper 08/207 (Washington: International Monetary Fund).
Budina, N., and A. Tuladhar, 2010, “Post-Crisis Fiscal Policy Priorities for the ASEAN-5,” IMF Working Paper No. 10/252 (Washington: International Monetary Fund).
Chinoy, S., 2013, “Show Me the Money,” Financial Express, January 25. http://www.fi nancialexpress.com/news/column-show-me-the-money-/1064543/3.
Commission on Growth and Development, 2008, “The Growth Report: Strategies for Sustained Growth and Inclusive Development” (Washington: World Bank).
Craig, R.S., C. Hua, P. Ng, and R. Yuen, forthcoming, “Chinese Capital Account Liberalization and the Internationalization of the Renminbi,” IMF Working Paper (Washington: International Monetary Fund).
Cubero, R., S. Peiris, P. Rungcharoenkitkul, and D. Seneviratne, forthcoming, “Growing Strong Together: An Analysis of ASEAN Linkages,” IMF Working Paper (Washington: International Monetary Fund).
Ducanes, G., M. Cagas, D. Qin, P. Quising, and M. Abdur Razzaque, 2006, “Macroeconomic Effects of Fiscal Policies: Empirical Evidence

REGIONAL ECONOMIC OUTLOOK: ASIA AND PACIFIC
56
from Bangladesh, China, Indonesia, and the Philippines,” Economics and Research Department Working Paper No. 85 (Manila: Asian Development Bank).
Ebrill, L., M. Keen, J-P. Bodin, and V. Summers, 2001, The Modern VAT (Washington: International Monetary Fund).
Eichengreen, B., D. Park, and K. Shin, 2012, “When Fast-Growing Economies Slow Down: International Evidence and Implications for China,” Asian Economic Papers, Vol. 11, No. 1, pp. 42–87.
———, 2013, “Growth Slowdowns Redux: New Evidence on the Middle-Income Trap,” NBER Working Paper No. 18673, January (Cambridge, Massachusetts: National Bureau of Economic Research).
Financial Stability Board, 2012, “Identifying the Effects of Regulatory Reforms on Emerging Market and Developing Economies: A Review of Potential Unintended Consequences,” Report to the G-20 Finance Ministers and Central Bank Governors (June).
Fiszbein, A., and N. Schady, 2009, Conditional Cash Transfers: Reducing Present and Future Poverty (Washington: World Bank). http://siteresources.worldbank.org/INTCCT/Resources/5757608-1234228266004/PRR-CCT_web_noembargo.pdf.
Frankel, J.A., C.A. Vegh, and G. Vuletin, 2011, “On Graduation from Fiscal Procyclicality,” NBER Working Paper No. 17619 (Cambridge, Massachusetts: National Bureau for Economic Research).
Guimarães, R., and P. Rungcharoenkitkul (forthcoming), “Fiscal Policy in Asia: Is It Countercyclical? Is It Effective?” IMF Working Paper (Washington: International Monetary Fund).
Herd, R., S. Hill, and V. Koen, 2011, “Fiscal Prospects and Reforms in India,” OECD Economics Department Working Papers, No. 911 (Paris: OECD Publishing).
Heston, A., R. Summers, and B. Alen, 2012, “Penn World Table Version 7.1,” Center for International Comparisons of Production, Income and Prices at the University of Pennsylvania (November).
Ilzetzki, E., E. Mendoza, and C. Végh, 2011, “How Big (Small?) Are Fiscal Multipliers?” IMF Working Paper 11/52 (Washington: International Monetary Fund).
International Monetary Fund, 2004, “Public Investment and Fiscal Policy,” Paper prepared by the IMF’s Fiscal Affairs Department and Policy Development and Review Department in consultation with other departments and in cooperation with the World Bank and the Inter-American Development Bank. http://www.imf.org/external/np/fad/2004/pifp/eng/.
———, 2009, Regional Economic Outlook: Asia and Pacifi c (Washington, May).
———, 2011a, “Revenue Mobilization in Developing Countries,” Policy Paper (March). http://www.imf.org/external/np/pp/eng/2011/030811.pdf.
———, 2011b, Regional Economic Outlook: Asia and Pacifi c (Washington, April).
———, 2011c, “Japan: Spillover Report for the 2011 Article IV Consultation,” Country Report No. 11–183 (Washington, July).
———, 2011d, Regional Economic Outlook: Asia and Pacifi c (Washington, October).
———, 2012a, “Philippines: Technical Assistance Report on Road Map for a Pro-Growth and Equitable Tax System,” IMF Country Report No. 12/60 (Washington, March).
———, 2012b, Regional Economic Outlook: Asia and Pacifi c (Washington, April).
———, 2012c, “2012 Spillover Report,” IMF Policy Paper (Washington, July).
———, 2012d, “Pilot External Sector Report” (Washington, July).

REFERENCES
57
———, 2013a, “Energy Subsidy Reform: Lessons and Implications,” IMF Policy Paper (Washington).
———, 2013b, “Asia and Pacifi c Small States—Raising Potential Growth and Enhancing Resilience to Shocks,” Policy Paper (Washington, February). http://www.imf.org/external/[pp/longres.aspx?id=4746.
———, 2013c, Fiscal Monitor (Washington, April).
Jha, S., S. Mallick, D. Park, and P. Quising, 2010, “Effectiveness of Countercyclical Fiscal Policy: Time-Series Evidence from Developing Asia,” ADB Economics Working Paper Series, No. 211 (Manila: Asian Development Bank).
Jha, S., and B. Ramaswami, 2010, “How Can Food Subsidies Work Better? Answers from India and the Philippines,” ADB Economics Working Paper Series, No. 221 (Manila: Asian Development Bank).
Johansson, Å., C. Heady, J. Arnold, B. Brys, and L. Vartia, 2008, “Tax and Economic Growth,” OECD Economics Department Working Papers, No. 620 (Paris: OECD Publishing).
Kaminsky, G., C. Reinhart, and C. Végh, 2005, “When It Rains, It Pours: Pro-Cyclical Capital Flows and Macroeconomic Policies,” NBER Macroeconomics Annual Report 2004, Vol. 19, pp. 11–82.
Lane, P., and A. Tornell, 1999, “The Voracity Effect,” American Economic Review, Vol. 89, No. 1 (March), pp. 22–46.
Leamer, E.E., 1978, Specifi cation Search: Ad Hoc Inference with Nonexperimental Data (New York: Wiley).
Lim, C., F. Columba, A. Costa, P. Kongsamut, A. Otani, M. Sayid, T. Wezel, and X. Wu, 2011, “Macroprudential Policy: What Instruments and How Are They Used? Lessons from Country Experiences,” IMF Working Paper No. 238 (Washington: International Monetary Fund).
Magnus, J.R., O. Powell, and P. Prüfer, 2010, “A Comparison of Two Model-Averaging Techniques with an Application to Growth Empirics,” Journal of Econometrics, Vol. 154, pp. 139–53.
Manasan, R.G., 2011, “Assessment of the Impact of the Fiscal Stimulus, Fiscal Risk and Fiscal Transparency: The Philippines,” Chapter 6 in Assessment on the Impact of Stimulus, Fiscal Transparency and Fiscal Risk, ed. by T. Ito and F. Parulian, ERIA Research Project Report, No. 2010–1 (Jakarta: Economic Research Institute for ASEAN and East Asia). http://www.eria.org/publications/research_project_reports/assessment-on-the-impact-of-stimulus-fi scal-transparency-and-fi scal-risk.html.
Mohommad, A., R. Anand, D. Coady, V. Thakoor, and J.P. Walsh, forthcoming, “The Fiscal and Welfare Impacts of Reforming Fuel Subsidies in India,” IMF Working Paper (Washington: International Monetary Fund).
Organization for Economic Cooperation and Development (OECD), 2012, “Agricultural Policy Monitoring and Evaluation.”
———, 2012, Society at a Glance: Asia/Pacifi c 2011 (Paris: OECD Publishing). http://dx.doi.org/10.1787/9789264106154-en.
OECD and World Health Organization (WHO), 2012, Health at a Glance: Asia/Pacifi c 2012, Introduction (Paris: OECD Publishing). http://dx.doi.org/10.1787/9789264183902-en.
Reside, R.E., 2006, “Towards Rational Fiscal Incentives (Good Investments or Wasted Gifts?),” Economic Policy Reform Advocacy Fiscal Sector Report, No. 1, University of Philippines School of Economics.
———, 2007, “Can Fiscal Incentives Stimulate Regional Investment in the Philippines? (An Update of Empirical Results),” UPSE Discussion Paper No. 0705 (Quezon City: University of the Philippines School of Economics). http://www.econ.upd.edu.ph/dp/index.php/dp/article/view/67/59.
Sala-i-Martin, X., G. Doppelhoffer, and R. Miller, 2004, “Determinants of Long-Run Growth: A Bayesian Averaging of Classical Estimates (BACE) Approach,” American Economic Review, Vol. 94, No. 4 (September), pp. 813–35.

REGIONAL ECONOMIC OUTLOOK: ASIA AND PACIFIC
58
Schneider, F., A. Buehn, and C. Montenegro, 2010, “Shadow Economies All over the World: New Estimates for 162 Countries,” Policy Research Working Paper 5356 (Washington: World Bank).
Seneviratne, D., and Y. Sun, 2013, “Infrastructure and Income Distribution in ASEAN5: What Are the Links?” IMF Working Paper No. 13/41 (Washington: International Monetary Fund).
Sheridan, N., P. Tumbarello, and Y. Wu, 2012, “Global and Regional Spillovers to Pacifi c Island Countries,” IMF Working Paper No. 12/154 (Washington: International Monetary Fund).
Silvani, C., J. Brondolo, E. LeBorgne, and Frank Bosch, 2008, “Tax Administration Reform and Fiscal Adjustment: The Case of Indonesia (2001–07),” IMF Working Paper No. 08/129 (Washington: International Monetary Fund).
Spilimbergo, A., S.A. Symansky, and M. Schindler, 2009, “Fiscal Multipliers,” IMF Staff Position Note No. 2009/11 (Washington: International Monetary Fund).
Tang, H.C., P. Liu, and E.C. Cheung, 2010, “Changing Impact of Fiscal Policy on Selected ASEAN Countries,” ADB Working Paper No. 70 (December), ADB Economics Working Paper Series No. 211 (Manila: Asian Development Bank).
Tapsoba, S., forthcoming, “Options and Strategies for Fiscal Consolidation in India,” IMF Working Paper (Washington: International Monetary Fund).
Tornell, A., and P. Lane, 1999, “The Voracity Effect,” American Economic Review, Vol. 89, No.1, pp. 22–48.
Tumbarello, P., E. Cabezon, and Y. Wu, forthcoming, “Are the Asia and Pacifi c Small States Different from Other Small States?” IMF Working Paper (Washington: International Monetary Fund).
Usui, N., 2011a, Tax Reform Toward Consolidation— Policy Options for the Government of the Philippines (Manila: Asian Development Bank).
———, 2011b, Searching for Effective Poverty Interventions Conditional Cash Transfer in the Philippines (Manila: Asian Development Bank).
World Bank, 2012a, “Creating Fiscal Space through Revenue Mobilization,” South Asia Economic Focus (Washington, June). http://hdl.handle.net/10986/11925.
———, 2012b, Targeting Poor and Vulnerable Households in Indonesia (Washington). http://www.ausaid.gov.au/countries/eastasia/indonesia/Documents/prsp-report-targeting-poor-ipm.pdf.
———, 2012c, World Development Indicators (Washington).
Yang, Y., M. Davies, S. Wang, J. Dunn, and Y. Wu, 2011, “Monetary Policy Transmission Mechanisms in Pacifi c Island Countries,” IMF Working Paper No. 11/96 (Washington: International Monetary Fund).