
042 Eurostat data evaluation to ID dw - Cedefop · The European Centre for the Development of...
130
Transcript of 042 Eurostat data evaluation to ID dw - Cedefop · The European Centre for the Development of...


Cedefop
Evaluation of Eurostat education, training and skills data sources
Cedefop Panorama series
Luxembourg: Office for Official Publications of the European Communities, 2008

The European Centre for the Development of Vocational Training (Cedefop) is the European Union's reference Centre for vocational education and training. We provide information on and analyses of vocational education and training systems, policies, research and practice. Cedefop was established in 1975 by Council Regulation (EEC) No 337/75. Europe 123 GR-57001 Thessaloniki (Pylea) Postal Address: PO Box 22427 GR-55102 Thessaloniki Tel. (30) 23 10 49 01 11 Fax (30) 23 10 49 00 20 E-mail: [email protected] Homepage: www.cedefop.europa.eu
A great deal of additional information on the European Union is available on the Internet. It can be accessed through the Europa server (http://europa.eu).
Cataloguing data can be found at the end of this publication.
Luxembourg: Office for Official Publications of the European Communities, 2008
ISBN 978-92-896-0504-5 ISSN 1562-6180
© European Centre for the Development of Vocational Training, 2008 Reproduction is authorised provided the source is acknowledged.
Printed in Belgium

1
Foreword
Vocational education and training, a major part of lifelong learning, is critical to Europe’s effort to reposition itself in the global economy and respond to its major economic and social challenges.
To do this, policy and the policy-making process need to be informed and supported by robust and internationally comparable statistics and indicators. Adequate and consistent data are the key to understanding what is happening in vocational education and training (VET). It is with this in mind that the Helsinki communiqué (European Commission, 2006a) called for special attention to be given to improving the scope, comparability and reliability of VET statistics. The communiqué also indicates how these objectives could be achieved: using and combining existing data, while ensuring adequate national data on VET and consistency and comparability with other data on education and training.
The harmonised data sources of the European statistical system are the key sources of official education and training statistics and indicators at EU and Member States levels. They are core to providing relevant data according to commonly agreed quality standards. The European statistical system provides the appropriate statistical infrastructure to ensure the quality of the data, stable time series, sufficient coverage and sustainability, avoidance of double work, international comparability, and affordability. It comprises harmonised data sources, instruments and methods.
Yet currently available data sources do not provide a comprehensive and consistent picture of developments in education, training and skills, a situation that is intensified in VET. This publication, therefore, takes stock of the availability of VET data from current and planned Eurostat surveys and data collections.
It provides key contributions to the Copenhagen process: a clearer picture of the current and future scope of VET statistics is presented; important methodological issues regarding possibilities to compare and combine different data sources are identified; and short, medium and long-term visions of improvements is outlined.
Aviana Bulgarelli Cedefop Director

2
Acknowledgements
Katja Nestler and Alex Stimpson, project managers in Cedefop, supervised the drafting of this report Evaluation of Eurostat education, training and skills data sources.
Cedefop would like to acknowledge the notable contribution to this publication of Ms Ewa Wadolkowska, European Research Associates (EU-RA). She gathered and carried out the initial analysis of the material on Eurostat data sources, presented first findings to Cedefop and drafted the final report. The publication benefited from comments provided by Mircea Badescu, Centre for Research on Lifelong Learning (CRELL), and Oyvind Bjerkestrand, Directorate General for Education and Culture.
Technical and other support of Cedefop colleagues and the publication team are also acknowledged.

3
Table of contents Foreword .................................................................................................................................... 1 Acknowledgements .................................................................................................................... 2 Executive summary .................................................................................................................... 7 1. EU policy context ............................................................................................................. 13
1.1. EU policy background............................................................................................ 13
1.2. Political need for VET statistics and indicators ..................................................... 14
1.3. Objectives of the study........................................................................................... 15
2. Describing the VET system statistically........................................................................... 16 2.1. Types of VET to be covered .................................................................................. 16
2.2. Approaches to building a system of VET statistics and indicators ........................ 16
2.3. Defining the system................................................................................................ 17
2.4. Identifying the information to be collected ............................................................ 19
2.4.1. Inputs......................................................................................................... 19 2.4.2. Processes ................................................................................................... 20 2.4.3. Outputs ...................................................................................................... 21 2.4.4. Outcomes .................................................................................................. 22
3. Current Eurostat data VET data sources........................................................................... 26 3.1. Eurostat data sources collecting LLL/VET data .................................................... 26
3.2. Type of information collected ................................................................................ 28
3.3. Status of VET variables within the data source ..................................................... 31
3.4. Complementarity and exclusiveness of data sources ............................................. 32
3.4.1. Exclusiveness of data sources ................................................................... 33 3.4.2. Complementarity of Eurostat data sources ............................................... 36
3.5. Overview of statistics and indicators on VET/LLL ............................................... 37
4. Methodological aspects of Eurostat sources..................................................................... 42 4.1. Objectives of Eurostat sources ............................................................................... 42
4.2. Other methodological aspects ................................................................................ 44
5. Recent developments in Eurostat data sources................................................................. 51 5.1. Eurostat education and training data sources ......................................................... 51
5.1.1. CVTS ........................................................................................................ 51 5.1.2. EU LFS ad hoc module on entry of young people into the labour
market........................................................................................................ 52 5.1.3. UOE data collection on education systems............................................... 52 5.1.4. EU adult education survey (AES)............................................................. 55
5.2. Other Eurostat data sources.................................................................................... 57

4
5.2.1. European household survey ...................................................................... 57 5.2.2. EU LFS ad hoc module on the labour market situation of migrants
and their immediate descendants .............................................................. 58 5.2.3. Community survey on ICT usage and e-commerce in enterprises ........... 58 5.2.4. Community survey on ICT usage in households and by individuals........ 59
6. Setting up a system of VET statistics ............................................................................... 61 6.1. Introduction ............................................................................................................ 61
6.2. Current VET data collected.................................................................................... 61
6.3. Statistical system audit for modular system........................................................... 62
6.3.1. Essential data not currently collected ....................................................... 64 6.3.2. Adequacy and appropriateness of Eurostat sources.................................. 65
6.4. Sources for a VET statistics system ....................................................................... 66
6.5. Improving methodologies ...................................................................................... 73
6.6. Illustrating the modular system statistically........................................................... 77
6.6.1. Inputs......................................................................................................... 79 6.6.2. Processes ................................................................................................... 84 6.6.3. Outputs ...................................................................................................... 85 6.6.4. Outcomes .................................................................................................. 88
7. List of abbreviations ......................................................................................................... 90 8. Country codes ................................................................................................................... 91 9. Bibliography ..................................................................................................................... 92 Annex 1: Reconciliation of Eurostat VET and UOE data collections .................................. 94 Annex 2: Detailed overview of education variables collected in Eurostat sources ............ 104 Annex 3: Currently published statistics and indicators on VET/LLL ................................ 109

5
List of tables, figures and boxes Tables
Table 1: Eurostat sources that collect data on VET .............................................................. 9 Table 2: Type of information that would help to build a more comprehensive picture
of VET................................................................................................................... 24 Table 3: Eurostat data sources collecting information on LLL and, of those, on VET....... 28 Table 4: Type of data collected by Eurostat sources........................................................... 29 Table 5: Type of VET collected by Eurostat sources.......................................................... 29 Table 6: Summary of ranking of LLL/VET variables in each Eurostat source................... 31 Table 7: Classification of data sources based on overall interaction of all variables in
each source ............................................................................................................ 32 Table 8: Definitions of various types of VET used in Eurostat sources and at
Cedefop ................................................................................................................. 34 Table 9: Eurostat sources collecting complementary information on VET ........................ 37 Table 10: Thematic statistics and indicators to monitor progress towards the Lisbon
objectives in education and training...................................................................... 41 Table 11: Objectives of Eurostat sources .............................................................................. 42 Table 12: Statistical units and target population of Eurostat sources.................................... 44 Table 13: Timeliness of Eurostat sources.............................................................................. 46 Table 14: Overview of Eurostat sources by type................................................................... 47 Table 15: Periodicities of Eurostat sources ........................................................................... 48 Table 16: Information collected on vocational education in the UOE data collection ......... 53 Table 17: Education-related variables to be collected in the 2008 ad hoc module on
the labour market situation of migrants and their immediate descendants ........... 58 Table 18: Chronological list of main changes in collecting information on LLL in the
Community survey on ICT usage in households and by individuals .................... 60 Table 19: Information currently not collected by any Eurostat source ................................. 64 Table 20: Sources to include in the harmonised modular system in short, medium and
long term................................................................................................................ 74 Table 21: Proposed definitions for VET terms in the harmonised system............................ 75 Table 22: Coverage of economic activities in the CVTS and the LCS ................................. 76 Table 23: Examples of indicators that can be formed from existing Eurostat sources to
describe the VET system....................................................................................... 78 Table 24: Enterprises providing any other form of training as % of all enterprises, by
form of training (2005) for NACE sections C to K and O.................................... 79 Table 25: Percentage of employees (all enterprises) participating in CVT courses
(2005) for NACE sections C to K and O............................................................... 80

6
Table 26: Number of apprentices total and in full-time units in enterprises employing more than 10 people (2004) for NACE sections C to O, except L........................ 80
Table 27: Number of students in pre-vocational and vocational education in the EU-27 (2005, in thousands) .................................................................................. 81
Table 28: Direct costs of CVT courses as % of total labour cost (all enterprises) (2005) for NACE sections C to K and O............................................................... 82
Table 29: Vocational training allowances and vocational training in purchasing power standard per inhabitant (2005)............................................................................... 82
Table 30: Number of students in vocational programmes by ISCED level, study intensity (full-time, part-time) (2005) ................................................................... 83
Table 31: Percentage of the total hours in CVT courses, by type of course, (2005) for NACE sections C to K and O................................................................................ 84
Table 32: Hours in CVT courses per employee (all enterprises) (2005) for NACE sections C to K and O............................................................................................ 84
Table 33: Number of graduates from vocational education by ISCED level in the EU-27 (2005) ............................................................................................................... 85
Table 34: Number of graduates of vocational programmes by ISCED level and gender (2005) .................................................................................................................... 86
Table 35: Number of graduates from upper secondary education (ISCED 3) vocational programmes by age group (2005)........................................................ 87
Table 36: Number of graduates from post-secondary non-tertiary education (ISCED 4) vocational programmes by age group (2005) ................................................... 88
Table 37: Job mismatches (a) and their labour-market effects among school leavers in Europe (2000)........................................................................................................ 89
Table 38: Criteria determining the allocation of programmes into the different categories in the VET data collection (a)............................................................... 95
Table 39: Comparison of variables collected in the UOE data collection and the discontinued VET data collection ......................................................................... 97
Figures
Figure 1: Levels of the VET system ..................................................................................... 18 Figure 2: VET system components....................................................................................... 18 Figure 3: Graphical representation of current Eurostat VET statistics................................. 62
Box
Box 1 Key education-related indicators on EU policy.....................................................39

7
Executive summary
Introduction
The Council conclusions on European cooperation in vocational education and training agreed that priority should be given at European level to ‘the improvement of the scope, precision and reliability of VET [vocational education and training] statistics in order to enable evaluation of progress’ (Council of EU, 2004, p. 14).
The Maastricht communiqué on the future priorities of enhanced European cooperation in vocational education and training (VET) advised that priority should be given to ‘the improvement of the scope, precision and reliability of VET statistics in order to enable evaluation of progress in making VET efficient, effective and attractive. Adequate data and indicators are the key to understanding what is happening in VET and what additional interventions and decision-making are required by all parties involved’ (European Commission, 2004, p. 4).
The Helsinki communiqué on enhanced European cooperation in vocational education and training stated that ‘adequate and consistent data and indicators are the key to understanding what is happening in VET’ (European Commission, 2006, p. 8).
Currently available statistics and indicators do not provide a complete picture of education, training and skills. They allow analysis of only single aspects because information across sources is difficult to combine. In many instances results from different sources provide different pictures of the same issue. This is particularly the case with statistics on VET. A considerable amount of key statistics and indicators is not available, not reliable or not comparable.
It is within this context that this study aims to reveal the potential of existing and future Eurostat surveys and data collections to improve the availability and quality of statistics and indicators on education and training, in particular VET, lifelong learning (LLL) and skills.
Specifically, this study aims to:
(a) provide a detailed overview of all Eurostat data sources that contain, in one way or another, variables related to education and training, in particular VET, LLL and skills (VET/LLL variables);
(b) provide a detailed overview of methodological developments in existing data sources and of new data sources that contain VET/LLL variables;
(c) develop a concept for a harmonised modular system of statistics and indicators on VET.

8
Defining a system for VET statistics and indicators
Considering a linear approach for a system of VET statistics, and based on the main components of the education system itself (Unesco, 2005), statistics and indicators can be classified into the following four types:
(a) inputs; these are the real resources used in education and include:
(i) student characteristics (e.g. socioeconomic status of students, occupational status of parents; student’s and parent’s country of birth);
(ii) teacher/trainer characteristics (e.g. minimum qualification required; in-service training; working time and holidays; salaries; promotion and advancement);
(iii) educational institution characteristics (e.g. number of institutions; number of personnel, number of new entrants; number of students by age and gender);
(iv) resources devoted to education (e.g. expenditure on education by source of finance; government, enterprises, households, etc.);
(v) curricula/programme characteristics (e.g. average duration of programme in days/hours; time spent in institution/workplace);
(b) processes; these are the interactions between learners and inputs, between different inputs themselves, and between teaching/learning processes and include:
(i) learner time allocation, e.g. level of absenteeism;
(ii) management, e.g. authorities responsible for management of educational institutions such as regional, local authorities, legal status, methods of financing, guidance;
(iii) teaching/learning methods, e.g. theoretical courses, lectures, basic knowledge or whether it involved practical training, simulation of work experience;
(iv) monitoring of teachers/trainers; tools that institutions/workplaces have in place to evaluate the quality of teaching/training provided;
(v) monitoring and evaluation of learning outcomes; tools to monitor and evaluate outcomes of learning;
(c) outputs; these are the direct and more immediate results or effects of education and include:
(i) learner attainment, e.g. number of graduates, drop-outs;
(ii) changes in attitudes; people’s attitudes towards education play an important part in their willingness to learn and thus can be linked to their performance;
(iii) improvements in quality, e.g. the effectiveness of education and training;
(iv) equity effects, e.g. number of graduates by gender, socioeconomic status, etc;
(d) outcomes; these are the ultimate or eventual effects of education and include:
(i) impact on students, e.g. returns on education, relative earnings, labour force status;

9
(ii) impact on economy and development; relationship between economic growth and level of educational attainment;
(iii) impact on health and citizenship, e.g. people having a long-standing illness by educational attainment, participation in elections, local communities;
(iv) impact on productivity in enterprises; net impact on productivity in enterprises of vocational training;
(v) sociocultural participation, e.g. going to the cinema, cultural site visits, attending live sporting events, book reading, participation in political parties or trade unions;
(vi) retention of minimum learning competences; practical skills, know-how and understanding) necessary for employment in a particular occupation or trade, or class of occupations or trades.
VET data currently covered by Eurostat data sources
Some 16 Eurostat sources have recently collected, or are currently collecting, data on LLL (Table 1). Of the 16 data sources, only 10 sources have collected or are currently collecting variables that can be relevant to VET. Almost all of the identified data sources collect non-financial information, while half of these data sources collect financial information. Most important, just over a third of data sources collect both financial and non-financial data on LLL. Examining those data sources collecting some form of VET information reveals that most sources collect some data on initial vocational training (IVT); seven sources collect some data relating to continuing vocational training (CVT) (not in table).
Table 1: Eurostat sources that collect data on VET
Eurostat source Collects VET data
Continuing vocational training survey (CVTS) x Unesco-UIS/OECD/Eurostat (UOE) data collection on education systems x EU labour force survey (LFS) x EU labour force survey (LFS) ad hoc modules on LLL x EU labour force survey (LFS) ad hoc module on transition from school to working life EU statistics on income and living conditions (EU-SILC) Eurostat harmonised European time use surveys (HETUS) EU labour cost survey (LCS) x EU labour-market policy (LMP) database x European system on social protection on statistics (ESSPROS) x Eurostat harmonised household budget survey (HBS) National health interview surveys Structural business statistics (a) x European system of national accounts Community survey of ICT usage in households x Community innovation surveys (CIS) x (a) The structural business statistics data collection stopped covering data on VET from 2002 following a change in the methodology. Prior
to 2002, it collected only one question related to VET, which was on the number of apprentices in enterprises.
10
It seems that for data sources where the objectives are not associated with the collection of information on education and training, the status of LLL/VET variables is not of primary importance. Two examples are the Eurostat harmonised household budget survey (HBS), and the EU labour cost survey (LCS) which collect data on household expenditure on education and structure of labour costs. The Eurostat harmonised HBS aims to collect information on household consumption expenditures on goods and services, including education, while the EU LCS aims to collect information on developments in labour costs, of which a part is education.
The impact of this is that, to gain a broader picture of developments in VET, statistics from dedicated collections such as Unesco/OECD/Eurostat (UOE) or the continuing vocational training survey (CVTS) have to be combined with data from other sources. However, definitions and methodologies may differ, and therefore comparability may suffer.
Recent developments in Eurostat data sources In the past few years there have been many developments with Eurostat data sources across all statistical themes, including modifications to existing collections (e.g. data collected separately on general education and vocational education for several variables or the introduction of new surveys such as the adult education survey). Not all the developments that have taken (or are taking) place are related to collecting information on LLL and VET.
Establishing a VET statistics system In an ideal world, all the data needed to describe the VET process would be available from one data source, in an appropriate format, for the relevant years. It would cover (at a minimum) the essential indicators, in a harmonised form, and at a good level of quality. There would be just one data source collecting all the information (both qualitative and quantitative) required to describe the VET process. Unfortunately, there is not a single data source that supplies exhaustive VET data, therefore several sources have to be used. In several instances, the methodologies are not fully harmonised. Concepts and definitions and, in several cases, even the classifications used, for examples ISCED or NACE (1) are not always the same. A number of the variables needed to form the indicators are not available in existing data sources. In some cases, the same variable is found in more than one data source, but with different data for the same item, resulting from different methodologies or parameters being used. The following points were observed in an evaluation of Eurostat data sources:
(a) periodicity of data sources; while some sources collect data frequently, such as every year (e.g. labour force survey, Community survey of ICT usage in households, UOE data collection), others are conducted at longer intervals (e.g. CVTS, LCS, Eurostat harmonised HBS);
(1) ISCE: international standard classification of education
NACE: statistical nomenclature of economic activities in the European Community.

11
(b) differences in the period of observation in household and individual surveys; it was established that there are differences in the period of observing the household or individual in Eurostat sources. For example, the labour force survey (LFS) looks at the previous four weeks, while the adult education survey (AES) looks at the previous 12 months;
(c) differences concerning concepts and definitions used in relation to VET; while Eurostat data sources try to maintain the same concepts and definitions, there is a great deal of divergence between sources used for vocational education. This means that problems arise when compiling a statistical picture of VET using different data sources;
(d) classifications used; in general Eurostat sources tend to apply the same classifications, such as international standard classification of occupations (ISCO-88), NACE, and ISCED 97. However, some sources truncate the ISCED by collecting data on two ISCED levels together. Data is collected according to the economic activity (NACE) of enterprises within both the LCS and CVTS, but unfortunately they do not cover the same categories;
(e) methodological changes in relation to data requested; in some sources, such as the CVTS and the UOE collection, changes to the questionnaires largely benefit the information collected on VET, although one disadvantage is that data will not be available for the entire time series. Other sources, such as the structural business statistics survey, have stopped collecting data on VET;
(f) coverage; not all data sources cover all existing Member States for all the years for which data was collected. This means that there are gaps in the data collected for some countries.
One could conclude that not all Eurostat sources can be part of a harmonised system of VET statistics. In the short term, only two sources could be considered to be harmonised enough to be included in a modular system: the CVTS and the UOE data collection on education systems. Other sources identified could potentially be part of the modular system of VET statistics in the medium to long term. However, methodological work needs to be undertaken for them to be considered harmonised. This would include:
(a) harmonising the definitions and concepts in relation to education and training; there is no homogeneity in the concepts and definitions applied in relation to education and training, especially about VET. A starting point in reaching a consensus could be the definitions adopted in the CVTS and the former Eurostat VET data collection, which was suspended in 2001. There is currently no single adopted concept/definition in the European statistical system for each of the following:
(i) CVT;
(ii) institutional training;
(iii) workplace training;
(iv) alternance training;
(v) apprenticeship;

12
(b) reaching a consensus on the categories of economic activities to use in NACE for surveys of enterprises. The CVTS is only conducted once every five years. In theory the LCS could be used to complete gaps for some variables. However, the surveys do not collect data for enterprises according to the same economic activities as classified by NACE (Rev. 1.1). The coverage of NACE (2) sections is not the same for both surveys. The CVTS covers enterprises whose activity is classified by NACE sections C to K and O, whereas the LCS covers all enterprises classified by NACE sections C to O. Therefore, it is essential that agreement is reached on the NACE sections to be used in any modular system for all sources;
(c) collection of data on vocational education from surveys of individuals and households. One of the problems associated with surveys of individuals or households is whether it is possible to distinguish between general education and the different types of VET. The forthcoming EU LFS ad hoc module on entry of young people into the labour market will attempt to differentiate between general and vocational education. This survey needs to be examined with the aim of determining whether it is feasible to adopt the methodology in other surveys of individuals and households such as the AES and the EU statistics on income and living conditions (EU-SILC);
(d) completing statistical gaps needed to describe the VET process. To fill some gaps in the proposed modular system of VET statistics and indicators, some additional modules could be inserted in existing sources.
(2) NACE Rev. 1.1 is the classification of economic activities corresponding to the international standard
industrial classification (ISIC) Rev. 3 at European level. Though more disaggregated than ISIC Rev. 3.1, NACE Rev. 1.1 is totally in line with it and can thus be regarded as its European counterpart.

13
1. EU policy context
1.1. EU policy background
The Lisbon conclusions (Council of EU, 2000) gave a major political impetus to enhanced cooperation in VET by making education, training and LLL key elements of EU strategy for competitiveness and social cohesion. The 2001 Stockholm European Council agreed that efforts should continue to develop education and training systems, focusing on three strategic goals to be attained by 2010: quality, access, and openness to the world. A year later, the European Council approved a detailed work programme (Education and training 2010) (Council of EU, 2002) to reach these goals, supporting the ambition of the Ministers for Education to make education and training systems in Europe a worldwide quality reference by 2010.
The Barcelona European Council in March 2002 requested that further action be taken on vocational training, particularly about the transparency of qualifications and closer European cooperation, working closely with the social partners. On 12 November 2002, the Council (education, youth and culture) agreed a Resolution on promoting enhanced European cooperation in VET (Council of EU, 2003). This strategy for improving the performance, quality and attractiveness of VET was then endorsed by the Ministers for VET of the Member States, the EFTA/EEA and candidate countries, the Commission and the European social partners, at their meeting in Copenhagen on 29-30 November 2002, the Copenhagen declaration (European Commission, 2002). The declaration anticipated gradual integration of the Copenhagen process into the follow-up to the objectives of education and training systems (the Objectives process).
The Council and the European Commission (2004) joint interim report Education and training 2010 to the 2004 Spring European Council, includes a progress report on the first concrete results of the Copenhagen process, and recognises its role in encouraging reform, supporting LLL and developing mutual trust between Member States and between all key players in VET. The interim report calls for European common references and principles as a matter of priority, at national level, taking account of national situations and respecting Member States’ competences.
Since November 2002, the Council has adopted a series of acts resulting from enhanced cooperation in VET and LLL. They cover human capital for social cohesion, competitiveness, guidance throughout life, principles for identifying and validating non-formal and informal learning and quality assurance in VET.

14
1.2. Political need for VET statistics and indicators
In its conclusions of 24 May 2005 on new indicators in education and training, the Council asked the Commission to ‘assess progress made towards the establishment of a coherent framework of indicators and benchmarks for following-up on the Lisbon objectives in the area of education and training, including a reconsideration of the suitability of existing indicators used for monitoring progress’ (Council of EU, 2005, p. 8).
The driving force for such a framework was the standing group on indicators and benchmarks (SGIB). In its meeting on 8 and 9 June 2006, the SGIB agreed on the Commission’s draft proposal for a framework of 10 benchmarks and other targets and 22 key indicators. Key indicators proposed were the educational level of the whole population, education and training of students with special needs, employability, socioeconomic outcomes and the education/training process. In February 2007, the Commission proposed in a Communication a coherent framework of indicators and benchmarks to monitor the Education and training 2010 programme (European Commission, 2007a).
Finally, in its meeting on 25 May 2007, the Council set the terms and guiding principles for further developments in education and training statistics. The Council confirmed that:
(a) ‘periodic monitoring of performance and progress through the use of indicators and benchmarks is an essential part of the Lisbon process [...];
(b) the development of new indicators shall fully respect the responsibility of Member States for the organisation of their education systems and should not impose undue administrative or financial burden on the organisation and institutions concerned [...];
(c) the five benchmarks [...] are of continuing relevance [...] (3);
(d) there is a need to continue to improve the quality of data produced by the European statistical system’ (Council of EU, 2007, p. 5).
The Council invited ‘the Commission to make use of, or further develop, sixteen of the proposed core indicators’ (op. cit., p. 7); and invited ‘the Member States and the Commission to closely cooperate in the development and implementation of a coherent framework of indicators and benchmarks, including the improvement of the statistical basis’ (op. cit., p. 9). It reaffirmed the ‘need to continue to enhance the cooperation with other international organisations active in the field [...]’ (op. cit., p. 6).
Currently available statistics and indicators do not provide a complete picture of education, training and skills. They allow analysis of only single aspects because information across data sources is difficult to combine. In many instances, results from different sources provide different pictures of the same issue. This is particularly the case with statistics on VET. Moreover, many VET statistics and indicators are not available, not reliable or not comparable.
(3) The five benchmarks are defined in the Council conclusions of 5 May 2003 on reference levels of European
average performance in education and training (benchmarks) (Council of EU, 2003).

15
1.3. Objectives of the study
The harmonised data sources of the European statistical system are the key sources of official education and training statistics and indicators at EU and Member State levels. In this context, the Council reaffirmed in 2007 that ‘there is a need to continue to improve the quality of the data produced by the European statistical system, [...]’ (Council of EU, 2007, p. 5).
Within this policy context, this study aims to reveal the potential of existing and future Eurostat surveys and data collections to improve the availability and quality of statistics and indicators on education and training, in particular VET, LLL and skills.
The study’s three main objectives are as follows:
(a) to provide a detailed overview of all Eurostat data sources that contain variables related to education and training, in particular VET, LLL and skills (VET/LLL variables);
(b) to provide a detailed overview of methodological developments in existing data sources and of new data sources that contain VET/LLL variables;
(c) to develop a concept for a harmonised modular system of statistics and indicators on VET.

16
2. Describing the VET system statistically
2.1. Types of VET to be covered
Before embarking on a detailed analysis of the information required to describe VET statistically, it is necessary to establish some basic points. First is reaching a consensus on the type of VET that should be included in the system.
According to the Cedefop glossary Terminology of vocational training policy, VET is defined as ‘education and training which aims to equip people with skills and competences that can be used on the labour market’ (Cedefop; Tissot, 2004, p. 158). This means that VET can include the following types of training:
(a) initial vocational training (IVT);
(b) continuing vocational training (CVT);
(c) labour-market training (for unemployed).
This study aims to define a modular system of VET statistics on IVT and CVT. This system should be extended at a later stage to include labour-market training.
2.2. Approaches to building a system of VET statistics and indicators
Several concepts could be considered in building a system of VET statistics and indicators, including the following:
(a) the policy approach, or top-down approach, examines policies at national/international level and establishes the data needed to monitor these policies. Indicators are constructed based on the policy needs. Data sources are then examined to see what policy needs can or cannot be met with currently available data. An example of this approach is the coherent framework of indicators and benchmarks for monitoring progress towards the Lisbon objectives in education and training. Though VET is not explicitly covered by the 16 indicators, an ‘extension’ of some indicators to cover VET aspects is not only necessary but also possible;
(b) the mixed approach or policy-oriented – empirical approach – distinguishes three dimensions: statistical, analytical and policy-oriented. The OECD organises indicators to distinguish between the actors in education systems while grouping the indicators according to whether they concern learning outcomes, circumstances that shape these outcomes or constraints that set policy choices into context. Policy issues (such as equity in educational outcomes and educational opportunities, the quality of educational outcomes and educational provision, effectiveness of resource management) are dealt with in the same framework;

17
(c) the statistical (empirical) approach. Indicators are classified according to the main components of the education system (including VET):
(i) inputs: real resources involved in education, for example the characteristics of learners, educators, curricula, textbooks, facilities and equipment, and financial resources;
(ii) processes: interactions between learners and inputs, between different inputs themselves, and between teaching/learning processes, for example attendance/ participation, absenteeism, etc.;
(iii) outputs: direct and more immediate results of education, for example learner’s completion/certification;
(iv) outcomes: ultimate or eventual effects of education, for example increased earnings, employment, contribution to productivity, improved health, and other non-monetary outcomes;
(d) the bottom-up approach examines the data currently collected by national and international sources and builds indicators based on what is available. This approach can be considered to be more pragmatic in that it is reliant on the data being available. However it does not always sufficiently consider policies and can be simplistic.
The policy approach and the mixed approach require in-depth analysis of existing policies at national/international level. Given the scope of this study, it was decided not to pursue these approaches. The bottom-up approach was avoided given the fragmentary nature of the available statistics and indicators related to VET.
2.3. Defining the system
Using the statistical approach, four levels of the main VET system have been identified for collecting statistical information:
(a) legislation and policies;
(b) national institutions and organisations;
(c) providers of VET;
(d) individual participants.
Figure 1 shows how these main levels interconnect.
Two approaches could be employed in building a statistical model of the VET system. The first considers inputs, processes, outputs and outcomes in relation to each of the levels in Figure 1; the second does not differentiate between the different levels (e.g. educational institutions, individual participants, etc.) to avoid duplication of information.

18
Providers of vocational education and training
National institutions and organisations
Individual participants
Policies and legislation
Input Processes Outputs Outcomes
Figure 1: Levels of the VET system
It is not possible to examine different levels (national institutions and organisations; providers of VET; and individual participants) with respect to the statistical approach (inputs, processes, and outputs, and outcomes) separately given the overlapping and interacting nature of these levels. If we are trying to measure how much individuals spent on their own education in course fees we could suggest collecting data on individual/household expenditure on education. However, we would already be duplicating this information as it would also be considered as an input into the vocational education system through financial resources at the institutions disposal.
Thus, it was decided to adopt a linear approach as the basis for the system (Figure 2). The main advantage is that it is easy to adopt and that indicators and statistics can be easily defined as input, process, output or outcome indicators.
Figure 2: VET system components

19
The four components may be viewed as a form of production. Indicators are normally classified as follows:
(a) input indicators are measures of real resources available in education. These measure the characteristics of learners (that is the availability of a resource, its nature and quality, and its manner/rate of use), educators, facilities, materials and equipment;
(b) process indicators are measures of the interaction taking place between inputs. These show the transition of inputs into outputs. They are of use at many different levels in an administrative hierarchy and are important in evaluating a programme;
(c) output/outcome indicators are measures of the immediate/long-term results and effects of educational activity, for example attainments effects, achievement effects, attitude/ behaviour effects, and equity effects.
2.4. Identifying the information to be collected
Having identified the main components of the system, it is essential to specify the information that should be collected on each component. We shall consider each component in turn.
2.4.1. Inputs
Inputs to VET are the real resources used in education. The following information on real resources has been identified:
(a) student characteristics, i.e. indicators of correlation between student performance and background, including:
(i) socioeconomic status of students, determined by the socioeconomic status of the parents if the student is not employed;
(ii) occupational status of parents;
(iii) student and parents’ country of birth;
(iv) native language of student and parents;
(v) obstacles to learning (low income, time, etc.);
(b) teacher/trainer characteristics e.g.:
(i) minimum proportion of time devoted to professional training of teachers;
(ii) minimum length and level of teacher training;
(iii) qualifications;
(iv) minimum qualification required (level and pedagogical training) for teachers and trainers;
(v) in-service training;

20
(vi) working time and holidays;
(vii) salaries;
(viii) promotion and advancement;
(c) characteristics of educational institutions offering VET programmes. Characteristics include indicators such as number of institutions; number of personnel broken down by type (teachers, support staff, assistants, etc.); number of management personnel; number of new entrants by age and gender; number of students by age and gender; average class size, etc.;
(d) resources devoted to education, including expenditures on education by source of finance (government, enterprises, households); expenditures on education by type of transaction (spending on education institutions, grants and loans to students etc.); education expenditures of education institutions (current and capital expenditures);
(e) VET curricula/programme characteristics, including average duration of programme in days/hours; time spent in institution/workplace.
2.4.2. Processes
These are the interactions between learners and inputs, between different inputs themselves, and between teaching/learning processes, including the following:
(a) learner time allocation: amount of time the learner devotes to VET in an institution/workplace or elsewhere. The level of absenteeism should also be considered;
(b) management: information of a quantitative and qualitative nature, including authorities managing educational institutions (e.g. regional, local authorities), legal status, methods of financing, school board, role of social partners and guidance, etc. Further, there should be a distinction between public and private schools;
(c) teaching/learning methods: qualitative information on pedagogical methods used and whether training took place:
(i) in an educational institution with theoretical courses, lectures, basic knowledge, or whether it involved practical training, simulation of work experience;
(ii) in an enterprise and was either solely work based or involved theoretical courses, lectures, basic knowledge;
(d) monitoring of teachers/trainers, referring to the tools institutions/workplaces have in place to evaluate the quality of teaching/training provided. Qualitative information is to be collected;
(e) monitoring and evaluation of learning outcomes, referring to the tools institutions/workplaces have in place to monitor and evaluate outcomes of learning, such as examinations, regular meetings with students, etc. Again, qualitative rather than quantitative information is required.

21
2.4.3. Outputs
These are the direct and more immediate results of education, including the following:
(a) learner attainment: several indicators can be used, including the number of graduates. Graduation rates are a measure of the production of educational institutions and of the system in general and record the flow of graduates which can potentially enter the labour market or further study. This indicator is only pertinent to vocational programmes that lead to a qualification. Other indicators include:
(i) number of drop-outs: high dropout rates imply high input-output ratios and hence lead to low internal efficiency. The UOE data collection on education systems collects information on the number of students and repeaters in ISCED levels 1 to 3 by grade within that ISCED level. Using this information it is possible to calculate the number of dropouts. However, the data collected in this case does not distinguish between general programmes and pre-vocational or vocational programmes for ISCED levels 2 and 3 making calculation of drop-out rates for vocational education difficult;
(ii) self-reported skills: important for those vocational programmes that do not lead to a vocational qualification;
(b) changes in attitudes: attitudes towards education play an important part in a person’s willingness to learn and can be linked to performance. It is interesting to see whether, after participating in VET, their attitudes have changed either positively or negatively. Measuring changes in attitudes would require surveying students before and after programme participation to gauge their attitudes to a particular subject or even towards the programme itself. Measuring student’s attitudes towards a particular subject should not be confused with measuring their attitudes towards a programme or even to their teachers/trainers;
(c) improvements in quality: the quality of learning in schools refers to the relationship between pedagogical and organisational contexts (e.g. self-organised learning, project-based learning, or teamwork), and the results of competence measurements. It can be assumed that intensive use of such learning opportunities is correlated with the learning achievements of students. The quality of training in firms refers to characterisations of firm-based learning and instruction differentiated according to working tasks, working environments, and pedagogical and didactical settings;
(d) equity effects: the recent Commission Communication on efficiency and equity in European education and training systems stated that ‘people with low qualifications are at an increased risk of unemployment and social exclusion’ (European Commission, 2006b p. 3). It is important to establish whether there are any groups in society that are excluded or underrepresented in this type of education or training. Examples of the type of information collected here should include indicators on learner attainment (e.g. number of graduates) cross-referenced by particular groups in society.

22
2.4.4. Outcomes
These are the ultimate or eventual effects of education, for example increased earnings, employment, contribution to productivity, improved health, and other non-monetary outcomes. They include the following:
(a) impact on students, including:
(i) returns on education: a measure of the returns obtained, over time, relative to the cost of the initial investment in education. Rates of return can be measured from the private individual’s point of view or from society’s point of view. Private rates of return measure the future net economic payoff to an individual of increasing the amount of education undertaken while social rates of return measure the benefits to society of additional education. Several studies have shown that the higher the level of education attained, the higher the earnings from employment will be. The prospect of increased future earnings may act as an incentive for an individual to attain a higher education qualification compared to a vocational qualification;
(ii) relative earnings: one of the ways in which the market provides incentives for individuals to develop and maintain appropriate levels of skills is through wage differentials, in particular through the enhanced earnings accorded to those persons completing additional education. Human capital includes the stock of skills that individuals maintain or develop, usually through education or training, and then offer in return for earnings in the labour market. The higher the earnings that result from increases in human capital, the higher the returns on that investment and the premium paid for enhanced skills and/or enhanced productivity;
(iii) labour force participation by level of educational attainment: this involves examining the labour force status of individuals with vocational educational qualifications following the International Labour Organisation definitions of employment, unemployment and inactivity. This can then be compared with the labour force status of individuals with different levels and types of educational attainment;
(iv) unemployment rates by level of educational attainment: to the extent that educational attainment is assumed to be an indicator of skill, it can signal to employers the potential knowledge, capacities and workplace performance of candidates for employment. Differences in unemployment rates by level of educational attainment can be an indicator of the degree to which further education improves individuals’ economic opportunities. High unemployment rates of individuals with high levels of educational attainment can signal a mismatch between labour–market skill demands and oversupply of skilled individuals from the education system;
(v) occupational status or transition to an adequate job in relation to qualifications. It is interesting to observe whether an individual who completes a vocational programme manages the transition to employment related to the qualifications obtained;

23
(b) impact on the economy and development: human capital has long been identified as a key factor in combating unemployment and low pay and there is now also robust evidence that it is an important determinant of economic growth;
(c) impact on health and citizenship: it is interesting to investigate whether attaining a particular educational level has an impact on these factors. This includes collecting information on variables such as educational attainment, participation in elections, local communities, etc. of people with a long-standing illness;
(d) impact on productivity in enterprises: this involves the impact of VET and especially CVT. It is not easy to collect this type of information, let alone quantify it. Existing sources tend to focus on the costs to enterprises of providing vocational training for their employees. For example the CVTS collected information on the financial costs to enterprises and on the working time that employees spent on vocational training. This information can help to establish the net impact of vocational training on productivity in enterprises, but it is not enough to establish whether resulting productivity has increased or decreased in enterprises. This is because information on the turnover and profitability of enterprises prior to engaging in vocational training is not collected;
(e) sociocultural participation: it is interesting to determine whether persons participating in VET programmes or whose highest level of educational attainment is a VET qualification, take part in sociocultural activities compared to persons with other levels of educational attainment (e.g. tertiary education, compulsory education). Examples of sociocultural participation include: going to the cinema; cultural site visits; attending live sporting events; book reading; participation in political parties or trade unions; membership of professional associations and charitable organisations;
(f) retention of minimum learning competences: at the primary education level proxies for minimum learning competences could include indicators based on numeracy and literacy. However, even countries where nearly all children reach the final grade of basic education may find themselves dissatisfied with learning outcomes, compared with international standards, and/or given the country’s own judgment as to what constitutes minimum learning competences. Even where learning outcomes are satisfactory on average, the country may discover that many poor children are still not acquiring these minimum competences. Ideally the system of statistics and indicators on VET should include the retention of minimum learning competences of VET participants. This may refer to the practical skills, know-how and understanding necessary for employment in a particular occupation or trade (or class of occupations or trades). However, it would be difficult to arrive at proxies of indicators for measurement purposes, given that countries have their own view of what should be regarded as minimum learning competences about VET programmes or particular occupations.
Table 2 summarises the type of information required for each component and sub-component. This information is not exhaustive.

24
Tabl
e 2:
Ty
pe o
f inf
orm
atio
n th
at w
ould
hel
p to
bui
ld a
mor
e co
mpr
ehen
sive
pic
ture
of V
ET
Com
pone
nt o
f VE
T
Sub-
com
pone
nt
Exa
mpl
es o
f inf
orm
atio
n
Stud
ent c
hara
cter
istic
s
edu
catio
nal b
ackg
roun
d of
stud
ent’s
par
ents
o
ccup
atio
nal s
tatu
s of s
tude
nt’s
par
ents
or s
ocio
econ
omic
stat
us; s
tude
nt’s
and
par
ent’s
cou
ntry
of b
irth
nat
ive
lang
uage
of s
tude
nt a
nd p
aren
ts
obs
tacl
es to
par
ticip
atio
n (e
.g. g
eogr
aphi
c lo
catio
n, in
com
e, e
tc.)
atti
tude
s to
lear
ning
Teac
her/t
rain
er c
hara
cter
istic
s
qua
lific
atio
ns
pro
fess
iona
l dev
elop
men
t s
ocio
dem
ogra
phic
s t
each
ers s
alar
ies
Educ
atio
nal i
nstit
utio
ns c
hara
cter
istic
s
num
ber o
f ins
titut
ions
n
umbe
r of p
erso
nnel
bro
ken
dow
n by
type
(tea
cher
s, su
ppor
t sta
ff, a
ssis
tant
s, et
c., i
n he
ad c
ount
s and
full-
time
equi
vale
nts)
n
umbe
r of m
anag
emen
t per
sonn
el
num
ber o
f new
ent
rant
s by
age
and
gend
er
num
ber o
f stu
dent
s by
age
and
gend
er
ave
rage
cla
ss si
ze
Fina
ncia
l res
ourc
es d
evot
ed to
VET
e
duca
tion
expe
nditu
res b
y so
urce
of f
inan
ce (g
over
nmen
t, en
terp
rises
, ind
ivid
uals
) and
type
of t
rans
actio
n e
duca
tion
expe
nditu
res b
y re
sour
ce c
ateg
ory
(i.e.
cur
rent
and
cap
ital e
xpen
ditu
re)
Inpu
ts
Cur
ricul
a/pr
ogra
mm
e ch
arac
teris
tics
ave
rage
dur
atio
n of
pro
gram
me
in d
ays/
hour
s t
ime
spen
t in
inst
itutio
n/w
orkp
lace
n
umbe
r of p
rogr
amm
e ho
urs
Lear
ner t
ime
allo
catio
n
tim
e al
loca
ted
to V
ET in
wor
kpla
ce
tim
e al
loca
ted
to V
ET in
inst
itutio
ns
par
ticip
atio
n in
IVT,
CV
T l
evel
of a
bsen
teei
sm
Man
agem
ent
aut
horit
ies r
espo
nsib
le fo
r set
ting
prog
ram
me
obje
ctiv
es
gui
danc
e r
ole
of so
cial
par
tner
s Te
achi
ng/le
arni
ng m
etho
ds
Inst
itutio
nal/w
orkp
lace
trai
ning
Proc
esse
s
Mon
itorin
g of
teac
hers
/trai
ners
N
o qu
antit
ativ
e pr
oxy

Com
pone
nt o
f VE
T
Sub-
com
pone
nt
Exa
mpl
es o
f inf
orm
atio
n
Mon
itorin
g an
d ev
alua
tion
of le
arni
ng o
utco
mes
N
o qu
antit
ativ
e pr
oxy
Lear
ner a
ttain
men
t
num
ber o
f gra
duat
es b
y ag
e an
d ge
nder
r
atio
of c
ompl
eted
lear
ners
to e
nrol
led
lear
ners
(mea
sure
men
t of e
ffic
ienc
y)
num
ber o
f dro
p-ou
ts
sel
f-re
porte
d sk
ills
Cha
nges
in a
ttitu
des
No
quan
titat
ive
prox
y Im
prov
emen
ts in
qua
lity
No
quan
titat
ive
prox
y
Out
puts
Equi
ty e
ffec
ts
Num
ber o
f gra
duat
es b
y ag
e an
d ge
nder
; loc
atio
n, e
tc.
Impa
ct o
n st
uden
ts
ret
urns
on
VET
(thr
ough
hig
her i
ncom
e)
lab
our f
orce
stat
us
occ
upat
iona
l sta
tus o
r tra
nsiti
on to
an
adeq
uate
job
in re
latio
n to
qua
lific
atio
ns
Impa
ct o
n ec
onom
y an
d de
velo
pmen
t g
row
th
pov
erty
c
rime
Impa
ct o
n he
alth
and
citi
zens
hip
hea
lth
par
ticip
atio
n in
ele
ctio
ns, l
ocal
com
mun
ities
etc
. Im
pact
on
prod
uctiv
ity in
ent
erpr
ise
No
quan
titat
ive
prox
y So
cioc
ultu
ral p
artic
ipat
ion
Parti
cipa
tion
in c
ultu
ral a
ctiv
ities
Out
com
es
Ret
entio
n of
min
imum
lear
ning
com
pete
nces
N
o qu
antit
ativ
e pr
oxy

26
3. Current Eurostat data VET data sources
3.1. Eurostat data sources collecting LLL/VET data
A proposal for a harmonised modular system of VET statistics should not only consider Eurostat sources with VET data but also those with data on LLL (4). Moreover, some data sources that do not have VET as a primary focus could be the best vehicle for collecting certain variables compared to sources which already gather VET data. For instance, the Eurostat harmonised HBS provides information about household consumption expenditure on goods and services, including education. The CVTS and the UOE data collection on education systems collect data on VET. However, while the former restricts itself to information on the investment made by enterprises for CVT, the latter gathers information by ISCED level which effectively excludes some types of vocational training.
It is essential to establish which sources have the potential to be part of the system of harmonised VET statistics.
Eurostat classifies its data sources according to the following nine statistical domains or themes:
(a) general and regional statistics;
(b) economy and finance;
(c) population and social conditions;
(d) industry, trade and services,
(e) agriculture, forestry and fisheries;
(f) external trade;
(g) transport;
(h) environment and energy;
(i) science and technology;
Each one of these themes contains sub-themes into which each Eurostat data source is classified. For example, data sources classified in the sub-theme ‘education and training’ can be found under ‘population and social conditions’.
(4) According to the definition of LLL as adopted by the Commission and the Member States, LLL
encompasses ‘all learning activity undertaken throughout life, with the aim of improving knowledge, skills and competences with a personal, civic, social and/or employment-related perspective’ (European Commission, 2001, p. 33).

27
Some 16 Eurostat data sources have recently collected or are currently collecting data on LLL (Table 3). The data sources identified can be classified into the following three groups:
Group A: collected under the sub-theme of education and training statistics within the domain of population and social conditions;
Group B: collected in another sub-theme/statistical domain, but with attached education module(s);
Group C: collected in another statistical domain/sub-theme without a special education module.
While most data sources containing LLL information are mainly clustered in the theme ‘population and social conditions’, not all of them are found in the sub-theme ‘education and training’. Only the CVTS, and the UOE data collection on education systems can be classified under group A. Two EU LFS ad hoc modules (on LLL and on the transition from school to working life) are designed within the remit of education and training statistics but are collected under the auspices of the EU LFS. Thus, they should be classified under group B. The other data sources fall under group C.
Also, not all the data sources collecting data on LLL actually collect data on VET. Of the 16 identified sources collecting information on LLL, 10 collected, or are currently collecting, variables considered relevant to VET. Only the CVTS is solely devoted to collecting information on a particular aspect of vocational training (i.e. CVT in the enterprise). Table 3 identifies the Eurostat sources collecting information on VET.

28
Table 3: Eurostat data sources collecting information on LLL and, of those, on VET
Group Statistical domain Sub-theme Data collection VET
CVTS X A Population and
social conditions Education and training UOE data collection on education systems X
EU LFS X EU LFS ad hoc module on LLL B Population and
social conditions Labour market EU LFS ad hoc module on transition from school to working life
EU-SILC Living conditions and welfare Eurostat HETUS X EU LCS X
Labour market EU LMP database X ESSPROS X
Living conditions and welfare Eurostat harmonised HBS
Health National health interview surveys
Population and social conditions
Information society statistics Community survey of ICT usage in households X
Industry, trade and services
Industry, trade and services – horizontal view Structural business statistics (a) X
Economy and finance National accounts European system of national accounts
C
Science and technology Science and technology CIS X
(a) The structural business statistics data collection stopped covering data on VET from 2002 following a change in the methodology. Prior to 2002, it collected only one question related to VET on the number of apprentices in enterprises.
3.2. Type of information collected
Each Eurostat data source identified in Table 3 collects quantitative information on LLL, which can be classified as:
(a) non-financial, for example number of persons enrolled in education at ISCED level 5-6, number of persons participating in CVT;
(b) financial, for example public expenditure on education, educational institutions, costs to enterprises of providing vocational training to their employees.
Almost all identified data sources collect non-financial information, while half of them collect financial information. Just over a third collect both financial and non-financial data on LLL (Table 4).

29
Table 4: Type of data collected by Eurostat sources
Name of source Non-financial Financial
CVTS X X Community survey of ICT usage in households X CIS X EU LFS X EU LFS ad hoc module on transition from school to working life X EU LFS ad hoc module on LLL X Harmonised HBS X X HETUS X EU-SILC X X EU LCS X X EU LMP database X X ESSPROS X Structural business statistics X European system of national accounts X National health interview surveys X UOE data collection X X
Although the number of sources collecting information on LLL appears impressive, especially on IVT, in reality there is a great deal of repetition in some of the information collected. For example, the number of apprentices in enterprises is the only VET variable collected by the EU LCS and the structural business statistics.
Examining those data sources collecting VET information reveals that most sources collect some form of data on IVT (Table 5). Seven of these sources collect some data on CVT, the coverage of data collected by the CVTS being comprehensive with respect to the training effort of enterprises.
Table 5: Type of VET collected by Eurostat sources
Name of source IVT CVT Training for unemployment
CVTS (a) x x Community survey of ICT usage in households x x CIS x EU LFS x x x EU LFS ad hoc module on LLL x EU LCS x x EU LMP database x x x ESSPROS x Structural business statistics x UOE data collection x x
(a) The latest CVTS3 collection includes data on IVT, though this was not included in CVTS1 and CVTS2.

30
One Eurostat data source that has not been mentioned in the list of sources collecting information on LLL (Table 3) is the suspended Eurostat data collection on VET. The Eurostat VET data collection was a standardised collection of VET programmes in the EU. The exercise was initially designed to respond to policy requests (in particular to seek alternatives to academic routes), as a tool for policy-makers to help them to design, monitor and evaluate national training policies. Data obtained from the Eurostat VET collection differed from the UOE data in that the former covers multiple forms of vocational training (at school, in training centres, in enterprises, long-distance learning), whereas the latter collects information on solely school-based and combined school- and work-based programmes, but excludes training of employees by their employers. Further, the questionnaire contained information, which allowed each programme to be described under several headings: target population, status of participants, place of apprenticeship, duration, bodies in charge of defining the programme’s objectives, financing of the programme, etc. The CVTS was seen as a complement to the VET data collection. To highlight information deficits caused by the suspension of the VET data collection, Annex 1 reconciles the information collected by the VET data collection with information currently collected by the UOE data collection.

31
3.3. Status of VET variables within the data source
The status of the LLL/VET variables collected by each data source was examined in relation to two main characteristics. First is its status within the data source: each variable was assessed in relation to the objectives of the source and the questionnaire to determine the importance of the variable. Each variable was ranked according to the following scale.
Rank Explanation
1 It is core to the source, that is, the collection of these variables are the main aim 2 It is important as it forms part of the objectives 3 It is less important 4 It is only intended to provide background information 5 It is not important
Table 6 summarises the ranking of variables in each data source according to the above scale. It can be concluded that for data sources where the objectives are not associated with the collection of information on education and training, the status of LLL/VET variables is not of primary importance. However, there are a few exceptions in cases where the LLL/VET variables actually measure the objectives of the source. For example, the Eurostat harmonised HBS, and the Eurostat HETUS collect data on household expenditure on education and time spent on study. The Eurostat harmonised HBS aims to collect information on household consumption expenditures on goods and services such as education, while the HETUS aims to collect information on time spent on numerous activities such as education.
Table 6: Summary of ranking of LLL/VET variables in each Eurostat source
Data source 1 2 3 4 5 Total
CVTS2 17 – – – – 17 Community survey of ICT usage in households 04 3 – 1 – 08 CIS – – – – 1 01 EU LFS 01 – – 8 – 09 EU LFS ad hoc module on transition from school to working life 02 – – – – 02
EU LFS ad hoc module on LLL 10 – – – – 10 Eurostat harmonised HBS 01 – – 1 – 02 Eurostat HETUS 01 – – 4 – 05 EU-SILC 02 – – 6 2 10 EU LCS – 3 – 3 – 06 EU LMP database 03 – 8 2 – 13 ESSPROS 02 – – – – 02 Structural business statistics 1 – – 01 European system of national accounts 21 – – – – 21 UOE data collection 25 – – – – 25

32
The second characteristic is the link to other variables of the data source. The link of LLL/VET variables to the other variables in their respective data source can be classified as follows:
Type I: the variables (non-financial, financial or background data) interact with one another to form a complete picture of a particular type of education;
Type II: the variables aim to provide background information on the individual, household, enterprise, etc. which can be cross-referenced with the other variables in the collection to enable in-depth analysis of individuals, enterprises, etc.;
Type III: the variables interact with one another to form a complete picture of a particular aspect such as the economy, household consumption patterns, etc.
Table 7 classifies Eurostat data sources collecting LLL variables according to how all the variables in the data source interact.
Table 7: Classification of data sources based on overall interaction of all variables in each source
Data source Type I Type II Type III
CVTS X Community survey of ICT usage in households X CIS X EU LFS X EU LFS ad hoc module on transition from school to working life X EU LFS ad hoc module on LLL X Eurostat harmonised HBS X Eurostat HETUS X EU-SILC X EU LCS X EU LMP database X ESSPROS X Structural business statistics X European system of national accounts X UOE data collection X
3.4. Complementarity and exclusiveness of data sources
Data sources are mutually exclusive if the information contained in one is not collected by any other. Mutually exclusive variables, on the other hand, measure the same subject, but from different perspectives or with different concepts and definitions. A more comprehensive picture of VET/LLL might be obtained by presenting data from several data sources, so long as they are complementary rather than contradictory.

33
To determine whether the data sources are mutually exclusive, complementary or contradictory, each variable identified was classified as:
Type I: repeated in more than one source;
Type II: unique to that source.
3.4.1. Exclusiveness of data sources
Just over one quarter of the variables examined are type I. This may suggest that each source will produce the same data for a particular variable but several good examples illustrate that this is not the case. Differences in data collected for what appears to be the same variable can be attributed to several methodological factors:
(a) objectives of the source: the objectives of Eurostat sources differ considerably between sources, from collecting information (quantitative and/or qualitative) on education and training to collecting information on the labour market, the economy, consumption behaviour and use of ICT in households, etc. The objectives affect the type of information needed, which translates into differences in the data collected. For example, the EU LMP database collects data only on public interventions in the labour market so the data collected on the labour-market training only refers to those programmes financed by public bodies;
(b) statistical units and population: even though some Eurostat sources examined may measure the same subject, they are still exclusive, as data is collected from different statistical units and populations. This was the case for those examined, where considerable variation in the statistical units and populations existed. Statistical units vary between individuals, households and enterprises, while the statistical population varies between households, individuals and enterprises (as classified in certain economic activities). The statistical units and population are discussed in further detail in Section 4.2;
(c) concepts and definitions applied: every effort is made to ensure that the same concepts and definitions are used within the European statistical system. However, differences between sources are common, especially in relation to the concepts and definitions applied. It has been observed that there is a great deal of heterogeneity in the concepts and definitions applied to education and training, indicating a degree of exclusivity of the data collected in the source (Table 8). The lack of homogeneity in concepts and definitions may be because there are no agreed definitions set down in a Commission regulation. This can be particularly problematic when considering a harmonised modular system of VET statistics.

34
Tabl
e 8:
D
efin
ition
s of v
ario
us ty
pes o
f VET
use
d in
Eur
osta
t sou
rces
and
at C
edef
op
Typ
e of
VE
T
Sour
ce
Def
initi
on
CV
TS
CV
T is
a tr
aini
ng m
easu
re, o
r act
ivity
, hav
ing
as it
s prim
ary
obje
ctiv
e th
e ac
quis
ition
of n
ew c
ompe
tenc
es o
r the
dev
elop
men
t an
d im
prov
emen
t of e
xist
ing
ones
. CV
T is
fina
nced
, at l
east
par
tly, b
y en
terp
rises
eith
er fo
r tho
se h
avin
g a
wor
k co
ntra
ct o
r be
nefit
ing
dire
ctly
from
thei
r wor
k fo
r the
ent
erpr
ise,
such
as u
npai
d fa
mily
wor
kers
and
cas
ual w
orke
rs. T
he e
mpl
oyed
with
ap
pren
tices
hip
or tr
aini
ng c
ontra
ct m
ay n
ot b
e co
nsid
ered
. The
trai
ning
mea
sure
s or a
ctiv
ities
shou
ld b
e pl
anne
d an
d sh
ould
be
orga
nise
d or
supp
orte
d w
ith th
e sp
ecia
l goa
l of l
earn
ing.
Ran
dom
lear
ning
and
IVT
are
expl
icitl
y ex
clud
ed.
LCS
Voc
atio
nal t
rain
ing
cost
s pai
d by
an
empl
oyer
incl
udin
g:
exp
endi
ture
on
voca
tiona
l-tra
inin
g se
rvic
es a
nd fa
cilit
ies (
also
thos
e fo
r app
rent
ices
, but
not
thei
r wag
es a
nd sa
larie
s),
sm
all r
epai
rs a
nd m
aint
enan
ce o
f bui
ldin
gs a
nd in
stal
latio
ns, e
xclu
ding
staf
f cos
ts;
exp
endi
ture
on
parti
cipa
tion
in c
ours
es;
the
fees
of i
nstru
ctor
s fro
m o
utsi
de th
e en
terp
rise;
e
xpen
ditu
re o
n te
achi
ng a
ids a
nd to
ols u
sed
for t
rain
ing;
s
ums p
aid
by th
e en
terp
rise
to v
ocat
iona
l-tra
inin
g or
gani
satio
ns, e
tc.
Subs
idie
s lin
ked
to v
ocat
iona
l tra
inin
g sh
ould
be
dedu
cted
.
CV
T
Ced
efop
Ed
ucat
ion
and
train
ing
afte
r ini
tial e
duca
tion
or e
ntry
into
wor
king
life
aim
ed a
t hel
ping
indi
vidu
als t
o im
prov
e or
upd
ate
thei
r kn
owle
dge
and/
or sk
ills,
acqu
ire n
ew sk
ills f
or a
car
eer m
ove
or re
train
ing,
or c
ontin
ue th
eir p
erso
nal o
r pro
fess
iona
l de
velo
pmen
t.
EU L
MP
data
base
M
easu
res w
here
mos
t of t
he tr
aini
ng ti
me
(75
% o
r mor
e) is
spen
t in
a tra
inin
g in
stitu
tion
(sch
ool/c
olle
ge, t
rain
ing
cent
re o
r si
mila
r).
Inst
itutio
nal
train
ing
Euro
stat
VET
dat
a co
llect
ion
(dis
cont
inue
d)
in
an e
duca
tion/
train
ing
inst
itutio
n: 9
0 %
or m
ore
of th
e tra
inin
g ho
urs s
pent
in a
scho
ol/c
olle
ge, a
trai
ning
cen
tre, o
r co
mbi
natio
n of
bot
h pl
aces
. m
ainl
y in
an
educ
atio
n/tra
inin
g in
stitu
tion
with
som
e tim
e sp
ent a
t the
wor
kpla
ce: 7
5 %
or m
ore
and
less
than
90
% o
f the
tra
inin
g ho
urs s
pent
in a
scho
ol/c
olle
ge o
r tra
inin
g ce
ntre
, and
the
rest
of t
he ti
me
spen
t in
a w
orki
ng e
nviro
nmen
t (e
nter
pris
e or
oth
er).
EU L
MP
data
base
m
easu
res w
here
mos
t of t
he tr
aini
ng ti
me
(75
% o
r mor
e) is
spen
t in
the
wor
kpla
ce;
ent
irely
wor
k-ba
sed
mea
sure
s, w
here
ther
e is
no
iden
tifia
ble
elem
ent o
f for
mal
ised
trai
ning
are
con
side
red
as le
arni
ng-b
y-do
ing
or le
arni
ng-b
y-ex
perie
nce
and
shou
ld b
e co
nsid
ered
as t
empo
rary
recr
uitm
ent i
ncen
tives
. W
orkp
lace
tra
inin
g Eu
rost
at V
ET d
ata
colle
ctio
n (d
isco
ntin
ued)
mai
nly
at th
e w
orkp
lace
with
som
e tim
e sp
ent i
n an
edu
catio
n/tra
inin
g in
stitu
tion:
75
% o
r mor
e an
d le
ss th
an 9
0 %
of t
he
train
ing
hour
s spe
nt in
a w
orki
ng e
nviro
nmen
t (en
terp
rise
or o
ther
), th
e re
st o
f the
tim
e sp
ent i
n sc
hool
/col
lege
or a
trai
ning
ce
ntre
; i
n th
e w
orkp
lace
: les
s tha
n 10
% o
f lea
rnin
g tim
e in
an
educ
atio
n/tra
inin
g in
stitu
tion.

Typ
e of
VE
T
Sour
ce
Def
initi
on
EU L
MP
data
base
M
easu
res w
here
the
train
ing
time
is e
venl
y sp
lit b
etw
een
a tra
inin
g in
stitu
tion
and
the
wor
kpla
ce.
Euro
stat
VET
dat
a co
llect
ion
(dis
cont
inue
d)
Tim
e sh
ared
bet
wee
n an
edu
catio
n/tra
inin
g in
stitu
tion
and
the
wor
kpla
ce: l
ess t
han
75 %
of t
he tr
aini
ng ti
me
is sp
ent i
n a
scho
ol/c
olle
ge o
r tra
inin
g ce
ntre
, the
rest
of t
he ti
me
spen
t in
a w
orki
ng e
nviro
nmen
t or v
ice
vers
a.
Alte
rnan
ce
train
ing
Ced
efop
Ed
ucat
ion,
or t
rain
ing,
alte
rnat
ing
perio
ds in
a sc
hool
, or t
rain
ing
cent
re, a
nd in
the
wor
kpla
ce. T
he a
ltern
ance
sche
me
can
take
pl
ace
on a
wee
kly,
mon
thly
or y
early
bas
is d
epen
ding
on
the
coun
try. P
artic
ipan
ts a
re n
ot c
ontra
ctua
lly li
nked
to th
e em
ploy
er
whe
re th
ey d
o th
eir t
rain
ing,
nor
do
they
gen
eral
ly re
ceiv
e re
mun
erat
ion
(unl
ike
appr
entic
es).
CV
TS
In th
e C
VTS
2 m
etho
dolo
gy a
ppre
ntic
es a
nd tr
aine
es a
re d
efin
ed a
s tho
se e
mpl
oyee
s who
hav
e a
spec
ial t
rain
ing
cont
ract
. In
the
late
st C
VTS
3 m
etho
dolo
gy, a
ppre
ntic
eshi
p is
def
ined
in te
rms o
f IV
T. IV
T is
a w
ork-
base
d tra
inin
g m
easu
re o
r act
ivity
fo
r app
rent
ices
/trai
nees
lead
ing
to a
form
al q
ualif
icat
ion.
The
mea
sure
s are
ofte
n fin
ance
d (p
artly
or w
holly
) by
the
ente
rpris
e,
alth
ough
this
is n
ot a
man
dato
ry c
ondi
tion.
App
rent
ices
/trai
nees
ofte
n ha
ve a
spec
ial t
rain
ing
cont
ract
.
EU L
MP
data
base
A
form
of a
ltern
ate
train
ing
whe
re th
e pa
rtici
pant
s rec
eive
a sa
lary
/rem
uner
atio
n fo
r par
ticip
atio
n, a
re li
nked
to th
e em
ploy
er
by a
con
tract
(or a
n ag
reem
ent),
and
rece
ive
a re
cogn
ised
dip
lom
a on
com
plet
ion.
Eu
rost
at V
ET d
ata
colle
ctio
n (d
isco
ntin
ued)
A
ltern
ate
prog
ram
mes
, the
par
ticip
ants
of w
hich
rece
ive
a sa
lary
/wag
e fo
r the
ir pa
rtici
patio
n in
the
prog
ram
me
and
are
linke
d (e
ither
dire
ctly
or v
ia th
eir e
duca
tion/
train
ing
inst
itutio
n) to
the
empl
oyer
by
a co
ntra
ct o
r an
agre
emen
t.
Stru
ctur
al b
usin
ess
stat
istic
s
Incl
uded
in th
is v
aria
ble
are
all e
mpl
oyee
s who
do
not p
artic
ipat
e fu
lly in
the
prod
uctio
n pr
oces
s of t
he u
nit b
ecau
se th
ey a
re
wor
king
und
er a
n ap
pren
tice
cont
ract
or b
ecau
se th
ey a
re u
nder
taki
ng v
ocat
iona
l tra
inin
g im
ping
ing
sign
ifica
ntly
on
thei
r pr
oduc
tivity
.
EU L
CS
Cov
ers a
ll em
ploy
ees,
full-
time
or p
art-t
ime,
who
do
not y
et fu
lly p
artic
ipat
e in
the
prod
uctio
n pr
oces
s and
who
wor
k ei
ther
un
der a
n ap
pren
tices
hip
cont
ract
or i
n a
situ
atio
n in
whi
ch v
ocat
iona
l tra
inin
g pr
edom
inat
es o
ver p
rodu
ctiv
ity. T
he n
umbe
r of
appr
entic
es is
the
aver
age
mon
thly
num
ber e
mpl
oyed
in th
e re
porti
ng u
nit d
urin
g th
e re
fere
nce
year
.
App
rent
ices
hip
Ced
efop
Sy
stem
atic
, lon
g-te
rm tr
aini
ng a
ltern
atin
g pe
riods
in a
scho
ol o
r tra
inin
g ce
ntre
and
at t
he w
orkp
lace
; the
app
rent
ice
is
cont
ract
ually
link
ed to
the
empl
oyer
and
rece
ives
rem
uner
atio
n (w
age
or a
llow
ance
). Th
e em
ploy
er a
ssum
es re
spon
sibi
lity
for
prov
idin
g th
e tra
inee
with
trai
ning
lead
ing
to a
spec
ific
occu
patio
n.

36
(d) classifications used: as with concepts and definitions, every effort is made by Eurostat to ensure that the same classifications are used in all its sources. One classification common to several investigated sources was NACE, the statistical classification of economic activities in the European Community. An example of where classification may affect the comparability of vocational training data is in the area of costs. Both the LCS and the CVTS collect data on costs of vocational training. But, in addition to differences in definitions and reference year (5), which could give rise to different data for the same variable, the data sources also cover different NACE sections. Yet, examining the data by the coverage of NACE itself does not indicate that the data sources are necessarily contradictory;
(e) type of data source: it is important to reflect that differences in the type of data source will lead to differences in results obtained and any subsequent interpretations that can be made. For example, we can expect that the results of data collected from administrative sources will be different from those collected using surveys.
In considering the exclusivity of Eurostat variables, it is important to consider the above five factors. To a certain extent, all the Eurostat data sources can be considered exclusive. The only exceptions are the two LFS ad hoc modules (transition from school to working life, and the one on LLL), which piggy-back onto the core questions in the LFS.
3.4.2. Complementarity of Eurostat data sources
Table 5 showed a rather simplified view of the type of VET data collected by Eurostat sources, in terms of whether a source collects information on IVT, CVT and training for the unemployed. While it may seem that there is considerable repetition of data collected on VET, this is not the case for all data sources. Examining data sources for complementarity involves looking at the methodologies in more depth. It is essential to establish whether a source collects data on a particular aspect of VET not collected elsewhere. Table 9 lists the sources considered as collecting information not collected elsewhere.
(5) Starting with CVTS3 (2005), the survey will be conducted every five years, the LCS every four years
(1996, 2000, 2004). This means that the surveys were not conducted in the same period.

37
Table 9: Eurostat sources collecting complementary information on VET
Data source Information collected
CVTS Training provided by employers for their employees Community survey of ICT usage in households
Obtaining Internet-related skills through vocational training courses at the demand of the employer
CIS Enterprises engaging in internal or external training of personnel directly aimed at developing and/or introducing innovations
EU LFS Prevocational and vocational education undertaken in the previous four weeks
EU LCS Apprentices in enterprises EU LMP database Public interventions related to training
UOE data collection (UOE) Solely school-based vocational and technical training and combined school and work-based programmes. One of the attributes setting the UOE data collection apart from other sources is that it collects data by ISCED level
It can be argued that other sources such as the LCS or structural business statistics collect several of the variables collected by the CVTS. However, the CVTS collects a wealth of other information, which can be cross-referenced against other variables. This differentiates it from the LCS or structural business statistics.
3.5. Overview of statistics and indicators on VET/LLL
Eurostat statistics and indicators are made available to the general public mainly through its website (6). The database provides free direct access to the latest and most complete statistics on the European Union (EU), the Member States, the Euro-zone and other countries, collected from the numerous data collections. The data are arranged by statistical theme. The information available on the website includes:
(a) online database;
(b) publications (either hard copy or electronic version).
Given the extensive nature of some of Eurostat collections with regard to variables, it is not possible to disseminate all the information collected. This is particularly the case with micro surveys such as the LCS, LFS and ECHP/EU-SILC (7). Only the main statistics and indicators about each theme are normally disseminated. To acquire the full data set, a special request has to be made directly to Eurostat.
Eurostat publishes many indicators on its online database, though not all of them can be
(6) http://www.ec.europa.eu/eurostat [cited 18.4.2008]. (7) The total duration of the European community household panel survey (ECHP) was eight years, running
from 1994 to 2001. It was replaced by European Union statistics on income and living conditions (EU-SILC) launched in 2004.

38
considered key indicators monitoring policies. On the Eurostat website, data is provided in two general ways: within predefined tables or as detailed tables. The parameters in the former are already set but with the latter, users can build their own tables using a range of available variables.
Eurostat gathers and publishes data on the following types of key indicators on EU policy (published as predefined tables):
(a) structural indicators: these aim to assess the progress of the EU towards the goal set in the Lisbon European Council ‘to become the most competitive and dynamic knowledge-based economy in the world capable of sustainable economic growth with more and better jobs and greater social cohesion’ (Council of EU, 2000, p. 2). The Council acknowledged the need for regular discussion and assessment of the progress made in achieving this goal on the basis of commonly agreed structural indicators;
(b) Euro indicators: these are exclusively dedicated to infra-annual economic statistics such as consumer prices, national accounts, balance of payments, external trade, industry, energy, commerce and services, and the labour market, as well as a selection of monetary and financial indicators of the European Central Bank and business and consumer survey results from the European Commission’s Directorate-General for Economic and Financial Affairs;
(c) long-term indicators: a complete section is devoted to education and LLL under the population and social conditions theme (Box 1).
(d) sustainable development indicators: the EU sustainable development strategy, adopted by the European Council in Gothenburg in June 2001, and renewed in June 2006, aimed to reconcile economic development, social cohesion and protection of the environment. Monitoring progress towards this overarching goal is an essential part of the strategy. The indicators aim to monitor, assess and review the EU’s sustainable development strategy. A parallel objective is to inform the general public about progress in attaining the commonly agreed objectives of sustainable development.
Box 1 shows the education-related indicators for each of the above four types of indicators.
Certain education-related indicators are used to measure EU policy in more than one of the four types of indicators. This is particularly the case with the indicators on LLL and early school leavers. These indicators are classified as structural, long-term and sustainable development indicators.

39
Structural indicators employment – lifelong learning (adult participation in education and training) – total/females/males
innovation and research – science and technology graduates – total/females/males – youth education attainment level – total/females/males
social cohesion – early school leavers – total/females/males
Euro indicators Harmonised index of consumer prices – education – index (2005=100) Long-term indicators regions and cities – urban audit
training and education indicators: students in higher education (ISCED 97 levels 5-6) per 1 000 population population and social conditions – education and lifelong learning
level of education youth education attainment level – total/females/males early school leavers – total/females/males unemployment rates of the population aged 25-64 by level of education total population having completed at least upper secondary education
– school enrolment pupils and students school expectancy four-year-olds in education pupils in upper secondary education enrolled in vocational stream 18-year-olds in education median age pupil/teacher ratio in primary education
– students students share of women among tertiary students mobility of students in Europe
– foreign languages foreign languages learned per pupil pupils learning English/French/German
– expenditure spending on human resources annual expenditure on public and private educational institutions per pupil/student private expenditure on education as % of GDP annual expenditure on public and private educational institutions compared to GDP per capita total public expenditure on education
– lifelong learning lifelong learning (adult participation in education and training) – total/females/males
– information society individuals’ level of computer skills – low/medium/high
– living conditions and welfare consumption expenditure of private households on education education
science and technology – human resources
doctorate students in science and technology – total/females/males individuals’ level of computer skills – low/medium/high
Sustainable development indicators competitiveness – lifelong learning
employment – total unemployment rate, by highest level of education
other aspects of social exclusion – early school-leavers – persons with low educational attainment, by age group
Source: Eurostat. Available from Internet: http://epp.eurostat.ec.europa.eu/ [cited 21.4.2008]
Box 1: Key education-related indicators on EU policy

40
At the time of writing, there is not a single indicator within the predefined tables section of the Eurostat website which is exclusively devoted to VET. Within the detailed tables section of the Eurostat website, several further groups of indicators are presented, including on ‘thematic indicators’ (8). These help monitor progress towards the Lisbon objectives in education and training (9). ‘Education and training 2010’ integrates all actions in education and training at European level, including VET (the Copenhagen process). Further, the Bologna process, initiated in 1999, is crucial to developing the European higher education area. Both contribute actively to achieving the Lisbon objectives and are, therefore, closely linked to the education and training 2010 work programme. The indicators are divided into six main tables. Table 10 presents a list of indicators used to monitor the education and training 2010 work programme by Eurostat table.
Apart from the structural, Euro, long-term and sustainable development indicators, Eurostat also disseminates on its website other LLL/VET related indicators and statistics. These indicators and statistics are presented under the form ‘detailed tables’. Eurostat’s data navigation tree allows users to select and download different variables and indicators within larger tables. Downloads can be made in various formats.
Annex 3 contains a detailed list of all the indicators published by Eurostat broadly relating to VET and LLL.
(8) Thematic indicators can be found under ‘education and training’ within the ‘population and social
conditions’ section. (9) Education and training 2010 diverse systems, shared goals – the education and training contribution to the
Lisbon strategy. Available from Internet: http://ec.europa.eu/education/policies/2010/et_2010_en.html [cited 14.4.2008].

41
Table 10: Thematic statistics and indicators to monitor progress towards the Lisbon objectives in education and training
Table Statistics/indicators
Teachers and trainers; age distributions, pupils to teachers ratio
teachers and trainers in ISCED 1 or ISCED 2-3 by age ratio of students to teachers in ISCED 1-3 combined, or separately in ISCED 1,
ISCED 2 and ISCED 3
Mathematics, science and technology enrolments and graduates
enrolments by gender as a percentage of total enrolments graduates (ISCED 5-6) by gender as a percentage of all fields graduates (ISCED 5-6) by gender per 1000 population aged 20-29 thousands of graduates (ISCED 5-6) by gender
Investments in education and training
total public expenditure on education as a percentage of GDP, for all levels of education combined
expenditure on educational institutions from private sources as % of GDP, for all levels of education combined
annual expenditure on public and private educational institutions per pupil in Euro purchasing power standard, broken down by primary (ISCED 1), secondary (ISCED 2-4), and tertiary level of education (ISCED 5-6) based on full-time equivalents
annual expenditure on public and private educational institutions per pupil compared to GDP per capita, broken down by primary (ISCED 1), secondary (ISCED 2-4), and tertiary level of education (ISCED 5-6), based on full-time equivalents
Participation rates in education by age and gender
Students (ISCED 1-6) by gender aged 15-24 years, as % of corresponding age population
Foreign language learning
average number of foreign languages learned per pupil (ISCED 2 or 3) percentage of pupils at ISCED 2 and 3 (general/pre-vocational) learning zero, one,
two, three or more foreign languages
Student mobility
students (ISCED 5-6) studying in EU-27/EEA/candidate countries as % of all students
inflow of ISCED 5-6 students from EU-27/EEA/candidate countries as % of all students

42
4. Methodological aspects of Eurostat sources
4.1. Objectives of Eurostat sources
Each of the statistical domains collecting information on LLL has particular objectives for the type of data collected (Table 11). Therefore, any proposals for a harmonised modular system of VET statistics must consider the limitations of each data source. Four of the 16 Eurostat sources evaluated have objectives firmly underpinned in collecting information (quantitative and/or qualitative) on education and training:
(a) CVTS;
(b) EU LFS ad hoc module on transition from school to working life;
(c) EU LFS ad hoc module on LLL;
(d) UOE data collection on education systems.
The focus of the other sources covers aspects such as collecting information on the labour market, the economy, consumption behaviour and ICT usage by households. There are limitations on the type of modular system that can be proposed given the different objectives of each of these data collections. Proposing to collect data on certain aspects of VET in one data source may be at odds with the objectives of the source. For instance, the Eurostat harmonised HBS collects data on household consumption expenditures on goods and services.
Table 11: Objectives of Eurostat sources
Data collection Objectives
CVTS2 To obtain quantitative and qualitative information about the vocational training provided by enterprises for their employees
Community survey of ICT usage in households
To provide statistics on individuals, households and the information society. It covers the availability of computers and the Internet in households, devices and communication systems used, type of connection to the Internet, use of the computer and Internet, frequency and place of use (breakdowns by age group, gender, education level, employment situation and region)
CIS
Provides information on the characteristics of innovation activity at enterprise level. It allows the monitoring of Europe’s progress in innovation, creating a better understanding of the innovation process and analysing the effects of innovation on the economy (about competitiveness, employment, economic growth, trade patterns, etc.)
EU LFS
It is the main source of information about the situation and trends in the EU labour market. It provides data on employment, unemployment and inactivity together with breakdowns by age, gender, educational attainment, temporary employment, full-time/part-time distinction and many other dimensions. In 1999 the ad hoc modules became an inherent part of the EU LFS
EU LFS ad hoc module on transition from school to working life
To collect information on persons aged 15-35 years who left continuous education within the past 5 or 10 years (i.e. between 1990-95 and 2000), and their subsequent transition to working life

43
EU LFS ad hoc module on LLL
To collect information on the participation of the population aged 25-64 years in, and the volume of, LLL
Eurostat harmonised HBS
Essentially, to provide information about household consumption expenditures on goods and services, with considerable detail in the categories used; information on income, possession of consumer durable goods and cars; basic information on housing and many demographic and socioeconomic characteristics. Historically, the prime objective in all the Member States was to collect information on household consumption expenditures for use in updating the ‘weights’ for the basket of goods used in the consumer price index
Eurostat HETUS To provide statistics on the division of gainful and domestic work between women and men, and on their participation in education, cultural activities and other spheres of life (voluntary work, care, mobility, leisure time, etc.)
EU-SILC
To cover cross-sectional data on income, poverty, social exclusion and other living conditions as well as longitudinal data (pertaining to individual-level changes over time, observed periodically over a certain duration) restricted to income, labour and a limited number of non-monetary indicators of social exclusion
EU LCS
They constitute a hierarchical system of multi-annual, yearly and quarterly statistics, designed to provide a comprehensive and detailed picture of the level, structure and short-term development of labour costs in the different sectors. Structural information on labour costs is collected through four-yearly LCS covering detailed structural labour costs data, hours worked and hours paid (LCS collection)
EU LMP database
To collect detailed information on public interventions in the labour market. Public interventions refer to actions taken by general government involving expenditure, either in the form of actual disbursements or of foregone revenue (reductions in taxes, social contributions or other charges normally payable)
ESSPROS
To provide a comprehensive, realistic and coherent description of social protection in the Member States covering social benefits to households and their financing. Social benefits are transfers to households, in cash or in kind, intended to relieve them from the financial burden of several risks or needs
Structural business statistics
To describe the economy through the observation of the activity of units engaged in an economic activity. They answer such questions as: how much wealth is created in an activity? How large a workforce is needed to create this wealth? How is this activity developing? Is this activity participating in the growth of the economy? How many investments are realised in this activity?
National health interview surveys To describe the health status and the health-related behaviours of the population.
European system of national accounts
To evaluate the structure of a total economy; specific parts or aspects of a total economy; development of a total economy over time; total economy in relation to other total economies
UOE data collection on education systems
To provide internationally comparable data on key aspects of education systems, specifically on the participation and completion of education programmes, as well as the cost and type of resources dedicated to education

44
4.2. Other methodological aspects
A number of points can be made about key aspects of statistical methodologies and questionnaires used in Eurostat LLL information collection. Close examination of the statistical units (10) of the Eurostat sources containing LLL/VET variables revealed that there is considerable variation between sources, from individuals to households and enterprises. The base populations (11) also vary between sources. In fact, the population also varies from households to individuals and enterprises classified in certain economic activities (Table 12).
Table 12: Statistical units and target population of Eurostat sources
Name of survey Statistical units Statistical population
CVTS2 Enterprises
Enterprises with 10 or more employees belonging to NACE Rev. 1.1 sections C to K and O. Optionally separate strata with enterprises of size 5-9 belonging to these NACE sections may be included.
Community survey of ICT usage in households Households and individuals
All households having at least one member in the age group 16 to 74 years; individuals aged 16-74 years.
CIS Enterprises
Enterprises with 10 or more employees belonging to NACE Rev. 1.1 sections C, D E, G (51), I, J, K (72, 74.2, 74.3). Countries could also include enterprises with less than 10 employees, if they were treated separately.
EU LFS Individuals; in data referring to household characteristics the units are private households
All persons in private households aged 15 years or older
EU LFS ad hoc module on LLL Individuals The population in private households
aged 25-64 years.
EU LFS ad hoc module on youth transition from education to working life
Individuals
Persons aged 15 to 35 years who have left continuous education within the past 5 or 10 years (i.e. between 1990-95 and 2000)
Eurostat harmonised HBS
Address/dwelling/private household/individual
Individuals residing in private households
(10) The statistical unit is the base type of the elements of a group (also called population) that we want to
observe or analyse. The basic statistical operations of classification, aggregation and ordering are done on the statistical unit. The choice of the statistical unit is a matter of both the data collection process (namely the operational restrictions associated with collecting data from each type of statistical unit) and the conceptual framework chosen to observe and analyse the phenomenon. The statistical unit is the bearer of statistical characteristics or attributes, which we ultimately want to measure.
(11) A population is a collection of objects of the same class, which in statistical terms means a group of elements of the same statistical unit.

45
Eurostat HETUS Private households and household members
Persons aged 10 (or 15) or more years in private households
EU-SILC Individuals. Data is compiled at household level and made equivalent
Individuals living in private households
EU LCS
The statistical units are local units and enterprises as defined in Council Regulation (EEC) No 696/93 of 15 March 1993
Enterprises with 10 or more employees in NACE Rev. 1.1 sections C to K, in 2004 C to O (excluding L)
EU LMP database Labour market intervention (services, measures, and supports)
The public resources devoted to labour market measures
ESSPROS Social protection scheme
All interventions from public or private bodies intended to relieve households and individuals of the burden of a defined set of risks or needs, provided that there is neither a simultaneous reciprocal nor an individual arrangement involved
Structural business statistics Enterprises and local units Enterprises/local units in NACE
Rev. 1.1 sections C to K
National health interview surveys Individuals and households
Persons aged 15 or more and households. For some countries there is an upper age limit
European system of national accounts (ESA95)
The elementary building block of ESA95 statistics is the institutional unit (ESA95, 2.12.), ‘an elementary economic decision-making centre characterised by uniformity of behaviour and decision-making autonomy in the exercise of its principal function’.
The economy (or large sub-sectors) as a whole
UOE data collection The basic unit is the educational programme as defined in the ISCED 97
All of a country’s domestic educational activity (i.e. within its own territory) in the ordinary school and university system, as defined in the ISCED 97.
Statistical information is most useful (and sometimes, only meaningful) when provided with a good level of timeliness. A data source should ideally take a minimum amount of time to produce the required information; make it possible to release the information as soon as it is available; and provide information on a regular basis. In assessing the quality of the source, it is important to evaluate the timeliness of the data produced. This study found overall that VET data timeliness varies between Eurostat data sources from nine months after the reference year (Community survey of ICT usage in households) to more than two years (UOE data collection statistical exercise).

46
Table 13: Timeliness of Eurostat sources
Data collection Timeliness
CVTS2 According to the CVTS2 methodology, from the start of the survey in the beginning of 2000 to the transmission of complete and correct data to Eurostat (March 2001), the collection should have taken approximately 15 months
Community survey of ICT usage in households
Data are generally delivered to Eurostat in the fourth quarter of the reference year
CIS The CIS2 data were released in the first quarter of 1999. The CIS3 data were disseminated in August 2003. The CIS4 data were disseminated in October 2006
EU LFS
Monthly data on seasonally adjusted unemployment rates are published approximately 34 days after the end of the month. The quarterly series are updated at approximately 120 days after the end of reference quarter. Annual averages are published along with quarter four
EU LFS ad hoc module on transition from school to working life
One-off survey
EU LFS ad hoc module on LLL One-off survey
Eurostat harmonised HBS
Between one and four years after the end of the reference period depending on the country
Eurostat HETUS Harmonisation of results of 10 Member States was undertaken in 2004. It did not relate to a specific year
EU-SILC
Results from EU-SILC should be supplied by participant countries to Eurostat within 12 months of the end of the survey year: annual data for year N will be available in December of year N+1. Annual data for 2005 for EU-25 and 3 EFTA countries from EU-SILC was finalised in May 2007
EU LCS Countries are obliged to transmit complete and consistent data from the LCS within 18 months of the end of the reference period. On average, it takes another four to six months to prepare the data for general distribution
EU LMP database Between approximately 15 and 20 months after the end of reference year ESSPROS About 22 months after the end of the year to which the data relate
Structural business statistics
Final data should be sent to Eurostat 18 months after the end of the reference period. Preliminary data should be sent to Eurostat 10 months after the end of the reference period. Preliminary data are normally released at T+12 and most definitive data at T+22. European aggregates (final data only) may be released with an additional time-lag. While calculating EU totals, estimates for missing country characteristics may be needed
National health interview surveys
The national surveys are not all performed in the same period and results are not all available at the same time
European system of national accounts
Eurostat releases the annual European growth rates after 45 days (i.e. mid-February of the following year). A more complete set of variables is released after 65 days (i.e. mid-March of the following year). Some breakdowns, notably by 31 industry activities, detailed exports/imports and household final consumption by the classification of individual consumption by purpose (COICOP, 3 digit level) are released later, in October/November. Fixed assets broken down by industry and product type are released after 24 months. In case of missing country data, Eurostat may use internal figures (based on unpublished estimates) to produce European aggregates
UOE data collection Participation, entrants, personnel, language learning: two years after end of the reference period. Graduates: 1.5 years after end of the reference period. Finance data: 2.5 years after end of the reference period.
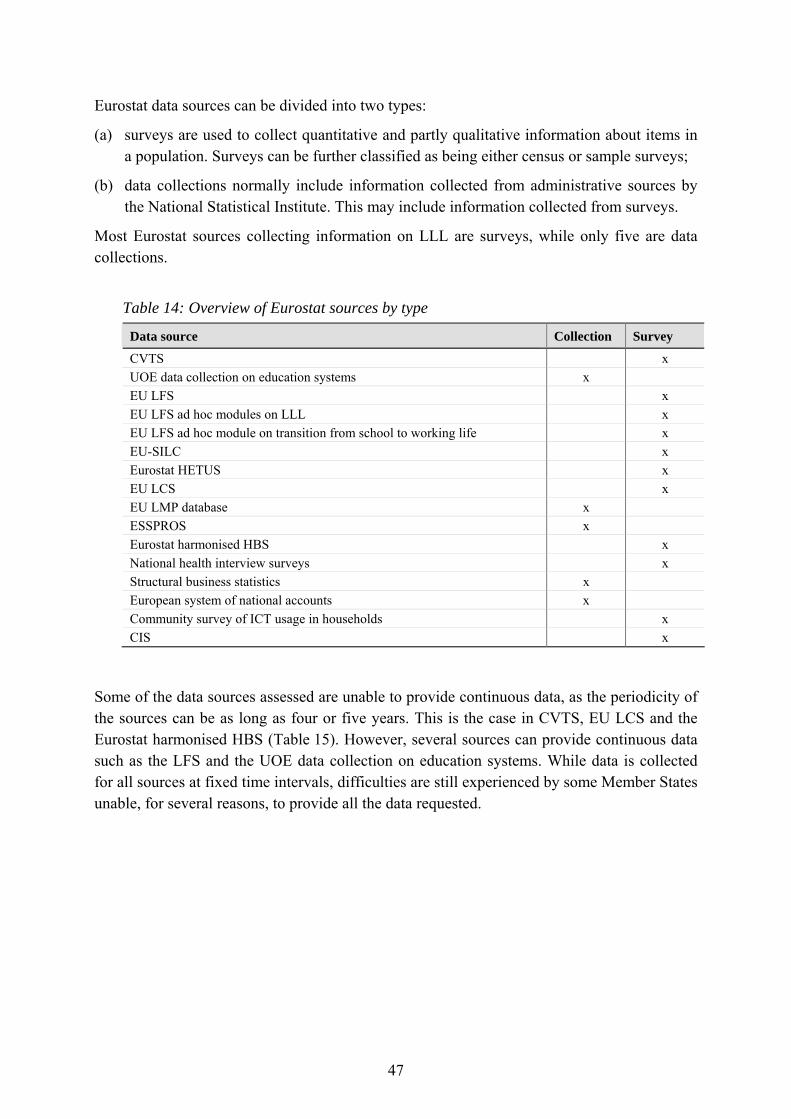
47
Eurostat data sources can be divided into two types:
(a) surveys are used to collect quantitative and partly qualitative information about items in a population. Surveys can be further classified as being either census or sample surveys;
(b) data collections normally include information collected from administrative sources by the National Statistical Institute. This may include information collected from surveys.
Most Eurostat sources collecting information on LLL are surveys, while only five are data collections.
Table 14: Overview of Eurostat sources by type
Data source Collection Survey
CVTS x UOE data collection on education systems x EU LFS x EU LFS ad hoc modules on LLL x EU LFS ad hoc module on transition from school to working life x EU-SILC x Eurostat HETUS x EU LCS x EU LMP database x ESSPROS x Eurostat harmonised HBS x National health interview surveys x Structural business statistics x European system of national accounts x Community survey of ICT usage in households x CIS x
Some of the data sources assessed are unable to provide continuous data, as the periodicity of the sources can be as long as four or five years. This is the case in CVTS, EU LCS and the Eurostat harmonised HBS (Table 15). However, several sources can provide continuous data such as the LFS and the UOE data collection on education systems. While data is collected for all sources at fixed time intervals, difficulties are still experienced by some Member States unable, for several reasons, to provide all the data requested.
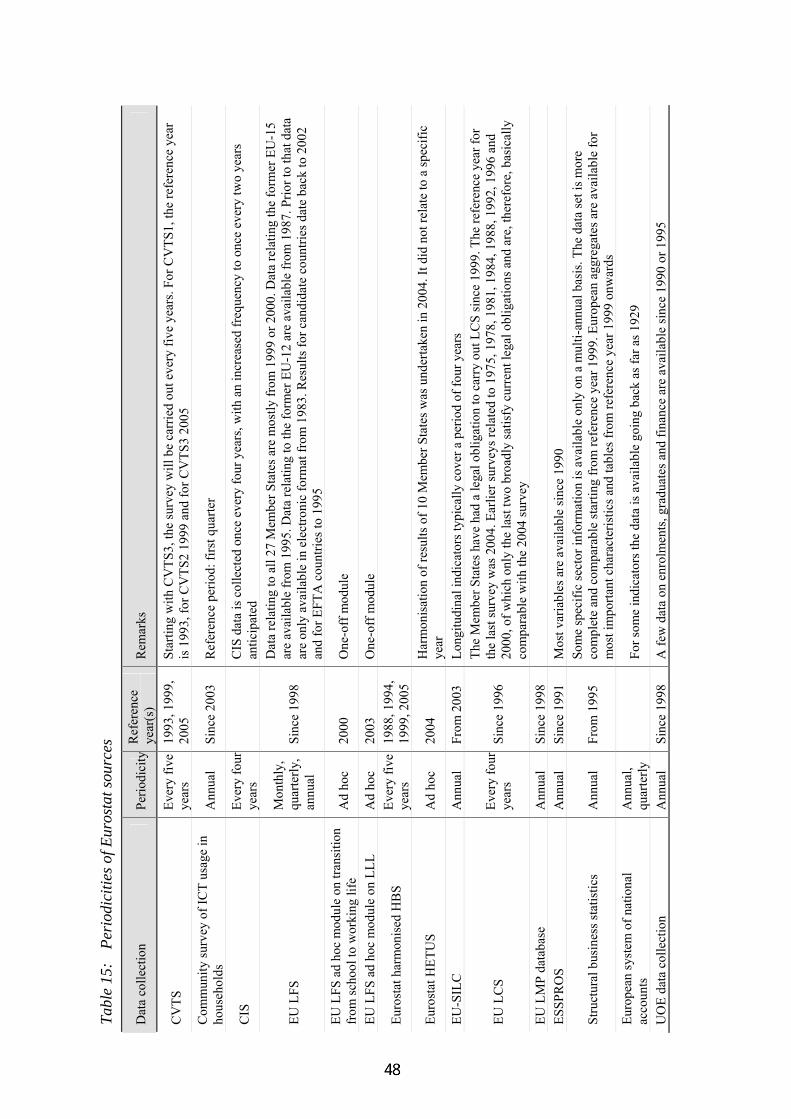
48
Tabl
e 15
: Pe
riod
iciti
es o
f Eur
osta
t sou
rces
Dat
a co
llect
ion
Perio
dici
tyR
efer
ence
ye
ar(s
) R
emar
ks
CV
TS
Ever
y fiv
eye
ars
1993
, 199
9,
2005
St
artin
g w
ith C
VTS
3, th
e su
rvey
will
be
carr
ied
out e
very
five
yea
rs. F
or C
VTS
1, th
e re
fere
nce
year
is
199
3, fo
r CV
TS2
1999
and
for C
VTS
3 20
05
Com
mun
ity su
rvey
of I
CT
usag
e in
ho
useh
olds
A
nnua
l Si
nce
2003
R
efer
ence
per
iod:
firs
t qua
rter
CIS
Ev
ery
four
year
s
CIS
dat
a is
col
lect
ed o
nce
ever
y fo
ur y
ears
, with
an
incr
ease
d fr
eque
ncy
to o
nce
ever
y tw
o ye
ars
antic
ipat
ed
EU L
FS
Mon
thly
, qu
arte
rly,
annu
al
Sinc
e 19
98
Dat
a re
latin
g to
all
27 M
embe
r Sta
tes a
re m
ostly
from
199
9 or
200
0. D
ata
rela
ting
the
form
er E
U-1
5 ar
e av
aila
ble
from
199
5. D
ata
rela
ting
to th
e fo
rmer
EU
-12
are
avai
labl
e fr
om 1
987.
Prio
r to
that
dat
a ar
e on
ly a
vaila
ble
in e
lect
roni
c fo
rmat
from
198
3. R
esul
ts fo
r can
dida
te c
ount
ries d
ate
back
to 2
002
and
for E
FTA
cou
ntrie
s to
1995
EU
LFS
ad
hoc
mod
ule
on tr
ansi
tion
from
scho
ol to
wor
king
life
A
d ho
c 20
00
One
-off
mod
ule
EU L
FS a
d ho
c m
odul
e on
LLL
A
d ho
c 20
03
One
-off
mod
ule
Euro
stat
har
mon
ised
HB
S Ev
ery
five
year
s 19
88, 1
994,
19
99, 2
005
Euro
stat
HET
US
Ad
hoc
2004
H
arm
onis
atio
n of
resu
lts o
f 10
Mem
ber S
tate
s was
und
erta
ken
in 2
004.
It d
id n
ot re
late
to a
spec
ific
year
EU
-SIL
C
Ann
ual
From
200
3 Lo
ngitu
dina
l ind
icat
ors t
ypic
ally
cov
er a
per
iod
of fo
ur y
ears
EU L
CS
Ever
y fo
urye
ars
Sinc
e 19
96
The
Mem
ber S
tate
s hav
e ha
d a
lega
l obl
igat
ion
to c
arry
out
LC
S si
nce
1999
. The
refe
renc
e ye
ar fo
r th
e la
st su
rvey
was
200
4. E
arlie
r sur
veys
rela
ted
to 1
975,
197
8, 1
981,
198
4, 1
988,
199
2, 1
996
and
2000
, of w
hich
onl
y th
e la
st tw
o br
oadl
y sa
tisfy
cur
rent
lega
l obl
igat
ions
and
are
, the
refo
re, b
asic
ally
co
mpa
rabl
e w
ith th
e 20
04 su
rvey
EU
LM
P da
taba
se
Ann
ual
Sinc
e 19
98
ES
SPR
OS
Ann
ual
Sinc
e 19
91
Mos
t var
iabl
es a
re a
vaila
ble
sinc
e 19
90
Stru
ctur
al b
usin
ess s
tatis
tics
Ann
ual
From
199
5 So
me
spec
ific
sect
or in
form
atio
n is
ava
ilabl
e on
ly o
n a
mul
ti-an
nual
bas
is. T
he d
ata
set i
s mor
e co
mpl
ete
and
com
para
ble
star
ting
from
refe
renc
e ye
ar 1
999.
Eur
opea
n ag
greg
ates
are
ava
ilabl
e fo
r m
ost i
mpo
rtant
cha
ract
eris
tics a
nd ta
bles
from
refe
renc
e ye
ar 1
999
onw
ards
Eu
rope
an sy
stem
of n
atio
nal
acco
unts
A
nnua
l, qu
arte
rly
Fo
r som
e in
dica
tors
the
data
is a
vaila
ble
goin
g ba
ck a
s far
as 1
929
UO
E da
ta c
olle
ctio
n A
nnua
l Si
nce
1998
A
few
dat
a on
enr
olm
ents
, gra
duat
es a
nd fi
nanc
e ar
e av
aila
ble
sinc
e 19
90 o
r 199
5

49
When considering the geographical coverage of each source, it is important to bear in mind that not all sources cover data for all of the 27 Member States and for all the years of the data collection exercise. The simple reason for this is that the EU has been progressively enlarging over the past 20 years from 12 Member States in 1986, 15 in 1995, 25 in 2004 and 27 in 2007. The data collected by a particular Eurostat source focuses on collecting data for Member States or candidate countries for a particular year. The exception to this is the UOE data collection on education systems (Table 15);
The concepts, definitions, and classifications used in Eurostat sources more or less conform to the definitions set by EU regulations. For example, the definition of enterprises found in LCS and CVTS2 is the one defined in Council Regulation (EEC) No 696/93 of 15 March 1993. If no EU regulation exists, then the definitions used are generally similar. However, there are major differences between data sources on the concepts and definitions of education and training.
For the unemployed, most of these data sources used or referred to the definition adopted by the 13th international conference of labour statisticians (12). However, deviations in the definitions used have also been observed. For example, in the CVTS2 methodology, the definition of the unemployed is given as ‘those persons, who were previously unemployed whether or not they were unskilled or skilled’, in contrast to the definition adopted by the 13th international conference of labour statisticians.
In the UOE data collection on education systems, the classification of governments by level is clear in most cases, but there are some ambiguities. If a country only has two levels of government, the lower level is usually designated local, not regional. If there are four or more levels, the second level is usually designated regional and the third local. If a city (such as the national capital) has dual status as both regional and local government, its expenditure is reported as expenditure of regional level government (e.g. the Stadtstaaten Hamburg, Bremen and Berlin in Germany).
Nine of the 16 Eurostat sources identified (Table 4) try to adhere to a common methodology and questionnaire to ensure comparability in the results. However, it is not the case for the following three, based on national surveys, which may include different definitions and concepts:
(a) Eurostat harmonised HBS: Eurostat collects data from national statistical institutes and harmonises the results of national HBS approximately every five years. Eurostat does not emphasise the use of the same questions, survey structure or sample designs in the surveys. Rather, emphasis is placed on harmonising the concepts and definitions used by
(12) ‘The “unemployed” comprise all persons above a specified age who during the reference period were:
(a) “without work”, i.e. were not in paid employment or self-employment [...]; (b) “currently available for work”, i.e. were available for paid employment or self-employment during the
reference period; (c) “seeking work”, i.e. had taken specific steps in a specified recent period to seek paid employment or
self-employment […]’ (ILO, 1982, p. 4).

50
national surveys. The Eurostat harmonised HBS collects data according to the classification of individual consumption by purpose (COICOP-HBS);
(b) Eurostat HETUS: in 2000, Eurostat set out guidelines for the HETUS. The purpose of the guidelines was to provide a solid methodological basis for countries intending to carry out time use surveys, which will ensure that the results are comparable between countries and, therefore, greatly increase the value of the data obtained. The European activity coding list allows several groupings of activities depending on the purpose of the analysis. The activity list includes the following relevant activities: unspecified study; school or university (unspecified activities related to school or university; classes and lectures; homework; other specified activities related to school or university); free time study. The HETUS activity coding list was based on international practices and previous classifications used in Europe. Data published by Eurostat relates to national time use surveys conducted between 1998 and 2004 by national statistical agencies and research institutes in 16 Member States (13). The results are not fully comparable since the survey methods used deviated from the European guidelines;
(c) national health interview surveys: the data come from non-harmonised national surveys and the countries were asked by Eurostat to post-harmonise the data according to their guidelines (Eurostat, 2004).
(13) Belgium, Denmark, Germany, Estonia, Spain, France, Italy, Latvia, Lithuania, Hungary, the Netherlands,
Poland, Slovenia, Finland, Sweden and the UK, as well as in Norway and Romania.

51
5. Recent developments in Eurostat data sources
In the past few years there have been many developments in Eurostat data sources across all statistical themes, including modifications to existing collections, and the introduction of new surveys. Not all of the developments are related to the collection of information on LLL and VET. In this chapter, sole focus is on developments that affect the collection of information on LLL and in particular VET.
It is useful to differentiate between changes to Eurostat data sources relating to:
(a) Eurostat education and training data sources;
(b) other Eurostat data sources.
5.1. Eurostat education and training data sources
In Chapter 3, several Eurostat data sources were identified that can be classified directly under the statistical theme of education and training. These are:
(a) CVTS;
(b) EU LFS ad hoc module on entry of young people into the labour market;
(c) UOE data collection on education systems;
This section considers developments in these sources as well as any new sources under the theme of education and training.
5.1.1. CVTS
The first enterprise survey on CVT was conducted in 1994 in the then 12 Member States. The CVTS1 was part of the action programme for developing CVT in the European Community (FORCE) based on Council Decision 90/267/EEC of 29 May 1990 (Council of EU, 1990). The growing policy interest in data on CVT in enterprises, together with the demand for CVT data to cover the 15 Member States, led the Commission to promote the CVTS2. This was introduced in 2000 in all Member States, in Norway and in the then nine candidate countries.
Use of CVTS1 and CVTS2 was based on gentlemen’s agreements between Eurostat and the Member States. For the CVTS3 and beyond, Eurostat proposed a legal basis for data collection within the European statistical system, in the form of a European Parliament/Council Regulation (EC) No 1552/2005 (EP and Council of EU, 2005). The objective of the regulation was to create a common statistical standard allowing the production of harmonised data, establishing a common framework, for the production of Community statistics on vocational training in enterprises. The CVTS3 took place in 2006, with the reference year of 2005.

52
While ensuring that the results of the CVTS3 are as comparable as possible with previous surveys (CVTS1 and CVTS2), several changes were made to the questionnaire and the methodology, including:
(a) collecting more information on enterprise training strategy;
(b) establishing a workable definition of IVT and a demarcation from CVT;
(c) collecting data on IVT, including total number of IVT participants, costs incurred by the enterprises in relation to the provision of IVT, whether enterprises contributed to collective or other funds, or received payments from such funds or other sources of grants/subsidies.
5.1.2. EU LFS ad hoc module on entry of young people into the labour market
In 2000, Eurostat conducted an ad hoc module on the transition from school to working life. The target population was persons aged 15 to 35 who had left continuous education within the past five or 10 years (i.e. between 1990-95 and 2000).
Commission regulation (EC) No 384/2005 (European Commission, 2005) outlined several ad hoc modules for the years 2007 to 2009. One of these is entitled the Entry of young people into the labour market, and is planned to take place in 2009. The list of variables includes the programme orientation of the highest level of formal education attained as follows:
(a) general education;
(b) vocational education mainly (or solely) school based;
(c) combination of school and workplace-based vocational education;
(d) vocational education mainly workplace based;
(e) vocational education, with no further distinction possible.
This information will only be collected for persons with educational attainment of ISCED 2-4.
5.1.3. UOE data collection on education systems
In recent years there have been many developments to the UOE data collection on education systems. The Council has recently adopted a regulation on the production and development of statistics on education and lifelong learning (3659/07), establishing a common framework for the systematic production of Community statistics in these fields.
The UOE statistical exercise collects data on students enrolled, entrants, graduates, education personnel and finance of education by level of education as defined by ISCED 97.
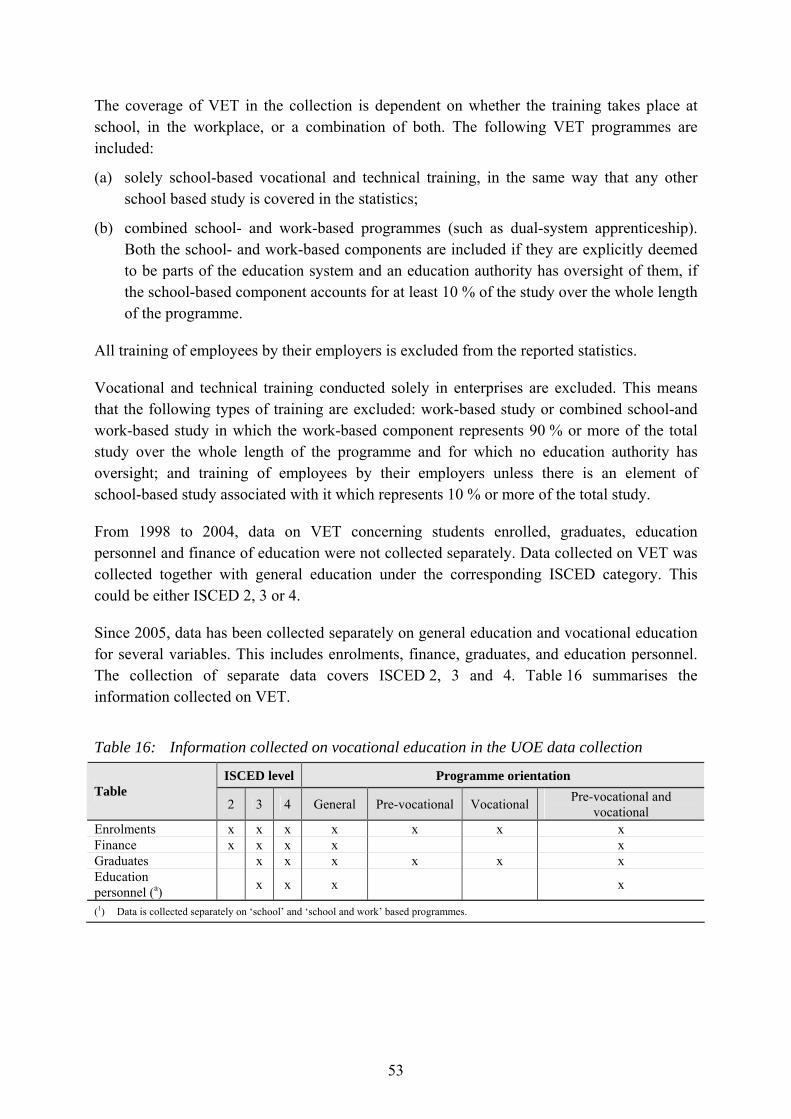
53
The coverage of VET in the collection is dependent on whether the training takes place at school, in the workplace, or a combination of both. The following VET programmes are included:
(a) solely school-based vocational and technical training, in the same way that any other school based study is covered in the statistics;
(b) combined school- and work-based programmes (such as dual-system apprenticeship). Both the school- and work-based components are included if they are explicitly deemed to be parts of the education system and an education authority has oversight of them, if the school-based component accounts for at least 10 % of the study over the whole length of the programme.
All training of employees by their employers is excluded from the reported statistics.
Vocational and technical training conducted solely in enterprises are excluded. This means that the following types of training are excluded: work-based study or combined school-and work-based study in which the work-based component represents 90 % or more of the total study over the whole length of the programme and for which no education authority has oversight; and training of employees by their employers unless there is an element of school-based study associated with it which represents 10 % or more of the total study.
From 1998 to 2004, data on VET concerning students enrolled, graduates, education personnel and finance of education were not collected separately. Data collected on VET was collected together with general education under the corresponding ISCED category. This could be either ISCED 2, 3 or 4.
Since 2005, data has been collected separately on general education and vocational education for several variables. This includes enrolments, finance, graduates, and education personnel. The collection of separate data covers ISCED 2, 3 and 4. Table 16 summarises the information collected on VET.
Table 16: Information collected on vocational education in the UOE data collection
ISCED level Programme orientation Table
2 3 4 General Pre-vocational Vocational Pre-vocational and vocational
Enrolments x x x x x x x Finance x x x x x Graduates x x x x x x Education personnel (a) x x x x
(1) Data is collected separately on ‘school’ and ‘school and work’ based programmes.

54
Since 2002 a regular update of national ISCED mappings into the UOE data collection has been made through the ISCMAP-PROG questionnaire. Data on programmes at national level (whether or not they can be classified by ISCED) are collected in the ISCMAP-PROG and ISCMAP-QUAL questionnaires and provide accompanying metadata and background methodological information. This includes whether the education programme orientation is a general, pre-vocational or a vocational programme, and various other information:
(a) the programme number;
(b) the year when the programme was created;
(c) the ISCED level;
(d) the programme destination (A/B/C); the destination of the programme towards labour market entry of further studies, in accordance with the ISCED-97 instructions. It includes destinations A, B, C. For ISCED 5 the term destination is used to denote the type of the tertiary education programme (5A or 5B);
(e) the programme orientation (G/P/V); the programme orientation towards a General (G), pre-vocational (P) or vocational (V) content in accordance with the ISCED-97 instructions;
(f) the theoretical cumulative duration at ISCED 5;
(g) the position in the national degree/qualification structure (intermediate, first, second, etc.);
(h) the position in the tertiary education structure (bachelor, master, PhD);
(i) the notes on programmes that span ISCED levels or sub-categories;
(j) the minimum entrance requirement (ISCED level or other);
(k) the main diplomas, credentials and certifications awarded;
(l) the theoretical starting age;
(m) the theoretical duration of the programme;
(n) the theoretical cumulative years of education at the end of the programme;
(o) whether the programme has a work-based element;
(p) whether the programme is specifically designed for adults;
(q) whether the programme is specifically designed for part-time attendance;
(r) whether it is reported in the UOE data collection;
(s) whether it is reported in the UOE finance tables;
(t) enrolments.

55
5.1.4. EU adult education survey (AES)
In April 2002, Eurostat proposed to the EU directors of social statistics a comprehensive system of adult education statistics based on the CVTS and the planned AES. Following the recommendation of the Directors, Eurostat created a taskforce to develop the AES, with a mandate for exploring the feasibility and requirements for launching an EU AES within the broader framework of the development of education and training statistics. The AES taskforce produced its final report in April 2004, recommending 2006 as the reference year for the survey, but allowing for one-year difference before or after the reference year. This gave countries the option either to prepare the AES as a separate survey, or to integrate the core module in a national survey. This will result in three different (successive) reference years (2005, 2006 and 2007).
In June 2004, an adult education questionnaire development group prepared the AES questionnaire; the classification for learning activities was developed and tested in parallel. The draft questionnaire, together with the precision requirements for the survey and the results of the classification for learning activities testing, were presented at the education and training statistics working group. After this meeting the taskforce for the development of AES Pilots was created to assist countries in pilots for the AES, providing a forum for exchange of experience both for the preparatory phase and for the pilot evaluation phase. Following tests conducted in Sweden and the UK, plus further discussion, the final version of the questionnaire was prepared. The survey was conducted in 2006/07 in all Member States, Croatia, Turkey and Norway. Most countries implemented the AES as a stand-alone survey; some included AES variables within existing surveys (mostly as an ad hoc module of the LFS) and only two participating countries adapted national surveys on adult education.
The AES collected information on all types of learning activities (formal, non-formal, and informal) according to the EU definition of LLL (14). The survey collected demographic and socioeconomic information of individuals and their (self-reported) skills, on their participation in cultural, social and civic activities.
Information on the highest level of education or training successfully completed by individuals is collected according to ISCED level. ISCED divides programmes of ISCED 2, 3, and 4 into sub-categories according to programme orientation (i.e. general education; pre-vocational or pre-technical education; vocational or technical education) and the cumulative theoretical duration. The AES questionnaire does not distinguish programme orientation for ISCED 2, 3, and 4. However, information on ISCED 3c (vocational/technical education) is collected separately.
(14) As adopted by the Commission and the Member States, LLL encompasses ‘all learning activity undertaken
throughout life, with the aim of improving knowledge, skills and competences with a personal, civic, social and/or employment-related perspective’ (European Commission, 2001, p. 33).

56
Information on participation in formal education and training is also collected by ISCED level, but not by programme orientation, so it is not possible to distinguish individuals who participated in pre-vocational and vocational programmes from several programmes. There are several variables related to the role of the employer and the individual in formal and non-formal education in enterprises, including:
(a) degree to which the education activity took place during paid working hours (including paid leave or recuperation);
(b) employer or prospective employer pay in part or in full for tuition, registration, exam fees,;
(c) employer or prospective employer pay in part or in full for books or technical study means.
Several variables on participation in non-formal education in relation to VET can be derived from the survey:
(a) participated in non-formal education activity for job-related reasons;
(b) participated in non-formal education activity to keep job;
(c) participated in non-formal education activity to increase/improve work (to do job better/and/or improve career prospects, to be able to do job better, to be able to take greater responsibilities/increase chances of promotion);
(d) participated in non-formal education activity to change job/occupation (to increase possibilities of getting a job, or changing a job/profession, to start own business);
(e) degree to which the education activity took place during paid working hours (including paid leave or recuperation);
(f) activity leads to a certificate which is required (by the law or employer) for the execution of current or planned activity in the labour market (as employer or employee);
(g) employer or prospective employer pays in part or in full for tuition, registration, exam fees;
(h) employer or prospective employer pay in part or in full for books or technical study means;
(i) provider of education activity was an employer or employer’s organisation;
(j) did not participate in education and training due to a lack of employer’s support;
(k) did not participate in education and training as training conflicted with work schedule.
The survey also enquires whether individuals have deliberately tried to teach themselves at work. However, this question is combined with whether individuals deliberately tried to teach themselves during their free time through a family member, friend or colleague, printed material, computers, television/radio, or guided tours.
The final results for some countries are expected to be published in 2008, and for all at the beginning of 2009.
57
5.2. Other Eurostat data sources
5.2.1. European household survey
Eurostat is planning to establish a common multipurpose annual social survey, the European household survey. This aims to increase flexibility of statistical production and rationalise existing surveys. It is expected that increased flexibility of statistical production would result from the new survey containing an open part that would be used annually at short notice for specific requests.
At the time of writing, the concept makes provisions for three regular annual modules, supplemented by various intermittent modules:
(a) a module composed of the core variables;
(b) a module corresponding to the current ICT usage survey;
(c) a module on the European health interview survey annual indicators;
(d) irregular modules to include three modules on the AES;
(e) different modules to answer new policy demands from Commission Directorate Generals.
The first AES irregular model would include the ‘main’ AES component and the first complementary one. The second module would then combine the ‘main’ one and the second complementary. The ‘main’ AES component would include variables currently in AES about information on the household, education and training successfully completed, the employment characteristics of the main job, participation in formal and non-formal education and training and informal learning. The first AES complementary component would include variables currently in AES about information on not completed education and training, second job, the situation one year before the survey, parental education, participation in education or training, obstacles to participation in education and further detailed information on selected activities. The second AES complementary component would include variables currently in AES about information on access to information about learning possibilities, on language skills and on attitudes towards learning. A third module would correspond to the AES module on social, civic, cultural and sports related participation.
This cycle of modules could be periodically repeated to ensure a time series of data for political needs in this area. A pilot survey is expected to be carried out in 2008; all Member States plus Norway and Iceland will be invited to take part. It will cover four different modules: the core variables module; the ICT module (2008 ICT household survey); the European health interview survey, biennial indicators module; and the EU-SILC 2006 module on social participation. The pilots will probably be different depending on whether countries have (or are developing) a national omnibus survey.

58
5.2.2. EU LFS ad hoc module on the labour market situation of migrants and their immediate descendants
The aim of the ad hoc module on the labour market situation of migrants and their immediate descendants is to collect comprehensive and comparable data to monitor progress towards the common objectives of the European employment strategy and of the social inclusion process.
The implementation of the 2008 module was conditional upon the results of feasibility studies, the results of which Eurostat presented in the meeting of Directors of social statistics of Member States in September 2005. It was concluded that Member States and Eurostat should proceed in preparing the module for 2008, to cover all Member States. The results of the survey will be presented before the end of March 2009.
Commission regulation No 102/2007 of 2 February 2007 (European Commission, 2007b) set out the list of variables to be collected in 2008. The list of variables mainly focuses on help received, restrictions and integration onto the labour market by migrants and their immediate descendents. However, a few variables can be considered being directly related to LLL (Table 17). In particular, ‘participation in labour market/training programmes’ is directly related to VET.
Table 17: Education-related variables to be collected in the 2008 ad hoc module on the labour market situation of migrants and their immediate descendants
Variable Notes
Main reason for migrating (last migration) Reasons given include: study
Use of facilities for establishing what highest qualification equates to in the host country system
Possible answers include: yes, established what qualification equates to; yes, but not established what qualification equates to
or procedure not yet completed; no, no need because highest qualification obtained
in the host country Use of services for labour-market integration in the two years following the last arrival
Responses include participation in labour-market training/programmes.
5.2.3. Community survey on ICT usage and e-commerce in enterprises
Since the first data collection in 2002 the questionnaire has included an item on whether enterprises use the Internet for training and education.
The 2007 questionnaire included a one–off module on ‘e-skills- ICT competence in the enterprise unit and the demand for ICT skills’. One of the questions in this module asked enterprises whether they provided training to develop or upgrade the ICT-related skills of their personnel during the previous year (2006). The question differentiated between training for ICT/IT specialists and training for users of ICT.

59
5.2.4. Community survey on ICT usage in households and by individuals
Since the first data collection in 2002, there have been many changes to the Community survey on ICT usage in households and by individuals. Several changes to the questionnaire have made a significant impact on the information collected on LLL.
The education level of the individual has been surveyed every year, classified into low, medium, and high levels:
(a) low: ISECD 1 and 2, primary education and lower secondary education; (b) medium: ISCED 3 and 4, upper secondary education and post secondary non-tertiary
education; (c) high: ISECD 5 and 6, tertiary programmes which normally require the successful
completion of ISCED 3 or 4 and second stage tertiary education that leads to an advanced research qualification.
In 2002, the only question relating to LLL was whether the individual used the Internet for an information search and online services related to education and training. From 2002 to 2007 the number of questions expanded to gather more information on the ICT skills of individuals.
Including a module on e-skills in the 2005 survey added further questions relating to a potential link between ICT skills and education and training. For example, a question was added in the module aiming to establish whether the individual acquired their Internet skills through education and training or some other way. Above all, the question tried to establish a link between Internet-related skills of individuals and vocational training courses taken.
In particular, the question distinguished between the following types of education and training: (a) formalised educational institution (school, college, university); (b) training courses in an adult education centre (but not at the initiative of the employer); (c) vocational training courses (at the demand of the employer); (d) self-study using books, CD-ROMs, etc.; (e) self-study in the sense of learning-by-doing.
Further modifications to the survey were undertaken in 2007, aiming to gather more information on ICT skills and education. These modifications included a question trying to establish the barriers in undertaking computer-training courses, including: (a) lack of time; (b) course costs; (c) no suitable offer available; (d) courses too difficult.
Unfortunately, the forthcoming 2008 survey has dropped the e-skills module, which included the question on whether the individual acquired Internet skills through education and training or some other way.
The main changes in information on LLL collected via the Community survey on ICT usage in households and by individuals are summarised in Table 18.

60
Table 18: Chronological list of main changes in collecting information on LLL in the Community survey on ICT usage in households and by individuals
2002
Two questions on LLL were asked: whether the individual used the Internet for an information search and online services related to education and
training; the education level of the individual.
2003
The question on whether the individual used the Internet for information search and online services related to education and training was dropped. New questions added: whether the individual used the Internet for training and education in the last three months: formalised
educational activities (school, university, etc.); post-educational courses; other educational courses related specifically to employment opportunities;
whether the individual had taken any training courses (of half a day or longer) on any aspect of computer use.
2004
The question added in the 2004 questionnaire on whether the individual had taken any training courses (of half a day or longer) on any aspect of computer use was altered to: have you taken any training courses (of three hours or longer) on any aspect of computer use? in the last 12 months; more than one year ago; no training courses undertaken.
2005
A module on e-skills was added to the survey. The question about taking any computer use training courses was once again changed: when did you last take a training course (of at least three hours) on any aspect of computer use? − within the last three months; − between three months and a year ago; − between one and three years ago; − more than three years ago; − never taken one;
where or how did you obtain the skills to carry out Internet related activities? − formalised educational institution (school, college, university); − training courses in adult education centre (but not on the initiative of your employer); − vocational training courses (on the demand of the employer); − self-study using books, CD-ROMs, etc.; − self-study in the sense of learning-by-doing; − informal assistance from colleagues, relatives, friends; − some other way.
2006 The questionnaire of 2005 remained unchanged
2007
New question added: used the Internet in the last three months to look for information about education, training or course offers: − looking for information about education, training or course offers; − doing an online course (of any subject); − consulting the Internet with the purpose of learning;
in the past three months, have you taken part in a course (any training, not only computer or Internet training, including school or university)?
in the past three months, have you used the Internet to: − do research as part of a training course or your education; − exchange messages about the course content with other learners; − download learning content which was provided online; − look for the availability of a book or article for your course in a library;
what are the reasons for not having taken a course on computer use recently? (added to the e-skills module): − lack of time; − course costs; − no suitable offer available; − courses are too difficult; − none of the above.
2008
The module on e-skills and several questions were dropped from the questionnaire, including: how skills were obtained to carry out Internet related activities;
in the past three months, have you taken part in a course (any training, not only computer or Internet training, including school or university)? what are the reasons for not having taken a course on computer use recently?

61
6. Setting up a system of VET statistics
6.1. Introduction
The previous chapters have shown the multiplicity of sources collecting data on VET. In several instances the methodologies are not fully harmonised, and concepts and definitions may differ; in several cases, even classifications used vary, e.g. ISCED, NACE.. For example, converting the number of teaching professionals in head counts from one source into full-time equivalents used in another (an arduous task) is necessary if the information from both sources is to be compatible. In some cases, variables needed to form relevant indicators are not available in the existing data sources. In others, the same variable is found in more than one source, but with different data for the same item, resulting from different methodologies or parameters being used. For example the CVTS and the LCS collect data on the vocational training costs of employees by enterprises; however, they are different due to differences in methodologies.
In the absence of a single reliable data source able to collect all relevant VET aspects, a harmonised modular system (with modules which cover specific aspects of the data needs) is the most appropriate strategy to address this situation. In Chapter 2, a proposed system for collecting VET statistics was outlined based on an input, process, output and outcome approach to VET. In Table 2 this system set out the type of data required to satisfy the requirements of each of the individual components of the VET system.
6.2. Current VET data collected
Figure 3 depicts the current situation for VET statistics, showing some, but not all, data sources collecting information on LLL/VET. The central circle of Figure 3 represents the VET system main components: inputs, processes, outputs and outcomes. The outer circles represent some (but not all) of the Eurostat data sources evaluated, for example CVTS, LCS, UOE data collection on education systems, etc. The figure shows that several data sources overlap the VET system, some even overlap each other. Sources overlapping the central VET circle cover some of the information required to measure the VET process. Sources overlapping each other, i.e. CVTS and LCS, indicate that some of the variables (e.g. enterprise spending on vocational training) are collected in both sources.
The following points summarise current Eurostat sources collecting information on LLL:
(a) some sources collect some of the variables needed for the modular system, but not all the variables collected by the source relate to VET. Such a source is seen to overlap the VET system circle, for example LCS, AES, UOE data collection on education systems;

62
Harmonised HBS
VET system
AES
UOE data collection on
education systems
CVTS
No data collected on
VET
Data not covered by any source
Sources overlap in relation to some of the variables collected
LCS
(b) a source collects only variables needed to describe the VET system and only a few variables are covered by other data sources. Such a source lies within the VET system circle and may overlap with one or two other sources, for example the CVTS;
(c) a source contains none of the variables required to describe the VET system. An example is the Eurostat harmonised HBS, which lies outside the VET system circle. In addition, this source may overlap with some of the information collected in other sources, which collect VET data but whose primary focus is not VET;
(d) a source may collect VET data similar to VET data collected in other sources. In this case sources overlap each other in addition to overlapping the VET system circle. For example the LCS and the AES;
(e) data on a particular aspect of the VET system is not covered by any Eurostat source.
Figure 3: Graphical representation of current Eurostat VET statistics
6.3. Statistical system audit for modular system
Existing statistics and indicators on VET tend to focus on the CVTS. However, it has been shown that several Eurostat data sources can be used to provide and construct statistics and indicators on VET. While some variables are repeated by more than one source, there are still gaps in our knowledge about certain aspects of VET, which none of the existing Eurostat data sources can fill.

63
Whether a source can, or has the potential to, provide data on a particular aspect of VET should not be confused with the ability of the source to fit into a harmonised system of VET statistics and indicators. The current situation is such that indicators can be constructed from different Eurostat sources on different VET aspects and used to form a non-harmonised picture of these aspects. For example, the CVTS can provide data for indicators on the CVT of employees by enterprises, the LCS can provide information on the wages and salaries of apprentices in enterprises, while ESSPROS can provide data on vocational training allowances. Assembling indicators in this manner can help to monitor certain aspects of VET, but it fails to consider the important issue of the degree to which these sources are harmonised.
To determine if a source can fit into a harmonised system of VET statistics and indicators, it is essential to establish whether the source is adequate and appropriate in meeting the requirements of a harmonised system. Adequacy relates to whether a source meets the needs for key indicators and variables in terms of quality, periodicity, volume of data provided, and in conceptual terms. Appropriateness refers to how the different sources fit together, or the degree of harmonisation of each source.
A statistical system audit was conducted to clarify whether each source identified as collecting either LLL/VET variables could be used in a harmonised modular system. This audit examined the important issue of adequacy and appropriateness of each source that could potentially provide information to the VET system.
A proposed system for collecting VET statistics based on inputs, processes, outputs and outcomes was outlined (Chapter 2). This system provides the parameters for assessing the data currently available and so establishing which available variables can be used in the harmonised modular system. This system provides some examples of the type of information that should be available in the final modular system of VET statistics in terms of each of its components (inputs, processes, outputs, and outcomes).
The statistical system audit identified which sources contain variables that can be used to fulfil the information requirements of the modular system. It does not automatically mean that if data collected in one Eurostat source appears to be similar to the data required, then this source could be used to fill a particular statistical gap. It is worth highlighting that, in this modular system, attention needs to be placed on maintaining a high level of comparability and coherence in the data collected from all sources. To this end, the statistical audit paid particular attention to the adequacy and appropriateness of Eurostat sources.

64
6.3.1. Essential data not currently collected
The statistical audit revealed that existing Eurostat sources were unable to provide all the information required to describe the VET system. Table 19 shows the gaps that could not be filled by existing sources. It can be concluded that there are still gaps in our knowledge of VET despite all the Eurostat data sources collecting information on LLL.
While the statistical audit clearly demonstrated big gaps in the information required to describe the VET system, some of these gaps can be remedied through the introduction of new questions to existing sources or the establishment of new surveys. The suspension of the Eurostat VET data collection left a void in some of the variables previously collected; this has not yet been completely filled by any data source, although the UOE statistical exercise has made concerted efforts. However, the problem of the adequacy and appropriateness of Eurostat data sources cannot be overlooked.
Table 19: Information currently not collected by any Eurostat source
Component of VET system
Sub-component Example of variables
Student characteristics Native language of student and parents Minimum proportion of time devoted to professional training of teachers Minimum length and level of teacher training Qualifications of VET teachers Minimum qualification required (level and pedagogical training) for teachers and trainers
Teacher/trainer characteristics
Working time of teachers and trainers involved in VET programmes broken down by full and part-time and gender
Input
Educational institution characteristics Number of institutions/training centres
Learner time allocation Level of absenteeism Management Type of management Monitoring of teachers/trainers Monitoring of teachers/trainers Process
Monitoring and evaluation of learning outcomes Monitoring and evaluation of learning outcomes
Number of drop-outs Learner attainment
Self-reported skills Changes in attitudes Changes in attitudes Improvements in quality Improvements in quality
Output
Equity effects Number of graduates by socioeconomic status of parents Outcome Impact on students Returns to education from VET

65
6.3.2. Adequacy and appropriateness of Eurostat sources
Our study showed that, while some sources can fulfil some data requirements in the harmonised system of VET statistics and indicators, problems of adequacy and appropriateness rendered the sources unable to meet the requirements fully.
One of the biggest stumbling blocks to a harmonised system of statistics and indicators on VET is that the types of sources that currently collect some data on VET are different. Chapter 4 showed that, while some sources are administrative data collections, others are sample surveys.
In summary, the following points were observed as a result of the evaluation of Eurostat data sources and the subsequent statistical audit:
(a) periodicity of data sources: while some data sources are conducted frequently, such as every year (e.g. LFS, Community survey of ICT usage in households, UOE statistical exercise), others are conducted at long regular intervals (e.g. CVTS, LCS, Eurostat harmonised HBS). This means that attempting to combine data collected from sources with long regular intervals with that of short regular intervals results in gaps. A good example of this is the CVTS, which is conducted once every five years. This survey contains a good deal of information on CVT in enterprises. While the LCS collects some of this information, such as the cost of vocational training, most of this information cannot be easily replaced by other sources. Inevitably we are left with statistical gaps for certain variables;
(b) differences in the period of observation in household and individual surveys: it was established that there are differences between Eurostat sources in the observation periods for households or individuals. For example, the LFS looks at the previous four weeks, while the AES looks at the previous 12 months. Trying to combine data from these sources will result in non-harmonised periods of observation;
(c) differences concerning concepts and definitions used in relation to VET: while Eurostat data sources generally try to maintain the same concepts and definitions used, there is a great deal of divergence between sources with respect to those used for vocational education. This means that problems arise when:
(i) completing the statistical picture of VET from different sources;
(ii) filling in data from different sources when data from one source is missing.
(d) classifications used: in general Eurostat sources tend to apply the same classifications, such as the international standard classification of occupations (ISCO-88); NACE; and the ISCED 97. Some sources truncate the ISCED classification by collecting data on two ISCED levels together. Data is collected on enterprises according to their economic activity (NACE), for example by the LCS and the CVTS. Unfortunately the latter do not cover the same NACE sections;
(e) methodological changes in relation to data requested: in some sources such as the CVTS

66
and the UOE statistical exercise, recent changes to the information requested has benefited the information collected on VET. However, this means that data will not be available for the entire period for which it is collected. Some data sources, such as the structural business survey, have stopped collecting data on VET;
(f) geographical coverage: not all data sources cover all existing Member States for all the years for which data was collected. Therefore, there are gaps in the data collected for some countries.
The statistical audit illustrated the enormous gulf between the data requested and the data provided by national statistical institutes. This can be illustrated by the UOE data collection on education systems. The collection requests data expenditure on education by ISCED level by households and other private entities, including firms, religious institutions and other non-profit organisations, but not educational institutions. However, only a few countries are able to fulfil these data requirements. Recent changes to the collection include requesting separate expenditure data on pre-vocational and vocational education. It has yet to be seen to what extent countries are able to meet the requirements.
6.4. Sources for a VET statistics system
It is evident from the statistical audit and the evaluation of Eurostat data sources that not all Eurostat sources can be part of a harmonised VET statistics system. All sources collecting data on LLL, regardless of whether they collect data on VET, were considered. This is because some sources, which do not currently collect data on VET, may have the potential to collect some variables on VET in the future. For example the AES does not currently explicitly ask for information on VET, but it should be possible in the future to add questions to the questionnaire or to add a module focusing on a particular aspect of VET.
In assessing the potential of each source to be included in a harmonised system, it is essential to look at the global picture. This includes examining not only the information that is currently collected but also the adequacy and appropriateness of the source. Several aspects should be examined, including:
(a) objectives of the sources;
(b) periodicity of the source;
(c) harmonisation of concepts and definitions;
(d) geographical coverage.

67
Each source is considered in terms of its potential for being used in a harmonised system of VET statistics below:
(a) Adult education survey
The new AES does not directly ask for the orientation of studies undertaken (general, pre-vocational or vocational). Instead, the survey focuses on whether the individual participated in guided on-the-job training by establishing whether the activity took place during paid working hours, and whether the employer contributed to the tuition fees or other expenses.
In its present state, the use of the survey to extract information on VET is limited; although the possibility remains to add questions or even a module in future surveys to clarify participation in VET.
(b) Continuing vocational training survey
The aim of the CVTS is to obtain key information about the training provided by enterprises for their employees. A common European questionnaire is used for the survey; any deviations are noted in the national sampling plan, including deviations from the recommended sequence of questions. It collects several variables related to the CVT of employees by enterprises, including participants and costs. While the two previous surveys did not collect data on IVT, the latest one (reference year 2005) collected some information on IVT.
One of the major disadvantages of the CVTS is that it is conducted every five years, and that previous surveys did not cover all current Member States. It can be argued that the LCS could be used to fill the gaps for some variables for at least one year (e.g. costs of vocational training in enterprises). Unfortunately, the LCS does not collect the same level of detail as the CVTS. Another problem associated with using the LCS to complete some data gaps is that the surveys use different categories of NACE economic activities to classify enterprises. This means that the results will be subject to error. One suggestion might be to project the data forward for some variables, for example costs of CVT paid by enterprises or the number of participants, based on previous surveys conducted. However, such a calculation should only be considered as a rough estimate.
Further, and perhaps most important, the definitions applied in relation to VET, notably CVT and apprenticeship, differ considerably from those of other sources not dedicated to vocational training, including the LCS.
The CVTS contains a lot of pertinent information but to improve comparability and reporting on VET more generally, a harmonisation process needs to be undertaken for VET concepts and definitions across sources.
(c) EU Labour force survey
While the main objective of the LFS is to obtain information on the labour market and related issues, it does collect data on education. The LFS has many advantages including the fact that it is a quarterly sample survey and ad hoc modules collecting data on

68
particular aspects related to education can be added. This was the case with ad hoc modules on LLL and the ad hoc module on transition from school to working life. Data related to education can be cross-referenced with other variables in the LFS core survey such as age, gender, occupation, labour force status.
However, one of the main problems of surveys of households or individuals was highlighted when we considered recent developments in Eurostat data sources (Chapter 5). This concerns an individual’s ability to differentiate between general education and the different types of VET. For example, the proposed LFS ad hoc module on the entry of young people into the labour market, scheduled to take place in 2009, is considering asking for the orientation of the highest level of formal education attained. It tries to distinguish between the following types of VET:
(i) vocational education mainly (or solely) school based;
(ii) combination of school and workplace-based vocational education;
(iii) vocational education mainly workplace based;
(iv) vocational education, with no distinction possible between 2, 3, and 4.
(d) Community innovation survey
The CIS does not meet any of the information requirements of the proposed harmonised modular system as the aim of the survey is to provide information on the characteristics of innovation activity at enterprise level. The only information collected on VET was the number of enterprises engaging in internal or external training of personnel directly aimed at the development and/or introduction of innovations. The survey is conducted once every four years. This survey has little potential to be used in a system of harmonised statistics.
(e) EU survey on income and living conditions
This is a Eurostat harmonised survey and so offers great scope for achieving comparability. Several countries derive the required data from administrative registers. Financial topics are an important feature of EU-SILC. As it is multidimensional, the data can be cross-referenced by a wide range of demographic, social and economic characteristics of households, including ISCED aspects. It provides the opportunity to obtain longitudinal data; hence the prospect of analysing transitions between different states of education and training.
While specific data on VET is not collected, the information on education includes background data such as educational attainment and education related allowances. However, the source does not distinguish between general and vocational education.
The ability to incorporate a module on VET in future surveys is partly dependent on the ability to meet the objectives of the survey and to distinguish general from vocational education. It can be argued that some questions relating to whether an individual received training allowances/grants for participating in continuing vocational education

69
or IVT can perhaps be more easily added, as it would be within the objectives of the survey. The coverage of variables is defined by a regulation, therefore, it would not be easy to add variables to EU-SILC. However, Member States are allowed to add variables for purely domestic purposes.
(f) EU labour cost survey
The LCS suits a harmonised system of VET statistics as the main concepts and definitions and classifications used are standard international classifications, ensuring comparability and compatibility between Member States. However, the VET definitions applied differ considerably from other sources, notably the CVTS.
The LCS is conducted once every four years. It aims to collect comparable data on the level and composition of labour costs and on the structure and distribution of earnings. The information collected on education and training relates only to expenditure by enterprises on apprentices, and vocational training. Any new questions relating to VET should focus on the costs of CVT and IVT.
The coverage of variables is defined by a directive, so it would be difficult to add new variables. One of the points to address is that VET concepts and definitions differ from those of the CVTS. If this survey is to be included in a harmonised system, further methodological work should be undertaken on concepts and definitions.
(g) Eurostat harmonised household budget survey
Data collected by Eurostat from national statistical institutes for the harmonised HBS is output harmonised approximately every five years. Eurostat does not emphasise the use of the same questions, survey structure or sample designs in the surveys; emphasis is placed on harmonising the concepts and definitions used by national surveys. Eurostat collects data from national HBS according to the COICOP-HBS. The breakdown of educational services in the COICOP-HBS is based on the level of categories of ISCED 97 (ISCED 0-1, ISCED 2-3, ISCED 4, ISCED 5-6, education not definable by level).
Above all, the harmonised HBS does not distinguish spending by households on vocational education from general education. Further, the education data collected by Eurostat under the COICOP-HBS classification relates only to educational services. It does not include expenditure on educational materials such as books and stationery or educational support services such as healthcare or transport services and accommodation. It also does not include expenditure on driving or recreational lessons, and sport or tourism activities. However, it includes education transmitted through radio or television. Therefore, a portion of household expenditure is not collected.
The essential reference for the harmonised HBS is the concept of ‘household final consumption expenditure’. Eurostat recognise that the concept of ‘actual household final consumption expenditure’ would be more suitable, since it is based on acquisition. Household actual final consumption consists of the acquisitions households obtain through their spending on goods and services in their own country or abroad (household

70
final consumption expenditure) and acquisitions from the government and non-profit institutions serving households which are, in essence, provisions in kind to the households (social transfers in kind). To improve the comparability situation, Eurostat proposed a method to impute publicly financed aggregate expenditure on health and education to household and the individual level, respectively. This imputation led Eurostat to recommend that the concept of actual use of education services is not included in the conceptual base of household consumption expenditure of harmonised HBS for the round of 2005.
(h) Harmonised European time use survey
Data published by Eurostat relates to national time use surveys conducted between 1998 and 2004 by national statistical agencies and research institutes in 16 Member States (15). The results are not fully comparable since the survey methods used deviated from the European guidelines. This source should only be considered part of a modular system in the long term, not in the short to medium term.
(i) European system of national accounts
The European system of national accounts gives comprehensive aggregate expenditure on education by institutional sectors. The data are comparable because they are compiled within a harmonised conceptual and statistical framework. The totals they provide are normally used to calibrate the reliability of the grossed-up estimates from such surveys as HBS. They are aggregates and provide no detail on individual institution or individual household, i.e. no microdata; they cannot be cross-analysed by demographic, economic and social characteristics. Data collected on education is based on the ISCED classification. However, it does not differentiate between general and vocational training programmes.
(j) European system of integrated social protection statistics (ESSOROS)
The objective of ESSPROS is to provide a comprehensive, realistic and coherent description of social protection in the Member States: it covers social benefits and their financing, geared to international comparability and harmonised with other statistics, particularly the national accounts, in its main concepts. Social protection encompasses all interventions from public or private bodies intended to relieve households and individuals of the burden of a defined set of risks or needs, provided that there is neither a simultaneous reciprocal nor an individual arrangement involved.
While ESSPROS excludes education, it does collect data on vocational training allowances in terms of cash benefits and benefits in kind (16) under the unemployment function.
(15) Belgium, Denmark, Germany, Estonia, Spain, France, Italy, Latvia, Lithuania, Hungary, the Netherlands,
Poland, Slovenia, Finland, Sweden and the UK, as well as in Norway and Romania. (16) According to the ESSPROS methodology, cash benefits is a benefit paid in cash, and that does not require
evidence of actual expenditure by the recipients. In contrast, benefits in kind are granted in the form of

71
Vocational training allowances are defined as ‘payments by social security funds or public agencies to targeted groups of persons in the labour force who take part in training schemes intended to develop their potential for employment’.
Vocational training in relation to benefits in kind are defined as ‘payments made by social security funds or public agencies to institutions which provide professional training to people without a job or at risk of losing their job shortly to develop their potential for further employment’.
It can be argued that the vocational training allowances data collected does not cover all types of vocational training allowances awarded, as the definition of vocational training applied in the methodology is restrictive. Vocational training is strictly defined and includes only programmes aimed at the unemployed or at workers at risk of losing their jobs, and financed by social security funds or public agencies. It excludes expenditure by employers on staff training and retraining. This type of training, which is in the interests of both employers and employees, is not within the scope of ESSPROS. Similarly, vocational training provided within the country’s education system, such as apprenticeships, is excluded as ESSPROS does not include an education function.
ESSPROS is complementary to the CVTS and the UOE data statistical exercise as it excludes:
(i) data on employers’ expenditure on staff training and retraining collected by the CVTS;
(ii) data on vocational training provided within the country’s education system, such as apprenticeships collected by the UOE data statistical exercise.
(k) EU labour-market policy database
The EU LMP database aims to collect detailed information on public interventions in the labour market. Public interventions refer to actions taken by general government involving expenditure, either in the form of actual disbursements or of foregone revenue (reductions in taxes, social contributions or other charges normally payable). The data collection is annual and, in the long term, can provide scope for a time-series.
There are three major limitations of the EU LMP database which currently make it difficult for this source to be part of a harmonised system: (i) only labour-market training is considered, and the funding can only be public. This
means that private funding for labour-market training is outside of the scope of this collection;
goods and services. They may be provided by way of reimbursement or directly. Reimbursements are benefits in the form of payments that reimburse the recipient in whole or in part for certified expenditure on specified goods and services. Directly provided benefits are goods and services granted without any pre-financing by the beneficiary.

72
(ii) the labour-market training measures must aim to benefit identifiable members of one or more of the following target groups: unemployed, employed at risk and inactive;
(iii) the VET concepts and definitions differ considerably from other sources.
Methodological work should be undertaken to ensure comparability in the concepts and definitions of education and training.
(l) National health interview surveys
Unfortunately, the only education data collected is related to educational attainment. Therefore, this source does not meet any of the data requirements for the system of harmonised VET statistics and indicators. The data come from non-harmonised national surveys, with countries asked by Eurostat to post-harmonise the data according to their guidelines. However, as the source already collects data on educational attainment by ISCED level, it could be examined whether it is possible to differentiate vocational education from general education. This source could provide information on the outcomes of VET in relation to the impact on health of VET.
(m) Structural business statistics
Structural business statistics describe the economy by observing the activity of units engaged in an economic activity. This source stopped collecting data on VET from 2002 following a change in methodology. Given the scope of this source, it is difficult to propose collecting data on a particular aspect of VET.
(n) Community survey of ICT usage in enterprises
The aim of this survey is the timely provision of statistics on enterprises and the information society. This module provides a framework for the requirements in terms of coverage, duration and periodicity, subjects covered, breakdowns of data provision and any necessary pilot studies. This module covers business activities within sections D to K and division 92 of NACE Rev. 1.1), section J been included for some years.
One of the questions in this module asked enterprises whether they provided training to develop or upgrade the ICT related skills of their personnel during the previous year (2006). The question differentiated between training for ICT/IT specialists and training for users of ICT.
While this survey focuses on ICT use in enterprises, it could be proposed to collect background information on participation in CVT and IVT, by collecting more information on the vocational training of employees in ICT. Some of the background data could then be used to complete gaps for the years when the CVTS is not conducted. To achieve this, methodological work would be needed on the VET concepts and definitions applied as well as on the NACE categories covered by the survey.
(o) Community survey of ICT usage in households
The aim of this survey is the timely provision of statistics on individuals, households and the information society. This module provides a framework for the requirements in terms of coverage, duration and periodicity, subjects covered, breakdowns of data provision

73
and any necessary pilot studies. The data collected in this survey relates to education and ICT. The only variable related to VET, which was collected until 2007, was whether the individual obtained their Internet-related skills through vocational training courses at the demand of the employer.
(p) UOE data collection on education systems
The UOE data collection on education systems aims to provide internationally comparable data on key aspects of education systems. It is based on the ISCED. The UOE data collection on education systems is annual, covers all the Member States and mainly the period 1998 and onwards. Limited data on enrolments, graduates and finance are available since 1990 or 1995. Formal education as defined by ISCED is fully covered by the collection.
Programmes or studies designated as ‘adult education’ not similar to regular education programmes are not included (including courses or classes for general interest or personal enrichment and or leisure classes). In these types of programmes, students are assigned to the most appropriate ISCED level. Adult education is not treated as a separate level of education. In many countries, private expenditure on education contained in some indicators is not comprehensive.
The timeliness of the data supplied varies for the different types of variables collected. The time lag for the collection of data on finance is two years after the end of the reference financial year, corresponding usually to the calendar year. Indicators are then made available in the Eurostat website within six months of the deadline.
Since 2005, data is collected separately on general education and vocational education for several variables. This includes enrolments, finance, graduates, and education personnel.
6.5. Improving methodologies
Table 20 shows the data sources that could potentially be included in a harmonised modular system of VET statistics. In the short term, only two sources are harmonised enough to be included: the CVTS and UOE data collection on education systems.
These two sources can already be used to provide data for the VET system. Each of these sources collects data from different angles. The CVTS is a survey of enterprises, while the UOE takes on board every angle to try to describe the education system. While the UOE collects annual data, the CVTS collects data only once every five years, which can be considered harmonised. Together, these two sources meet a few, but not all, data requirements (identified in Chapter 2) to describe the VET system.

74
Table 20: Sources to include in the harmonised modular system in short, medium and long term
Source Short term Medium term Long term
AES X CVTS X Community survey of ICT usage in enterprises X EU LFS X Eurostat harmonised HBS X Eurostat HETUS X EU-SILC X EU LCS X EU LMP database X ESSPROS X National health interview surveys X UOE data collection X
Other data sources identified could potentially be part of the modular system of VET statistics in the medium to long term. However, methodological work needs to be undertaken to consider them harmonised.
First is harmonising the definitions and concepts of education and training, as there is no homogeneity, especially on VET. Chapter 3 shows the extent to which concepts and definitions vary between sources. There is no single concept/definition adopted in the European statistical system for each of the following:
(a) CVT;
(b) institutional training;
(c) workplace training;
(d) alternance training;
(e) apprenticeship;
It is important to reach a consensus on the above definitions to achieve a certain level of comparability. A starting point could be the definitions adopted in the CVTS and the suspended Eurostat VET data collection (Table 21).

75
Table 21: Proposed definitions for VET terms in the harmonised system
Type of VET Data source Definition
CVT CVTS
CVT is a training measure, or activity, having as its primary objective the acquisition of new competences or the development and improvement of existing ones. It is financed at least partly by enterprises either for those having a working contract or benefiting directly from their work for the enterprise, such as unpaid family workers and casual workers. The employed with apprenticeship or training contract may not be considered. The training measures or activities should be planned and should be organised or supported with the special goal of learning. Random learning and IVT are explicitly excluded.
Institutional training
Eurostat VET data collection (discontinued)
in an education/training institution: 90 % and more of the training hours spent in a school/college, a training centre, or combination of both places.
mainly in an education/training institution with some time spent at the workplace: between 75 % and less than 90 % of the training hours spent in a school/college or a training centre, and the rest of the time spent in a working environment (enterprise or other).
Workplace training
Eurostat VET data collection (discontinued)
mainly at the workplace with some time spent in an education/training institution: between 75 % and less than 90 % of the training hours spent in a working environment (enterprise or other), the rest of the time spent in school/college or a training centre;
in the workplace: less than 10 % of learning time in an education/training institution.
Alternance training
Eurostat VET data collection (discontinued)
Time shared between an education/training institution and the workplace: less than 75 % of the training time is spent in a school/college or a training centre, the rest of the time spent in a working environment or vice versa.
CVTS
In the latest CVTS3 methodology, apprenticeship is defined in terms of IVT. IVT is a work-based training measure or activity for apprentices/trainees leading to a formal qualification. The measures are often financed (partly or wholly) by the enterprise, although this is not a mandatory condition. Apprentices/trainees often have a special training contract. Apprenticeship
Eurostat VET data collection (discontinued)
Alternate programmes, the participants of which receive a salary/wage for their participation in the programme and are linked (either directly or via their education/training institution) to the employer by a contract or an agreement.
Reaching a consensus on the categories of economic activities to use in NACE for surveys of enterprises is also a goal: surveys of enterprises include the CVTS and the LCS. Although the CVTS collects a wealth of information on VET it is only conducted once every five years. In theory the LCS could be used to complete gaps for some variables. However, the surveys use different categories of NACE economic activities to classify enterprises. The CVTS covers enterprises whose activity is classified by NACE sections C to K and O, whereas the LCS covers all enterprises classified by NACE sections C to O (Table 22). Therefore, it is essential that agreement is reached on the NACE sections to be used in the modular system for all sources.

76
Table 22: Coverage of economic activities in the CVTS and the LCS
NACE Name CVTS LCS C Mining and quarrying ● ● D Manufacturing ● ● E Electricity, gas and water supply ● ● F Construction ● ●
G Wholesale and retail trade; repair of motor vehicles, motorcycles and personal and household goods ● ●
H Hotels and restaurants ● ● I Transport, storage and communication ● ● J Financial intermediation ● ● K Real estate, renting and business activities ● ● L Public administration and defence; compulsory social security ● M Education ● N Health and social work ● O Other community, social and personal service activities ● ● P Activities of households Q Extra-territorial organisations and bodies
Collection of data on VET from surveys of individuals and households raises the problem of distinguishing general education from the different types of VET. The forthcoming EU LFS ad hoc module on entry of young people into the labour market will attempt to differentiate general from vocational education. This survey needs to be examined to determine whether the methodology can be adopted for other surveys of individuals and households such as the AES, the EU-SILC, etc.
There are gaps to be filled in describing the VET process: some modules could be inserted in existing sources. Even if they provide information on particular missing aspects of VET, these modules would only be one-off and would not altogether solve the problem of a harmonised system of VET statistics. Examples of possible modules are:
(a) community survey of ICT use in enterprises is conducted annually. A module, collecting data on the vocational training of employees in ICT could be added; this module could also collect background information on participation in CVT and IVT in enterprises and on the costs of CVT.
(b) Eurostat harmonised HBS could collect data on household expenditure on vocational training. This should be based on the list of Eurostat educational goods and services to ensure comparability in the data collected. However, methodological work should be undertaken on the feasibility of distinguishing vocational from general education;
(c) UOE data collection on education systems. A module could be added requesting information on VET educational providers and teachers. It has been shown in the statistical audit that the UOE can be one of the main vehicles for collecting more information on VET. However, before making suggestions for a module it is first necessary to evaluate the data collected in relation to the recent changes in the methodology. Since 2005, the questionnaire requests that countries provide data for ISCED 2-4 split broken down by general, pre-vocational and vocational programmes for several tables (enrolments, finance, graduates, education personnel).

77
6.6. Illustrating the modular system statistically
It is still possible, to a degree, to illustrate the VET system statistically, even if further methodological work is necessary to improve harmonisation of VET data from different Eurostat sources. The data in this section comes mainly from the two sources considered harmonised, i.e. the CVTS, and the UOE data collection on education systems. However, other data from sources needing further methodological work are also presented.
The data is presented according to the main components of the VET system (Chapter 2): inputs, process, outputs and outcomes, and summarised in Table 23.

78
Tabl
e 23
: Ex
ampl
es o
f ind
icat
ors t
hat c
an b
e fo
rmed
from
exi
stin
g Eu
rost
at so
urce
s to
desc
ribe
the
VET
syst
em
Com
pone
nt
of V
ET
sy
stem
Su
b-co
mpo
nent
E
xam
ple(
s) o
f ind
icat
or
Sour
ce
Ente
rpris
es p
rovi
ding
any
oth
er fo
rm o
f tra
inin
g as
% o
f all
ente
rpris
es, b
y fo
rm o
f tra
inin
g (2
005)
for N
AC
E se
ctio
ns C
to K
and
O
Perc
enta
ge o
f em
ploy
ees (
all e
nter
pris
es) p
artic
ipat
ing
in C
VT
cour
ses (
2005
) for
NA
CE
sect
ions
C to
K a
nd O
CV
TS3
(pro
visi
onal
dat
a)
Num
ber o
f app
rent
ices
tota
l and
in fu
ll-tim
e un
its in
ent
erpr
ises
em
ploy
ing
mor
e th
an 1
0 pe
ople
(2
004)
for N
AC
E se
ctio
ns C
to O
, exc
ept L
EU
LC
S
Stud
ent a
nd
educ
atio
nal i
nstit
utio
n ch
arac
teris
tics
Num
ber o
f stu
dent
s in
pre-
voca
tiona
l and
voc
atio
nal e
duca
tion
in th
e EU
-27
(200
5) (i
n th
ousa
nds)
U
OE
data
col
lect
ion
on
educ
atio
n sy
stem
s D
irect
cos
ts o
f CV
T co
urse
s as %
of t
otal
labo
ur c
ost (
all e
nter
pris
es) (
2005
) for
NA
CE
sect
ions
C to
K a
nd O
C
VTS
3 (p
rovi
sion
al d
ata)
R
esou
rces
dev
oted
to
educ
atio
n V
ocat
iona
l tra
inin
g al
low
ance
s and
voc
atio
nal t
rain
ing
in p
urch
asin
g po
wer
stan
dard
per
in
habi
tant
(200
4)
ESSP
RO
S
Num
ber o
f stu
dent
s in
voca
tiona
l pro
gram
mes
by
ISC
ED le
vel,
stud
y in
tens
ity (f
ull-t
ime,
par
t-tim
e) (2
005)
Inpu
ts
Cur
ricul
a/
prog
ram
me
char
acte
ristic
s Th
eore
tical
dur
atio
n, c
umul
ativ
e ye
ars o
f voc
atio
nal e
duca
tiona
l ISC
ED 3
pro
gram
mes
(200
5)
UO
E da
ta c
olle
ctio
n on
ed
ucat
ion
syst
ems
Hou
rs in
CV
T co
urse
s per
em
ploy
ee (a
ll en
terp
rises
) (20
05) f
or N
AC
E se
ctio
ns C
to K
and
O
Proc
esse
s Le
arne
r tim
e al
loca
tion
Perc
enta
ge o
f the
tota
l hou
rs in
CV
T co
urse
s, by
type
of c
ours
e (2
005)
for N
AC
E se
ctio
ns C
to
K a
nd O
CV
TS3
(pro
visi
onal
dat
a)
Lear
ner a
ttain
men
t N
umbe
r of g
radu
ates
from
voc
atio
nal e
duca
tion
by IS
CED
leve
l in
the
EU-2
7 (2
005)
Num
ber o
f gra
duat
es fr
om v
ocat
iona
l pro
gram
mes
bro
ken
dow
n by
leve
l and
gen
der (
2005
)
Num
ber o
f gra
duat
es fr
om u
pper
seco
ndar
y ed
ucat
ion
(ISC
ED 3
) voc
atio
nal p
rogr
amm
es
(200
5)
Out
puts
Eq
uity
eff
ects
Num
ber o
f gra
duat
es fr
om p
ost s
econ
dary
edu
catio
n (I
SCED
4) v
ocat
iona
l pro
gram
mes
(200
5)
UO
E da
ta c
olle
ctio
n on
ed
ucat
ion
syst
ems
Out
com
es
Impa
ct o
n st
uden
ts
Job
mis
mat
ches
and
thei
r lab
our-
mar
ket e
ffec
ts a
mon
g sc
hool
leav
ers i
n Eu
rope
(200
0)
EU L
FS

79
6.6.1. Inputs
6.6.1.1. Characteristics of educational institutions
Characteristics of educational institutions include indicators such as number of institutions; number of personnel broken down by type (teachers, support staff, assistants, etc.); number of management personnel; number of new entrants by age and gender; number of students by age and gender; average class size, etc.
Table 24: Enterprises providing any other form of training as % of all enterprises, by form of training (2005) for NACE sections C to K and O
Country
Any type of other forms
CVT in work situation
Job rotation, exchanges or secondments
Learning/quality circles
Self-learning
Continued training at conferences, workshops,
lectures and seminars
BE 55 41 13 13 17 36 BG 24 17 3 4 5 15 CZ 59 42 4 9 17 46 DK 61 30 14 25 19 53 DE 66 48 9 16 15 58 EE 50 31 15 6 16 38 EL 13 6 3 5 3 8 ES 38 26 10 11 11 18 FR 44 29 10 8 9 23 LT 42 18 1 11 9 37 LU 64 44 14 19 21 49 HU 41 18 3 7 7 32 MT 43 31 10 11 12 30 NL 52 31 9 10 18 36 AT 71 32 19 28 13 64 PL 27 17 4 2 4 19 PT 36 22 4 4 3 24 RO 33 19 12 6 8 13 SK 49 32 3 8 9 35 SE 60 34 29 8 16 44 UK 86 75 27 20 36 60
Source: Eurostat – CVTS3 (provisional data).

80
Table 25: Percentage of employees (all enterprises) participating in CVT courses (2005) for NACE
sections C to K and O
Country %
EU-27 33 EU-25 34
BE 40 BG 15 CZ 59 DK 35 DE 30 EE 24 EL 14 ES 33 FR 46 IT 29 CY 30 LV 15 LT 15 LU 49 HU 16 MT 32 NL 34 AT 33 PL 21 PT 28 RO 17 SI 50 SK 38 FI 39 SE 46 UK 33 NO 29
Date of extraction: 2 May 2008. Source: Eurostat – CVTS3 (provisional data).
Table 26: Number of apprentices total and in full-time units in enterprises employing
more than 10 people (2004) for NACE sections C to O, except L
Country Total Full-time
BE 3 232 673 BG : : CZ 23 754 3 085 DK 38 581 36 583 DE 1 027 310 774 376 EE 0 0 IE 15 299 13 265 EL 9 883 6 021 ES 33 574 0 FR 183 907 158 816 IT 185 564 102 415 CY 20 0 LV 661 435 LT 500 252 LU 870 810 HU 1 936 379 MT 855 486 NL : : AT 85 445 84 025 PL 56 229 51 171 PT 21 762 21 509 RO 228 189 SI : : SK 92 524 80 551 FI 3 786 3 786 SE 0 0 UK 701 843 500 642 HR 0 0 IS 385 312
NO 14 489 : Date of extraction: 24 June 2008. : not available, confidential or unreliable value 0 less than half the final digit shown and greater than real zero Source: Eurostat – LCS.

81
Table 27: Number of students in pre-vocational and vocational education in the EU-27 (2005, in thousands)
ISCED 2 (lower secondary or second
stage of basic education) ISCED 3 (upper secondary education)
ISCED 4 (post-secondary non-tertiary
education) Country Vocational
programmes Pre-vocational programmes
Vocational programmes
Vocational programmes
EU-27 248.0 1 203.0 14 561.6 1 282.9 BE 162.7 – 535.5 51.3 BG 7.0 – 205.3 4.1 CZ – 0.7 391.4 56.6 DK – – 125.6 – DE – – 1 709.6 444.5 EE 0.3 – 18.9 10.8 IE – 44.9 5.6 74.2 EL – – 137.3 36.6 ES 8.5 – 478.9 – FR – – 1 525.7 24.8 IT – 992.9 676.5 57.9 CY – – 4.4 – LV 1.4 – 39.1 3.9 LT 6.6 – 29.8 10.2 LU – – 12.1 0.9 HU 2.0 59.1 71.4 75.4 MT – – 4.4 2.1 NL 50.3 – 443.0 7.5 AT – 23.6 276.4 73.4 PL – – 951.9 268.8 PT 9.1 77.4 39.6 RO – – 693.3 48.7 SI – – 80.1 0.4 SK 0.1 231.9 4.7 FI – 213.1 17.7 SE – 4.4 283.9 8.6 UK – – 5 377.1 –
– not applicable or zero by default Source: Eurostat– UOE data collection on education systems.
6.6.1.2. Resources devoted to education
This includes: expenditures on education by source of finance (government, enterprises, households); expenditures on education by type of transaction (spending on education institutions, grants and loans to students, etc.); education expenditures of education institutions (current and capital expenditures).

82
Table 28: Direct costs of CVT courses as % of total labour cost (all
enterprises) (2005) for NACE sections C to K and O
Country %
EU-27 0.7 EU-25 0.7
BE 0.5 BG 0.7 CZ 0.9 DK 1.2 DE 0.7 EE 1.1 EL 0.3 ES 0.5 FR 0.8 IT 0.4 CY 0.6 LV 0.5 LT 0.7 LU 1.0 HU 0.9 MT 1.2 NL 1.2 AT 0.8 PL 0.7 PT 0.5 RO 0.7 SI 1.1 SK 1.0 FI 0.8 SE 0.9 UK 0.9 NO 0.6
Date of extraction: 2 May 2008. Source: Eurostat – CVTS3 (provisional data).
Table 29: Vocational training allowances and vocational training in purchasing power standard per inhabitant (2005)
Vocational training allowances
Vocational training
Country Periodic benefits
Lump sum
Benefits in kind
EU-27 27.4 0.3 16.2 BE 20.3 : 7.3 BG 0.8 : 2.0 CZ 1.6 : 2.2 DK 307.9 : : DE 68.4 : 9.8 EE 0.8 : 5.0 IE 54.9 : 37.7 EL 0.2 : 120.5 ES 7.4 : 62.4 FR 34.3 : : IT : : 5.6 CY : : 2.4 LV 0.4 : 8.2 LT 1.4 : 3.9 LU : 42.8 15.1 HU : : 4.7 MT 6.6 : 7.1 NL 0 : : AT 40.9 : 33.8 PL 0.2 : 1.7 PT : : : RO : : 1.0 SI 5.2 : 6.6 SK : : : FI 35.0 : 39.4 SE 106.4 : 36.1 UK 2.4 1.6 27.4
Date of extraction: 24 June 2008. : not available, confidential or unreliable value Source: Eurostat – ESSPROS.
6.6.1.3. Curricula/programme characteristics Curricula/programme characteristics include average duration of programme in days/hours; time spent in institution/workplace; and whether the programme is full or part-time.

83
Table 30: Number of students in vocational programmes by ISCED level, study intensity (full-time, part-time) (2005)
ISCED 2 ISCED 3 ISCED 4 Country
Full-time Part-time Full-time Part-time Full-time Part-time
EU-27 98 836 149 181 9 884 158 4 677 469 1 011 951 271 601 BE 20 594 142 069 291 801 243 716 30 821 20 469 BG 2 142 4 888 200 909 4 423 1 296 2 803 CZ – – 391 355 – 45 874 10 704 DK – – 125 366 212 – – DE – – 1 709 609 – 444 465 – EE 267 – 18 886 – 8 847 1 915 IE – – 5 623 – 61 056 13 122 EL – – 120 288 17 045 36 599 – ES 8 455 – 305 757 173 102 – – FR – – 1 525 689 – 24 790 – IT – – 676 473 – 57 906 – CY – – 4 308 100 – – LV 1 421 – 38 299 787 3 182 752 LT 6 648 – 29 835 – 10 164 – LU – – 12 024 30 931 – HU 2 016 – 69 247 2194 56 761 18 640 MT – – 2 207 2151 2 062 – NL 48 039 2 224 429 535 13 457 7 399 56 AT – – 276 362 : 73 363 : PL – – 810 467 141 446 72 169 196 625 PT 9 142 – 39 597 – : – RO – – 673 441 19 899 48 693 – SI – – 61 788 18 267 293 138 SK 112 – 223 507 8 377 3 007 1 714 FI – – 213 055 – 17 665 – SE – – 221 934 61 936 4 608 4 663 UK – – 1 406 796 3 970 327 : : HR – 12 556 141 711 4251 – – MK – – 58 059 : – 405 TR – – 1 102 394 309 962 – –
Date of extraction: 26 May 2008. : not available, confidential or unreliable value – not applicable or zero by default Source: Eurostat – UOE data collection on education systems.

84
6.6.2. Processes
6.6.2.1. Learner time allocation
Learner time allocation refers to the amount of time that the learner devotes to VET in an institution/workplace or elsewhere. The level of absenteeism should also be considered.
Table 31: Percentage of the total hours in CVT courses, by type of course, (2005) for NACE sections
C to K and O
Country % EU-27 9 EU-25 9
BE 12 BG 4 CZ 14 DK 10 DE 9 EE 7 EL 3 ES 9 FR 13 IE : IT 7 CY 7 LV 4 LT 5 LU 16 HU 6 MT 11 NL 12 AT 9 PL 6 PT 7 RO 5 SI 14 SK 12 FI 10 SE 15 UK 7 NO 9
Date of extraction: 2 May 2008. Source: Eurostat – CVTS3 (provisional data).
Table 32: Hours in CVT courses per employee (all enterprises)
(2005) for NACE sections C to K and O
Country Internal course
External course
EU-27 53 47 EU-25 52 48
BE 60 40 BG 62 38 CZ 56 44 DK 41 59 DE 63 37 EE 33 67 EL 33 58 ES 59 41 FR 37 64 IT 61 39 CY 44 55 LV 47 53 LT 45 55 LU 57 43 HU 32 68 MT 68 32 NL 42 58 AT 49 51 PL 45 55 PT 48 52 RO 73 27 SI 55 53 SK 44 56 FI 53 47 SE 51 49 UK 56 44 NO 66 34
Data of extraction: 24 June 2008. Source: Eurostat – CVTS3 (provisional data).

85
6.6.3. Outputs
6.6.3.1. Learner attainment
There are several indicators that can be used to measure learner attainment, including the number of graduates.
Table 33: Number of graduates from vocational education by ISCED level in the EU-27 (2005)
ISCED 3 (upper secondary education) ISCED 4 (post-secondary non-tertiary education) Country
Pre-vocational programmes Vocational programmes Vocational programmes
BE – 72 958 24 030 BG – 35 294 847 CZ 722 93 168 23 612 DK – 29 292 – DE – 572 780 130 818 EE – 3 696 3 843 IE 68 374 – 8 702 EL – 48 853 14 672 ES – 167 577 – FR : : : IT 188 999 207 162 41 692 CY – 1 215 – LV – 7 427 2 130 LT 20 6 883 4 060 LU – 2 495 136 HU : 24 486 34 612 MT – – – NL – 127 878 2 559 AT – 53 105 28 899 PL – 280 838 92 111 PT 8 007 7 851 : RO – 242 725 18 530 SI – 20 863 178 SK – 61 760 2 526 FI – 52 489 3 541 SE – 45 069 875 UK : : : HR – 38 144 – MK – 15 446 405 TR – 211 323 –
Date of extraction: 26 May 2008. : not available, confidential or unreliable value – not applicable or zero by default Source: Eurostat – UOE data collection on education systems.

86
6.6.3.2. Equality effects
The type of information collected here should include indicators on learner attainment (e.g. number of graduates) cross-referenced by particular characteristics such as gender, ethnicity or age groups.
Table 34: Number of graduates of vocational programmes by ISCED level and gender (2005)
ISCED 3 (upper secondary education) ISCED 4 (post-secondary non-tertiary education) Country
Males Females Males Females
BE 35 505 37 453 11 110 12 920 BG 21 221 14 073 339 508 CZ 49 970 43 198 12 349 11 263 DK 13 015 16 277 – – DE 304 157 268 622 71 551 59 267 EE 2 403 1 293 1 499 2 344 IE – – 7 162 1 540 EL 28 401 20 452 7 133 7 539 ES 79 477 88 100 – – FR : : : : IT 107 871 99 291 16 260 25 432 CY 983 232 – – LV 4 554 2 873 816 1 314 LT 4 064 2 819 1 587 2 473 LU 1 249 1 246 114 22 HU 15 590 8 896 16 340 18 272 MT – – – – NL 63 385 64 493 1 905 654 AT 32 375 20 730 11 043 17 856 PL 169 755 111 083 35 796 56 315 PT 4 153 3 698 : : RO 140 894 101 831 6 676 11 854 SI 10 892 9 971 38 140 SK 33 233 28 527 1 420 1 106 FI 24 109 28 380 1 643 1 898 SE 24 738 20 331 393 482 UK : : : : HR 20 627 17 517 – – MK 9 121 6 325 352 53 TR 124 659 86 664 – –
Date of extraction: 26 May 2008. : not available, confidential or unreliable value – not applicable or zero by default Source: Eurostat – UOE data collection on education systems.
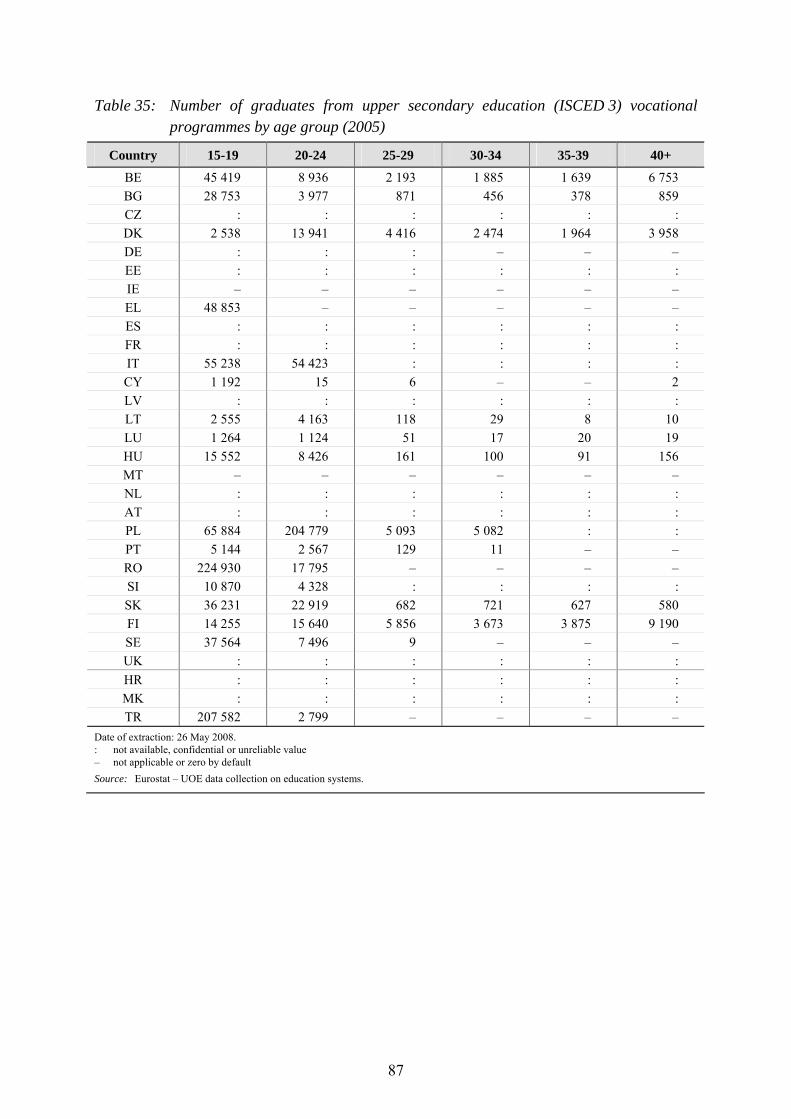
87
Table 35: Number of graduates from upper secondary education (ISCED 3) vocational programmes by age group (2005)
Country 15-19 20-24 25-29 30-34 35-39 40+
BE 45 419 8 936 2 193 1 885 1 639 6 753 BG 28 753 3 977 871 456 378 859 CZ : : : : : : DK 2 538 13 941 4 416 2 474 1 964 3 958 DE : : : – – – EE : : : : : : IE – – – – – – EL 48 853 – – – – – ES : : : : : : FR : : : : : : IT 55 238 54 423 : : : : CY 1 192 15 6 – – 2 LV : : : : : : LT 2 555 4 163 118 29 8 10 LU 1 264 1 124 51 17 20 19 HU 15 552 8 426 161 100 91 156 MT – – – – – – NL : : : : : : AT : : : : : : PL 65 884 204 779 5 093 5 082 : : PT 5 144 2 567 129 11 – – RO 224 930 17 795 – – – – SI 10 870 4 328 : : : : SK 36 231 22 919 682 721 627 580 FI 14 255 15 640 5 856 3 673 3 875 9 190 SE 37 564 7 496 9 – – – UK : : : : : : HR : : : : : : MK : : : : : : TR 207 582 2 799 – – – –
Date of extraction: 26 May 2008. : not available, confidential or unreliable value – not applicable or zero by default Source: Eurostat – UOE data collection on education systems.

88
Table 36: Number of graduates from post-secondary non-tertiary education (ISCED 4) vocational programmes by age group (2005)
Country 15-19 20-24 25-29 30-34 35-39 40+ BE 10 663 8 991 1 360 950 756 1 309 BG 7 325 271 71 56 117 CZ : : : : : : DK – – – – – – DE – : : – – – EE : : : : : : IE 3 660 2 774 2 268 – – – EL 1 477 9 892 1 975 1328 : : ES – – – – – – FR : : : : : : IT 626 12 719 12 093 7471 2 372 6 411 CY – – – – – – LV : : : : : : LT 465 3 157 189 106 83 60 LU – 36 46 29 16 9 HU 5 354 23 403 1 956 1 455 1 147 1 297 MT – – – – – – NL : : : : : : AT : : : : : : PL 469 68 426 10 567 12 649 : : PT : : : : : : RO – 18 530 – – – – SI 5 89 : : : : SK 55 1 303 677 251 152 88 FI – 111 357 487 656 1 930 SE 22 229 191 147 134 152 UK : : : : : : HR – – – – – – MK : : : : : : TR – – – – – –
Date of extraction: 26 May 2008. : not available, confidential or unreliable value – not applicable or zero by default Source: Eurostat – UOE data collection on education systems.
6.6.4. Outcomes
6.6.4.1. Impact on students
There are several indicators that can be used to measure the impact on students including job mismatches.

89
Table 37: Job mismatches (a) and their labour-market effects among school leavers in Europe (2000)
Country Participation in CVT by job mismatch (%) Participation in CVT by job match (%)
BE 9 11 DK 14 18 EL – 1 ES 1 1 FR 5 5 IT 0.4 0.4
HU 7 5 NL 12 9 AT 7 10 SI 8 4 FI 21 23 SE 8 15
– not applicable or zero by default (a) job mismatch is defined as a discrepancy between the current occupation a school-leaver is working in and the field of education
attended. Individuals working outside their field of education are treated as school-leavers with a non-matching job. Source: Eurostat – calculated from the EU LFS and the ad hoc module on the transition from school to working life (the sample was
restricted to persons who attended a vocational programme before leaving initial education for the first time).

90
7. List of abbreviations
AES Adult education survey
CIS Community innovation survey
COICOP Classification of individual consumption by purpose
COICOP-HBS Classification of individual consumption by purpose adapted to the needs of household budget surveys
CVT Continuing vocational training
CVTS Continuing vocational training survey
ESSPROS European system of integrated social protection statistics
EU LFS European Union labour force survey
EU LMP European Union labour-market policy
EU-SILC EU survey on income and living conditions
HBS Household budget survey
HETUS Harmonised European time use survey
ISCED International standard classification of education
IVT Initial vocational training
LCS Labour cost survey
LFS Labour force survey
LLL Lifelong learning
LMP Labour-market policy
NACE Statistical classification of economic activities in the European Community
UOE Unesco-UIS/OECD/Eurostat
VET Vocational education and training

91
8. Country codes BE Belgium BG Bulgaria CZ Czech Republic DK Denmark DE Germany EE Estonia IE Ireland EL Greece ES Spain FR France IT Italy CY Cyprus LV Latvia LT Lithuania LU Luxembourg HU Hungary MT Malta NL Netherlands AT Austria PL Poland PT Portugal RO Romania SI Slovenia SK Slovakia FI Finland SE Sweden UK United Kingdom HR Croatia MK former Yugoslav Republic of Macedonia TR Turkey

92
9. Bibliography
Badescu, M. (JRC and CRELL). Measuring the outputs and outcomes of vocational training – towards a coherent framework for indicators. Luxembourg: Publications Office, 2006 (CRELL research paper; 2).
Cedefop; Tissot, P. Terminology of vocational training policy: a multilingual glossary for an enlarged Europe. Luxembourg: Publications Office, 2004.
Council of EU. Council decision of 29 May 1990 establishing an action programme for the development of continuing vocational training in the European Community (force) (90/267/EEC). Official Journal of the European Community, 21 June 1990, L 156, p. 1-7.
Council of EU. Presidency conclusions: Lisbon European Council, 23 and 24 March 2000. Brussels: General secretariat of the Council of the EU, 2000.
Council of EU. Detailed work programme on the follow-up of the objectives of education and training systems in Europe. Official Journal of the European Communities, 14 June 2002, C 142, p. 1-22.
Council of EU. Council resolution of 19 December 2002 on the promotion of enhanced European cooperation in vocational education and training. Official Journal of the European Communities, 18 January 2003, C 13, p. 2-4.
Council of EU, Press release: 2616th Council meeting: education, youth and culture. Brussels: Council of the European Union, 2004 (14380/04, Presse 310).
Council of EU. Council conclusions of 24 May 2005 on new indicators in education and training (2005/C141/04). Official Journal of the European Union, 10 June 2005, C 141, p. 7-8.
Council of EU. Council conclusions on a coherent framework of indicators and benchmarks for monitoring progress towards the Lisbon objectives in education and training. Brussels: Council of the European Union, 2007 (10083/07).
Council of EU and European Commission. Education and training 2010: the success of the Lisbon strategy hinges on urgent reforms: joint interim report of the Council and the Commission on the implementation of the detailed work programme on the follow-up of the objectives of education and training systems in Europe. Brussels: European Commission, 2004.
European Commission. Declaration of the European Ministers of vocational education and training, and the European Commission convened in Copenhagen on 29 and 30 November 2002, on enhanced European cooperation in vocational education and training. Brussels: European Commission, 2002.
European Commission. Communication from the Commission: making a European area of lifelong learning a reality. Luxembourg: Publications Office, 2001 (COM(2001) 678 final).

93
European Commission. Maastricht communiqué on the future priorities of enhanced European cooperation in vocational education and training (VET): review of the Copenhagen declaration of 30 November 2002. Brussels: European Commission, 2004.
European Commission. Commission Regulation (EC) No 384/2005 of 7 March 2005 adopting the programme of ad hoc modules, covering the years 2007 to 2009, for the labour force sample survey provided for by Council Regulation (EC) No 577/98. Official Journal of the European Union, 8 March 2005, L 61, p. 23-24.
European Commission. The Helsinki communiqué on enhanced European cooperation in vocational education and training: communiqué of the European Ministers of vocational education and training, the European social partners and the European Commission, convened in Helsinki on 5 December 2006 to review the priorities and strategies of the Copenhagen process. Brussels: European Commission, 2006a.
European Commission. Communication from the Commission to the Council and to the European Parliament: efficiency and equity in European education and training systems. Brussels: European Commission, 2006b (COM(2006) 481 final). Available from Internet: http://ec.europa.eu/education/policies/2010/doc/comm481_en.pdf [cited 9.4.2008].
European Commission. Communication from the Commission: a coherent framework of indicators and benchmarks for monitoring progress towards the Lisbon objectives in education and training. Luxembourg: Publications Office, 2007a (COM(2007) 61 final).
European Commission. Commission Regulation (EC) No 102/2007 of 2 February 2007 adopting the specifications of the 2008 ad hoc module on the labour market situation of migrants and their immediate descendants, as provided for by Council Regulation (EC) No 577/98 and amending Regulation (EC) No 430/2005. Official Journal of the European Union, 3 February 2007b, L 28, p. 3-7.
European Parliament; Council of EU. Regulation (EC) No 1552/2005 of the European Parliament and of the Council of 7 September 2005 on statistics relating to vocational training in enterprises. Official Journal of the European Union, 30 September 2005, L 255, p. 1-5.
Eurostat. Guidelines for the collection of data on 18 HIS items. Luxembourg: Eurostat, 2004.
ILO – International Labour Organization. Resolution concerning statistics of the economically active population, employment, unemployment and underemployment, adopted by the Thirteenth international conference of labour statisticians. Geneva: ILO, Bureau of Statistics, 1982.
Unesco. NFE-MIS handbook: developing a sub-national non-formal education management information system. Paris: UNLD-Life, 2005.
Unesco. International standard classification of education – ISCED 1997. Montreal: UIS –Unesco Institute for Statistics: 2006.

94
Annex 1: Reconciliation of Eurostat VET and UOE data collections
Eurostat VET data collection
The Eurostat VET data collection was a standardised collection of VET programmes in the EU. A vocational education programme was defined as ‘any activity whose aim is to promote the acquisition of the necessary knowledge, skills and attitudes for the exercise of an occupation or group of occupations’.
The data collection started in 1995 (with reference year 1993/94) and was organised jointly by Eurostat and Cedefop, in the framework of the Leonardo da Vinci programme. The exercise was initially designed to respond to policy requests (in particular to seek alternatives to academic routes), as a tool for policy-makers, which could help them to design, monitor and evaluate national training policies. One of the advantages of the VET data collection was the ability to produce indicators by type of programme. In 2000, due to lack of resources, the VET data collection was suspended by Eurostat. Programmes included in the data collection were defined according to several criteria.
For the first collection (1993/94), four categories of programme were established on the basis of the target population of the programme:
(a) programmes for IVT (for the young people of school age);
(b) training programmes for adults;
(c) pre-vocational training programmes (identified as such by the names and descriptions given to the programmes);
(d) education/training programmes for disadvantaged persons (including programmes for the unemployed, whatever their age, young unemployed people, physically or mentally disabled, foreigners).
The coverage proved complete only for the first category. For the 1994/95 and 1995/96 collections, it was decided to eliminate the distinction between ‘initial education and training’ and ‘training for adults’. These two categories were merged in one category ‘vocational training’.
Presenting the IVT systems without considering the pre-vocational programmes was inadequate, so it was decided to improve the coverage of this category. The term ‘pre-vocational’ in the name of the programme is not sufficient to determine whether or not the programme belongs in the ‘pre-vocational’ category, since the aim of the VET initiative was to find joint definitions (and not to stick to national terminology) and to make the data comparable.

95
Data on programmes for the disabled was not available in all countries or was difficult to locate. Given the difficulties in collecting this type of data and the fact that the questionnaire was not designed to collect this category of programmes, it was decided to postpone collecting data on the disabled. The target population was maintained as a question simply to have the description of the programme included in the database. Programmes at ISCED 5A and 6 levels (higher education) were excluded from this data collection since the objective of the initiative was to seek alternatives to university education. The following table defined the three categories of programmes included in the data collection.
Table 38: Criteria determining the allocation of programmes into the different categories in the VET data collection (a)
Pre-vocational Vocational Post-vocational
Does not provide full set of skills Provides full set of skills Does not provide full set of skills >= 300 hours >= 600 hours >= 300 hours
ISCED <= 3 Any ISCED level, but usually ISCED >=3 ISCED >= 3
Prepares specifically for further education and training Does not prepare specifically for
further education and training Does not prepare specifically for the exercise of a job or a set of jobs
Prepares specifically for the exercise of a job or a set of jobs
Prepares specifically for the exercise of a job or a set of jobs
Does not lead to a labour-market relevant vocational qualification
Leads to a labour market relevant vocational qualification
Leads to a labour market relevant vocational qualification
(a) Distance learning programmes and programmes for disadvantaged persons to be included in the relevant category according to the applicable criteria.
UOE data collection on education systems
The objective of the UOE data collection is to provide internationally comparable data on key aspects of education systems, specifically on participation and completion of education programmes, and cost and type of resources dedicated to education. The coverage of vocational and technical training in the statistics is dependent on where the training takes place: at school, in the workplace or a combination of both. The following programmes are included:
(a) solely school-based vocational and technical training, in the same way any other school based study is covered in the statistics;
(b) combined school- and work-based programmes (such as dual-system apprenticeship), both the school- and work-based components are included if:
(i) they are explicitly deemed to be parts of the education system and an education authority has oversight of them;
(ii) the school-based component accounts for at least 10 % of the study over the whole length of the programme.

96
All training of employees by their employers should be excluded from the reported statistics as should vocational and technical training conducted solely in enterprises. The following types of training are also excluded:
(a) work-based study or combined school- and work-based study in which the work-based component represents 90 % or more of the total study over the whole length of the programme and for which no education authority has oversight;
(b) training of employees by their employers unless there is an element of school-based study associated with it, which represents 10 % or more of the total study.
The UOE collects data on levels of education according to the ISCED 97 to produce internationally comparable education statistics and indicators. Since 2002 a regular update of national ISCED mappings into the UOE data collection is made through the ISCMAP-PROG questionnaire. Since 2005, limited sets of data on specific subjects are collected through a small number of additional tables (ad hoc modules). The subjects of the modules change from year to year, though some subjects may be regularly repeated. For example, in 2005 a table on ‘estimating tertiary survival rates’ was added.
VET versus UOE
Table 39 summarises all the variables collected in the last VET data collection and currently collected by the UOE. As the UOE collects information by ISCED level it can easily be reported that the information is still being collected, even if the focus of the Eurostat VET collection was national programmes. Data on programmes at the national level (whether or not they can be classified by ISCED) are collected in the ISCMAP-PROG and ISCMAP-QUAL questionnaires in the UOE.
Several variables of the VET collection are still being collected by the UOE or are now collected due to recent changes in the questionnaires (especially ISCMAP-PROG and ISCMAP-QUAL). Some variables, such as whether the programme is designed to meet the specific needs of disadvantaged persons, can only be partially available in the UOE. Information lost due to the suspension of the VET data collection includes:
(a) percentage of time spent in each situation;
(b) authorities in charge of setting the educational/training objectives;
(c) minimum qualification required (level and pedagogical training) for teachers and trainers;
(d) destination of participants directly after successful completion of this programme.

97
Tabl
e 39
: C
ompa
riso
n of
var
iabl
es c
olle
cted
in th
e U
OE
data
col
lect
ion
and
the
disc
ontin
ued
VET
data
col
lect
ion
Dis
cont
inue
d V
ET
dat
a co
llect
ion
UO
E d
ata
colle
ctio
n
Var
iabl
e C
omm
ent
Var
iabl
e C
omm
ent
Rec
onci
liatio
n
01
Obj
ectiv
es o
f the
pro
gram
me
Def
ines
kno
wle
dge,
skill
s and
at
titud
es p
artic
ipan
ts sh
ould
hav
e ac
quire
d by
the
end
of th
e pr
ogra
mm
e. T
his q
uest
ion
was
m
eant
to m
ake
a co
mpa
rison
with
U
OE
data
col
lect
ion
poss
ible
.
Non
e
Dat
a on
edu
catio
nal p
rogr
amm
es a
re
colle
cted
by
ISC
ED 9
7, o
rgan
ised
to
acco
mpl
ish
pred
eter
min
ed o
bjec
tives
. Fo
r exa
mpl
e, p
repa
ratio
n fo
r adv
ance
d st
udy,
qua
lific
atio
n fo
r occ
upat
ion,
or
incr
easi
ng k
now
ledg
e.
Col
lect
ed
02
Plac
e in
the
natio
nal e
duca
tion
syst
em
Posi
tion
in th
e na
tiona
l de
gree
/qua
lific
atio
n st
ruct
ure
(inte
rmed
iate
, firs
t, se
cond
, etc
.). P
ositi
on in
the
terti
ary
educ
atio
n st
ruct
ure
(bac
helo
rs, m
aste
r, Ph
D).
This
refe
rs to
pro
gram
mes
C
olle
cted
03
Spec
ific
feat
ures
of t
he
prog
ram
me
yea
r pro
gram
me
crea
ted;
y
ear q
ualif
icat
ion
intro
duce
d;
ISC
ED le
vel o
f qu
alifi
catio
n.
C
olle
cted
04
Prog
ram
me
prov
ides
pa
rtici
pant
s with
the
full
set o
f co
mpe
tenc
es n
eces
sary
for
empl
oym
ent i
n a
parti
cula
r oc
cupa
tion
or tr
ade
or c
lass
of
occu
patio
ns o
r tra
des.
N
one
By
usin
g IS
CED
97,
the
UO
E es
tabl
ishe
d au
xilia
ry c
riter
ia a
s pro
xies
, in
clud
ing
the
degr
ee to
whi
ch th
e pr
ogra
mm
e is
spec
ifica
lly o
rient
ed
tow
ards
a c
lass
of o
ccup
atio
ns o
r tra
des
and
is g
ener
ally
orie
nted
tow
ards
an
imm
edia
te tr
ansi
tion
to th
e la
bour
m
arke
t.
This
info
rmat
ion
is p
artia
lly
colle
cted
05
Prog
ram
me
lead
s to
a la
bour
m
arke
t rel
evan
t voc
atio
nal
qual
ifica
tion
reco
gnis
ed b
y th
e co
mpe
tent
aut
horit
ies.
N
one
By
usin
g IS
CED
97,
it c
an b
e as
sum
ed
that
the
qual
ifica
tion
is re
cogn
ised
. C
olle
cted

Dis
cont
inue
d V
ET
dat
a co
llect
ion
UO
E d
ata
colle
ctio
n
Var
iabl
e C
omm
ent
Var
iabl
e C
omm
ent
Rec
onci
liatio
n
06
Prog
ram
me
desi
gned
to p
repa
re
spec
ifica
lly fo
r the
exe
rcis
e of
a
parti
cula
r occ
upat
ion
or tr
ade,
or
clas
s of o
ccup
atio
ns o
r tra
des
N
one
By
usin
g IS
CED
97,
the
UO
E es
tabl
ishe
d au
xilia
ry c
riter
ia a
s pro
xies
, in
clud
ing
the
degr
ee to
whi
ch th
e pr
ogra
mm
e is
spec
ifica
lly o
rient
ed
tow
ards
a c
lass
of o
ccup
atio
ns o
r tra
des
and
is g
ener
ally
orie
nted
tow
ards
an
imm
edia
te tr
ansi
tion
to th
e la
bour
m
arke
t.
This
info
rmat
ion
is p
artia
lly
colle
cted
07
Prog
ram
me
desi
gned
to p
repa
re
spec
ifica
lly fo
r fur
ther
edu
catio
n an
d tra
inin
g
Prog
ram
me
spec
ifica
lly
desi
gned
for c
ontin
uing
ed
ucat
ion
(Thi
s var
iabl
e w
as c
olle
cted
up
to a
nd
incl
udin
g 20
04).
By
usin
g IS
CED
97,
it
can
be d
educ
ed to
wha
t ISC
ED le
vel t
he
prog
ram
me
can
lead
.
This
info
rmat
ion
is p
artia
lly
colle
cted
08
Age
at w
hich
the
prog
ram
me
is
desi
gned
to st
art
Use
d to
det
erm
ine
whe
ther
the
prog
ram
me
is fo
r you
ng p
eopl
e or
fo
r adu
lts.
Theo
retic
al st
artin
g ag
e of
pa
rtici
pant
s Pr
ior t
o 20
05 th
e va
riabl
e w
as c
alle
d ‘ty
pica
l sta
rting
age
’ C
olle
cted
09
Prog
ram
me
desi
gned
to m
eet t
he
spec
ific
educ
atio
nal/t
rain
ing
need
s of d
isad
vant
aged
per
sons
Une
mpl
oyed
; peo
ple
wis
hing
to re
-en
ter t
he la
bour
mar
ket a
fter
prol
onge
d ab
senc
e; n
on n
atio
nals
; th
e di
sabl
ed; e
arly
scho
ol-le
aver
s;
othe
r.
pro
gram
me
spec
ifica
lly
desi
gned
for a
dults
; p
rogr
amm
e sp
ecifi
cally
de
sign
ed fo
r par
t-tim
e at
tend
ance
.
Col
lect
ed fr
om 2
005
This
info
rmat
ion
is p
artia
lly
colle
cted
10
Mos
t com
mon
ent
ry
requ
irem
ent(s
) for
peo
ple
to b
e ad
mitt
ed in
the
prog
ram
me.
Non
e; a
ge; p
revi
ous
educ
atio
n/tra
inin
g; e
ntry
ex
amin
atio
n; p
revi
ous w
orki
ng
expe
rienc
e; o
ther
.
Min
imum
ent
ranc
e re
quire
men
ts b
y pr
ogra
mm
e
This
refe
rs to
ISC
ED le
vel o
r oth
er. B
y us
ing
ISC
ED, t
he U
OE
esta
blis
hed
auxi
liary
crit
eria
as p
roxi
es; t
his i
nclu
des
typi
cal e
ntra
nce
qual
ifica
tions
and
m
inim
um e
ntra
nce
requ
irem
ents
. Thi
s m
aybe
the
succ
essf
ul c
ompl
etio
n of
the
prev
ious
ISC
ED le
vel o
r any
qu
alifi
catio
n at
the
prev
ious
or c
urre
nt
leve
l.
This
info
rmat
ion
is p
artia
lly
colle
cted
11
Oth
er p
ossi
ble
entry
re
quire
men
t(s) f
or p
eopl
e to
be
adm
itted
in th
e pr
ogra
mm
e
E.g.
age
, pre
viou
s ed
ucat
ion/
train
ing,
ent
ry
exam
inat
ion,
pre
viou
s wor
king
ex
perie
nce,
oth
er.
Non
e
Not
col
lect
ed

Dis
cont
inue
d V
ET
dat
a co
llect
ion
UO
E d
ata
colle
ctio
n
Var
iabl
e C
omm
ent
Var
iabl
e C
omm
ent
Rec
onci
liatio
n
12
Plac
e of
edu
catio
n/tra
inin
g
Educ
atio
nal/t
rain
ing
inst
itutio
n;
ente
rpris
e or
oth
er w
orki
ng
envi
ronm
ent (
e.g.
hos
pita
l);
dist
ance
lear
ning
.
Prog
ram
me
has a
wor
k ba
sed
elem
ent
Col
lect
ed si
nce
2005
Th
is in
form
atio
n is
par
tially
co
llect
ed
13
Type
of i
nstru
ctio
n he
ld
Theo
retic
al c
ours
es, l
ectu
res,
basi
c kn
owle
dge;
pra
ctic
al tr
aini
ng,
sim
ulat
ion
of w
ork
expe
rienc
e.
Prog
ram
me
has a
wor
k ba
sed
elem
ent
Col
lect
ed si
nce
2005
. It c
an b
e as
sum
ed
that
for s
ome
of th
e IS
CED
leve
ls
theo
retic
al c
ours
es a
nd le
ctur
es a
re p
art
of th
e cu
rric
ulum
.
This
info
rmat
ion
is p
artia
lly
colle
cted
14
Perc
enta
ge o
f tim
e sp
ent i
n ea
ch
situ
atio
n
Non
e
Not
col
lect
ed
15
Sala
ry/w
age
impl
icat
ions
as a
re
sult
of p
artic
ipat
ion
in th
e pr
ogra
mm
e
N
one
N
ot c
olle
cted
16
Prog
ram
me
subj
ect t
o a
cont
ract
/agr
eem
ent
Educ
atio
nal/t
rain
ing
inst
itutio
n an
d en
terp
rise;
par
ticip
ant a
nd
educ
atio
nal/t
rain
ing
inst
itutio
n;
parti
cipa
nt a
nd e
nter
pris
e;
parti
cipa
nt, e
duca
tiona
l/tra
inin
g in
stitu
tion
and
ente
rpris
e.
Non
e
Not
col
lect
ed
17
Type
of c
ours
e Fu
ll-tim
e; p
art-t
ime;
bot
h.
Prog
ram
me
spec
ifica
lly
desi
gned
for p
art-t
ime
atte
ndan
ce
Th
is in
form
atio
n is
par
tially
co
llect
ed
18
Vol
ume
of h
ours
of t
he
prog
ram
me
(ful
l and
par
t-tim
e)
Low
er a
nd u
pper
dur
atio
n lim
its.
Obj
ectiv
e is
to e
stim
ate
the
theo
retic
al d
urat
ion
of th
e tra
inin
g pr
ogra
mm
e an
d th
e in
tens
ity o
f the
tra
inin
g fo
r bot
h m
odal
ities
(ful
l-tim
e, p
art-t
ime)
.
Cou
rse
hour
s C
olle
cted
sinc
e 20
05
This
info
rmat
ion
is p
artia
lly
colle
cted
19
Elap
sed
time
(bet
wee
n th
e st
artin
g da
te a
nd th
e co
mpl
etio
n da
te o
f the
pro
gram
me)
for m
ost
parti
cipa
nts i
n th
e pr
ogra
mm
e
Ref
ers t
o th
e to
tal p
erio
d ov
er
whi
ch th
e pr
ogra
mm
e ex
tend
s (it
is
the
time
that
ela
pses
bet
wee
n th
e st
artin
g da
te a
nd th
e co
mpl
etio
n da
te o
f the
pro
gram
me)
.
the
oret
ical
dur
atio
n of
the
prog
ram
me;
t
heor
etic
al c
umul
ativ
e ye
ars a
t the
end
of t
he
prog
ram
me.
Col
lect
ed si
nce
2005
. Prio
r to
2005
the
varia
ble
was
cal
led
‘typi
cal d
urat
ion
of
the
prog
ram
me’
. C
olle
cted

Dis
cont
inue
d V
ET
dat
a co
llect
ion
UO
E d
ata
colle
ctio
n
Var
iabl
e C
omm
ent
Var
iabl
e C
omm
ent
Rec
onci
liatio
n
20
Aut
horit
ies i
n ch
arge
of s
ettin
g th
e ed
ucat
iona
l/tra
inin
g ob
ject
ives
‘In
char
ge o
f’ sh
ould
be
inte
rpre
ted
as ‘u
ltim
atel
y re
spon
sibl
e fo
r’.
Gov
ernm
ent a
utho
ritie
s (ce
ntra
l, re
gion
al, a
nd lo
cal l
evel
); no
n-go
vern
men
t aut
horit
ies;
en
terp
rises
; edu
catio
n/tra
inin
g in
stitu
tions
; oth
er.
Non
e
Not
col
lect
ed
21
Rol
e of
soci
al p
artn
ers
Are
they
initi
atin
g th
e pr
oces
s or
cons
ulte
d du
ring
the
proc
ess.
Non
e
Not
col
lect
ed
22
Rol
e of
ent
erpr
ises
A
re th
ey in
itiat
ing
the
proc
ess o
r co
nsul
ted
durin
g th
e pr
oces
s. N
one
N
ot c
olle
cted
23
Fina
l sou
rce(
s) o
f fun
ding
: in
dica
ting
whe
ther
it is
ove
r 75
% o
f the
fund
ing;
bet
wee
n 51
an
d 75
%; b
etw
een
26 a
nd
50 %
; 25
% o
f the
fund
ing
or
less
Gov
ernm
ent a
utho
ritie
s (ce
ntra
l, re
gion
al a
nd lo
cal l
evel
); no
n-go
vern
men
t aut
horit
ies;
soci
al
partn
ers (
trade
uni
ons,
cham
bers
, em
ploy
ers a
ssoc
iatio
ns, e
tc.);
en
terp
rises
; edu
catio
n/tra
inin
g in
stitu
tions
par
ticip
ants
; oth
er (e
.g.
relig
ious
org
anis
atio
ns).
Educ
atio
n ex
pend
iture
by
leve
l of e
duca
tion,
sour
ce
and
type
of t
rans
actio
n. T
he
sour
ces o
f fun
ding
refe
r to
gove
rnm
ent (
cent
ral,
regi
onal
, loc
al);
inte
rnat
iona
l ag
enci
es a
nd o
ther
fore
ign
sour
ces,
hous
ehol
ds a
nd
othe
r priv
ate
entit
ies.
Whi
le th
e U
OE
does
not
ask
the
prop
ortio
n of
fina
l fun
ding
the
sour
ces
cont
ribut
e, it
doe
s col
lect
qua
ntita
tive
data
, the
reby
ena
blin
g ca
lcul
atio
n of
the
final
pro
porti
on.
Col
lect
ed
24
Euro
pean
Soc
ial F
und
cont
ribut
es to
the
fund
ing
of th
is
prog
ram
me
partl
y or
fully
Non
e
It is
not
col
lect
ed a
s a se
para
te v
aria
ble.
H
owev
er, t
his d
ata
shou
ld b
e in
clud
ed
unde
r fun
ds fr
om in
tern
atio
nal a
genc
ies
and
othe
r for
eign
sour
ces.
Col
lect
ed

Dis
cont
inue
d V
ET
dat
a co
llect
ion
UO
E d
ata
colle
ctio
n
Var
iabl
e C
omm
ent
Var
iabl
e C
omm
ent
Rec
onci
liatio
n
25
Req
uire
men
ts fo
r suc
cess
ful
com
plet
ion
of p
rogr
amm
e
Pass
ing
an e
xam
inat
ion
or a
noth
er
form
al a
sses
smen
t (co
ntin
uous
or
final
); at
tend
ing
the
prog
ram
me
for
a m
inim
um n
umbe
r of h
ours
; oth
er.
fin
al e
xam
; s
erie
s of e
xam
s dur
ing
prog
ram
me;
s
peci
fied
num
ber o
f co
urse
hou
rs a
nd e
xam
; s
peci
fied
num
ber o
f co
urse
hou
rs o
nly;
p
erce
ntag
e of
cou
rse
exam
ined
; c
ours
e ho
urs;
s
peci
fic re
quire
men
t; c
ondi
tions
und
er w
hich
qu
alifi
catio
n ob
tain
ed
with
out s
ucce
ssfu
l co
mpl
etio
n of
pro
gram
me.
Thes
e va
riabl
es a
re c
olle
cted
from
200
5 fo
r pro
gram
mes
. Not
col
lect
ed th
roug
h a
sepa
rate
var
iabl
e up
to 2
005.
C
olle
cted
26
Succ
essf
ul c
ompl
etio
n of
the
prog
ram
me
ackn
owle
dged
by
type
of a
utho
rity
Gov
ernm
ent a
utho
ritie
s (ce
ntra
l, re
gion
al a
nd lo
cal l
evel
); no
n-go
vern
men
t aut
horit
ies:
soci
al
partn
ers;
ent
erpr
ises
; ed
ucat
ion/
train
ing
inst
itutio
ns;
parti
cipa
nts;
oth
er (e
.g. r
elig
ious
or
gani
satio
ns).
Aw
ardi
ng o
rgan
isat
ion
of
prog
ram
me
Col
lect
ed si
nce
2005
C
olle
cted
27
ISC
ED 9
7 cl
assi
ficat
ion
for t
he
prog
ram
me
The
basi
c un
it of
cl
assi
ficat
ion
is th
e ed
ucat
iona
l pro
gram
me
as
defin
ed b
y IS
CED
97
C
olle
cted
28
Succ
essf
ul c
ompl
etio
n of
pr
ogra
mm
e pr
ovid
es a
cces
s to
othe
r pro
gram
me(
s) to
whi
ch th
e pa
rtici
pant
s wou
ld n
ot o
ther
wis
e ha
ve h
ad a
cces
s and
whi
ch
ISC
ED le
vel i
t giv
es a
cces
s to
Prog
ram
me
may
lead
to in
term
s of
com
plem
enta
ry a
nd h
ighe
r tra
inin
g (o
pen
acce
ss to
som
e pr
ogra
mm
es).
Non
e
By
usin
g IS
CED
97,
the
UO
E es
tabl
ishe
d au
xilia
ry c
riter
ia a
s pro
xies
, in
clud
ing
the
type
s of s
ubse
quen
t ed
ucat
ion
for w
hich
the
prog
ram
mes
ha
ve b
een
theo
retic
ally
des
igne
d to
pr
epar
e st
uden
ts.
Col
lect
ed
29
Des
tinat
ion
of p
artic
ipan
ts
dire
ctly
afte
r suc
cess
ful
com
plet
ion
of th
is p
rogr
amm
e
Ove
r 60
%; b
etw
een
40 a
nd 6
0 %
; le
ss th
an 4
0 %
do
not c
ontin
ue in
ed
ucat
ion
and
train
ing.
N
one
N
ot c
olle
cted

Dis
cont
inue
d V
ET
dat
a co
llect
ion
UO
E d
ata
colle
ctio
n
Var
iabl
e C
omm
ent
Var
iabl
e C
omm
ent
Rec
onci
liatio
n
30
Min
imum
qua
lific
atio
n re
quire
d (le
vel a
nd p
edag
ogic
al tr
aini
ng)
for t
each
ers a
nd tr
aine
rs
Info
rmat
ion,
pro
gram
me-
by-
prog
ram
me,
on
the
curr
ent
min
imum
theo
retic
al q
ualif
icat
ion
nece
ssar
y to
per
form
te
achi
ng/tr
aini
ng ta
sks.
Non
e
Not
col
lect
ed.
31
Hea
d co
unts
and
full-
time
equi
vale
nts o
f tea
cher
s/tra
iner
s in
volv
ed in
VET
pro
gram
mes
In th
e co
nver
sion
of h
ead
coun
ts
into
full-
time
equi
vale
nts,
only
the
wor
king
tim
e in
VET
pro
gram
mes
sh
ould
be
cons
ider
ed.
Hea
d co
unts
and
full-
time
equi
vale
nts o
f tea
cher
s/
acad
emic
s by
leve
l of
educ
atio
n, p
rogr
amm
e or
ient
atio
n, g
ende
r, an
d ty
pe
of in
stitu
tion
by IS
CED
le
vel.
Dat
a is
not
ava
ilabl
e by
pro
gram
me.
C
olle
cted
.
32
Wor
king
tim
e of
teac
hers
and
tra
iner
s inv
olve
d in
VET
pr
ogra
mm
es b
roke
n do
wn
by
full
and
part-
time
and
gend
er
Te
ache
r’s s
peci
fied
wor
king
tim
e by
ISC
ED le
vel.
Num
ber o
f hou
rs p
er y
ear a
full-
time
teac
her i
s exp
ecte
d to
wor
k. It
exc
lude
s ov
ertim
e, n
on-s
peci
fied
prep
arat
ion
time,
an
d da
ys th
at th
e sc
hool
is c
lose
d fo
r ho
liday
s.
This
info
rmat
ion
is p
artia
lly
colle
cted
.
Num
ber o
f stu
dent
s ful
l and
pa
rt-tim
e an
d fu
ll-tim
e eq
uiva
lent
s by
ISC
ED le
vel.
The
num
ber o
f stu
dent
s enr
olle
d re
fers
to
the
coun
t of s
tude
nts s
tudy
ing
in th
e re
fere
nce
perio
d. E
ach
stud
ent e
nrol
led
in th
e ed
ucat
ion
prog
ram
me
shou
ld b
e co
unte
d on
ly o
nce.
33
N
umbe
r of p
artic
ipan
ts in
the
prog
ram
me:
full
and
part-
time
Num
ber o
f par
ticip
ants
in th
e pr
ogra
mm
e re
fers
to e
ither
tota
l nu
mbe
r of p
artic
ipan
ts d
urin
g th
e ac
adem
ic y
ear,
on a
giv
en d
ate,
or
durin
g th
e ca
lend
ar y
ear.
En
rolm
ents
by
prog
ram
me.
D
oes n
ot d
istin
guis
h pa
rt-tim
e fr
om
full-
time.
This
info
rmat
ion
is p
artia
lly
colle
cted
.
34
Prog
ram
me
orga
nise
d m
ore
than
on
ce d
urin
g th
e ac
adem
ic y
ear
N
one.
Not
col
lect
ed.
35
Num
ber o
f new
ent
rant
s by
gend
er
Num
ber o
f the
new
ent
rant
s ref
ers
to e
ither
: firs
t yea
r new
ent
rant
s (r
epea
ters
exc
lude
d); f
irst y
ear
entra
nts (
repe
ater
s inc
lude
d); a
ll ne
w e
ntra
nts (
rega
rdle
ss o
f the
gr
ade
they
ent
er);
othe
r.
Num
ber o
f new
ent
rant
s by
leve
l of e
duca
tion,
gen
der
and
age
by IS
CED
leve
l.
New
ent
rant
s are
stud
ents
who
, dur
ing
the
cour
se o
f the
cur
rent
repo
rting
pe
riod,
ent
er a
ny p
rogr
amm
e le
adin
g to
a
reco
gnis
ed q
ualif
icat
ion
at th
is le
vel f
or
the
first
tim
e, ir
resp
ectiv
e of
whe
ther
st
uden
ts e
nter
the
prog
ram
me
at th
e be
ginn
ing
or a
t an
adva
nced
stag
e of
the
prog
ram
me.
Col
lect
ed.

Dis
cont
inue
d V
ET
dat
a co
llect
ion
UO
E d
ata
colle
ctio
n
Var
iabl
e C
omm
ent
Var
iabl
e C
omm
ent
Rec
onci
liatio
n
36
Num
ber o
f par
ticip
ants
who
su
cces
sful
ly c
ompl
eted
the
prog
ram
me
by g
ende
r
num
ber o
f gra
duat
es b
y ge
nder
by
ISC
ED le
vel;
num
ber o
f gra
duat
es b
y pr
ogra
mm
e.
D
ata
by g
ende
r is
colle
cted
by
ISC
ED le
vel.
37
Num
ber o
f gra
duat
es b
y fie
ld o
f tra
inin
g
Bas
ed o
n th
e fie
lds o
f tra
inin
g cl
assi
ficat
ion
(Eur
osta
t’s m
etad
ata
clas
sific
atio
n of
fiel
ds o
f edu
catio
n an
d tra
inin
g, 1
999)
.
Num
ber o
f gra
duat
es b
y fie
ld o
f tra
inin
g an
d by
IS
CED
leve
l.
The
UO
E fo
llow
s the
revi
sed
ISC
ED
clas
sific
atio
ns b
y fie
ld o
f edu
catio
n. T
he
UO
E de
finiti
on is
als
o co
nsis
tent
with
fie
lds o
f edu
catio
n an
d tra
inin
g cl
assi
ficat
ion,
pro
duce
d by
Eur
osta
t in
1999
(Une
sco,
200
6).
Dat
a is
col
lect
ed
by IS
CED
leve
l. H
owev
er, i
t doe
s no
t col
lect
dat
a on
pro
gram
mes
.

104
Annex 2: Detailed overview of education variables collected in Eurostat sources
Variable VET variable
Rank (a)
CVTS2
Enterprises with a specific training budget, which included provision for CVT X 1 Enterprises with an internal training centre, which is used exclusively or partly for CVT X 1 Enterprise with a joint agreement with employees or their representatives covering CVT for some or all categories of its workers X 1
Enterprises undertaking any CVT activities X 1 Enterprises providing any types of CVT for its persons employed during the two preceding years (1997 or 1998) X 1
Enterprises intending to provide CVT courses; other forms of training during the years 2000 and 2001 X 1
Number of hours spent on CVT courses compared to the hours spent on other forms of CVT increased/decreased X 1
The number of hours spent on CVT courses during paid working time compared to those spent in the employees’ own time increased/decreased X 1
The proportion of fees and payments to training providers covered by the individual person employed compared to that covered by the enterprise increased/decreased X 1
Proportion of persons employed in the following occupational groups actually participated in these CVT courses: managers and professional staff; technicians and associate professional; clerks, service workers and shop and market sales workers; craft and related trade workers, plant and machine operators, assemblers and elementary occupations
X 1
Total number of participants in courses (number) and paid working-time (hours) broken down by gender X 1
Total amount of paid working time spent by participants on CVT courses (in hours) broken down between internally and externally managed courses X 1
Total paid working time (hours) spent on CVT courses by field (subject) of training X 1 Total paid working time spent (hours) broken down by type of CVT provider for externally managed CVT courses only, X 1
Costs of CVT courses X 1 Enterprise formal procedures for evaluating the effect of its CVT courses X 1 CVT courses in 1999 and particular groups of persons employed: women, young (25 years or younger), older (50 years or older), handicapped, ethnic minorities, at risk of losing their job, without formal qualifications, part-time
X 1
Community innovation survey
Enterprises engaging in internal or external training of personnel directly aimed at the development and/or introduction of innovations X 5
Community survey of ICT usage in households
Used Internet in the last three months at a place of work 1 Used Internet in the last three months for education and training, broken down by purpose (looking for information about education, training or course offers; doing an online course of any subject; consulting the Internet with the purpose of learning)
1
In the past three months used Internet to take part in a course (any training, not only computer or Internet training, including school or university) 1
In the past three months used Internet to do research as part of a training course or your education 1
Last take a training course (of at least three hours) on any aspect of computer use 2

105
Variable VET variable
Rank (a)
Reasons for not having taken a course on computer use recently 2 Method used to obtain the Internet-related skills, broken down by type: formal educational institution (school, college, university); training courses in adult education centre (but not on the initiative of your employer); vocational training courses (on the demand of the employer); self-study using books, CD-ROMs, online courses, etc.; self-study in the sense of learning-by-doing; informal assistance from colleagues, relatives, friends; some other way
X 2
Educational level: primary or lower secondary education, no formal education. (ISCED 0, 1 or 2); upper secondary education (ISCED 3 or 4); tertiary education 4
Labour cost survey
Number of apprentices X 4 Number of hours worked by apprentices X 4 Wages and salaries of apprentices X 2 Vocational training costs (excluding costs for apprentices) X 2
Eurostat harmonised HBS
Household expenditure on education broken down by COICIOP level 1
EU-SILC
Number of hours during a usual week at pre-school 5 Number of hours during a usual week at compulsory school 5 Current education activity (in education/not in education) 4 ISCED level currently attended 4 Year when highest level of education was attained 4 Highest ISCED level attained 4 Self-defined current activity status (pupil, student, further training, unpaid work experience) 4 Reason for working less than 30 hours (in main and other jobs) due to undergoing education or training
Net series of personal income at component level (education-related allowances) 1 Gross series of personal income at component level (education-related allowances) 1
HETUS
At present receiving education or training 4 Level of education (ISCED 97) and training received X 4 Full time or part time education 4 Highest level of education completed 4 Study or school (both in adult and child diaries): school or university; and free time study 1
European system of national accounts
Gross value added (at basic prices) 1 Gross operating surplus and gross mixed income 1 Consumption of fixed capital 1 Output 1 Intermediate consumption 1 Gross capital formation 1 Gross fixed capital formation 1 Changes in inventories and acquisitions less disposals of valuables 1 Changes in inventories 1 Acquisitions less disposals of valuables 1 Gross value added (at basic prices) 1 Compensation of employees 1

106
Variable VET variable
Rank (a)
Wages and salaries 1 Net operating surplus and net mixed income 1 Other taxes less other subsidies on production 1 Consumption of fixed capital – price index 1 Output – price index 1 Gross capital formation – price index 1 Gross fixed capital formation – price index 1 Total employment, broken down by employees and self-employed 1 Final consumption expenditure of households on education 1
LFS
Education or training received during previous four weeks or more 1 Type of instruction received X 4 Level of this education or training (ISCED 97) X 4 Purpose of this education and training X 4 Total length of this education or training 4 Usual number of hours of training per week 4 Highest level of education or training successfully completed (ISCED 97) everybody aged 15 years or more X 4
Obtained a (non tertiary) vocational qualification (minimum duration: six months) everybody aged 15 years or more by type of instruction X 4
Year when highest level of education or training was successfully completed everybody aged 15 years or more 4
LFS ad hoc module on transition from school to working life
Highest level of education or training successfully completed (when leaving continuous education for the first time) 1
Field of education (when leaving continuous education for the first time) 1
LFS ad hoc module on LLL
During the last 12 months has been a student or an apprentice in regular education 1 Level of this education or training (ISCED 97) 1 Field of this education or training 1 Attendance at any courses, seminars, conferences or received private lessons or instructions outside the regular education within the last 12 months 1
Main reasons for participating in this taught activity: mainly job related reasons; mainly personal/social reasons 1
Subject/content of this taught activity/field of education/learning 1 Any part of this taught activity take place during paid working hours? Only during paid hours; mostly during paid hours; mostly outside paid hours; only outside paid hours; no job at that time
1
Duration in number of taught hours for all taught activities 1 Methods for non-taught learning including self-learning with the purpose to improve skills during the previous 12 months, which was not part of a taught activity or program of studies? 1
EU LMP database
Contextual description of the training measure (aim, beneficiaries/participants, action/instrument, financing/support, eligibility, legal basis) X 1
Expenditure on training measures broken down by type (transfers to individuals, employers, service providers) (qualitative) X 1

107
Variable VET variable
Rank (a)
Operational target groups of the training measure (registered unemployed, other registered jobseekers, not registered, employed) X 1
Detailed target group of the training measure (all, long-term unemployed, youth, older, disabled, immigrants, ethnic minorities, re-entrants/lone parents, public priorities, etc.) X 1
Planned duration of training measure (typical, maximum, unlimited, one-off) X 1 Area of application of training measure (national, regional) X 1 Source of finance of measure (central government, state/regional, local government, social security, European Social Fund, other) X 1
Institution responsible for the training measure (central government, state/regional, local government, social security, trade union, public employment services) X 1
Implementation of intervention (year started and ended) X 1 Expenditure on training measures broken down by type (transfers to individuals, employers, service providers) (quantitative) X 1
Breakdown of participants in measure by gender, age, duration of unemployment, previous status of entrants (registered unemployed, not registered, employed, unknown) X 1
Destination of exits of training measures (employment, of which subsidised, other measure, inactivity, unknown) X 1
Average duration of participation in measure X 1
ESSPROS
Cash benefits – vocational training allowance (under unemployment function) X 1 Benefits in kind – vocational training (under unemployment function) X 1
UOE data collection on education systems
Number of students by level of education, programme orientation, destination, intensity of participation, gender and age X 1
Number of students in adult education programmes by level of education, programme orientation, programme destination, intensity of participation, gender and age X 1
Number of students by level of education, programme orientation, programme destination, type of institution, intensity of participation and gender X 1
Number of students in adult education programmes by level of education, programme orientation, programme destination, intensity of participation, and gender X 1
Number of students and repeaters (ISCED 123) in general programmes by level of education, gender and grade 1
Number of students in grade 1 by gender and age 1 Number of students (ISCED 56) by level of education, programme destination, field of education and gender 1
Number of students (ISCED 56) by residential status, prior education outside the reporting country, citizenship, level of programme destination and field of destination and field of education
1
Number of students by level of education, programme destination, residence status, country of prior education, citizenship, EU/non-EU membership and gender 1
Number of students by level of education, programme destination, country of permanent residence and citizenship status 1
Number of students (ISCED 56) by level of education, programme destination, country of prior education and citizenship status 1
Number of students (ISCED 56) by level of education, programme destination, and country of citizenship 1
Annual intake by level of education and programme destination X 1 Number of new entrants by level of education, gender and age X 1

108
Variable VET variable
Rank (a)
Number of graduates (ISCED 3 and 4) by level of education, programme destination, programme orientation, type of institution, gender and by residence, country of prior education and citizenship status
X 1
Number of graduates (ISCED 5-6) by level of education, programme destination, programme orientation, age and gender
1
Number of graduates (ISCED 5-6) by level of education, programme destination, cumulative duration, age and gender 1
Number of graduates (ISCED 3, 4, 5 and 6) by level of education, programme orientation, gender and field of education X 1
Number of students with coverage adjusted to statistics on education personnel by level of education, programme orientation, programme destination, type of institution and mode X 1
Classroom teachers (ISCED 0-4) and academic staff (ISCED 5-6) by level of education, programme orientation, gender, age, type of institution and employment status X 1
School level management personnel and teacher aids (ISCED 0-3) by type of institution and employment status 1
Number of students with coverage adjusted to statistics on educational finance by level of education, programme orientation, programme destination, type of institution and mode X 1
Education expenditures by level of education and source and type of transaction X 1 Education expenditures by level of education, nature and resource category X 1 Average class size level of education and type of institution 1 (a) Each variable is assessed in relation to the objectives of the source and the questionnaire, to determine the importance of the variable.
Each variable was ranked according to the following scale: 1 It is core to the source, that is, the collection of these variables are the main aim. 2 It is important as it forms part of the objectives. 3 It is less important. 4 It is only intended to provide background information. 5 It is not important.

109
Annex 3: Currently published statistics and indicators on VET/LLL Code Indicators Comments
General and regional statistics
European and national short term indicators
Regional education statistics GR01 Number of students by level of education, orientation, gender and region Education statistics –
ISCED 97 GR02 Number of students by age, gender and region Education indicators GR03 Regional indicators
Regional labour market Regional economically active population – LFS series and LFS adjusted series
GR04 Economically active population by gender, age and highest level of education attained, at NUTS (a) levels 1 and 2 (thousands)
Regional employment – LFS series GR05 Employment by gender, age and highest level of education attained, at NUTS levels 1 and 2
(thousands)
GR06 Population aged 15 and over by gender, age and highest level of education attained, at NUTS levels 1 and 2 (thousands)
Regional sociodemographic labour force statistics – LFS series GR07 LLL: participation of adults aged 25-64 in education and training, at NUTS levels 1 and 2
(thousands) GR08 Candidate and Western Balkan countries: education
Education: education finance; education statistics – school enrolment
GR09 European neighbourhood policy countries and Russia: education
Economy and Finance
National accounts EF01 Gross value added (at basic prices) EF02 Gross operating surplus and gross mixed income EF03 Consumption of fixed capital
National accounts detailed breakdowns (by industry, by product, by consumption purpose) EF04 Output
Includes education

Code Indicators Comments EF05 Intermediate consumption EF06 Gross capital formation EF07 Gross fixed capital formation EF08 Changes in inventories and acquisitions less disposals of valuables EF09 Changes in inventories EF10 Acquisitions less disposals of valuables EF11 Gross value added (at basic prices) EF12 Compensation of employees EF13 Wages and salaries EF14 Net operating surplus and net mixed income EF15 Other taxes less other subsidies on production EF16 Consumption of fixed capital – price index EF17 Output – price index EF18 Gross capital formation – price index EF19 Gross fixed capital formation – price index EF20 Changes in inventories and acquisitions less disposals of valuables – price index EF21 Changes in inventories – price index EF22 Acquisitions less disposals of valuables – price index EF23 Gross value added (at basic prices) – price index EF24 Total employment, broken down by employees and self-employed
EF25 Final consumption expenditure of households on education (2 digit and 3 digit level)
At the COICOP 3 digit level data is only available for pre-primary and primary education.
EF26 Gross value added (at basic prices) EF27 Gross operating surplus and gross mixed income EF28 Consumption of fixed capital EF29 Output EF30 Intermediate consumption EF31 Gross capital formation EF32 Gross fixed capital formation EF33 Changes in inventories and acquisitions less disposals of valuables EF34 Changes in inventories EF35 Acquisitions less disposals of valuables EF36 Gross value added (at basic prices) EF37 Compensation of employees
Quarterly National Accounts
EF38 Net operating surplus and net mixed income
Includes education

Code Indicators Comments EF39 Other taxes less other subsidies on production EF40 Consumption of fixed capital – price index EF41 Output – price index EF42 Gross capital formation – price index EF43 Gross fixed capital formation – price index EF44 Changes in inventories and acquisitions less disposals of valuables – price index EF45 Changes in inventories – price index EF46 Acquisitions less disposals of valuables – price index EF47 Gross value added (at basic prices) – price index EF48 Total employment, broken down by employees and self-employed EF49 Final consumption expenditure of households on education (2 digit level) EF49 Supply table EF49 Use table EF49 Input-output table EF49 Input-output table for domestic output
National accounts – supply, use and Input-output tables
EF49 Input-output table for imports
Government statistics EF50 Intermediate consumption
EF51 Intermediate consumption; other taxes on production; current taxes on income, wealth, etc.; adjustment for the change in net equity of households in pension funds reserves
EF52 Other taxes on production; current taxes on income, wealth, etc.; adjustment for the change in net equity of households in pension funds reserves
EF53 Compensation of employees EF54 Subsidies EF55 Property income, consolidated and broken down by sub-sector EF56 Other current transfers, consolidated
EF57 Social benefits other than social transfers in kind and social transfers in kind = expenditure on products supplied to households via market producers
EF58 Final consumption expenditure EF59 Capital transfers, consolidated EF60 Investment grants EF61 Gross capital formation
Annual government finance statistics
EF62 Gross fixed capital formation
Broken down by general government: central government; state government; local government; social security funds

Code Indicators Comments EF63 Acquisitions less disposals of non-financial non-produced assets EF64 Gross capital formation and acquisitions less disposals of non-financial non-produced assets EF65 Total general government expenditure
Theme: population and social conditions
Demography PS01 Population by gender, indicator of citizenship age and highest level of educational attainment PS02 Population aged 15-74 by gender, age group, economic activity and occupation National level census
2001 round: educational level PS03 Population aged 15-74 by gender, age group, economic activity and occupation and the highest
educational level completed PS04 Population by gender, age group, highest educational attainment and occupation Regional level census
2001 round PS05 Population by gender, age group, highest educational attainment, current economic activity PS06 Active population by gender, age and educational level completed
National level census 1990/91 round: educational level PS07 Economically inactive persons by gender, age and educational level completed
Health
PS08 Consultation of a medical doctor during the past 12 months, by gender, age and educational level ( %)
PS09 Consultation of a dentist during the past 12 months, by gender, age and educational level ( %) PS10 In-patient hospitalisation during the past 12 months by gender, age and educational level ( %) PS11 Day-patient hospitalisation during the past 12 months, by gender, age and educational level ( %) PS12 Breast cancer screening – mammography – by age and educational level ( %)
Public health
PS13 Cervical cancer screening by age and educational level ( %) PS14 Body mass index by gender, age and educational level ( %) PS15 Self-perceived health by gender, age and educational level ( %) PS16 People having a long-standing illness or health problem, by gender, age and educational level ( %) PS17 Activity restriction in the past six months by gender, age and educational level ( %)
PS18 Reduction in activities over the past two weeks because of health problems, by gender, age and educational level ( %)
PS19 Smokers by number of cigarettes, by gender, age and educational level ( %) PS20 Previous smoking behaviour of non-smokers by gender, age and educational level ( %)
Health status: indicators from the national health interview surveys (round 2004)
PS21 Smokers by gender, age and educational level ( %)

Code Indicators Comments
PS22 Consumption of alcohol (percentage of people who drunk any alcohol the past 12 months) by gender, age and educational level ( %)
PS23 Average weight by gender, age class, education and working status (b) PS24 Average height by gender, age class, education and working status (b)
PS25 Body mass index by gender, age class, education and working status according to body mass index categories by WHO-EURO 1996 (b)
Health status: indicators from other surveys and sources
PS26 Body mass index by gender, age class, education and working status according to current body mass index categories by WHO-EURO (b)
PS27 Self perceived health by gender, age, education and activity status (b) Self perceived health PS28 Prevalence percentages of disability by education level, gender and age group
PS29 Percentage of population by attitude towards smoking by gender, age, education and working status (b) Life styles
PS30 Percentage of population by attitude towards smoking – details – by gender, age, education and working status (b)
PS31 Work related health problems and accidental injuries Health and safety at work: Structural indicators on health and safety at work PS32 Relative standardised incidence rate of accidental injuries at work by educational attainment level
and gender (mean rate for each Member State = 100)
Education
PS33 Teachers and trainers; age distributions – pupils to teachers ratio
The following age groups are given: <30, 30-39, 40-49, >50. Data is given for ISCED 1-3 for public and private institutions
PS34 Mathematics, science and technology enrolments and graduates Data refer to ISCED 5-6
PS35 Investments in education and training Includes public expenditure on education as % of GDP, for all levels of education combined; expenditure on educational institutions from private sources as % of GDP, for all levels of education combined
PS36 Participation rates in education by age and gender Age group refers to 15-24
PS37 Foreign language learning
Average number of foreign languages learned per pupil at ISCED 2 and 3; percentage of pupils at ISCED 2 and 3 (GEN) learning three or more foreign languages; percentage of pupils at ISCED 2 and 3 (GEN) learning two foreign languages; percentage of pupils at ISCED 2 and 3 (GEN) learning one foreign languages; percentage of pupils at ISCED 2 and 3 (GEN) learning no foreign languages
Thematic indicators – progress towards the Lisbon objectives in education and training
PS38 Student mobility Students (ISCED 5-6) studying in another EU-27, EEA or Candidate country – as % of all students; inflow of students (ISCED 5-6) from EU-27, EEA and Candidate countries – as % of all students in the country

Code Indicators Comments
PS39 Context
This includes school expectancy of pupils and students (ISCED 0-6); expected years of tertiary education; students in post-compulsory education – as a % of the total population of post-compulsory school age; students in post-compulsory education (thousands); population in post-compulsory school age (thousands); pupils and students (ISCED 1-3) – as % of total age population; pupils and students (ISCED 1-3) (thousands); participation rates in education for 18-year olds, ISCED 1-6
PS40 Distribution of pupils/students by level Refers to ISCED 0-6
Education indicators – non-finance
PS41 Participation/Enrolment in education (ISCED 0-4)
Data refer to ISCED 0-4. Data for ISCED 0 is broken down by the following age groups: 3; 4; 5; 6. Data for ISCED 1 is broken down by the following age groups: 4; 5; 6, 7.
PS42 Tertiary education participation
Refers to ISCED 5-6. Data on enrolments broken down by gender and by field of study: science, mathematics, computing, engineering, manufacturing, construction; education humanities and art social science, business and law; engineering, manufacturing and construction; agriculture and veterinary; health and welfare; services; unknown. Also data on mobility of students: in tertiary education (ISCED 5-6); data on age groups: median age in tertiary education (ISCED 5-6); entrants at theoretical starting age in ISCED level 5 as % of all persons of the corresponding age group; entrants at the theoretical starting age in ISCED level 5 as % of all entrants in ISCED level 5
PS43 Participation/enrolment in education by gender
Data is broken down by gender, gender and age. Data is also available on two VET indicators: students at ISCED 3-VOC – as % of all students at ISCED 3; students at ISCED 4-VOC – as % of all students at ISCED 4
PS45 Tertiary education graduates Data broken down by age, gender, and broad field of education
PS42 Teaching staff Data broken down by ISCED level, gender, age, and position (teachers, head teachers). Data refer to both public and private institutions.
PS46 Pupil/student – teacher ratio and average class size (ISCED 1-3) Data refer to ISCED 1-3
PS47 Languages
Data refer to ISCED 1-3. Data is broken down by the number of languages taught for each ISCED level. Distinction is made for ISCED 3 between general and vocational programmes. Data is also broken down by type of language taught (i.e. English, French, German, Spanish, and Russian).
PS48 Educational attainment by gender Data is given on educational attainment, and early school leavers.
Education indicators – non-finance
PS49 Unemployment by educational attainment, age and gender Data is broken down by age group, and by ISCED level

Code Indicators Comments
PS50 Expenditure on education in current prices
PS51 Expenditure on education in constant prices
Data refer to public expenditure
PS52 Expenditure on education as % of GDP or public expenditure
PS53 Expenditure on public educational institutions
PS54 Expenditure on public and private educational institutions
PS55 Financial aid to students Refers to all levels of education, and separately for ISCED 5-6
Education indicators – finance
PS56 Funding of education Refers to all levels of education. Data broken down by level of government.
Enrolments, graduates, entrants, personnel and language learning – absolute numbers
PS57 Students by ISCED level, type of institution (private or public) and study intensity (full-time, part-time)
PS58 Students by ISCED level, study intensity (full-time, part-time) and gender PS59 Tertiary students (ISCED 5-6) by field of education and gender
PS60 Students in tertiary education (ISCED 5-6) who are non-citizens, non-residents or with prior education from another country by field of education
PS61 Foreign students in tertiary education (ISCED 5-6) by country of citizenship
PS62 Graduates in ISCED 3 and 4 by age and gender Data on vocational programmes in ISCED3-4 are provided separately.
PS63 Graduates in ISCED 5 and 6 by age and gender PS64 Graduates in ISCED 3 to 6 by field of education and gender PS65 New entrants to ISCED 3 to 6 by age and gender PS66 Teachers (ISCED 0-4) and academic staff (ISCED 5-6) by age and gender
PS67 Teachers (ISCED 0-4) and academic staff (ISCED 5-6) by employment status (full-time, part-time, full-time equivalence) and gender
PS68 Students in ISCED 1-3 by modern foreign language studied
Students by ISCED level, age and gender
PS69 Students in ISCED 1-3 by number of modern foreign languages studied Data on vocational programmes in ISCED 2-3 are provided separately
PS70 Number of students by level of education, orientation, gender and region
EU region
PS71 Number of students by age, gender and region Data on vocational programmes in ISCED level 2-3 are provided separately

Code Indicators Comments PS72 Regional indicators PS73 Youth transitions from education to working life in Europe (in number of months) PS74 Employed in service sector and occupational status of recent school-leavers PS75 Young people social origin, educational attainment and labour outcomes in Europe PS76 Parents’ education level
Youth transitions from education to working life in Europe/LFS 2000
PS77 Job mismatches and their labour market effects among school levers in Europe Includes data on participation in CVT by job mismatch (%) and participation in CVT by job match (%)
Training PS78 Training/non training enterprises by NACE PS79 Training/non training enterprises by size class PS80 Participants in CVT courses by NACE, size class and gender PS81 Costs of CVT courses by NACE and size class PS82 Hours spent on CVT courses by NACE, size class and gender
CVT
PS83 Employees in enterprises by NACE, size class and gender PS84 Participation in LLL in any training activities PS85 Participation in LLL – formal education PS86 Participation in LLL – non-formal education and training
LLL
PS87 Participation in LLL – informal learning
Labour market
PS88 Early school-leavers –percentage of the population aged 18-24 with, at most, lower secondary education and not in further education or training
PS89 LLL (adult participation in education and training) percentage of the population aged 25-64 participating in education and training over the four weeks prior to the survey
PS90 Youth education attainment level – percentage of the population aged 20-24 having completed at least upper secondary education
PS91 Percentage of the population aged 25-64 having completed at least upper secondary education
Broken down by gender Employment and
unemployment
PS92 Percentage of the population aged 25-64 having completed at most lower secondary education
Broken down by the following age groups: 25-64; 25-34; 35-44; 45-54; 55-64; 65 and over
Employment and unemployment: PS93 Population, aged 15-74 years by gender, age groups and highest level of education
attained (thousands)

117
Code Indicators Comments
PS94 Population, aged 15-74 years by participation in education or training, by gender and age groups (thousands)
PS95 Active population by gender, age groups and highest level of education attained (thousands)
PS96 Activity rates by gender, age groups and highest level of education attained (%)
PS97 Employment by gender, age groups and highest level of education attained (thousands)
PS98 Employment by gender, occupation and highest level of education attained (thousands)
PS99 Employment rates by gender, age groups and highest level of education attained (%)
PS100 Self-employment by gender, age groups and highest level of education attained (thousands)
PS101 Employees by gender, age groups and highest level of education attained (thousands)
PS102 Temporary employees by gender, age groups and highest level of education attained (thousands)
PS103 Full-time and part-time employment by gender, age groups and highest level of education attained (thousands)
PS104 Population in employment having a second job by gender and highest level of education attained (thousands)
PS105 Unemployment rates by gender, age groups and highest level of education attained (%)
LFS series – detailed quarterly survey results (from 1998)
PS106 Inactive population by gender, age groups and highest level of education attained (thousands)
PS107 Population, aged 15-74 years, by gender, age groups and highest level of education attained (thousands)
PS108 Population, aged 15-74 years by participation in education or training, by gender and age groups (thousands)
PS109 Active population by gender, age groups and highest level of education attained (thousands)
PS110 Activity rates by gender, age groups and highest level of education attained (%)
PS111 Employment by gender, age groups and highest level of education attained (thousands)
PS112 Employment by gender, occupation and highest level of education attained (thousands)
Employment and unemployment: LFS series – detailed annual survey results
PS113 Employment rates by gender, age groups and highest level of education attained (%)

118
Code Indicators Comments
PS114 Self-employment by gender, age groups and highest level of education attained (thousands)
PS115 Employees by gender, age groups and highest level of education attained (thousands)
PS116 Temporary employees by gender, age groups and highest level of education attained (thousands)
PS117 Full-time and part-time employment by gender, age groups and highest level of education attained (thousands)
PS118 Population in employment having a second job by gender and highest level of education attained (thousands)
PS119 Unemployment rates by gender, age groups and highest level of education attained (%)
PS120 Inactive population by gender, age groups and highest level of education attained (thousands)
PS121 Economically active population by gender, age and highest level of education attained, at NUTS 1 and 2 (thousands)
PS122 Employment by gender, age and highest level of education attained, at NUTS 1 and 2 (thousands)
PS123 Population aged 15 and over by gender, age and highest level of education attained, at NUTS 1 and 2 (thousands)
Employment and unemployment: LFS regional series
PS124 LLL: participation of adults aged 25-64 in education and training, at NUTS 1 and 2 (thousands)
PS125 Structure of earnings survey 2002 PS126 Number of employees by economic activity, gender, level of educational attainment PS127 Mean hourly earnings by economic activity, gender, educational attainment PS128 Mean monthly earnings by economic activity, gender, educational attainment PS129 Mean annual earnings by economic activity, gender, educational attainment PS130 Mean monthly hours paid by economic activity, gender, educational attainment
Earnings
PS131 Mean annual holidays by economic activity, gender, educational attainment
PS132 Labour cost, wages and salaries, direct remuneration This includes: labour costs for apprentices; and wages and salaries for apprentices
PS133 Structure of labour cost as a % total cost
This includes: wages and salaries of apprentices; employers’ social contributions for apprentices; vocational training costs Labour costs
PS134 Number of employees, hours actually worked and paid
This includes: number of apprentices; average hours actually worked by the apprentices per year

119
Code Indicators Comments
PS135 Public expenditure on training total and broken down by type of expenditure
Type of expenditure refers to: transfers to individuals: periodic cash payments, lump-sum payments, reimbursements,
reduced social contributions, reduced taxes; transfers to employers: periodic cash payments, lump-sum payments, reimbursements,
reduced social contributions, reduced taxes; transfers to service providers.
Data is available for each country for each training measure
EU LMP
PS136 Participants in training Data is available for each country for each training measure broken down by stocks, entrants, and exits
Living conditions and welfare
PS137 Mean consumption expenditure by detailed COICOP level (in purchasing power standard).
This includes education
PS138
Mean consumption expenditure per household with expenditure greater than zero by detailed COICOP level (in purchasing power standard).
Education broken down by: pre-primary and primary; secondary; post-secondary non-tertiary; tertiary; education not definable by level
PS139 Overall structure of consumption expenditure by detailed COICOP level (per thousands)
This includes education
PS140
Structure of consumption expenditure by socioeconomic category of the reference person (COICOP 2) (per thousands)
Socioeconomic category of the reference person refers to: manual workers in industry and services; non manual workers in industry and services; self-employed; unemployment; retired; inactive population – other; unknown. Education broken down by: pre-primary and primary; secondary; post-secondary non-tertiary; tertiary; education not definable by level
PS141
Structure of consumption expenditure by number of active persons (COICOP 2) (per thousands)
Number of active persons refers to: 0, 1, 2, and 3 or more. Education broken down by: pre-primary and primary; secondary; post-secondary non-tertiary; tertiary; education not definable by level
Consumption expenditure of private households
PS142 Structure of consumption expenditure by income quintile (COICOP 2) (per thousands)
Education broken down by: pre-primary and primary; secondary; post-secondary non-tertiary; tertiary; education not definable by level

120
Code Indicators Comments
PS143 Structure of consumption expenditure by type of household (COICOP 2) (per thousands)
Type of household refers to: single person; single parent with dependent children; two adults; two adults with dependent children; three or more adults; three or more adults with dependent children; unknown. Education broken down by: pre-primary and primary; secondary; post-secondary non-tertiary; tertiary; education not definable by level
PS144
Structure of consumption expenditure by age of the reference person (COICOP 2) (per thousands)
The following breakdown is given for age of the reference person: less than 30 years; 30-44 years; 45-59 years; 60 years and over. Education broken down by: pre-primary and primary; secondary; post-secondary non-tertiary; tertiary; education not definable by level
PS145
Structure of consumption expenditure by degree of urbanisation (COICOP 2) (per thousands)
The following breakdown is given for degree of urbanisation: densely-populated area (at least 500 inhabitants/km²); intermediate urbanised area (100-499 inhabitants/km²); sparsely populated area (less than 100 inhabitants/km²). Education broken down by: pre-primary and primary; secondary; post-secondary non-tertiary education; tertiary; education not definable by level
Consumption expenditure of private households
PS146
Structure of consumption expenditure by main source of income (COICOP 2) (per thousands)
The following breakdown is given for main source of income: primary income; secondary income. Education broken down by: pre-primary and primary; secondary; post-secondary non-tertiary; tertiary; education not definable by level
Income and living conditions PS147 Early school leavers not in education or training by gender PS148 At risk of poverty rates by education level PS149 Distribution of population by education level PS150 Mean and median income by education level
Main indicators
PS151 In-work at risk of poverty rates by education level
Social protection PS152 Tables by benefits and currency – unemployment function
Periodic benefit vocational training; periodic benefit vocational training (non means-tested); periodic benefit vocational training (means-tested); lump sum benefit vocational training; lump sum benefit vocational training (non means-tested); lump sum benefit vocational training (means-tested); vocational training; vocational training (non means-tested); vocational training (means-tested)
PS153
Percentage of individuals with access to the Internet broken down by place of access (home, workplace, place of education, Internet cafe, public Internet access point, etc.)
Information society statistics
PS154 Percentage of individuals having used the Internet in relation to training and educational purposes
Data is available for: formalised educational activities (school, university, etc.); other educational courses related specifically to employment opportunities; and post educational courses

121
Code Indicators Comments
PS155 Percentage of enterprises using e-learning applications for training and education of employees Data is broken down by NACE category
PS156 Individuals’ level of computer skills PS157 Individuals’ level of Internet skills PS158 Way of obtaining e-skills PS159 Most recent training course on computer use
Tourism PS160 Employed persons by level of education attained
Theme: industry, trade and services
Industry, trade and services IT01 Annual detailed enterprise statistics Includes number of apprentices for some NACE sections
Structural business statistics IT02 Enterprises managed by the founder – broken down by
education of the entrepreneur
Information society statistics
IT03 Percentage of individuals having used the Internet in relation to training and educational purposes
Data is available for: formalised educational activities (school, university, etc.); other educational courses related specifically to employment opportunities; and post educational courses Policy indicators
IT04 Percentage of enterprises using e-learning applications for training and education of employees Data is broken down by NACE category
IT05 Individuals’ level of computer skills IT06 Individuals’ level of Internet skills IT07 Way of obtaining e-skills
e-skills of individuals
IT08 Most recent training course on computer use
Data is broken down by individual type, which includes age groups, gender, degree of urbanisation, level of formal education, employment status
Theme: science and technology
Community innovation survey
Results of the third community innovation survey (CIS3)
ST01 Enterprises, engaged and not engaged in training in 2000

122
Code Indicators Comments Results of the fourth community innovation survey (CIS4)
ST02 Enterprises, engaged in training in 2004
High-tech industry and knowledge-intensive services
ST03 Mean annual earnings in high-tech industries and knowledge-intensive services, by level of education
Human resources in science and technology (HRST) ST04 Annual data on HRST with tertiary education, by field of education and gender ST05 Annual data on HRST with tertiary education, by field of education and age
Stocks of HRST at the national and regional levels; unemployment for HRST and non-HRST ST06 Annual data on HRST with tertiary education, employed, by field of education and
occupation
Refers to ISCED levels 5/6
ST07 Annual data graduation from tertiary education according to ISCED 97 ST08 Annual data on participation in tertiary education according to ISCED 97 ST09 Annual data on participation of foreign students in tertiary education according to ISCED97 ST10 Annual data on graduation from tertiary education according to ISCED 76 ST11 Annual data on participation in tertiary education according to ISCED 76
Refers to ISCED levels 5/6
ST12 Data on HRST and mobility derived from the 2001 round of Population and Housing Censuses
ST13 Educational attainment, by gender and age group ST14 Educational attainment of 25-64 years old by country of citizenship
ST15 Educational attainment of internationally mobile 25-64 years old, by world part of residence one year prior to census
ST16 HRST by education, by field of study, gender and age group ST17 HRST by education, unemployed, by field of study, gender and age group ST18 HRST by education, employed, by field of study, sector of activity and gender
Flows of HRST at the national level: education inflows and job-to-job mobility
ST19 HRST by education, employed, by field of study, occupation and gender
ST20 Educational attainment, by gender and age group ST21 Educational attainment of 25-64 years old by country of citizenship
ST22 Educational attainment of internationally mobile 25-64 years old, by world part of residence one year prior to census
Refers to ISCED 97
ST23 HRST and sub-groups of HRST, employed, by sector of activity and gender ST24 HRST and sub-groups of HRST, employed, by sector of activity and age group
ST25 HRST by education, by field of study, gender and age group ST26 HRST by education, unemployed, by field of study, gender and age group
Data on HRST and mobility derived from the 2001 round of population and housing censuses
ST27 HRST by education, employed, by field of study, sector of activity and gender
Refers to ISCED 97

123
Code Indicators Comments ST28 HRST by education, employed, by field of study, occupation and gender
Information society statistics
ST29 Percentage of individuals having used the Internet in relation to training and education
Data is available for: formalised educational activities (school, university, etc.); other educational courses related specifically to employment opportunities; and post educational courses Policy indicators
ST30 Percentage of enterprises using e-learning applications for training and education of employees
Data is broken down by NACE category
ST31 Individuals’ level of computer skill ST32 Individuals’ level of Internet skills ST33 Way of obtaining e-skills
e-skills of individuals
ST34 Most recent training course on computer use
Data is broken down by individual type, which includes age groups, gender, degree of urbanisation, level of formal education, employment status.
(a) Nomenclature of units for territorial statistics (b) Source: European community household panel survey users’ database, Eurostat, 06/2003.

Cedefop (European Centre for the Development of Vocational Training)
Evaluation of Eurostat education, training and skills data sources Cedefop Luxembourg: Office for Official Publications of the European Communities
2008 – IV, 123 pp. – 21 x 29.7 cm
(Cedefop Panorama series– ISSN 1562-6180)
ISBN 978-92-896-0504-5
Cat. No: TI-70-07-146-EN-C
Free of charge – 5185 EN –


![(DRAFT) FRAMEWORK CONTRACT - Cedefop · AO/E/ICTF/Printers/012/07 European Centre for the Development of Vocational Training (DRAFT) FRAMEWORK CONTRACT CONTRACT NUMBER – [complete]](https://static.fdocuments.us/doc/165x107/5cce43c388c993045f8c85a5/draft-framework-contract-aoeictfprinters01207-european-centre-for-the.jpg)


![(DRAFT) FRAMEWORK CONTRACT...(DRAFT) FRAMEWORK CONTRACT CONTRACT NUMBER – [complete] The European Centre for the Development of Vocational Training, hereinafter referred to as "Cedefop”,](https://static.fdocuments.us/doc/165x107/5e4b8434ef868a39685a0e97/draft-framework-contract-draft-framework-contract-contract-number-a-complete.jpg)