04.13 Long-term Development of Selected Climate Parameters ...
58
1 04.13 Long-term Development of Selected Climate Parameters (Edition 2015) Overview Berlin lies in the temperate climate zone, characterised by a distinct manifestation of seasons with maximum precipitation in the summer months. The climate in Berlin is primarily determined by air masses transported here from the southwest and northwest, mainly from the Atlantic. These air masses are characterised by humid sea air, which provides for mild temperatures when coming from southerly directions, and cooler air when coming from the north. If the air masses come from easterly and thus continental directions, they are usually very dry and may cause very cold weather periods in winter and very hot ones in summer. However, in large conurbations such as Berlin, this natural influence is at least sometimes shifted by various anthropogenic influence factors, which are summarised under the term “heat island effect”. The intensity of this heat island effect depends on various urban structures (building height, density of development etc.) but also on the prevailing meteorological situation (i.e. the weather conditions). This heat island effect is particularly pronounced under summerly weather conditions with low winds and high pressure, under which the air can hardly circulate within a densely built-up city. Accordingly, the temperature values are lower in the less densely built-up surroundings of the city. The general warming due to climate change additionally raises the temperature level (cf. chapter: Excursus: Estimate of possible effects of climate change). This occurs in urban and rural areas alike, so that the relative temperature differences between city and countryside essentially remain the same. However, with a rise in the general temperature level, temperature values that impose a bioclimatic load occur more frequently mainly in the cities. Primarily elderly people react very sensitively to extreme temperatures. In our geographic areas, particularly the extreme weather conditions in summer play a major role in this regard. In order to better quantify such loads, various threshold days are distinguished in meteorology according to the following definitions: • Summer day: maximum temperature reaches at least 25 °C • Hot day: maximum temperature reaches at least 30 °C • Tropical night: minimum temperature not under 20 °C • Frost day: minimum temperature under 0 °C • Ice day: maximum temperature under 0 °C. Note: In the context of these evaluations, hot days are simultaneously also assessed as summer days. While an analysis of the current state of the distribution of climatological parameters and for the simulation or scenario formation of future states can be carried out using very elaborate climate models (cf. DWD 2010, SenStadt 2009a-b, SenStadt 2010), there are more or less comprehensive measurement data for the analysis of time periods in the past. In the Berlin area, temperature values have been recorded regularly since the beginning of the 18 th century. The Berlin climate measurement series is thus among the oldest in the world. Of course the measurement capabilities at the time were limited with respect to precision and permanence (of the measurement site), especially as these observations were not carried out by technical institutes; in Berlin they were first performed by individuals such as the parish church pastor or the teacher and astronomer Johann Heinrich Mädler (as detailed in Pelz 2007). The longest contiguous climatological measurement series in the Berlin area is the one in Potsdam; it goes back to 1893. In 1908 the Berlin reference station in Dahlem begins to record the climate (three times per day), though Dahlem was not part of Berlin at the time. The statistical analyses published here are essentially based on partial results of the project “GIS-based modelling of characteristic quantities relevant to urban climate on the basis of high-resolution data on buildings and vegetation” (“GIS-gestützte Modellierung von stadtklimatisch relevanten
Transcript of 04.13 Long-term Development of Selected Climate Parameters ...
1
04.13 Long-term Development of Selected Climate Parameters (Edition 2015)
Overview Berlin lies in the temperate climate zone, characterised by a distinct manifestation of seasons with maximum precipitation in the summer months.
The climate in Berlin is primarily determined by air masses transported here from the southwest and northwest, mainly from the Atlantic. These air masses are characterised by humid sea air, which provides for mild temperatures when coming from southerly directions, and cooler air when coming from the north. If the air masses come from easterly and thus continental directions, they are usually very dry and may cause very cold weather periods in winter and very hot ones in summer.
However, in large conurbations such as Berlin, this natural influence is at least sometimes shifted by various anthropogenic influence factors, which are summarised under the term “heat island effect”. The intensity of this heat island effect depends on various urban structures (building height, density of development etc.) but also on the prevailing meteorological situation (i.e. the weather conditions). This heat island effect is particularly pronounced under summerly weather conditions with low winds and high pressure, under which the air can hardly circulate within a densely built-up city. Accordingly, the temperature values are lower in the less densely built-up surroundings of the city. The general warming due to climate change additionally raises the temperature level (cf. chapter: Excursus: Estimate of possible effects of climate change). This occurs in urban and rural areas alike, so that the relative temperature differences between city and countryside essentially remain the same. However, with a rise in the general temperature level, temperature values that impose a bioclimatic load occur more frequently mainly in the cities.
Primarily elderly people react very sensitively to extreme temperatures. In our geographic areas, particularly the extreme weather conditions in summer play a major role in this regard.
In order to better quantify such loads, various threshold days are distinguished in meteorology according to the following definitions:
• Summer day: maximum temperature reaches at least 25 °C • Hot day: maximum temperature reaches at least 30 °C • Tropical night: minimum temperature not under 20 °C • Frost day: minimum temperature under 0 °C • Ice day: maximum temperature under 0 °C.
Note: In the context of these evaluations, hot days are simultaneously also assessed as summer days. While an analysis of the current state of the distribution of climatological parameters and for the simulation or scenario formation of future states can be carried out using very elaborate climate models (cf. DWD 2010, SenStadt 2009a-b, SenStadt 2010), there are more or less comprehensive measurement data for the analysis of time periods in the past.
In the Berlin area, temperature values have been recorded regularly since the beginning of the 18th century. The Berlin climate measurement series is thus among the oldest in the world. Of course the measurement capabilities at the time were limited with respect to precision and permanence (of the measurement site), especially as these observations were not carried out by technical institutes; in Berlin they were first performed by individuals such as the parish church pastor or the teacher and astronomer Johann Heinrich Mädler (as detailed in Pelz 2007).
The longest contiguous climatological measurement series in the Berlin area is the one in Potsdam; it goes back to 1893. In 1908 the Berlin reference station in Dahlem begins to record the climate (three times per day), though Dahlem was not part of Berlin at the time.
The statistical analyses published here are essentially based on partial results of the project “GIS-based modelling of characteristic quantities relevant to urban climate on the basis of high-resolution data on buildings and vegetation” (“GIS-gestützte Modellierung von stadtklimatisch relevanten

2
Kenngrößen auf der Basis hochaufgelöster Gebäude- und Vegetationsdaten“) (GEO-NET 2014) as well as the results of a student internship (Knerr 2014). This project is being funded by the European Regional Development Fund (ERDF) and the State of Berlin (Project number: 027EFRE GDI) with funding for measures for building the geodata infrastructure (GDI).
Statistical Base The measured temperature data and wind values used here come from three different operators:
the Berlin-Grunewald station is operated by the Senate Department for Urban Development and the Environment in the framework of the Berlin Air Quality Monitoring Network BLUME
the Berlin-Dahlem station is maintained by the Institute of Meteorology of the Free University of Berlin
the four stations Berlin-Alexanderplatz, Berlin-Tegel, Berlin-Tempelhof and Potsdam are operated by the German Meteorological Service, which provides free access to the data on its homepage.
All six stations are operated with electronically operated measurement automata that record the temperature at a height of 2m. Further meteorological parameters are measured at all six measurement sites (see the data on the operators’ websites); however, the focus of evaluation of the Environmental Atlas was on the values for air temperature, mainly the temperature values in summer.
The stations were selected mainly due to their long-term measurement series, but due to their location in the municipal area (cf. Fig. 0.1) they are also well-suited for describing various surrounding structures:
the inner-city area with dense development (Berlin-Alexanderplatz)
the (inner) city peripheral areas (Berlin-Tegel und Berlin-Tempelhof)
loosely developed areas with single-family houses (Berlin-Dahlem) and
forest sites with no or little influence from buildings (Potsdam and Berlin-Grunewald).

3
Fig. 0.1: Location of the evaluated Berlin climate stations in the municipal area of Berlin. The measurement sites are marked by yellow circles (the Potsdam station lies to the southwest outside the map section). (GEO-NET 2014).
Methodology The first subsection of the data analysis deals with long-term mean values of climate parameters for the measurement stations under consideration. The purpose is to indicate both local differences in the manifestation of climatic parameters and possible trends in a climate development that has already taken place. Subsequently, model scenarios on possible climate developments until the end of the century are analysed and assessed for three station sites in Berlin using the statistical procedure WettReg.
The 30-year time interval from 1981 to 2010 was selected as a reference period for analysing the actual state in the current long-term mean. Besides an evaluation of the monthly mean values of typical climate parameters, the relative temperature differences of the annual mean values at the different measurement stations are indicated and the historical development of the air temperatures in the Berlin area is illustrated for the different recording periods of the individual stations.
In the second section of the analysis of the measurements, the focus is on weather conditions in summer with possible heat load. Besides the illustration of the temporal development of temperatures in summer, statistical evaluations of the frequencies of summer days and hot days as well as tropical nights are carried out. The evaluations further include typical diurnal variations on summer days, which were also used in connection with the aforementioned ERDF project in order to specify the meteorological initial conditions of the model simulations to be carried out and to be able to perform spot checks of the results of the calculations.
Results of the station evaluations The main measurement data at the stations under consideration are first considered in combination in order to analyse differences and common features of the measurement sites. The focus of the
4
considerations is on the period from 1981 to 2010, as climate data are available for most of the stations under consideration in this period and these 30 years are regarded as a current period for considering “long-term climate conditions”.
The individual data are provided in relation to the figures in a combined table for all stations (with reference to the summer and winter characteristic quantities) as well as individual station tables (including all daily values since records began). However, they are also available for download in a combined archive (zip; 110 MB).
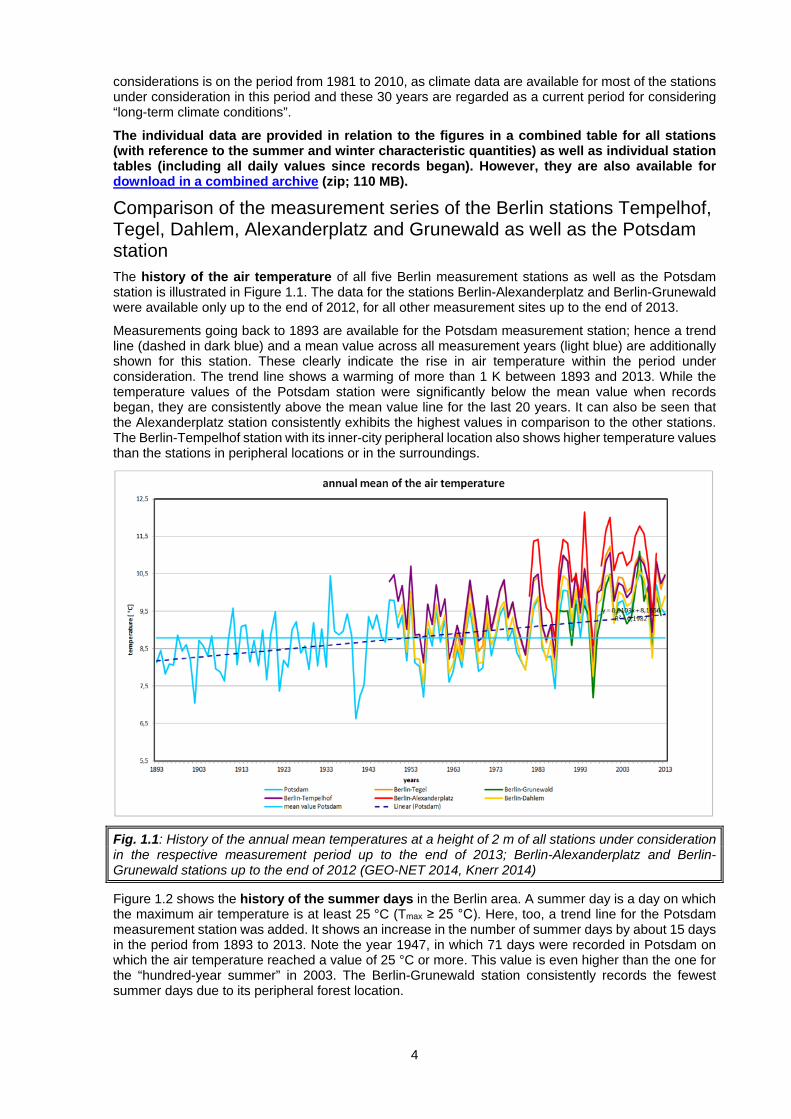
Comparison of the measurement series of the Berlin stations Tempelhof, Tegel, Dahlem, Alexanderplatz and Grunewald as well as the Potsdam station The history of the air temperature of all five Berlin measurement stations as well as the Potsdam station is illustrated in Figure 1.1. The data for the stations Berlin-Alexanderplatz and Berlin-Grunewald were available only up to the end of 2012, for all other measurement sites up to the end of 2013.
Measurements going back to 1893 are available for the Potsdam measurement station; hence a trend line (dashed in dark blue) and a mean value across all measurement years (light blue) are additionally shown for this station. These clearly indicate the rise in air temperature within the period under consideration. The trend line shows a warming of more than 1 K between 1893 and 2013. While the temperature values of the Potsdam station were significantly below the mean value when records began, they are consistently above the mean value line for the last 20 years. It can also be seen that the Alexanderplatz station consistently exhibits the highest values in comparison to the other stations. The Berlin-Tempelhof station with its inner-city peripheral location also shows higher temperature values than the stations in peripheral locations or in the surroundings.
Fig. 1.1: History of the annual mean temperatures at a height of 2 m of all stations under consideration in the respective measurement period up to the end of 2013; Berlin-Alexanderplatz and Berlin-Grunewald stations up to the end of 2012 (GEO-NET 2014, Knerr 2014)
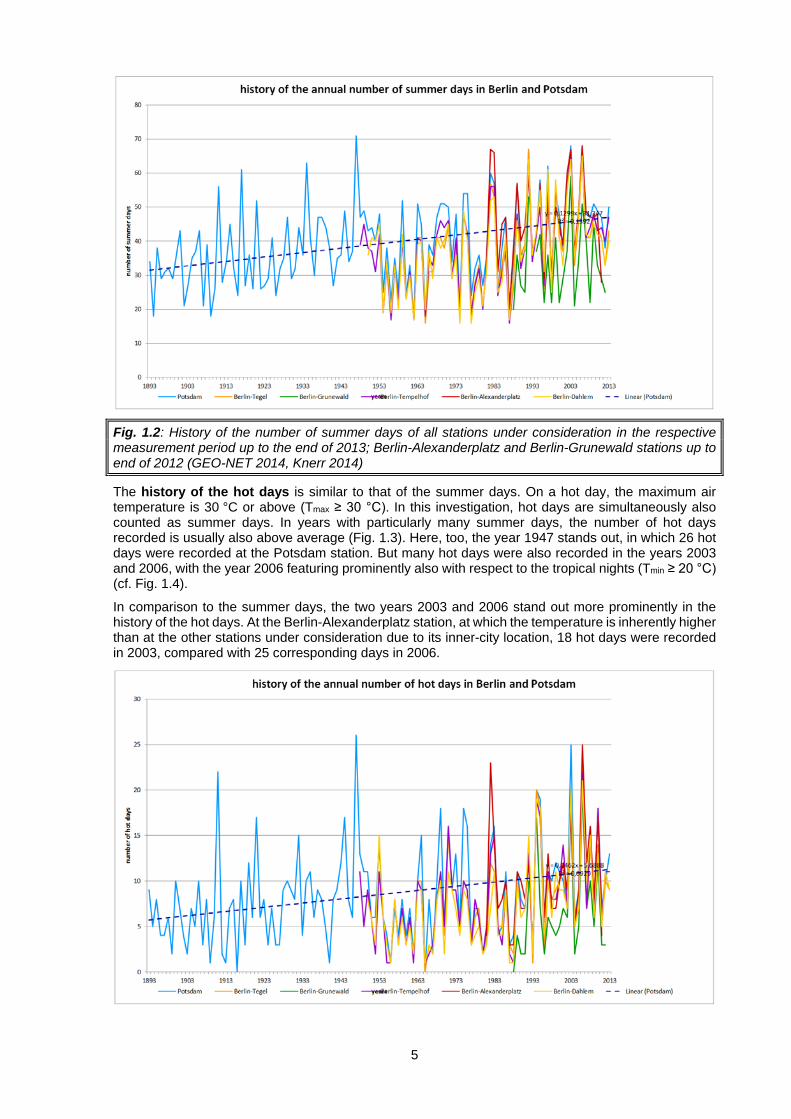
Figure 1.2 shows the history of the summer days in the Berlin area. A summer day is a day on which the maximum air temperature is at least 25 °C (Tmax ≥ 25 °C). Here, too, a trend line for the Potsdam measurement station was added. It shows an increase in the number of summer days by about 15 days in the period from 1893 to 2013. Note the year 1947, in which 71 days were recorded in Potsdam on which the air temperature reached a value of 25 °C or more. This value is even higher than the one for the “hundred-year summer” in 2003. The Berlin-Grunewald station consistently records the fewest summer days due to its peripheral forest location.
5
Fig. 1.2: History of the number of summer days of all stations under consideration in the respective measurement period up to the end of 2013; Berlin-Alexanderplatz and Berlin-Grunewald stations up to end of 2012 (GEO-NET 2014, Knerr 2014)
The history of the hot days is similar to that of the summer days. On a hot day, the maximum air temperature is 30 °C or above (Tmax ≥ 30 °C). In this investigation, hot days are simultaneously also counted as summer days. In years with particularly many summer days, the number of hot days recorded is usually also above average (Fig. 1.3). Here, too, the year 1947 stands out, in which 26 hot days were recorded at the Potsdam station. But many hot days were also recorded in the years 2003 and 2006, with the year 2006 featuring prominently also with respect to the tropical nights (Tmin ≥ 20 °C) (cf. Fig. 1.4).
In comparison to the summer days, the two years 2003 and 2006 stand out more prominently in the history of the hot days. At the Berlin-Alexanderplatz station, at which the temperature is inherently higher than at the other stations under consideration due to its inner-city location, 18 hot days were recorded in 2003, compared with 25 corresponding days in 2006.

6
Fig. 1.3: History of the number of hot days of all stations under consideration in the respective measurement period up to the end of 2013; Berlin-Alexanderplatz and Berlin-Grunewald stations up to the end of 2012 (GEO-NET 2014, Knerr 2014)
The history of the tropical nights in the region also clearly shows the influence of urban structures on the air temperature (Fig. 1.4). The Berlin-Alexanderplatz station consistently shows – apart from years with missed measurements (1993/94) – the highest number of tropical nights. The thermal effects of the nocturnal energy flows from the surrounding building structures have a particular effect here. A high proportion of impervious cover and the dense roadside development with its large heat storage capacity form a comprehensive reservoir for sustained heat radiation in summer nights. According to the German Meteorological Service, the Berlin-Alexanderplatz station is in first place out of all German climate stations with an average of 5 tropical nights per year. However, in years with pronounced summers the number of tropical nights can lie far above the average value, as the number of 21 corresponding nights in 2006 shows.
Fig. 1.4: History of the number of tropical nights of all stations under consideration in the period 1981 to 2013; Berlin-Alexanderplatz and Berlin-Grunewald stations up to the end of 2012 (GEO-NET 2014, Knerr 2014)
The history of the frost days (minimum temperature under 0 °C) (cf. Fig. 1.5) shows a downward trend on the basis of the Potsdam station, which correlates well with the upward trend of the summerly threshold days (Figure 1.1 to 1.4). A decrease in the number of frost days by close to 15 days over the entire period can be observed. The Berlin-Alexanderplatz station registered the fewest frost days per year over the entire history.

7
Fig. 1.5: History of the number of frost days of all stations under consideration in the respective measurement period up to the end of 2013; Berlin-Alexanderplatz and Berlin-Grunewald stations up to the end of 2012 (GEO-NET 2014, Knerr 2014)
The history of the ice days (maximum temperature under 0 °C) at the measurement stations in the Berlin area also shows a decrease. With about five days for the trend line of the Potsdam station, this is much less pronounced than in the case of the frost days. In analogy with the analysis of the hot days, the frost days are also being counted as ice days here.
Here, too, the Berlin-Alexanderplatz measurement station plays a special role in the collective of stations due to its inner-city location: As in the case of the frost days, it exhibits the fewest ice days. All other stations show a similar history.
Fig. 1.6: History of the number of ice days of all stations under consideration in the respective measurement period up to the end of 2013; Berlin-Alexanderplatz and Berlin-Grunewald stations up to the end of 2012 (GEO-NET 2014, Knerr 2014)

8
In the following, the evaluation of selected climate parameters at the individual stations is represented using tables and graphs. The current long-term time interval of the 30 years from 1981 to 2010 was selected as a reference period, as far as data were available. The evaluations of the mean wind direction distributions refer to the 10-year time interval from 2001 to 2010. Hourly values of wind direction and wind speeds were available for the Berlin measurement stations Tegel, Tempelhof, Dahlem and Grunewald.
Berlin-Alexanderplatz Site
Coordinates of the current geographic location
in WGS 84 [EPSG 4326]: R = 13° 24’ 20.5” H = 52° 31’ 11.2” in ETRS89 UTM 33N [EPSG 25833]: R = 391827.1 H = 5820048.4
Measurement height 57 m above sea level Operator German Meteorological Service (DWD) In operation since 1969; interruptions inter alia 1993, 1994 and 1997 Annual mean of the air temperature (1981 to 2010)
10.66 °C
Highest temperature ever measured (up to the end of 2012)
37.8 °C on July 11, 2010
Lowest temperature ever measured (up to the end of 2012)
-18.7 °C on January 14, 1987
Tab. 2.1: Characteristics of the Berlin-Alexanderplatz climate station
Photo 2.1: Location of the Berlin-Alexanderplatz station (see arrow mark), SenStadtUm 2014, aerial photography flight on March 30, 2014 (cf. also Fig. 0.1)

9
Photo 2.2: View of the Berlin-Alexanderplatz station; photo: Andreas Machate (cf. also Fig. 0.1)
The Berlin-Alexanderplatz station lies directly in the city centre of Berlin at the corner of Karl-Liebknecht-Straße and Spandauer Straße (cf. Photo 2.2). The river Spree flows about 350 m west of the current site of the station. The surroundings of the station are characterised by dense and partly high buildings and only very few, mostly smaller green spaces. Due to the inner-city structure at the measurement site, this station exhibits by far the highest nocturnal air temperatures among the Berlin stations and is treated nationwide as a representative inner-city climate station by the German Meteorological Service (DWD). Unfortunately, some measurements were missed in the past, some because of replannings at and near the old measurement site at the foot of the television tower (cf. Berliner Morgenpost on August 6, 2011). The fixed station has existed at the site described above near St. Mary’s Church and the Neptune Fountain since 2012.
The station values used for the investigation start on January 1, 1981, and exhibit some interruptions (mainly in the years 1993, 1994 and 1997) that partly affected the calculation of the annual values, in particular the annual mean values (see the original values within the Excel tables).
The temperature history of the Berlin-Alexanderplatz station is shown in Figure 2.1 for the years 1981 up to July 2011. The gap caused by the missed measurements in the 1990s is clearly visible. As mentioned, the measurement series is regarded nationwide as representative of an inner-city temperature history. With an average value of 10.66 °C, it shows by far the highest value of the six stations being compared here. The annual average value was 9.90 °C at the start of the temperature records being evaluated, in 1981, and increased to 11.04 °C in 2012.

10
Developments, trends
Fig. 2.1: History of the annual mean temperature at the Berlin-Alexanderplatz site in the long-term time interval 1981 to 2010 (GEO-NET 2014, Knerr 2014)
The climate diagram for the Berlin-Alexanderplatz station is shown in Figure 2.2. The maximum of the annual total precipitation lies in the summer months; by contrast, the lowest amounts of precipitation occur in the transitional seasons.
Fig. 2.2: Climate diagram for the Berlin-Alexanderplatz station for the long-term time interval 1981 to 2010 (GEO-NET 2014, Knerr 2014)

11
The very high number of tropical nights is notable in Figure 2.3, given that tropical nights are very rare in Germany so far. At most DWD stations there is less than one tropical night per year on average (DWD, accessed on March 15, 2016).
Here the exceptional inner-city location of the station compared to the vast majority of other official climate stations has a marked effect. The trend of the summer days and hot days also shows the special situation of this station (cf. also Fig. 1.2 and 1.3).
Note the period from July 18 to July 28, 2006, during which temperature values above 30 °C were measured every day, as well as the period from July 19 to July 29, 2006, during which the criteria of a tropical night with temperature values of 20 °C and higher were fulfilled every night (cf. Fig. 2.4).
Fig. 2.3: History of the threshold days summer day, hot day and tropical night for the Berlin-Alexanderplatz station for the long-term period 1981 to 2010 (GEO-NET 2014, Knerr 2014)
Fig. 2.4: Frequency of the occurrence of consecutive summer days, hot days and tropical nights for the long-term period 1981 to 2010 at the Berlin-Alexanderplatz station (GEO-NET 2014, Knerr 2014)
Due to the higher temperatures in the inner city of Berlin, the number of frost days and ice days is significantly lower than at other measurement sites. However, a trend towards a decrease in the number

12
of these threshold days cannot be ascertained. The number of frost days remained nearly constant at the Berlin-Alexanderplatz measurement station over the last 30 years. The number of days with a maximum temperature of at most 0 °C decreased by only one day in this period (cf. Fig. 2.5).
Fig. 2.5: History of the threshold days frost day and ice day at the Berlin-Alexanderplatz station for the long-term period 1981 to 2010 (GEO-NET 2014, Knerr 2014)
Berlin-Dahlem Site
Coordinates of the current geographic location
Climate station: in WGS 84 [EPSG 4326]: R = 13° 18’ 6.2” H = 52° 27’ 13.3” in ETRS89 UTM 33N [EPSG 25833]: R = 384598.7 H = 5812859.2 Wind measurement (26 m above ground): in WGS 84 [EPSG 4326]: R = 13° 18’ 38.3” H = 52° 27’ 27.7” in ETRS89 UTM 33N [EPSG 25833]: R = 385216.1 H = 5813287.8
Measurement height Climate station: 51 m above sea level Wind measurement: 93 m above sea level
Operator Free University of Berlin In operation since April 1, 1908 (various sites) Annual mean of the air temperature (1981 to 2010)
9.5 °C
Highest temperature ever measured (up to end of 2013)
37.8 °C on July 11, 1959
Lowest temperature ever measured (up to the end of 2013)
-26.0 °C on February 11, 1929
Timeline of the changing measurement sites (cf. Photos 3.1 to 3.4)
Site First measurement Last measurement
Königin-Luise-Str. 22
Kiebitzweg 20
Podbielskiallee 62
Botanical Garden
April 1, 1908
December 1, 1949
October 3, 1951
July 12, 1997
? ?, 1962
October 2, 1951
July 11, 1997
ongoing

13
*) the data in italics/bold are unclear or unknown (Myrcik 2015).
Tab. 3.1: Characteristics of the Berlin-Dahlem climate station
Photo 3.1: Location of the Berlin-Dahlem station (see arrow mark). SenStadtUm 2014, aerial photography flight on March 30, 2014 (cf. also Fig. 0.1)
The Dahlem climate station has long been regarded as the Berlin reference station both for long-term observation and for current weather reporting. The station’s location changed several times – albeit within narrow confines – under the influence of the establishment and the initially varying locations of the Institute of Meteorology of the FU Berlin founded in 1948. Due to its significance for Berlin climate observation, its various sites since 1908 are documented in photographs below.
Photo 3.2: Site of the Dahlem climate station on the grounds of the Royal Gardening Academy (Königliche Gärtnerlehranstalt) at Königin-Luise-Str. 22 (period from April 1, 1908 to 1962) © Archive Institute of Meteorology (FU Berlin)
Photo 3.3: Site of the Dahlem climate station on the grounds of the first site of the Institute of Meteorology of the FU Berlin at Kibitzweg 20 (period from December 1 (uncertain) 1949 to October 2, 1951) © Archive Institute of Meteorology (FU Berlin)

14
Photo 3.4: Site of the Dahlem climate station on the grounds of the second site of the Institute of Meteorology of the FU Berlin at Podbielskiallee 62 (period from October 3, 1951 to July 11, 1997) © Archive Institute of Meteorology (FU Berlin)
Photo 3.5: Current site of the Dahlem climate station on the grounds of the Berlin Botanical Garden at Königin-Luise-Str. 6-8 (period since July 12, 1997) © Georg Myrcik
The measurement station of the Free University of Berlin is located about 13 km southwest of the city centre of Berlin in the Dahlem district of the borough Steglitz-Zehlendorf on the grounds of the Botanical Garden encompassing more than 43 ha (cf. Photo 3.1). The surroundings are characterised by mansions with spacious gardens and some smaller parks. To the west, the Dahlem district borders on the Berlin forest of Grunewald. The wind measurement station is located around 750 m to the northeast on the building of an FU institute on the Fichtenberg (Carl-Heinrich-Becker-Weg 10).
Long-term mean values Table 3.2 gives an overview of the long-term monthly mean values of selected climate parameters at the Dahlem station in the 30-year period 1981 to 2010 under consideration.
Berlin-Dahlem 1981-2010
monthly mean values Jan Feb Mar Apr May Jun Jul Aug Sep Oct Nov Dec annual
mean
air temperatures at a height of 2m in °C
mean air temperature 0.6 1.4 4.7 9.4 14.3 16.8 19.1 18.2 14.1 9.4 4.7 1.3 9.5
highest monthly mean 5.4 6.2 7.9 13.2 16.4 20.3 23.2 21.3 17.8 12.4 7.5 5.5 13.1
mean daily maximum 3.0 4.4 8.7 14.6 19.5 21.9 24.4 23.9 19.1 13.7 7.3 3.4 13.7
lowest monthly mean -6.9 -6.3 0.4 7.0 10.5 14.3 16.2 15.7 11.5 6.0 0.6 -4.7 5.4
mean daily minimum -2.0 -1.5 1.1 4.4 8.8 11.5 13.9 13.3 9.8 5.8 2.0 -1.0 5.5
summer days (maximum ≥ 25 °C) number
0 0 0 0.9 4.7 7.9 13.4 12.4 3.2 0.1 0 0 42.6
hot days (maximum ≥ 30 °C) number
0 0 0 0 0.5 1.6 4.2 2.6 0.1 0 0 0 9
tropical nights (minimum ≥ 20°C) number
0 0 0 0 0 0 0.3 0.1 0 0 0 0 1.4
frost days (minimum < 0°C) number
18.1 16.9 11.6 3.3 0.1 0 0 0 0 2.3 8.9 17.4 78.5

15
ice days (maximum < 0 °C) number
8 4.6 0.5 0 0 0 0 0 0 0 1.2 6.6 20.8
sunshine duration in hours 55 75 120 187 229 217 241 220 159 121 59 43 1,726
precipitation totals in mm 48 39 44 33 57 60 62 64 46 38 47 52 591
Tab. 3.2: Monthly mean values of climate parameters at the Berlin-Dahlem station for the long-term period 1981 to 2010 (statistical base DWD, processing GEO-NET 2014).
The climate diagram of the Berlin-Dahlem station is shown in Figure 3.1. It shows the averaged history of temperature and precipitation over the individual months over the 30-year period 1981 to 2010. August is the month with the most rainfall; the least precipitation occurs in the transitional seasons.
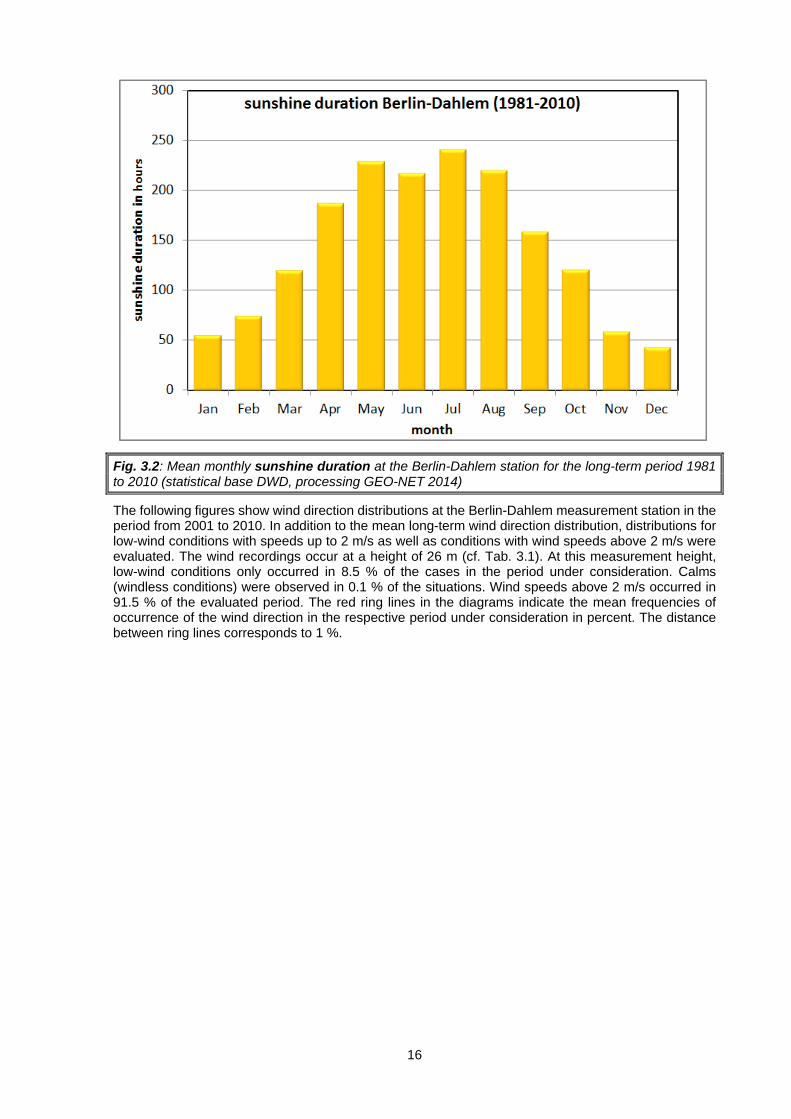
The sunshine diagram follows the temperature curve, as expected (cf. Fig. 3.2).
Fig. 3.1: Climate diagram of the Berlin-Dahlem station for the long-term period 1981 to 2010 (GEO-NET 2014, Knerr 2014)
16
Fig. 3.2: Mean monthly sunshine duration at the Berlin-Dahlem station for the long-term period 1981 to 2010 (statistical base DWD, processing GEO-NET 2014)
The following figures show wind direction distributions at the Berlin-Dahlem measurement station in the period from 2001 to 2010. In addition to the mean long-term wind direction distribution, distributions for low-wind conditions with speeds up to 2 m/s as well as conditions with wind speeds above 2 m/s were evaluated. The wind recordings occur at a height of 26 m (cf. Tab. 3.1). At this measurement height, low-wind conditions only occurred in 8.5 % of the cases in the period under consideration. Calms (windless conditions) were observed in 0.1 % of the situations. Wind speeds above 2 m/s occurred in 91.5 % of the evaluated period. The red ring lines in the diagrams indicate the mean frequencies of occurrence of the wind direction in the respective period under consideration in percent. The distance between ring lines corresponds to 1 %.

17
Fig. 3.3: Mean wind direction distribution in the period 2001 to 2010 at the Berlin-Dahlem measurement station (measurement height 26 m). The ring lines indicate the frequencies of occurrence of the wind directions, their distance corresponds to 1 % (statistical base DWD, processing GEO-NET 2014)
Fig. 3.4: Frequencies of the wind directions in the annual mean at the Berlin-Dahlem measurement station in the period 2001 to 2010 by wind speed (statistical base DWD, processing GEO-NET 2014).
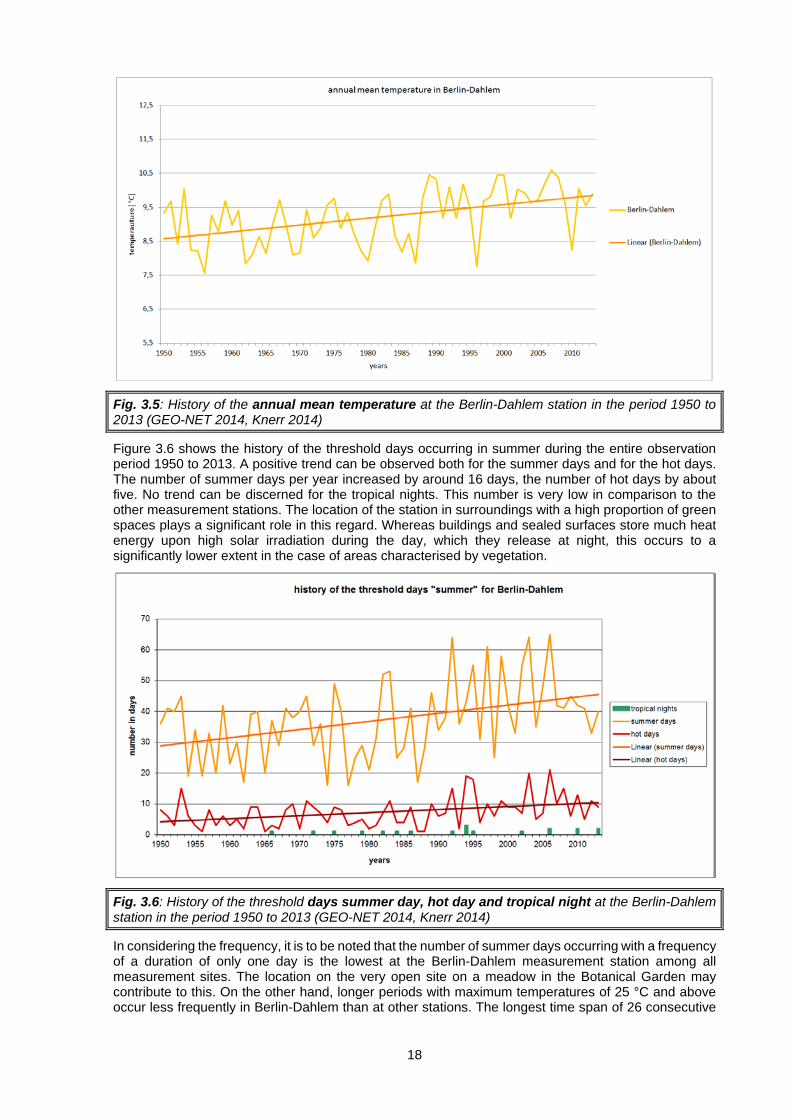
Developments, trends Figure 3.5 shows the history of the annual mean temperature of the years 1950 to 2013. The trend is increasing over the course of the measurement series, as for all other stations. In Berlin-Dahlem, this increase amounts to more than one Kelvin. A period of significantly lower temperatures between the mid-1950s until around 1970 can be discerned.
18
Fig. 3.5: History of the annual mean temperature at the Berlin-Dahlem station in the period 1950 to 2013 (GEO-NET 2014, Knerr 2014)
Figure 3.6 shows the history of the threshold days occurring in summer during the entire observation period 1950 to 2013. A positive trend can be observed both for the summer days and for the hot days. The number of summer days per year increased by around 16 days, the number of hot days by about five. No trend can be discerned for the tropical nights. This number is very low in comparison to the other measurement stations. The location of the station in surroundings with a high proportion of green spaces plays a significant role in this regard. Whereas buildings and sealed surfaces store much heat energy upon high solar irradiation during the day, which they release at night, this occurs to a significantly lower extent in the case of areas characterised by vegetation.
Fig. 3.6: History of the threshold days summer day, hot day and tropical night at the Berlin-Dahlem station in the period 1950 to 2013 (GEO-NET 2014, Knerr 2014)
In considering the frequency, it is to be noted that the number of summer days occurring with a frequency of a duration of only one day is the lowest at the Berlin-Dahlem measurement station among all measurement sites. The location on the very open site on a meadow in the Botanical Garden may contribute to this. On the other hand, longer periods with maximum temperatures of 25 °C and above occur less frequently in Berlin-Dahlem than at other stations. The longest time span of 26 consecutive

19
days is also shorter by five days than at the remaining stations. Tropical nights occurred on two consecutive days only in one case (July 27 and 28, 2013) (cf. Fig. 3.7).
Fig. 3.7: Frequency of occurrence of consecutive summer days, hot days and tropical nights for the long-term period 1981 to 2010 at the Berlin-Dahlem station (GEO-NET 2014, Knerr 2014)
The decrease in the number of frost days and ice days occurring (cf. Fig. 3.8) is probably also a contributing effect of global warming. The number of frost days decreased by around eight days on average in the period 1950 to 2013, the number of ice days by around five days.
Fig. 3.8: History of the threshold days frost day and ice day at the Berlin-Dahlem station in the period 1950 to 2013 (GEO-NET 2014, Knerr 2014)
Berlin-Grunewald Site
Coordinates of the current geographic location
in WGS 84 [EPSG 4326]: R = 13° 13’ 30.2” H = 52° 28’ 23.8”
20
in ETRS89 UTM 33N [EPSG 25833]: R = 379543.9 H = 5815161.6
Measurement height Climate station: 58 m above sea level Wind measurement: 85 m above sea level
Operator Senate Department for Urban Development and the Environment
In operation since February 1988 Annual mean of the air temperature (1988 to 2012)
8.9 °C
Highest temperature ever measured (up to the end of 2012)
37.3 °C on July 11, 2010
Lowest temperature ever measured (up to the end of 2012)
-20.9 °C on January 2, 1997
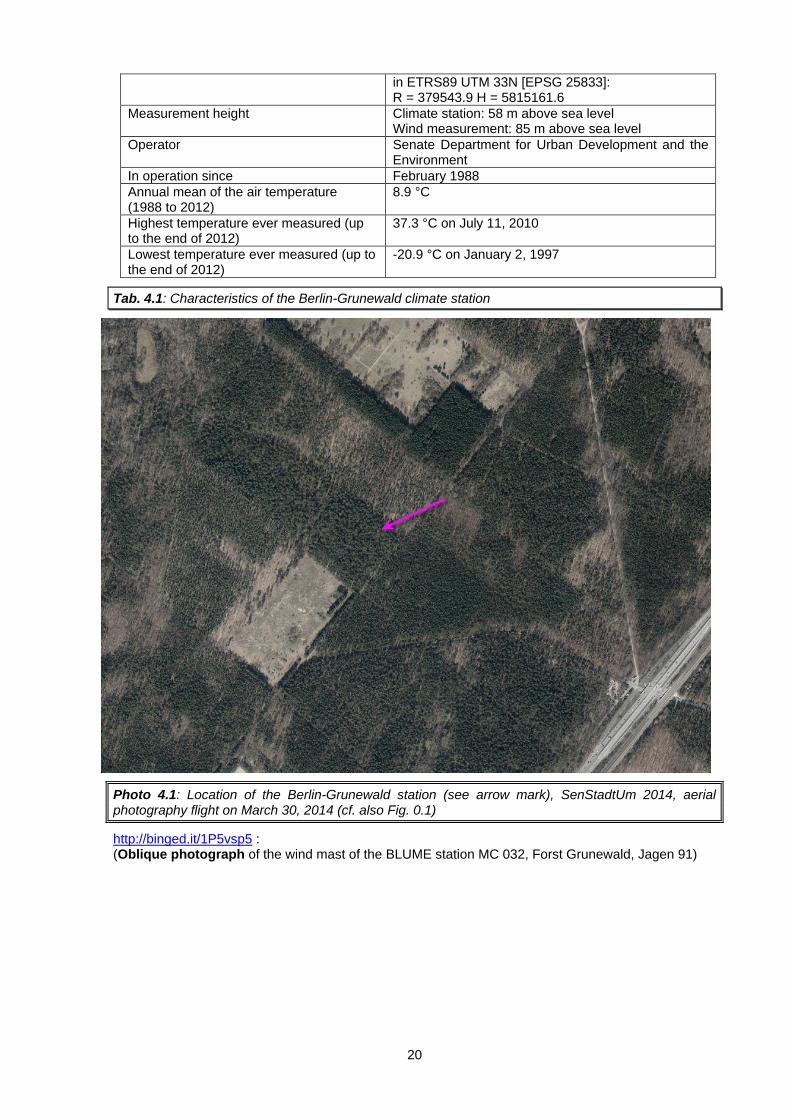
Tab. 4.1: Characteristics of the Berlin-Grunewald climate station
Photo 4.1: Location of the Berlin-Grunewald station (see arrow mark), SenStadtUm 2014, aerial photography flight on March 30, 2014 (cf. also Fig. 0.1)
http://binged.it/1P5vsp5 : (Oblique photograph of the wind mast of the BLUME station MC 032, Forst Grunewald, Jagen 91)

21
Photo 4.2: View of the BLUME station MC 032 Forst Grunewald Jagen 91
The Grunewald measurement station is an exceptional case among the Berlin stations being evaluated here. The station of the Berlin Air Quality Monitoring Network BLUME is located within a stand of sparse pine trees of about 20 m height in the Grunewald forest. The air temperature and humidity are recorded at heights of 2 and 18 m, respectively; the wind measurements occur at a height of 27 m above ground and thus about 7 m above the level of the tree tops. The measurements of the meteorological parameters thus reflect the local climate of the adjoining forest. Due to the location, the long-term annual mean of the air temperature takes the lowest values among the Berlin stations under consideration. In contrast to the other evaluations, the monthly mean values given refer to the 25-year period from 1988 to 2012.
Long-term mean values Table 4.2 gives an overview of the long-term monthly mean values of selected climate parameters at the Grunewald station in the 25-year period 1988-2012 under consideration.
Berlin-Grunewald 1988-2012
monthly mean values Jan Feb Mar Apr May Jun Jul Aug Sep Oct Nov Dec annual
mean
air temperatures at a height of 2m in °C
mean air temperature 0.8 1.6 4.7 9.3 13.3 15.5 17.6 16.6 13.3 8.9 4.1 1.3 8.9
highest monthly mean 5.8 5.6 8.0 13.9 15.9 19.3 23.1 20.6 17.5 12.6 7.9 6.0 13.0
mean daily maximum 2.9 4.4 8.6 14.6 18.5 20.0 22.3 21.2 17.4 12.5 6.3 3.1 12.7
lowest monthly mean -4.2 -3.3 0.9 6.4 9.6 13.5 15.5 15.9 10.6 5.7 0.4 -4.3 5.6

22
mean daily minimum -1.4 -1.2 1.0 4.0 7.9 10.6 13.0 12.2 9.5 5.6 1.9 -0.8 5.2
summer days (maximum ≥ 25 °C) number
0 0 0 1.4 4.2 6 10.8 8.8 1.8 0 0 0 33
hot days (maximum ≥ 30 °C) number
0 0 0 0.4 0.4 1 3.3 1.7 0.04 0 0 0 6.5
tropical nights (minimum ≥ 20°C) number
0 0 0 0 0 0.04 0.4 0.04 0 0 0 0 0.48
frost days (minimum < 0°C) number
16.3 16.1 12.5 5.1 0.2 0 0 0 0 3.2 8.9 15.8 78.1
ice days (maximum < 0 °C) number
7.2 4.4 0.5 0 0 0 0 0 0 0 1.4 6.1 19.6
Tab. 4.2: Monthly mean values of climate parameters at the Berlin-Grunewald station (1988 to 2012), (data provided by SenStadtUm 2013, processed by GEO-NET 2014).
At the Berlin-Grunewald station, too, the measurements from 1988 to 2010 were taken into account for the climate diagram. One precipitation measurement series is missing for the Berlin-Grunewald station (cf. Tab. 4.2) because primarily aerosols are measured within the Berlin Air Quality Monitoring Network and only a few meteorological parameters are recorded in addition.
Fig. 4.1: Climate diagram for the Berlin-Grunewald station for the period 1988 to 2010 (Knerr 2014)
The following figures show wind direction distributions at the Berlin-Grunewald measurement station in the period from 2001 to 2010. In addition to the mean long-term wind direction distribution, distributions for low-wind conditions with speeds up to 2 m/s as well as conditions with wind speeds above 2 m/s were evaluated. At this measurement height, low-wind conditions occurred in 38.1 % of the cases in the period under consideration. Wind speeds above 2 m/s occurred 61.9 % of the time. Due to the

23
measurements at a height of only about 7 metres above the trees with a height of 20 m, the lowest wind speeds were recorded here among the stations evaluated. The red ring lines in the diagrams indicate the mean frequencies of occurrence of the wind direction in the respective period under consideration in percent. The distance between ring lines corresponds to 1 %.
Fig. 4.2: Mean wind direction distribution in the period 2001 to 2010 at the Berlin-Grunewald measurement station (measurement height 27 m, about 7 m above trees 20 m high), (data provided by SenStadtUm, processed by GEO-NET2014).
Fig. 4.3: Frequencies of the wind directions in the annual mean in the period 2001 to 2010 at the Berlin-Grunewald measurement station by wind speed (data provided by SenStadtUm 2013, processed by GEO-NET 2014)

24
Developments, trends Figure 4.4 shows the history of the annual mean temperature of the years 1988 to 2012. As for all other stations, the trend is increasing over the course of the measurement series. In Berlin-Grunewald, this increase amounts to more than one Kelvin. In 1993, measurements were missed over several weeks between June 4 and September 12.
Fig. 4.4: History of the annual mean temperature at the Berlin-Grunewald site in the measurement period 1988 to 2012 (GEO-NET 2014, Knerr 2014)
The number of summer days and hot days is also increasing at the Berlin-Grunewald station. With a plus of about seven summer days and four hot days, the increase is not quite as marked as at the other stations evaluated (cf. Fig. 4.5). Here, too, it has to be taken into consideration that several weeks of measurements were missed in 1993 between June 4 and September 12.
Fig. 4.5: History of the threshold days summer day, hot day and tropical night for the Berlin-Grunewald station in the measurement period 1988 to 2012 (GEO-NET 2014, Knerr 2014)
For the years with a strongly positively deviating number of threshold days, on the one hand the year 2003 is notable, in which very warm conditions prevailed over a long period, leading to a high number of summer days. However, in 2006 significantly higher temperatures than in 2003 were measured over a shorter period, leading to the maximum number of heat days during the entire measurement period.

25
The Berlin-Grunewald station records by far the fewest summerly threshold days due to the location in a forest area that is peripheral by Berlin standards.
The measurement period being shortened by at least 7 years would tend to play only a minor role in this context, as the preceding years had significantly fewer threshold days (cf. Fig. 3.6 for Dahlem).
Fig. 4.6: Frequency of occurrence of consecutive summer days, hot days and tropical nights for the 23-year period 1988 to 2010 at the Berlin-Grunewald station (GEO-NET 2014, Knerr 2014)
Complementing the rise in summer threshold days, the number of frost days decreased in the trend at the Berlin-Grunewald measurement station, if only by about 6 days, whereas the number of days with a maximum temperature under 0 °C (ice days) increased by the same amount (cf. Fig. 4.7).
Abb. 4.7: History of the winter threshold days frost day and ice day at the Berlin-Grunewald station in the measurement period 1988 to 2012 (GEO-NET 2014, Knerr 2014)

26
Berlin-Tegel Site
Coordinates of the current geographic location
in WGS 84 [EPSG 4326]: R = 13° 18’ 31.8” H = 52° 33’ 51.8” in ETRS89 UTM 33N [EPSG 25833]: R = 385371.1 H = 5825159.9
Measurement height Climate station: 36 m above sea level, Wind measurement: 46 m above sea level
Operator German Meteorological Service DWD (aviation weather station)
In operation since January 1, 1963 Annual mean of the air temperature (1981 to 2010)
10.0 °C
Highest temperature ever measured (up to the end of 2013)
37.7 °C on July 11, 2010
Lowest temperature ever measured (up to the end of 2013)
-24.4 °C on January 31, 1963
Tab. 5.1: Characteristics of the Berlin-Tegel climate station
Photo 5.1: Location of the Berlin-Tegel aviation weather station (see arrow mark). SenStadtUm 2014, aerial photography flight on March 30, 2014 (cf. also Fig. 0.1)
The Berlin-Tegel measurement station is located on the airport compound in the northeast of the municipal area of Berlin, about 9 km from the city centre. The area to the north and northwest of the airport is characterised by large forest and lake areas, whereas partly dense development is found from northeast to south. The wind measurements are performed at a height of 10 m above ground. The measurements for the station go back to the beginning of 1963.
Long-term mean values Table 5.2 gives an overview of the long-term monthly mean values of selected climate parameters at the Tegel station in the 30-year period 1981 to 2010 under consideration.
Berlin-Tegel 1981-2010
monthly mean values Jan Feb Mar Apr May Jun Jul Aug Sep Oct Nov Dec annual
mean

27
air temperatures at a height of 2m in °C
mean air temperature 0.8 1.6 5 9.7 14.7 17.3 19.8 19.1 14.8 10.1 5 1.7 10
highest monthly mean 5.5 6.9 8.2 13.8 17.0 20.6 24.4 22.5 18.9 13.3 8.0 5.8 13.7
mean daily maximum 3.2 4.5 8.7 14.4 19.5 22.0 24.6 24.1 19.3 13.9 7.6 3.7 13.8
lowest monthly mean -7.1 -6.7 0.4 7.2 10.7 14.9 16.9 16.3 11.9 6.5 0.7 -4.1 5.6
mean daily minimum -1.8 -1.4 1.3 4.7 9.3 12.3 14.7 14.3 10.6 6.5 2.4 -0.7 6.0
summer days (maximum ≥ 25 °C) number
0 0 0 0.9 4.5 7.7 13.8 12.9 3.3 0.1 0 0 43.3
hot days (maximum ≥ 30 °C) number
0 0 0 0 0.4 1.6 4.5 2.8 0.1 0 0 0 9.4
tropical nights (minimum ≥ 20°C) number
0 0 0 0 0 0.2 1.6 0.5 0 0 0 0 2.3
frost days (minimum < 0°C) number
17.1 16.4 10.8 3.2 0.1 0 0 0 0 1.9 8.2 16.2 73.8
ice days (maximum < 0 °C) number
7.4 4.7 0.6 0 0 0 0 0 0 0 1.1 6.2 20
sunshine duration in hours 51 70 114 181 227 216 239 220 152 116 55 41 1682
precipitation totals in mm 43 34 41 31 54 56 60 63 44 37 42 46 549
Tab. 5.2: Monthly mean values of climate parameters at the Berlin-Tegel station for the long-term period 1981-2010 (statistical base DWD, processing GEO-NET 2014).
The climate diagram of the Berlin-Tegel station is shown in Figure 5.1. It shows an averaged history of temperature and precipitation of the individual months of the 30-year period from 1981 to 2010. August is the month with the most rainfall; the least precipitation occurs in the transitional seasons.

28
Fig. 5.1: Climate diagram for the Berlin-Tegel station for the long-term period 1981 to 2010 (GEO-NET 2014, Knerr 2014)
The sunshine diagram follows the temperature curve, as expected (cf. Fig. 5.2).
Fig. 5.2: Mean monthly sunshine duration at the Berlin-Tegel climate station for the long-term period 1981 to 2010 (statistical base DWD, processing GEO-NET 2014).

29
The following figures show wind direction distributions at the Tegel aviation weather station in the period from 2001 to 2010. In addition to the mean long-term wind direction distribution, distributions for low-wind conditions with speeds up to 2 m/s as well as conditions with wind speeds above 2 m/s were evaluated. Low-wind conditions were recorded in 24.6 % of the cases in the period under consideration. Calms (windless conditions) were observed in 0.6 % of the situations. Wind speeds above 2 m/s occurred in 75.4 % of the evaluated period. The red ring lines in the diagrams indicate the mean frequencies of occurrence of the wind direction in the respective period under consideration in percent. The distance between ring lines corresponds to 1 %.
Fig. 5.3: Mean wind direction distribution in the period 2001 to 2010 at the Berlin-Tegel aviation weather station (measurement height 10 m). The ring lines indicate the frequencies of occurrence of the wind directions, their distance corresponds to 1 % (statistical base DWD, processing GEO-NET 2014).
Fig. 5.4: Frequencies of the wind directions in the annual mean in the period 2001 to 2010 at the Berlin-Tegel aviation weather station by wind speed (statistical base DWD, processing GEO-NET 2014).

30
Developments, trends Figure 5.5 shows the history of the annual mean temperature of the years 1963 to 2013. The trend is increasing in the course of the measurement series, as for all other stations. In Berlin-Tegel, this increase amounts to more than 1.5 Kelvin, the largest increase among the six stations under consideration.
Fig. 5.5: History of the annual mean temperature at the Berlin-Tegel station in the measurement period 1963 to 2013 (GEO-NET 2014, Knerr 2014)
Figure 5.6 illustrates the history of the threshold days occurring in summer for the entire observation period 1963 to 2013. Both the summer days and the hot days exhibit a positive trend. The number of summer days per year increased by about 16 days, the number of hot days by about four. The number of tropical nights shows no clear tendency.
Fig. 5.6: History of the threshold days summer day, hot day and tropical night at the Berlin-Tegel station in the measurement period 1963 to 2013 (GEO-NET 2014, Knerr 2014)
Although the temperatures at the Berlin-Tegel station rose by 1.6 °C in the last 50 years, there is no marked difference in the increase of summerly threshold days in comparison with the other five stations. In the trend, the number of summer days in 2013 was 16 days above the initial values in 1963; the number of hot days increased by four days.
31
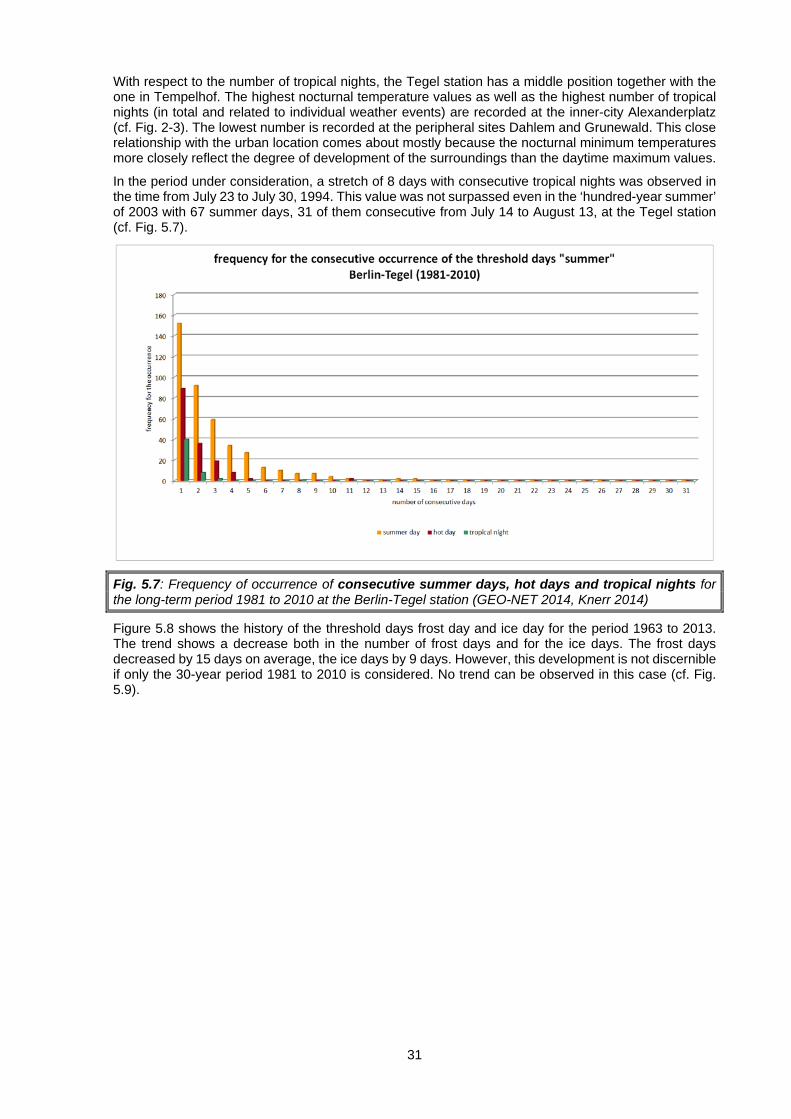
With respect to the number of tropical nights, the Tegel station has a middle position together with the one in Tempelhof. The highest nocturnal temperature values as well as the highest number of tropical nights (in total and related to individual weather events) are recorded at the inner-city Alexanderplatz (cf. Fig. 2-3). The lowest number is recorded at the peripheral sites Dahlem and Grunewald. This close relationship with the urban location comes about mostly because the nocturnal minimum temperatures more closely reflect the degree of development of the surroundings than the daytime maximum values.
In the period under consideration, a stretch of 8 days with consecutive tropical nights was observed in the time from July 23 to July 30, 1994. This value was not surpassed even in the ‘hundred-year summer’ of 2003 with 67 summer days, 31 of them consecutive from July 14 to August 13, at the Tegel station (cf. Fig. 5.7).
Fig. 5.7: Frequency of occurrence of consecutive summer days, hot days and tropical nights for the long-term period 1981 to 2010 at the Berlin-Tegel station (GEO-NET 2014, Knerr 2014)
Figure 5.8 shows the history of the threshold days frost day and ice day for the period 1963 to 2013. The trend shows a decrease both in the number of frost days and for the ice days. The frost days decreased by 15 days on average, the ice days by 9 days. However, this development is not discernible if only the 30-year period 1981 to 2010 is considered. No trend can be observed in this case (cf. Fig. 5.9).

32
Fig. 5.8: History of the threshold days frost day and ice day at the Berlin-Tegel station in the measurement period 1963 to 2013 (GEO-NET 2014, Knerr 2014)
Fig. 5.9: History of the threshold days frost day and ice day at the Berlin-Tegel station for the long-term period 1981 to 2010 (GEO-NET 2014, Knerr 2014)
Berlin-Tempelhof Site
Coordinates of the current geographic location
in WGS 84 [EPSG 4326]: R = 13° 24’ 7.6” H = 52° 28’ 2.8” in ETRS89 UTM 33N [EPSG 25833]: R = 391453.5 H = 5814232.3
Measurement height 49 m above sea level Operator German Meteorological Service DWD In operation since January 1, 1948
33
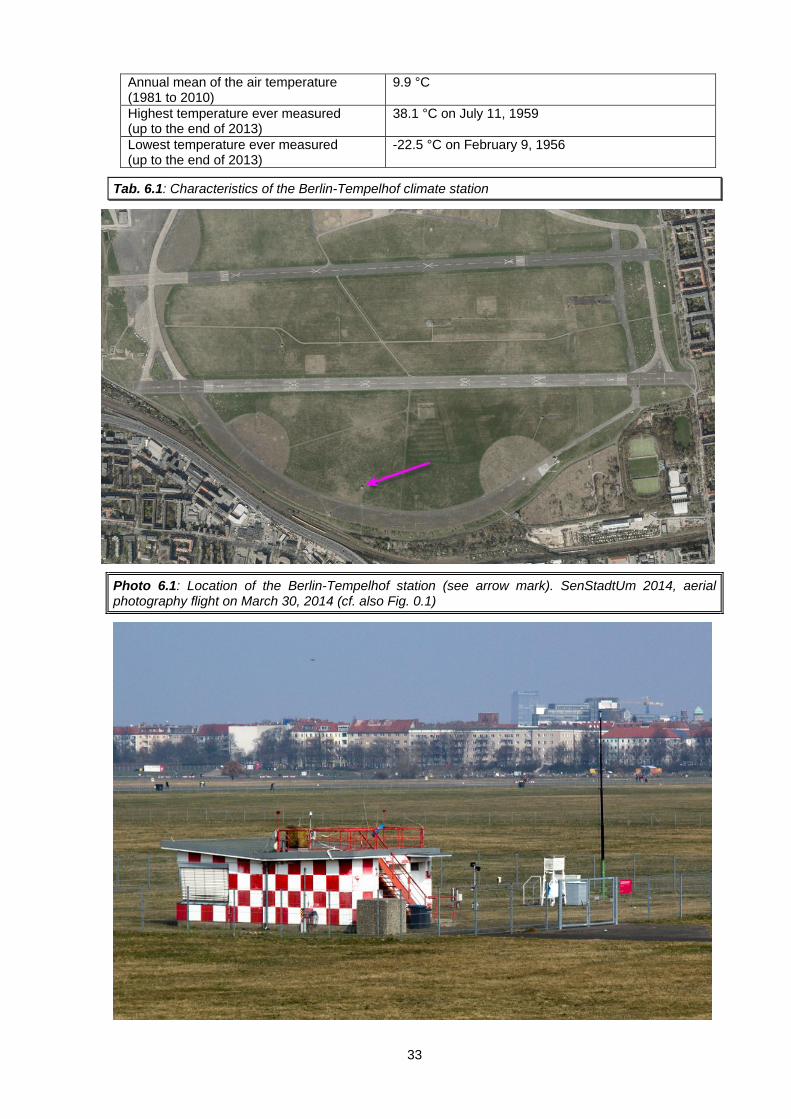
Annual mean of the air temperature (1981 to 2010)
9.9 °C
Highest temperature ever measured (up to the end of 2013)
38.1 °C on July 11, 1959
Lowest temperature ever measured (up to the end of 2013)
-22.5 °C on February 9, 1956
Tab. 6.1: Characteristics of the Berlin-Tempelhof climate station
Photo 6.1: Location of the Berlin-Tempelhof station (see arrow mark). SenStadtUm 2014, aerial photography flight on March 30, 2014 (cf. also Fig. 0.1)

34
Photo 6.2: View of the Berlin-Tempelhof station; photo: Andreas Machate (cf. also Fig. 0.1)
The Tempelhof measurement site of the German Meteorological Service is located in the inner-city area, about 2.5 km south of the eastern city centre, on the southern edge of the Tempelhofer Feld, the former central Tempelhof Airport, which is characterised by green and free spaces. The wind measurements are taken at a height of 10 m above ground. Measurements for this station go back to the beginning of 1948.
For the Berlin-Tempelhof measurement station, data from about 65 years of weather records are available for the present evaluations; only the Potsdam time series goes back (albeit significantly) further.
Long-term mean values Table 6.2 gives an overview of the long-term monthly mean values of selected climate parameters at the Tempelhof station in the 30-year period 1981 to 2010 under consideration.
Berlin-Tempelhof 1981-2010
monthly mean values Jan Feb Mar Apr May Jun Jul Aug Sep Oct Nov Dec annual
mean
air temperatures at a height of 2m in °C
mean air temperature 0.8 1.5 4.9 9.6 14.6 17.3 19.8 19.2 14.9 10 4.9 1.6 9.9
hightest monthly mean 5.5 6.7 8.3 13.5 16.8 20.5 24.4 22.3 18.5 13.1 8.2 5.7 13.6
mean daily maximum 3.2 4.4 8.6 14.2 19.4 21.9 24.6 24.1 19.3 13.8 7.5 3.7 13.7
lowest monthly mean -6.9 -6.4 0.5 7.2 10.8 15.0 16.9 16.4 11.8 6.5 0.3 -4.0 5.7
mean daily minimum -1.9 -1.4 1.4 4.8 9.4 12.4 14.8 14.4 10.8 6.5 2.4 -0.8 6.1
summer days (maximum ≥ 25 °C) number
0 0 0 0.8 4.2 7.9 13.9 12.9 3.1 0.1 0 0 42.8
hot days (maximum ≥ 30 °C) number
0 0 0 0 0.4 1.7 4.6 2.9 0.1 0 0 0 9.6
tropical nights (minimum ≥ 20°C) number
0 0 0 0 0 0.1 0.8 0.4 0 0 0 0 1.5
frost days (minimum < 0°C) number
17.4 16 10.7 2.3 0 0 0 0 0 1.6 8.6 16.5 73.2
ice days (maximum < 0 °C) number
7.8 4.8 0.6 0 0 0 0 0 0 0 1.1 6.3 20.7
sunshine duration in hours 52 74 116 181 222 220 238 220 157 118 56 41 1,693
precipitation totals in mm 48 38 43 33 56 60 60 59 47 38 45 50 576
Tab. 6.2: Monthly mean values of climate parameters at the Berlin-Tempelhof station in the long-term period 1981 to 2010 (statistical base DWD, processing GEO-NET 2014).
The climate diagram of the Tempelhof station is shown in Figure 6.1. In Berlin-Tempelhof, the distribution of precipitation in the summer months is slightly shifted with respect to the other stations. The month with the most precipitation in the entire year is already June, not August.

35
Fig. 6.1: Climate diagram for the Berlin-Tempelhof station for the long-term period 1981 to 2010 (GEO-NET 2014, Knerr 2014)
Fig. 6.2: Mean monthly sunshine duration at the Berlin-Tempelhof climate station for the long-term period 1981 to 2010 (statistical base DWD, processing GEO-NET 2014).

36
The following figures show wind direction distributions at the Tempelhof station in the period from 2001 to 2010. In addition to the mean long-term wind direction distribution, distributions for low-wind conditions with speeds up to 2 m/s as well as conditions with wind speeds above 2 m/s were evaluated. Low-wind conditions were recorded in 17.5 % of the cases in the period under consideration. Calms were observed in 0.2 % of the situations. Wind speeds above 2 m/s occurred in 82.5 % of the evaluated period. Further, wind direction distributions were evaluated for the summer and winter half-years. For both half-years, winds from 270° occur with the highest frequencies. While the secondary maximum is formed by winds from the east in the summer half-year, winds from southwestern directions occur with the second-highest frequency in the winter half-year.
The red ring lines in the diagrams indicate the mean frequencies of occurrence of the wind direction in the respective period under consideration in percent. The distance between ring lines corresponds to 1 %.
Fig. 6.3: Mean wind direction distribution in the period 2001 to 2010 at the Berlin-Tempelhof climate station (measurement height 10 m). The ring lines indicate the frequencies of occurrence of the wind directions, their distance corresponds to 1 % (statistical base DWD, processing GEO-NET 2014).

37
Fig. 6.4: Frequencies of the wind directions in the annual mean for the period 2001-2010 at the Berlin-Tempelhof climate station by wind speed (measurement height 10 m). The ring lines indicate the frequencies of occurrence of the wind directions, their distance corresponds to 1 % (statistical base DWD, processing GEO-NET 2014).
Fig. 6.5: Mean frequencies of the wind directions in the summer and winter half-years of the period 2001-2010 at the Berlin-Tempelhof climate station (measurement height 10 m). The ring lines indicate the frequencies of occurrence of the wind directions, their distance corresponds to 1 % (statistical base DWD, processing GEO-NET 2014).
Developments, trends Figure 6.6 shows the history of the annual mean temperature of the years 1948 to 2013. The trend is increasing over the course of the measurement series, as for all other stations, by about 1 Kelvin. Here, too, a period of significantly lower temperatures between the mid-1950s until around 1970 can be discerned.
Fig. 6.6: History of the annual mean temperature at the Berlin-Tempelhof site in the measurement period 1948 into 2013 (GEO-NET 2014, Knerr 2014)
For the summerly threshold days, regardless of the respective measurement period Figures 6.7 and 6.8 show a strong increase in summer days, in the longer trend since 1948 by 17 summer days. The number of hot days increases by about six days. While the history of the number of tropical nights exhibits no trend, the relatively high number of nighttime hours with temperatures not below 20 °C at this open site is notable. In the summer of 1994, the highest hitherto recorded number of 10 tropical nights occurred.

38
The warmest summer night was measured with a minimum temperature of 23.4 °C in the summer of 2010 on July 11.
Fig. 6.7: History of the threshold days summer day, hot day and tropical night at the Berlin-Tempelhof station in the measurement period 1948 to 2013 (GEO-NET 2014, Knerr 2014)
Fig. 6.8: History of the threshold days summer day, hot day and tropical night at the Berlin-Tempelhof station for the long-term period 1981 to 2010 (GEO-NET 2014, Knerr 2014)
Despite the high number of tropical nights, these mostly occur individually and not consecutively. 1994 is a ‘special’ year with record values: From July 26 to August 2, the temperature did not fall below 20 °C in eight consecutive nights; during the days, too, there was a heat wave, so that on eleven consecutive days (July 22 to August 1, 1994) the daily maximum values were above 30 °C (cf. Fig. 6.9).

39
Fig. 6.9: Frequency of occurrence of consecutive summer days, hot days and tropical nights for the long-term period 1981 to 2010 at the Berlin-Tempelhof station (GEO-NET 2014, Knerr 2014)
The winterly threshold days frost day and ice day exhibited a negative trend also at the Berlin-Tempelhof station. The frost days decreased by about seven days since records began in Tempelhof; the ice days decreased by 4 days per year in the trend (cf. Fig. 6.10).
Fig. 6.10: History of the threshold days frost day and ice day at the Berlin-Tempelhof station in the measurement period 1948 to 2013 (GEO-NET 2014, Knerr 2014)
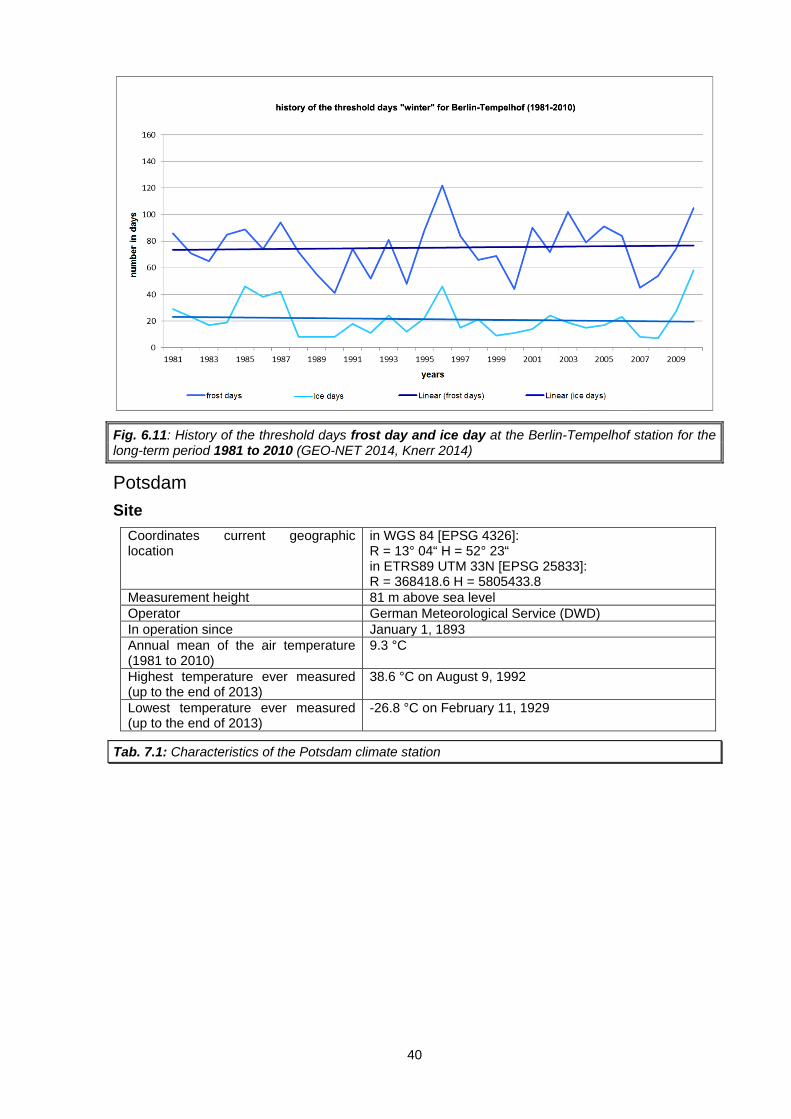
In the representation focused on the 30-year period 1981 to 2010, it is notable that here the trend exhibits an increase in the frost days. This is due to the very high number of these threshold days in 1996 and 2010 (cf. Fig. 6.11 as well as Fig. 5.9 for the Tegel station).
40
Fig. 6.11: History of the threshold days frost day and ice day at the Berlin-Tempelhof station for the long-term period 1981 to 2010 (GEO-NET 2014, Knerr 2014)
Potsdam Site
Coordinates current geographic location
in WGS 84 [EPSG 4326]: R = 13° 04“ H = 52° 23“ in ETRS89 UTM 33N [EPSG 25833]: R = 368418.6 H = 5805433.8
Measurement height 81 m above sea level Operator German Meteorological Service (DWD) In operation since January 1, 1893 Annual mean of the air temperature (1981 to 2010)
9.3 °C
Highest temperature ever measured (up to the end of 2013)
38.6 °C on August 9, 1992
Lowest temperature ever measured (up to the end of 2013)
-26.8 °C on February 11, 1929
Tab. 7.1: Characteristics of the Potsdam climate station

41
Photo 7.1: Location of the Potsdam-Telegrafenberg station (see arrow mark). © OpenStreetMap accessed April 21, 2015
The Potsdam climate station is the only meteorological station worldwide that exhibits such a comprehensive measurement programme without gaps over a time period of more than 100 years without a change in the site or the measurement and observation methods. It is therefore called a “long-term meteorological station”. Much further historical and current information about the station is available here: “Long-Term Meteorological Station Potsdam-Telegrafenberg” (accessed March 15, 2015).
The station lies in the southwest of Potsdam approx. 600 m outside the built-up zone on the elevation of the so-called Telegraph Mountain (Telegrafenberg). It is located at a height of 81 m above sea level on the edge of an expansive forest area. The immediate surroundings of the measurement field are flat and surrounded by trees of 15 - 20 m height at a distance of approx. 50 - 100 m. The measurement meadow has a size of 1,200 m² and adjoins the building of the former Meteorological Observatory, on whose tower both the radiation and wind measurements and, due to the free view in all directions, the ocular observations are carried out (PIK 2015).
Long-term mean values Table 7.2 gives an overview of the long-term monthly mean values of selected climate parameters at the Potsdam station in the 30-year period 1981 to 2010 under consideration.
Potsdam 1981-2010
monthly mean values Jan Feb Mar Apr May Jun Jul Aug Sep Oct Nov Dec annual
mean
air temperatures at a height of 2m in °C
mean air temperature 0.2 1 4.4 9.2 14.1 16.6 19 18.3 14.2 9.4 4.4 1 9.3
highest monthly mean 5.0 6.2 7.6 13.2 16.1 19.8 23.6 21.1 17.9 12.5 7.4 5.2 13.0
mean daily maximum 2.8 4.3 8.8 14.8 19.8 22.1 24.7 24.2 19.3 13.7 7.1 3.2 13.7
lowest monthly mean -7.3 -7.2 -0.3 6.6 10.3 14.3 16.0 15.5 11.2 6.0 0.0 -4.5 5.1

42
mean daily minimum -2.5 -2.0 0.7 4.1 8.7 11.6 13.9 13.6 10.1 5.9 1.7 -1.4 5.4
summer days (maximum ≥ 25 °C) number
0 0 0 1.2 5.3 8.5 13.8 13.6 3.4 0.1 0 0 45.9
hot days (maximum ≥ 30 °C) number
0 0 0 0.1 0.6 1.8 4.9 3.2 0.1 0 0 0 10.7
tropical nights (minimum ≥ 20 °C) number
0 0 0 0 0 0.03 0.3 0.13 0 0 0 0 0.5
frost days (minimum < 0°C) number
19.2 18.2 12.8 3.4 0 0 0 0 0 1.9 10 18.4 83.8
ice days (maximum < 0 °C) number
8.2 4.8 0.5 0 0 0 0 0 0 0 1.4 7.1 22
sunshine duration in hours 55 77 120 187 232 220 242 224 160 122 60 45 1742
precipitation totals in mm 46 39 42 34 57 61 61 64 47 37 46 53 586
Tab. 7.2: Monthly mean values of climate parameters at the Potsdam station for the long-term period 1981 to 2010 (statistical base DWD, processing GEO-NET 2014)
Figure 7.1 shows the climate diagram for the Potsdam station. It shows an averaged history of temperature and precipitation for the long-term period 1981 to 2010. Most of the precipitation occurs in the summer months, as is typical of the predominant climate. With 9.34 °C, the average temperature is about half a degree Celsius higher than in the entire measurement period 1893 to 2013.

43
Fig. 7.1: Climate diagram for the Potsdam station for the long-term period 1981 to 2010 (GEO-NET 2014, Knerr 2014)
Fig. 7.2: Mean monthly sunshine duration at the Potsdam station for the long-term period 1981 to 2010 (statistical base DWD, processing GEO-NET 2014).
Developments, trends
Fig. 7.3: History of the annual mean temperature at the Potsdam station in the measurement period 1893 to 2013 (GEO-NET 2014, Knerr 2014)
Figure 7.3 shows the history of the annual average temperature since climate records began on January 1, 1893, up to the end of 2013. In addition to some natural fluctuations, it can also be discerned that the annual mean temperature rises significantly over the course of the measured last 120 years. Whereas in the early measurement years the annual mean temperature was around 8 °C , in recent years average values between 9.5 and 10.5 °C were usually reached. This temperature rise is also illustrated by the trend line.

44
With an average temperature of 8.85 °C over the entire period, the Potsdam station exhibits the lowest temperature of all stations compared. Besides the peripheral location, which was not subject to significant changes due to construction in its surroundings, a reason for this lies in the long measurement series of 120 years, which also includes temperature values that have not yet been influenced by anthropogenic climate change.
Figure 7.4 shows the histories of the threshold days summer day, hot day and tropical night. The individual trend lines for summer days and hot days illustrate the increase in threshold days in the measurement period. Whereas the number of summer days was 34 per year in 1893, in the trend it increased by 16 to 50 days per year in 2013.
In the development of the hot days, the increase in the case numbers is naturally slowed down and amounts to 3 days in the trend over the entire measurement period. However, here, too, significant fluctuations are observed in the course of the 120 measurement years. With 26 days, the year 1947 recorded the most hot days. With respect to the tropical nights, a clustering in the current decade can be observed.
Fig. 7.4: History of the threshold days summer day, hot day and tropical night for the Potsdam station in the measurement period 1893 to 2013 (GEO-NET 2014, Knerr 2014)
If only the 30-year period from 1981 to 2010 is considered in Figure 7.5, it becomes apparent that it was primarily in this last quarter of the entire measurement time that most of the increase in the summerly threshold days occurred (in the case of the summer days about 70 % of the total increase).

45
Fig. 7.5: History of the threshold days summer day, hot day and tropical night at the Potsdam station for the long-term period 1981 to 2010 (GEO-NET 2014, Knerr 2014)
Under stable summerly high-pressure weather conditions with low winds, an enduring rise in air temperatures may occur over several days or over weeks. Figure 7.6 shows the frequency of consecutive threshold days in the long-term period 1981 to 2010. In the “hundred-year summer” of 2003, daily maximum temperatures were at least 25 °C throughout about four weeks in the period from July 13 to August 12; on 17 of these days the criterion of a hot day was even fulfilled (temperature maximum 30 °C or more).
Fig. 7.6: Frequency of occurrence of consecutive summer days, hot days and tropical nights for the long-term period 1981 to 2010 at the Potsdam station (GEO-NET 2014, Knerr 2014)
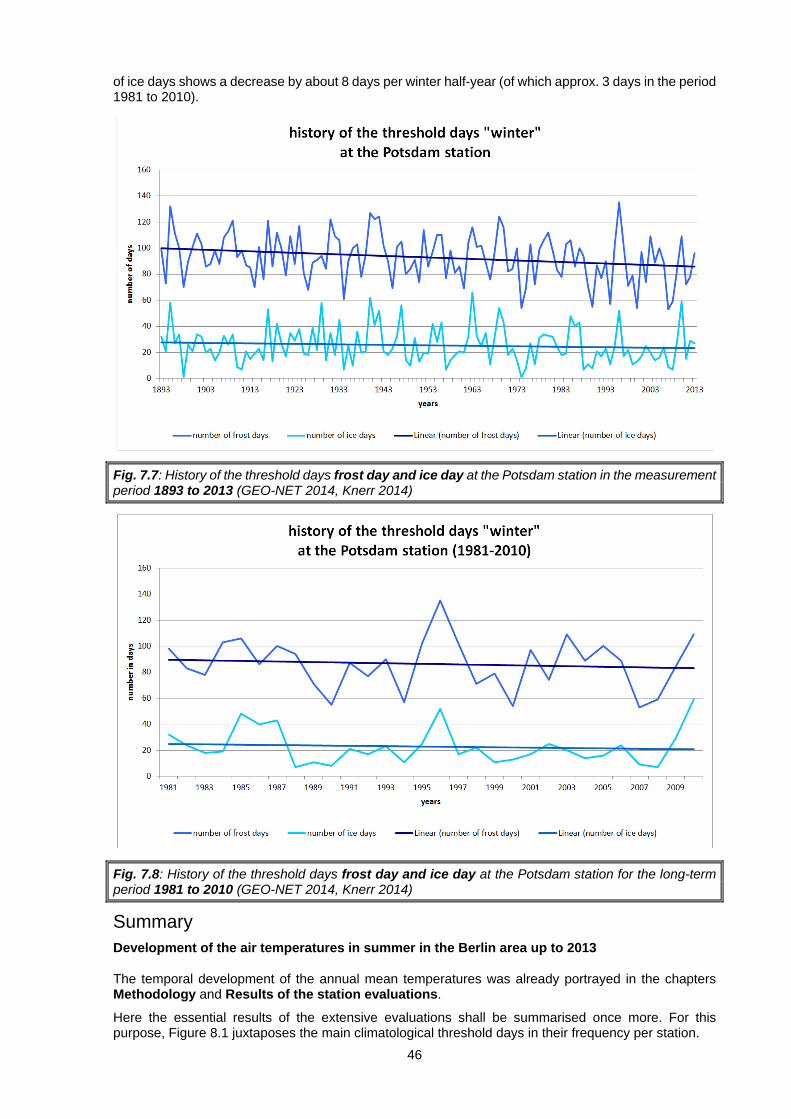
Due to climate warming, the number of summerly threshold days is increasing, whereas the number of winterly threshold days is decreasing. Figure 7.7 shows the histories for the threshold days frost day and ice day for the entire period 1893 to 2013. The linear trend illustrates that in the last 120 years the number of frost days at the Potsdam station decreased from the initial level of about 100 frost days by 16 days (of which about 9 days in the current 30-year period 1981 to 2010; cf. Figure 7.8); the number
46
of ice days shows a decrease by about 8 days per winter half-year (of which approx. 3 days in the period 1981 to 2010).
Fig. 7.7: History of the threshold days frost day and ice day at the Potsdam station in the measurement period 1893 to 2013 (GEO-NET 2014, Knerr 2014)
Fig. 7.8: History of the threshold days frost day and ice day at the Potsdam station for the long-term period 1981 to 2010 (GEO-NET 2014, Knerr 2014)
Summary Development of the air temperatures in summer in the Berlin area up to 2013
The temporal development of the annual mean temperatures was already portrayed in the chapters Methodology and Results of the station evaluations.
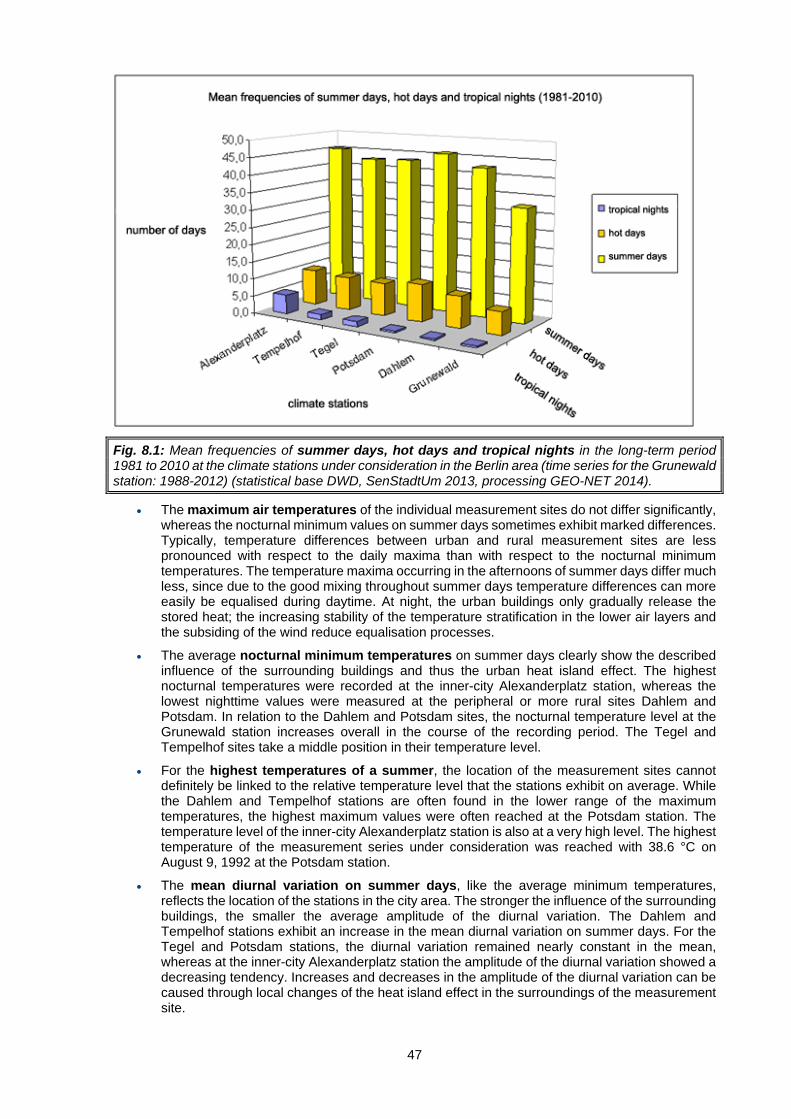
Here the essential results of the extensive evaluations shall be summarised once more. For this purpose, Figure 8.1 juxtaposes the main climatological threshold days in their frequency per station.
47
Fig. 8.1: Mean frequencies of summer days, hot days and tropical nights in the long-term period 1981 to 2010 at the climate stations under consideration in the Berlin area (time series for the Grunewald station: 1988-2012) (statistical base DWD, SenStadtUm 2013, processing GEO-NET 2014).
• The maximum air temperatures of the individual measurement sites do not differ significantly, whereas the nocturnal minimum values on summer days sometimes exhibit marked differences. Typically, temperature differences between urban and rural measurement sites are less pronounced with respect to the daily maxima than with respect to the nocturnal minimum temperatures. The temperature maxima occurring in the afternoons of summer days differ much less, since due to the good mixing throughout summer days temperature differences can more easily be equalised during daytime. At night, the urban buildings only gradually release the stored heat; the increasing stability of the temperature stratification in the lower air layers and the subsiding of the wind reduce equalisation processes.
• The average nocturnal minimum temperatures on summer days clearly show the described influence of the surrounding buildings and thus the urban heat island effect. The highest nocturnal temperatures were recorded at the inner-city Alexanderplatz station, whereas the lowest nighttime values were measured at the peripheral or more rural sites Dahlem and Potsdam. In relation to the Dahlem and Potsdam sites, the nocturnal temperature level at the Grunewald station increases overall in the course of the recording period. The Tegel and Tempelhof sites take a middle position in their temperature level.
• For the highest temperatures of a summer, the location of the measurement sites cannot definitely be linked to the relative temperature level that the stations exhibit on average. While the Dahlem and Tempelhof stations are often found in the lower range of the maximum temperatures, the highest maximum values were often reached at the Potsdam station. The temperature level of the inner-city Alexanderplatz station is also at a very high level. The highest temperature of the measurement series under consideration was reached with 38.6 °C on August 9, 1992 at the Potsdam station.
• The mean diurnal variation on summer days, like the average minimum temperatures, reflects the location of the stations in the city area. The stronger the influence of the surrounding buildings, the smaller the average amplitude of the diurnal variation. The Dahlem and Tempelhof stations exhibit an increase in the mean diurnal variation on summer days. For the Tegel and Potsdam stations, the diurnal variation remained nearly constant in the mean, whereas at the inner-city Alexanderplatz station the amplitude of the diurnal variation showed a decreasing tendency. Increases and decreases in the amplitude of the diurnal variation can be caused through local changes of the heat island effect in the surroundings of the measurement site.

48
• An increase in the summer days occurring is exhibited by all stations. Due to the relatively homogeneous maximum temperatures in summer within the city area, the number of summer days at the different stations does not differ markedly. The histories of the individual stations are sometimes hard to distinguish, as the frequencies of the summer days only differ insignificantly. It is notable that not only the temperature level but also the frequency of summer days at the Potsdam station is relatively high up to the early 90s in comparison to the stations in the Berlin city area.
• As expected, larger differences occur in the number of tropical nights, as the nocturnal minimum temperatures more closely reflect the degree of development of the surroundings. Here the inner-city Alexanderplatz station stands out due to its significantly higher number of tropical nights.
Excursus: Estimation of possible effects of climate change Preliminary remark The climate change that is taking place according to the findings of the IPCC (IPCC 2014) will have impacts also on Berlin in different areas of life.
The State of Berlin has long recognized the urgency that these prognoses imply for the city and has responded with already prepared plans and measures addressing both the area of mitigation and that of adaptation, and is continuously developing them further.
Detailed information on these goals and fundamentals as well as on agreements and measures already adopted is available and regularly updated on the pages “Climate Protection” [German only] of the Senate Department.
In the framework of the aforementioned ERDF project “GIS-based modelling of parameters relevant to urban climate on the basis of high-resolution data on buildings and vegetation” (GEO-NET 2014), an estimation of the possible future development of the climate in Berlin was carried out with respect to the evaluation of three climate stations: Berlin-Dahlem, Berlin-Tempelhof and Berlin-Tegel. For these stations, prognostic data of the regionalisation model WettReg 2010 (CEC Potsdam) are available that are used to assess the future situation. The regional climate model WettReg was already used in the framework of the co-operation agreement between the German Meteorological Service (DWD), Section Climate and Environmental Consulting and the Senate Department for Urban Development, Section Geo-Information, Unit Urban and Environmental Information System, which resulted in the first comprehensive illustrations of the possible effects of climate change on the changes in the temperature behaviour being prepared for Berlin (SenStadt 2010).
For more information on WettReg, the uncertainty necessarily inherent in climate projections and further conditions, see the explanations presented in connection with this work in the accompanying text of the Environmental Atlas (cf. 04.12, Chapter Methodology).
For the estimations described below, the regional climate model WETTREG 2010 was applied to the 3 Berlin climate stations mentioned, with 10 model runs each with the emission scenario A1B.
Results of the regional climate model WETTREG 2010 for three selected climate stations in Berlin The climatic system in Berlin that is segmented according to the urban structures will be fundamentally preserved for autochthonous1 weather conditions under the influence of climate change. However, due to the gradual warming of the atmosphere, relevant changes are to be expected in the course of the century for the human-biometeorological load level. These developments will be quantified in the following. The time periods 2011-2040, 2041-2070 and 2071-2100 will be considered, as is usual for such investigations.
Annual mean values of the air temperature The development of the local near-ground annual average temperature is a first indicator for the extent of the future human-biometeorological load situation in Berlin. It has risen moderately but steadily since the beginning of the Industrial Revolution, and in the past climate normal period 1961-1990 it was 8.9,
1 From Ancient Greek autós “self” and chthōn “earth”, i.e. roughly “indigenous”, “native”, “aboriginal”.

49
9.3 and 9.4 °C, respectively, for the three climate stations considered in Berlin (see Fig. 8.2). Under the influence of climate change, this development will not only continue but will intensify already in the coming decades. Taking the scenario A1B as a basis yields a further increase
• in the short term (climate period 2011-2040) by +1.4 K (Kelvin) (Tegel), +1.2 K (Tempelhof) and +1.3 K (Dahlem),
• in the medium term (2041-2070) by +2.7 K (Tegel), +2.6 K (Tempelhof) and 2.6 K (Dahlem) and
• in the long term (2071-2100) by +3.9 K (Tegel), +3.7 K (Tempelhof) and +3.7 K (Dahlem).
As illustrated in Figure 8.2, a steady rise in the annual average temperatures up to the end of the 21st century is to be expected. The development of the annual mean temperatures is subject to the natural fluctuations of the climate. The climate stations Berlin-Tegel and Berlin-Tempelhof exhibit a very similar development of the temperatures. The Dahlem station shows less pronounced values throughout. This reflects the location of the climate stations in the urban space. Whereas the Berlin-Tegel and Berlin-Tempelhof stations represent relief spaces within densely built-up urban areas, the Berlin-Dahlem station has a more peripheral location. The heat island effect is not as pronounced here as at the other two sites. Data from a station with a very urban location in very densely built-up areas (e.g. Berlin-Alexanderplatz), in which even higher temperatures are to be expected overall, are not available for this evaluation.
Fig. 8.2: Projection of future near-ground annual mean temperatures at three Berlin climate stations for the time period 2011 to 2100; WETTREG simulation, scenario A1B, (dashed lines = linear trend) (GEO-NET 2014)
Frequency of occurrence of meteorological threshold days A gradual warming of the near-ground air layers is significant from a human-biometeorological perspective only if it is concomitant with an intensification or an increased frequency of occurrence of load situations. The frequencies of occurrence of the meteorological threshold days summer days (Tmax ≥ 25 °C), hot days (Tmax ≥ 30 °C) and tropical nights (Tmin ≥ 20 °C) are good indicators for this.
A consideration of the manifestations of the different parameters for the three Berlin climate stations shows that they differ significantly only in the manifestation of the tropical nights. Here, too, the trend of increasing frequency of occurrence of the threshold days under consideration that emerges from the climate observations of the past decades (cf. Chapter “Results of the station evaluations”) continues and intensifies.
50
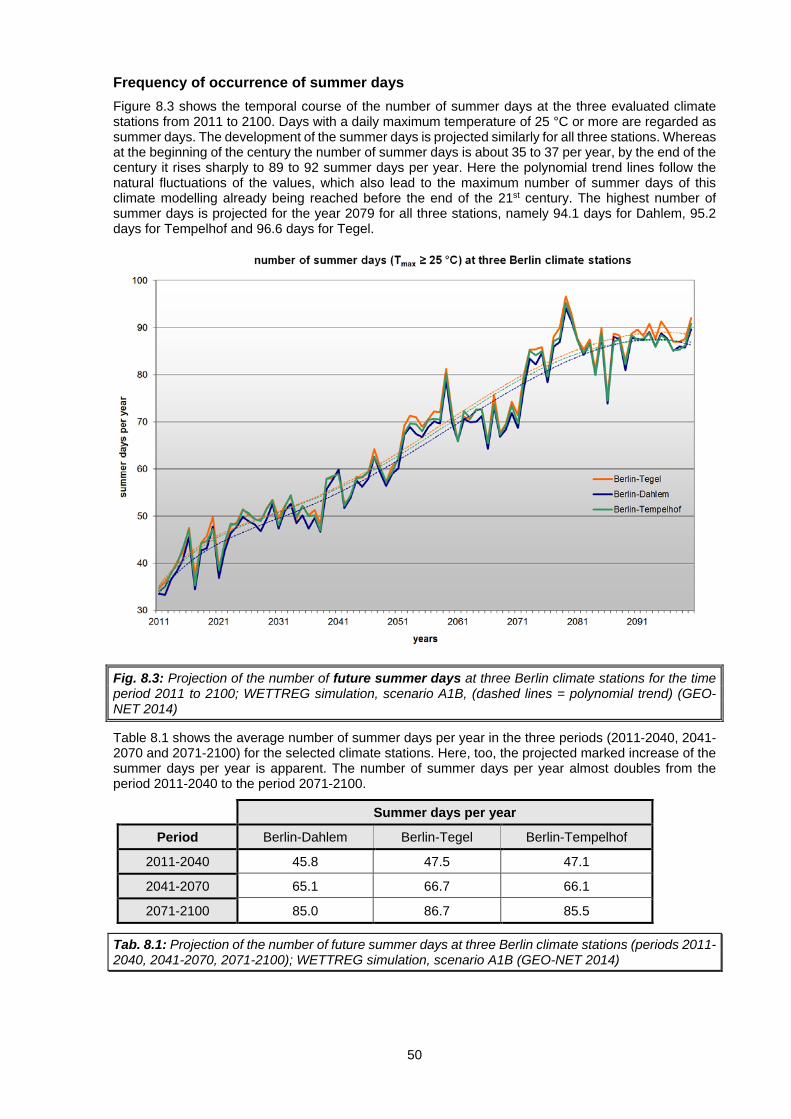
Frequency of occurrence of summer days Figure 8.3 shows the temporal course of the number of summer days at the three evaluated climate stations from 2011 to 2100. Days with a daily maximum temperature of 25 °C or more are regarded as summer days. The development of the summer days is projected similarly for all three stations. Whereas at the beginning of the century the number of summer days is about 35 to 37 per year, by the end of the century it rises sharply to 89 to 92 summer days per year. Here the polynomial trend lines follow the natural fluctuations of the values, which also lead to the maximum number of summer days of this climate modelling already being reached before the end of the 21st century. The highest number of summer days is projected for the year 2079 for all three stations, namely 94.1 days for Dahlem, 95.2 days for Tempelhof and 96.6 days for Tegel.
Fig. 8.3: Projection of the number of future summer days at three Berlin climate stations for the time period 2011 to 2100; WETTREG simulation, scenario A1B, (dashed lines = polynomial trend) (GEO-NET 2014)
Table 8.1 shows the average number of summer days per year in the three periods (2011-2040, 2041-2070 and 2071-2100) for the selected climate stations. Here, too, the projected marked increase of the summer days per year is apparent. The number of summer days per year almost doubles from the period 2011-2040 to the period 2071-2100.
Summer days per year
Period Berlin-Dahlem Berlin-Tegel Berlin-Tempelhof
2011-2040 45.8 47.5 47.1
2041-2070 65.1 66.7 66.1
2071-2100 85.0 86.7 85.5
Tab. 8.1: Projection of the number of future summer days at three Berlin climate stations (periods 2011-2040, 2041-2070, 2071-2100); WETTREG simulation, scenario A1B (GEO-NET 2014)

51
Frequency of occurrence of hot days Weather situations in which the daily maximum temperature is 30 °C or higher are referred to as hot days.
Figure 8.4 shows the development of the hot days from 2011 to 2100. The natural fluctuations of the climate in the course of a century are clearly visible here from the curved trend line. Nevertheless, the increase in the number of hot days per year can be discerned clearly. As described in the chapter “Results of the station evaluations”, the number of hot days in Berlin has been rising for decades. The climate modelling using WETTREG shows that in future this rise will be much more rapid. Whereas in 2011 5 to 7 hot days per year are assumed, 36 to 39 hot days per year are expected in 2100. The highest number of hot days is projected for the year 2087 with 43.1 hot days for the Berlin-Tegel and Berlin-Dahlem stations and 44.8 days for Berlin-Tempelhof.
Fig. 8.4: Projection of the number of future hot days at three Berlin climate stations for the time period 2011-2100; WETTREG simulation, scenario A1B, (dashed lines = polynomial trend) (GEO-NET 2014)
Also with respect to the projected development of the number of hot days there are no relevant differences between the stations considered, as seen in Table 8.2, which shows the number of hot days for three periods. From the first period at the beginning of the century to the last period under consideration, the values are tripled.
Hot days per year
Period Berlin-Dahlem Berlin-Tegel Berlin-Tempelhof
2011-2040 11.6 12.6 12.4
2041-2070 23.1 24.0 23.5
2071-2100 35.3 36.7 35.9
Tab. 8.2: Projection of the number of future hot days at three Berlin climate stations (periods 2011-2040, 2041-2070, 2071-2100); WETTREG simulation, scenario A1B (GEO-NET 2014)
Figure 8.5 shows a summary of the development of the summer days and hot days at the three climate stations considered. A linear representation was chosen for the sake of illustrating the trend. It is apparent that the manifestation of summer days and hot days is correlated. However, the slope of the

52
trend lines of the parameters shows that the increase in the summer days is more rapid overall than the increase in the hot days.
Fig. 8.5: Common projection of the number of future summer days and hot days at three Berlin climate stations for the time period 2011 to 2100; WETTREG simulation, projection A1B, (dashed lines = linear trend) (GEO-NET 2014)
Frequency of occurrence of tropical nights A situation in which the nocturnal minimum temperature does not fall below 20 °C is referred to as a tropical night. This is associated with a considerable heat load for humans.
Overall, the number of tropical nights per year also increases up to the end of the century. However, in this case marked differences can be discerned in the manifestation of the parameter between the three climate stations in Berlin. The highest number of tropical nights per year for the entire period under consideration is projected at the Berlin-Tegel station. Here the value lies between 2 tropical nights in 2011 and at the end of the century 12.5 tropical nights in 2100. This corresponds to an increase in the number of tropical nights by a factor of about six in 90 years. For the Berlin-Tempelhof station, the modelling for the development of the tropical nights mostly lies slightly below the modelling for Berlin-Tegel. Here the number of tropical nights per year increases from 2 in 2011 to 11.5 in 2100. The manifestation of tropical nights is significantly lower for the Berlin-Dahlem station. The development goes from 1 tropical night in 2011 up to 4.7 tropical nights in 2100 (cf. Fig. 8.6). Thus less than half as many tropical nights are projected for Berlin-Dahlem than for the other two sites in Berlin.

53
Fig. 8.6: Projection of the number of future tropical nights at three Berlin climate stations for the time period 2011 to 2100; WETTREG simulation, scenario A1B, (dashed lines = polynomial trend) (GEO-NET 2014)
The history of the development of the tropical nights at the three climate stations is basically similar, though at the Dahlem station the increase up to 2062 is significantly lower. For all three stations, the maximum of tropical nights is attained in 2062. In this year, 8.7 tropical nights are attained in Dahlem, 18 tropical nights in Tegel and 16.1 nights with a temperature minimum above 20 °C in Tempelhof. Beyond this year, the values at all three climate stations exhibit a slight downward tendency. This reflects the natural fluctuations of the climate. Due to the relatively low manifestation of tropical nights in comparison to hot days and particularly summer days, the fluctuations can be read off the presentation in the graph much more clearly than for the parameters considered previously.
To illustrate the differences in the values at the three sites, Figure 8.7 shows a diagram which represents the average number of tropical nights per year in the three reference periods of 30 years each up to the end of the 21st century.
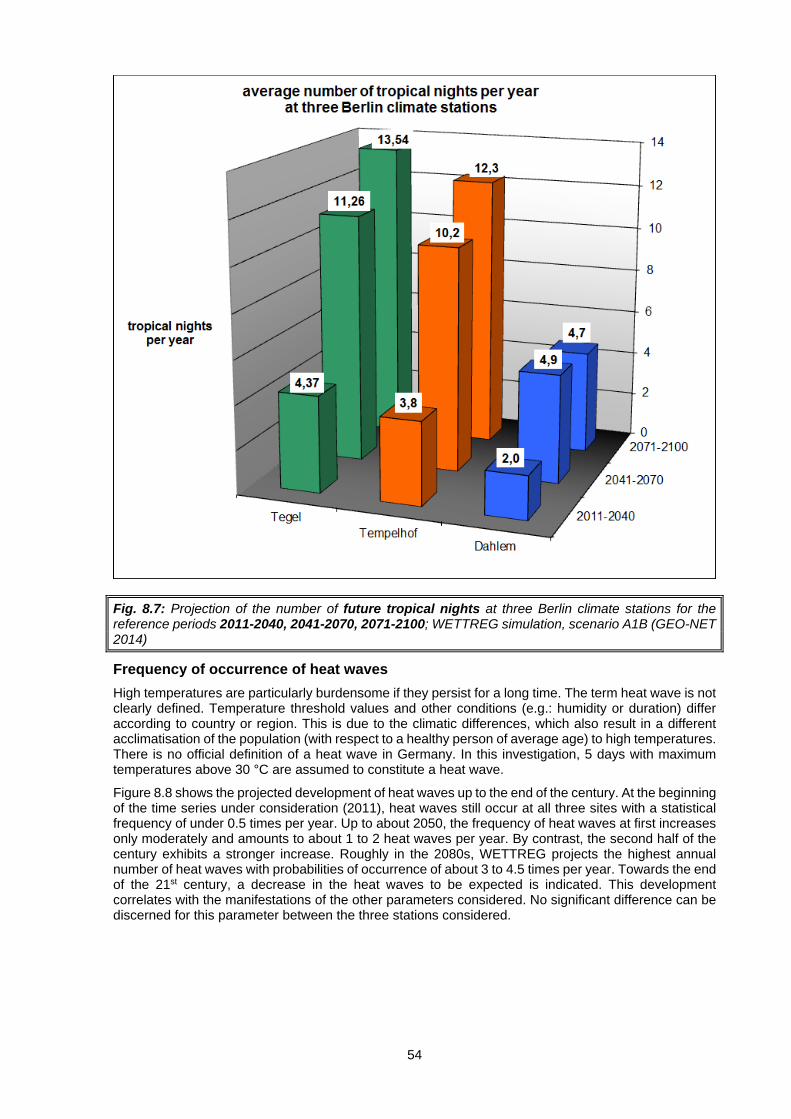
54
Fig. 8.7: Projection of the number of future tropical nights at three Berlin climate stations for the reference periods 2011-2040, 2041-2070, 2071-2100; WETTREG simulation, scenario A1B (GEO-NET 2014)
Frequency of occurrence of heat waves High temperatures are particularly burdensome if they persist for a long time. The term heat wave is not clearly defined. Temperature threshold values and other conditions (e.g.: humidity or duration) differ according to country or region. This is due to the climatic differences, which also result in a different acclimatisation of the population (with respect to a healthy person of average age) to high temperatures. There is no official definition of a heat wave in Germany. In this investigation, 5 days with maximum temperatures above 30 °C are assumed to constitute a heat wave.
Figure 8.8 shows the projected development of heat waves up to the end of the century. At the beginning of the time series under consideration (2011), heat waves still occur at all three sites with a statistical frequency of under 0.5 times per year. Up to about 2050, the frequency of heat waves at first increases only moderately and amounts to about 1 to 2 heat waves per year. By contrast, the second half of the century exhibits a stronger increase. Roughly in the 2080s, WETTREG projects the highest annual number of heat waves with probabilities of occurrence of about 3 to 4.5 times per year. Towards the end of the 21st century, a decrease in the heat waves to be expected is indicated. This development correlates with the manifestations of the other parameters considered. No significant difference can be discerned for this parameter between the three stations considered.

55
Fig. 8.8: Projection of the average number of future hot waves per year at three Berlin climate stations for the time period 2011 to 2100; WETTREG projection, scenario A1B, (dashed lines = polynomial trend) (GEO-NET 2014)
To allow the future duration of heat waves to be assessed, Figure 8.9 shows the maximum number of consecutive hot days per year and the mean number of consecutive hot days per year. Here, too, the manifestation of the values of all three Berlin climate stations correlates strongly. The mean number of consecutive hot days only exhibits a slight increasing trend. It increases from the beginning of the century (about 3 days) to about 5 days at the end of the century. The increase in the maximum number of hot days per year is much more marked. It increases from about 4 days to 12 to 14 days in 90 years. The spread of the values is high.
It becomes apparent that in future not only more frequent heat waves are to be expected, but also more extended ones. However, extremely long heat waves remain the exception and not the rule, as indicated by the only slightly increasing mean number of hot days per year.

56
Fig. 8.9: Projection of the mean and maximum number of future consecutive hot days per year at three Berlin climate stations for the time period 2011 to 2100; WETTREG projection, scenario A1B, (dashed lines = polynomial trend). (GEO-NET 2014)
Summary of possible climate change effects in Berlin The analysis of the WETTREG projection up to 2100 for the three Berlin climate stations Dahlem, Tegel and Tempelhof shows that the trend of increasing temperatures and especially of increasing extreme values that could already be observed in the past decades will continue and will even grow stronger in the coming years and decades.
As a consequence, according to the current state of knowledge the human-biometeorological loads for the population will increase. Particularly the investigated parameters hot days and tropical nights represent critical load situations for the human organism. A strong increase in the number of hot days will occur at all sites considered, and only Dahlem shows an advantage with respect to the development of the tropical nights. Here, the manifestation of the tropical nights to be expected up to the end of the 21st century is significantly lower than at the other two sites. This is due to the location of the climate station outside the inner city in the area of single-family homes. Due to the greater greening of the surroundings of the station, more cooling can occur at night than in the more strongly sealed and urban areas of the other two climate stations. The significantly cooler nights in the Dahlem area are also reflected in the projected annual mean temperature for this station, which thus constantly lies approx. half a degree below the temperatures in Tegel and Tempelhof. In view of the health relevance mentioned, attention must also be paid to the increasing load due to heat waves, both in the number of their occurrence and in their more pronounced manifestation.
Although the station was not included in the comparison, it is to be expected on the basis of the evaluations in the chapter “Results of the station evaluations” that the Alexanderplatz site would have significantly exceeded the trend representations of the individual parameters of the Tegel and Tempelhof sites due to its far more urban surroundings compared to Tempelhof and Tegel.
Literature [1] Berliner Morgenpost 2011:
Article “Berlins einzigartige Wetterstation verschwunden” [“Berlin’s unique weather station vanished”], edition of August 6, 2011, Berlin. Internet: http://www.morgenpost.de/berlin-aktuell/article1724502/Berlins-einzigartige-Wetterstation-verschwunden.html (accessed on March 15, 2015)

57
[2] CEC-Potsdam n.d.: WETTREG 2010 – Wetterlagenbasierte Regionalisierungsmethode [regionalisation method based on weather conditions], Online-Informationen und Datenzugriff [online information and data access], Potsdam. Internet: http://www.cec-potsdam.de/wettreg.html
(accessed on March 10, 2016)
[3] Deutscher Wetterdienst [German Meteorological Service] DWD n.d.: Online-Abfrage von Klimadaten ausgewählter Messstationen [online query of climate data of selected measurement stations], Offenbach. Internet: http://www.dwd.de/DE/leistungen/cdcftp/cdcftp.html
(accessed on March 10, 2016)
[4] Deutscher Wetterdienst [German Meteorological Service] DWD 2010: Berlin im Klimawandel - Eine Untersuchung zum Bioklima, Abschlussbericht zur Kooperation zwischen dem Deutschen Wetterdienst und der Senatsverwaltung für Stadtentwicklung, Abt. III, Referat Informationssystem Stadt und Umwelt [Berlin in climate change - An investigation of the bioclimate, final report on the co-operation between the German Meteorological Service and the Senate Department for Urban Development, Section III, Unit Urban and Environmental Information System], Potsdam, Freiburg. Internet: Download project report (pdf; 3.8 MB)
(accessed on March 15, 2015)
[5] GEO-NET GmbH 2014: Project “GIS-gestützte Modellierung von stadtklimatisch relevanten Kenngrößen auf der Basis hochaufgelöster Gebäude- und Vegetationsdaten” [“GIS-based modelling of parameters relevant to urban climate on the basis of high-resolution data on buildings and vegetation”] 2013-2015, on behalf of the Senate Department for Urban Development and the Environment, intermediate report 12/2013, unpublished, funded through ERDF, Berlin.
[6] IPCC (Intergovernmental Panel on Climate Change) 2014:
Fifth Assessment Report (AR5), Climate Change 2014, downloadable via: http://www.ipcc.ch/report/ar5/syr/, Geneva. Internet: http://www.ipcc.ch/ (accessed on March 15, 2015)
[7] Knerr, I. 2014: Statistische Auswertungen zu Klimaparametern langjährig betriebener Messstationen in Berlin und Potsdam, Ergebnisse im Rahmen eines Studienpraktikums bei der Senatsverwaltung für Stadtentwicklung und Umwelt, III D Geodateninfrastruktur [Statistical evaluations for climate parameters of measurement stations operated over the long term in Berlin and Potsdam, results in the framework of a student internship with the Senate Department for Urban Development, III D Geodata Infrastructure], Berlin.
[8] Kreienkamp, F., Enke, W., 2006: WETTREG 20C control run 1961-2000 and WETTREG A1B scenario run 2001-2100, UBA Project. CERA database: Internet: https://www.dkrz.de/up/de-systems/de-cera/datenbank (accessed on February, 19, 2018)
[9] Myrcik, G. 2015: Information on the Berlin-Dahlem climate station via mail from February 3, 2015, Berlin.
[10] Pelz, J. 2007: Prüfung der Jahresmitteltemperaturen in Berlin für die Jahre 1780 bis 1835 [Examination of the annual mean temperatures in Berlin for the years 1780 to 1835]. Beiträge des Institutes für

58
Meteorologie an der FU Berlin [Contributions of the Institute of Meteorology at the FU Berlin] 33/00, ISSN 0938-5312, Berlin.
[11] PIK (Potsdam-Institut für Klimafolgenforschung) [Potsdam Institute for Climate Impact Research] 2015: Web page on the long-term meteorological station Potsdam Telegrafenberg, Potsdam Internet: https://www.pik-potsdam.de/services/climate-weather-potsdam/climate-weather-potsdam?set_language=en (accessed on March 9, 2016)
[12] SenStadtUm (Senate Department for Urban Development and the Environment) (ed.) 2013: Berliner Luftgüte-Messnetz BLUME, Messstation 032 [Berlin Air Quality Monitoring Network BLUME, measurement station 032], Forst Grunewald, Jagen 91, Berlin. Internet: http://www.stadtentwicklung.berlin.de/umwelt/umweltatlas/extra/3_12/ed312_MC032_u.htm (accessed on March 15, 2015)
Digital maps [13] SenStadtUm (Senate Department for Urban Development and the Environment Berlin) (ed.)
2014: Digital orthophotos for the entire city area of Berlin with a ground resolution of 0.20 m in sheet lines 2 km x 2 km. Berlin. Internet: http://fbinter.stadt-berlin.de/fb/index.jsp?loginkey=showAreaSelection&mapId=k_luftbild2014@senstadt&areaSelection=map (accessed on March 15, 2015)
[14] SenStadt (Senate Department for Urban Development Berlin) (ed.) 2009a: Environmental Atlas Berlin, Edition 2009, Map 04.10 Climate Model Berlin - Analysis Maps, 1:50 000, Berlin. Internet: http://www.stadtentwicklung.berlin.de/umwelt/umweltatlas/eia410.htm (accessed on March 15, 2015)
[15] SenStadt (Senate Department for Urban Development Berlin) (ed.) 2009b: Environmental Atlas Berlin, Edition 2009, Map 04.11 Climate Model Berlin - Evaluation Maps, 1:50,000, Berlin. Internet: http://www.stadtentwicklung.berlin.de/umwelt/umweltatlas/eia411.htm (accessed on March 15, 2015)
[16] SenStadt (Senate Department for Urban Development Berlin) (ed.) 2010: Environmental Atlas Berlin, Edition 2010, Map 04.12 Future Climatic Change and Thermal Load, 1:50000, Berlin. Internet: http://www.stadtentwicklung.berlin.de/umwelt/umweltatlas/ei412.htm (accessed on March 15, 2015)