04 Refining · 2.6 Crude oil production by type and region ... Crude oil exports 11 928 13 392 16...
70
Transcript of 04 Refining · 2.6 Crude oil production by type and region ... Crude oil exports 11 928 13 392 16...
3
Content01 Petróleos Mexicanos 1.1 Summary of Consolidated operating statistics1.2 Summary of Consolidated operating statistics (continued)1.3 Income statements 1.4 Balance sheet as of December 311.5 Investment1.6 Statistics on safety and environmental protection1.7 Employees
Exploration and production Hydrocarbon reserves and production Crude Oil and gas reserves, 2012 Drilling and production Drilling Crude oil production by region and integral asset Crude oil production by type and region Crudeoilproductioninselectedfields Natural gas production by region and integral asset Naturalgasproductioninselectedfields Crude oil and natural gas production by states Crude oil distribution Natural gas distribution
03 Gas 3.1 Processing capacity3.2 Natural gas processing and production3.3 Dry gas balance3.4 Gas processing by center3.5 Domestic sales of dry gas, LPG and petrochemicals
04Refining 4.1Refiningcapacity4.2Refiningproduction4.3Productionbyrefinery4.4 Value of domestic sales4.5 Volume of domestic sales4.6Domesticsalesofrefinedproductsbyregion,20114.7Averageend-userpricesofselectedrefinedproducts4.8 Service stations by state
05 Petrochemicals 5.1 Installed capacity by complex5.2 Petrochemical production5.3 Production by petrochemical complex5.4 Value of petrochemical domestic sales5.5 Volume of petrochemical domestic sales5.6 Average end-user prices of selected petrochemicals
06 International Trade 6.1 Hydrocarbon exports and imports6.2 Value of crude oil exports by destination6.3 Volume of crude oil exports by destination6.4 Crude oil exports to selected countries6.5 Crude oil prices6.6 Crude oil prices by destination6.7Refinedproductsanddrygasexportsandimports6.8 Petrochemicals exports and imports
07 International Comparisons 7.1 2012 proved oil reserves, selected countries7.2 2011 proved natural gas reserves, selected countries7.3 2011 oil production, selected countries7.4 2011 natural gas production, selected countries7.5 2010 atmospheric distillation capacity, top petroleum companies7.6 2010 top petroleum companies by crude oil production7.7 2010 top petroleum companies by natural gas production7.8 2010 top petroleum companies by sales
Glossary and Nomenclature
2 25 42 59
11
3250
64
Morelos Petrochemical Center
022.1 2.2 2.3 2.4 2.5 2.6 2.7 2.8 2.9
2.102.112.12
5
01Petróleos Mexicanos
1.1Summary of Consolidated operating statistics
1.2Summary of Consolidated operating statistics (continued)
1.3Income statements
1.4Balance sheet as of December 31
1.5Investment
1.6Statistics on safety and environmental protection
1.7Employees
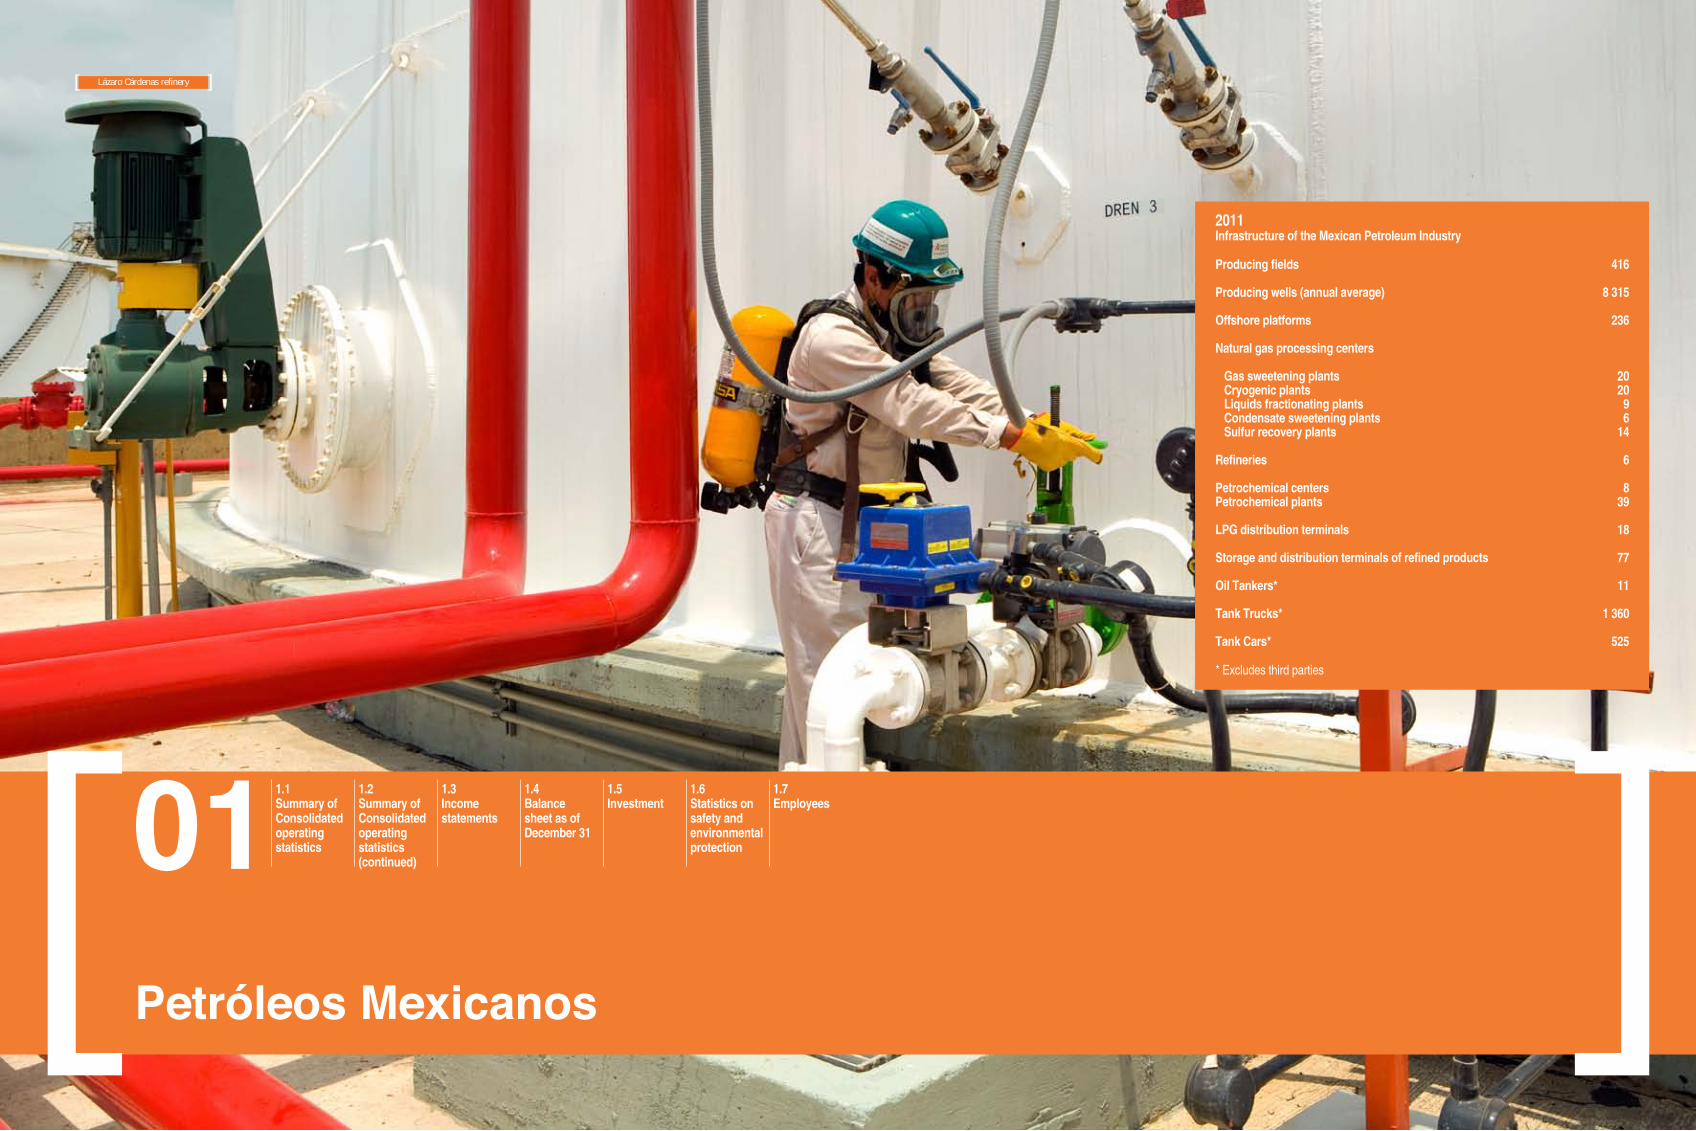
2011Infrastructure of the Mexican Petroleum Industry
Producing fields
Producing wells (annual average) Offshore platforms
Natural gas processing centers Gas sweetening plants Cryogenic plants Liquids fractionating plants Condensate sweetening plants Sulfur recovery plants
Refineries
Petrochemical centersPetrochemical plants
LPG distribution terminals
Storage and distribution terminals of refined products
Oil Tankers*
Tank Trucks*
Tank Cars*
* Excludes third parties
416
8 315
236
20 20 9 6
14
6
8 39
18
77
11
1 360
525
Lázaro Cárdenas refinery

1.1SummaryofConsolidatedoperatingstatistics
3
a. Includes stabilized condensates.b. Includes LPG from natural gas processing plants of Pemex-Gas and Basic Petrochemicals and Pemex-Exploration and Production. c. Includes petrochemicals manufactured by Pemex-Petrochemicals, Pemex-Refining and ethane and sulfur produced by Pemex-Gas and Basic Petrochemicals. d. Excludes propane and pentane.
Change2011/2010
2001 2002 2003 2004 2005 2006 2007 2008 2009 2010 2011 (%)Production (Mbd)Liquid hydrocarbons 3 560 3 585 3 789 3 825 3 760 3 683 3 471 3 157 2 971 2 953 2 934 -0.6 Crude oil 3 127 3 177 3 371 3 383 3 333 3 256 3 076 2 792 2 601 2 576 2 550 -1.0 Condensates and Liquids a 433 408 418 442 426 427 395 366 370 377 384 1.8 Natural gas (MMcfd) 4 511 4 423 4 498 4 573 4 818 5 356 6 058 6 919 7 031 7 020 6 594 -6.1 Crude oil processing 1 252 1 245 1 286 1 303 1 284 1 284 1 270 1 261 1 295 1 184 1 167 -1.5 Refined products b 1 473 1 481 1 556 1 587 1 554 1 546 1 512 1 491 1 525 1 416 1 379 -2.6 Petrochemicals c (Mt) 10 377 9 880 10 298 10 731 10 603 10 961 11 757 11 973 11 956 13 188 12 384 -6.1
Domestic salesVolume (Mbd) Refined products d 1 712 1 658 1 684 1 718 1 771 1 762 1 816 1 826 1 771 1 762 1 786 1.4 LPG 325 332 327 328 314 306 301 292 281 288 285 -1.1 Motor gasolines 551 565 600 636 671 718 760 792 792 802 799 -0.3 Jet fuel 55 53 54 58 59 61 68 65 55 56 56 0.6 Diesel 276 271 295 303 320 345 358 382 359 371 384 3.4 Fuel oil 475 406 355 332 341 264 257 220 209 185 201 8.5 Others 30 31 53 61 66 68 71 76 75 60 62 2.6 Dry gas (MMcfd) 1 993 2 425 2 622 2 756 2 634 2 952 3 064 3 086 3 119 3 255 3 385 4.0 Petrochemicals c (Mt) 3 495 3 295 3 181 3 568 3 795 3 870 4 041 4 191 4 064 4 214 4 281 1.6
Value (millon pesos) Refined products d 171 139 161 213 222 821 296 219 373 383 433 565 473 571 542 687 512 720 584 355 679 236 16.2 LPG 29 327 26 137 36 856 42 663 48 531 52 706 54 456 55 972 49 461 53 386 57 981 8.6 Motor gasolines 71 609 69 756 99 228 144 982 184 651 221 697 247 338 265 981 258 488 295 109 328 457 11.3 Jet fuel 5 682 5 194 7 229 10 951 16 241 18 897 23 369 31 936 18 321 22 935 31 560 37.6 Diesel 33 793 30 245 44 707 61 473 78 736 88 374 96 920 111 425 121 521 144 010 166 241 15.4 Fuel oil 27 653 26 709 30 896 31 529 39 521 43 299 42 396 61 670 51 908 56 767 80 265 41.4 Others 3 075 3 172 3 905 4 621 5 703 8 591 9 091 15 703 13 022 12 148 14 731 21.3 Dry gas 28 914 30 313 51 189 69 195 79 038 75 355 78 644 105 436 58 102 67 141 64 469 -4.0 Petrochemicals c 9 601 8 452 12 425 19 221 23 386 24 659 25 970 33 427 24 054 32 102 38 110 18.7
0
1000
2000
3000
4000
5000
6000
7000
8000
20112010200920082007200620052004200320022001
Natural gas productionmillion cubic feet per day
0
100
200
300
400
500
600
700
800
20112010200920082007200620052004200320022001
Domestic sales of automotivegasolinesthousand barrels per day

5
1.2SummaryofConsolidatedoperatingstatistics(continued)
La Cangrejera Petrochemical Center e. Includes condensates from 2003 to 2006. f. Average prices. g. Includes components.
Change2011/2010
2001 2002 2003 2004 2005 2006 2007 2008 2009 2010 2011 (%)Foreign tradeVolume (Mbd) Liquid hydrocarbons net exports 1 524 1 617 1 821 1 789 1 670 1 612 1 371 1 043 946 926 844 -8.8 Crude oil exports 1 756 1 705 1 844 1 870 1 817 1 793 1 686 1 403 1 222 1 361 1 338 -1.7 Refined products Exports e 104 156 177 153 187 188 180 192 243 193 185 -4.2 Imports 335 244 200 234 334 369 495 553 519 627 678 8.1 Dry gas (MMcfd) Exports 25 4 - - 24 33 139 107 67 19 1 -93.2 Imports 292 592 757 766 480 451 386 447 422 536 791 47.6 Petrochemicals (Mt) Exports 780 832 813 914 867 818 693 587 741 677 458 -32.3 Imports 128 197 95 105 239 254 270 250 388 268 101 -62.2
Value (millon dollars) Crude oil exports 11 928 13 392 16 676 21 258 28 329 34 707 37 937 43 342 25 605 35 985 49 322 37.1 Refined products Exports e 856 1 182 1 614 1 947 2 991 3 595 4 052 5 537 4 657 4 764 6 188 29.9 Imports 3 656 2 495 2 423 3 792 7 859 10 029 15 797 21 893 13 308 20 335 29 404 44.6 Dry gas Exports 48 4 - - 79 72 351 316 103 32 2 -95.1 Imports 424 775 1 526 1 715 1 398 1 135 996 1 424 633 939 1 272 35.5 Petrochemicals Exports 113 113 148 217 303 299 242 349 147 245 260 6.4 Imports 29 46 44 58 107 128 145 158 168 174 125 -28.4
Prices (dollars per barrel) f
Exports Crude oil 18.61 21.52 24.78 31.05 42.71 53.04 61.64 84.38 57.40 72.46 101.00 39.4 Istmo 22.27 23.48 28.08 38.04 53.11 57.29 69.92 81.09 63.38 78.63 106.22 35.1 Maya 17.19 20.89 24.13 29.82 40.61 51.10 60.38 82.92 56.22 70.65 98.80 39.9 Olmeca 23.96 24.87 29.32 39.34 53.91 64.67 70.89 99.37 65.79 79.58 109.83 38.0 LPG g 28.48 24.34 32.70 39.39 37.52 48.26 58.46 72.52 47.50 66.67 81.37 22.0 Jet fuel 29.20 27.43 32.41 45.17 67.95 82.58 83.70 123.65 69.03 88.07 123.53 40.3 Diesel 24.49 22.86 33.48 36.46 56.59 49.84 60.96 93.23 59.93 89.33 0.00 -100.0 Fuel oil (high sulfur content) 11.69 17.71 18.14 18.17 19.20 37.73 44.70 51.94 51.47 63.50 89.15 40.4
Imports LPG 21.62 21.56 28.34 35.19 42.45 46.22 55.56 62.38 41.02 55.04 67.60 22.8 Gasolines 37.83 34.05 41.69 52.42 75.45 85.16 95.09 115.45 75.91 93.44 124.64 33.4 Fuel oil (low sulfur content) 23.01 26.01 29.31 34.79 43.00 54.55 62.10 96.17 65.96 74.67 106.25 42.3 Natural gas (US$/MMBtu) 3.92 3.48 5.38 5.95 7.77 6.68 6.91 8.48 4.01 4.68 4.29 -8.2

510
Gral. Lázaro Cárdenas refinery
1.3 Income statementsa
Millions of mexican pesos
a. Audited figures. Includes Petróleos Mexicanos, subsidiary entities and subsidiary companies. b. Until 2003, only net interest cost is considered. Since 2004 net money exchange and monetary position in addition to net interest cost is used. c. For reference purposes, the money exchange conversions from pesos to US dollar, have been made to the 2011 exchange rate of Ps. 13.9904 = US$1.00.
0
100000
200000
300000
400000
500000
600000
700000
800000
20112010200920082007200620052004200320022001
Income
*Income before taxes and duties
Taxes
Income* and taxes millions of mexican pesos
(million 2001 2002 2003 2004 2005 2006 2007 2008 2009 2010 2011 dollars) c
Total sales 445 330 481 437 625 429 773 587 928 643 1 062 495 1 136 035 1 328 950 1 089 921 1 282 064 1 558 429 111 393Domestic sales 303 853 314 271 387 237 449 013 505 109 546 738 592 048 679 754 596 370 683 853 779 198 55 695Export sales 141 477 167 166 238 192 324 574 423 534 515 757 542 927 644 418 488 260 592 908 772 965 55 250Services income - - - - - - 1 061 4 778 5 292 5 303 6 266 448
Cost of sales 165 315 157 802 207 118 264 106 361 177 403 106 460 666 654 032 561 135 631 355 780 626 55 797
Gross income 280 015 323 635 418 311 509 481 567 466 659 389 675 370 674 918 528 786 650 709 777 803 55 596
General expenses 41 613 47 105 50 744 54 280 68 711 78 041 84 939 103 806 100 509 104 253 96 378 6 889Transportation and distribution expenses 13 588 14 962 15 549 17 574 21 911 24 019 24 799 33 962 31 856 33 274 31 349 2 241Administrative expenses 28 025 32 143 35 195 36 706 46 800 54 022 60 141 69 844 68 653 70 979 65 029 4 648
Operating income 238 402 276 530 367 567 455 201 498 755 581 348 590 431 571 112 428 277 546 457 681 425 48 707
Other revenues (expenses) -net- 5 405 342 2 961 11 154 11 837 69 742 83 019 197 991 40 293 71 586 195 545 13 977
Comprehensive financing cost b - 13 104 - 13 773 - 30 742 - 7 048 - 4 479 - 22 983 - 20 047 - 107 512 - 15 308 - 11 969 - 91 641 - 6 550
Participation in Subsidiaries and Associates' Results - - - - - - 5 545 - 1 965 - 1 291 1 541 - 796 - 57
Income before taxes and duties 230 703 263 098 339 785 459 308 506 112 628 107 658 948 659 625 451 971 607 613 784 532 56 076
Hydrocarbon extraction duties and other 168 264 179 099 288 366 419 629 560 415 582 855 677 256 771 702 546 633 654 141 876 016 62 615Special tax on production and services 95 199 114 491 94 076 54 705 20 214 - - - - - - -
Net income - 34 091 - 30 492 - 40 644 - 25 496 - 76 282 45 252 - 18 309 - 112 076 - 94 662 - 46 527 - 91 483 - 6 539

Balance sheet as of December 31a
Million pesos
Cactus Gas Processing Center
6
a. Audited results. Include Petróleos Mexicanos, subsidiary entities and subsidiary companies. b. For reference purposes, the money exchange conversions from pesos to US dollar, habe been made to the 2011 exchange rate of Ps. 13.9904 = US$1.00.
(million 2001 2002 2003 2004 2005 2006 2007 2008 2009 2010 2011 dollars) b
Total assets 556 883 697 379 845 472 947 527 1 042 560 1 204 734 1 330 281 1 236 837 1 332 037 1 395 197 1 533 345 109 600Current assets 76 534 123 654 171 027 243 616 292 763 384 924 428 561 364 292 349 697 315 911 357 470 25 551Properties, plant and equipment 406 913 486 098 539 219 594 569 643 236 710 488 793 846 845 062 967 592 1 061 388 1 152 506 82 378Others 73 436 87 627 135 226 109 343 106 561 109 322 107 874 27 483 14 749 17 898 23 369 1 670
Total liabilities 434 017 596 684 799 611 914 184 1 069 430 1 164 781 1 280 373 1 209 952 1 398 877 1 506 499 1 727 264 123 461Short term liabilities 71 948 113 771 136 916 140 483 164 476 169 927 289 464 175 965 242 960 207 254 253 470 18 117Long term liabilities 362 069 482 913 662 695 773 702 904 954 994 854 990 909 1 033 987 1 155 917 1 299 245 1 473 794 105 343
Equity 122 866 100 696 45 861 33 343 - 26 870 39 954 49 908 26 885 - 66 840 - 111 302 - 193 919 - 13 861Certificates of contribution 10 222 10 222 82 620 86 909 89 805 93 445 96 958 96 958 96 958 96 958 96 958 6 930Restatement of equity 181 838 190 523 130 258 132 342 144 333 154 101 178 532 - - - - -Accumulated net income (losses) - 85 473 - 109 855 - 167 017 - 211 570 - 305 539 - 287 786 - 317 174 - 261 840 - 356 502 - 397 473 - 488 956 - 34 949Others 16 279 9 804 - 25 662 44 531 80 193 91 592 191 767 192 704 189 213 198 079 14 158
Total liabilities and equity 556 883 697 380 845 472 947 528 1 042 560 1 204 735 1 330 281 1 236 837 1 332 037 1 395 197 1 533 345 109 600

Investmenta
Million pesos
7
La Cangrejera Petrochemical Center
a. Cash flow figures include capitalized maintenance. b. Non-PIDIREGAS CAPEX does not include financing activities c. For reference purposes, the money exchange conversions from pesos to US dollar, habe been made to the 2011 exchange rate of Ps. 13.9904 = US$1.00.
(millios2001 2002 2003 2004 2005 2006 2007 2008 2009 2010 2011 dollars)c
Total 62 938 80 759 113 687 122 863 126 988 150 397 170 111 201 740 251 882 268 514 267 204 19 099Non-PIDIREGAS b 26 993 22 943 19 013 12 243 21 436 20 130 17 573 23 773 251 882 268 514 267 204 19 099PIDIREGAS 35 945 57 816 94 674 110 620 105 552 130 267 152 538 177 967 - - - -
Pemex-Exploration and Production 53 446 63 000 88 380 113 332 112 863 130 071 148 761 178 104 226 802 239 409 235 929 16 864Non-PIDIREGAS b 17 501 13 443 8 945 3 694 11 040 8 142 6 992 8 261 226 802 239 409 235 929 16 864PIDIREGAS 35 945 49 557 79 435 109 638 101 823 121 929 141 769 169 844 - - - -
Pemex-Refining 5 501 14 077 19 878 5 092 9 001 15 229 15 979 17 379 18 526 22 551 25 135 1 797Non-PIDIREGAS b 5 501 5 893 5 744 4 647 6 542 7 369 7 124 10 580 18 526 22 551 25 135 1 797PIDIREGAS 8 184 14 134 445 2 459 7 861 8 855 6 800 - - - -
Pemex-Gas and Basic Petrochemicals 2 567 1 796 3 253 2 498 3 206 3 322 4 004 4 203 3 941 3 887 2 997 214Non-PIDIREGAS b 2 567 1 721 2 148 1 961 1 936 2 845 2 308 2 889 3 941 3 887 2 997 214PIDIREGAS 75 1 105 537 1 270 477 1 696 1 314 - - - -
Pemex-Petrochemicals 1 058 1 454 1 627 1 598 1 530 1 426 1 139 1 614 2 053 2 462 2 425 173Non-PIDIREGAS b 1 058 1 454 1 627 1 598 1 530 1 426 922 1 604 2 053 2 462 2 425 173PIDIREGAS - - - - - - 217 10 - - - -
Petróleos Mexicanos Corporate 366 432 549 343 388 349 227 439 560 206 717 51Non-PIDIREGAS b 366 432 549 343 388 349 227 439 560 206 717 51

8
Statistics on safety and environmental protection
Morelos Petrochemical Center
a. Includes stock changes in calculation of hazardous residual generation. A volume 7.8% greater than generated was disposed in 2005. b. According to the institutional rules regarding the report of leakages and spills 526 events were not included (equivalent to 5 tons) in 2003, and 469 (equivalent to 22 tons) were not included in 2004. c. In 2002, 2003 and 2004 the number of certificates decreased due to internal reorganizations and multisite certifications (in 2006, Pemex-Gas and Basic Petrochemicals and Pemex-Petrochemicals, obtain a single certificate). d. Includes 110 certificates received in 2011, (new and endorsements)
Pemex - Refining
Pemex - Gas and Basic Petrochemical
Pemex - Petrochemicals
Petróleos Mexicanos Corporate
Accidente frecuency index
Pemex - Exploration and Production
0.0
0.5
1.0
1.5
2.0
2.5
20112010200920082007200620052004200320022001
Petróleos Mexicanos
2001 2002 2003 2004 2005 2006 2007 2008 2009 2010 2011
Frequency index ( number of disabling accidents per million of man-hours worked)
Petróleos Mexicanos 1.00 1.17 1.09 1.50 1.06 0.67 0.59 0.47 0.42 0.42 0.54Pemex-Exploration and Production 1.26 1.14 1.35 1.67 1.26 0.96 1.22 0.74 0.72 0.43 0.39Pemex-Refining 0.69 1.10 0.63 1.23 1.16 0.59 0.27 0.24 0.32 0.66 0.80Pemex-Gas and Basic Petrochemicals 0.50 1.01 0.92 0.38 0.26 0.07 0.10 0.53 0.10 0.18 0.20Pemex-Petrochemicals 0.56 0.88 1.13 2.00 1.13 0.70 0.48 0.80 0.45 0.29 0.68Petróleos Mexicanos 1.86 1.79 1.54 1.85 0.71 0.42 0.07 0.12 0.07 0.09 0.48
Severity index (number of lost workdays per million of man-hours worked)Petróleos Mexicanos 93 96 96 100 67 31 26 27 26 25 29
Pemex-Exploration and Production 140 126 92 107 78 42 52 41 44 30 30Pemex-Refining 50 92 78 89 73 30 15 17 17 36 39Pemex-Gas and Basic Petrochemicals 79 48 184 137 56 9 2 44 13 23 18Pemex-Petrochemicals 132 108 146 151 80 40 25 43 31 11 28Petróleos Mexicanos 52 40 51 53 27 11 2 4 3 4 14
Environmental protectionSulfur oxide emissions (SOx) (t/Mt) 2.15 1.49 1.65 1.49 1.25 1.48 1.62 2.60 2.87 2.11 1.60Carbon dioxide emissions (CO2) (t/Mt) 125 111 117 112 90 114 124 150 165 149 139Total discharges to water (kg/Mt) 13.19 9.16 7.61 6.39 6.35 6.99 7.71 7.27 11.70 8.80 10.65Disposal of hazardous waste a (%) 77.00 84.80 97.99 98.19 158.20 62.59 162.07 149.36 108.28 110.41 110.18Leakage and spills b
Events 1 249 839 791 338 399 404 392 329 216 203 267Volume (t) 8 031 19 995 9 570 5 488 3 528 3 434 14 992 1 970 7 033 27 971 3 305
Environmental audits and certifications (number)Completed environmental audits (accrued) 303 308 432 440 443 464 656 754 805 939 968Clean industry certificates (accrued) 279 297 345 369 369 377 422 461 570 609 719 (d)
ISO 9000 c 318 159 89 52 46 41 43 43 37 16 18ISO 14000 c 44 46 41 36 29 29 28 28 23 20 22
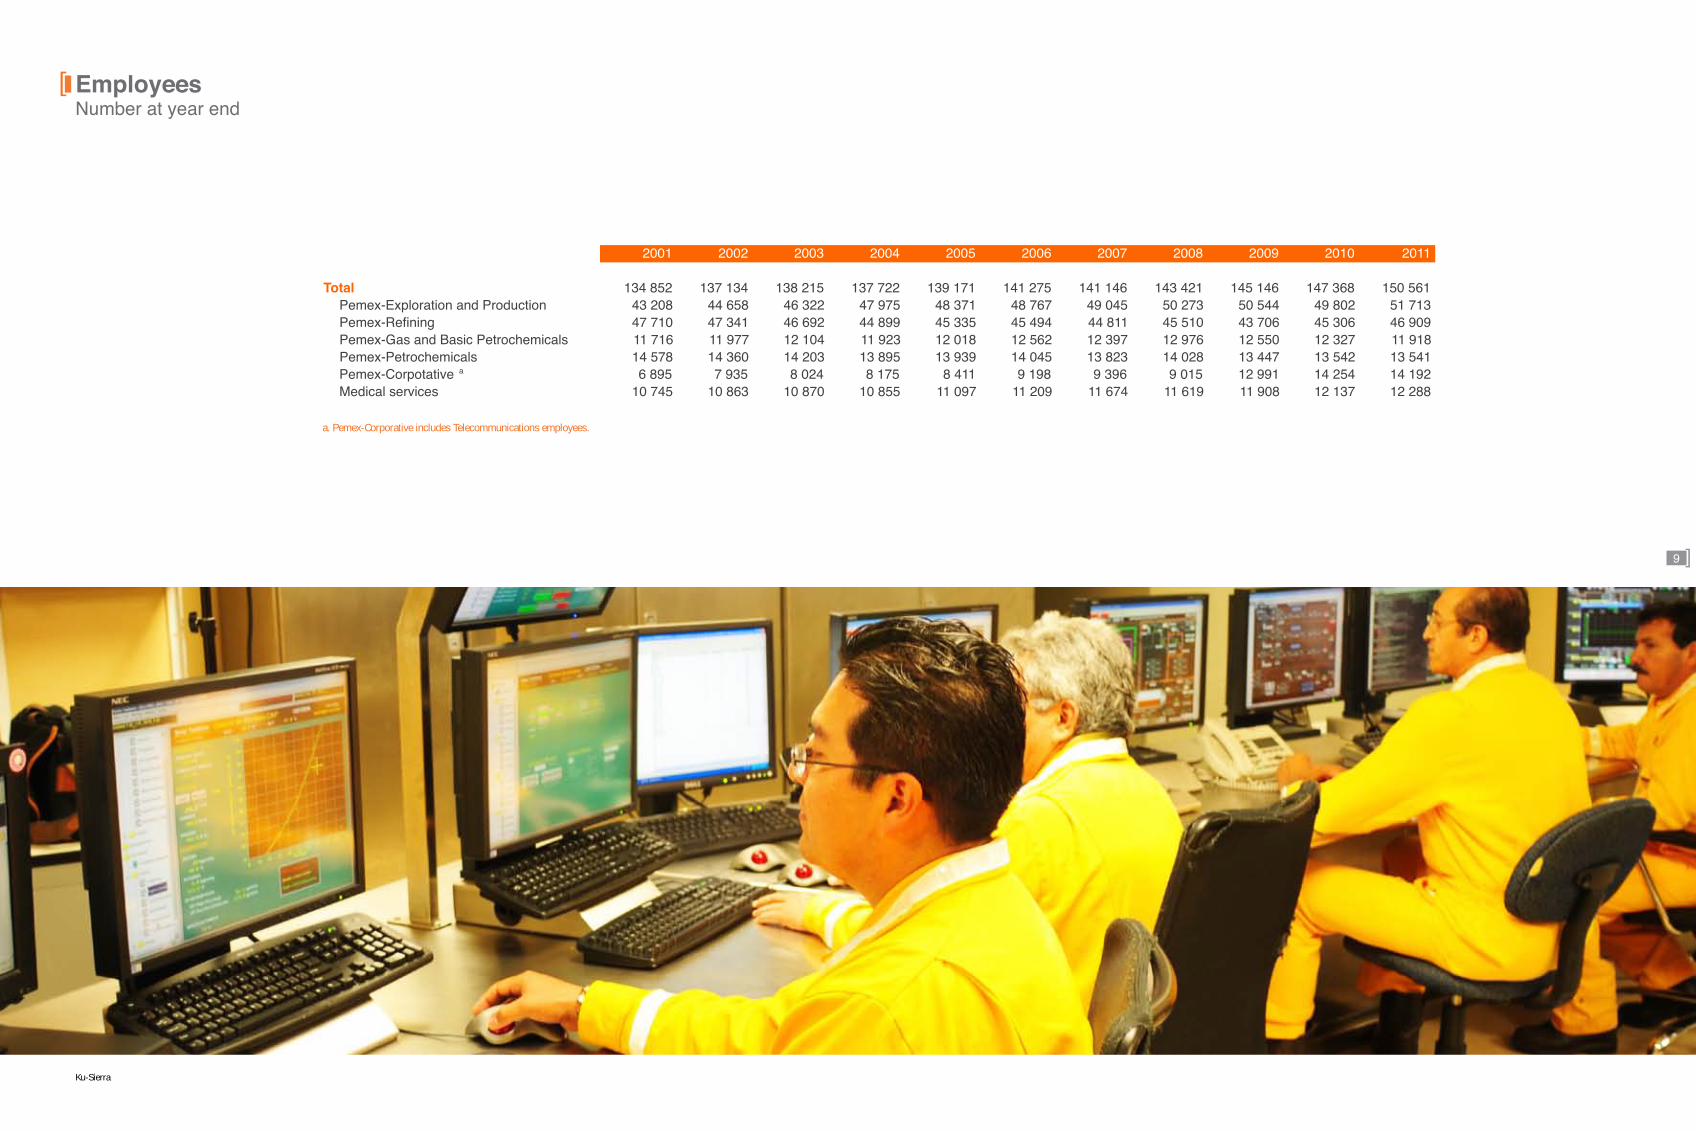
EmployeesNumber at year end
9
Ku-Sierra
a. Pemex-Corporative includes Telecommunications employees.
2001 2002 2003 2004 2005 2006 2007 2008 2009 2010 2011
Total 134 852 137 134 138 215 137 722 139 171 141 275 141 146 143 421 145 146 147 368 150 561Pemex-Exploration and Production 43 208 44 658 46 322 47 975 48 371 48 767 49 045 50 273 50 544 49 802 51 713Pemex-Refining 47 710 47 341 46 692 44 899 45 335 45 494 44 811 45 510 43 706 45 306 46 909Pemex-Gas and Basic Petrochemicals 11 716 11 977 12 104 11 923 12 018 12 562 12 397 12 976 12 550 12 327 11 918Pemex-Petrochemicals 14 578 14 360 14 203 13 895 13 939 14 045 13 823 14 028 13 447 13 542 13 541Pemex-Corpotative a 6 895 7 935 8 024 8 175 8 411 9 198 9 396 9 015 12 991 14 254 14 192Medical services 10 745 10 863 10 870 10 855 11 097 11 209 11 674 11 619 11 908 12 137 12 288

10
Oil facilities
Gas Processing Center
Petrochemical Center
Refinery
Sales Center
Pipelines
Maritime Route
Salamanca
Madero
BurgosReynosa
Arenque
Poza Rica
Cadereyta
Monterrey
Tula
Morelos
Minatitlán
Cactus
Salina Cruz
Cd. Pemex
Guadalajara
Cd. México
Camargo
Cangrejera
CosoleacaqueN. Pemex
San Martín La Venta
Producing Areas
MatapionchePajaritos
12
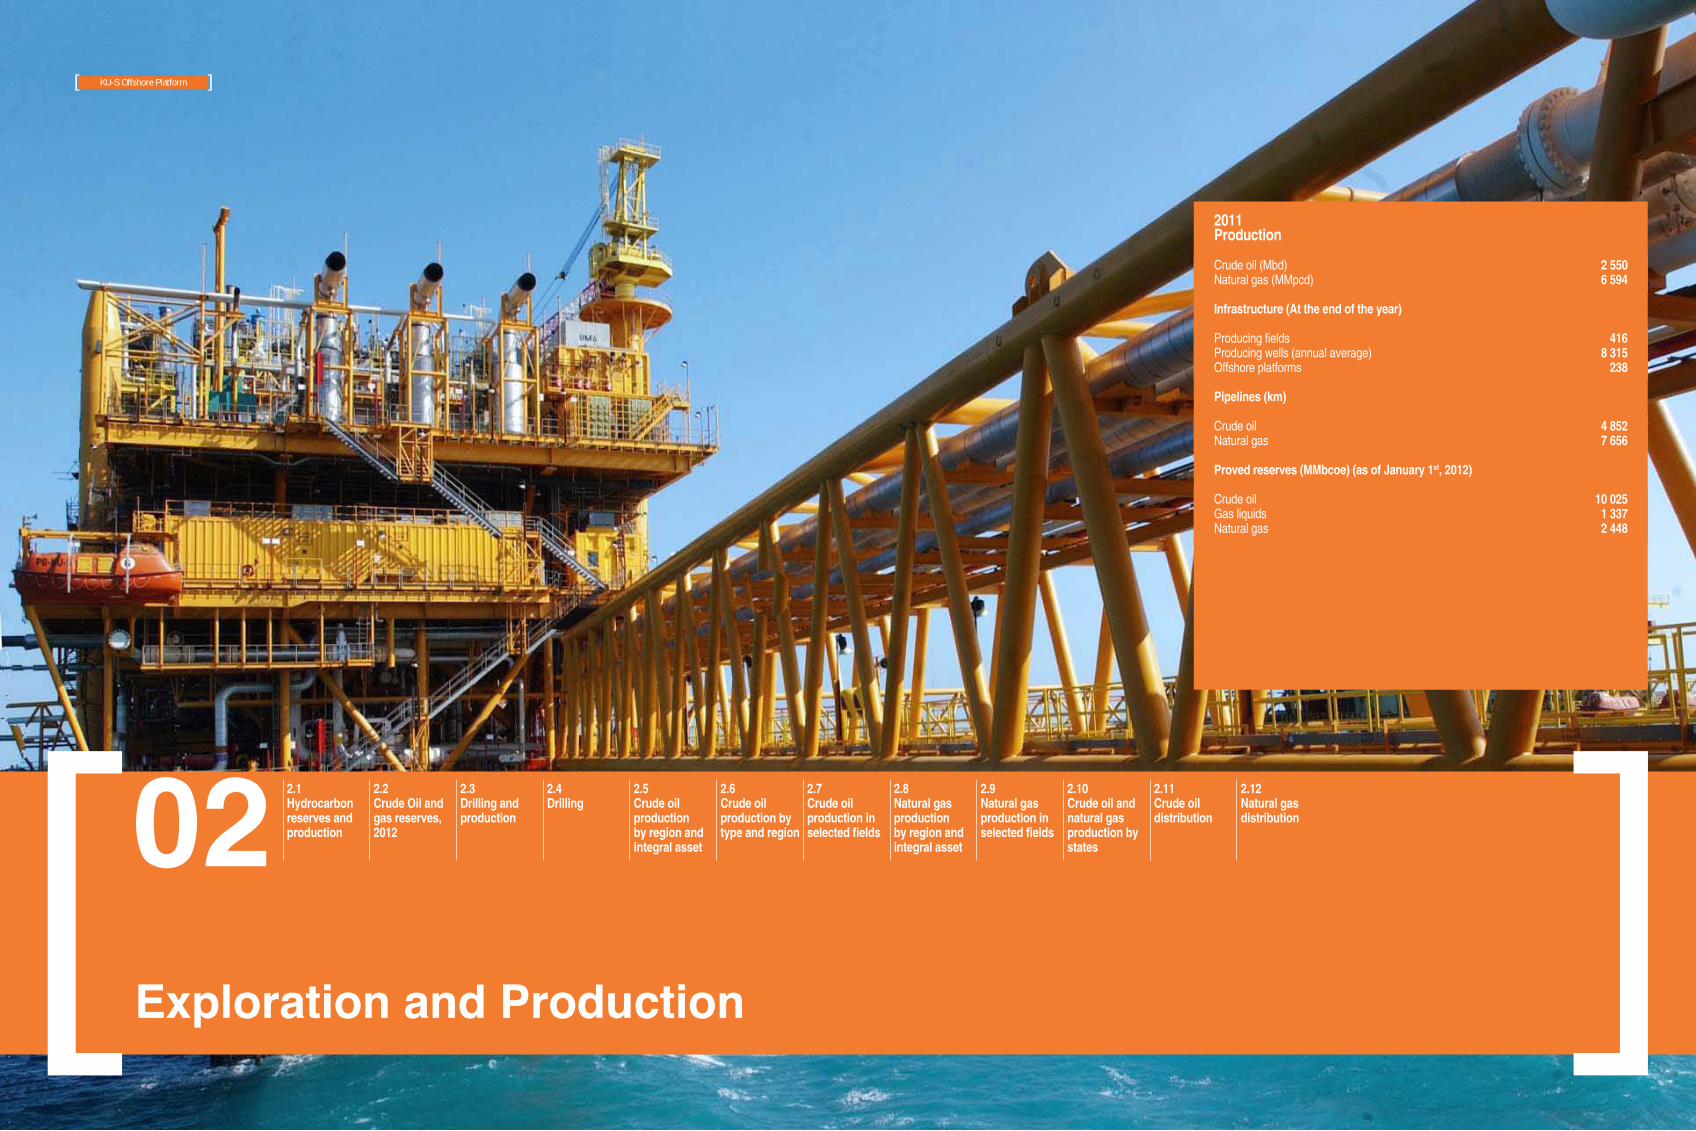
02Exploration and Production
2.1Hydrocarbon reserves and production
2.2Crude Oil and gas reserves, 2012
2.3Drilling and production
2.4Drilling
2.5Crude oil production by region and integral asset
2.6Crude oil production by type and region
2.7Crude oil production in selected fields
2.8Natural gas production by region and integral asset
2.9Natural gas production in selected fields
2.10Crude oil and natural gas production by states
2.11Crude oil distribution
2.12Natural gas distribution
2011Production
Crude oil (Mbd)Natural gas (MMpcd)
Infrastructure (At the end of the year)
Producing fieldsProducing wells (annual average)Offshore platforms
Pipelines (km)
Crude oilNatural gas
Proved reserves (MMbcoe) (as of January 1st, 2012)
Crude oilGas liquidsNatural gas
2 5506 594
4168 315
238
4 8527 656
10 0251 3372 448
KU-S Offshore Platform
12
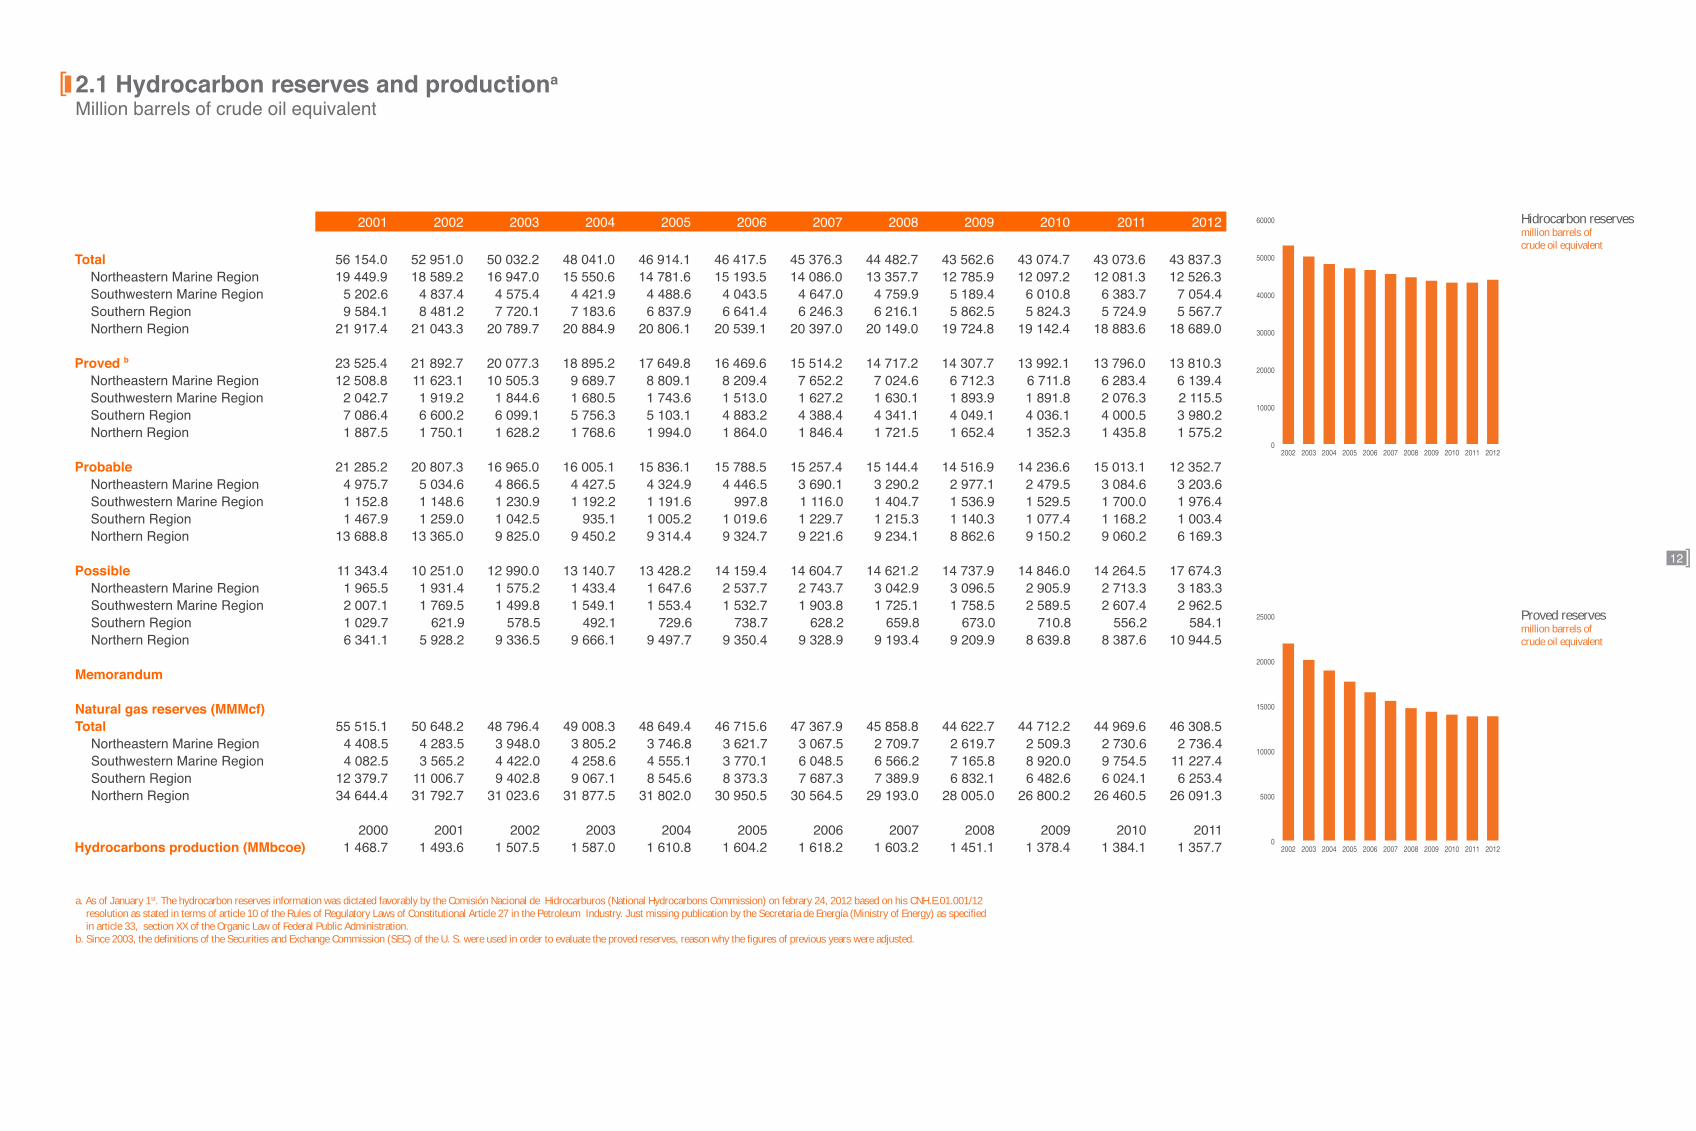
2.1 Hydrocarbon reserves and productiona
Million barrels of crude oil equivalent
a. As of January 1st. The hydrocarbon reserves information was dictated favorably by the Comisión Nacional de Hidrocarburos (National Hydrocarbons Commission) on febrary 24, 2012 based on his CNH.E.01.001/12 resolution as stated in terms of article 10 of the Rules of Regulatory Laws of Constitutional Article 27 in the Petroleum Industry. Just missing publication by the Secretaria de Energía (Ministry of Energy) as specified in article 33, section XX of the Organic Law of Federal Public Administration.
b. Since 2003, the definitions of the Securities and Exchange Commission (SEC) of the U. S. were used in order to evaluate the proved reserves, reason why the figures of previous years were adjusted.
2001 2002 2003 2004 2005 2006 2007 2008 2009 2010 2011 2012
Total 56 154.0 52 951.0 50 032.2 48 041.0 46 914.1 46 417.5 45 376.3 44 482.7 43 562.6 43 074.7 43 073.6 43 837.3Northeastern Marine Region 19 449.9 18 589.2 16 947.0 15 550.6 14 781.6 15 193.5 14 086.0 13 357.7 12 785.9 12 097.2 12 081.3 12 526.3Southwestern Marine Region 5 202.6 4 837.4 4 575.4 4 421.9 4 488.6 4 043.5 4 647.0 4 759.9 5 189.4 6 010.8 6 383.7 7 054.4Southern Region 9 584.1 8 481.2 7 720.1 7 183.6 6 837.9 6 641.4 6 246.3 6 216.1 5 862.5 5 824.3 5 724.9 5 567.7Northern Region 21 917.4 21 043.3 20 789.7 20 884.9 20 806.1 20 539.1 20 397.0 20 149.0 19 724.8 19 142.4 18 883.6 18 689.0
Proved b 23 525.4 21 892.7 20 077.3 18 895.2 17 649.8 16 469.6 15 514.2 14 717.2 14 307.7 13 992.1 13 796.0 13 810.3Northeastern Marine Region 12 508.8 11 623.1 10 505.3 9 689.7 8 809.1 8 209.4 7 652.2 7 024.6 6 712.3 6 711.8 6 283.4 6 139.4Southwestern Marine Region 2 042.7 1 919.2 1 844.6 1 680.5 1 743.6 1 513.0 1 627.2 1 630.1 1 893.9 1 891.8 2 076.3 2 115.5Southern Region 7 086.4 6 600.2 6 099.1 5 756.3 5 103.1 4 883.2 4 388.4 4 341.1 4 049.1 4 036.1 4 000.5 3 980.2Northern Region 1 887.5 1 750.1 1 628.2 1 768.6 1 994.0 1 864.0 1 846.4 1 721.5 1 652.4 1 352.3 1 435.8 1 575.2
Probable 21 285.2 20 807.3 16 965.0 16 005.1 15 836.1 15 788.5 15 257.4 15 144.4 14 516.9 14 236.6 15 013.1 12 352.7Northeastern Marine Region 4 975.7 5 034.6 4 866.5 4 427.5 4 324.9 4 446.5 3 690.1 3 290.2 2 977.1 2 479.5 3 084.6 3 203.6Southwestern Marine Region 1 152.8 1 148.6 1 230.9 1 192.2 1 191.6 997.8 1 116.0 1 404.7 1 536.9 1 529.5 1 700.0 1 976.4Southern Region 1 467.9 1 259.0 1 042.5 935.1 1 005.2 1 019.6 1 229.7 1 215.3 1 140.3 1 077.4 1 168.2 1 003.4Northern Region 13 688.8 13 365.0 9 825.0 9 450.2 9 314.4 9 324.7 9 221.6 9 234.1 8 862.6 9 150.2 9 060.2 6 169.3
Possible 11 343.4 10 251.0 12 990.0 13 140.7 13 428.2 14 159.4 14 604.7 14 621.2 14 737.9 14 846.0 14 264.5 17 674.3Northeastern Marine Region 1 965.5 1 931.4 1 575.2 1 433.4 1 647.6 2 537.7 2 743.7 3 042.9 3 096.5 2 905.9 2 713.3 3 183.3Southwestern Marine Region 2 007.1 1 769.5 1 499.8 1 549.1 1 553.4 1 532.7 1 903.8 1 725.1 1 758.5 2 589.5 2 607.4 2 962.5Southern Region 1 029.7 621.9 578.5 492.1 729.6 738.7 628.2 659.8 673.0 710.8 556.2 584.1Northern Region 6 341.1 5 928.2 9 336.5 9 666.1 9 497.7 9 350.4 9 328.9 9 193.4 9 209.9 8 639.8 8 387.6 10 944.5
Memorandum
Natural gas reserves (MMMcf)Total 55 515.1 50 648.2 48 796.4 49 008.3 48 649.4 46 715.6 47 367.9 45 858.8 44 622.7 44 712.2 44 969.6 46 308.5
Northeastern Marine Region 4 408.5 4 283.5 3 948.0 3 805.2 3 746.8 3 621.7 3 067.5 2 709.7 2 619.7 2 509.3 2 730.6 2 736.4Southwestern Marine Region 4 082.5 3 565.2 4 422.0 4 258.6 4 555.1 3 770.1 6 048.5 6 566.2 7 165.8 8 920.0 9 754.5 11 227.4Southern Region 12 379.7 11 006.7 9 402.8 9 067.1 8 545.6 8 373.3 7 687.3 7 389.9 6 832.1 6 482.6 6 024.1 6 253.4Northern Region 34 644.4 31 792.7 31 023.6 31 877.5 31 802.0 30 950.5 30 564.5 29 193.0 28 005.0 26 800.2 26 460.5 26 091.3
2000 2001 2002 2003 2004 2005 2006 2007 2008 2009 2010 2011Hydrocarbons production (MMbcoe) 1 468.7 1 493.6 1 507.5 1 587.0 1 610.8 1 604.2 1 618.2 1 603.2 1 451.1 1 378.4 1 384.1 1 357.7
0
10000
20000
30000
40000
50000
60000
20122011201020092008200720062005200420032002
Hidrocarbon reservesmillion barrels ofcrude oil equivalent
Proved reservesmillion barrels of crude oil equivalent
0
5000
10000
15000
20000
25000
20122011201020092008200720062005200420032002

27
2.2CrudeOilandgasreserves,2012a Million barrels of crude oil equivalent
Burgos Integral Asset
a. As of January 1st. The hydrocarbon reserves information was dictated favorably by the Comisión Nacional deHidrocarburos (National Hydrocarbons Commission) on febrary 24, 2012 based on his CNH.E.01.001/12 resolution as stated in terms of article 10 of the Rules of Regulatory Laws of Constitutional Article 27 in the Petroleum Industry. Just missing publication by the Secretaria de Energía (Ministry of Energy) as specified in article 33, section XX of the Organic Law of Federal Public Administration.
b. Includes condensates. c. Since 2003, the definitions of the Securities and Exchange Commission (SEC) of the U. S. were used in order to
evaluate the proved reserves.
Crude oil Gas liquids b Natural gas Total
Total 30 612.5 4 320.9 8 903.9 43 837.3Northeastern Marine Region 11 595.3 404.8 526.1 12 526.3Southwestern Marine Region 4 026.4 869.3 2 158.7 7 054.4Southern Region 3 491.8 873.5 1 202.4 5 567.7Northern Region 11 499.1 2 173.2 5 016.7 18 689.0
Proved c 10 025.2 1 336.8 2 448.3 13 810.3Northeastern Marine Region 5 528.0 266.8 344.6 6 139.4Southwestern Marine Region 1 266.9 285.8 562.8 2 115.5Southern Region 2 417.2 668.2 894.9 3 980.2Northern Region 813.1 116.0 646.1 1 575.2
Probable 8 548.1 1 248.5 2 556.1 12 352.7Northeastern Marine Region 2 999.7 92.0 111.8 3 203.6Southwestern Marine Region 1 202.4 228.2 545.7 1 976.4Southern Region 666.7 140.1 196.7 1 003.4Northern Region 3 679.3 788.1 1 701.8 6 169.3
Possible 12 039.3 1 735.6 3 899.5 17 674.3Northeastern Marine Region 3 067.6 45.9 69.8 3 183.3Southwestern Marine Region 1 557.1 355.2 1 050.2 2 962.5Southern Region 407.9 65.3 110.8 584.1Northern Region 7 006.7 1 269.1 2 668.7 10 944.5
Memorandum
Natural gas reserves (MMMcf) Proved Probable Possible Total
Total 12 733.5 13 293.9 20 281.1 46 308.5Northeastern Marine Region 1 792.0 581.6 362.8 2 736.4Southwestern Marine Region 2 927.1 2 838.4 5 461.9 11 227.4Southern Region 4 654.1 1 022.8 576.5 6 253.4Northern Region 3 360.3 8 851.1 13 879.9 26 091.3 0 5000 10000 15000 20000
Northern
Northeastern Marine
Southwestern Marine
Southern
By Region
0 5000 10000 15000 20000
Possible
Probable
Proved
By Type
0 10000 20000 30000 40000
Crude oil
Natural gas
Gas liquids
By Fluid

14
2.3Drillingandproduction
a. Wells that reached their target. b. Since 2007, Pemex-Exploratio and Production adopts the Trade Exploratory Success definition. c. Excludes injection wells. d. Average drilling rigs. e. Average depth of wells drilled to their target. f. Includes only fields with proved reserves. In 2007 the Kibo and Lalail fields were exlcuded due to
they do not incorporate proved reserves. g. Annual average.
2001 2002 2003 2004 2005 2006 2007 2008 2009 2010 2011
Wells drilled a 449 447 653 733 759 672 615 822 1 490 994 1 000Wells completed 459 459 593 727 742 656 659 729 1 150 1 303 1 034
Exploratory wells 53 55 88 103 74 69 49 65 75 39 33Producing wells b 28 27 53 42 39 32 26 27 29 23 16Success rate % 53 49 60 41 53 46 53 42 39 59 48
Development wells 406 404 505 624 668 587 610 664 1 075 1 264 c 1 001Producing wells 370 355 455 581 612 541 569 612 1 014 1 200 955Success rate % c 91 88 90 94 92 92 94 92 94 95 95
Drilling rigs d 50 70 101 132 116 103 116 143 176 130 128Exploratory wells 10 21 35 40 27 23 20 30 26 19 17Development wells 40 50 66 92 88 80 96 113 150 111 111
Kilometers drilled 1 098 1 186 1 763 2 106 2 004 1 858 1 798 2 199 3 770 2 532 2 494Average depth by well e (m) 2 359 2 478 2 904 2 692 2 828 2 771 2 744 2 748 2 494 2 605 2 418Discovered fields f 15 16 33 24 16 13 14 14 13 5 8 Crude oil - 2 11 8 3 2 4 6 6 2 2 Natural gas 15 14 22 16 13 11 10 8 7 3 6Producing fields 301 309 340 355 357 364 352 345 394 405 416Producing wells at end of period g 4 435 4 591 4 942 5 286 5 683 6 080 6 280 6 382 6 890 7 476 8 315Oil and gas production by well (bd) 923 900 880 833 774 729 699 622 549 508 448
0
100
200
300
400
500
600
700
800
900
1000
20112010200920082007200620052004200320022001Non productives
Completed wells
Natural gas
Crude oil
0
1000
2000
3000
4000
5000
6000
7000
8000
9000
20112010200920082007200620052004200320022001
Producing wells
Producing wells and averagedepth per well
Average depth per well (meters)
15
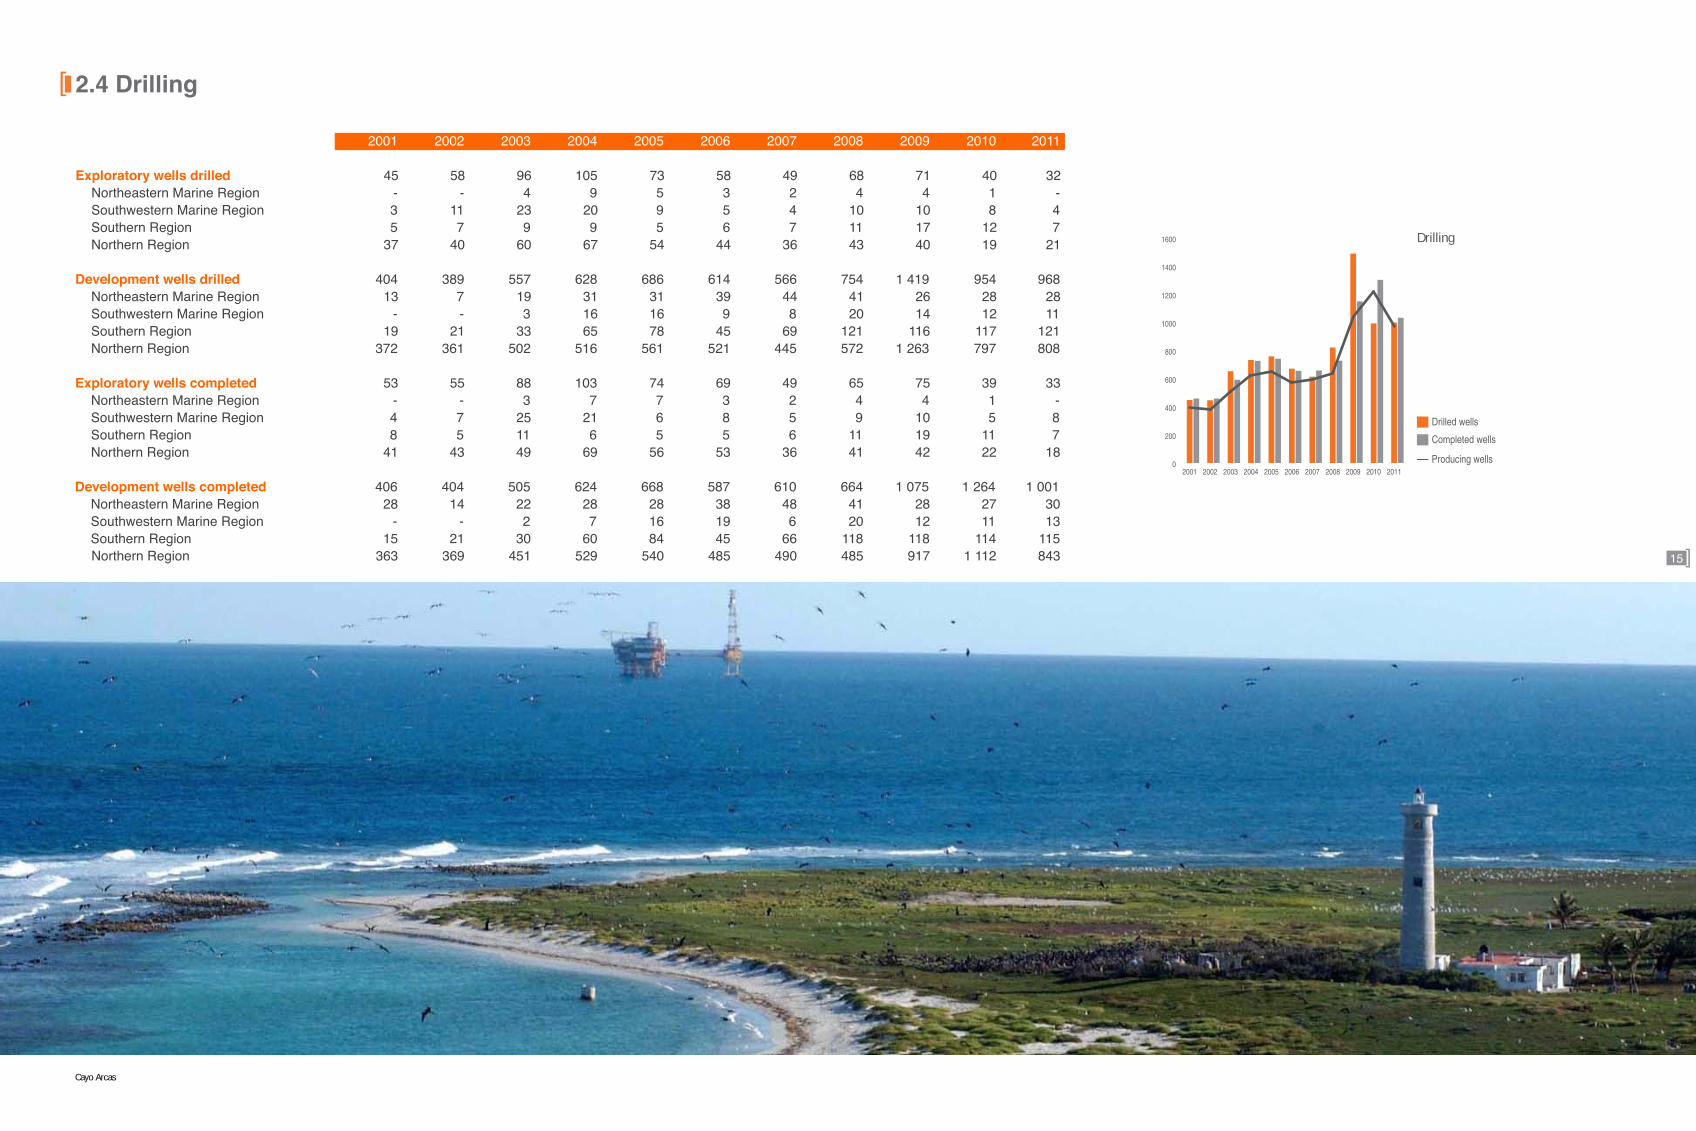
2.4Drilling
Cayo Arcas
2001 2002 2003 2004 2005 2006 2007 2008 2009 2010 2011
Exploratory wells drilled 45 58 96 105 73 58 49 68 71 40 32Northeastern Marine Region - - 4 9 5 3 2 4 4 1 -Southwestern Marine Region 3 11 23 20 9 5 4 10 10 8 4Southern Region 5 7 9 9 5 6 7 11 17 12 7Northern Region 37 40 60 67 54 44 36 43 40 19 21
Development wells drilled 404 389 557 628 686 614 566 754 1 419 954 968Northeastern Marine Region 13 7 19 31 31 39 44 41 26 28 28Southwestern Marine Region - - 3 16 16 9 8 20 14 12 11Southern Region 19 21 33 65 78 45 69 121 116 117 121Northern Region 372 361 502 516 561 521 445 572 1 263 797 808
Exploratory wells completed 53 55 88 103 74 69 49 65 75 39 33Northeastern Marine Region - - 3 7 7 3 2 4 4 1 -Southwestern Marine Region 4 7 25 21 6 8 5 9 10 5 8Southern Region 8 5 11 6 5 5 6 11 19 11 7Northern Region 41 43 49 69 56 53 36 41 42 22 18
Development wells completed 406 404 505 624 668 587 610 664 1 075 1 264 1 001Northeastern Marine Region 28 14 22 28 28 38 48 41 28 27 30Southwestern Marine Region - - 2 7 16 19 6 20 12 11 13Southern Region 15 21 30 60 84 45 66 118 118 114 115Northern Region 363 369 451 529 540 485 490 485 917 1 112 843
0
200
400
600
800
1000
1200
1400
1600
20112010200920082007200620052004200320022001
Drilling
Completed wells
Drilled wells
Producing wells

16
2.5Crudeoilproductionbyregionandintegralasseta Thousand barrels per day
a. In 2004 the administrative structure of Pemex-Exploration and Production changed to integral assets. Hence, figures prior to 2004 were adjusted. b. Adjusted and corrected production by water content. Note: Integral Asset Aceite Terciario del Golfo was established in 2008, so that their associated fields were rid of Integral Asset Poza Rica-Altamira.
Change2011/2010
2001 2002 2003 2004 2005 2006 2007 2008 2009 2010 2011 (%)
Total 3 127.0 3 177.1 3 370.9 3 382.9 3 333.3 3 255.6 3 075.7 b 2 791.6 2 601.5 2 575.9 2 550.1 - 1.0
Northeastern Marine Region 1 985.8 2 151.6 2 416.3 2 440.8 2 357.0 2 204.7 2 017.7 1 745.6 1 492.8 1 397.2 1 342.7 - 3.9Cantarell 1 731.0 1 902.3 2 122.8 2 136.4 2 035.3 1 800.9 1 490.5 1 039.5 684.8 558.0 500.7 - 10.3Ku-Maloob-Zaap 254.8 249.3 293.6 304.4 321.7 403.8 527.2 706.1 808.0 839.2 842.1 0.3
Southwestern Marine Region 554.0 452.2 397.6 388.2 396.3 475.1 505.9 500.3 517.6 544.4 560.6 3.0Abkatún-Pol-Chuc 496.8 406.8 359.0 321.8 299.8 332.2 312.3 308.1 305.4 296.3 276.2 - 6.8Litoral Tabasco 57.3 45.4 38.6 66.4 96.5 142.9 193.6 192.2 212.3 248.1 284.4 14.6
Southern Region 508.7 498.4 483.3 472.7 496.6 491.3 465.2 458.7 497.7 531.9 530.6 - 0.2Cinco Presidentes 30.7 34.3 37.3 37.7 38.8 39.3 44.6 47.3 56.6 71.7 83.5 16.4Bellota-Jujo 197.1 201.8 195.4 212.3 224.0 219.1 190.0 174.8 172.2 160.2 143.4 - 10.5Macuspana 0.7 1.6 2.5 4.9 5.0 6.6 10.4 15.7 27.1 32.9 32.5 - 1.1Muspac 54.0 48.2 42.2 36.1 33.3 33.6 33.6 36.1 42.1 49.5 48.5 - 2.0Samaria-Luna 226.3 212.3 205.9 181.6 195.5 192.7 186.7 184.7 199.9 217.5 222.7 2.4
Northern Region 78.5 74.9 73.6 81.2 83.5 84.5 86.9 87.1 93.3 102.4 116.2 13.5Poza Rica-Altamira 77.0 73.4 72.1 79.5 81.6 83.0 85.1 55.7 59.1 56.5 60.2 6.4Aceite Terciario del Golfo - - - - - - - 29.3 29.5 41.0 52.8 28.9Veracruz 1.6 1.5 1.5 1.7 1.9 1.5 1.8 2.1 4.6 4.9 3.2 - 33.6
Northeastern Marine
Southwestern Marine
Northern
Oil production by regionthousand barrels per day
Southern0
500
1000
1500
2000
2500
3000
3500
20112010200920082007200620052004200320022001
17
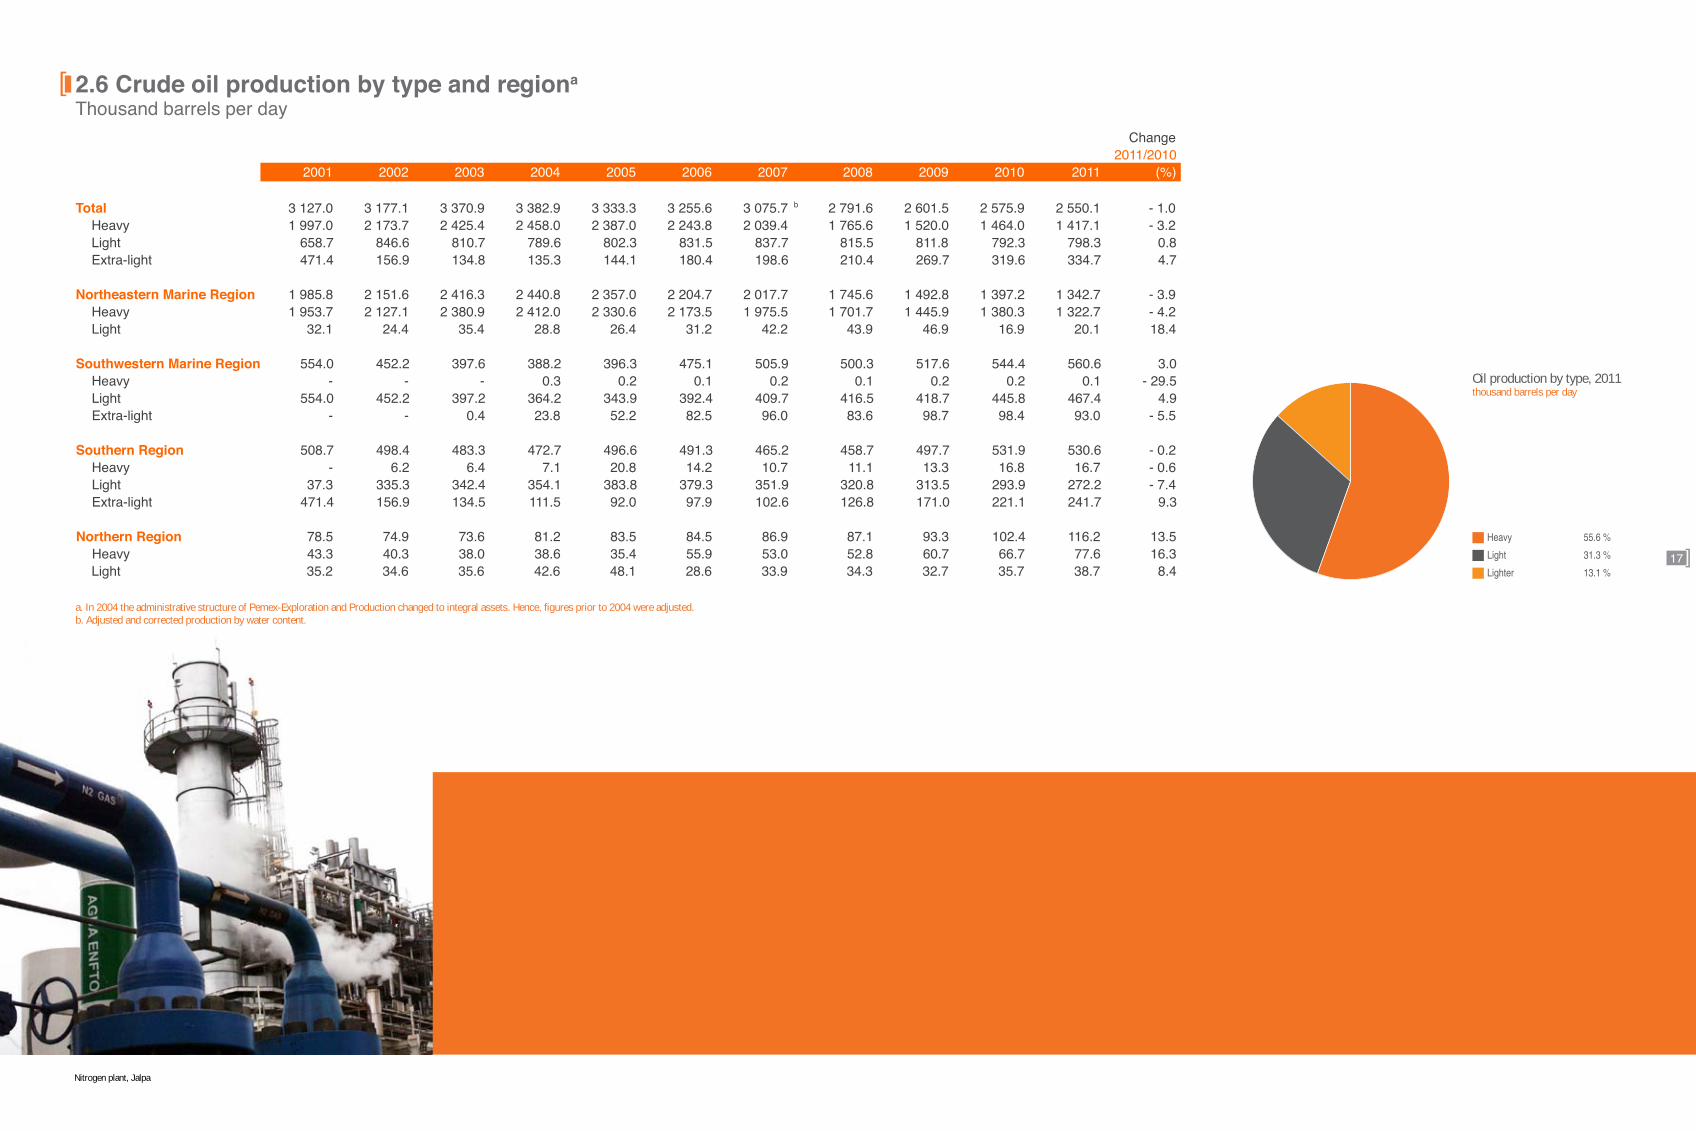
2.6Crudeoilproductionbytypeandregiona Thousand barrels per day
Nitrogen plant, Jalpa
a. In 2004 the administrative structure of Pemex-Exploration and Production changed to integral assets. Hence, figures prior to 2004 were adjusted. b. Adjusted and corrected production by water content.
Change2011/2010
2001 2002 2003 2004 2005 2006 2007 2008 2009 2010 2011 (%)
Total 3 127.0 3 177.1 3 370.9 3 382.9 3 333.3 3 255.6 3 075.7 b 2 791.6 2 601.5 2 575.9 2 550.1 - 1.0Heavy 1 997.0 2 173.7 2 425.4 2 458.0 2 387.0 2 243.8 2 039.4 1 765.6 1 520.0 1 464.0 1 417.1 - 3.2Light 658.7 846.6 810.7 789.6 802.3 831.5 837.7 815.5 811.8 792.3 798.3 0.8Extra-light 471.4 156.9 134.8 135.3 144.1 180.4 198.6 210.4 269.7 319.6 334.7 4.7
Northeastern Marine Region 1 985.8 2 151.6 2 416.3 2 440.8 2 357.0 2 204.7 2 017.7 1 745.6 1 492.8 1 397.2 1 342.7 - 3.9Heavy 1 953.7 2 127.1 2 380.9 2 412.0 2 330.6 2 173.5 1 975.5 1 701.7 1 445.9 1 380.3 1 322.7 - 4.2Light 32.1 24.4 35.4 28.8 26.4 31.2 42.2 43.9 46.9 16.9 20.1 18.4
Southwestern Marine Region 554.0 452.2 397.6 388.2 396.3 475.1 505.9 500.3 517.6 544.4 560.6 3.0Heavy - - - 0.3 0.2 0.1 0.2 0.1 0.2 0.2 0.1 - 29.5Light 554.0 452.2 397.2 364.2 343.9 392.4 409.7 416.5 418.7 445.8 467.4 4.9Extra-light - - 0.4 23.8 52.2 82.5 96.0 83.6 98.7 98.4 93.0 - 5.5
Southern Region 508.7 498.4 483.3 472.7 496.6 491.3 465.2 458.7 497.7 531.9 530.6 - 0.2Heavy - 6.2 6.4 7.1 20.8 14.2 10.7 11.1 13.3 16.8 16.7 - 0.6Light 37.3 335.3 342.4 354.1 383.8 379.3 351.9 320.8 313.5 293.9 272.2 - 7.4Extra-light 471.4 156.9 134.5 111.5 92.0 97.9 102.6 126.8 171.0 221.1 241.7 9.3
Northern Region 78.5 74.9 73.6 81.2 83.5 84.5 86.9 87.1 93.3 102.4 116.2 13.5Heavy 43.3 40.3 38.0 38.6 35.4 55.9 53.0 52.8 60.7 66.7 77.6 16.3Light 35.2 34.6 35.6 42.6 48.1 28.6 33.9 34.3 32.7 35.7 38.7 8.4
Heavy 55.6 %
Light 31.3 %
Oil production by type, 2011thousand barrels per day
Lighter 13.1 %

18
2.7CrudeoilproductioninselectedfieldsThousand barrels per day
Burgos Integral Asset
a. Historically Cantarell. b. Adjusted and corrected production by water content.
Change2011/2010
2001 2002 2003 2004 2005 2006 2007 2008 2009 2010 2011 (%)
Total 3 127 3 177 3 371 3 383 3 333 3 256 3 076 b 2 792 2 601 2 576 2 550 - 1.0 Northeastern Marine Region 1 986 2 152 2 416 2 441 2 357 2 205 2 018 1 746 1 493 1 397 1 343 - 3.9
CantarellAkal-Nohoch a 1 673 1 851 2 054 2 079 1 973 1 734 1 416 949 560 384 325 - 15.2Sihil - 1 9 6 19 16 12 19 35 60 66 9.9Chac 22 17 20 17 12 12 13 12 12 14 9 - 37.2Ixtoc 11 11 11 11 13 14 12 12 11 12 15 34.2Kutz 5 9 13 12 12 12 11 11 10 21 19 - 8.0
Ku 176 185 197 191 203 269 327 364 353 337 311 - 7.8Zaap 26 21 41 57 69 71 113 225 277 274 280 2.3Maloob 45 35 50 53 47 54 73 113 170 218 243 11.7Otros 29 21 21 15 9 23 40 42 63 79 74 - 5.9
Southwestern Marine Region 554 452 398 388 396 475 506 500 518 544 561 3.0Ixtal - - - - 9 47 68 83 108 118 106 - 10.1Chuc 118 107 99 93 103 107 87 69 68 74 58 - 21.2Bolontiku - - - 7 18 27 54 58 62 54 50 - 7.1Sinan - - 0 18 32 53 66 59 60 64 52 - 18.2Caan 163 133 114 108 98 88 72 67 50 43 34 - 21.6Otros 273 212 184 163 137 153 158 164 171 192 260 35.6
Southern Region 509 498 483 473 497 491 465 459 498 532 531 - 0.2Samaria 83 71 73 62 65 64 62 53 49 43 41 - 4.4Sen 33 31 21 13 19 22 27 41 46 54 58 5.9Jujo 56 56 51 44 50 56 51 45 37 23 14 - 37.1Pijije 5 9 12 11 13 15 14 18 28 50 62 22.7Iride 43 43 44 46 50 48 41 34 26 17 15 - 13.3Puerto Ceiba 21 38 46 77 77 54 41 33 24 19 16 - 14.1Tecominoacán 29 27 23 20 22 29 23 25 24 20 15 - 23.5Costero - - - 0 - 1 2 9 18 22 22 3.1Tizón 1 1 2 3 5 5 7 8 15 15 12 - 20.3Cunduacán 22 21 23 26 27 21 14 13 14 11 7 - 35.2Cárdenas 20 16 14 13 15 18 14 13 14 16 12 - 21.4Guaricho - - 0 4 4 4 5 8 12 14 13 - 4.8Mora 6 6 5 4 4 9 12 10 11 10 10 - 8.7Sunuapa 0 1 1 2 3 2 2 2 9 13 9 - 25.2Yagual 4 4 4 6 12 11 11 9 9 9 7 - 25.0Otros 185 175 163 141 130 132 140 138 161 195 216 10.6
Northern Region 79 75 74 81 84 84 87 87 93 102 116 13.5Bagre 2 1 1 1 1 1 4 9 9 9 7 - 24.0Poza Rica 11 10 10 11 10 10 9 7 7 6 6 3.5Tajín 1 1 3 6 6 5 8 11 7 7 6 - 6.3Agua Fría 2 2 2 7 6 7 5 7 7 5 6 13.3Coapechapa 0 0 0 4 9 7 6 7 7 6 5 - 4.5Arenque 8 8 9 8 9 8 8 6 5 5 6 22.3Otros 54 52 49 44 42 45 47 40 52 66 80 22.4

19
2.8Naturalgasproductionbyregionandintegralasseta Million cubic feet per day
a. In 2004 the administrative structure of Pemex-Exploration and Production changed to integral assets. Hence, figures prior to 2004 were adjusted. Note: Integral Asset Aceite Terciario del Golfo was established in 2008, so that their associated fields were rid of Integral Asset Poza Rica-Altamira.
Change2011/2010
2001 2002 2003 2004 2005 2006 2007 2008 2009 2010 2011 (%)
Total 4 510.7 4 423.5 4 498.4 4 572.9 4 818.0 5 356.1 6 058.5 6 918.6 7 030.7 7 020.0 6 594.1 - 6.1
Northeastern Marine Region 794.2 831.2 940.5 947.5 927.7 920.2 1 157.2 1 901.3 1 782.5 1 583.7 1 405.6 - 11.2Cantarell 639.7 704.3 786.1 789.1 760.7 717.7 944.9 1 628.5 1 455.3 1 251.9 1 074.7 - 14.2Ku-Maloob-Zaap 154.5 126.8 154.4 158.4 167.1 202.5 212.2 272.8 327.2 331.8 330.9 - 0.3
Southwestern Marine Region 735.6 620.6 581.3 602.6 654.8 856.1 992.5 1 022.9 1 111.5 1 171.7 1 208.3 3.1Abkatún-Pol-Chuc 621.0 520.3 494.3 456.1 431.8 512.5 544.2 569.0 580.2 594.2 559.0 - 5.9Litoral de Tabasco 114.6 100.3 87.0 146.5 222.9 343.6 448.4 453.9 531.3 577.6 649.3 12.4
Southern Region 1 743.2 1 703.8 1 630.0 1 495.1 1 400.3 1 352.1 1 352.8 1 450.6 1 599.6 1 764.7 1 692.3 - 4.1Cinco Presidentes 43.9 56.5 58.7 67.8 62.8 56.7 61.4 67.5 69.2 104.9 116.9 11.5Bellota-Jujo 310.3 292.2 276.6 276.6 281.9 271.4 239.6 250.7 260.8 305.9 288.2 - 5.8Macuspana 135.6 132.4 147.5 179.6 167.5 192.9 223.1 260.5 312.4 306.5 292.4 - 4.6Muspac 738.4 725.7 686.0 558.1 449.2 368.5 310.9 299.5 278.6 273.5 279.1 2.1Samaria-Luna 514.9 497.0 461.2 412.9 438.9 462.6 517.6 572.4 678.6 773.9 715.7 - 7.5
Northern Region 1 237.7 1 267.9 1 346.7 1 527.8 1 835.2 2 227.6 2 556.0 2 543.9 2 537.1 2 499.9 2 287.8 - 8.5Burgos 989.7 1 006.9 1 030.7 1 094.5 1 217.3 1 330.3 1 411.8 1 382.7 1 515.2 1 478.4 1 344.1 - 9.1Poza Rica-Altamira 112.4 107.1 110.8 119.5 118.8 174.1 222.5 152.5 133.5 117.3 115.2 - 1.8Aceite Terciario del Golfo - - - - - - - 52.1 78.7 85.3 111.9 31.1Veracruz 135.7 153.9 205.2 313.8 499.2 723.3 921.7 956.7 809.6 818.9 716.7 - 12.5
Northeastern Marine
Southwestern Marine
Northern
Natural gas production by regionmillion cubic feet per day
Southern0
1000
2000
3000
4000
5000
6000
7000
8000
20112010200920082007200620052004200320022001
20
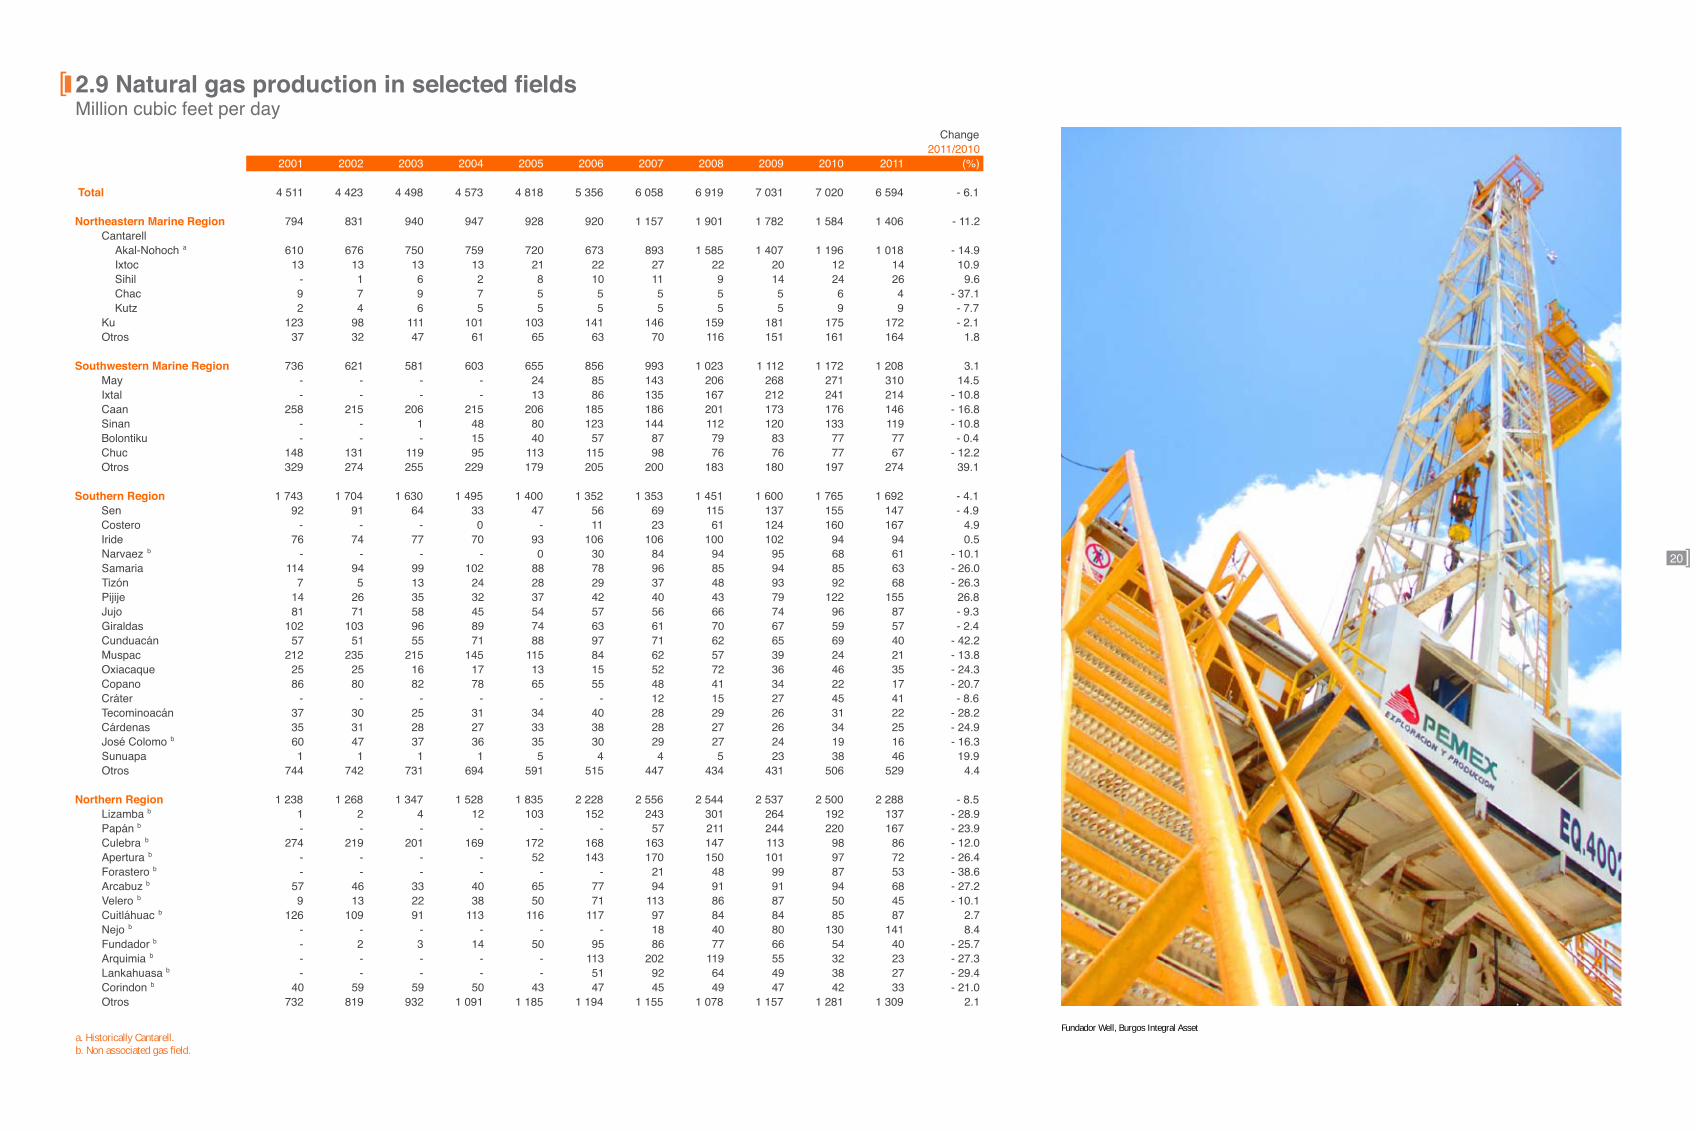
2.9Naturalgasproductioninselectedfields Million cubic feet per day
Fundador Well, Burgos Integral Asseta. Historically Cantarell.b. Non associated gas field.
Change2011/2010
2001 2002 2003 2004 2005 2006 2007 2008 2009 2010 2011 (%)
Total 4 511 4 423 4 498 4 573 4 818 5 356 6 058 6 919 7 031 7 020 6 594 - 6.1
Northeastern Marine Region 794 831 940 947 928 920 1 157 1 901 1 782 1 584 1 406 - 11.2Cantarell
Akal-Nohoch a 610 676 750 759 720 673 893 1 585 1 407 1 196 1 018 - 14.9Ixtoc 13 13 13 13 21 22 27 22 20 12 14 10.9Sihil - 1 6 2 8 10 11 9 14 24 26 9.6Chac 9 7 9 7 5 5 5 5 5 6 4 - 37.1Kutz 2 4 6 5 5 5 5 5 5 9 9 - 7.7
Ku 123 98 111 101 103 141 146 159 181 175 172 - 2.1Otros 37 32 47 61 65 63 70 116 151 161 164 1.8
Southwestern Marine Region 736 621 581 603 655 856 993 1 023 1 112 1 172 1 208 3.1May - - - - 24 85 143 206 268 271 310 14.5Ixtal - - - - 13 86 135 167 212 241 214 - 10.8Caan 258 215 206 215 206 185 186 201 173 176 146 - 16.8Sinan - - 1 48 80 123 144 112 120 133 119 - 10.8Bolontiku - - - 15 40 57 87 79 83 77 77 - 0.4Chuc 148 131 119 95 113 115 98 76 76 77 67 - 12.2Otros 329 274 255 229 179 205 200 183 180 197 274 39.1
Southern Region 1 743 1 704 1 630 1 495 1 400 1 352 1 353 1 451 1 600 1 765 1 692 - 4.1Sen 92 91 64 33 47 56 69 115 137 155 147 - 4.9Costero - - - 0 - 11 23 61 124 160 167 4.9Iride 76 74 77 70 93 106 106 100 102 94 94 0.5Narvaez b - - - - 0 30 84 94 95 68 61 - 10.1Samaria 114 94 99 102 88 78 96 85 94 85 63 - 26.0Tizón 7 5 13 24 28 29 37 48 93 92 68 - 26.3Pijije 14 26 35 32 37 42 40 43 79 122 155 26.8Jujo 81 71 58 45 54 57 56 66 74 96 87 - 9.3Giraldas 102 103 96 89 74 63 61 70 67 59 57 - 2.4Cunduacán 57 51 55 71 88 97 71 62 65 69 40 - 42.2Muspac 212 235 215 145 115 84 62 57 39 24 21 - 13.8Oxiacaque 25 25 16 17 13 15 52 72 36 46 35 - 24.3Copano 86 80 82 78 65 55 48 41 34 22 17 - 20.7Cráter - - - - - - 12 15 27 45 41 - 8.6Tecominoacán 37 30 25 31 34 40 28 29 26 31 22 - 28.2Cárdenas 35 31 28 27 33 38 28 27 26 34 25 - 24.9José Colomo b 60 47 37 36 35 30 29 27 24 19 16 - 16.3Sunuapa 1 1 1 1 5 4 4 5 23 38 46 19.9Otros 744 742 731 694 591 515 447 434 431 506 529 4.4
Northern Region 1 238 1 268 1 347 1 528 1 835 2 228 2 556 2 544 2 537 2 500 2 288 - 8.5Lizamba b 1 2 4 12 103 152 243 301 264 192 137 - 28.9Papán b - - - - - - 57 211 244 220 167 - 23.9Culebra b 274 219 201 169 172 168 163 147 113 98 86 - 12.0Apertura b - - - - 52 143 170 150 101 97 72 - 26.4Forastero b - - - - - - 21 48 99 87 53 - 38.6Arcabuz b 57 46 33 40 65 77 94 91 91 94 68 - 27.2Velero b 9 13 22 38 50 71 113 86 87 50 45 - 10.1Cuitláhuac b 126 109 91 113 116 117 97 84 84 85 87 2.7Nejo b - - - - - - 18 40 80 130 141 8.4Fundador b - 2 3 14 50 95 86 77 66 54 40 - 25.7Arquimia b - - - - - 113 202 119 55 32 23 - 27.3Lankahuasa b - - - - - 51 92 64 49 38 27 - 29.4Corindon b 40 59 59 50 43 47 45 49 47 42 33 - 21.0Otros 732 819 932 1 091 1 185 1 194 1 155 1 078 1 157 1 281 1 309 2.1
21
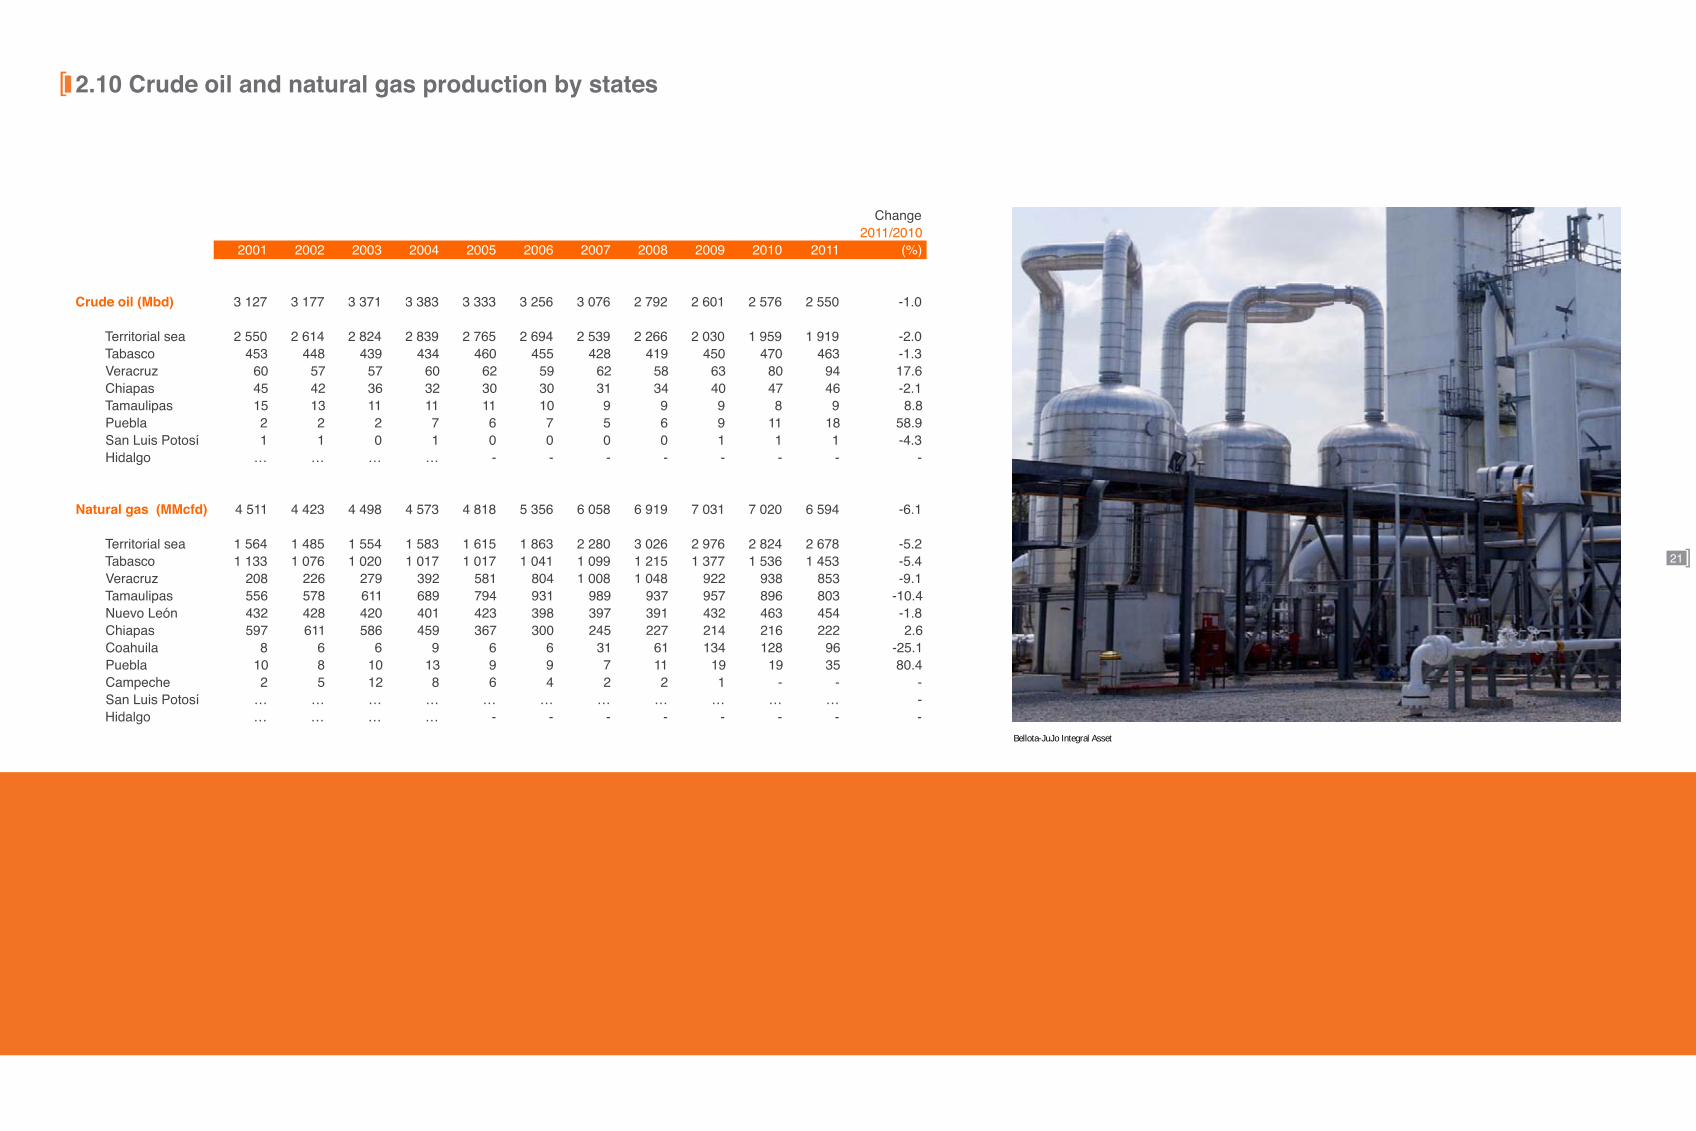
2.10Crudeoilandnaturalgasproductionbystates
Bellota-JuJo Integral Asset
Change2011/2010
2001 2002 2003 2004 2005 2006 2007 2008 2009 2010 2011 (%)
Crude oil (Mbd) 3 127 3 177 3 371 3 383 3 333 3 256 3 076 2 792 2 601 2 576 2 550 -1.0
Territorial sea 2 550 2 614 2 824 2 839 2 765 2 694 2 539 2 266 2 030 1 959 1 919 -2.0 Tabasco 453 448 439 434 460 455 428 419 450 470 463 -1.3 Veracruz 60 57 57 60 62 59 62 58 63 80 94 17.6 Chiapas 45 42 36 32 30 30 31 34 40 47 46 -2.1 Tamaulipas 15 13 11 11 11 10 9 9 9 8 9 8.8 Puebla 2 2 2 7 6 7 5 6 9 11 18 58.9 San Luis Potosí 1 1 0 1 0 0 0 0 1 1 1 -4.3 Hidalgo … … … … - - - - - - - -
Natural gas (MMcfd) 4 511 4 423 4 498 4 573 4 818 5 356 6 058 6 919 7 031 7 020 6 594 -6.1
Territorial sea 1 564 1 485 1 554 1 583 1 615 1 863 2 280 3 026 2 976 2 824 2 678 -5.2 Tabasco 1 133 1 076 1 020 1 017 1 017 1 041 1 099 1 215 1 377 1 536 1 453 -5.4 Veracruz 208 226 279 392 581 804 1 008 1 048 922 938 853 -9.1 Tamaulipas 556 578 611 689 794 931 989 937 957 896 803 -10.4 Nuevo León 432 428 420 401 423 398 397 391 432 463 454 -1.8 Chiapas 597 611 586 459 367 300 245 227 214 216 222 2.6 Coahuila 8 6 6 9 6 6 31 61 134 128 96 -25.1 Puebla 10 8 10 13 9 9 7 11 19 19 35 80.4 Campeche 2 5 12 8 6 4 2 2 1 - - - San Luis Potosí … … … … … … … … … … … - Hidalgo … … … … - - - - - - - -

22
2.11 Crude oil distributionThousand barrels per day
Akal B
a. Adjusted and corrected production by water content.
Change2011/2010
2001 2002 2003 2004 2005 2006 2007 2008 2009 2010 2011 (%)
Availability 3 130 3 180 3 375 3 385 3 335 3 258 3 078 a 2 793 2 603 2 578 2 552 - 1.0Production 3 127 3 177 3 371 3 383 3 333 3 256 3 076 2 792 2 601 2 576 2 550 - 1.0Naphtha and condensates 3 3 4 2 2 3 2 2 2 2 2 - 16.2
Distribution 3 106 3 163 3 358 3 363 3 320 3 234 3 058 2 754 2 594 2 549 2 515 - 1.3To refineries 1 140 1 172 1 246 1 258 1 275 1 242 1 231 1 216 1 264 1 191 1 172 - 1.6To abroad processing 62 130 112 97 81 80 - - - - - -To petrochemical plants 146 145 150 134 131 122 126 131 97 - - -To exports terminals 1 757 1 716 1 848 1 874 1 833 1 789 1 701 1 407 1 232 1 358 1 343 - 1.1
Linefill, stock changes, losses, injections, transfers and statistical differences 25 17 17 22 15 25 20 39 10 29 37 26.3
To exports terminals 53.4 %
Oil distribution, 2011thousand barrels per day
To refineries 46.6 %
23
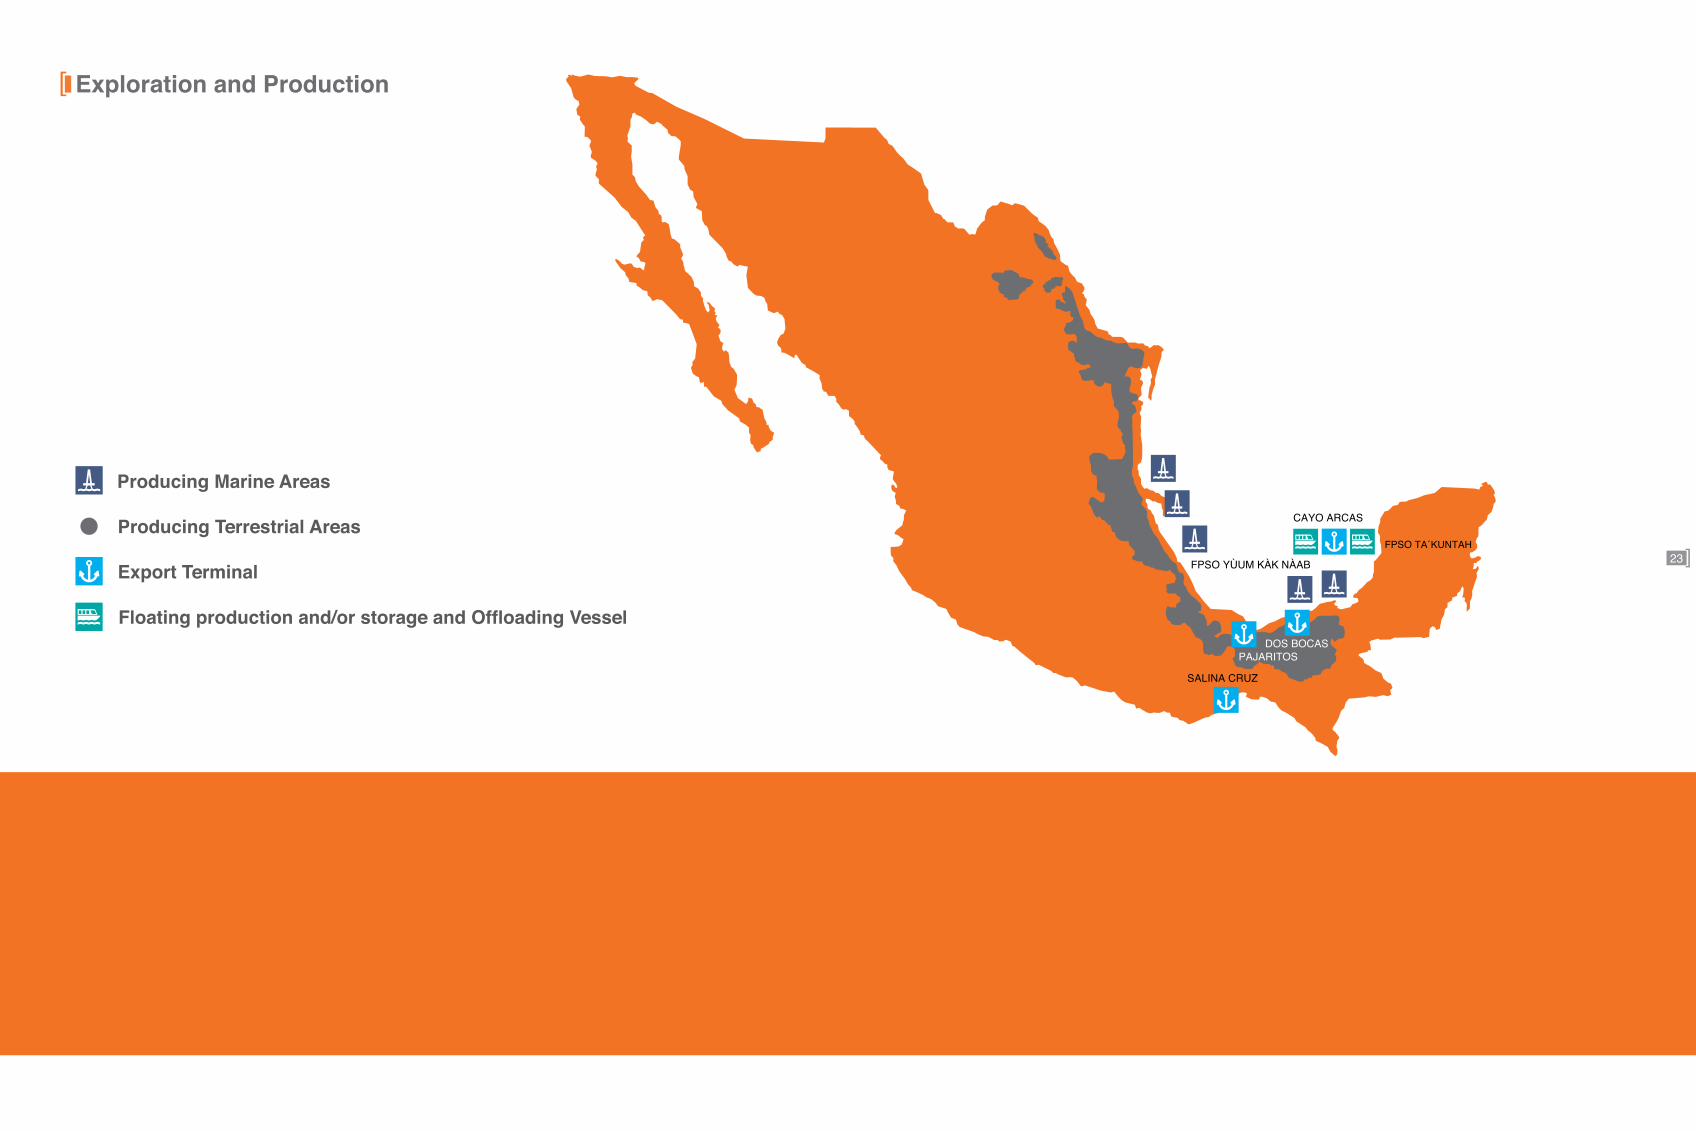
Exploration and Production
Floating production and/or storage and Offloading Vessel
Export Terminal
Producing Terrestrial Areas
Producing Marine Areas
CAYO ARCAS
DOS BOCASPAJARITOS
SALINA CRUZ
FPSO YÙUM KÀK NÀAB
FPSO TA´KUNTAH

24
2.12NaturalgasdistributionMillion cubic feet per day
Dos Bocas
a. Includes residual and field gas used in process and formation pressure boosting. b. Includes gas for pressure boosting purposes. c. Non significative figure.
Change2011/2010
2001 2002 2003 2004 2005 2006 2007 2008 2009 2010 2011 (%)
Availability 5 478 5 472 5 619 5 742 5 984 6 571 7 211 8 055 8 198 8 222 7 754 - 5.7Production 4 511 4 423 4 498 4 573 4 818 5 356 6 058 6 919 7 031 7 020 6 594 - 6.1
Sour gas 3 294 3 164 3 133 2 994 2 937 3 075 3 415 4 236 4 315 4 312 4 000 - 7.2Sweet gas 1 216 1 260 1 365 1 579 1 881 2 281 2 644 2 682 2 716 2 708 2 434 - 10.1
From Pemex-Gas and Basic Petrochemicals 967 1 048 1 121 1 169 1 166 1 215 1 153 1 136 1 167 1 202 1 160 - 3.5
Distribution 5 478 5 472 5 620 5 742 5 984 6 571 7 211 8 055 8 198 8 222 7 754 - 5.7Self-consumption a 439 443 441 521 618 665 785 848 1 128 1 562 1 615 3.4To atmosphere 425 318 296 180 198 286 560 1 347 1 044 611 360 - 41.0
Carbon dioxide (CO2) 78 52 43 27 16 15 13 13 12 11 10 - 5.3Natural gas 347 266 254 153 182 271 547 1 334 1 031 600 350 - 41.7
Net linefill 6 10 7 2 - 19 3 - 8 - 9 8 7 - 53 - 883.7Carbon dioxide (CO2) injected to deposits 9 26 25 31 23 9 8 5 6 7 4 - 34.9Condensation in pipelines and plants 271 241 261 233 240 267 244 225 226 241 245 1.8To Pemex-Refining 6 22 5 1 1 2 2 2 2 0 0 - 38.7To PGPB 4 321 4 411 4 585 4 775 4 923 5 340 5 621 5 638 5 784 5 795 5 583 - 3.7
To pipelines 710 697 763 815 998 1 152 1 334 1 382 1 326 1 312 1 047 - 20.2To processing plants b 3 611 3 714 3 823 3 960 3 926 4 188 4 287 4 256 4 458 4 483 4 536 1.2
Sweetening plants 3 176 3 208 3 325 3 296 3 118 3 162 3 150 3 190 3 388 3 427 3 454 0.8Cryogenic plants 435 506 498 664 807 1 025 1 138 1 066 1 070 1 056 1 082 2.5
Statistical difference and measurement errors c … … … … … … … … … … … -
Utilization
To atmosphere
Natural gas utilizationmillion cubic feet per day
0
1000
2000
3000
4000
5000
6000
7000
8000
20112010200920082007200620052004200320022001
51
03Gas
3.1Processing capacity
3.2Natural gas processing and production
3.3Dry gas balance
3.4Gas processing by center
3.5Domestic sales of dry gas, LPG and petrochemicals
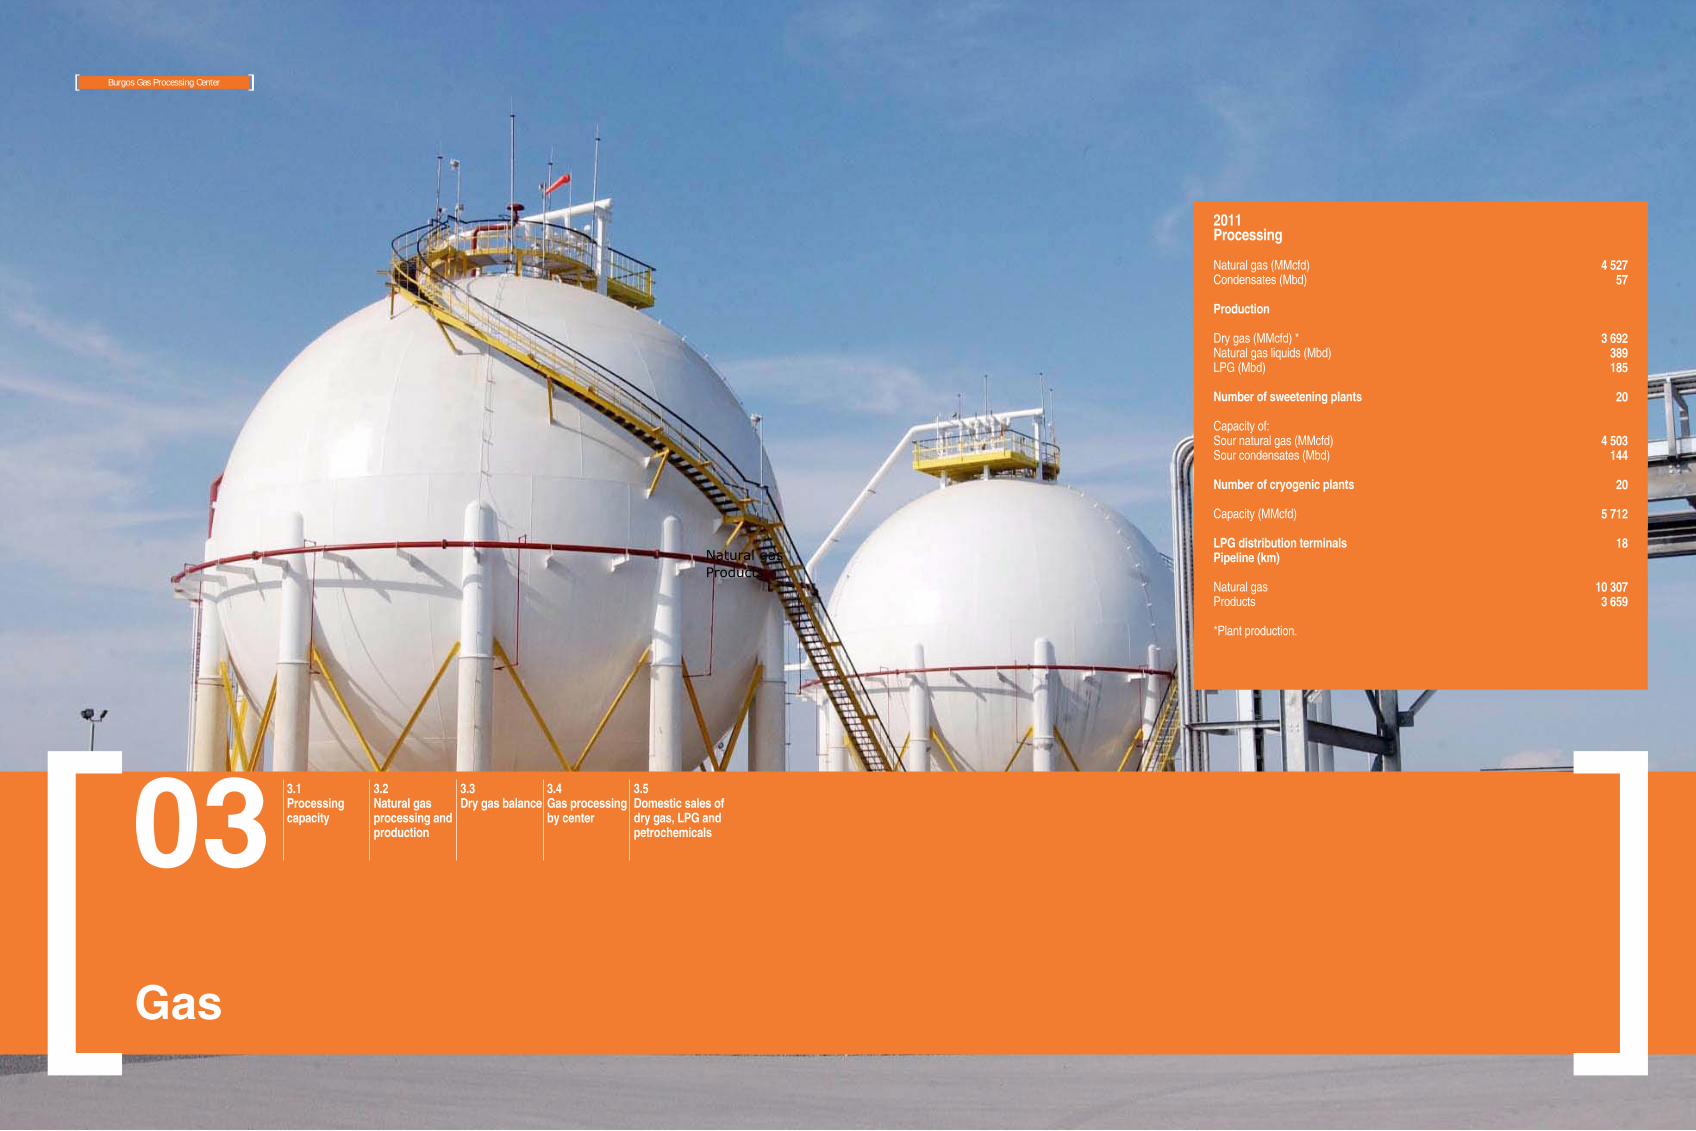
2011Processing
Natural gas (MMcfd)Condensates (Mbd)
Production
Dry gas (MMcfd) *Natural gas liquids (Mbd)LPG (Mbd)
Number of sweetening plants
Capacity of:Sour natural gas (MMcfd)Sour condensates (Mbd)
Number of cryogenic plants
Capacity (MMcfd)
LPG distribution terminalsPipeline (km)
Natural gasProducts
*Plant production.
4 527 57
3 692 389 185
20
4 503 144
20
5 712
18
10 3073 659
Burgos Gas Processing Center
Natural gasProducts
26
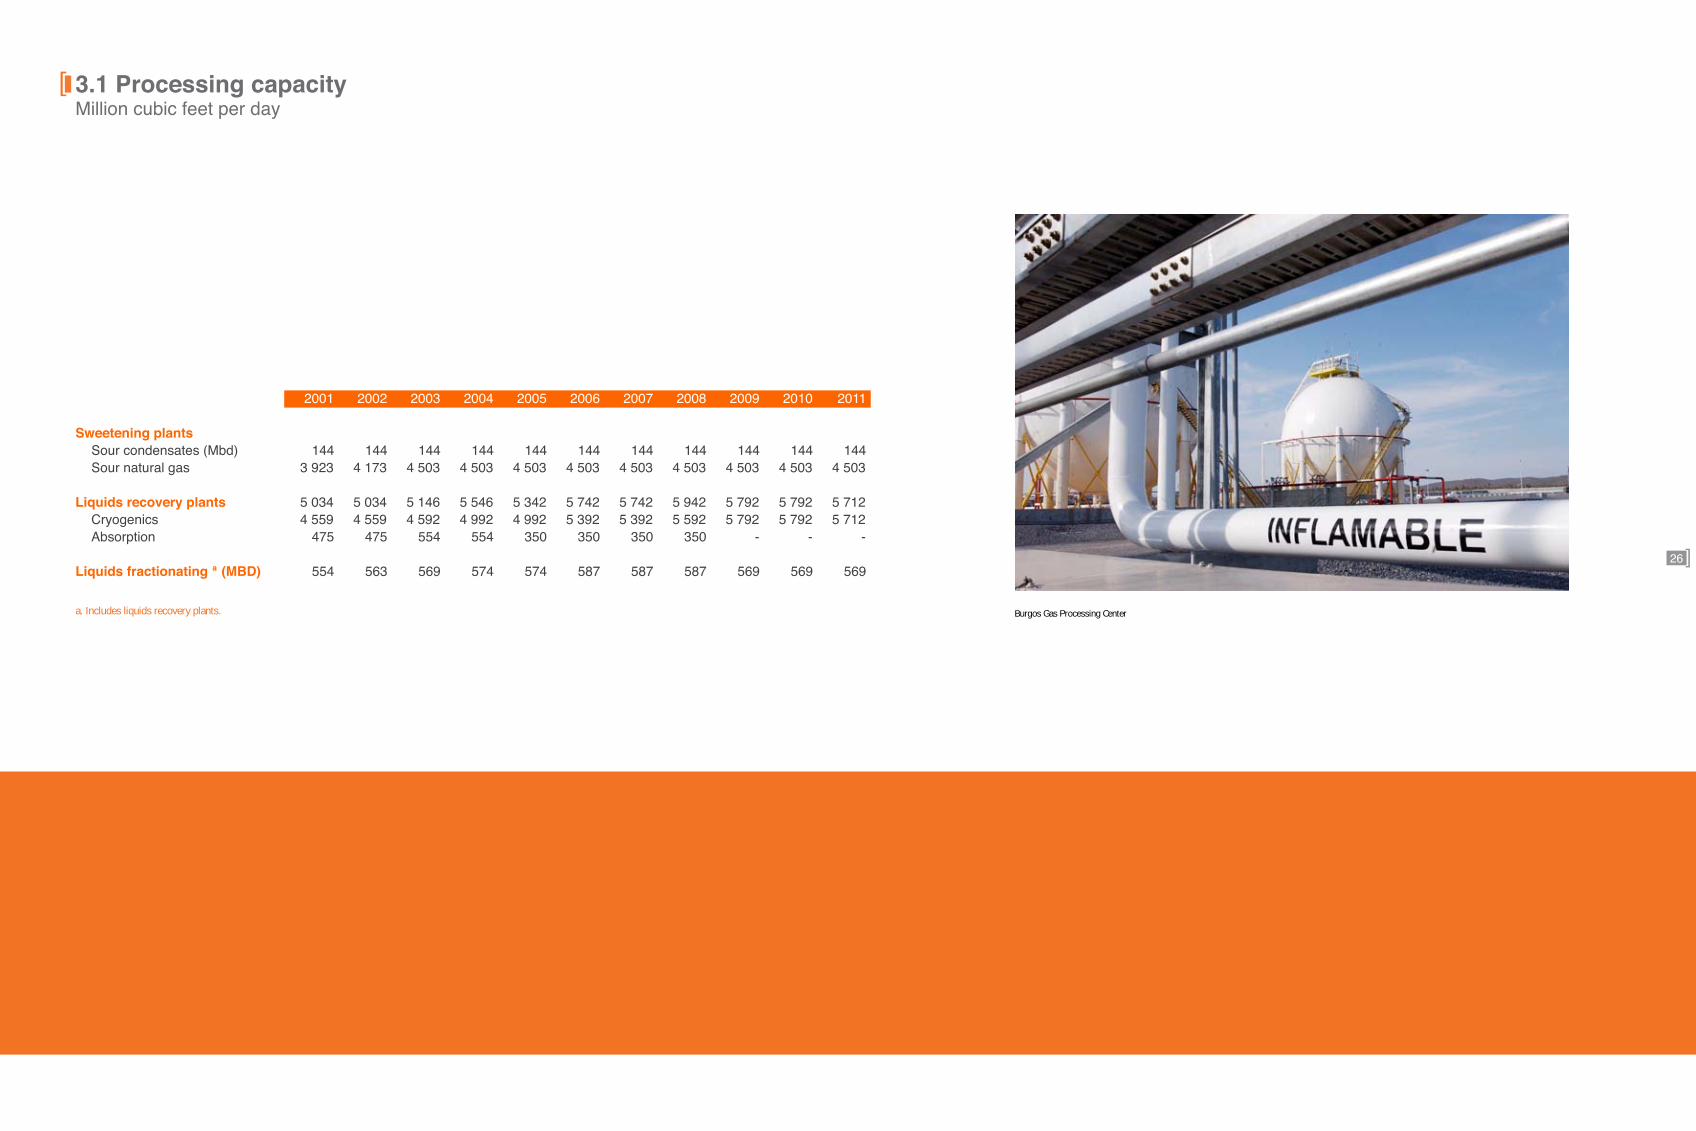
3.1ProcessingcapacityMillion cubic feet per day
Burgos Gas Processing Centera. Includes liquids recovery plants.
2001 2002 2003 2004 2005 2006 2007 2008 2009 2010 2011
Sweetening plantsSour condensates (Mbd) 144 144 144 144 144 144 144 144 144 144 144Sour natural gas 3 923 4 173 4 503 4 503 4 503 4 503 4 503 4 503 4 503 4 503 4 503
Liquids recovery plants 5 034 5 034 5 146 5 546 5 342 5 742 5 742 5 942 5 792 5 792 5 712Cryogenics 4 559 4 559 4 592 4 992 4 992 5 392 5 392 5 592 5 792 5 792 5 712Absorption 475 475 554 554 350 350 350 350 - - -
Liquids fractionating a (MBD) 554 563 569 574 574 587 587 587 569 569 569
27
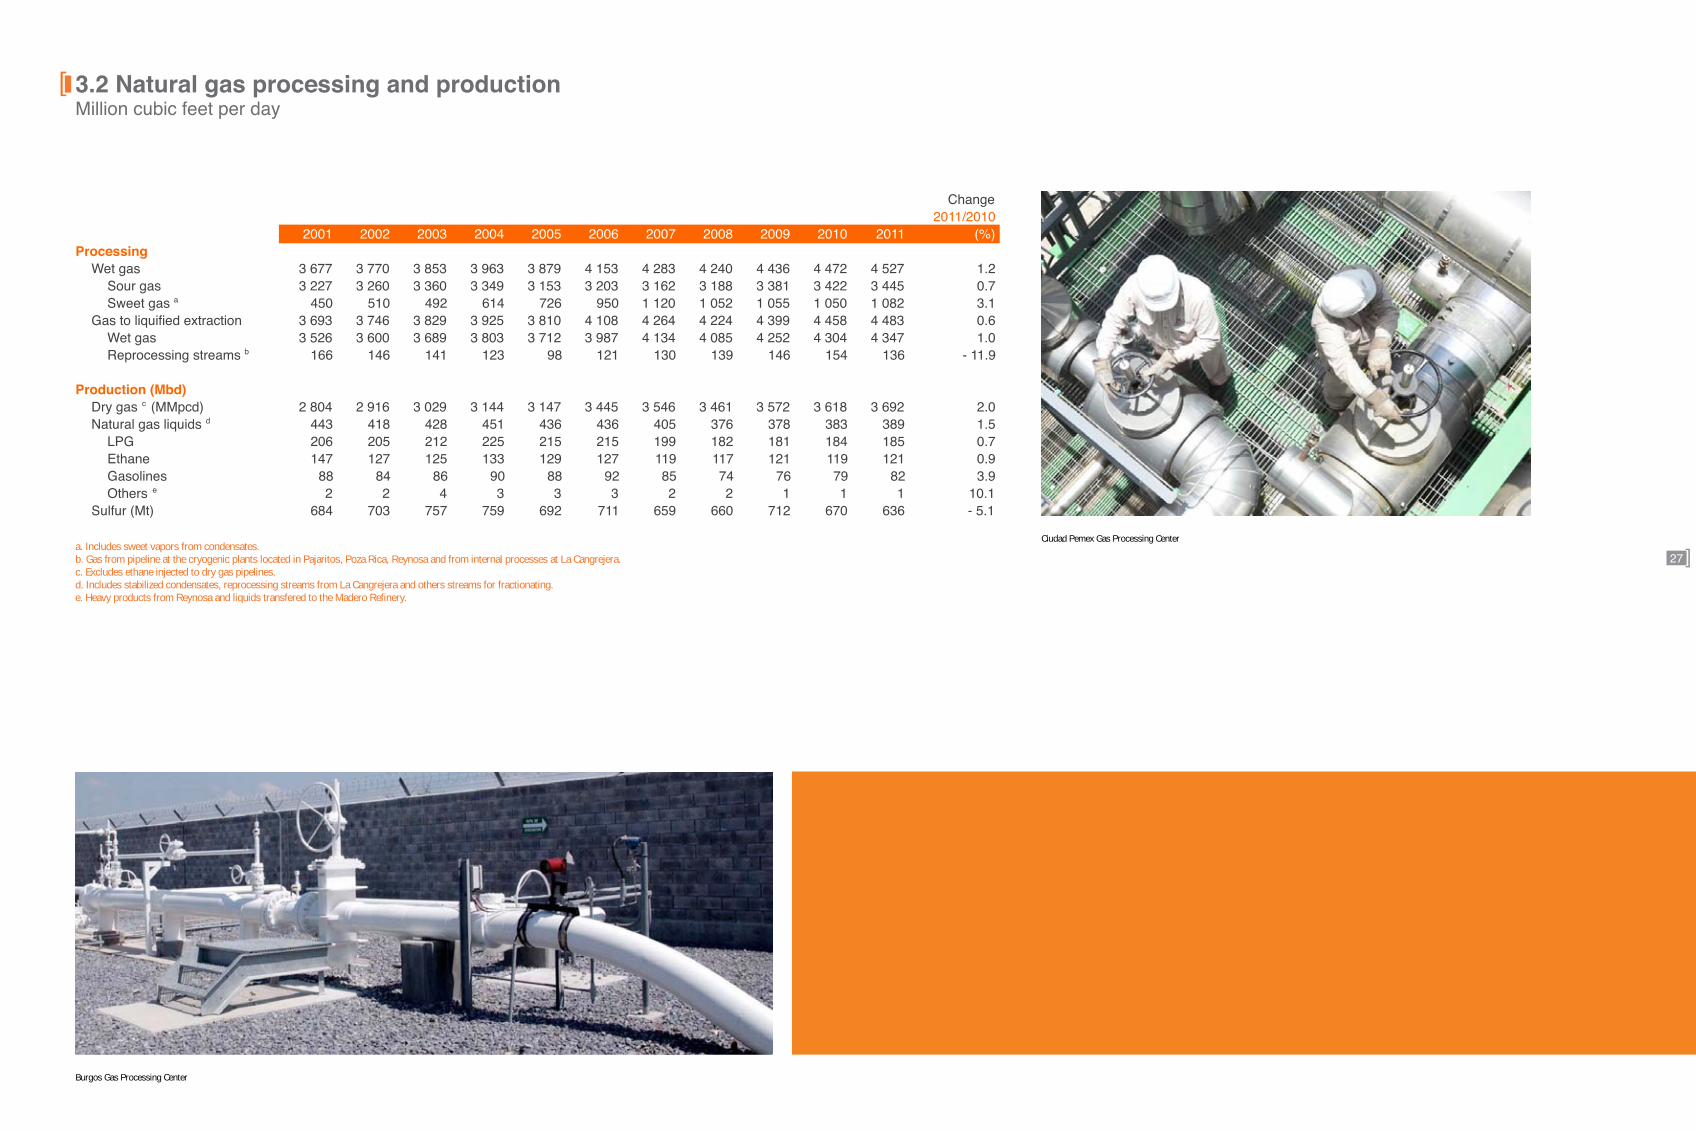
3.2NaturalgasprocessingandproductionMillion cubic feet per day
Ciudad Pemex Gas Processing Center
Burgos Gas Processing Center
a. Includes sweet vapors from condensates. b. Gas from pipeline at the cryogenic plants located in Pajaritos, Poza Rica, Reynosa and from internal processes at La Cangrejera. c. Excludes ethane injected to dry gas pipelines. d. Includes stabilized condensates, reprocessing streams from La Cangrejera and others streams for fractionating. e. Heavy products from Reynosa and liquids transfered to the Madero Refinery.
Change2011/2010
2001 2002 2003 2004 2005 2006 2007 2008 2009 2010 2011 (%)Processing
Wet gas 3 677 3 770 3 853 3 963 3 879 4 153 4 283 4 240 4 436 4 472 4 527 1.2Sour gas 3 227 3 260 3 360 3 349 3 153 3 203 3 162 3 188 3 381 3 422 3 445 0.7Sweet gas a 450 510 492 614 726 950 1 120 1 052 1 055 1 050 1 082 3.1
Gas to liquified extraction 3 693 3 746 3 829 3 925 3 810 4 108 4 264 4 224 4 399 4 458 4 483 0.6Wet gas 3 526 3 600 3 689 3 803 3 712 3 987 4 134 4 085 4 252 4 304 4 347 1.0Reprocessing streams b 166 146 141 123 98 121 130 139 146 154 136 - 11.9
Production (Mbd)Dry gas c (MMpcd) 2 804 2 916 3 029 3 144 3 147 3 445 3 546 3 461 3 572 3 618 3 692 2.0Natural gas liquids d 443 418 428 451 436 436 405 376 378 383 389 1.5
LPG 206 205 212 225 215 215 199 182 181 184 185 0.7Ethane 147 127 125 133 129 127 119 117 121 119 121 0.9Gasolines 88 84 86 90 88 92 85 74 76 79 82 3.9Others e 2 2 4 3 3 3 2 2 1 1 1 10.1
Sulfur (Mt) 684 703 757 759 692 711 659 660 712 670 636 - 5.1

28
Gas
Hermosillo Cananea
Piedras Negras Chihuahua
Monclova Monterrey
Ciudad Madero
Cadereyta
Guadalajara
Toluca CIUDAD PEMEX
Lázaro Cárdenas
Merida
Naco Cd.Juárez
POZA RICA
Veracruz
NUEVO PEMEX CACTUS
LA VENTA
CANGREJERA MORELOS
PAJARITOS
ARENQUE
BURGOS
Salina Cruz
México
Gas Processing Center
Pipeline
MATAPIONCHE
Cd. de

29
3.3DrygasbalanceMillion cubic feet per day
Burgos Gas Processing Center
a. Measured volumes at 1 Kg/cm2 and 20°C.
Change2011/2010
2001 2002 2003 2004 2005 2006 2007 2008 2009 2010 2011 (%)
Supply 3 921 4 309 4 655 4 836 4 724 5 136 5 353 5 367 5 393 5 540 5 604 1.2Production 2 804 2 916 3 029 3 144 3 147 3 445 3 546 3 461 3 572 3 618 3 692 2.0From processing plants 101 91 95 108 94 87 87 76 74 74 76 2.4From producing fields of PEP 710 697 763 815 998 1 152 1 334 1 382 1 325 1 312 1 045 -20.3Imports 292 592 757 766 480 451 386 447 422 536 791 47.6Others 14 13 10 4 5 1 - - - - - -
Demand 3 851 4 299 4 620 4 813 4 688 5 116 5 330 5 369 5 367 5 509 5 573 1.2Self-consumption 1 829 1 870 1 993 2 056 2 033 2 130 2 128 2 176 2 181 2 235 2 187 - 2.1Exports 25 4 - - 24 33 139 107 67 19 1 - 93.2Domestic sales a 1 993 2 425 2 622 2 756 2 634 2 952 3 064 3 086 3 119 3 255 3 385 4.0
Industrial-distributors sector 984 1 132 1 138 1 094 1 073 1 156 1 185 1 127 1 000 1 763 1 884 6.9Power sector 1 010 1 293 1 484 1 535 1 422 1 663 1 740 1 671 1 801 1 146 1 189 3.7Power autogeneration sector - - - 127 139 133 139 140 136 144 139 - 3.8Dealers sector 148 183 201 173 - 14.0
Linefil 3 … 5 … - 2 1 … - 1 1 0 0 - 356.8
Difference 71 10 35 23 38 18 22 - 2 26 31 30 - 1.7
0
500
1000
1500
2000
2500
3000
3500
20112010200920082007200620052004200320022001
Industrial - distributors sector
Power sector
Power autogeneration sector
Wholesalers
Imports
Domestic sales and imports of dry natural gasmillion cubic feet per day
0
500
1000
1500
2000
2500
3000
3500
4000
4500
5000
20112010200920082007200620052004200320022001
Natural gas processing
Dry gas production
Dry natural gas processingand productionmillion cubic feet per day

3.4GasprocessingbycenterMillion cubic feet per day
30
Ciudad Pemex Gas Processing Center
a. As of August 31, 2009, is out of operation.
Change2011/2010
2001 2002 2003 2004 2005 2006 2007 2008 2009 2010 2011 (%)
Gas processing 3 677 3 770 3 853 3 963 3 879 4 153 4 283 4 240 4 436 4 472 4 527 1
Sour wet gas 3 227 3 260 3 360 3 349 3 153 3 203 3 162 3 188 3 381 3 422 3 445 1Cactus 1 550 1 581 1 533 1 431 1 373 1 334 1 404 1 597 1 712 1 674 1 696 1Ciudad Pemex 787 785 922 941 826 918 884 831 847 888 854 - 4Matapionche 96 94 81 81 73 74 67 54 51 49 45 - 9Nuevo Pemex 648 676 696 760 741 744 668 593 658 678 677 0Arenque - - 28 34 32 32 31 26 23 26 30 13Poza Rica 145 124 100 100 107 100 109 86 91 106 144 36
Sweet wet gas 450 510 492 614 726 950 1 120 1 052 1 055 1 050 1 082 3
Ciudad Pemex 84 102 65 70 63 45 67 60 52 53 41 - 22La Venta 61 62 60 65 46 45 53 62 57 79 102 28Reynosa a 286 336 356 233 223 197 183 117 11 - - -Burgos - - - 241 385 646 804 808 932 913 931 2Nuevo Pemex 19 10 12 6 9 17 14 5 3 5 8 54
31
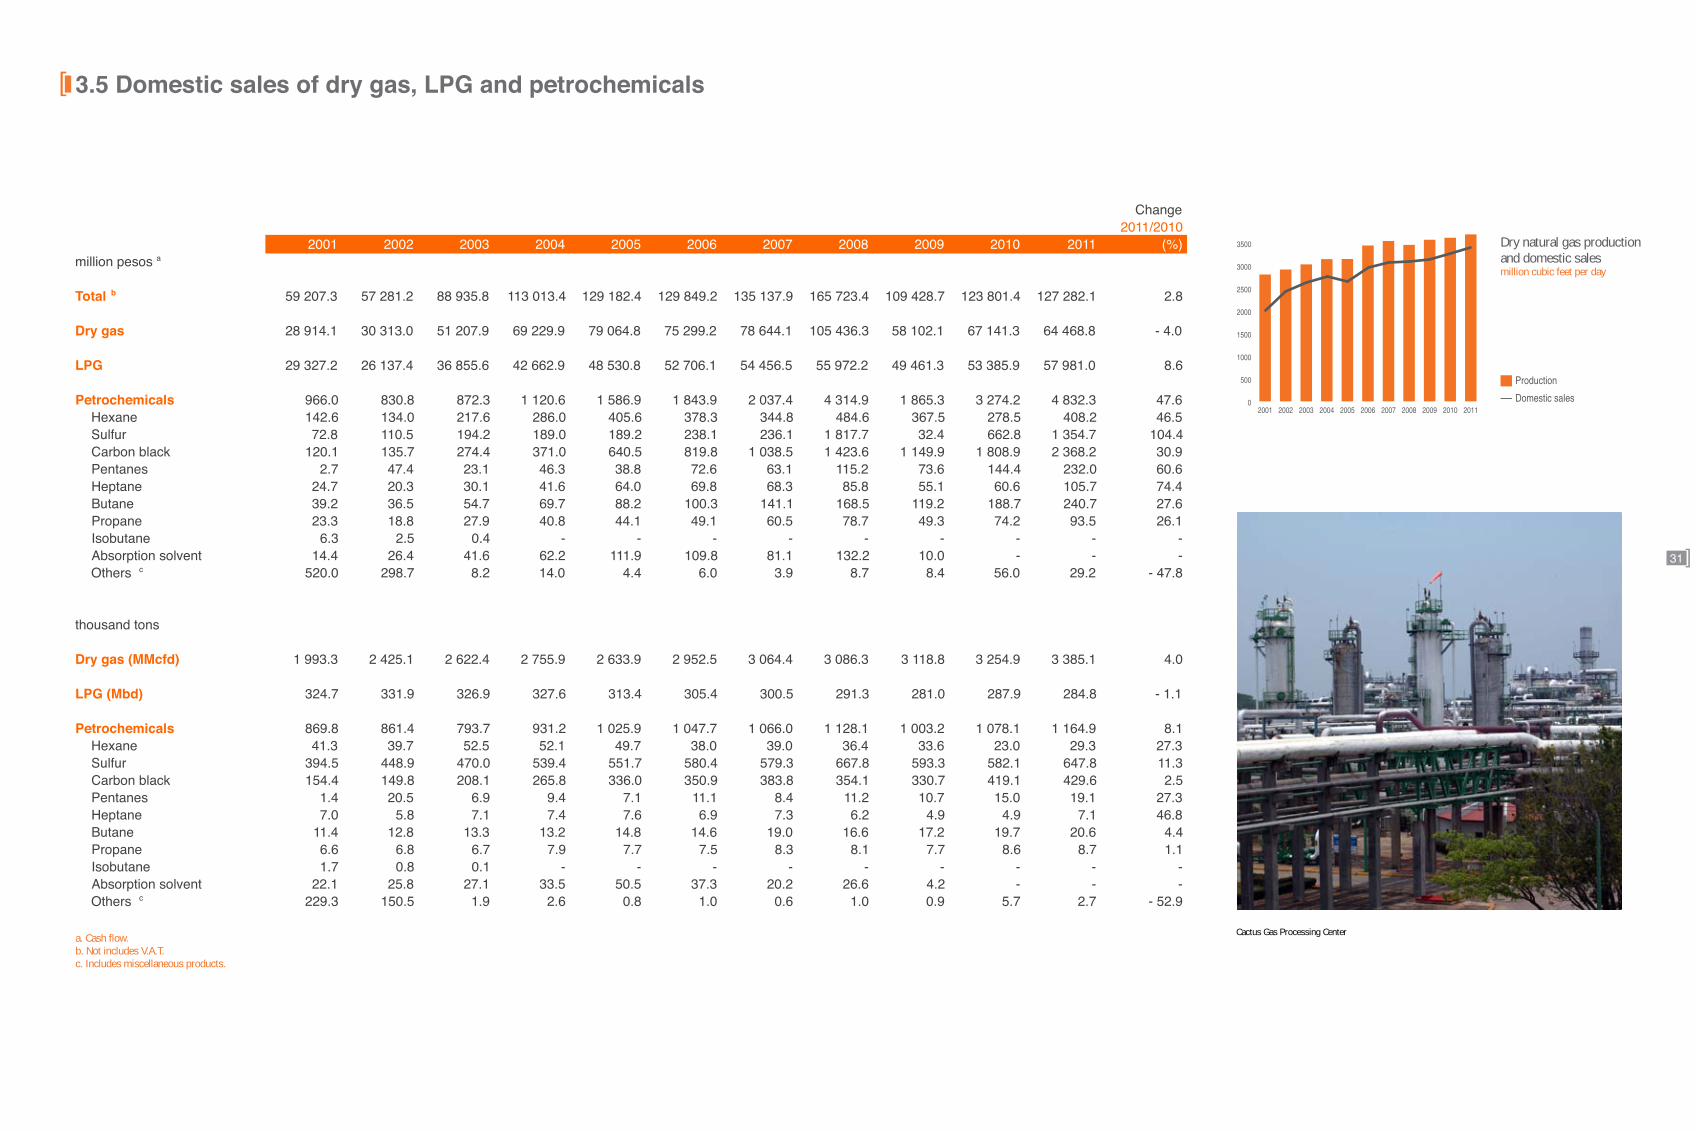
3.5Domesticsalesofdrygas,LPGandpetrochemicals
Cactus Gas Processing Centera. Cash flow.b. Not includes V.A.T.c. Includes miscellaneous products.
Change2011/2010
2001 2002 2003 2004 2005 2006 2007 2008 2009 2010 2011 (%)million pesos a
Total b 59 207.3 57 281.2 88 935.8 113 013.4 129 182.4 129 849.2 135 137.9 165 723.4 109 428.7 123 801.4 127 282.1 2.8
Dry gas 28 914.1 30 313.0 51 207.9 69 229.9 79 064.8 75 299.2 78 644.1 105 436.3 58 102.1 67 141.3 64 468.8 - 4.0
LPG 29 327.2 26 137.4 36 855.6 42 662.9 48 530.8 52 706.1 54 456.5 55 972.2 49 461.3 53 385.9 57 981.0 8.6
Petrochemicals 966.0 830.8 872.3 1 120.6 1 586.9 1 843.9 2 037.4 4 314.9 1 865.3 3 274.2 4 832.3 47.6Hexane 142.6 134.0 217.6 286.0 405.6 378.3 344.8 484.6 367.5 278.5 408.2 46.5Sulfur 72.8 110.5 194.2 189.0 189.2 238.1 236.1 1 817.7 32.4 662.8 1 354.7 104.4Carbon black 120.1 135.7 274.4 371.0 640.5 819.8 1 038.5 1 423.6 1 149.9 1 808.9 2 368.2 30.9Pentanes 2.7 47.4 23.1 46.3 38.8 72.6 63.1 115.2 73.6 144.4 232.0 60.6Heptane 24.7 20.3 30.1 41.6 64.0 69.8 68.3 85.8 55.1 60.6 105.7 74.4Butane 39.2 36.5 54.7 69.7 88.2 100.3 141.1 168.5 119.2 188.7 240.7 27.6Propane 23.3 18.8 27.9 40.8 44.1 49.1 60.5 78.7 49.3 74.2 93.5 26.1Isobutane 6.3 2.5 0.4 - - - - - - - - -Absorption solvent 14.4 26.4 41.6 62.2 111.9 109.8 81.1 132.2 10.0 - - -Others c 520.0 298.7 8.2 14.0 4.4 6.0 3.9 8.7 8.4 56.0 29.2 - 47.8
thousand tons
Dry gas (MMcfd) 1 993.3 2 425.1 2 622.4 2 755.9 2 633.9 2 952.5 3 064.4 3 086.3 3 118.8 3 254.9 3 385.1 4.0
LPG (Mbd) 324.7 331.9 326.9 327.6 313.4 305.4 300.5 291.3 281.0 287.9 284.8 - 1.1
Petrochemicals 869.8 861.4 793.7 931.2 1 025.9 1 047.7 1 066.0 1 128.1 1 003.2 1 078.1 1 164.9 8.1Hexane 41.3 39.7 52.5 52.1 49.7 38.0 39.0 36.4 33.6 23.0 29.3 27.3Sulfur 394.5 448.9 470.0 539.4 551.7 580.4 579.3 667.8 593.3 582.1 647.8 11.3Carbon black 154.4 149.8 208.1 265.8 336.0 350.9 383.8 354.1 330.7 419.1 429.6 2.5Pentanes 1.4 20.5 6.9 9.4 7.1 11.1 8.4 11.2 10.7 15.0 19.1 27.3Heptane 7.0 5.8 7.1 7.4 7.6 6.9 7.3 6.2 4.9 4.9 7.1 46.8Butane 11.4 12.8 13.3 13.2 14.8 14.6 19.0 16.6 17.2 19.7 20.6 4.4Propane 6.6 6.8 6.7 7.9 7.7 7.5 8.3 8.1 7.7 8.6 8.7 1.1Isobutane 1.7 0.8 0.1 - - - - - - - - -Absorption solvent 22.1 25.8 27.1 33.5 50.5 37.3 20.2 26.6 4.2 - - -Others c 229.3 150.5 1.9 2.6 0.8 1.0 0.6 1.0 0.9 5.7 2.7 - 52.9
0
500
1000
1500
2000
2500
3000
3500
20112010200920082007200620052004200320022001
Production
Domestic sales
Dry natural gas productionand domestic salesmillion cubic feet per day

65
04Refining
4.1 Refining capacity
4.2 Refining production
4.3 Production by refinery
4.4 Value of domestic sales
4.5 Volume of domestic sales
4.6 Domestic sales of refined products by region, 2011
4.7 Average end-user prices of selected refined products
4.8 Service stations by state
2011Thousand barrels per day
Processing
Production
Domestic sales of refined products
Facilities
Atmospheric distillation capacity
Number of refineries
Storage and distribution terminals
Service stations
Pipeline (km)
Crude oil
Products
1 167
1 190
1 498
1 690 6
77
9 637
5 213
8 958
Ing. Héctor R. Lara Sosa, refinery

33
RefiningRosarito
Mexicali
Ensenada
Hermosillo
Guaymas
Cd. Obregón
Topolobampo
Culiacán
Mazatlán
Guamuchil
Saltillo
Chihuahua
Torreón
Sabinas
Cd. Juárez
Paila
Cuesta de los Muertos
Monclova
Laguna
Reynosa
Matamoros
D.F.
Veracruz
MINATITLÁN
SALINA CRUZ
Morelia
Zacatecas
Cuernavaca Pajaritos
Dos Bocas
Villahermosa
MADERO
CADEREYTA
Poza Rica El Castillo
Zapoapita Puebla
Pachuca TULA León
Degollado Zamora
Toluca
SALAMANCA
Manzanillo C.F.E.
Lázaro Cárdenas
Acapulco
Aguascalientes
Querétaro
San Luis Potosí Progreso
Campeche Lerma
Mérida
Refinery
Pipeline
Polyduct

34
4.1RefiningcapacityThousand barrels per day
Gral. Lázaro Cárdenas refinery
a. Excludes La Cangrejera since 2008.
2001 2002 2003 2004 2005 2006 2007 2008 2009 2010 2011
Atmospheric distillation 1 559 1 540 1 540 1 540 1 540 1 540 1 540 1 540 1 540 1 540 1 690Vacuum distillation 774 768 768 768 768 754 754 754 754 754 832Cracking 375 396 396 375 375 381 381 381 381 381 423Visbreaking 141 141 141 141 141 91 91 91 91 91 91Reforming 269 301 301 301 301 279 279 279 279 279 279Hydrodesulfurization a 848 987 987 987 987 926 926 926 926 1 010 1 067Alkylation and Isomerization a 139 144 144 144 144 152 152 128 128 128 142Coking - - 100 100 100 100 100 100 100 100 156

35
4.2RefiningproductionThousand barrels per day
Ing. Antonio M. Amor refinery
a. Refers to unfinished gasoline. b. Includes gasoline transfer from La Cangrejera to the Minatitlan Refinery. c. It start production as of January 2009. d. Includes aeroflex 1-2, coke, vacuum gas oil to export, furfural extract and flasher bottoms.
Change2011/2010
2001 2002 2003 2004 2005 2006 2007 2008 2009 2010 2011 (%)
Refined products 1 261.6 1 262.4 1 327.5 1 349.6 1 325.3 1 327.8 1 312.4 1 306.9 1 342.7 1 229.1 1 190.2 - 3.2LPG 27.8 31.3 33.8 28.0 30.6 25.4 26.6 25.9 27.1 25.5 21.4 - 16.0Gasolines 390.2 398.2 445.2 466.7 455.1 456.2 456.4 450.7 471.5 424.2 400.3 - 5.6
Nova/Base a 9.8 16.4 10.5 3.9 4.8 7.5 4.5 6.5 3.0 3.0 0.7 - 78.2Pemex Magna b 362.0 359.4 396.5 418.5 412.0 413.7 425.7 418.7 364.0 341.2 324.2 - 5.0Ultra Low sulfur Magna c - - - - - - - - 81.8 67.3 61.7 - 8.3Pemex Premium 17.3 21.8 37.6 43.8 38.2 35.0 26.1 25.4 22.7 12.5 13.7 9.9Others 1.2 0.7 0.6 0.4 0.1 0.1 0.1 0.1 0.1 0.1 0.0 - 77.1
Jet fuel 56.7 56.7 59.6 62.1 63.3 64.8 66.3 64.0 57.1 51.9 56.3 8.5Other kerosenes 0.3 - - - - - - - - - - -Diesel 281.6 266.9 307.8 324.7 318.2 328.1 334.0 343.5 337.0 289.5 273.8 - 5.4
Low sulfur content 1.1 0.7 0.6 - - - - - - - - -Pemex Diesel 266.6 246.7 290.8 319.6 312.3 318.3 326.2 336.1 291.4 221.0 193.6 - 12.4Ultra Low sulfur Diesel c - - - - - - - - 44.5 67.7 80.1 18.2Others 13.9 19.5 16.4 5.1 5.9 9.8 7.8 7.4 1.0 0.8 0.1 - 92.9
Industrial fuel oil ... - - - - - - - - - - -Fuel oil 430.4 436.1 381.1 356.5 337.9 323.3 301.5 288.7 316.2 322.3 307.5 - 4.6Asphalts 28.7 28.8 25.6 27.2 29.3 32.3 31.9 34.3 31.9 24.9 26.1 4.9Lubricants 5.2 4.9 5.5 5.4 5.2 5.1 5.2 5.1 4.2 4.3 3.7 - 12.7Paraffines 1.2 1.0 0.9 1.0 1.1 1.0 1.1 1.0 0.8 0.8 0.7 - 9.8Refinery gas 39.0 37.4 51.3 49.9 51.9 56.7 55.2 54.9 54.9 54.2 62.6 15.6Other refined products d 0.6 1.1 16.7 28.2 32.8 34.8 34.2 38.8 42.0 31.7 37.9 19.4
Petrochemicals (Mt) 712.8 690.6 894.8 1 042.6 1 048.2 1 070.8 1 121.2 1 070.5 1 178.4 1 120.2 1 117.0 - 0.3
0
200
400
600
800
1000
1200
1400
1600
20112010200920082007200620052004200320022001
Diesel
Fuel oil
Jet fuel
LPG
Refinery productionthousand barrels per day
Gasolines
Others

36
4.3ProductionbyrefineryThousand barrels per day
Ing. Antonio M. Amor refinery
a. Excludes products under abroad processing agreements.
Cadereyta 14.6 %
Madero 10.1 %
Minatitlán 13.0 %
Salamanca 14.6 %
Refinery Runs, 2011Thousand barrels per day
Tula 23.7 %
Salina Cruz 23.9 %
Change2011/2010
2001 2002 2003 2004 2005 2006 2007 2008 2009 2010 2011 (%)
Processing 1 251.9 1 245.4 1 285.9 1 303.4 1 284.4 1 284.2 1 269.8 1 261.0 1 294.9 1 184.1 1 166.7 - 1.5
Production a 1 261.6 1 262.4 1 327.5 1 349.6 1 325.3 1 327.8 1 312.4 1 306.9 1 342.7 1 229.1 1 190.2 - 3.2
CadereytaProcessing 200.4 196.0 209.0 212.8 194.6 207.2 210.2 208.3 217.2 176.9 170.6 - 3.6Production 204.6 206.7 227.5 220.1 199.9 214.6 218.5 220.1 224.5 180.5 171.1 - 5.2
MaderoProcessing 105.9 108.0 141.2 145.3 141.9 149.3 141.4 152.1 151.8 126.4 117.5 - 7.0Production 92.1 89.9 142.2 153.8 158.6 172.0 160.6 163.4 160.7 134.4 117.7 - 12.4
MinatitlánProcessing 177.0 169.6 176.6 167.0 162.6 168.6 170.1 161.6 167.1 158.7 151.9 - 4.3Production 181.9 175.8 178.2 174.7 176.4 173.1 173.8 171.7 179.7 176.8 167.6 - 5.2
SalamancaProcessing 185.7 185.4 185.0 198.6 197.0 196.4 187.6 192.5 192.1 185.9 170.7 - 8.2Production 185.1 186.3 187.4 201.1 195.0 195.8 183.8 193.1 189.1 183.7 167.0 - 9.1
Salina CruzProcessing 292.8 306.3 306.2 287.9 292.7 290.0 271.5 279.4 277.2 270.0 279.4 3.5Production 303.7 322.7 320.1 303.1 301.2 299.5 284.0 290.0 289.6 281.1 285.5 1.6
TulaProcessing 290.3 280.1 267.8 291.9 295.6 272.7 288.9 267.2 289.5 266.2 276.6 3.9Production 294.2 281.0 272.1 296.4 294.2 272.9 291.8 268.6 299.2 272.7 281.4 3.2

37
4.4 Value of domestic salesMillion pesos
Ing. Héctor R. Lara Sosa refinery
a. Excludes IEPS and VAT. b. Includes initial filling motor gasoline. c. Includes domestic gas oil. d. Coke and impregnant.
Change2011/2010
2001 2002 2003 2004 2005 2006 2007 2008 2009 2010 2011 (%)
Total a 142 508.5 135 623.2 186 882.5 255 244.1 326 924.3 383 307.0 421 622.9 490 003.8 466 117.7 535 058.7 625 678.7 16.9
Refined products 141 821.1 135 075.8 185 964.9 253 556.4 324 852.4 380 858.5 419 114.8 486 715.3 463 258.8 530 969.0 621 254.5 17.0Gasolines 71 895.6 70 004.0 99 443.1 145 192.7 184 883.9 221 972.2 247 625.4 266 286.8 258 778.0 295 430.7 328 870.2 11.3
Pemex Magna 60 734.8 57 327.1 80 864.0 117 390.9 150 793.1 181 286.7 209 006.5 231 071.4 233 307.2 270 121.9 300 936.8 11.4Pemex Premium 10 874.5 12 428.9 18 364.1 27 591.2 33 857.6 40 410.7 38 331.9 34 909.6 25 180.3 24 987.2 27 520.1 10.1Aviation fuels 112.3 125.3 130.1 119.7 172.0 180.4 212.9 236.9 240.9 247.1 353.4 43.0Others b 174.1 122.8 84.8 90.9 61.2 94.4 74.1 69.0 49.6 74.4 59.9 - 19.5
Kerosenes 5 806.6 5 326.9 7 344.0 11 081.5 16 388.7 19 089.5 23 552.5 32 038.3 18 439.9 23 114.3 31 776.1 37.5Jet fuel 5 681.6 5 193.9 7 229.0 10 951.1 16 241.3 18 897.1 23 369.3 31 936.4 18 320.7 22 935.3 31 560.2 37.6Others c 125.0 133.0 115.0 130.5 147.4 192.3 183.2 101.9 119.2 179.0 215.9 20.6
Diesel 33 793.0 30 244.6 44 706.9 61 473.2 78 736.5 88 373.6 96 920.1 111 424.7 121 521.5 144 009.6 166 241.2 15.4Pemex Diesel 27 589.3 25 424.8 36 538.9 51 675.9 67 014.4 76 036.1 84 752.0 96 434.7 106 129.0 125 556.4 142 559.8 13.5Others 6 203.6 4 819.9 8 168.0 9 797.3 11 722.1 12 337.5 12 168.2 14 990.0 15 392.4 18 453.2 23 681.4 28.3
Industrial fuel oil 9.3 - - - - - - - - - - -Fuel oil 27 653.0 26 709.1 30 896.3 31 528.8 39 520.7 43 298.9 42 395.7 61 670.2 51 907.6 56 766.7 80 265.5 41.4Asphalts 1 513.7 1 812.0 2 304.2 2 857.8 3 538.3 5 759.5 6 107.4 11 492.9 10 277.1 8 814.1 10 539.1 19.6Lubricants 1 008.2 855.2 1 126.7 1 245.0 1 536.3 2 059.9 2 167.9 3 318.1 2 000.5 2 429.8 3 153.8 29.8Paraffines 141.2 122.9 119.7 144.7 201.3 225.2 247.7 371.6 235.3 297.5 304.2 2.2Others d 0.5 1.0 24.0 32.6 46.7 79.8 98.0 112.7 99.0 106.4 104.5 - 1.8
Petrochemicals 687.5 547.4 917.6 1 687.7 2 071.9 2 448.6 2 508.1 3 288.4 2 859.0 4 089.7 4 424.3 8.2
38
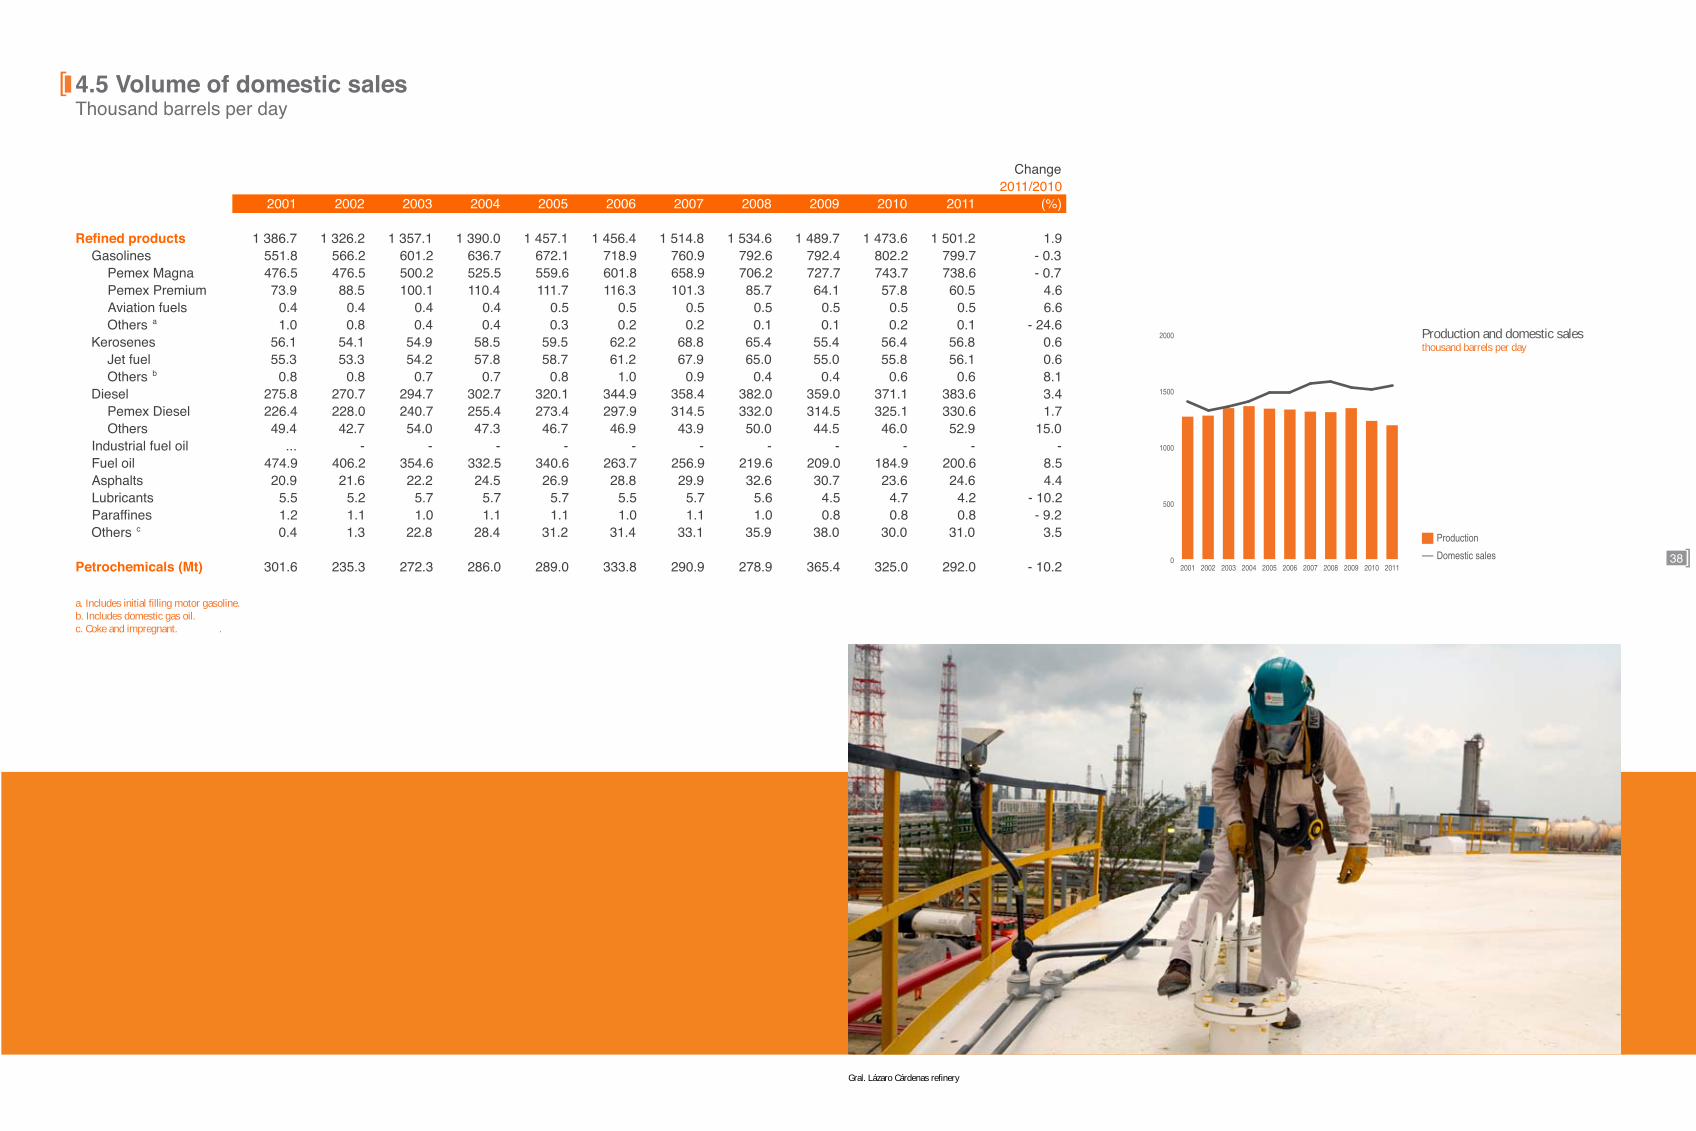
4.5 Volume of domestic salesThousand barrels per day
Gral. Lázaro Cárdenas refinery
a. Includes initial filling motor gasoline. b. Includes domestic gas oil. c. Coke and impregnant. .
Change2011/2010
2001 2002 2003 2004 2005 2006 2007 2008 2009 2010 2011 (%)
Refined products 1 386.7 1 326.2 1 357.1 1 390.0 1 457.1 1 456.4 1 514.8 1 534.6 1 489.7 1 473.6 1 501.2 1.9Gasolines 551.8 566.2 601.2 636.7 672.1 718.9 760.9 792.6 792.4 802.2 799.7 - 0.3
Pemex Magna 476.5 476.5 500.2 525.5 559.6 601.8 658.9 706.2 727.7 743.7 738.6 - 0.7Pemex Premium 73.9 88.5 100.1 110.4 111.7 116.3 101.3 85.7 64.1 57.8 60.5 4.6Aviation fuels 0.4 0.4 0.4 0.4 0.5 0.5 0.5 0.5 0.5 0.5 0.5 6.6Others a 1.0 0.8 0.4 0.4 0.3 0.2 0.2 0.1 0.1 0.2 0.1 - 24.6
Kerosenes 56.1 54.1 54.9 58.5 59.5 62.2 68.8 65.4 55.4 56.4 56.8 0.6Jet fuel 55.3 53.3 54.2 57.8 58.7 61.2 67.9 65.0 55.0 55.8 56.1 0.6Others b 0.8 0.8 0.7 0.7 0.8 1.0 0.9 0.4 0.4 0.6 0.6 8.1
Diesel 275.8 270.7 294.7 302.7 320.1 344.9 358.4 382.0 359.0 371.1 383.6 3.4Pemex Diesel 226.4 228.0 240.7 255.4 273.4 297.9 314.5 332.0 314.5 325.1 330.6 1.7Others 49.4 42.7 54.0 47.3 46.7 46.9 43.9 50.0 44.5 46.0 52.9 15.0
Industrial fuel oil ... - - - - - - - - - - -Fuel oil 474.9 406.2 354.6 332.5 340.6 263.7 256.9 219.6 209.0 184.9 200.6 8.5Asphalts 20.9 21.6 22.2 24.5 26.9 28.8 29.9 32.6 30.7 23.6 24.6 4.4Lubricants 5.5 5.2 5.7 5.7 5.7 5.5 5.7 5.6 4.5 4.7 4.2 - 10.2Paraffines 1.2 1.1 1.0 1.1 1.1 1.0 1.1 1.0 0.8 0.8 0.8 - 9.2Others c 0.4 1.3 22.8 28.4 31.2 31.4 33.1 35.9 38.0 30.0 31.0 3.5
Petrochemicals (Mt) 301.6 235.3 272.3 286.0 289.0 333.8 290.9 278.9 365.4 325.0 292.0 - 10.2
Production
Domestic sales
Production and domestic salesthousand barrels per day
0
500
1000
1500
2000
20112010200920082007200620052004200320022001

39
4.6Domesticsalesofrefinedproductsbyregiona,2011 Thousand barrels per day
Gral. Lázaro Cárdenas refinery
a. Economic Regionalization established by the Presidency of the United Mexican States. b. Includes domestic gas oil.
Total Gasolines Kerosenesb Diesel Fuel oil Others
Total 1 501 800 57 384 201 61Central 390 231 23 74 57 5Central - West 327 187 7 94 22 17Northeastern 284 143 6 93 7 35Southern - Southeastern 323 138 14 65 103 3Northwestern 177 102 6 58 11 -
40
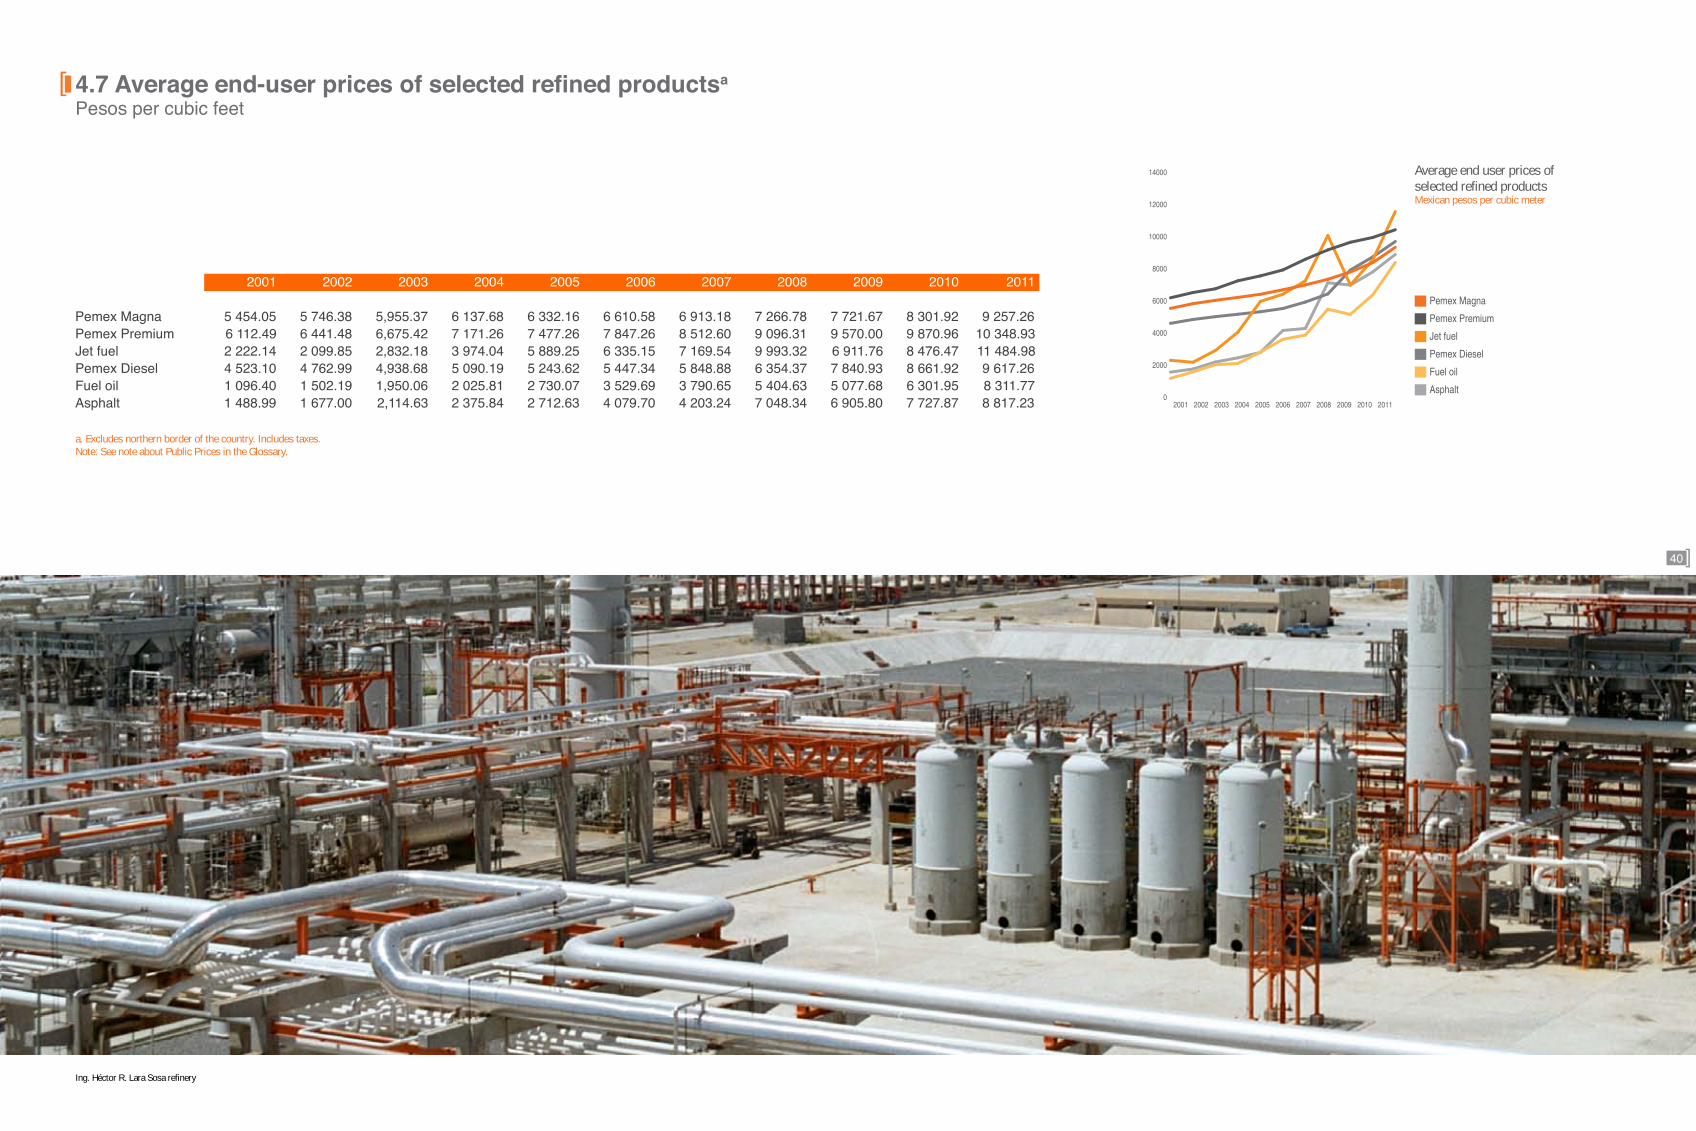
4.7Averageend-userpricesofselectedrefinedproductsa
Pesos per cubic feet
Ing. Héctor R. Lara Sosa refinery
a. Excludes northern border of the country. Includes taxes. Note: See note about Public Prices in the Glossary.
2001 2002 2003 2004 2005 2006 2007 2008 2009 2010 2011
Pemex Magna 5 454.05 5 746.38 5,955.37 6 137.68 6 332.16 6 610.58 6 913.18 7 266.78 7 721.67 8 301.92 9 257.26Pemex Premium 6 112.49 6 441.48 6,675.42 7 171.26 7 477.26 7 847.26 8 512.60 9 096.31 9 570.00 9 870.96 10 348.93Jet fuel 2 222.14 2 099.85 2,832.18 3 974.04 5 889.25 6 335.15 7 169.54 9 993.32 6 911.76 8 476.47 11 484.98Pemex Diesel 4 523.10 4 762.99 4,938.68 5 090.19 5 243.62 5 447.34 5 848.88 6 354.37 7 840.93 8 661.92 9 617.26Fuel oil 1 096.40 1 502.19 1,950.06 2 025.81 2 730.07 3 529.69 3 790.65 5 404.63 5 077.68 6 301.95 8 311.77Asphalt 1 488.99 1 677.00 2,114.63 2 375.84 2 712.63 4 079.70 4 203.24 7 048.34 6 905.80 7 727.87 8 817.23
Pemex Premium
Jet fuel
Pemex Diesel
Fuel oil
Average end user prices ofselected refined productsMexican pesos per cubic meter
Pemex Magna
Asphalt0
2000
4000
6000
8000
10000
12000
14000
20112010200920082007200620052004200320022001

41
4.8 Service stations by state
2001 2002 2003 2004 2005 2006 2007 2008 2009 2010 2011
Total 5 139 5 564 6 166 6 732 7 172 7 554 7 940 8 351 8 803 9 232 9 637
Aguascalientes 51 53 60 70 71 73 75 79 92 98 107Baja California 238 260 295 331 352 363 389 411 426 460 477Baja California Sur 48 54 61 65 76 83 92 99 104 112 127Campeche 31 34 39 40 42 43 43 43 46 51 54Coahuila 198 221 249 260 274 292 310 331 349 359 368Colima 35 45 50 56 60 64 69 74 78 83 89Chiapas 106 115 128 140 152 159 165 171 187 198 212Chihuahua 261 277 330 363 390 411 434 449 460 472 483Distrito Federal 314 309 317 322 328 327 326 330 334 346 353Durango 118 126 143 154 157 164 171 172 172 178 177Guanajuato 261 281 309 334 355 368 380 391 407 429 453Guerrero 107 114 129 140 145 156 163 165 175 177 179Hidalgo 121 139 155 170 180 192 208 216 225 231 240Jalisco 365 377 412 436 462 498 551 586 625 666 702México 371 425 469 518 561 603 637 672 713 748 782Michoacán 236 250 275 301 316 321 330 341 358 371 376Morelos 56 61 76 84 91 96 99 110 114 119 125Nayarit 60 65 70 75 76 82 86 92 101 105 110Nuevo León 340 372 419 461 494 511 517 538 565 596 616Oaxaca 100 104 112 122 137 143 150 160 177 181 188Puebla 215 246 272 289 294 306 318 326 343 357 386Querétaro 87 92 95 106 114 121 126 135 142 149 159Quintana Roo 46 55 60 71 79 86 87 98 116 122 143San Luis Potosí 118 129 142 153 164 172 179 192 212 216 221Sinaloa 171 196 230 265 281 300 319 341 360 376 394Sonora 260 275 295 320 349 376 391 407 424 443 455Tabasco 72 80 90 99 100 104 107 116 124 132 139Tamaulipas 238 265 289 319 337 365 400 434 458 488 497Tlaxcala 50 53 56 60 65 70 73 78 84 88 92Veracruz 268 285 317 359 399 421 447 474 499 529 566Yucatán 89 95 102 116 127 134 142 153 162 173 182Zacatecas 108 111 120 133 144 150 156 167 171 179 185
Service station

85
05Petrochemicals
5.1Installed capacity by complex
5.2Petrochemical production
5.3Production by petrochemical complex
5.4Value of petrochemical domestic sales
5.5Volume of petrochemical domestic sales
5.6Average end-user prices of selected petrochemicals
2011Thousand tons
Production
Domestic sales
Facilities
Number of plants
Number of centers
Installed capacity
Pipelines (km) *
*Includes piping rack.
8 155
2 824
39
8
12 409
742
Morelos Petrochemical Center

43
5.1 Installed capacity by complex Thousand tons
Morelos Petrochemical Center
2001 2002 2003 2004 2005 2006 2007 2008 2009 2010 2011
Total 11 189 11 562 12 497 12 546 12 571 12 571 12 572 12 798 13 061 13 275 12 409Cosoleacaque 4 736 4 998 4 975 4 975 4 975 4 975 4 977 4 977 4 976 4 976 4 306La Cangrejera 2 297 2 427 3 205 3 255 3 280 3 280 3 279 3 280 3 280 3 300 3 300Morelos 2 134 2 107 2 263 2 263 2 263 2 263 2 262 2 262 2 535 2 730 2 730Pajaritos 1 066 1 021 1 021 1 021 1 021 1 021 1 021 1 246 1 246 1 246 1 050Escolín 337 337 337 337 337 337 337 337 337 337 337Camargo 297 333 333 333 333 333 333 333 333 333 333San Martín Texmelucan 260 268 288 288 288 288 287 287 287 287 287Tula 62 71 76 76 76 76 76 76 66 66 66Reynosa - - - - - - - - - - -
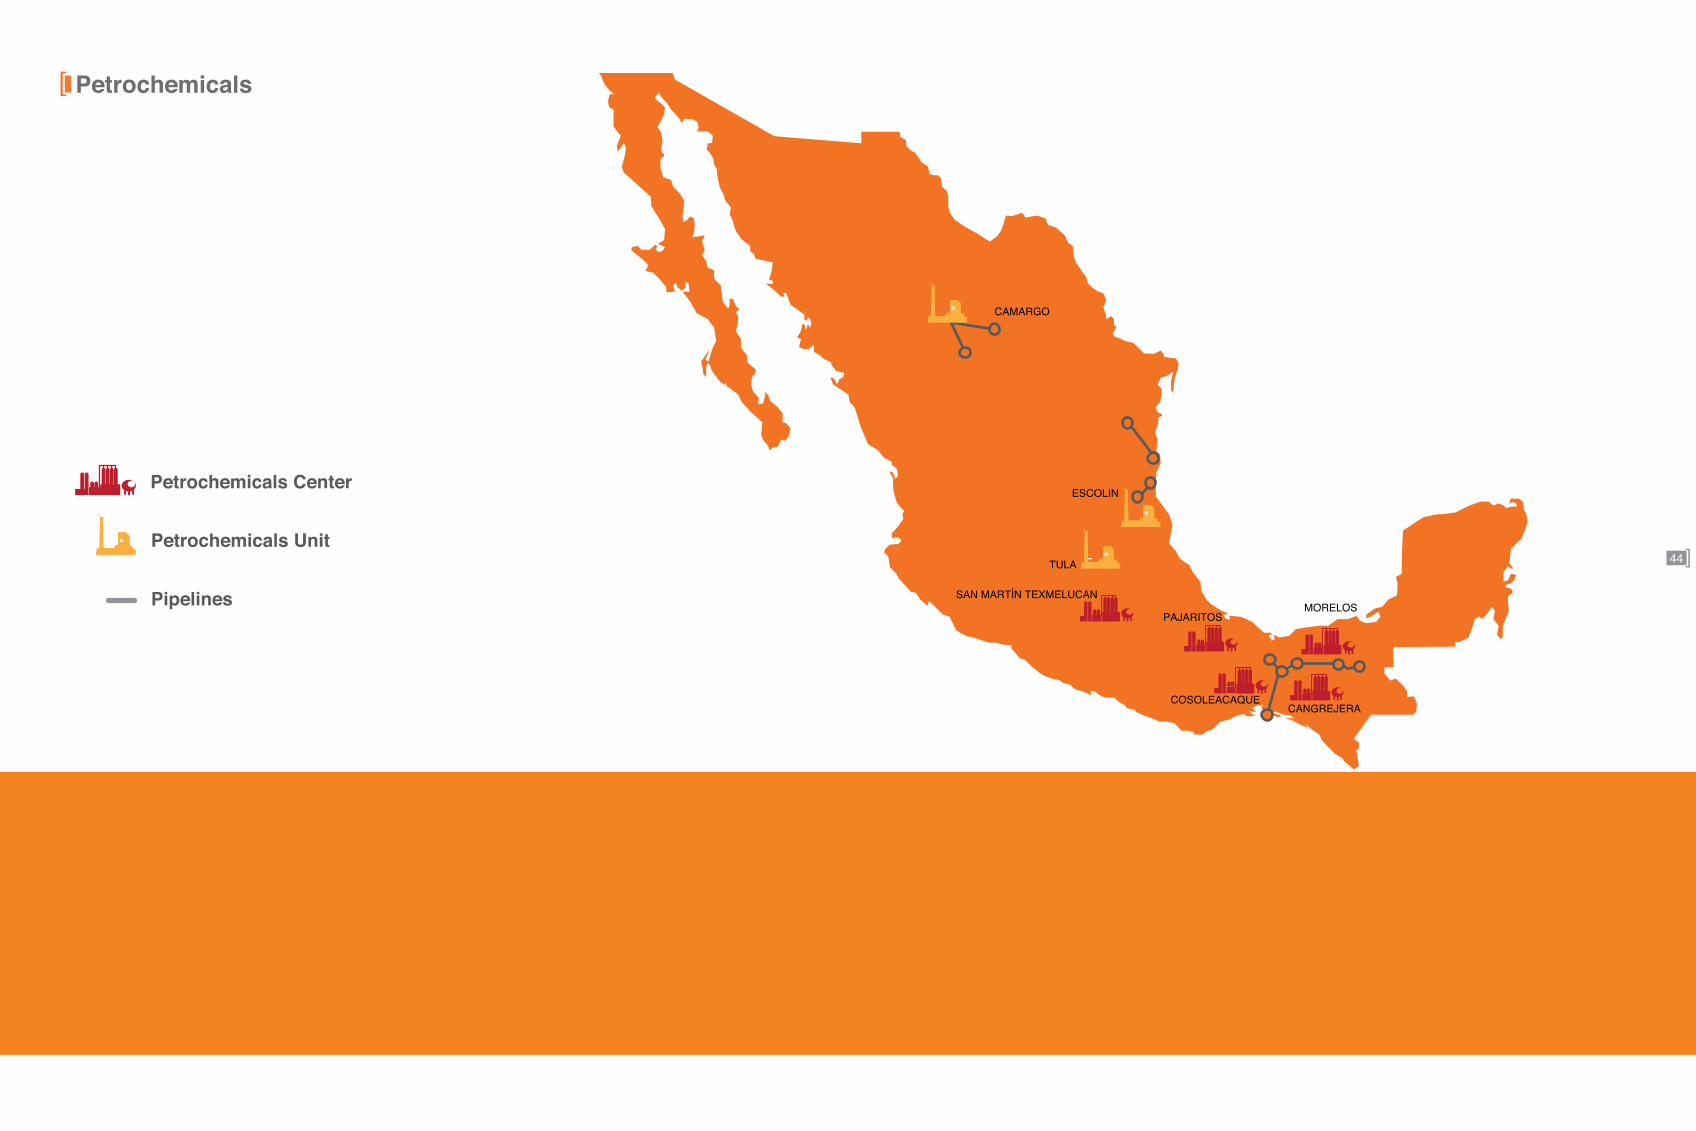
TULA
ESCOLIN
SAN MARTÍN TEXMELUCAN
PAJARITOSMORELOS
CANGREJERACOSOLEACAQUE
CAMARGO
Petrochemicals Unit
Petrochemicals Center
Pipelines
44
Petrochemicals

45
5.2 Petrochemical productionThousand tons
a. Includes additives for motor gasoline, antifreeze compounds, dispersing agents, dewaxers, corrosion inhibitors, surfactants and smoke suppressors. b. Production Stream for Incineration.
Change2011/2010
2001 2002 2003 2004 2005 2006 2007 2008 2009 2010 2011 (%)
Total 5 995 5 889 6 085 6 223 6 219 6 572 7 497 7 841 7 587 8 943 8 155 - 8.8
Methane derivatives 1 752 1 663 1 383 1 668 1 242 1 404 1 859 2 202 1 962 2 282 2 306 1.1Ammonia 707 680 534 681 514 592 760 896 790 899 867 - 3.5Carbonic anhydride 856 814 658 821 647 727 1 087 1 262 1 172 1 367 1 289 - 5.7Methanol 189 169 190 165 81 85 12 44 - 16 151 845.4
Ethane derivatives 2 408 2 309 2 218 2 073 2 440 2 748 2 607 2 604 2 695 2 831 2 750 - 2.8Acetaldehyde 58 51 57 5 - - - - - - - -Vinyl chloride 150 158 113 63 159 209 235 157 155 187 168 - 10.1Dichloroethane 245 253 186 110 260 353 391 267 259 306 275 - 10.3Ethylene 1 063 994 982 1 007 1 085 1 128 1 001 1 062 1 160 1 126 1 124 - 0.1Ethylene glycol 132 119 139 145 150 178 163 193 152 198 168 - 15.2Ethylene oxide 307 302 312 299 321 361 301 344 280 372 355 - 4.8HD Polyethylene 178 147 158 181 169 167 157 170 195 181 174 - 3.9LD Polyethylene 276 284 271 262 296 352 358 412 495 460 486 5.8
Aromatics and derivatives 642 670 795 1 222 1 187 1 089 1 085 1 058 957 1 042 923 - 11.4Heavy aromatics 1 10 5 10 8 9 14 15 9 8 7 - 6.6Aromine 100 40 31 84 140 106 102 120 104 37 41 40 - 1.2Benzene 94 107 114 136 160 135 118 101 79 118 118 0.2Styrene 124 128 101 162 142 139 134 120 91 65 128 96.5Ethylbenzene 140 140 114 179 155 156 149 136 105 77 144 86.9Fluxoil 5 3 4 4 5 4 4 3 4 2 3 17.9Orthoxylene - - 10 28 35 27 29 19 - - - -Paraxylene - - 55 201 220 185 187 112 - - - -Toluene 152 183 235 214 253 203 175 153 139 188 159 - 15.6Xylenes 86 68 73 31 35 28 30 46 60 100 93 - 7.4High octane hydrocarbon - - - 116 69 100 124 249 433 444 232 - 47.8
Propylene and derivatives 127 115 125 116 104 24 47 17 31 84 62 - 26.7Acetonitrile ... 3 5 3 3 - 1 - 1 2 2 - 6.5Hydrocyanic acid 3 6 7 7 6 - 3 - 1 6 4 - 29.5Acrylonitrile 32 61 77 72 63 - 24 - 12 55 39 - 29.5Polypropylene 2 - - - - - - - - - - -Propylene 89 45 36 34 32 24 20 17 17 21 17 - 20.2
Others 1 059 1 115 1 540 1 103 1 216 1 283 1 452 1 480 1 551 2 094 1 662 - 20.6Hydrochloric acid 87 92 66 38 93 126 141 93 92 109 98 - 10.1Muriatic acid 31 24 14 11 16 44 50 49 37 34 16 - 53.8Raw butane 36 35 36 41 46 44 35 33 37 35 35 0.0Petrochemical specialities a 11 11 10 10 13 14 11 11 11 10 9 - 10.0Heptane 13 8 18 11 15 14 13 23 20 20 19 - 4.7Hexane 62 57 70 66 66 53 56 54 46 51 45 - 12.2Hydrogen - - 167 162 184 167 161 148 110 159 128 - 19.6Nitrogen 96 109 106 112 118 117 106 135 149 167 165 - 1.2Oxygen 380 376 399 418 433 447 410 455 445 460 447 - 2.7Pentanes - - - - - - 112 89 139 316 189 - 40.3Petrochemical polymer ... - - - - - - - - - - -Heavy reformate 337 357 413 - - - - - - - - -CPDI b - - - - - - - - - 30 18 - 40.6Others 5 47 242 236 232 257 357 389 466 704 494 -29.7
Refined products 7 18 24 42 30 24 447 480 391 610 451 - 26.0Gasnaphtha 6 18 24 42 30 24 - 38 29 27 29 4.4Heavy naphtha - - - - - - 194 147 86 99 60 -39.5Octane basis gasoline - - - - - - - - 89 356 264 - 25.9Amorphous gasoline - - - - - - 253 296 186 127 98 - 22.4
Methane derivatives 28.3 %
Ethane derivatives 33.8 %
Aromatics and derivatives 15.8 %
Propylene and derivatives 0.8 %
Petrochemical production, 2011
Others 21.3 %

5.3 Production by petrochemical complex Thousand tons
Morelos Petrochemical Center
46
a. Camargo unit are shut down since 2003.
Change2011/2010
2001 2002 2003 2004 2005 2006 2007 2008 2009 2010 2011 (%)
Total 5 994 5 889 6 085 6 223 6 219 6 572 7 497 7 841 7 587 8 943 8 155 -8.8La Cangrejera 1 936 2 088 2 549 2 747 2 817 2 698 3 239 3 207 3 192 3 934 3 364 -14.5Cosoleacaque 1 468 1 433 1 192 1 503 1 161 1 319 1 748 2 059 1 871 2 122 2 028 -4.4Morelos 1 447 1 319 1 551 1 470 1 533 1 553 1 482 1 824 1 833 2 111 1 919 -9.1Pajaritos 699 675 503 222 529 865 966 697 680 751 685 -8.8San Martín Texmelucan 200 180 200 175 94 99 23 55 11 26 159 523.7Camargo a 95 61 - - - - - - - - - -Tula 36 56 57 63 58 - 27 - - - - -Escolín 112 78 32 43 28 38 10 - - - - -
31
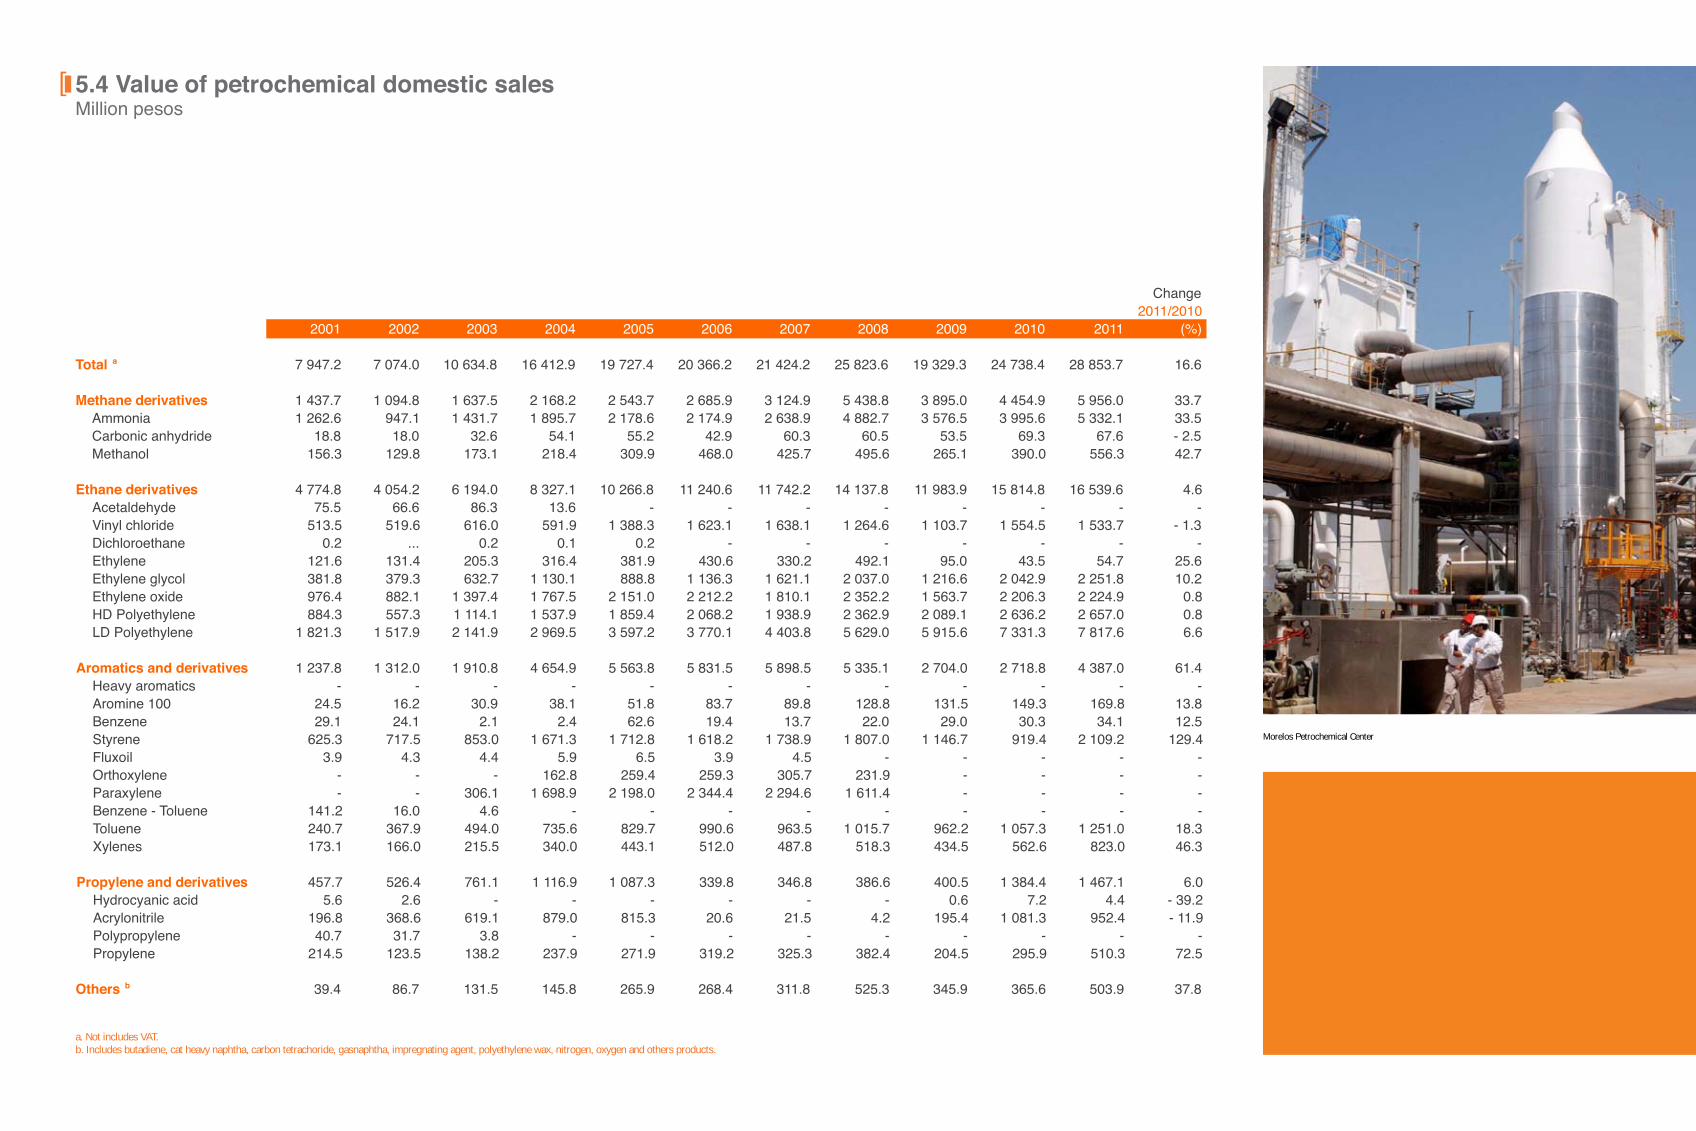
5.4 Value of petrochemical domestic sales Million pesos
Morelos Petrochemical Center
a. Not includes VAT. b. Includes butadiene, cat heavy naphtha, carbon tetrachoride, gasnaphtha, impregnating agent, polyethylene wax, nitrogen, oxygen and others products.
Change2011/2010
2001 2002 2003 2004 2005 2006 2007 2008 2009 2010 2011 (%)
Total a 7 947.2 7 074.0 10 634.8 16 412.9 19 727.4 20 366.2 21 424.2 25 823.6 19 329.3 24 738.4 28 853.7 16.6
Methane derivatives 1 437.7 1 094.8 1 637.5 2 168.2 2 543.7 2 685.9 3 124.9 5 438.8 3 895.0 4 454.9 5 956.0 33.7Ammonia 1 262.6 947.1 1 431.7 1 895.7 2 178.6 2 174.9 2 638.9 4 882.7 3 576.5 3 995.6 5 332.1 33.5Carbonic anhydride 18.8 18.0 32.6 54.1 55.2 42.9 60.3 60.5 53.5 69.3 67.6 - 2.5Methanol 156.3 129.8 173.1 218.4 309.9 468.0 425.7 495.6 265.1 390.0 556.3 42.7
Ethane derivatives 4 774.8 4 054.2 6 194.0 8 327.1 10 266.8 11 240.6 11 742.2 14 137.8 11 983.9 15 814.8 16 539.6 4.6Acetaldehyde 75.5 66.6 86.3 13.6 - - - - - - - -Vinyl chloride 513.5 519.6 616.0 591.9 1 388.3 1 623.1 1 638.1 1 264.6 1 103.7 1 554.5 1 533.7 - 1.3Dichloroethane 0.2 ... 0.2 0.1 0.2 - - - - - - -Ethylene 121.6 131.4 205.3 316.4 381.9 430.6 330.2 492.1 95.0 43.5 54.7 25.6Ethylene glycol 381.8 379.3 632.7 1 130.1 888.8 1 136.3 1 621.1 2 037.0 1 216.6 2 042.9 2 251.8 10.2Ethylene oxide 976.4 882.1 1 397.4 1 767.5 2 151.0 2 212.2 1 810.1 2 352.2 1 563.7 2 206.3 2 224.9 0.8HD Polyethylene 884.3 557.3 1 114.1 1 537.9 1 859.4 2 068.2 1 938.9 2 362.9 2 089.1 2 636.2 2 657.0 0.8LD Polyethylene 1 821.3 1 517.9 2 141.9 2 969.5 3 597.2 3 770.1 4 403.8 5 629.0 5 915.6 7 331.3 7 817.6 6.6
Aromatics and derivatives 1 237.8 1 312.0 1 910.8 4 654.9 5 563.8 5 831.5 5 898.5 5 335.1 2 704.0 2 718.8 4 387.0 61.4Heavy aromatics - - - - - - - - - - - -Aromine 100 24.5 16.2 30.9 38.1 51.8 83.7 89.8 128.8 131.5 149.3 169.8 13.8Benzene 29.1 24.1 2.1 2.4 62.6 19.4 13.7 22.0 29.0 30.3 34.1 12.5Styrene 625.3 717.5 853.0 1 671.3 1 712.8 1 618.2 1 738.9 1 807.0 1 146.7 919.4 2 109.2 129.4Fluxoil 3.9 4.3 4.4 5.9 6.5 3.9 4.5 - - - - -Orthoxylene - - - 162.8 259.4 259.3 305.7 231.9 - - - -Paraxylene - - 306.1 1 698.9 2 198.0 2 344.4 2 294.6 1 611.4 - - - -Benzene - Toluene 141.2 16.0 4.6 - - - - - - - - -Toluene 240.7 367.9 494.0 735.6 829.7 990.6 963.5 1 015.7 962.2 1 057.3 1 251.0 18.3Xylenes 173.1 166.0 215.5 340.0 443.1 512.0 487.8 518.3 434.5 562.6 823.0 46.3
Propylene and derivatives 457.7 526.4 761.1 1 116.9 1 087.3 339.8 346.8 386.6 400.5 1 384.4 1 467.1 6.0Hydrocyanic acid 5.6 2.6 - - - - - - 0.6 7.2 4.4 - 39.2Acrylonitrile 196.8 368.6 619.1 879.0 815.3 20.6 21.5 4.2 195.4 1 081.3 952.4 - 11.9Polypropylene 40.7 31.7 3.8 - - - - - - - - -Propylene 214.5 123.5 138.2 237.9 271.9 319.2 325.3 382.4 204.5 295.9 510.3 72.5
Others b 39.4 86.7 131.5 145.8 265.9 268.4 311.8 525.3 345.9 365.6 503.9 37.8

48
5.5 Volume of petrochemical domestic sales Thousand tons
a. Includes butadiene, cat heavy naphtha, carbon tetrachoride, gas naphtha, impregnating agent, polyethylene wax, nitrogen, oxygen and others products.
Change2011/2010
2001 2002 2003 2004 2005 2006 2007 2008 2009 2010 2011 (%)
Total 2 323 2 199 2 115 2 351 2 480 2 488 2 684 2 784 2 695 2 811 2 824 0.5
Methane derivatives 958 856 732 813 838 839 1 023 1 197 1 237 1 234 1 256 1.8Ammonia 752 644 541 584 587 600 714 826 895 825 833 0.9Carbonic anhydride 126 147 132 163 161 131 223 288 270 325 309 - 4.9Methanol 80 65 59 67 90 108 86 83 73 84 114 36.2
Ethane derivatives 916 902 916 881 952 1 066 1 076 1 092 1 108 1 204 1 172 - 2.7Acetaldehyde 22 23 21 3 - - - - - - - -Vinyl chloride 148 150 125 82 177 214 231 161 163 185 170 - 8.2Dichloroethane ... ... ... ... ... - - - - - - -Ethylene 23 35 37 45 43 39 32 36 10 3 4 12.0Ethylene glycol 103 112 111 128 103 141 169 191 152 197 167 - 15.0Ethylene oxide 214 219 220 200 222 243 196 212 181 235 241 2.7HD Polyethylene 139 103 149 162 150 153 146 153 168 175 162 - 7.2LD Polyethylene 266 259 254 260 258 276 302 339 433 409 427 4.5
Aromatics and derivatives 309 304 330 521 558 489 476 389 248 208 265 27.7Heavy aromatics - - - - - - - - - - - -Aromine 100 7 5 6 5 6 8 8 10 12 12 10 - 16.0Benzene 9 7 ... ... 8 2 1 2 3 2 2 - 1.8Styrene 125 126 114 141 136 122 124 117 99 57 121 111.0Fluxoil 4 4 3 4 4 1 1 - - - - -Orthoxylene - - - 21 31 26 28 19 - - - -Paraxylene - - 51 201 221 183 184 113 - - - -Benzene - Toluene 40 5 1 - - - - - - - - -Toluene 75 109 107 101 100 99 86 85 93 89 81 - 8.8Xylenes 50 49 47 47 53 49 44 43 41 47 51 8.5
Propylene and derivatives 107 96 100 106 83 30 30 25 37 78 70 - 10.8Hydrocyanic acid 3 2 - - - - - - 1 6 4 - 29.4Acrylonitrile 37 57 72 75 57 1 1 0 11 54 39 - 27.5Polypropylene 7 5 ... - - - - - -Propylene 61 32 27 31 26 29 29 25 25 18 26 43.9
Others a 34 41 37 30 48 64 79 81 65 87 61 - 30.0
Methane derivatives 44.5 %
Ethane derivatives 41.5 %
Aromatics and derivatives 9.4 %
Propylene and derivatives 2.5 %
Volume porcent participation ofpetrochemical domestic sales, 2011
Others 2.2 %
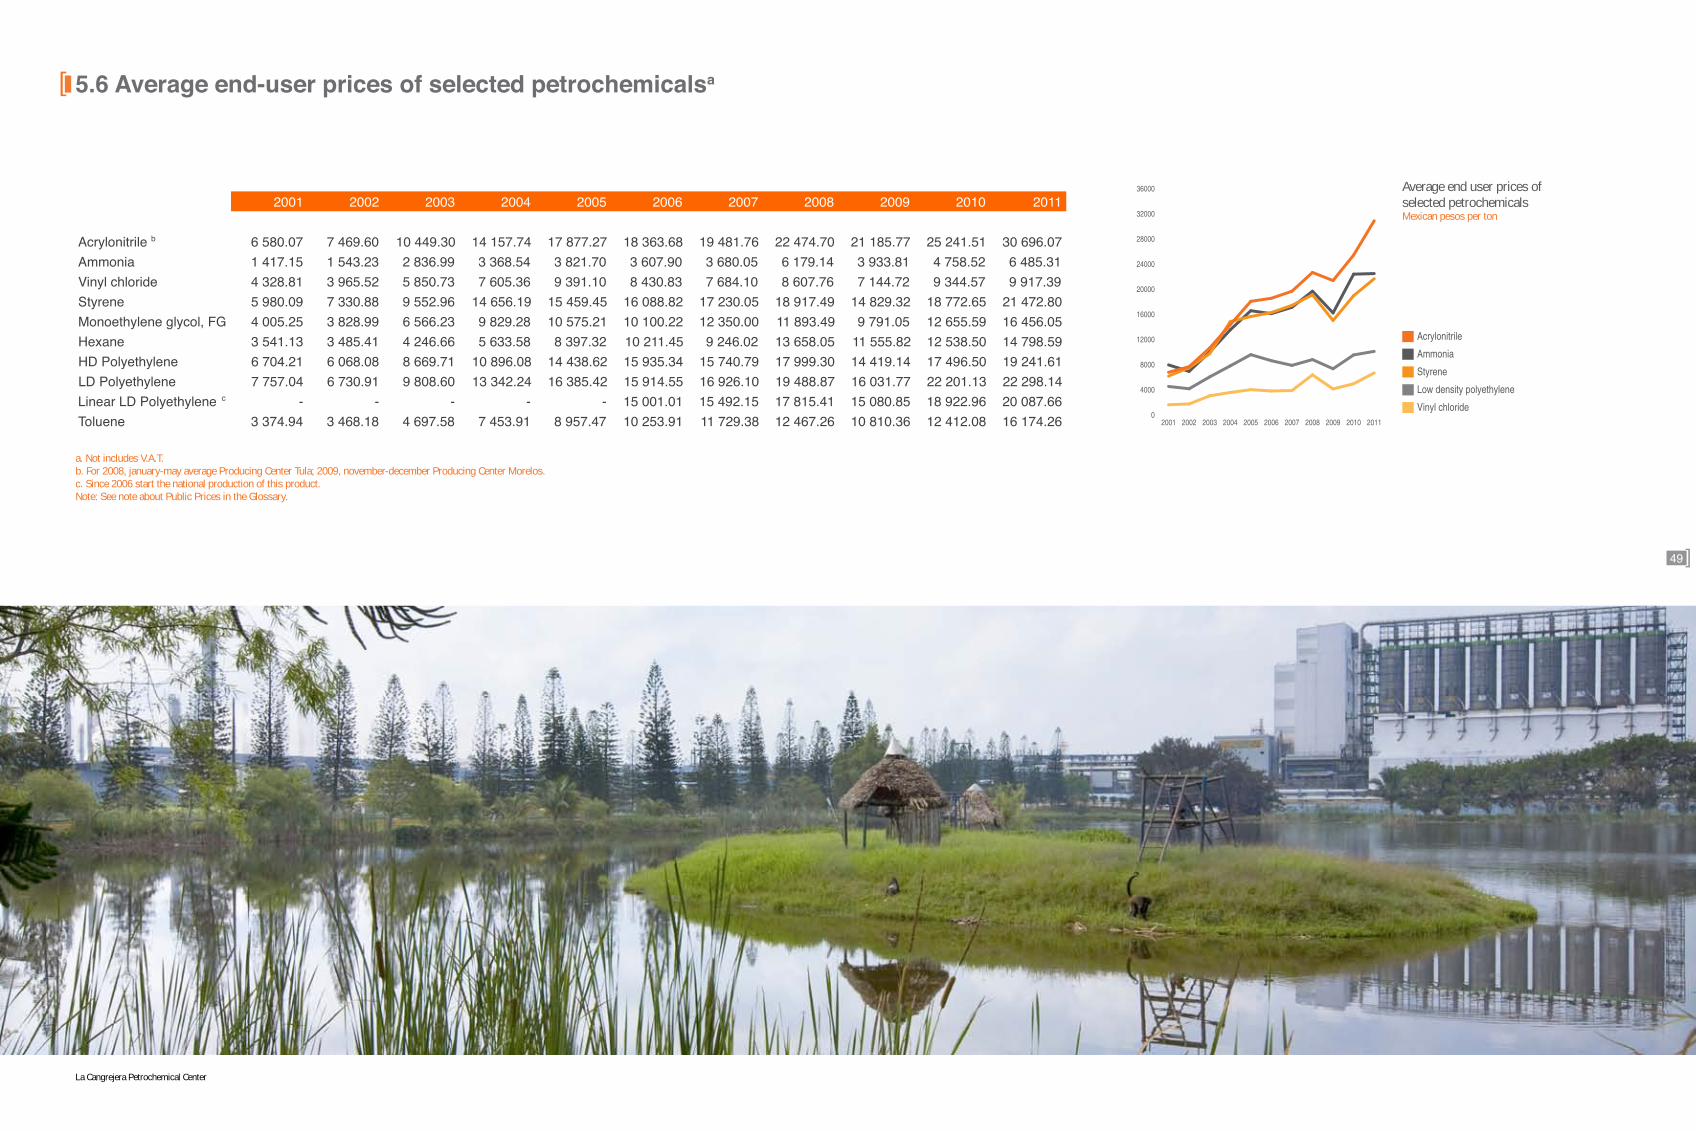
49
5.6Averageend-userpricesofselectedpetrochemicalsa
La Cangrejera Petrochemical Center
a. Not includes V.A.T. b. For 2008, january-may average Producing Center Tula; 2009, november-december Producing Center Morelos. c. Since 2006 start the national production of this product. Note: See note about Public Prices in the Glossary.
2001 2002 2003 2004 2005 2006 2007 2008 2009 2010 2011
Acrylonitrile b 6 580.07 7 469.60 10 449.30 14 157.74 17 877.27 18 363.68 19 481.76 22 474.70 21 185.77 25 241.51 30 696.07Ammonia 1 417.15 1 543.23 2 836.99 3 368.54 3 821.70 3 607.90 3 680.05 6 179.14 3 933.81 4 758.52 6 485.31Vinyl chloride 4 328.81 3 965.52 5 850.73 7 605.36 9 391.10 8 430.83 7 684.10 8 607.76 7 144.72 9 344.57 9 917.39Styrene 5 980.09 7 330.88 9 552.96 14 656.19 15 459.45 16 088.82 17 230.05 18 917.49 14 829.32 18 772.65 21 472.80Monoethylene glycol, FG 4 005.25 3 828.99 6 566.23 9 829.28 10 575.21 10 100.22 12 350.00 11 893.49 9 791.05 12 655.59 16 456.05Hexane 3 541.13 3 485.41 4 246.66 5 633.58 8 397.32 10 211.45 9 246.02 13 658.05 11 555.82 12 538.50 14 798.59HD Polyethylene 6 704.21 6 068.08 8 669.71 10 896.08 14 438.62 15 935.34 15 740.79 17 999.30 14 419.14 17 496.50 19 241.61LD Polyethylene 7 757.04 6 730.91 9 808.60 13 342.24 16 385.42 15 914.55 16 926.10 19 488.87 16 031.77 22 201.13 22 298.14Linear LD Polyethylene c - - - - - 15 001.01 15 492.15 17 815.41 15 080.85 18 922.96 20 087.66Toluene 3 374.94 3 468.18 4 697.58 7 453.91 8 957.47 10 253.91 11 729.38 12 467.26 10 810.36 12 412.08 16 174.26 0
4000
8000
12000
16000
20000
24000
28000
32000
36000
20112010200920082007200620052004200320022001
Ammonia
Styrene
Low density polyethylene
Vinyl chloride
Average end user prices ofselected petrochemicalsMexican pesos per ton
Acrylonitrile
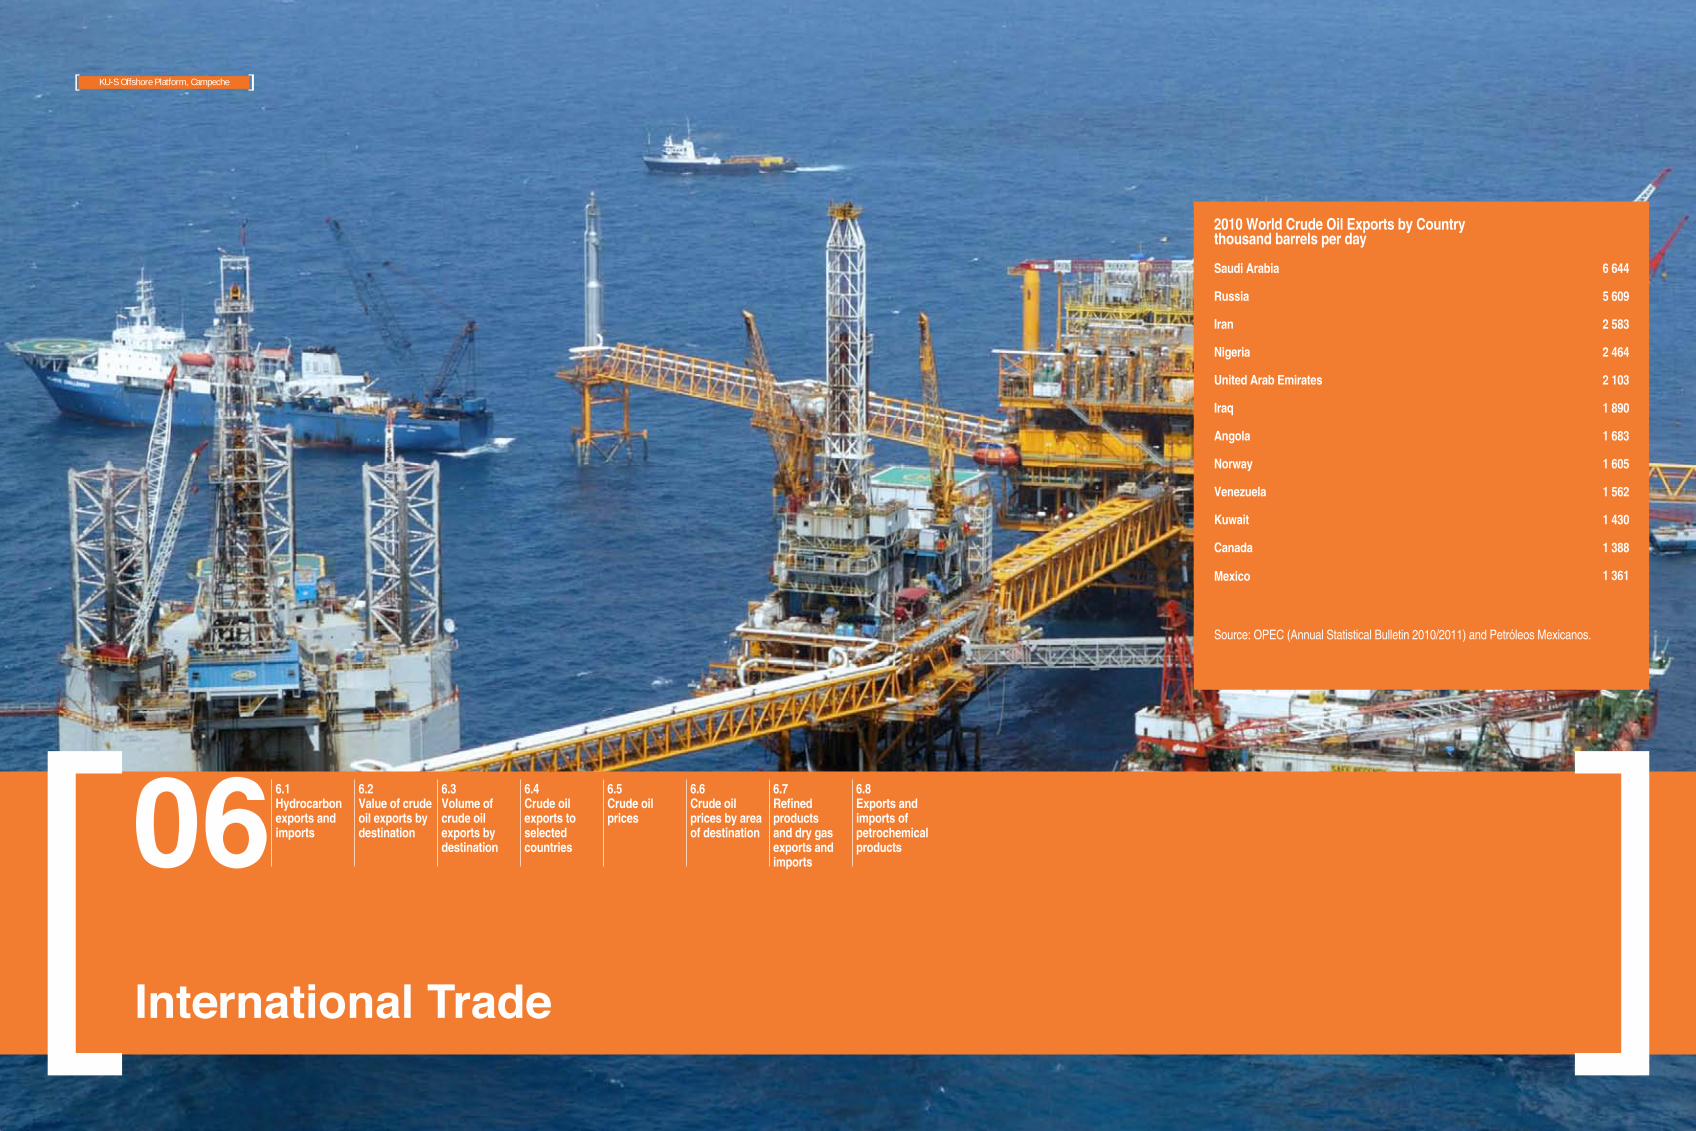
101
06International Trade
6.1Hydrocarbon exports and imports
6.2Value of crude oil exports by destination
6.3Volume of crude oil exports by destination
6.4Crude oil exports to selected countries
6.5Crude oil prices
6.6Crude oil prices by area of destination
6.7Refined products and dry gas exports and imports
6.8Exports and imports of petrochemical products
2010 World Crude Oil Exports by Country thousand barrels per day
Saudi Arabia
Russia
Iran
Nigeria
United Arab Emirates
Iraq
Angola
Norway
Venezuela
Kuwait
Canada
Mexico
Source: OPEC (Annual Statistical Bulletin 2010/2011) and Petróleos Mexicanos.
6 644
5 609
2 583
2 464
2 103
1 890
1 683
1 605
1 562
1 430
1 388
1 361
KU-S Offshore Platform, Campeche

51
6.1 Hydrocarbon exports and imports
FPSO Yuum K´Ak´ Naa´B, (The Lord of the sea), Campeche
a. Excludes the volume of imported products under processing agreements.
Change2011/2010
2001 2002 2003 2004 2005 2006 2007 2008 2009 2010 2011 (%)
million of U. S. dollars
Net exports 8 836.1 11 374.7 14 444.1 17 856.4 22 339.1 27 380.3 25 643.5 26 069.2 16 404.9 19 577.1 24 995.8 27.7
Exports 12 944.7 14 691.1 18 437.9 23 421.6 31 702.6 38 671.9 42 581.6 49 543.3 30 513.6 41 025.8 55 796.3 36.0Crude oil 11 927.7 13 392.2 16 676.3 21 257.9 28 329.4 34 706.8 37 937.5 43 341.5 25 605.4 35 985.4 49 322.3 37.1
Olmeca 2 775.7 2 222.9 2 307.7 3 187.9 4 246.2 5 443.4 4 469.1 4 712.2 3 444.8 6 149.1 8 132.6 32.3Istmo 705.9 392.5 255.4 380.9 1 569.6 1 427.9 1 049.9 683.1 327.4 2 148.9 3 849.9 79.2Maya 8 446.1 10 776.8 14 113.2 17 689.2 22 513.5 27 835.4 32 418.5 37 946.3 21 833.2 27 687.3 37 339.8 34.9
Condensates - - 1.6 17.8 40.4 23.7 - - - - 23.9 -Dry gas 47.8 4.0 - - 78.9 71.8 350.5 316.3 103.5 31.9 1.6 - 95.1Refined products 856.3 1 182.0 1 612.3 1 929.2 2 951.0 3 570.8 4 051.5 5 536.8 4 657.4 4 764.0 6 188.4 29.9Petrochemicals 112.9 112.9 147.6 216.7 302.9 298.7 242.1 348.6 147.3 244.6 260.2 6.4
Imports 4 108.5 3 316.5 3 993.8 5 565.2 9 363.5 11 291.6 16 938.2 23 474.1 14 108.7 21 448.8 30 800.6 43.6Dry gas 423.8 775.4 1 526.2 1 715.1 1 397.9 1 134.5 995.7 1 423.6 632.8 939.2 1 272.2 35.5Refined products 3 656.2 2 495.2 2 423.3 3 791.6 7 858.7 10 028.8 15 797.5 21 892.8 13 307.8 20 335.4 29 403.6 44.6Petrochemicals 28.6 45.9 44.3 58.4 106.8 128.2 145.0 157.7 168.1 174.2 124.7 - 28.4
thousand barrels per day
ExportsCrude oil 1 755.7 1 705.1 1 843.9 1 870.3 1 817.1 1 792.7 1 686.2 1 403.4 1 222.1 1 360.5 1 337.9 - 1.7
Olmeca 317.4 244.8 215.6 221.4 215.8 230.6 172.7 129.6 143.5 211.7 202.9 - 4.2Istmo 86.8 45.8 24.9 27.4 81.0 68.3 41.1 23.0 14.2 74.9 99.3 32.6Maya 1 351.4 1 414.5 1 603.4 1 621.6 1 520.3 1 493.8 1 472.3 1 250.8 1 064.5 1 074.0 1 035.7 - 3.6
Condensates - - 0.2 1.5 2.2 1.1 - - - - 0.7 -Dry gas (MMcfd) 24.9 4.4 - - 23.9 32.7 138.7 107.4 66.5 19.3 1.3 - 93.2Refined products 103.7 155.9 177.0 151.5 184.9 186.9 179.7 192.0 243.4 192.8 184.0 - 4.5Petrochemicals (Mt) 780.4 831.8 812.9 914.3 867.2 817.5 692.6 586.6 741.3 676.5 458.0 - 32.3
ImportsDry gas (MMcfd) 292.2 592.5 756.9 765.6 480.4 450.9 385.6 447.1 422.0 535.8 790.8 47.6Refined products a 335.3 243.6 199.9 234.2 333.7 368.9 494.6 552.5 519.2 627.3 678.2 8.1Petrochemicals (Mt) 128.1 197.4 94.7 104.7 238.6 253.8 270.0 249.8 388.2 268.2 101.3 - 62.2
Balance of Trademillion of U.S. dollars
Imports
Exports
Cumulative exports0
10000
20000
30000
40000
50000
60000
20112010200920082007200620052004200320022001

52
6.2 Value of crude oil exports by destination Million of U. S. dollars
Dos Bocas Maritime Terminal
Change2011/2010
2001 2002 2003 2004 2005 2006 2007 2008 2009 2010 2011 (%)
Total 11 927.7 13 392.2 16 676.3 21 257.9 28 329.4 34 706.8 37 937.5 43 341.5 25 605.4 35 985.4 49 322.3 37.1America 10 383.8 11 626.4 14 621.7 19 002.5 24 856.4 30 958.8 33 236.1 38 186.8 22 435.9 31 100.5 41 750.9 34.2
United States 8 977.3 10 584.2 13 106.0 17 032.3 22 224.6 28 025.9 30 126.2 35 455.7 21 712.9 30 034.9 40 293.8 34.2Others 1 406.4 1 042.2 1 515.7 1 970.3 2 631.9 2 933.0 3 109.8 2 731.1 723.0 1 065.6 1 457.1 36.7
Europe 1 234.6 1 400.4 1 494.7 1 886.5 2 969.2 3 174.0 3 858.4 4 318.6 2 400.5 3 408.6 4 852.8 42.4Far East 266.9 365.5 547.9 368.9 486.7 573.9 843.0 836.1 769.1 1 476.3 2 718.6 84.1Africa 42.5 - 12.0 - 17.1 - - - - - - -
Olmeca 2 775.7 2 222.9 2 307.7 3 187.9 4 246.2 5 443.4 4 469.1 4 712.2 3 444.8 6 149.1 8 132.6 32.3America 2 775.7 2 222.9 2 307.7 3 187.9 4 246.2 5 443.4 4 469.1 4 712.2 3 444.8 6 149.1 8 132.6 32.3
United States 2 522.2 2 040.5 2 025.9 2 928.1 3 850.1 5 033.0 4 140.7 4 213.4 3 265.2 5 792.1 7 688.9 32.7Others 253.5 182.4 281.8 259.8 396.1 410.4 328.4 498.8 179.7 357.0 443.7 24.3
Istmo 705.9 392.5 255.4 380.9 1 569.6 1 427.9 1 049.9 683.1 327.4 2 148.9 3 849.9 79.2America 548.5 271.7 165.7 274.0 1 033.6 1 311.2 868.0 492.5 197.8 1 566.9 3 249.9 107.4
United States 360.9 184.3 83.0 73.3 579.3 665.3 197.5 150.5 58.2 1 349.0 2 877.1 113.3Others 187.6 87.3 82.7 200.8 454.3 645.9 670.6 342.0 139.7 217.9 372.9 71.1
Europe 85.0 69.5 23.3 106.8 515.4 116.7 181.8 190.6 129.6 513.4 343.9 - 33.0Far East 72.4 51.3 66.4 - 20.6 - - - - 68.6 256.1 273.1Africa - - - - - - - - - - - -
Maya 8 446.1 10 776.8 14 113.2 17 689.2 22 513.5 27 835.4 32 418.5 37 946.3 21 833.2 27 687.3 37 339.8 34.9America 7 059.6 9 131.8 12 148.3 15 540.6 19 576.6 24 204.2 27 899.0 32 982.2 18 793.2 23 384.5 30 368.4 29.9
United States 6 094.3 8 359.3 10 997.2 14 030.9 17 795.2 22 327.6 25 788.1 31 091.9 18 389.5 22 893.7 29 727.8 29.9Others 965.3 772.5 1 151.2 1 509.7 1 781.4 1 876.7 2 110.9 1 890.3 403.7 490.7 640.5 30.5
Europe 1 149.6 1 330.9 1 471.4 1 779.6 2 453.7 3 057.3 3 676.5 4 128.1 2 270.9 2 895.2 4 508.9 55.7Far East 194.4 314.2 481.5 368.9 466.1 573.9 843.0 836.1 769.1 1 407.7 2 462.5 74.9Africa 42.5 - 12.0 - 17.1 - - - - - - -

53
6.3 Volume of crude oil exports by destination Thousand barrels per day
Change 2011/2010
2001 2002 2003 2004 2005 2006 2007 2008 2009 2010 2011 (%)
Total 1 755.7 1 705.1 1 843.9 1 870.3 1 817.1 1 792.7 1 686.2 1 403.4 1 222.1 1 360.5 1 337.9 - 1.7America 1 527.9 1 477.5 1 603.8 1 655.6 1 589.1 1 589.9 1 487.6 1 223.1 1 083.5 1 178.7 1 133.3 - 3.8
United States 1 321.7 1 338.6 1 437.5 1 482.0 1 424.7 1 441.9 1 351.5 1 142.9 1 049.0 1 139.5 1 095.0 - 3.9Others 206.1 138.9 166.3 173.6 164.4 148.0 136.1 80.2 34.5 39.2 38.3 - 2.3
Europe 183.9 181.0 175.7 178.4 193.9 170.8 163.3 145.3 104.1 127.6 130.8 2.6Far East 37.5 46.7 63.2 36.3 32.8 32.0 35.2 34.9 34.5 54.3 73.7 35.9Africa 6.4 - 1.2 - 1.4 - - - - - - -
Olmeca 317.4 244.8 215.6 221.4 215.8 230.6 172.7 129.6 143.5 211.7 202.9 - 4.2America 317.4 244.8 215.6 221.4 215.8 230.6 172.7 129.6 143.5 211.7 202.9 - 4.2
United States 288.5 224.7 189.5 202.4 195.9 213.6 160.1 115.2 136.2 199.6 192.2 - 3.7Others 28.9 20.2 26.1 19.0 19.9 17.0 12.6 14.3 7.3 12.1 10.7 - 12.0
Istmo 86.8 45.8 24.9 27.4 81.0 68.3 41.1 23.0 14.2 74.9 99.3 32.6America 67.9 31.8 16.0 19.0 52.5 62.7 35.0 15.5 8.7 54.5 84.3 54.9
United States 45.2 21.5 8.0 5.5 29.4 31.6 7.6 5.6 2.1 46.6 74.6 59.9Others 22.6 10.4 7.9 13.5 23.0 31.1 27.4 9.9 6.5 7.8 9.8 24.9
Europe 10.2 8.0 2.4 8.3 27.2 5.6 6.1 7.5 5.5 18.1 8.5 - 52.8Far East 8.7 5.9 6.6 - 1.2 - - - - 2.3 6.4 176.1Africa - - - - - - - - - - - -
Maya 1 351.4 1 414.5 1 603.4 1 621.6 1 520.3 1 493.8 1 472.3 1 250.8 1 064.5 1 074.0 1 035.7 - 3.6America 1 142.6 1 200.8 1 372.2 1 415.2 1 320.8 1 296.6 1 279.9 1 078.1 931.3 912.5 846.2 - 7.3
United States 988.0 1 092.4 1 239.9 1 274.0 1 199.3 1 196.7 1 183.8 1 022.1 910.6 893.3 828.3 - 7.3Others 154.7 108.4 132.3 141.1 121.5 99.9 96.1 56.0 20.7 19.2 17.9 - 7.2
Europe 173.6 172.9 173.4 170.1 166.6 165.2 157.2 137.8 98.7 109.5 122.3 11.7Far East 28.7 40.7 56.6 36.3 31.5 32.0 35.2 34.9 34.5 51.9 67.3 29.6Africa 6.4 - 1.2 - 1.4 - - - - - - -
Maya
Olmeca
Istmo
Crude oil exportsthousand barrels per day
0
500
1000
1500
2000
20112010200920082007200620052004200320022001

109
6.4 Crude oil exports to selected countriesa
Thousand barrels per day
Ing. Antonio M. Amor refinery
a. Excludes temporary crude oil exports for abroad processing.
Change2011/2010
2001 2002 2003 2004 2005 2006 2007 2008 2009 2010 2011 (%)
Total 1 755.7 1 705.1 1 843.9 1 870.3 1 817.1 1 792.7 1 686.2 1 403.4 1 222.1 1 360.5 1 337.9 - 1.7United States 1 321.7 1 338.6 1 437.5 1 482.0 1 424.7 1 441.9 1 351.5 1 142.9 1 049.0 1 139.5 1 095.0 - 3.9Spain 147.0 140.8 143.4 149.5 160.8 144.3 125.1 122.9 93.1 115.6 110.8 - 4.1India 20.8 36.7 52.5 36.3 32.8 32.0 35.2 34.9 34.5 27.8 37.1 33.4China - - - - - - - - - 26.4 36.6 38.5Canada 27.6 19.9 29.3 28.1 38.2 36.3 30.6 26.0 22.4 23.9 20.5 - 14.5San Jose Agreement 44.6 27.2 32.1 29.0 30.5 36.7 35.5 20.4 9.4 15.3 17.8 16.9Portugal 15.2 15.4 15.0 12.5 17.7 12.5 10.0 2.5 - 5.2 5.4 3.7Netherlands - 2.7 - - - 1.9 14.4 8.8 10.6 3.7 7.4 100.9Netherlands Antilles 133.9 91.8 104.9 116.5 95.8 75.0 70.0 33.8 2.7 - - -Israel 3.6 4.8 4.8 3.6 4.4 3.6 3.6 4.8 0.5 - - -England 14.6 15.7 12.5 12.2 10.9 7.8 10.1 5.0 - - - -Others 26.7 11.4 11.9 0.7 1.4 0.6 - 1.4 - 3.1 7.2 130.2
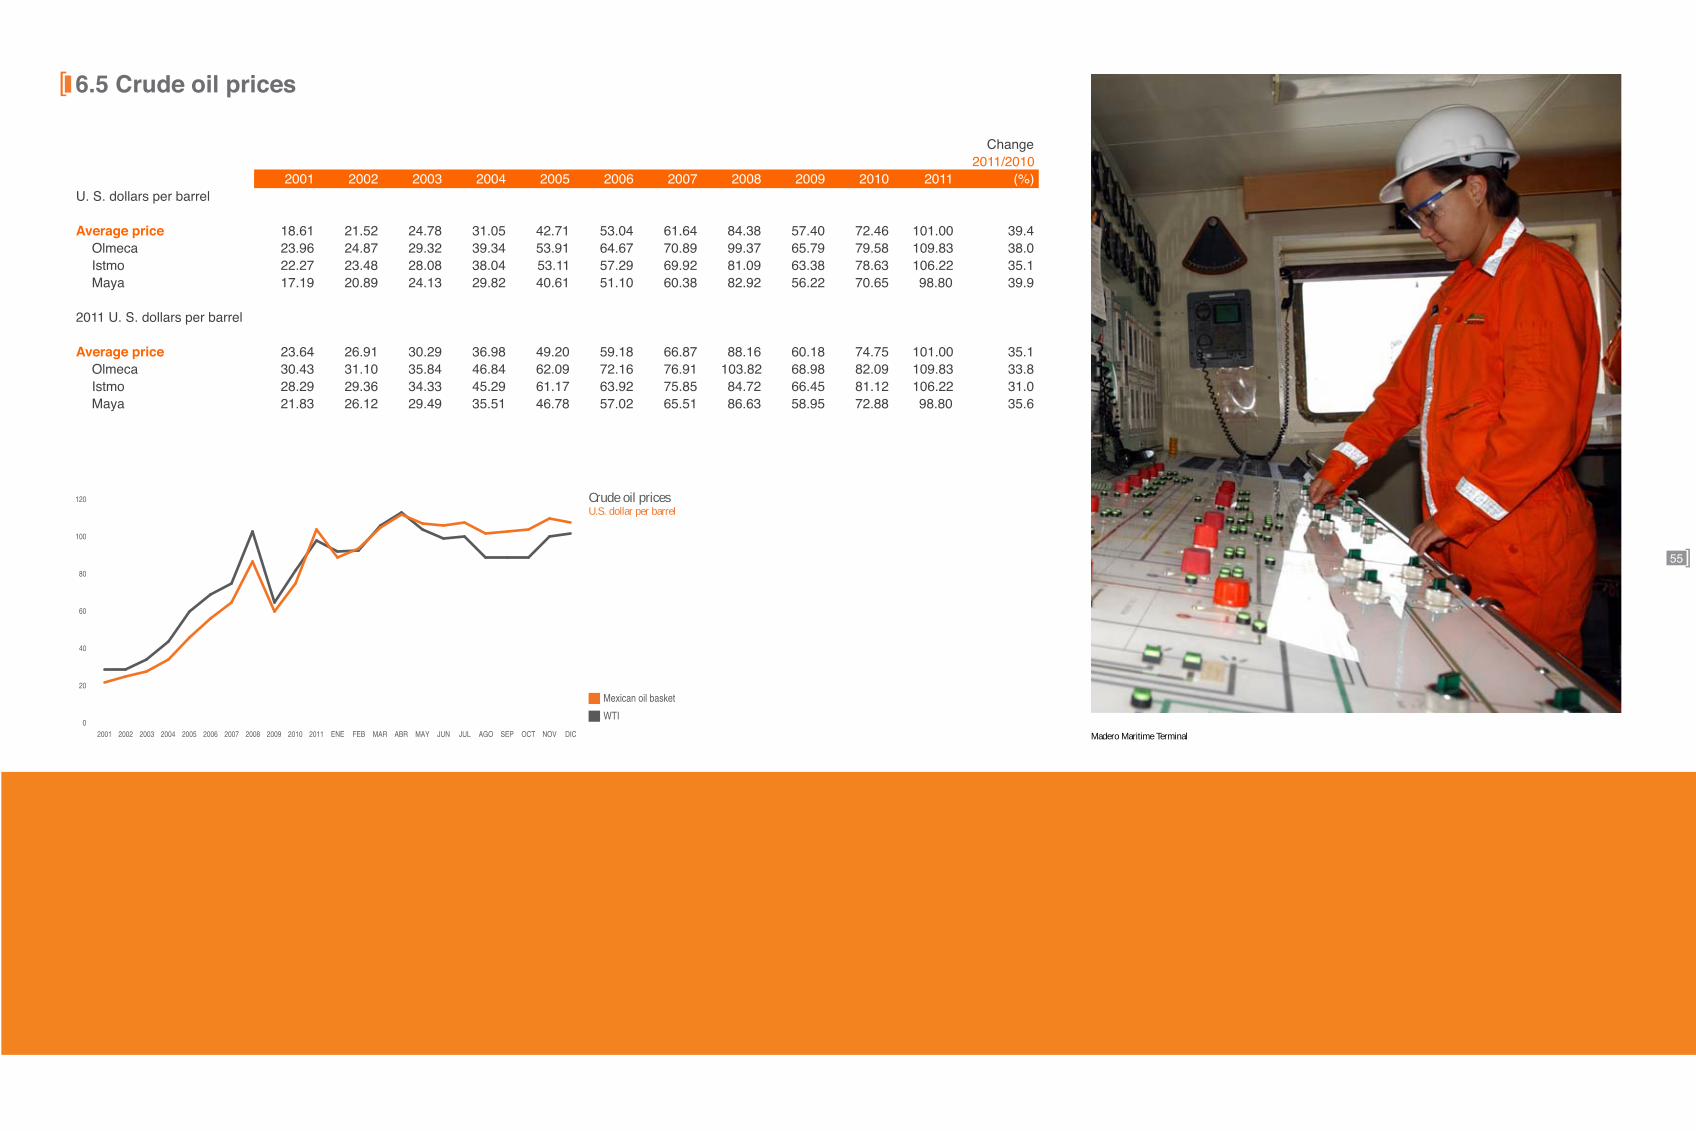
55
6.5 Crude oil prices
Madero Maritime Terminal
WTI
Crude oil pricesU.S. dollar per barrel
Mexican oil basket
0
20
40
60
80
100
120
DICNOVOCTSEPAGOJULJUNMAYABRMARFEBENE20112010200920082007200620052004200320022001
Change2011/2010
2001 2002 2003 2004 2005 2006 2007 2008 2009 2010 2011 (%)U. S. dollars per barrel
Average price 18.61 21.52 24.78 31.05 42.71 53.04 61.64 84.38 57.40 72.46 101.00 39.4Olmeca 23.96 24.87 29.32 39.34 53.91 64.67 70.89 99.37 65.79 79.58 109.83 38.0Istmo 22.27 23.48 28.08 38.04 53.11 57.29 69.92 81.09 63.38 78.63 106.22 35.1Maya 17.19 20.89 24.13 29.82 40.61 51.10 60.38 82.92 56.22 70.65 98.80 39.9
2011 U. S. dollars per barrel
Average price 23.64 26.91 30.29 36.98 49.20 59.18 66.87 88.16 60.18 74.75 101.00 35.1Olmeca 30.43 31.10 35.84 46.84 62.09 72.16 76.91 103.82 68.98 82.09 109.83 33.8Istmo 28.29 29.36 34.33 45.29 61.17 63.92 75.85 84.72 66.45 81.12 106.22 31.0Maya 21.83 26.12 29.49 35.51 46.78 57.02 65.51 86.63 58.95 72.88 98.80 35.6
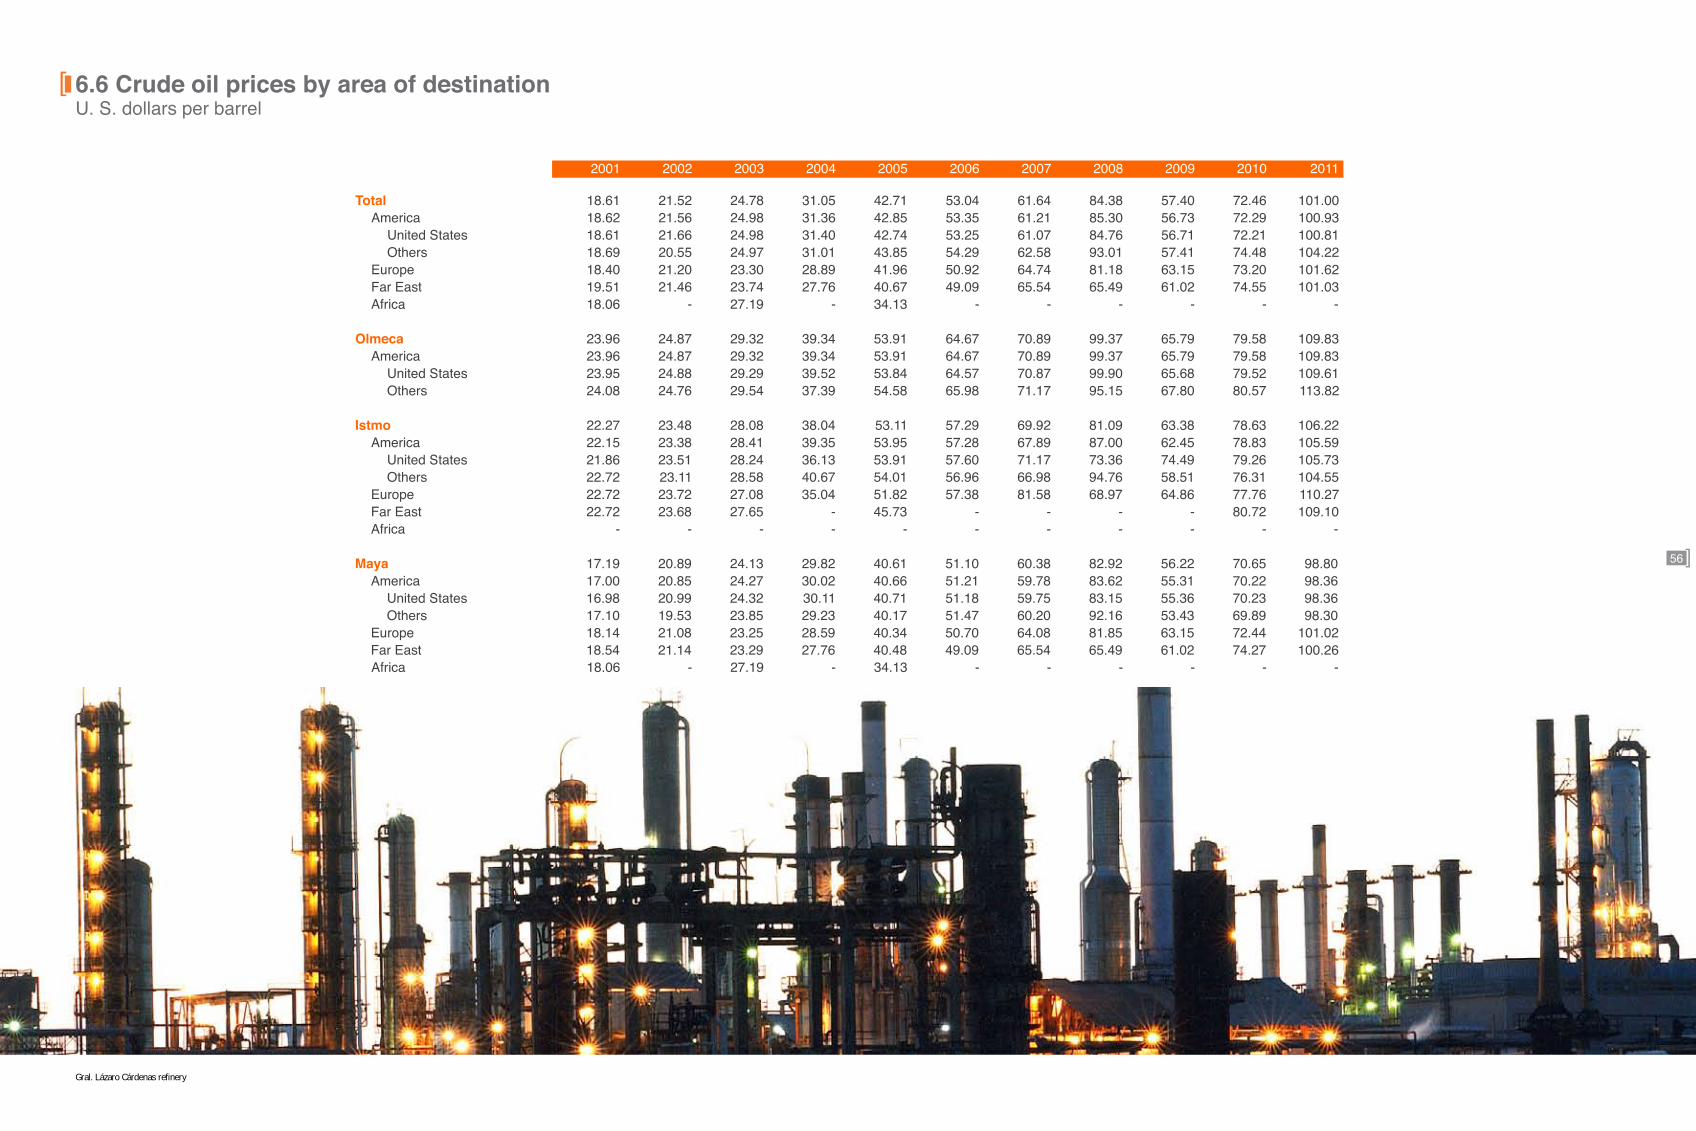
56
6.6 Crude oil prices by area of destination U. S. dollars per barrel
Gral. Lázaro Cárdenas refinery
2001 2002 2003 2004 2005 2006 2007 2008 2009 2010 2011
Total 18.61 21.52 24.78 31.05 42.71 53.04 61.64 84.38 57.40 72.46 101.00America 18.62 21.56 24.98 31.36 42.85 53.35 61.21 85.30 56.73 72.29 100.93
United States 18.61 21.66 24.98 31.40 42.74 53.25 61.07 84.76 56.71 72.21 100.81Others 18.69 20.55 24.97 31.01 43.85 54.29 62.58 93.01 57.41 74.48 104.22
Europe 18.40 21.20 23.30 28.89 41.96 50.92 64.74 81.18 63.15 73.20 101.62Far East 19.51 21.46 23.74 27.76 40.67 49.09 65.54 65.49 61.02 74.55 101.03Africa 18.06 - 27.19 - 34.13 - - - - - -
Olmeca 23.96 24.87 29.32 39.34 53.91 64.67 70.89 99.37 65.79 79.58 109.83America 23.96 24.87 29.32 39.34 53.91 64.67 70.89 99.37 65.79 79.58 109.83
United States 23.95 24.88 29.29 39.52 53.84 64.57 70.87 99.90 65.68 79.52 109.61Others 24.08 24.76 29.54 37.39 54.58 65.98 71.17 95.15 67.80 80.57 113.82
Istmo 22.27 23.48 28.08 38.04 53.11 57.29 69.92 81.09 63.38 78.63 106.22America 22.15 23.38 28.41 39.35 53.95 57.28 67.89 87.00 62.45 78.83 105.59
United States 21.86 23.51 28.24 36.13 53.91 57.60 71.17 73.36 74.49 79.26 105.73Others 22.72 23.11 28.58 40.67 54.01 56.96 66.98 94.76 58.51 76.31 104.55
Europe 22.72 23.72 27.08 35.04 51.82 57.38 81.58 68.97 64.86 77.76 110.27Far East 22.72 23.68 27.65 - 45.73 - - - - 80.72 109.10Africa - - - - - - - - - - -
Maya 17.19 20.89 24.13 29.82 40.61 51.10 60.38 82.92 56.22 70.65 98.80America 17.00 20.85 24.27 30.02 40.66 51.21 59.78 83.62 55.31 70.22 98.36
United States 16.98 20.99 24.32 30.11 40.71 51.18 59.75 83.15 55.36 70.23 98.36Others 17.10 19.53 23.85 29.23 40.17 51.47 60.20 92.16 53.43 69.89 98.30
Europe 18.14 21.08 23.25 28.59 40.34 50.70 64.08 81.85 63.15 72.44 101.02Far East 18.54 21.14 23.29 27.76 40.48 49.09 65.54 65.49 61.02 74.27 100.26Africa 18.06 - 27.19 - 34.13 - - - - - -

57
6.7Refinedproductsanddrygasexportsandimports
a. Excludes imported products under abroad processing agreements. b. Includes MTBE. c. Fuel oil equivalent.
Rosarito Sector pipelines
Change2011/2010
2001 2002 2003 2004 2005 2006 2007 2008 2009 2010 2011 (%)million of U. S. dollars
Net exports -3 175.9 -2 084.5 -2 335.6 -3 559.8 -6 186.4 -7 497.0 -12 391.1 -17 463.3 -9 179.7 -16 478.7 -24 461.9 48.4
Exports 904.1 1 186.1 1 614.0 1 947.0 3 070.3 3 666.4 4 402.1 5 853.1 4 760.8 4 795.9 6 213.9 29.6LPG 32.6 3.4 3.6 3.5 24.3 36.8 20.7 3.0 13.9 2.2 35.4 1 478.9Gasolines 626.3 570.6 754.3 1 127.8 1 472.7 1 782.3 1 953.4 2 173.8 1 344.8 1 848.7 2 619.3 41.7Jet fuel 26.8 63.5 90.2 112.4 172.3 189.6 103.9 258.8 106.4 42.2 79.3 88.0Diesel 80.0 66.7 35.7 102.7 17.1 46.3 196.0 220.0 104.7 13.5 - - 100.0Vacuum gas oil 4.7 - - - - - - - - - - -Fuel oil 16.5 160.8 141.9 17.5 5.8 490.7 547.9 1 122.1 2 267.9 2 834.3 3 281.6 15.8Asphalts 28.7 30.3 7.5 2.0 2.4 - - - - - - -Others 40.7 286.9 580.7 580.9 1 296.8 1 048.9 1 229.8 1 759.3 819.6 23.1 196.7 752.4
Dry gas 47.8 4.0 - - 78.9 71.8 350.5 316.3 103.5 31.9 1.6 - 95.1
Imports a 4 080.0 3 270.6 3 949.5 5 506.8 9 256.7 11 163.4 16 793.1 23 316.4 13 940.6 21 274.6 30 675.8 44.2LPG 600.5 471.5 574.3 648.1 707.1 813.8 1 094.9 1 117.9 771.2 1 011.5 987.6 - 2.4Propane 265.0 328.0 303.7 448.9 449.5 472.6 645.5 910.9 460.1 614.7 1 207.8 96.5Gasolines b 1 930.8 1 191.8 1 033.0 2 135.7 5 205.4 6 623.9 10 916.9 14 610.7 9 319.9 13 917.3 19 540.0 40.4Diesel 87.6 204.8 60.7 60.3 600.6 1 262.6 1 960.8 3 378.9 1 381.6 3 861.7 6 503.5 68.4Fuel oil 715.7 155.7 198.9 226.0 414.8 285.1 385.2 1 158.3 943.6 299.7 970.2 223.7Others 56.6 143.3 252.8 272.7 481.2 570.8 794.2 716.3 431.4 630.5 194.5 - 69.2
Dry gas 423.8 775.4 1 526.2 1 715.1 1 397.9 1 134.5 995.7 1 423.6 632.8 939.2 1 272.2 35.5
thousand barrels per day
Net exports - 271.0 - 174.5 - 134.2 - 194.1 - 214.0 - 242.5 - 351.3 - 410.7 - 328.2 - 510.7 - 609.9 19.4
Exports 107.4 156.5 177.2 152.9 190.6 192.8 200.2 207.8 253.3 195.6 184.9 - 5.5LPG 3.1 0.4 0.3 0.2 1.8 2.1 1.0 0.1 1.1 0.1 1.5 1 510.9Gasolines 73.0 70.7 70.7 76.2 79.0 86.6 79.7 68.8 71.4 67.7 75.2 11.0Jet fuel 2.5 6.3 7.6 6.8 6.9 6.3 3.4 5.7 4.2 1.3 1.8 34.1Diesel 8.9 8.0 2.9 7.7 0.8 2.5 8.8 6.4 4.8 0.4 - - 100.0Vacuum gas oil 0.8 - - - - - - - - - - -Fuel oil 3.9 24.9 21.4 2.6 0.8 35.6 33.6 59.0 120.7 122.3 100.9 - 17.5Asphalts 5.7 4.4 1.2 0.3 0.3 - - - - - - -Others 5.7 41.2 73.1 59.0 97.3 54.8 53.2 51.9 41.2 1.0 5.5 465.6
Dry gas c 3.7 0.6 - - 3.5 4.8 20.4 15.8 9.8 2.8 0.2 - 93.2
Imports a 378.4 331.0 311.4 347.1 404.5 435.4 551.5 618.5 581.4 706.3 794.8 12.5LPG 74.6 59.9 55.6 50.3 45.6 48.2 53.6 49.3 51.6 50.1 39.9 - 20.4Propane 25.2 41.7 29.8 34.3 27.3 27.4 29.3 39.5 28.5 28.9 42.5 47.1Gasolines b 139.3 95.6 69.1 112.5 190.4 214.2 315.3 345.6 335.0 409.8 430.3 5.0Diesel 6.7 17.2 3.9 2.9 21.4 40.5 52.7 68.0 47.7 108.0 135.7 25.6Fuel oil 85.2 16.4 18.6 17.7 26.4 14.3 17.0 32.9 39.2 11.0 25.0 127.5Others 4.3 12.9 22.9 16.4 22.6 24.2 26.7 17.3 17.3 19.5 4.8 - 75.4
Dry gas c 43.1 87.3 111.6 112.9 70.8 66.5 56.8 65.9 62.2 79.0 116.6 47.6

117
6.8 Exports and imports of petrochemical products
Platform in Ku Camp.
Change2011/2010
2001 2002 2003 2004 2005 2006 2007 2008 2009 2010 2011 (%)million of U. S. dollars
Net exports 84.3 67.0 103.4 158.2 196.1 170.5 97.1 190.9 - 20.8 70.4 135.4 92.5
Exports 112.9 112.9 147.6 216.7 302.9 298.7 242.1 348.6 147.3 244.6 260.2 6.4Acetaldehyde 15.2 10.5 12.5 3.0 - - - - - - - -Acrylonitrile 1.3 2.6 1.8 - 6.8 - 34.5 1.6 - - - -Ammonia 2.4 12.9 0.0 10.3 - 9.6 15.1 58.1 - 35.2 20.0 - 43.1Sulfur 6.4 12.9 25.3 28.0 20.5 19.4 18.5 129.4 1.6 42.3 57.2 35.3Benzene - - 10.1 7.5 28.0 21.2 7.7 - - 51.2 4.3 - 91.6Polyethylenic wax 0.2 0.1 0.3 0.3 0.1 0.2 0.3 - - 0.0 - -Styrene - 2.0 3.3 16.8 11.3 18.5 15.3 - - 3.3 17.6 434.7Ethylene 46.9 28.0 39.8 107.1 119.2 74.1 24.1 13.2 53.1 18.0 9.4 - 47.9Ethylene glycol 7.6 3.9 18.4 8.7 43.1 23.3 3.7 0.7 0.6 0.1 0.6 280.6Polyethylenes 22.7 22.4 17.5 18.6 44.8 92.3 83.7 99.5 65.7 51.6 91.0 76.4Polypropylene - - - - - - - - - - - -Others 10.2 17.6 18.7 16.5 29.1 40.1 39.2 46.0 26.3 42.8 60.1 40.4
Imports 28.6 45.9 44.3 58.4 106.8 128.2 145.0 157.7 168.1 174.2 124.7 - 28.4Ammonia 19.6 12.8 8.8 3.5 21.5 18.6 10.2 4.5 34.1 28.1 - -Benzene 6.1 1.8 - 4.0 - - - - - - - -Polyethylenes - 1.2 1.8 11.2 6.1 - - - - - - -Propylene - 2.0 - - - - - - - - - -Toluene 2.1 10.0 0.9 8.0 2.4 8.8 13.7 34.8 31.1 - - -Xylenes - 1.0 1.0 11.9 17.0 30.2 29.6 31.6 24.4 - 7.9 -Others 0.8 17.0 31.8 19.9 59.7 70.7 91.6 86.8 78.4 146.1 116.9 - 20.0
thousand tonnes
Net exports 652.4 634.3 718.2 809.6 628.6 563.7 422.6 336.7 353.1 408.4 359.7 - 11.9
Exports 780.4 831.8 812.9 914.3 867.2 817.5 692.6 586.6 741.3 676.5 458.0 - 32.3Acetaldehyde 36.6 28.9 32.4 6.7 - - - - - - - -Acrylonitrile 2.5 3.1 2.4 - 6.1 - 23.4 1.1 - - - -Ammonia 20.1 123.2 0.1 35.9 - 35.7 56.3 95.7 - 99.0 31.0 - 68.7Sulfur 478.3 444.7 535.0 607.3 493.9 484.2 439.3 367.3 522.0 414.5 297.2 - 28.3Benzene - - 22.6 10.4 33.5 21.7 7.3 - - 57.6 3.5 - 94.0Polyethylenic wax 0.7 0.6 1.3 0.9 0.2 0.7 0.8 - - 0.0 - -Styrene - 4.2 6.3 18.6 11.7 16.2 12.9 - - 3.1 13.4 325.1Ethylene 127.9 94.4 93.9 154.8 163.6 79.9 24.4 10.1 97.0 18.5 8.9 - 51.8Ethylene glycol 22.7 13.5 32.6 11.9 58.1 32.8 5.1 0.9 1.7 0.3 0.5 50.7Polyethylenes 45.0 51.5 30.6 23.9 46.6 89.4 73.4 68.8 74.8 45.6 70.8 55.2Polypropylene - - - - - - - - - - - -Others 46.7 67.6 55.8 43.8 53.3 57.0 49.6 42.7 45.8 37.8 32.7 - 13.4
Imports 128.1 197.4 94.7 104.7 238.6 253.8 270.0 249.8 388.2 268.2 101.3 - 62.2Ammonia 94.1 88.6 35.2 11.0 56.0 50.7 27.0 29.3 107.9 63.8 - -Benzene 19.4 4.2 - 3.3 - - - - - - - -Polyethylenes - 2.0 1.9 9.9 4.4 - - - - - - -Propylene - 4.5 - - - - - - - - - -Toluene 6.3 27.3 2.1 10.2 3.7 9.2 15.0 36.8 42.1 - - -Xylenes - 2.9 2.0 18.5 22.8 33.2 31.8 29.7 31.8 - 6.3 -Others 8.2 67.9 53.5 51.8 151.8 160.6 196.2 154.1 206.3 204.3 95.0 - 53.5
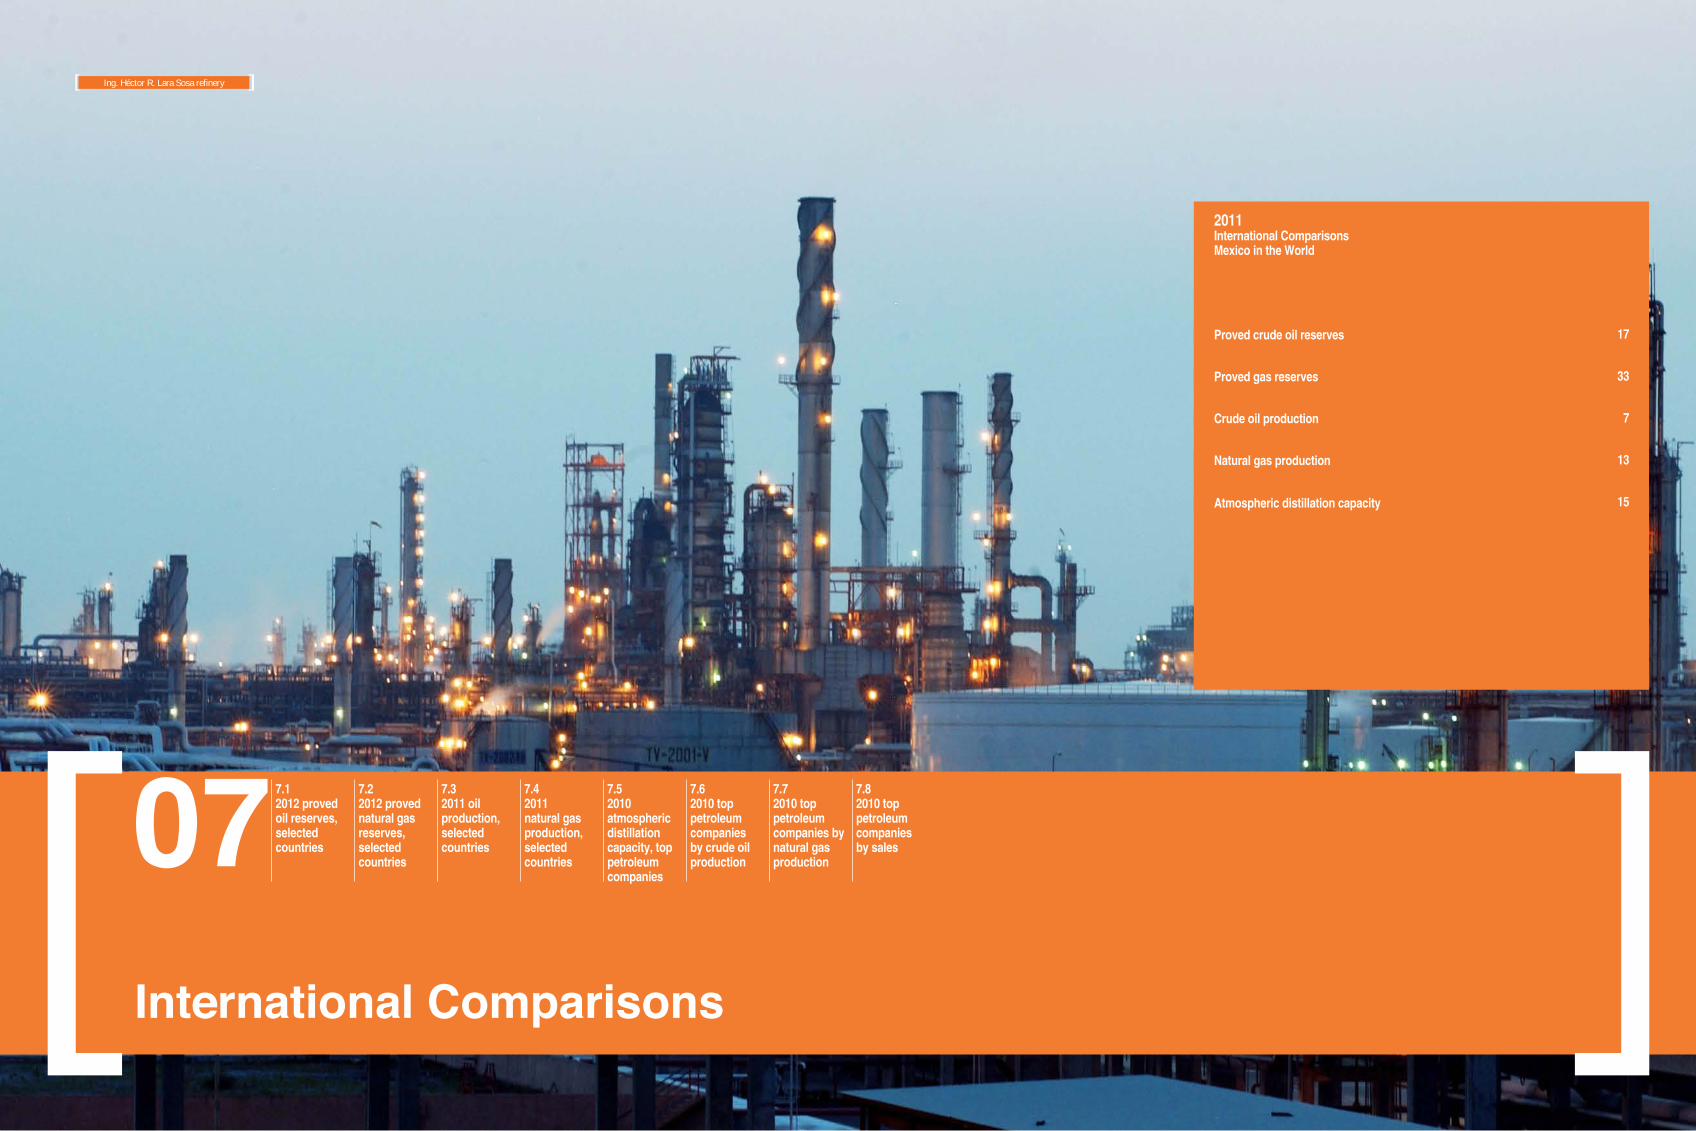
119
07International Comparisons
7.12012 proved oil reserves, selected countries
7.22012 proved natural gas reserves, selected countries
7.32011 oil production, selected countries
7.42011 natural gas production, selected countries
7.52010 atmospheric distillation capacity, top petroleum companies
7.62010 top petroleum companies by crude oil production
7.72010 top petroleum companies by natural gas production
7.82010 top petroleum companies by sales
Ing. Héctor R. Lara Sosa refinery
2011International Comparisons Mexico in the World
Proved crude oil reserves
Proved gas reserves
Crude oil production
Natural gas production
Atmospheric distillation capacity
17
33
7
13
15
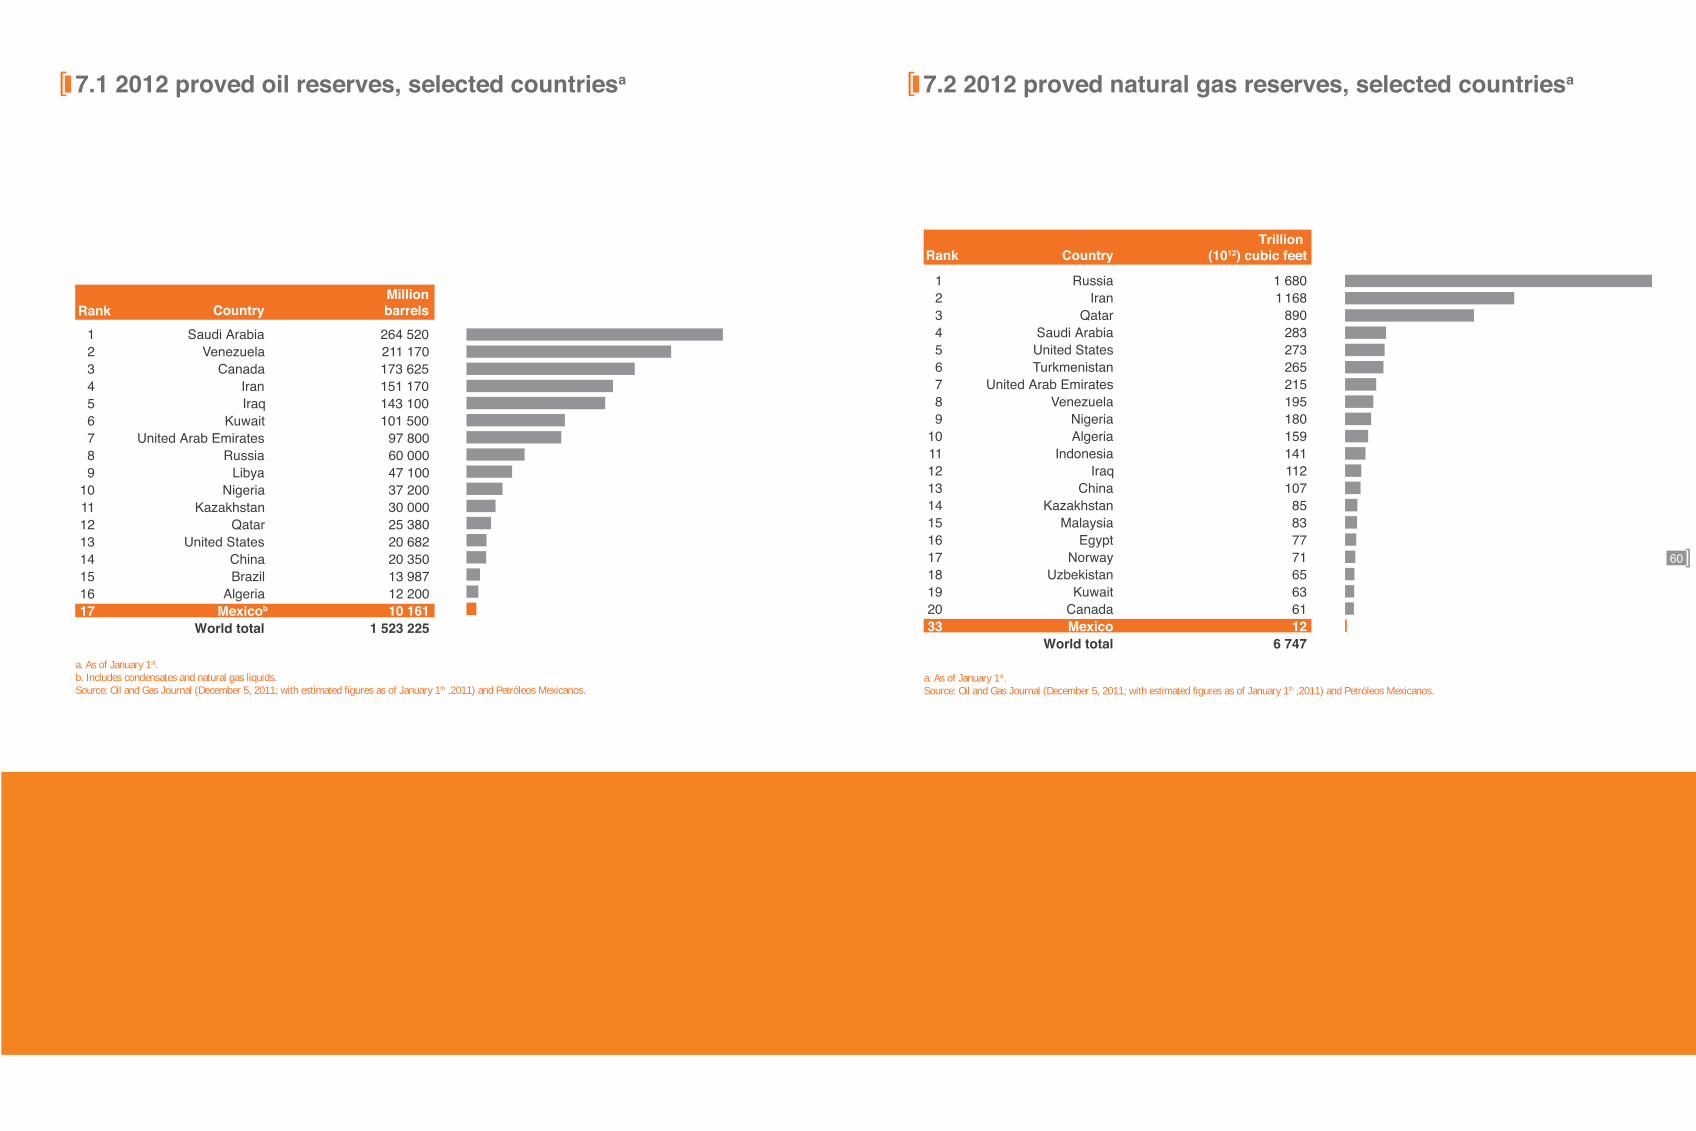
60
7.12012provedoilreserves,selectedcountriesa
7.22012provednaturalgasreserves,selectedcountriesa
a. As of January 1st. b. Includes condensates and natural gas liquids. Source: Oil and Gas Journal (December 5, 2011; with estimated figures as of January 1th ,2011) and Petróleos Mexicanos.
a. As of January 1st. Source: Oil and Gas Journal (December 5, 2011; with estimated figures as of January 1th ,2011) and Petróleos Mexicanos.
CountryMillion
barrels1
RankSaudi Arabia 264 520
2 Venezuela 211 1703 Canada 173 6254 Iran 151 1705 Iraq 143 1006 Kuwait 101 5007 United Arab Emirates 97 8008 Russia 60 0009 Libya 47 100
10 Nigeria 37 20011 Kazakhstan 30 00012 Qatar 25 38013 United States 20 68214 China 20 35015 Brazil 13 98716 Algeria 12 20017 Mexicob 10 161
World total 1 523 225
CountryRankTrillion
(1012) cubic feet
1 Russia 1 6802 Iran 1 1683 Qatar 8904 Saudi Arabia 2835 United States 2736 Turkmenistan 2657 United Arab Emirates 2158 Venezuela 1959 Nigeria 180
10 Algeria 15911 Indonesia 14112 Iraq 11213 China 10714 Kazakhstan 8515 Malaysia 8316 Egypt 7717 Norway 7118 Uzbekistan 6519 Kuwait 6320 Canada 6133 Mexico 12
World total 6 747

61
7.32011oilproduction,selectedcountries 7.42011naturalgasproduction,selectedcountries
Source: Oil and Gas Journal (March 22, 2012) and Petróleos Mexicanos.
Source: Oil and Gas Journal (March 22, 2012) and Petróleos Mexicanos.
CountryRankThousand
barrels per day1 Russia2 Saudi Arabia3 United States4 China5 Iran6 Canada7 Mexico8 United Arab Emirates9 Kuwait
10 Venezuela11 Iraq12 Nigeria13 Brazil14 Norway15 Angola
World total
10 3319 3465 6704 0763 5792 9002 5502 5052 5032 4982 4732 1772 1051 7591 638
72 759
CountryRank Million
cubic feet per dayUnited States
RussiaIran
CanadaFormer USSR
QatarChina
NorwayAlgeria
NetherlandsSaudi Arabia
IndonesiaMexico
Malaysia
123456789
101112131415 United Kingdom
World total
66 22261 78116 54814 01713 23311 3299 9389 7967 4797 4797 4527 4226 5946 0274 604
315 978

62
7.52010atmosphericdistillationcapacity,top petroleum companies
7.6 2010 top petroleum companies by crude oil productiona
Source: Information as of 2012 from Energy Intelligence Group (PIW, March 2012) and from Petróleos Mexicanos.
a. Includes natural gas liquids. Source: Information as of 2012 from Energy Intelligence Group (PIW, March 2012) and from Petróleos Mexicanos.
CompanyRank CountryThousand
barrels per day1 Exxon Mobil United States 6 2402 Sinopec China 4 9143 Royal Dutch Shell United Kingdom/Netherlands 3 5944 CNPC China 3 1425 PDVSA Venezuela 3 0356 BP United Kingdom 2 6677 ConocoPhillips United States 2 6578 Valero Energy United States 2 6409 Saudi Aramco Saudi Arabia 2 423
10 Total France 2 36311 Chevron United States 2 16012 Petrobras Brazil 2 10713 JX Holdings Japan 1 83114 NIOC Iran 1 74115 Petróleos Mexicanos Mexico 1 540
CompanyRank CountryThousand
barrels per day1 Saudi Aramco Saudi Arabia 10 0072 NIOC Iran 4 2923 PDVSA Venezuela 2 9704 Petróleos Mexicanos Mexico 2 9535 CNPC China 2 8406 KPC Kuwait 2 5567 Exxon Mobil United States 2 4228 INOC Iraq 2 3959 BP United Kingdom 2 374
10 Rosneft Russia 2 32211 Petrobas Brazil 2 15012 Lukoil Russia 1 94213 Chevron United States 1 92314 Royal Dutch Shell United Kingdom/Netherlands 1 70915 Adnoc Abu Dhabi 1 538

63
7.72010toppetroleumcompaniesbynaturalgasproduction
7.8 2010 top petroleum companies by sales
Source: Information as of 2012 from Energy Intelligence Group (PIW, March 2012) and from Petróleos Mexicanos.
Source: Fortune (July 25, 2011; figures as of December 31th ,2010) and Petróleos Mexicanos.
CompanyRank CountryMillion
of U.S. dollars1 Royal Dutch Shell United Kingdom/Netherlands 378 1522 Exxon Mobil United States 354 6743 BP United Kingdom 308 9284 Sinopec Group China 273 4225 China National Petroleum China 240 1926 Chevron United States 196 3377 Total France 186 0558 ConocoPhillips United States 184 9669 ENI Italy 131 756
10 Petrobras Brazil 120 05211 Petróleos Mexicanos Mexico 103 75112 PDVSA Venezuela 88 36113 Statoil Norway 87 64614 Lukoil Russia 86 07815 Petronas Malaysia 76 87616 Repsol YPF Spain 70 456
CompanyRank CountryMillion
cubic feet per day1 Gazprom Russia 49 1882 NIOC Iran 13 2923 Exxon Mobil United States 12 1484 Royal Dutch Shell United Kingdom/Netherlands 9 3055 BP United Kingdom 8 4016 Saudi Aramco Saudi Arabia 8 1217 CNPC China 8 0188 Sonatrach Algeria 7 5479 Petróleos Mexicanos Mexico 7 020
10 QP Qatar 7 01411 Uzbekneftegas Uzbekistan 5 81612 Total France 5 64813 Petronas Malaysia 5 17814 Chevron United States 5 04015 ConocoPhillips United States 4 860

129
Glossary and Nomenclature

PRODUTIONFIELDS.Fields with exploration wells. These include operating wells, which are divided into injection and production wells, and closed wells with potential to be exploited in the future.
REFINING CAPACITY.The daily operating capacity of a plant to produce refined products. Daily operating capacity means the maximum volume to be processed when the plant Works without interruption.
CONDENSATES.Any mixture of relatively light hydrocarbons that remain liquid at normal temperature and have a certain quantity of propane and butane. Unlike crude oil, they have low or cero quantity of heavy hydrocarbons that constitute heavy fuel.
There are three main sources of condensates:
a) liquid hydrocarbons that separate when natural gas is treated, typically consists of C5 to C8,
b) liquid hydrocarbons coming from non-associated gas that are recovered at the surface, and
c) liquid hydrocarbons coming from gas/condensate basins, which can barely be distinguished from a stabilized light crude oil.
DRILLINGRIGSINOPERATION.The daily average number of drilling rigs used for drilling Wells or in related activities such as dismantlement, transport and maintenance.
FLOATINGPRODUCTIONSTORAGEANDOFFLOADING(FPSO).Floating Production Storage and Offloading vessel (also called a “unit” and a “system”). A floating tank system used by the offshore crude oil and gas industry designed to receive, process, and storage crude oil or natural gas produced from nearby platforms, until the product can be offloaded onto waiting tankers. Instead, the FSO are not equipped with process systems.
NATURALGAS.Light paraffinic hydrocarbon mixture, mainly methane, small quantities of ethane and propane and in variable proportions nitrogen, carbon dioxide and hydrogen sulfide. Natural gas can be associated with crude oil or be found alone in non-associated natural gas wells.
DRY GAS.Natural gas free of heavier liquid hydrocarbons (natural gas liquids) consisting of ethane, propane, butane and natural gasoline.
SOUR GAS.Natural gas containing hydrocarbons, hydrogen sulfide and carbon dioxide (the later in concentrations greater than 50 ppm).
WET GAS.Natural gas containing more than 3 gallons of liquid hydrocarbons per thousand cubic feet of gas.
NATURALGASOLINE.A highly volatile hydrocarbon mixture heavier tan propane. Usually added to automotive gasoline to increase vapor pressure and start gasoline engines at low temperatures. Also used by the petrochemical industry to produce isobutane and isopentane, used in alkylation processes.
LIQUEFIEDPETROLEUMGAS(LPG).A gaseous mixture of propane and butane obtained during the fractionation of natural liquids or during the fractionation of refined products. It is the lighter fraction of crude oil utilized for domestic use and carburation.
SPECIALTAXONPRODUCTIONANDSERVICES(STPSORIEPS).An indirect tax on domestic sales of gasoline and diesel that Pemex-Refining collects on behalf of the Mexican Government. The difference between the retail price, or final price, and the producer price is
the IEPS rate. The final price of gasoline and diesel is established by the Ministry of Finance (SHCP). The producer price of PEMEX is referenced to that of an efficient refinery in the Gulf of Mexico.
SAN JOSÉ AGREEMENT.Crude oil cooperation agreement between Mexico and Venezuela that benefits Central America and Caribbean area and contemplates a collaboration scheme dedicated to finance economic development projects.
CRUDEOIL.Oil that comes from a reservoir after separating any associated gas. It does not include condensates and natural gas liquids production. Recovered crude oil is considered heavy or light according to the following approaches:
Heavy: crude oil with API gravity less or equal to 27°.
Light: crude oil with API gravity between 27° to 38°.
Extra-light: crude oil with API gravity greater than 38°.
Three varieties of crude oil are exported:
Maya: heavy crude oil with API gravity of 22° and 3.3% sulfur by weight.
65
Glossary
Istmo: light crude oil with API gravity of 33.6° and 1.3% sulfur by weight.
Olmeca: extra-light crude oil with API gravity of 39.3° and 0.8% sulfur by weight.
WELLS.Wells are classified according to their purpose or function, into development (including injection wells) and exploration (including wells by stratographic probe); and according to their completion grade, into drilled or completed.
Drilled wells. Are those with completed operations with the rotary drill and cemented casing, but have not entered into subsequent operations that allow production.
Completed wells. Are those with completed operations regarding: installation of production pipelines; shots to the pipeline lining to allow communication between the interior of the well and the storing rock; and cleaning and stimulation of the rock to enhance the flow of hydrocarbons.
Successful exploration wells. The relationship of currently producing exploration wells that incorporate reserves, divided by total completed wells. Since 2007, Pemex-Exploration and Production adopted the definition of Exploratory Commercial Success derived from international practices which evaluates
the performance of exploration activities from an economic point of view.
PEMEX-REFININGPROCESSES.Alkylation. Process by which an isoparafine (of short chain) combines chemically with an olefin through a catalyst to form another isoparafine (of long chain), called alkylate. It’s a major aspect of the upgrading of petroleum since it’s formed of high-octane compound.
Cracking. Process to break large molecules of crude oil into smaller ones: known as thermal cracking when the process is reached by the application of heat; catalytic cracking when a catalyst is used; and hydrocracking, when the process is carried out in a hydrogen atmosphere.
Distillation. Process consisting on heating a liquid mixture until the most volatile components pass to the vapor phase, then the vapor is cooled down to recover these components by condensation. The main objectives of distillation are to separate a mixture of several components taking advantage of their different boiling points, or to separate the volatile materials of the non-volatile ones.
Fractionation. Distillation process that separates small fractions of a hydrocarbon mixture.
Hydrodesulfurization. Process that eliminates
sulfur by transforming it to hydrogen sulfide in the gaseous stream, which can be easily separated and converted to elemental sulfur.
Isomerization. Process that alters the fundamental arrangement of the atoms of a molecule without adding or subtracting anything to the original molecule. Butane is rearranged as isobutane to be used in the alkylation of isobutene and other olefins for high octane hydrocarbon production.
Reforming. Process that improves the antiknoc quality of gasoline fractions by modifying their molecular structure: known as thermal reforming when is carried out by heat; and as catalytic reforming when catalyst is used.
PETROCHEMICALPRODUCTS.These chemicals are produced from raw materials derived from crude oil and natural gas. According to the governmental resolution published on November 13, 1996, in the Official Gazette of the Federation, the categories of basic petrochemical products are constituted by those derivates that serve as basic industrial raw materials. These products can only be elaborated by the state through Petróleos Mexicanos and its subsidiary entities:
1.- Ethane2.- Propane3.- Butane
4.- Pentane5.- Hexane6.- Heptane7.- Carbon black8.- Naphtha9.- Methane, when it comes from hydrogen carbides, obtained from reservoirs located in Mexican territory and used as raw material in industrial petrochemical process.
In addition, Petróleos Mexicanos has petrochemical by-products and other products which, according to the generally adopted convention, are not petrochemicals but are elaborated in its petrochemical areas.
REGION.A goegraphical area corresponding to the administrative division of Pemex-Exploration and Production. The regional heads are located along the Gulf of Mexico Coast: Poza Rica, Veracruz (Northern Region), Villahermosa, Tabasco (Southern Region) and Ciudad del Carmen, Campeche (Northeastern Marine Region and Southwestern Marine Region).
Integral asset. An administrative subdivision of each region. Resulting from the regions’ restructure, they are distributed as follows:
Northeastern Marine Region: Cantarell and Ku-Maloob-Zaap.
66

67
Southwestern Marine Region: Abkatún-Pol-Chuc and Litoral de Tabasco.
Southern Region: Bellota-Jujo, Cinco Presidentes, Macuspana, Muspac and Samaria-Luna.
Northern Region: Burgos, Poza Rica-Altamira and Veracruz.
RESERVES.Estimated amount of hydrocarbons that can be commercially recovered from well-known formations at a specific date. It is worth mentioning all estimated reserves involve some grade of uncertainty.
The SEC permits oil and gas companies, in their filings with the SEC, to disclose only proved reserves that a company has demonstrated by actual production or conclusive formation tests to be economically and legally producible under existing economic and operating conditions. We use certain terms in this document, such as total reserves, probable reserves and possible reserves, that the SEC’s guidelines strictly prohibit us from including in filings with the SEC.
PROVEDRESERVES(1P).Estimated volumes of hydrocarbons which geological and engineering analysis demonstrates with reasonable certainty will be commercially
recoverable in future years from known reservoirs under the prevailing economic conditions and existing operations; for example, prices and costs at the date of estimate. Prices include existing changes or contractual arrangements but are not based on future conditions.
PROBABLERESERVES(2P).Those reserves which analysis of geological and engineering data suggests are more likely to be recovered than to not being recoverable. If probabilistic methods are employed for evaluation, there is a probability of at least 50% that the amounts to be recovered will be equal to or greater than the sum of proved plus probable reserves, also called 2P reserves.
POSSIBLERESERVES(3P).Those hydrocarbon reserves which analysis of geological and engineering data suggests are less likely to be recoverable than probable reserves. According to this definition, when probabilistic methods are employed, there is a probability of at least 10% that the amounts actually recovered will be equal to or greater than the sum of proved, probable and possible reserves, also called 3P reserves.
DOMESTICSALES.Sales that Petróleos Mexicanos bills to its distributors in Mexican territory or that it carries out directly to
national clients for intermediate and end use. The sales value excludes taxes (STPS and VAT) and commissions to distributors.
REGIONALIZATIONOFREFINEDPRODUCTSSALES.
Since 2002 sales petroleum products adopted the economic regionalization used by the executive branch of the Mexican Government.
Central Region: Estado de Mexico, Distrito Federal, Morelos, Tlaxcala, Hidalgo and Puebla.
Northeastern Region: Chihuahua, Durango, Coahuila, Tamaulipas and Nuevo León.
Northwestern Region: Baja California, Baja California Sur, Sonora and Sinaloa.
Central-western Region: Nayarit, Zacatecas, Aguascalientes, Jalisco, Colima, San Luis Potosi, Guanajuato, Queretaro y Michoacan.
South-southeastern Region: Veracruz, Guerrero, Oaxaca, Chiapas, Tabasco, Campeche, Yucatán and Quintana Roo.
Public prices. The public prices that are presented correspond to different reference places, which are shown in the following table:
Product
Jet fuel
Heavy fuel oil
Acrylonitrile
Ammonia
Vinyl chloride
Styrene
Monoethylene glycol FG
Hexane
High density polyethylene
Low density polyethylene
Toluene
Reference place
Mexico City airport
Producing Center Tula
Producing Center Tula/Morelos
Producing Center Cosoleacaque
Producing Center Pajaritos
Producing Center La Cangrejera
Producing Center Morelos
Producing Center La Cangrejera
Producing Center Morelos
Producing Center La Cangrejera
Producing Center La Cangrejera

68
°C
kg/cm2
km
m
bd
Mbd
MMb
MMboe
Mm3
MMMcf
MMcfd
Mt
MTBE
STPS
INPC
Ps.
CAPEX
LD
HD
Celsius degrees
Kilogram per square centimeter
Kilometer
Meter
Barrels per day
Thousand barrels per day
Million barrels
Million barrels of crude oil equivalent
Thousand cubic meters
Billion cubic feet
Million cubic feet per day
Thousand tons
Methyl tertiary butyl ether
Special Tax on Production and Services
National Consumer Price Index
Mexican pesos
Capital expenditure
Low Density
High Density
Explanations:
• Annual variations are determined based on the original figures before rounding.
• Figures may not total due to rounding.• Operating figures can be modified by
adjustments and complaints that are solved after the accounting settlement, thus variations with respect to accounting figures may appear.
• International trade figures include operations related with the Petróleos Mexicanos system.
• The amounts shown in our consolidated financial statements do not express the provisions of Bulletin B-10 under Mexican FRS, which requires to express amounts in thousands of constant pesos.
The statistical yearbook contains Petróleos Mexicanos information as of December 31, 2011.
For information about this publication, please contact the Gerencia de Integración de Información Institucional, at Marina Nacional #329, Floor 31, Col. Petróleos Mexicanos C3, Mexico City, 11311 or by calling: (52) 55-19448028.
FG
VAT
GPC
PC
OPEC
PPQ
PGPB
PIDIREGAS
ppm
MMUS$
MM$
US$/b
US$/MMBtu
WTI
$/kg
$/m3
…
-
-
Fiber grade
Value Added Tax
Gas Processing Center
Petrochemical Complex
Organization of the Petroleum Exporting Countries
Pemex-Petrochemicals
Pemex-Gas and Basic Petrochemicals
Long-term Productive Infrastructure Projects
Parts per million
Million dollars
Million pesos
Dollars per barrel
Dollars per million Btu
West Texas Intermediate
Pesos per kilogram
Pesos per cubic meter
Negligible figure
Null value
Nomenclature

www.pemex.com
Morelos Petrochemical Center
Statistical Year Book
2012