03 Corporate Finance III
24
INSTITUTE OF ECONOMIC STUDIES Faculty of Social Sciences of Charles University Corporate Finance III Lecturer’s Notes No. 3 Course: Corporate Finance Teacher: Oldřich Dědek
-
Upload
gopala-krishnan -
Category
Documents
-
view
214 -
download
0
Transcript of 03 Corporate Finance III

8/19/2019 03 Corporate Finance III
http://slidepdf.com/reader/full/03-corporate-finance-iii 1/24
INSTITUTE OF ECONOMIC STUDIES
Faculty of Social Sciences of Charles University
Corporate Finance III
Lecturer’s Notes No. 3
Course: Corporate Finance
Teacher: Oldřich Dědek

8/19/2019 03 Corporate Finance III
http://slidepdf.com/reader/full/03-corporate-finance-iii 2/24
2
IX. MERGERS AND ACQUISITIONS
acquisition = financial decision to buy a firm which ceases to exist
buyer is called the bidder, the acquirer, the acquiring firm
seller is called the target, the acquired firm
merger = an agreement between the firms to create a combined entity from the
acquiring and the acquired firmtakeover = the act of shifting corporate control from the target’s shareholders to the
bidder’s shareholders
friendly takeover = the target board of directors supports the merger and agrees on
the price that is ultimately put to a shareholder vote
hostile takeover = the target board of directors fights the takeover attempt and the
acquirer (called raider) must garner enough shares to take control of the target
tender offer = the offer to buy the outstanding stock of the other firm at a specific price
management buyout = the bidding investors are incumbent managers; the acquired firm
usually ceases to exist as a publicly traded company and becomes a private business
leveraged buyout = funds for the tender offer come predominantly from debt
1. Reasons to acquire
acquisition must be a positive-NPV investment opportunity
PV (bidder) + PV (target) < PV (bidder and target as a conglomerate)
acquisition must be a source of synergies: cost-reduction synergies, revenue
enhancement synergies
a) economies of scale and scope
economies of scale = savings from producing goods in high volume
economies of scope = savings that come from combining marketing and distribution
of different types of related products
Corporate control
Cash, shares
Bidder Target

8/19/2019 03 Corporate Finance III
http://slidepdf.com/reader/full/03-corporate-finance-iii 3/24
3
source of synergies: sharing central services (accounting, executive management,
financial control, canteen, catering, etc.), fixed cost of production are allocated to
a higher production
b) vertical integration
vertical integration refers to a merger of two companies in the same industry that
make products required at different stages of the production process
source of synergies: direct control of the inputs or distribution channels; easier
coordination and administration (by putting two companies under central control,
both companies work toward a common goal)
c) monopoly gains
merging with or acquiring a major rival enables a firm to substantially reduce
competition within the industry
unwanted consequence of horizontal integration (a merger of two firms in the same
line of business), therefore it is an area of strong involvement of antitrust law
d) efficiency gains
source of synergies: elimination of duplication, more efficient organisation structure
it is easier to identify poorly performing corporations than to improve their
performance
e) expertise
to purchase already functioning unit may be more profitable way to get access to a
new efficient technology (high hiring cost, unfamiliarity with the new technology,
etc.)
f) operating losses
a conglomerate has a tax advantage over a single-product firm because losses in one
division can be offset by profits in another division and the tax shield can be
always realised
The profits of the two firms A and B are negatively correlated. Both firms pay 34 % corporate
tax. Both future states are equally probable.
Before-tax profit After-tax profit Expected after-
tax profit
State 1 State 2 State 1 State 2
Firm A 50 -20 33 -20 6.5
Firm B -20 50 -20 33 6.5
Firm A&B 30 30 19.8 19.8 19.8

8/19/2019 03 Corporate Finance III
http://slidepdf.com/reader/full/03-corporate-finance-iii 4/24
4
g) diversification
mergers are justified on the basis that the combined firm is less risky
it is a dubious argument as far as investors can achieve the benefits of diversification
themselves by purchasing shares in the two separate firms (they get no further
benefit form the firm diversifying through acquisition); investors can only be
worse-off because some of them do not like the fixed combination of risky shares
cemented in a merged firm
on the other hand diversified firms have a lower probability of default, consequently
they have a higher debt capacity and lower cost of capital
h) growth of earnings
merging a company with little growth potential and company with high growth
potential can raise earnings per share even when the merger itself creates no
economic value
Target
(low growth)
Bidder
(high growth)
Conglomerate
Earnings ($million) 5 5 10
Share price ($) 60 100 100
Shares outstanding (million) 1 1 1.6
Value of firm ($million)60 100 160
Earnings per share 5 5 6.25
Price/earnings ratio 12 20 16
high growth bidder acquires low growth target (higher growth potential is reflected
in a higher share price)
merger creates no added value (value of conglomerate is the sum of individual
values)
bidder can issue 0.6 million shares at a price $100 in total value $60 million that are
exchanged for the shares of the target also in total value $60 million (each
shareholder of the target will get per one share of his own 0.6 shares of the bidder)
the merger raises earnings per share that reflects the fact that the high-growth
company (with potential to generate earnings in the future) has purchased a low-
growth company (for which most of the value lies in it s current ability to generate
earnings)

8/19/2019 03 Corporate Finance III
http://slidepdf.com/reader/full/03-corporate-finance-iii 5/24
5
the merger should be rejected on economic grounds (no synergies involved), the true
motive may be to mislead non-sophisticated shareholders of the bidder (they are
pleased by a higher EPS)
sophisticated shareholders would notice declining price/earnings ratio
valuation of synergies
i) comparison of the target with other comparable companies
this approach gives only rough estimates because it does not capture operational
improvements and other synergies that the acquirer intends to implement
ii) projections of the expected cash flows and valuation of those cash flows
2. Acquisition premium
total gain from merger (synergies) = the difference between the value of a new
merged company and the sum of values of a bidder and a target before the merger
TG = PV (B&T) – [PV (B) + PV (T)]
acquisition premium = the difference between the acquisition price the bidder pays
for the target and the pre-emerged value of the target firm
AP = PT – PV (T)
distribution of the merger gain between the bidder and the target
TG = PV (B&T) – [PV (B) + PT] + PT – PV (T) = (TG – AP) + AP
goodwill = the difference between the acquisition price the bidder pays for the target
and the book value assigned to the target’s assets (goodwill can be amortised in
accounting books at a rate corresponding to the declining value of the acquired
assets)
♦
pre-merged value of a bidder: PV (B) = $200 million
pre-merged value of a target: PV (T) = $50 million
estimated synergies from the merger (total merger gain): TG = $25 million
payment for the target: PT = $65 million
gain for the target (acquisition premium): PT – PV (T) = 65 – 50 = $15 million
gain for the bidder = TG – AP = 25 – 15 = $10 million
gain for both actors = 15 + 10 = $25 million = total merger gain
♦
gain for targetgain for bidder

8/19/2019 03 Corporate Finance III
http://slidepdf.com/reader/full/03-corporate-finance-iii 6/24
6
empirical evidence
Berg & DeMarzo: statistical findings about the distribution of merger gain between the
bidder and the target show that the targets shareholders are overpaid (acquisition premium
is approximately equal to the synergies)
- acquires pay an average premium of 38 % over the pre-merger price of the target
- target’s shareholders enjoy an average gain of 16 % in their stock price when a bid is
announced
- acquirer’s shareholders see an average loss of 1 % (statistically not different from
zero)
free rider problem
an acquirer offers a price to the target’s shareholders which is well above the current
pre-merger price
if shareholders are generally expected to accept the offer than as an individual
shareholder it would be better not to tender his shares (if the bidder takes over the
control of the firm, the share price is going to rise even further due to reaped merger
synergies)
if all shareholders take this free-ride stance the merger or fails or the bidder has to offer
a higher price that wipes out any profit opportunities (shareholders must be
persuaded that the share price will not rise up when the merger is completed)
♦
A bidder offers the target’s shareholders a fair price $50 per share that is well above the
current market price. The bidder wants to get control over one half of outstanding shares. The
synergies of the merger are estimated at $400 million. However the merger fails due to free-
rider behaviour of existing shareholders.
Before merger After merger
Share price ($) 40 60
Shares outstanding (million) 20 10
Acquired shares (million) 0 10
Equity ($million) 800 1200
Firm value ($million) 800 1200
♦

8/19/2019 03 Corporate Finance III
http://slidepdf.com/reader/full/03-corporate-finance-iii 7/24
7
leveraged buyout
a tender offer is financed by borrowed money and shares of the target are pledged as
collateral on the loan
if the tender offer is successful, the law allows the bidder to attach the loan directly to
the corporation which is responsible (not the bidder) for repaying the loan
shareholders are pushed to tender their shares because i) the share price is not expected
to rise (higher leverage of the firm lowers the firm’s equity); ii) by refusing the
merger they will be deprived of capital gain
♦
A bidder announces a leveraged buyout. His intention is to borrow $400 for getting control of
half of outstanding shares that are purchased at market price. The synergies of the merger are
estimated at $400 million. This strategy eliminates incentives for fee rider behaviour.
Before merger After merger
Share price ($) 40 40
Shares outstanding (million) 20 10
Acquired shares (million) 0 10
Equity ($million) 800 800
Debt ($million) 400
Firm value ($million) 800 1200
♦
the law protects existing shareholders that they must be offered at least the pre-merger
price for their shares
the bidder cannot use the threat that an even higher leverage will incur capital losses to
existing shareholders in order to make them more willing to tender their shares; in
that case all shareholders would tender their shares at a pre-merger price that would
be costly for the bidder
in practice premiums in LBO transactions are often quite substantial (takeover defences
must be overcome, other potential acquires must be outbid)

8/19/2019 03 Corporate Finance III
http://slidepdf.com/reader/full/03-corporate-finance-iii 8/24
8
toehold
the bidder acquires the initial stake in the target secretly in the market (by doing that it
may get around the problem of shareholders’ reluctance to tender their shares)
a law may stipulate that above some limits (e.g. 10 %) the intention to acquire a larger
stake in a company must be made public
freeze-out merge
law allows the acquiring company to freeze existing shareholders out of the gains by
forcing non-tendering shareholders to sell them shares for the tender offer price
in case of successful takeover non-tendering shareholders lose their shares because the
target company no longer exists, in compensation they have right to receive the
tender offer for their shares
if tender price is higher than the pre-merger price the law recognizes the offer as fair
value
existing shareholder have little reason to oppose the bid; if tender succeeds they get the
tender price anyway and if tender fails they forgo the offered gain
acquirer need not make an all-cash offer, it can use shares of its own stock to pay for the
acquisition
competition
despite freeze-out and leveraged buyout most of the value still appears to accrue to the
target shareholders
the reason is competition that exists in the takeover; if a significant gain exists other
potential acquirers may submit their own bids (the result is effectively an auction in
which the target is sold to the highest bidder)
bidding war may not even result because an acquirer offered a large enough initial
premium to forestall the overbidding process
3. Stock-swap transaction
merger can be settled as cash transaction (the bidder pays for the target in cash) or as
stock-swap transaction (bidder pays by issuing new stock and gives it to the target
shareholders
8/19/2019 03 Corporate Finance III
http://slidepdf.com/reader/full/03-corporate-finance-iii 9/24
9
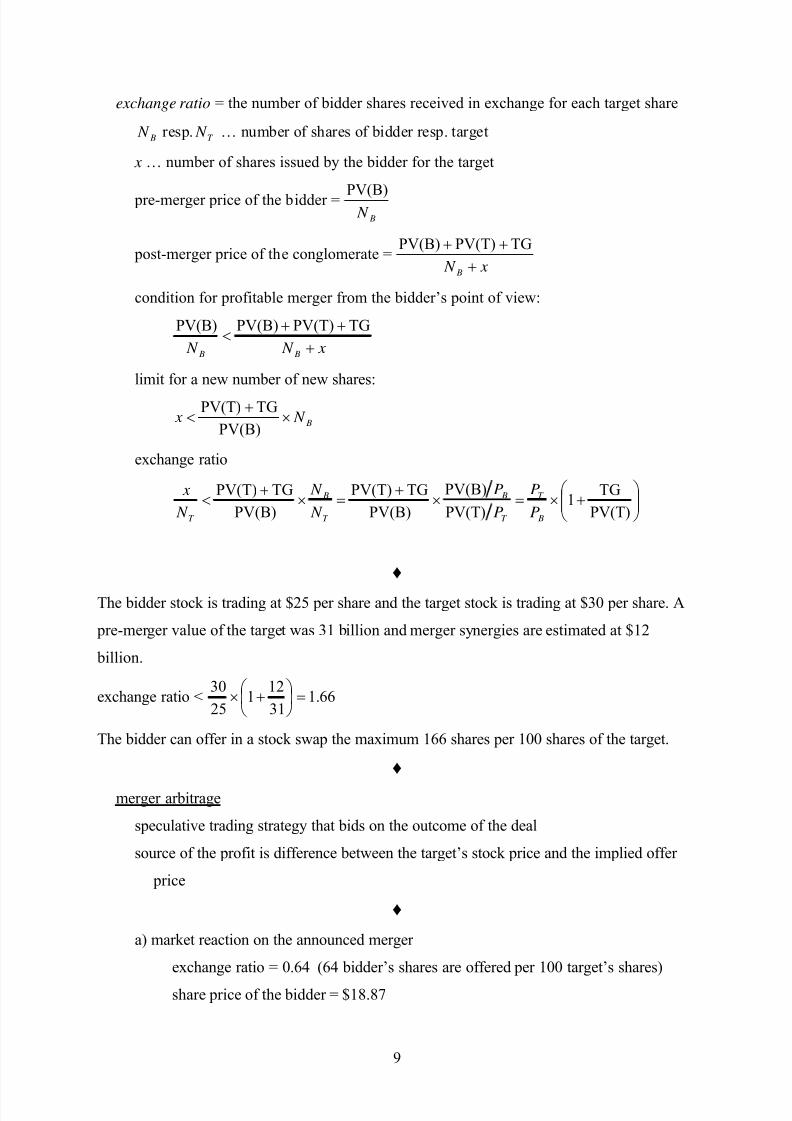
exchange ratio = the number of bidder shares received in exchange for each target share
T B N N resp. … number of shares of bidder resp. target
x … number of shares issued by the bidder for the target
pre-merger price of the bidder = B N
PV(B)
post-merger price of the conglomerate = x N B +
++ TGPV(T)PV(B)
condition for profitable merger from the bidder’s point of view:
x N N B B +
++<
TGPV(T)PV(B)PV(B)
limit for a new number of new shares:
B N x ×+
<PV(B)
TGPV(T)
exchange ratio
⎟⎟ ⎠
⎞⎜⎜⎝
⎛ +×=×
+=×
+<
PV(T)
TG1
PV(T)
PV(B)
PV(B)
TGPV(T)
PV(B)
TGPV(T)
B
T
T
B
T
B
T P
P
P
P
N
N
N
x
♦
The bidder stock is trading at $25 per share and the target stock is trading at $30 per share. A
pre-merger value of the target was 31 billion and merger synergies are estimated at $12
billion.
exchange ratio < 66.131
121
25
30=⎟
⎠
⎞⎜⎝
⎛ +×
The bidder can offer in a stock swap the maximum 166 shares per 100 shares of the target.
♦
merger arbitrage
speculative trading strategy that bids on the outcome of the deal
source of the profit is difference between the target’s stock price and the implied offer
price
♦
a) market reaction on the announced merger
exchange ratio = 0.64 (64 bidder’s shares are offered per 100 target’s shares)
share price of the bidder = $18.87

8/19/2019 03 Corporate Finance III
http://slidepdf.com/reader/full/03-corporate-finance-iii 10/24
10
share price of the target = $11.08
merger spread = 09968.008.11187.1864.0 >=×−× share price of the target
is undervalued
b) opening speculative position
short sale of 64 bidder’s shares cash inflow 68.1207$87.1864 =×
purchase of 100 target’s shares cash outflow 1108$08.11100 =×
if merger succeeds than speculator can swap 100 target’s shares for 64 bidder’s
shares and cover the short sale position
total profit = 1207.68 – 1108 = $99.68 per transaction
c) market reaction on cancelling the merger
share price of the bidder = $19.81
share price of the target = $8.50
speculator sells 100 target’s shares cash inflow 850$50.8100 =×
speculator buys 64 bidder’s shares in order to close short position cash outflow
84.1267$81.1964 =×
total loss = 1267.84 – 850 = 417.84
♦
4. Takeover defences
proxy fight = in hostile takeover the acquirer attempts to convince target shareholders to
unseat the target’s board of directors by using their proxy votes to support the
acquirers candidates
target’s reasons to oppose takeover
- the target might legitimately believe that the offer price is too low or that the
raider’s shares are overvalued (in case of swap transaction)
- self interest of managers if bidder plans complete change of leadership in
corporation
target company has a number of defensive strategies that enable to stop the bidder or
make the takeover prohibitively expensive
poison pills
articles of incorporation that give existing target shareholders the right to buy shares in
the target or the bidder at a deeply discounted price once certain conditions are met
8/19/2019 03 Corporate Finance III
http://slidepdf.com/reader/full/03-corporate-finance-iii 11/24
11
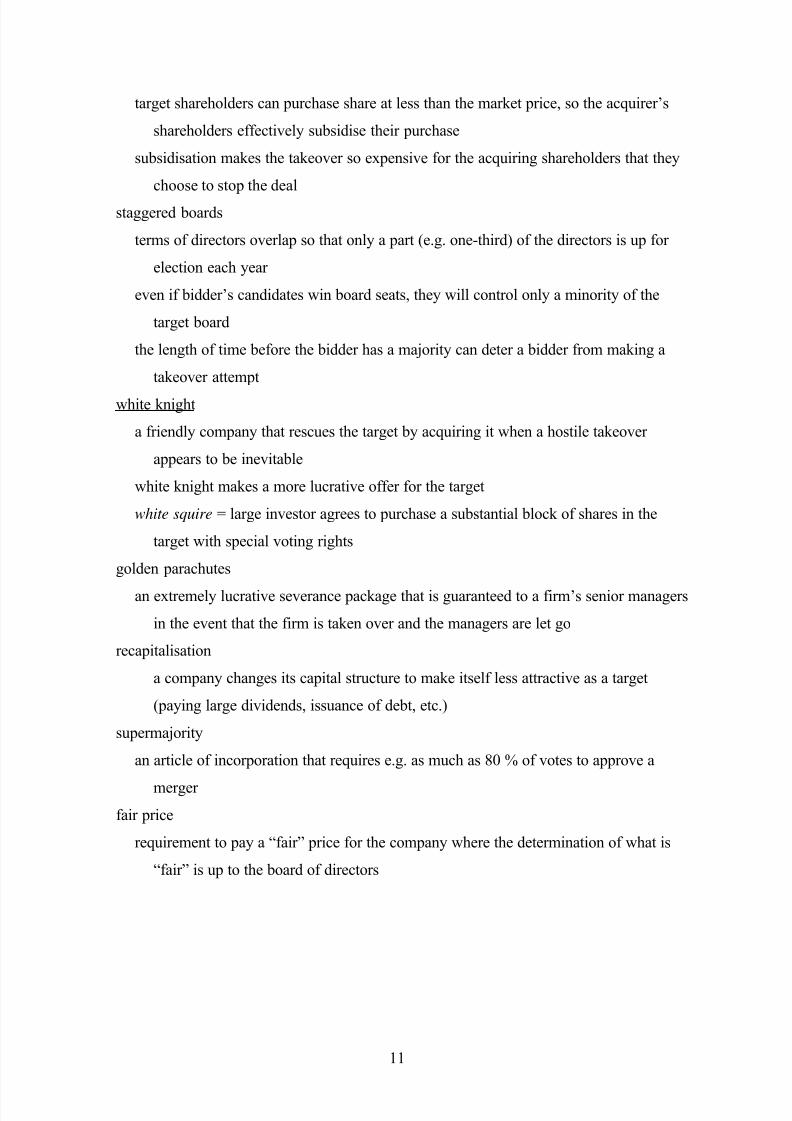
target shareholders can purchase share at less than the market price, so the acquirer’s
shareholders effectively subsidise their purchase
subsidisation makes the takeover so expensive for the acquiring shareholders that they
choose to stop the deal
staggered boards
terms of directors overlap so that only a part (e.g. one-third) of the directors is up for
election each year
even if bidder’s candidates win board seats, they will control only a minority of the
target board
the length of time before the bidder has a majority can deter a bidder from making a
takeover attempt
white knight
a friendly company that rescues the target by acquiring it when a hostile takeover
appears to be inevitable
white knight makes a more lucrative offer for the target
white squire = large investor agrees to purchase a substantial block of shares in the
target with special voting rights
golden parachutes
an extremely lucrative severance package that is guaranteed to a firm’s senior managers
in the event that the firm is taken over and the managers are let go
recapitalisation
a company changes its capital structure to make itself less attractive as a target
(paying large dividends, issuance of debt, etc.)
supermajority
an article of incorporation that requires e.g. as much as 80 % of votes to approve a
merger
fair price
requirement to pay a “fair” price for the company where the determination of what is
“fair” is up to the board of directors

8/19/2019 03 Corporate Finance III
http://slidepdf.com/reader/full/03-corporate-finance-iii 12/24
12
X. CAPITAL BUDGETING
capital budgeting is the process of analysing investment opportunities and deciding which
ones to accept
steps: - forecasting the project’s all future consequences for the firm (incremental cash
flow)
- computing the project’s NPV with an appropriate discount rate
- assessing uncertainties inherent in forecasted variables
1. Incremental free cash flow
Incremental FCF = Gross profit [Revenue – Cost]
– Taxes [(Gross profit – Depreciation) cτ × ]
– Capital expenditure
– Increase in net working capital
= (Revenue – Cost) )1( cτ −× – CapEx + ×cτ Dep – Increase ∆ NWC
= (Revenue – Cost – Dep) )1( cτ −× – CapEx + Dep – ∆ NWC
Earning before interest and taxes (EBIT) = (Revenue – Cost – Depreciation)
Unlevered net income = EBIT )1( cτ −×
(Increase in NWC)t = NWCt – NWCt-1
Net working capital = Current assets – Current liabilities
= Cash + Inventory + Receivables – Payables
0 1 2 3 4 5
Direct sales 26000 26000 26000 26000
Sales externalities -2500 -2500 -2500 -2500Direct cost -11000 -11000 -11000 -11000
Cost externalities 1500 1500 1500 1500
Gross profit 14000 14000 14000 14000
R&D and other cost -15000 -2800 -2800 -2800 -2800
Opportunity cost -200 -200 -200 -200
Depreciation -1500 -1500 -1500 -1500 -1500
EBIT -15000 9500 9500 9500 9500 -1500

8/19/2019 03 Corporate Finance III
http://slidepdf.com/reader/full/03-corporate-finance-iii 13/24
13
Income tax (40 %) 6000 -3800 -3800 -3800 -3800 600
Unlevered net income -9000 5700 5700 5700 5700 -900
Cash requirements 0 0 0 0
Inventory 0 0 0 0
Receivables 3525 3525 3525 3525
Payables -1425 -1425 -1425 -1425
Net working capital 2100 2100 2100 2100
Increase in NWC (–) -2100 0 0 2100
Depreciation (+) 1500 1500 1500 1500 1500
Cap. expenditure (–) -7500 0 0 0 0
Unlevered net income -9000 5700 5700 5700 5700 -900
Free cash flow -16500 5100 7200 7200 7200 2700
Comments:
Direct sales: The forecast of volume of goods sold at a given selling price.
Sales externalities: Indirect effects of the project that may increase or decrease the
profits of other business activities of the firm. Cannibalisation is referred to the
situation when sales of a new product displace sales of an existing product.Direct cost: Operating expenditure on produced goods (raw materials, intermediate
goods, wages, etc.)
Cost externalities: Reduction in direct production cost of goods replaced by the project’s
good.
R&D and other cost: The project requires an initial outlay on development of the
product. Other cost induced marketing, sale support, administration etc.
Opportunity cost: The lost value from company’s own resources that cannot be used in
other projects because they are tied up in given project (e.g. foregone rent if the
production of project’s good is located in the firm’s warehouse)
Depreciation: The firm uses a straight-line depreciation method. The last charge is
brought to book in the fifth year.
Income tax: As long as the firm earns taxable income from other activities, the project’s
losses lower the tax base. The project should be credited by this tax savings.
8/19/2019 03 Corporate Finance III
http://slidepdf.com/reader/full/03-corporate-finance-iii 14/24
14
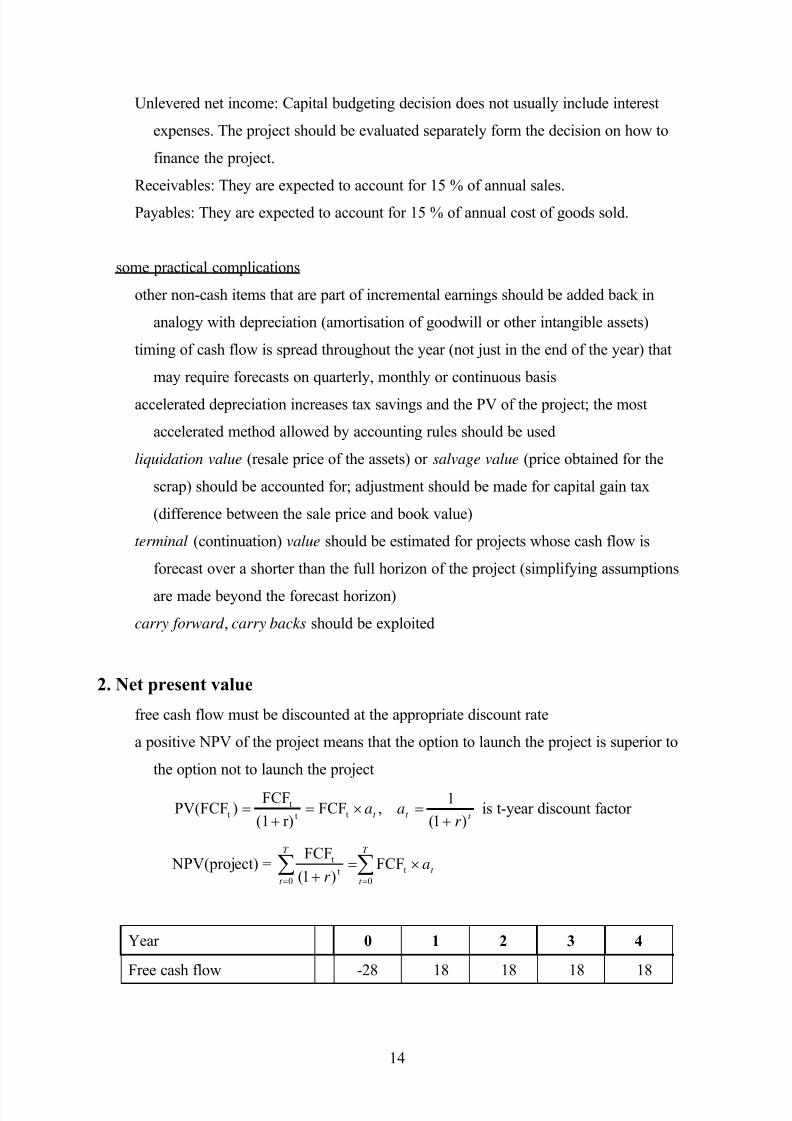
Unlevered net income: Capital budgeting decision does not usually include interest
expenses. The project should be evaluated separately form the decision on how to
finance the project.
Receivables: They are expected to account for 15 % of annual sales.
Payables: They are expected to account for 15 % of annual cost of goods sold.
some practical complications
other non-cash items that are part of incremental earnings should be added back in
analogy with depreciation (amortisation of goodwill or other intangible assets)
timing of cash flow is spread throughout the year (not just in the end of the year) that
may require forecasts on quarterly, monthly or continuous basis
accelerated depreciation increases tax savings and the PV of the project; the most
accelerated method allowed by accounting rules should be used
liquidation value (resale price of the assets) or salvage value (price obtained for the
scrap) should be accounted for; adjustment should be made for capital gain tax
(difference between the sale price and book value)
terminal (continuation) value should be estimated for projects whose cash flow is
forecast over a shorter than the full horizon of the project (simplifying assumptions
are made beyond the forecast horizon)
carry forward , carry backs should be exploited
2. Net present value
free cash flow must be discounted at the appropriate discount rate
a positive NPV of the project means that the option to launch the project is superior to
the option not to launch the project
t t t r
aa)1(
1,FCF
r)(1
FCF)PV(FCF tt
tt
+=×=
+= is t-year discount factor
NPV(project) = ∑∑==
×=+
T
t
t
T
t
ar 0
t
0t
t FCF)1(
FCF
Year 0 1 2 3 4
Free cash flow -28 18 18 18 18

8/19/2019 03 Corporate Finance III
http://slidepdf.com/reader/full/03-corporate-finance-iii 15/24
8/19/2019 03 Corporate Finance III
http://slidepdf.com/reader/full/03-corporate-finance-iii 16/24
16
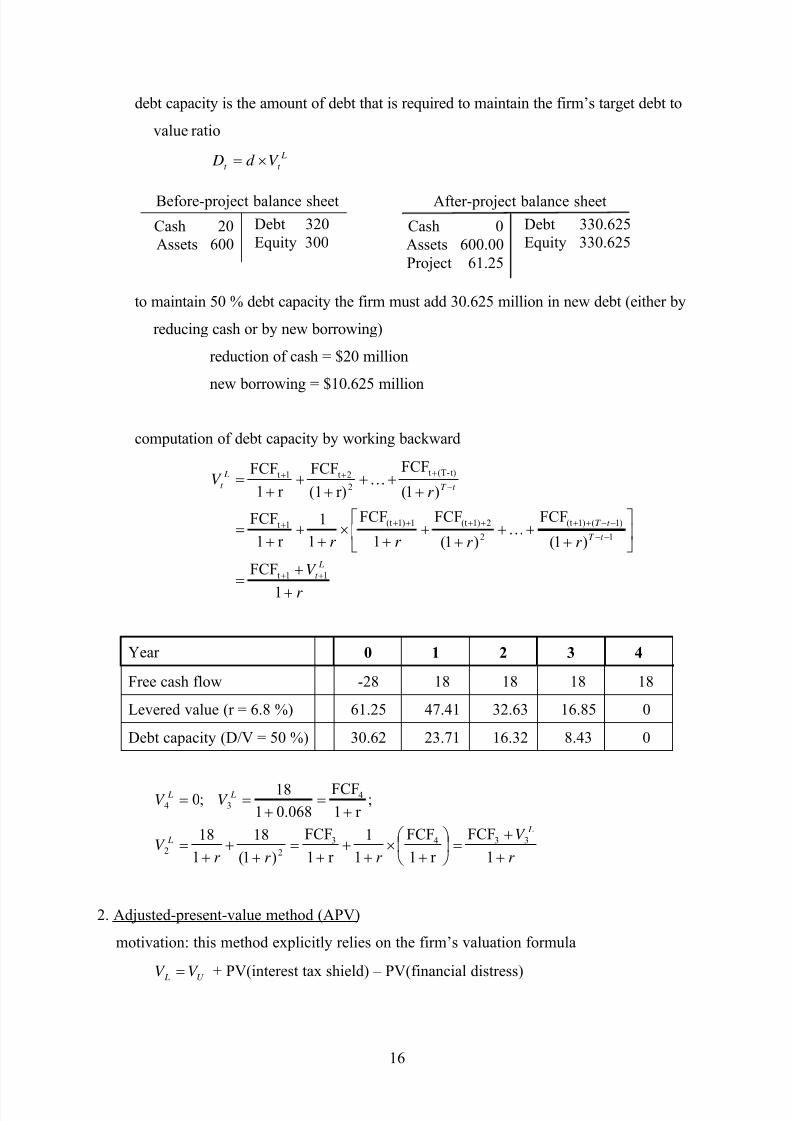
debt capacity is the amount of debt that is required to maintain the firm’s target debt to
value ratio
L
t t V d D ×=
to maintain 50 % debt capacity the firm must add 30.625 million in new debt (either by
reducing cash or by new borrowing)
reduction of cash = $20 million
new borrowing = $10.625 million
computation of debt capacity by working backward
r
V
r r r r
r V
L
t
t T
t T
t T
L
t
+
+=
⎥⎦
⎤⎢⎣
⎡
+++
++
+×
++
+=
+++
++
+=
++
−−
−−+++++++
−
+++
1
FCF
)1(
FCF
)1(
FCF
1
FCF
1
1
r 1
FCF
)1(
FCF
r)(1
FCF
r 1
FCF
11t
1
)1()1(t
2
2)1(t1)1(t1t
t)-(Tt
2
2t1t
K
K
Year 0 1 2 3 4
Free cash flow -28 18 18 18 18
Levered value (r = 6.8 %) 61.25 47.41 32.63 16.85 0
Debt capacity (D/V = 50 %) 30.62 23.71 16.32 8.43 0
r
V
r r r V
V V
L
L
L L
+
+=⎟
⎠
⎞⎜⎝
⎛
+×
++
+=
++
+=
+=
+==
1
FCF
r 1
FCF
1
1
r 1
FCF
)1(
18
1
18
;r 1
FCF
068.01
18;0
3343
22
434
2. Adjusted-present-value method (APV)
motivation: this method explicitly relies on the firm’s valuation formula
U L V V = + PV(interest tax shield) – PV(financial distress)
Debt 320Equity 300
Cash 20Assets 600
Before-project balance sheet
Debt 330.625Equity 330.625
Cash 0Assets 600.00Project 61.25
After-project balance sheet

8/19/2019 03 Corporate Finance III
http://slidepdf.com/reader/full/03-corporate-finance-iii 17/24
17
steps: 1. Determine the project’s value without leverage by discounting its FCF at the
unlevered cost of capital
2. determine the present value of the interest tax shield
3. Add the unlevered value of the project to the present valued of the tax shield to
determine the levered value of the project
if the project has similar risk to other firm’s investment, its unlevered cost of capital is the
same as for the firm as a whole
pre-tax WACC = E D r
D E
E r
E D
D×
++×
+
%0.8%105.0%65.0 =×+×=U r
million62.59$)08.01(
184
1
=+
= ∑=t
t U V
interest paid in year t = 1−× t D Dr
interest tax shield in year t = 1−×× t Dc Dr τ
Year 0 1 2 3 4
Debt capacity 30.62 23.71 16.32 8.43 0
Interest paid (r = 6.0 %) 0 1.84 1.42 0.98 0.51
Tax shield (τ = 40 %) 0 0.73 0.57 0.39 0.20
if future interest tax shields have similar risk to the project’s cash flow, they should be
discounted as the project’s unlevered cost of capital (maintaining a target leverage ratio
satisfies this condition)
PV(tax shield) = 63.1$08.120.0
08.139.0
08.157.0
08.173.0 432 =+++ million
NPV of the project = 59.62 +1.63 – 28 = $33.25
3. Flow-to-equity method (FTE)
motivation: this method explicitly calculates the free cash flow available to equity holders
taking into account all payments to and from debtholders
the firm’s projects should maximise the shareholders’ wealth

8/19/2019 03 Corporate Finance III
http://slidepdf.com/reader/full/03-corporate-finance-iii 18/24
18
steps: 1. Determine the free cash flow to equity that is the free cash flow net of borrowing
and interest payments
2. Determine the equity cost of capital
3. Compute the equity value by discounting the free cash flow to equity using the
equity cost of capital
Year 0 1 2 3 4
Free cash flow -28 18 18 18 18
Interest paid (r = 6.0 %) 0 -1.84 -1.42 -0.98 -0.51
Tax shield (τ = 40 %) 0 0.73 0.57 0.39 0.20
After-tax interest expense 0 -1.11 -0.85 -0.59 -0.31 Net borrowing 30.62 -6.91 -7.39 -7.89 -8.43
Flow to equity 2.62 9.98 9.76 9.52 9.26
After-tax interest expense = Interest paid – Tax shield
Net borrowing at date t = Debt capacity at t minus Debt capacity at t -1
Flow to equity = Free cash flow + After-tax interest expense + Net borrowing
NPV of the project = 25.33$1.1
26.9
1.1
52.9
1.1
76.9
1.1
98.9
62.2 432 =++++ million
3. Assessing uncertainty
break-even analysis
analysis that finds a level of analysed variable for which the project has an NPV of
zero (e.g. discount rate, selling price, etc.)
the difference between the forecasted values and break-even values reveal how much
error it would take to change the investment decision
sensitivity analysis
analysis that shows how the NPV varies as the underlying assumptions change
one can learn which assumptions are the most important and which aspects of the
project are most critical
estimations of worst-case and best-case assumptions for key variables
scenario analysis
analysis that considers the effect on NPV of changing multiple project parameters

8/19/2019 03 Corporate Finance III
http://slidepdf.com/reader/full/03-corporate-finance-iii 19/24
19
XI. REAL OPTIONS
financial option = the right to buy or sell a traded asset
real option = the right to take a particular business decision (investment specific decisions
that make impossible to present a general theory)
important examples:
- waiting option (a firm can choose the optimal time to commit to an investment)
- growth option (by undertaking the project a firm gets the opportunity to invest in
new projects)
- abandonment option (a firm can drop the project if it turns out to be unsuccessful)
1. Decision tree analysisdecision tree = a graphical representation of the future decisions and possible states of the
world
decision nodes (■) = a decision-maker must decide which branch to follow (under the
control)
information nodes (●) = a decision-maker incorporates uncertainty that influences the
outcome (out of the control)
value of real option can be computed by comparing expected profit without the option to
the expected profit with the option
25 %
75 %
-$100
$0
$0
$1500
-$500
$0
■
■
■
●

8/19/2019 03 Corporate Finance III
http://slidepdf.com/reader/full/03-corporate-finance-iii 20/24
20
2. The waiting option
benefits of the option to wait (postpone decision): learning more about the likely business
environment (the plan can be cancelled if the business climate deteriorates, start-up
costs may change, etc.)
♦
cost of starting the business = $5 million (both now or in one year)
yearly profit = $0.6 millionaverage growth rate of cash flow = 2 % per year
cost of capital = 12 %
present value of future cash flow (formula for growing perpetuity)
million6$02.012.0
6.0PV =
−=
NPV of the project without the option to wait
NPV = 6 – 5 = $1 million
the possibility to delay decision to start the project is equivalent to the European call option
paying a dividend
pay-off if conditions are favourable = 511 −=− S X S
pay-off if conditions are unfavourable = 0
risk-free rate (r ) = 5 %
strike price ( X ) = $5 million, PV( X ) = 5/(1+0.5) (discounted at risk-free interest rate)
current market price (S ) = $6 million
INVEST
BAD
GOOD
STOP
STOP
NPV of ro ect in 1 ear
NPV of project now
WAIT
START
■
■
●
)0,5max( 1 −= S C
8/19/2019 03 Corporate Finance III
http://slidepdf.com/reader/full/03-corporate-finance-iii 21/24
21
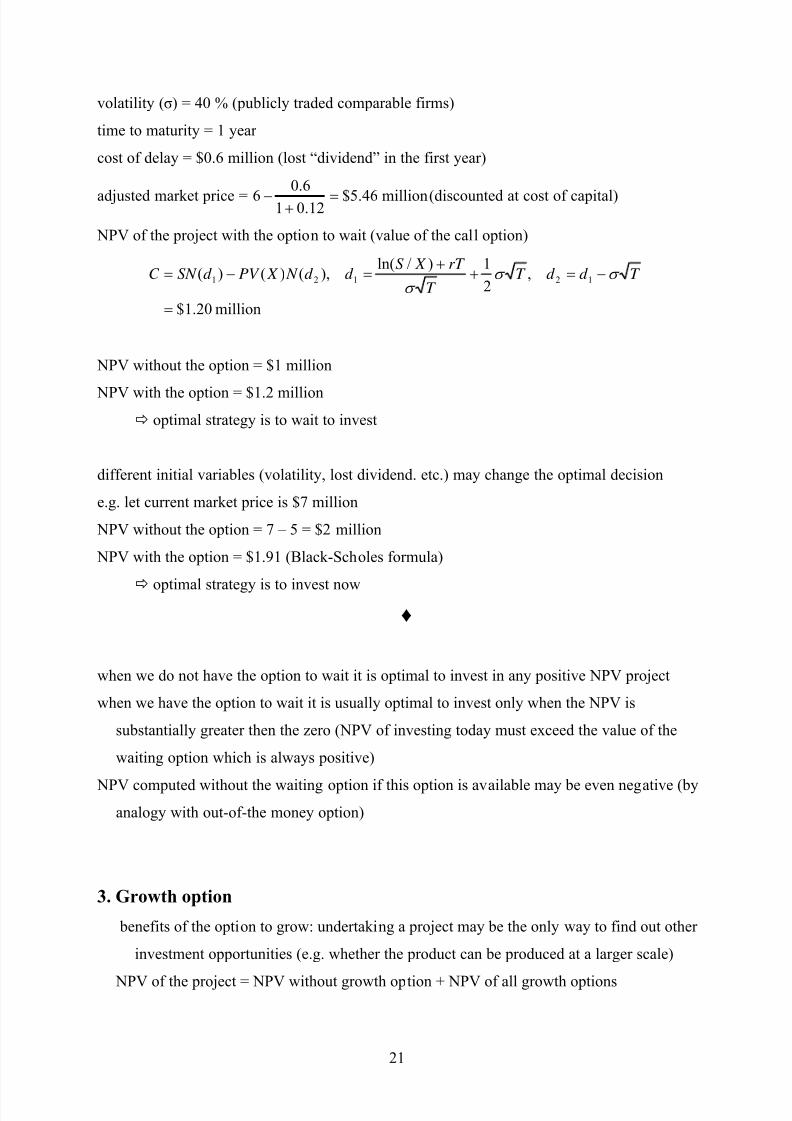
volatility (σ) = 40 % (publicly traded comparable firms)
time to maturity = 1 year
cost of delay = $0.6 million (lost “dividend” in the first year)
adjusted market price = million46.5$12.01
6.06 =+− (discounted at cost of capital)
NPV of the project with the option to wait (value of the call option)
million20.1$
,2
1)/ln(),()()( 12121
=
−=++
=−= T d d T T
rT X S d d N X PV d SN C σ σ
σ
NPV without the option = $1 million
NPV with the option = $1.2 million
optimal strategy is to wait to invest
different initial variables (volatility, lost dividend. etc.) may change the optimal decision
e.g. let current market price is $7 million
NPV without the option = 7 – 5 = $2 million
NPV with the option = $1.91 (Black-Scholes formula)
optimal strategy is to invest now
♦
when we do not have the option to wait it is optimal to invest in any positive NPV project
when we have the option to wait it is usually optimal to invest only when the NPV is
substantially greater then the zero (NPV of investing today must exceed the value of the
waiting option which is always positive)
NPV computed without the waiting option if this option is available may be even negative (by
analogy with out-of-the money option)
3. Growth option
benefits of the option to grow: undertaking a project may be the only way to find out other
investment opportunities (e.g. whether the product can be produced at a larger scale)
NPV of the project = NPV without growth option + NPV of all growth options

8/19/2019 03 Corporate Finance III
http://slidepdf.com/reader/full/03-corporate-finance-iii 22/24
22
♦
investment expenditure = $10 million
yearly earning = $1 million
risk-free interest rate = 6 %
risk-neutral probability = 50 % (probability that the project will generate $1 million in
perpetuity, otherwise it will generate nothing)
NPV of the project without growth option (should not be realised)
0006671$million1006.0
500000million10
)06.01(
million105.0 NPV
1
−=−=−+
×= ∑∞
=t t
NPV of doubling the project after one year
0006676$million1006.0
million1million10
)06.01(
million1 NPV
1
=−=−+
= ∑∞
=t t
present value of growth option (using risk-neutral probabilities)
0001453$06.01
66670005.0
PV =+
×
=
NPV of the project with growth option (should be realised)
0004781$31450001667000 NPV =+−=
♦
memo: risk-neutral probabilities are adjusted probabilities that make the expected return from
risky financial instrument equal to the risk-free interest rate
r
C C C
d u
+
×−+×
= 1
)1( ρ ρ
FAILURE
SUCCESS
SAME SIZE
SAME SIZE
DOUBLE SIZE
INVEST
DON’T INVEST
■
■
●
8/19/2019 03 Corporate Finance III
http://slidepdf.com/reader/full/03-corporate-finance-iii 23/24
23
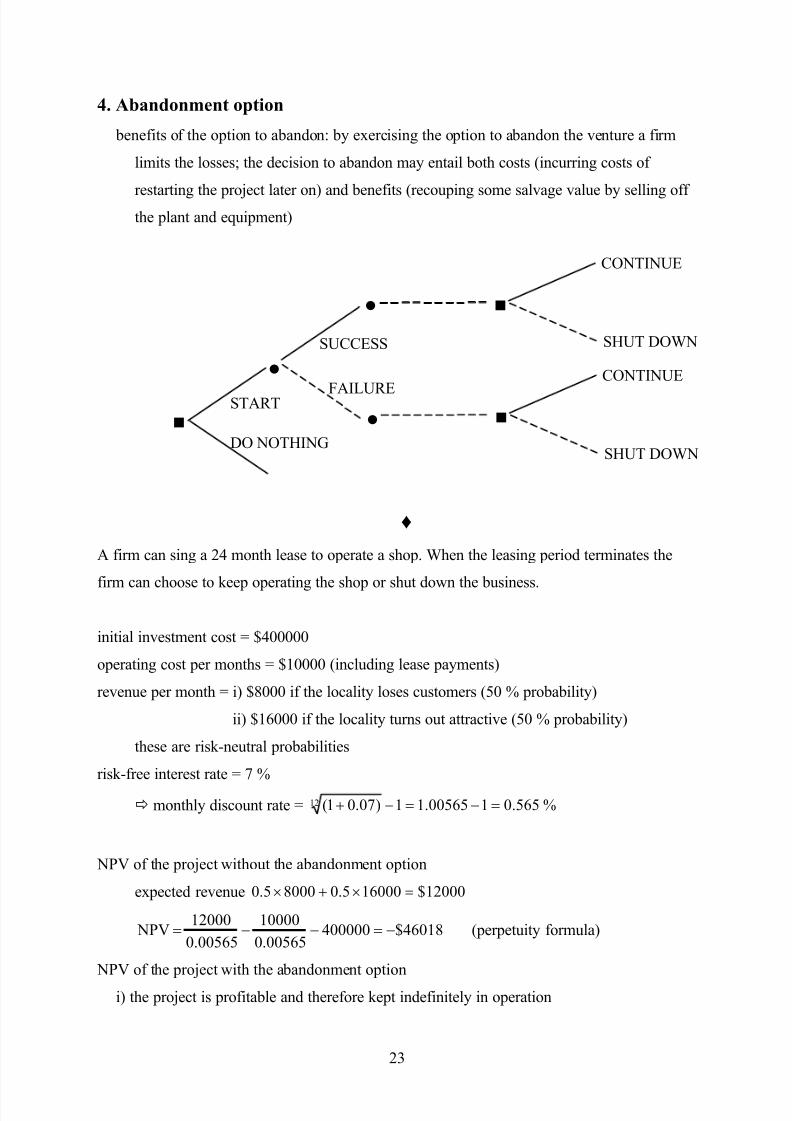
4. Abandonment option
benefits of the option to abandon: by exercising the option to abandon the venture a firm
limits the losses; the decision to abandon may entail both costs (incurring costs of
restarting the project later on) and benefits (recouping some salvage value by selling offthe plant and equipment)
♦
A firm can sing a 24 month lease to operate a shop. When the leasing period terminates the
firm can choose to keep operating the shop or shut down the business.
initial investment cost = $400000
operating cost per months = $10000 (including lease payments)
revenue per month = i) $8000 if the locality loses customers (50 % probability)
ii) $16000 if the locality turns out attractive (50 % probability)
these are risk-neutral probabilities
risk-free interest rate = 7 %
monthly discount rate = %565.0100565.11)07.01(12 =−=−+
NPV of the project without the abandonment option
expected revenue 12000$160005.080005.0 =×+×
46018$40000000565.0
10000
0.00565
12000 NPV −=−−= (perpetuity formula)
NPV of the project with the abandonment option
i) the project is profitable and therefore kept indefinitely in operation
●
SHUT DOWN
CONTINUE
■
●
●
FAILURE
SUCCESS SHUT DOWN
CONTINUE
START
DO NOTHING
■
■
8/19/2019 03 Corporate Finance III
http://slidepdf.com/reader/full/03-corporate-finance-iii 24/24
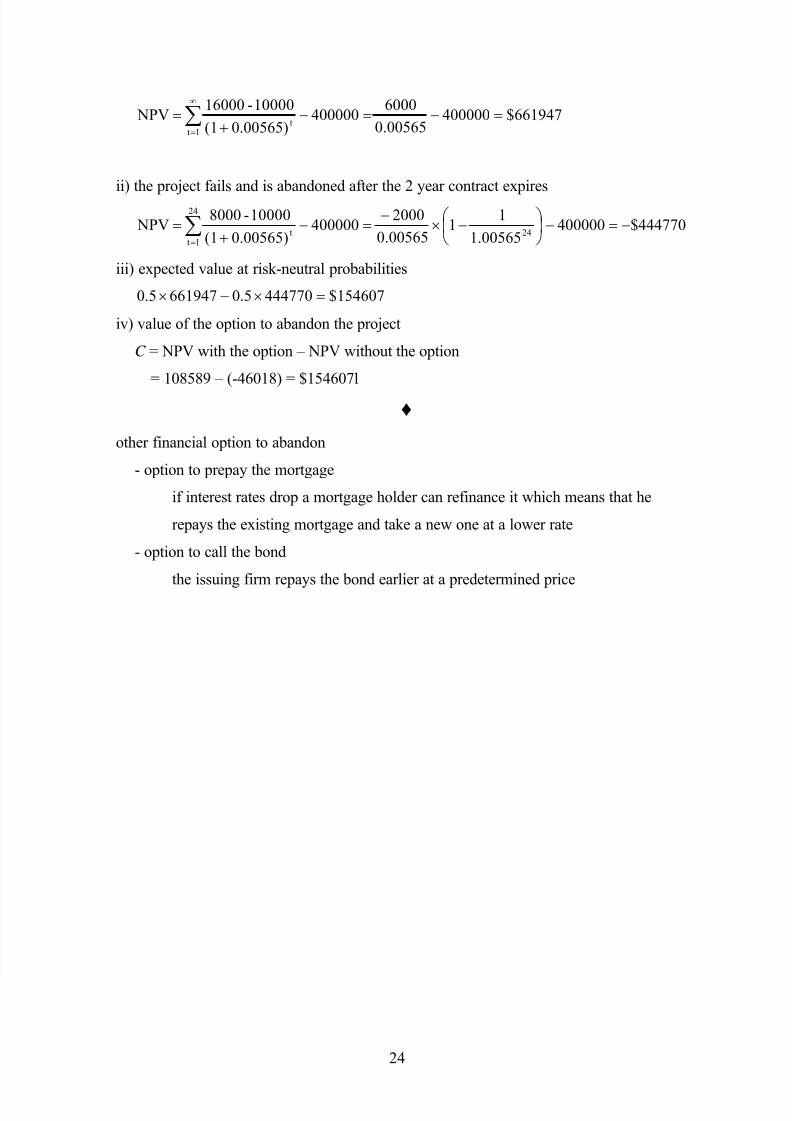
661947$40000000565.0
6000400000
0.00565)(1
10000-16000 NPV
1tt
=−=−+
=∑∞
=
ii) the project fails and is abandoned after the 2 year contract expires
444770$40000000565.1
11
00565.0
2000400000
0.00565)(1
10000-8000 NPV
24
24
1tt
−=−⎟ ⎠
⎞⎜⎝
⎛ −×
−=−
+=∑
=
iii) expected value at risk-neutral probabilities
154607$4447705.06619475.0 =×−×
iv) value of the option to abandon the project
C = NPV with the option – NPV without the option
= 108589 – (-46018) = $154607l
♦
other financial option to abandon
- option to prepay the mortgage
if interest rates drop a mortgage holder can refinance it which means that he
repays the existing mortgage and take a new one at a lower rate
- option to call the bond
the issuing firm repays the bond earlier at a predetermined price