
03 2015€¦ · roots in fundamental analysis but has also become popular as a systemat- ... (e.g....
30
The Discussion Note series provides analysis which may form relevant back- ground for Norges Bank Investment Management’s investment strategy and advice to the asset owner. Any views expressed in the Discussion Notes are not necessarily held by our organisation. The series is written by employees, and is informed by our investment research and our experience as a large, long-term asset manager. [email protected] www.nbim.no Date 02/12/2015 ISSN 1893-966X Quality-based investment strategies aim to capture the documented excess returns of high-quality stocks over low-quality stocks. In this note, we review the empirical evidence on the quality premium and discuss some of the explanations that researchers have put forward for the effect. THE QUALITY FACTOR DISCUSSION NOTE 03 2015
Transcript of 03 2015€¦ · roots in fundamental analysis but has also become popular as a systemat- ... (e.g....

The Discussion Note series provides analysis which may form relevant back-ground for Norges Bank Investment Management’s investment strategy and advice to the asset owner. Any views expressed in the Discussion Notes are not necessarily held by our organisation. The series is written by employees, and is informed by our investment research and our experience as a large, long-term asset manager.
Date 02/12/2015ISSN 1893-966X
Quality-based investment strategies aim to capture the documented excess returns of high-quality stocks over low-quality stocks. In this note, we review the empirical evidence on the quality premium and discuss some of the explanations that researchers have put forward for the effect.
THE QUALITY FACTORDISCUSSION NOTE
03 2015

2
THE QUALITY FACTOR
NORGES BANK INVESTMENT MANAGEMENT / DISCUSSION NOTE
SUMMARY
• Quality-based investment strategies aim to capture the documented ex-cess returns of high-quality stocks over low-quality stocks. Quality has its roots in fundamental analysis but has also become popular as a systemat-ic investment style in recent years.
• Quality can be defined in a variety of ways. The most commonly used quality metrics fall into three categories: (1) profitability measured by gross profits over assets, operating profit, ROA, ROE or ROIC; (2) safety measured by a variety of solvency metrics such as debt/assets; and (3) earnings quality measured by differences between cash and accounting items (accruals). A quality company is one that is profitable and safe, and makes most of its earnings in cash.
• The outperformance of high-quality stocks over low-quality stocks is well-documented in financial research. The empirical evidence for the existence of a profitability premium is especially strong.
• We construct quality factor-mimicking portfolios from FTSE Global equity data based on gross profitability, ROE, leverage, ROE stability, cash flows to assets and EPS quality. We find statistically significant average returns for four of these factors, ranging from 5.3 to 8.4 percent per year.
• Quality performs well during market downturns and may offer some downside protection in bear markets.
• Quality also loads negatively on value and can provide some diversifica-tion benefits in a multi-factor portfolio setting.
• Some evidence exists that profitability is closely related to value and has significant power in explaining a range of earnings-related anomalies, pointing to a possible link between profitability and the cross section of expected returns. It is not clear, however, whether the quality premium constitutes compensation for non-diversifiable risk. Other dimensions of quality such as safety and low accruals are even more difficult to reconcile with systematic risk pricing.
THE QUALITY FACTOR
3
THE QUALITY FACTOR
NORGES BANK INVESTMENT MANAGEMENT / DISCUSSION NOTE
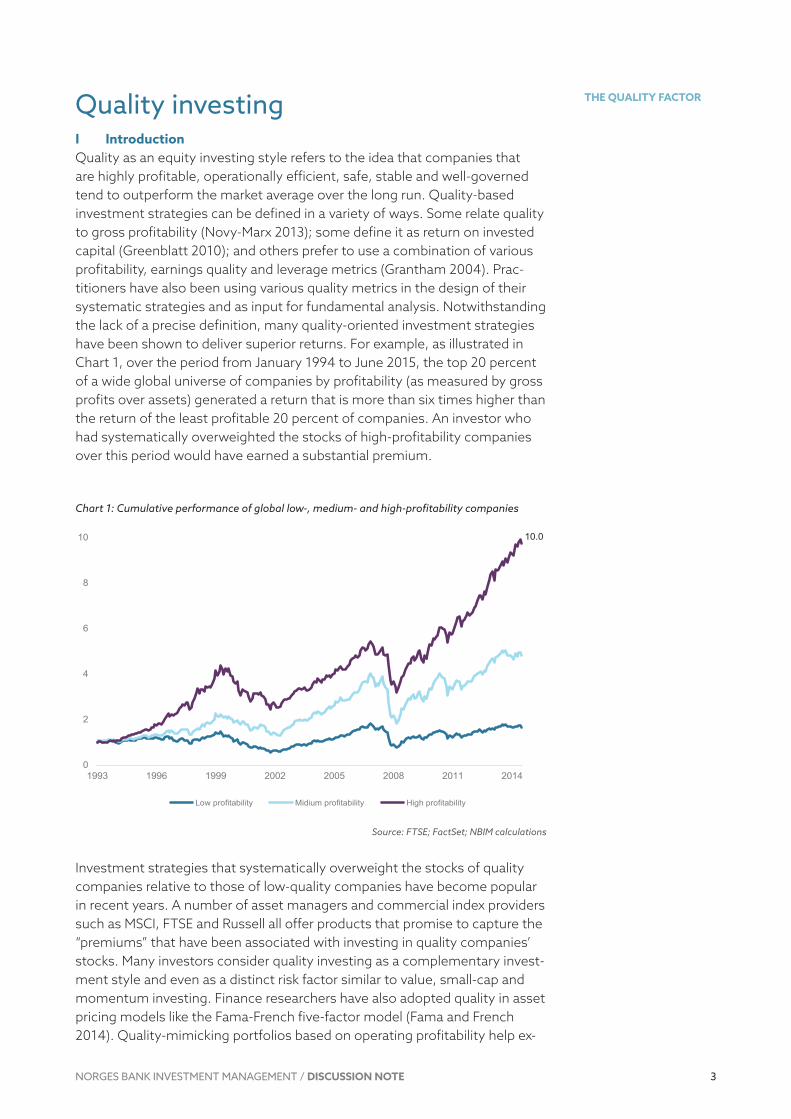
Quality investingI IntroductionQuality as an equity investing style refers to the idea that companies that are highly profitable, operationally efficient, safe, stable and well-governed tend to outperform the market average over the long run. Quality-based investment strategies can be defined in a variety of ways. Some relate quality to gross profitability (Novy-Marx 2013); some define it as return on invested capital (Greenblatt 2010); and others prefer to use a combination of various profitability, earnings quality and leverage metrics (Grantham 2004). Prac-titioners have also been using various quality metrics in the design of their systematic strategies and as input for fundamental analysis. Notwithstanding the lack of a precise definition, many quality-oriented investment strategies have been shown to deliver superior returns. For example, as illustrated in Chart 1, over the period from January 1994 to June 2015, the top 20 percent of a wide global universe of companies by profitability (as measured by gross profits over assets) generated a return that is more than six times higher than the return of the least profitable 20 percent of companies. An investor who had systematically overweighted the stocks of high-profitability companies over this period would have earned a substantial premium.
Chart 1: Cumulative performance of global low-, medium- and high-profitability companies
Source: FTSE; FactSet; NBIM calculations
Investment strategies that systematically overweight the stocks of quality companies relative to those of low-quality companies have become popular in recent years. A number of asset managers and commercial index providers such as MSCI, FTSE and Russell all offer products that promise to capture the “premiums” that have been associated with investing in quality companies’ stocks. Many investors consider quality investing as a complementary invest-ment style and even as a distinct risk factor similar to value, small-cap and momentum investing. Finance researchers have also adopted quality in asset pricing models like the Fama-French five-factor model (Fama and French 2014). Quality-mimicking portfolios based on operating profitability help ex-
Chart 1: Cumulative performance of global low-, medium- and high-profitability companies
0
2
4
6
8
10
12
1993 1996 1999 2002 2005 2008 2011 2014
Low profitability Midium profitability High profitability
10.0

4
THE QUALITY FACTOR
NORGES BANK INVESTMENT MANAGEMENT / DISCUSSION NOTE
plain a larger proportion of the cross-sectional variation in equity returns than the traditional market, value and size factors alone (Fama and French 2014).
The idea of investing in high-quality stocks is not a new one. Benjamin Gra-ham, an early pioneer of value investing, believed that quality and value went hand in hand (Graham 1973). Graham’s strategy is to identify undervalued and underappreciated stocks that meet certain criteria for quality. Graham considered metrics such as debt ratios, earnings stability, past earnings and dividend growth to be as important as value metrics such as price-to-earnings and price-to-book ratios for selecting stocks. Identifying mispriced high-quality assets is still central to fundamental stock analysis and underlies much of the asset management industry.
Despite the pervasiveness and economic significance of quality investment strategies, little research has tried to explain why quality premiums exist in the first place. In theory, quality stocks should command higher prices; they should not necessarily command higher risk-adjusted returns. As Asness et al. (2014) point out, investors should be willing to pay a higher price for companies with quality characteristics, as these companies tend to have higher expected cash flows, all else equal. However, the empirical evidence suggests that quality may not be fully priced in the cross section, and quality stocks therefore appear to generate excess risk-adjusted returns. As with oth-er market anomalies, this premium may be due to a variety of factors, includ-ing statistical and measurement errors, inadequate risk models, behavioural biases and institutional constraints.
In this note, we outline the existing evidence on the quality premium with a particular focus on the question of whether it constitutes a systematic risk factor suitable for a long-term investor. In particular, we (1) discuss the differ-ent definitions of quality and document the existence of quality premiums in different markets and over time; (2) discuss potential justifications for this empirical observation, including risk-based and behavioural explanations; and (3) examine the relationship between quality and other factor premiums such as value, momentum and size. Finally, we derive conclusions about the risk/return profile of the quality premium and its place in a systematic investment strategy.
II Empirical evidence for the quality premiuma Defining qualityQuality investing can be defined in a variety of ways but is typically associ-ated with buying profitable companies with low leverage and stable earn-ings. Quality is rooted in fundamental analysis and makes use of a variety of financial data extracted from quarterly and annual company reports. In Table 1, we provide some examples of how researchers and practitioners measure quality. Definitions vary in complexity, ranging from simple, one-dimensional ones (e.g. return on equity) to multi-metric ones comprising a multitude of accounting ratios (e.g. Piotroski’s F-score). The most commonly used quality characteristics can be grouped into three main categories:
• Profitability: High-quality firms are often described as profitable firms. Profitability refers to a company’s ability to generate earnings as com-

5
THE QUALITY FACTOR
NORGES BANK INVESTMENT MANAGEMENT / DISCUSSION NOTE
pared to its expenses. It is usually measured by accounting ratios such as gross profits over assets, operating profits over assets, operating cash flows over assets and various net profit-based measures such as return on equity (ROE), return on assets (ROA), return on invested capital (ROIC) or return on capital employed (ROCE). These ratios provide different insights into the financial health of a company. For example, gross, operating and net profit margins indicate how well a company is managing its expenses, whereas ROE and ROA indicate how well the company is deploying its capital to generate returns. These ratios can be affected by accounting choices, especially the ones based on bottom-line profitability. Novy-Marx (2013) argues that gross profit is the cleanest accounting measure of true economic profitability because this measure is relatively unaffected by accounting estimates for accruals and non-cash expenses such as de-preciation and amortisation. On the other hand, index providers such as FTSE and MSCI prefer to use net profit-based metrics such as return on equity and return on assets, as net profit measures the profit that accrues to common shareholders as opposed to other stakeholders. Profitability ratios can also be affected by seasonality (e.g. retailers typically generate higher profits in Q4) and may not always be comparable across industries (e.g. assets of financial firms are different from assets of industrial firms). Profitability ratios can be further decomposed into various efficiency ra-tios that measure how well a company can convert its assets into profits.
• Safety: Quality companies are often described as safe and stable com-panies. Excessive leverage may jeopardise a company’s ability to service its debt and ultimately lead to financial distress. Safety is typically associ-ated with a strong balance sheet – low leverage (e.g. low debt-to-assets ratio), high current ratios (current assets to current liabilities), high interest coverage ratios and high credit ratings from debt rating agencies. As with other ratios calculated from accounting data, safety ratios can be affected by the choice of accounting method and can vary across industries and countries. In addition to the level, the change in these ratios can also be used as safety indicators (Asness et al. 2014). Some researchers also use return-based measures of safety such as stock volatility and market beta (Asness et al. 2014).
• Quality of earnings: Quality of earnings can refer to both earnings per-sistence (stability) and “accounting” quality. Earnings stability can be measured by the volatility of earnings per share (EPS) or EPS growth, as well as by the volatility of various profitability metrics such as ROE, ROA and ROIC. A stable and persistent stream of earnings can indicate that a company has a competitive advantage, above-average management and a dominant market position. Earnings stability can vary by industry and company age. Younger companies will typically have higher earnings vol-atility than older, more-established ones. A high-quality company is also one that derives most of its earnings from cash transactions rather than from accruals, as the latter are less likely to persist, and the company is more likely to suffer subsequent earnings disappointments (Sloan 1996). The level of accruals can be measured by the difference between cash and accounting profits scaled by assets (income statement accruals) or the level of accrued items on the balance sheet scaled by assets (balance

6
THE QUALITY FACTOR
NORGES BANK INVESTMENT MANAGEMENT / DISCUSSION NOTE
sheet accruals). Richardson et al. (2005) extend Sloan’s definition of ac-cruals to include changes in non-current accruals such as capital expendi-tures, property, plant and equipment, and intangibles. Beneish (1999) proposes a model-based metric (probability of manipulation, or M-score) based on forensic accounting principles to assess accounting quality.
Table 1: Examples of quality definitions
Author/Practioner Quality defnition
Novy-Marx (2013) Gross profits / assets
Fama and French (2014) Operating income before depreciation and amortisation minus interest expense scaled by assets
Greenblatt (2010) Return on invested capital (ROIC)
Sloan (1996) Difference between cash and accounting earnings scaled by assets (earnings quality)
Piotroski (2000) (1) Return on assets, (2) Operating income, (3) Cash flow, (4) Quality of earnings, (5) Net income, (6) Leverage, (7) Liquidity equity issuance, (8) Gross margins, (9) Asset turnover
Asness, Frazzini and Pedersen (2014)
Z-scores based on:• profitability: gross profits over assets, return on equity, return on assets, cash
flow over assets, gross margin, low accruals• growth: 5-year prior growth of profitability• safety: low beta, low idiosyncratic volatility, low leverage, low bankruptcy risk,
low ROE volatility• payout: equity and debt issuance and total net payout over profits
GMO white paper (2004) • ROE• Leverage• Profit volatility
Graham (1973) Adequate size of enterprise, sufficiently strong financial position, earnings stability, dividend record, earnings growth, moderate P/E and P/B ratios
FTSE Quality indices • Return on assets• Accruals• Operating cash flow to debt”
In addition to profitability, safety and earnings quality, some authors extend the definition of quality to changes in the firm’s capital structure (e.g. asset growth, equity issuance and dividend payouts). For example, Asness et al. (2014) provide a broad definition of quality based on the present value rela-tion:
In their framework, the four right-hand side variables of the equation form the basis of the definition of quality. Quality characteristics that should lead to higher stock valuations are the ones that increase the numerator or de-crease the denominator. Quality companies are then profitable companies: they pay out a larger percentage of their earnings to shareholders; they are considered safe by investors; and they have growing earnings. This broader definition of quality unifies many of the definitions in Table 1 and also adds a new dimension to quality in the form of dividend payout. Payout is measured as an amalgam of equity issuance, debt issuance and total net payout over profits.
In addition to financial measures of quality, some investors consider corpo-rate governance as yet another dimension of quality. Gompers, Ishii and Met-rick (2003) argue that the level of shareholder rights may be related to com-pany performance. They construct a “Governance Index” based on various company governance provisions that are perceived to increase or decrease shareholder rights. Provisions such as classified boards, management ability

7
THE QUALITY FACTOR
NORGES BANK INVESTMENT MANAGEMENT / DISCUSSION NOTE
to change the firm’s bylaws and replace directors, and anti-takeover clauses such as poison pills, golden parachutes and greenmail, allow management to resist shareholder activism and are therefore considered shareholder-un-friendly. Empirically, Gompers, Ishii and Metrick (2003) find some evidence that stronger shareholder rights may be positively related to company profit-ability and stock performance. However, as Bebchuk, Cohen and Wang (2013) show, this finding may not be robust. The positive association between corporate governance scores and abnormal stock returns seems to disappear for the period 2000-2008.
Given the multitude of definitions of quality proposed by researchers and practitioners, it is difficult to quantify the size of the “quality premium”. In the next section, we review some of the literature on the quality premium, focusing on the three financial dimensions of quality: profitability, safety and earnings quality. It remains an open question which of the various quality metrics are the “best” measures of quality and which of the quality character-istics may be priced in the cross section of expected returns.
b The quality anomalyLike many other stock return regularities, the quality premium was discov-ered from testing empirically the capital asset pricing model of Sharpe (1964), Lintner (1965) and Black (1972) and later the multifactor models of Fama and French (1992) and Carhart (1997). Empirical evidence gathered over the past 20 years suggests that portfolios sorted on profitability, earnings quality and safety have generated higher risk-adjusted returns relative to the market portfolio or a multi-factor model. The size of the premium varies depending on the metrics used, the time period and the geography of the sample under study, as well as the asset pricing model used to measure portfolio risk.
The evidence for the existence of a long-term profitability premium is espe-cially strong. Using data for US companies from July 1963 to December 2010, Novy-Marx (2013) shows that sorting stocks on gross profitability generates excess returns
Side 17
(𝛼𝛼𝛼𝛼𝑖𝑖𝑖𝑖)
1
that cannot be explained by market risk or the Carhart four-factor model. He finds that investing based on gross profitability gener-ated statistically significant CAPM alphas of 1.44 percent per year over this period. Moreover, this anomaly cannot be explained by other known viola-tions of the CAPM such as the small-cap, value and momentum anomalies. In fact, Novy-Marx finds that gross profitability has about the same explana-tory power as book-to-market in explaining the cross section of average stock returns. Moreover, Novy-Marx (2014) finds that in direct tests, gross profita-bility performs relatively better than other quality strategies such as Graham’s quality, ROIC and earnings quality, especially among large-cap US stocks.
Alternative profitability metrics have also been shown to generate significant excess returns. Asness et al. (2014) show that portfolios sorted on profita-bility as measured by a composite z-score that captures gross profits over assets, return on equity, return on assets, cash flows to assets, gross margin and accruals, have generated statistically significant alphas both in the US and globally. The average profitability premium in the US over the period from 1956 to 2012 is 40bp per month, and the four-factor model alpha 53bp per month (t-stat = 8.71). The global profitability premium over the period
8
THE QUALITY FACTOR
NORGES BANK INVESTMENT MANAGEMENT / DISCUSSION NOTE
from 1986 to 2012 is 34bp per month, and the four-factor alpha 49bp (t-stat = 5.34). Similarly, Fama and French (2014) present evidence that operating profitability minus interest expense is associated with higher stock returns in a way similar to the gross profitability measure of Novy-Marx (2013). Chen, Novy-Marx and Zhang (2011) show that a long-short ROE factor earned a statistically significant average return of 71bp per month over the period from 1972 to 2010.
Safety metrics such as leverage ratios and credit scores have also been linked to abnormal stock returns, although the empirical evidence for these metrics is somewhat weaker. Early studies such as Bhandari (1988) and Fama and French (1992) suggested no positive relationship between low leverage and stock returns. However, other studies such as Dichev (1998), Griffin and Lem-mon (2002), Vassalou and Xing (2004) and Campbell et al. (2008) find that financial distress is associated with lower equity returns. George and Hwang (2010) show that return premiums for low leverage and low distress are significant in raw returns and even stronger in risk-adjusted returns. Penman, Richardson and Tuna (2007) decompose the book-to-market ratio into asset and leverage components, and show that the leverage component is nega-tively related to stock returns. Haugen and Baker (1996) find no statistically significant relationship between past volatility of earnings and returns, while Huang (2009) finds that firms with stable cash flows tend to outperform. The paper argues that cash flow volatility provides a better measure of economic uncertainty than accounting earnings.
Sloan (1996) shows that portfolios of US firms with low accruals earn positive abnormal returns in the following year. A portfolio that is long the 10 percent of firms with the “cleanest” earnings (low accruals) and short the 10 percent of firms with the largest accruals, earns an average return of 10 percent per year. Accruals are measured as the difference between cash and accounting earnings scaled by assets. Sloan shows that a large portion of the subse-quent excess returns is realised around future earnings announcements, and views these findings as being consistent with the market’s inability to cor-rectly impound the information contained in accruals into stock prices. More recent studies have confirmed the anomaly still exists. Kozlov and Petajisto (2013) present evidence that a simple strategy that is long stocks with high earnings quality and short stocks with low earnings quality, produces a higher Sharpe ratio than the overall market or similar strategies betting on value or small stocks. Leippold and Lohre (2010) find the accrual anomaly generates positive hedge returns in 22 of the 26 markets they examine.
Richardson, Tuna, and Wysocki (2010) provide a comprehensive survey of the literature on various accounting anomalies including the accruals anom-aly. Their review suggests that Sloan’s (1996) findings have been found to be robust in different US samples and across different markets and they cannot be attributed to outlier returns. Moreover, the anomaly has been found to be consistent with the investor fixation hypothesis. As Hirshleifer et al. (2004) suggest investors may be putting too much weight on accounting profitabil-ity relative to cash profitability when forecasting future earnings, leading to biased earnings forecasts and biased current market prices.

9
THE QUALITY FACTOR
NORGES BANK INVESTMENT MANAGEMENT / DISCUSSION NOTE
In a comprehensive study of quality, Asness et al. (2014) confirm many of the quality anomalies uncovered so far in the literature and construct a combined quality measure called Quality minus Junk (QMJ) based on proxies for profit-ability, safety, growth and payout. The QMJ premium is large and persistent, not only in the US, where the majority of quality anomalies were first ob-served, but also globally. The spread between high- and low-quality stocks is 40bp per month in the US and 38bp globally. The three- and four-factor alphas are statistically significant for both the US and the global samples.
c Global quality premiums To illustrate the main characteristics of the quality premium across different markets and over time, we construct seven quality factors similar to those found in the literature. We focus on the three main financial dimensions of quality. In particular, we consider the following metrics:
(1) Profitability
Formulas on p.9
𝐶𝐶𝐶𝐶𝐶𝐶𝐶𝐶 𝑆𝑆𝑆𝑆𝑆𝑆𝑆𝑆 𝐴𝐴𝐴𝐴𝐴𝐴𝐴𝐴𝐴𝐴𝐴𝐴𝑝𝑝𝑝𝑝𝑆𝑆𝑆𝑆𝐴𝐴𝐴𝐴 =𝐶𝐶𝐶𝐶𝑃𝑃𝑃𝑃𝐴𝐴𝐴𝐴𝑃𝑃 𝑃𝑃𝑃𝑃𝑃𝑃𝑃𝑃𝑆𝑆𝑆𝑆𝑃𝑃𝑃𝑃𝐴𝐴𝐴𝐴 𝑃𝑃𝑃𝑃𝑃𝑃𝑃𝑃𝑆𝑆𝑆𝑆𝑓𝑓𝑓𝑓 𝑆𝑆𝑆𝑆𝑆𝑆𝑆𝑆𝑝𝑝𝑝𝑝𝑃𝑃𝑃𝑃𝑃𝑃𝑃𝑃𝑆𝑆𝑆𝑆𝑆𝑆𝑆𝑆𝑆𝑆𝑆𝑆𝑆𝑆𝑆𝑆𝐴𝐴𝐴𝐴
𝑇𝑇𝑇𝑇𝑆𝑆𝑆𝑆𝑆𝑆𝑆𝑆𝑃𝑃𝑃𝑃𝑃𝑃𝑃𝑃 𝑃𝑃𝑃𝑃𝐴𝐴𝐴𝐴𝐴𝐴𝐴𝐴𝑝𝑝𝑝𝑝𝑆𝑆𝑆𝑆𝐴𝐴𝐴𝐴
𝐺𝐺𝐺𝐺𝑃𝑃𝑃𝑃 𝑆𝑆𝑆𝑆𝑆𝑆𝑆𝑆 𝐴𝐴𝐴𝐴𝐴𝐴𝐴𝐴𝐴𝐴𝐴𝐴𝑝𝑝𝑝𝑝𝑆𝑆𝑆𝑆𝐴𝐴𝐴𝐴 =𝑆𝑆𝑆𝑆𝑃𝑃𝑃𝑃𝑃𝑃𝑃𝑃𝑝𝑝𝑝𝑝𝐴𝐴𝐴𝐴 − 𝐶𝐶𝐶𝐶𝐶𝐶𝐶𝐶𝐺𝐺𝐺𝐺𝑆𝑆𝑆𝑆𝑇𝑇𝑇𝑇𝑆𝑆𝑆𝑆𝑆𝑆𝑆𝑆𝑃𝑃𝑃𝑃𝑃𝑃𝑃𝑃 𝑃𝑃𝑃𝑃𝐴𝐴𝐴𝐴𝐴𝐴𝐴𝐴𝑝𝑝𝑝𝑝𝑆𝑆𝑆𝑆𝐴𝐴𝐴𝐴
(2) SafetyFormulas on p.9
𝐿𝐿𝐿𝐿𝑝𝑝𝑝𝑝𝐿𝐿𝐿𝐿𝑝𝑝𝑝𝑝𝑝𝑝𝑝𝑝𝑝𝑝𝑝𝑝𝐿𝐿𝐿𝐿𝑝𝑝𝑝𝑝 =𝑇𝑇𝑇𝑇𝑆𝑆𝑆𝑆𝑆𝑆𝑆𝑆𝑝𝑝𝑝𝑝𝑆𝑆𝑆𝑆 𝑅𝑅𝑅𝑅𝑝𝑝𝑝𝑝𝑅𝑅𝑅𝑅𝑆𝑆𝑆𝑆𝑇𝑇𝑇𝑇𝑆𝑆𝑆𝑆𝑆𝑆𝑆𝑆𝑝𝑝𝑝𝑝𝑆𝑆𝑆𝑆 𝑝𝑝𝑝𝑝𝑃𝑃𝑃𝑃𝑃𝑃𝑃𝑃𝑝𝑝𝑝𝑝𝑆𝑆𝑆𝑆𝑃𝑃𝑃𝑃
∆ 𝑁𝑁𝑁𝑁𝑝𝑝𝑝𝑝𝑆𝑆𝑆𝑆 𝑅𝑅𝑅𝑅𝑝𝑝𝑝𝑝𝑅𝑅𝑅𝑅𝑆𝑆𝑆𝑆 =∆ 𝑇𝑇𝑇𝑇𝑆𝑆𝑆𝑆𝑆𝑆𝑆𝑆𝑝𝑝𝑝𝑝𝑆𝑆𝑆𝑆 𝑅𝑅𝑅𝑅𝑝𝑝𝑝𝑝𝑅𝑅𝑅𝑅𝑆𝑆𝑆𝑆 − ∆𝐶𝐶𝐶𝐶𝑝𝑝𝑝𝑝𝑃𝑃𝑃𝑃𝑃𝑃
𝑇𝑇𝑇𝑇𝑆𝑆𝑆𝑆𝑆𝑆𝑆𝑆𝑝𝑝𝑝𝑝𝑆𝑆𝑆𝑆 𝑝𝑝𝑝𝑝𝑃𝑃𝑃𝑃𝑃𝑃𝑃𝑃𝑝𝑝𝑝𝑝𝑆𝑆𝑆𝑆𝑃𝑃𝑃𝑃
Formulas on p.9
𝐿𝐿𝐿𝐿𝑝𝑝𝑝𝑝𝐿𝐿𝐿𝐿𝑝𝑝𝑝𝑝𝑝𝑝𝑝𝑝𝑝𝑝𝑝𝑝𝐿𝐿𝐿𝐿𝑝𝑝𝑝𝑝 =𝑇𝑇𝑇𝑇𝑆𝑆𝑆𝑆𝑆𝑆𝑆𝑆𝑝𝑝𝑝𝑝𝑆𝑆𝑆𝑆 𝑅𝑅𝑅𝑅𝑝𝑝𝑝𝑝𝑅𝑅𝑅𝑅𝑆𝑆𝑆𝑆𝑇𝑇𝑇𝑇𝑆𝑆𝑆𝑆𝑆𝑆𝑆𝑆𝑝𝑝𝑝𝑝𝑆𝑆𝑆𝑆 𝑝𝑝𝑝𝑝𝑃𝑃𝑃𝑃𝑃𝑃𝑃𝑃𝑝𝑝𝑝𝑝𝑆𝑆𝑆𝑆𝑃𝑃𝑃𝑃
∆ 𝑁𝑁𝑁𝑁𝑝𝑝𝑝𝑝𝑆𝑆𝑆𝑆 𝑅𝑅𝑅𝑅𝑝𝑝𝑝𝑝𝑅𝑅𝑅𝑅𝑆𝑆𝑆𝑆 =∆ 𝑇𝑇𝑇𝑇𝑆𝑆𝑆𝑆𝑆𝑆𝑆𝑆𝑝𝑝𝑝𝑝𝑆𝑆𝑆𝑆 𝑅𝑅𝑅𝑅𝑝𝑝𝑝𝑝𝑅𝑅𝑅𝑅𝑆𝑆𝑆𝑆 − ∆𝐶𝐶𝐶𝐶𝑝𝑝𝑝𝑝𝑃𝑃𝑃𝑃𝑃𝑃
𝑇𝑇𝑇𝑇𝑆𝑆𝑆𝑆𝑆𝑆𝑆𝑆𝑝𝑝𝑝𝑝𝑆𝑆𝑆𝑆 𝑝𝑝𝑝𝑝𝑃𝑃𝑃𝑃𝑃𝑃𝑃𝑃𝑝𝑝𝑝𝑝𝑆𝑆𝑆𝑆𝑃𝑃𝑃𝑃
(3) Earnings stability/qualityFormulas on p.9
𝐸𝐸𝐸𝐸𝑃𝑃𝑃𝑃𝑃𝑃𝑃𝑃 𝐴𝐴𝐴𝐴𝐴𝐴𝐴𝐴𝐴𝐴𝐴𝐴𝐴𝐴𝐴𝐴𝐴𝐴𝐴𝐴𝐴𝐴𝐴𝐴𝐴𝐴𝐴𝐴𝐴𝐴𝐴𝐴𝐴𝐴𝐴𝐴 = 𝑃𝑃𝑃𝑃𝐴𝐴𝐴𝐴𝑅𝑅𝑅𝑅𝑆𝑆𝑆𝑆𝑝𝑝𝑝𝑝𝑝𝑝𝑝𝑝 𝐸𝐸𝐸𝐸𝑃𝑃𝑃𝑃𝑃𝑃𝑃𝑃 𝑆𝑆𝑆𝑆𝑝𝑝𝑝𝑝𝑝𝑝𝑝𝑝𝑆𝑆𝑆𝑆 5 𝐴𝐴𝐴𝐴𝑝𝑝𝑝𝑝𝐴𝐴𝐴𝐴𝑆𝑆𝑆𝑆𝐴𝐴𝐴𝐴
𝐸𝐸𝐸𝐸𝑃𝑃𝑃𝑃𝑃𝑃𝑃𝑃 𝐴𝐴𝐴𝐴𝑃𝑃𝑃𝑃𝑃𝑃𝑃𝑃𝑆𝑆𝑆𝑆𝑃𝑃𝑃𝑃𝐴𝐴𝐴𝐴𝐴𝐴𝐴𝐴𝐴𝐴𝐴𝐴 =(𝐶𝐶𝐶𝐶𝐴𝐴𝐴𝐴𝐴𝐴𝐴𝐴𝑃𝑃 𝑃𝑃𝑃𝑃𝐴𝐴𝐴𝐴𝑆𝑆𝑆𝑆𝑃𝑃𝑃𝑃 𝑃𝑃𝑃𝑃𝑆𝑆𝑆𝑆𝑆𝑆𝑆𝑆𝑓𝑓𝑓𝑓 𝑆𝑆𝑆𝑆𝑆𝑆𝑆𝑆𝑝𝑝𝑝𝑝𝑆𝑆𝑆𝑆𝐴𝐴𝐴𝐴𝐴𝐴𝐴𝐴𝐴𝐴𝐴𝐴𝑆𝑆𝑆𝑆𝑆𝑆𝑆𝑆𝐴𝐴𝐴𝐴 − 𝑁𝑁𝑁𝑁𝑝𝑝𝑝𝑝𝐴𝐴𝐴𝐴 𝑆𝑆𝑆𝑆𝑆𝑆𝑆𝑆𝑆𝑆𝑆𝑆𝑃𝑃𝑃𝑃𝐴𝐴𝐴𝐴𝐴𝐴𝐴𝐴)
)𝐴𝐴𝐴𝐴𝐴𝐴𝐴𝐴𝐴𝐴𝐴𝐴 (𝑁𝑁𝑁𝑁𝑝𝑝𝑝𝑝𝐴𝐴𝐴𝐴 𝑆𝑆𝑆𝑆𝑆𝑆𝑆𝑆𝑆𝑆𝑆𝑆𝑃𝑃𝑃𝑃𝐴𝐴𝐴𝐴𝐴𝐴𝐴𝐴
Formulas on p.9
𝐸𝐸𝐸𝐸𝑃𝑃𝑃𝑃𝑃𝑃𝑃𝑃 𝐴𝐴𝐴𝐴𝐴𝐴𝐴𝐴𝐴𝐴𝐴𝐴𝐴𝐴𝐴𝐴𝐴𝐴𝐴𝐴𝐴𝐴𝐴𝐴𝐴𝐴𝐴𝐴𝐴𝐴𝐴𝐴𝐴𝐴𝐴𝐴 = 𝑃𝑃𝑃𝑃𝐴𝐴𝐴𝐴𝑅𝑅𝑅𝑅𝑆𝑆𝑆𝑆𝑝𝑝𝑝𝑝𝑝𝑝𝑝𝑝 𝐸𝐸𝐸𝐸𝑃𝑃𝑃𝑃𝑃𝑃𝑃𝑃 𝑆𝑆𝑆𝑆𝑝𝑝𝑝𝑝𝑝𝑝𝑝𝑝𝑆𝑆𝑆𝑆 5 𝐴𝐴𝐴𝐴𝑝𝑝𝑝𝑝𝐴𝐴𝐴𝐴𝑆𝑆𝑆𝑆𝐴𝐴𝐴𝐴
𝐸𝐸𝐸𝐸𝑃𝑃𝑃𝑃𝑃𝑃𝑃𝑃 𝐴𝐴𝐴𝐴𝑃𝑃𝑃𝑃𝑃𝑃𝑃𝑃𝑆𝑆𝑆𝑆𝑃𝑃𝑃𝑃𝐴𝐴𝐴𝐴𝐴𝐴𝐴𝐴𝐴𝐴𝐴𝐴 =(𝐶𝐶𝐶𝐶𝐴𝐴𝐴𝐴𝐴𝐴𝐴𝐴𝑃𝑃 𝑃𝑃𝑃𝑃𝐴𝐴𝐴𝐴𝑆𝑆𝑆𝑆𝑃𝑃𝑃𝑃 𝑃𝑃𝑃𝑃𝑆𝑆𝑆𝑆𝑆𝑆𝑆𝑆𝑓𝑓𝑓𝑓 𝑆𝑆𝑆𝑆𝑆𝑆𝑆𝑆𝑝𝑝𝑝𝑝𝑆𝑆𝑆𝑆𝐴𝐴𝐴𝐴𝐴𝐴𝐴𝐴𝐴𝐴𝐴𝐴𝑆𝑆𝑆𝑆𝑆𝑆𝑆𝑆𝐴𝐴𝐴𝐴 − 𝑁𝑁𝑁𝑁𝑝𝑝𝑝𝑝𝐴𝐴𝐴𝐴 𝑆𝑆𝑆𝑆𝑆𝑆𝑆𝑆𝑆𝑆𝑆𝑆𝑃𝑃𝑃𝑃𝐴𝐴𝐴𝐴𝐴𝐴𝐴𝐴)
)𝐴𝐴𝐴𝐴𝐴𝐴𝐴𝐴𝐴𝐴𝐴𝐴 (𝑁𝑁𝑁𝑁𝑝𝑝𝑝𝑝𝐴𝐴𝐴𝐴 𝑆𝑆𝑆𝑆𝑆𝑆𝑆𝑆𝑆𝑆𝑆𝑆𝑃𝑃𝑃𝑃𝐴𝐴𝐴𝐴𝐴𝐴𝐴𝐴
These quality metrics were not selected based on any horse-race tests among possible candidates but rather constitute an attempt to capture the multi-faceted nature of quality found in the existing literature on the quality premium. The first two metrics – gross profitability and cash flows to assets – are measures of company profitability; leverage and change in net debt are measures of safety; and EPS stability and EPS accruals are measures of earnings quality.
Quality is characterised by high profitability ratios, low leverage, a reduction in net debt, low standard deviation of EPS and low accruals. We use the

10
THE QUALITY FACTOR
NORGES BANK INVESTMENT MANAGEMENT / DISCUSSION NOTE
change in net debt as an indicator of whether a company is becoming safer over time (i.e. decreasing net debt is considered desirable). We do not intend to use it as a test of the various “asset growth” anomalies documented in the literature.
Equity pricing and fundamental stock data for the analysis come from FTSE and FactSet. The universe consists of all common stocks in the FTSE All-World index from January 1994 to September 2003 and the FTSE Global All-Cap index from October 2003 to June 2015. The FTSE Global All-Cap universe covers over 7,300 securities in 49 different countries. We exclude financial stocks from the analysis. Results that include financial stocks, shown in Appendix I, are largely comparable to the results for non-financial firms. All financial ratios are calculated from annual company fundamental data for the most recent financial year and are lagged at least three months to avoid any look-ahead bias.
The portfolio construction methodology is similar to the one used in many of the papers summarised in section b. At the beginning of every month, we convert each variable into ranks and split the sample of stocks into five quintiles from high quality (Q5) to low quality (Q1). We then consider a long-short factor-mimicking portfolio that is long the stocks in the highest-quality quintile and short the ones in the lowest-quality quintile. For the combined quality metric, we take an equally weighted average of the rank across the six metrics and re-rank the stocks in the universe based on the combined quality score. The returns of the long and short legs of the portfolios are val-ue-weighted and strategies are rebalanced on a monthly basis. All returns are measured in common currency (US dollars).
We also construct quality factors for the sub-universes of large- and small-cap stocks, as well as region- and sector-neutral versions of the portfolios where we impose equal regional and sectoral weights in the long and short legs of the portfolios. The regions consist of North America, developed Europe, developed Asia-Pacific, and emerging markets. The sector classifica-tion is based on the ICB Level 1 industry taxonomy. This classification system consists of the following ten sectors: Oil & Gas, Basic Materials, Industrials, Consumer Goods, Consumer Services, Healthcare, Telecommunications, Utilities, Financials and Technology.
In Table 2, we show the annualised performance statistics for the unadjusted and region/sector-neutral versions of the factor-mimicking portfolios. The average returns over the period from January 1994 to June 2015 range from 2.1 to 8.9 percent per year for the global unadjusted factors. Consistent with the literature, we find strong evidence for the existence of a profitability pre-mium (Sharpe ratios of 0.7 for cash flow over assets and 0.9 for gross profita-bility). Portfolios sorted on the two safety metrics produce relatively smaller risk-adjusted premiums over the sample period. The gross profitability-based strategy appears to have outperformed the remaining single-metric strate-gies. As expected, the correlations between alternative profitability metrics and alternative safety metrics are large and positive.

11
THE QUALITY FACTOR
NORGES BANK INVESTMENT MANAGEMENT / DISCUSSION NOTE
Differences in regional and sector portfolio compositions of the long and short legs of the portfolios account for some of the observed performance differential. The average returns for the region/sector-neutral factors are about half of those for the unadjusted ones. However, the region/sector-neu-tral factors also have lower volatility, and Sharpe ratios that are only 25 per-cent lower than those for the unadjusted factors. The EPS quality (accruals) factor has the lowest correlation with the remaining quality factors.
Table 2: Factor performance statistics
Gross profit / Assets
Cash flows / Assets
Lever-age
Change in net debt
EPS stabil-
ityEPS
qualityCom-bined
Global, unadjusted
Average 8.37 7.02 2.06 2.87 7.16 5.32 8.94
Std dev 9.26 9.46 10.29 7.65 12.59 8.22 9.37
Sharpe 0.90 0.74 0.20 0.37 0.57 0.65 0.95
Min monthly -7.79 -10.80 -15.68 -10.49 -10.63 -9.37 -8.77
Max monthly 8.84 9.30 11.06 10.53 10.98 11.24 8.64
Correlations
Gross profit / Assets 1.00
Cash flows / Assets 0.59 1.00
Leverage 0.35 0.07 1.00
Change in net debt 0.25 0.08 0.65 1.00
EPS stability 0.31 0.36 0.29 -0.01 1.00
EPS quality 0.19 0.17 0.53 0.43 0.16 1.00
Combined 0.71 0.63 0.65 0.47 0.57 0.41 1.00
Region and sector neutral
Average 4.29 3.93 1.60 1.30 4.56 3.89 4.77
Std dev 6.50 7.44 6.36 6.00 7.06 5.43 6.72
Sharpe 0.66 0.53 0.25 0.22 0.65 0.72 0.71
Min monthly -7.82 -10.46 -9.69 -7.90 -6.90 -7.92 -9.00
Max monthly 8.48 6.67 9.55 7.06 7.93 5.78 7.51
Correlations
Gross profit / Assets 1.00
Cash flows / Assets 0.57 1.00
Leverage 0.54 0.35 1.00
Change in net debt 0.26 0.26 0.27 1.00
EPS stability 0.39 0.50 0.31 0.03 1.00
EPS quality 0.02 0.22 -0.04 0.29 -0.09 1.00
Combined 0.68 0.75 0.60 0.41 0.53 0.17 1.00
Source: FTSE; FactSet; NBIM calculations

12
THE QUALITY FACTOR
NORGES BANK INVESTMENT MANAGEMENT / DISCUSSION NOTE
While positive on average, the quality premiums are time-varying. As shown in Charts 2 and 3, the quality premiums have gone through long periods of underperformance. Quality appears to perform particularly well in times of crises and underperform in times of booms. In Table 3, we show the performance statistics for the combined quality strategy (unadjusted) in different economic environments. Rather than exhibiting crash risk, the strategy exhibits defensive characteristics, as the strategy benefits from a flight to quality during crisis. During the global financial crisis, for example, the quality strategy posted an annualised return of 24 percent. On the other hand, during the bull market of 2001-2006, the strategies underperformed, as investors’ risk appetite increased during the period. The strategy also performs better in months when the overall stock market is up (11.9 percent) than in months when the market is down (7.2 percent). Because of its appar-ent counter-cyclicality, quality can serve as a useful diversifier in a long-only market portfolio.
Chart 2: Performance of quality portfolios (non-adjusted)
Source: FTSE; FactSet; NBIM calculations
Chart 3: Performance of quality portfolios (region and sector neutral)
Source: FTSE; FactSet; NBIM calculations
Chart 2: Performance of quality portfolios (non-adjusted)
0
1
2
3
4
5
6
7
1993 1996 1999 2002 2005 2008 2011 2014
Gross profit / Assets Cash flows / Assets Leverage Change in net debt
EPS stability EPS quality Combined
Chart 3: Performance of quality portfolios (region and sector neutral)
0
0,5
1
1,5
2
2,5
3
3,5
1993 1996 1999 2002 2005 2008 2011 2014
Gross profit / Assets Cash flows / Assets Leverage Change in net debtEPS stability EPS quality Combined
13
THE QUALITY FACTOR
NORGES BANK INVESTMENT MANAGEMENT / DISCUSSION NOTE
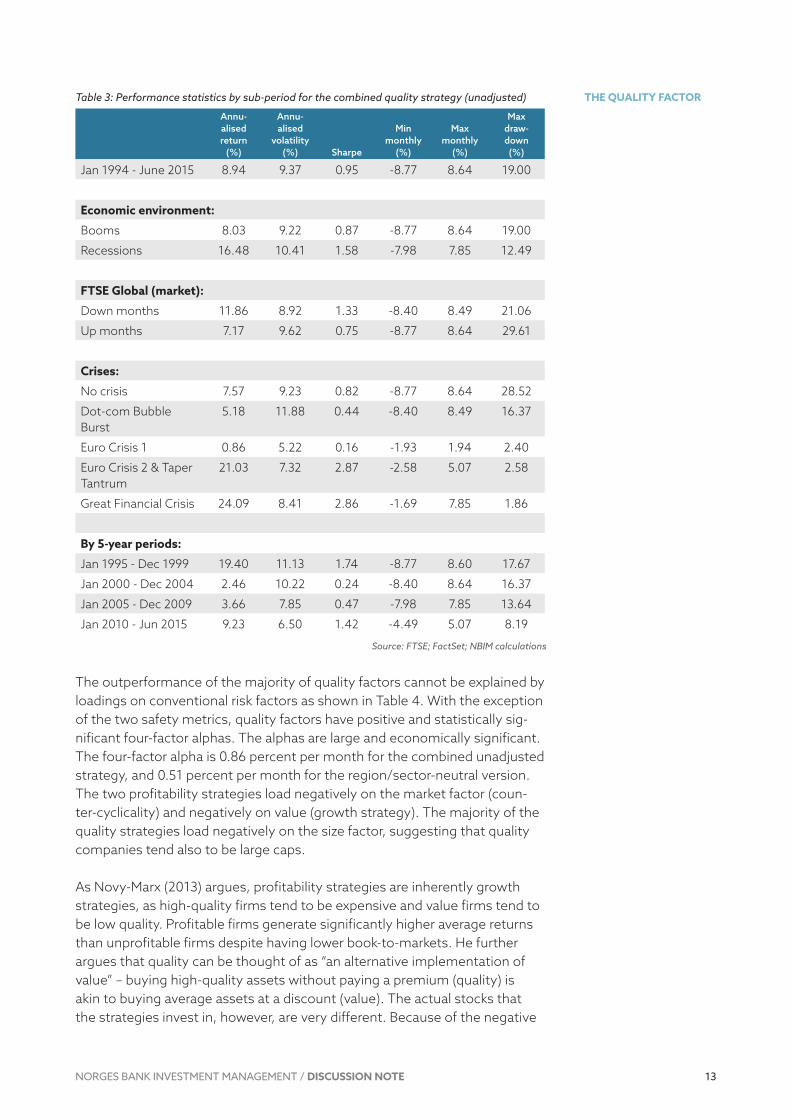
Table 3: Performance statistics by sub-period for the combined quality strategy (unadjusted)
Annu-alised return
(%)
Annu-alised
volatility (%) Sharpe
Min monthly
(%)
Max monthly
(%)
Max draw-down (%)
Jan 1994 - June 2015 8.94 9.37 0.95 -8.77 8.64 19.00
Economic environment:
Booms 8.03 9.22 0.87 -8.77 8.64 19.00
Recessions 16.48 10.41 1.58 -7.98 7.85 12.49
FTSE Global (market):
Down months 11.86 8.92 1.33 -8.40 8.49 21.06
Up months 7.17 9.62 0.75 -8.77 8.64 29.61
Crises:
No crisis 7.57 9.23 0.82 -8.77 8.64 28.52
Dot-com Bubble Burst
5.18 11.88 0.44 -8.40 8.49 16.37
Euro Crisis 1 0.86 5.22 0.16 -1.93 1.94 2.40
Euro Crisis 2 & Taper Tantrum
21.03 7.32 2.87 -2.58 5.07 2.58
Great Financial Crisis 24.09 8.41 2.86 -1.69 7.85 1.86
By 5-year periods:
Jan 1995 - Dec 1999 19.40 11.13 1.74 -8.77 8.60 17.67
Jan 2000 - Dec 2004 2.46 10.22 0.24 -8.40 8.64 16.37
Jan 2005 - Dec 2009 3.66 7.85 0.47 -7.98 7.85 13.64
Jan 2010 - Jun 2015 9.23 6.50 1.42 -4.49 5.07 8.19
Source: FTSE; FactSet; NBIM calculations
The outperformance of the majority of quality factors cannot be explained by loadings on conventional risk factors as shown in Table 4. With the exception of the two safety metrics, quality factors have positive and statistically sig-nificant four-factor alphas. The alphas are large and economically significant. The four-factor alpha is 0.86 percent per month for the combined unadjusted strategy, and 0.51 percent per month for the region/sector-neutral version. The two profitability strategies load negatively on the market factor (coun-ter-cyclicality) and negatively on value (growth strategy). The majority of the quality strategies load negatively on the size factor, suggesting that quality companies tend also to be large caps.
As Novy-Marx (2013) argues, profitability strategies are inherently growth strategies, as high-quality firms tend to be expensive and value firms tend to be low quality. Profitable firms generate significantly higher average returns than unprofitable firms despite having lower book-to-markets. He further argues that quality can be thought of as “an alternative implementation of value” – buying high-quality assets without paying a premium (quality) is akin to buying average assets at a discount (value). The actual stocks that the strategies invest in, however, are very different. Because of the negative

14
THE QUALITY FACTOR
NORGES BANK INVESTMENT MANAGEMENT / DISCUSSION NOTE
association between the two factors, value and quality work extremely well when run together.
Table 4: Factor loadings
Gross profit / Assets
Cash flows / Assets
Lever-age
Change in net debt
EPS stabil-
ity
EPS quality
Com-bined
Global, unadjusted
Alpha 0.826 0.787 0.375 0.087 0.672 0.672 0.864
(4.02) (4.57) (1.60) (0.43) (2.40) (2.99) (3.61)
Market -0.161 -0.256 0.156 0.169 0.061 0.035 -0.063
(-3.19) (-8.15) (1.96) (2.30) (1.11) (0.54) (-0.98)
Value 0.006 0.044 -0.249 -0.052 -0.143 0.022 -0.083
(0.06) (0.28) (-2.41) (-0.63) (-0.96) (0.23) (-0.81)
Size -0.324 -0.311 -0.273 -0.075 -0.173 -0.415 -0.319
(-3.68) (-2.77) (-2.50) (-0.85) (-1.64) (-4.54) (-3.37)
Momentum 0.077 0.175 -0.103 0.122 0.114 -0.115 0.128
(1.43) (2.72) (-1.13) (1.47) (0.95) (-1.20) (1.47)
R-sq 0.231 0.424 0.130 0.151 0.076 0.110 0.234
df 225 225 225 225 225 225 225
Global, region- and sector-neutral
Alpha 0.550 0.513 0.274 0.013 0.537 0.341 0.513
(5.14) (4.28) (2.34) (0.08) (3.80) (2.37) (3.39)
Market -0.155 -0.156 -0.118 0.060 -0.130 0.039 -0.047
(-6.30) (-4.61) (-3.59) (1.51) (-4.48) (1.60) (-1.08)
Value -0.121 -0.088 -0.075 -0.085 0.001 0.038 -0.129
(-0.98) (-0.57) (-0.90) (-1.10) (0.02) (0.46) (-1.06)
Size -0.022 -0.178 -0.047 -0.027 -0.176 -0.109 0.015
(-0.25) (-1.87) (-0.56) (-0.30) (-2.22) (-2.58) (0.14)
Momentum 0.052 0.086 0.086 0.130 0.083 0.002 0.067
(1.06) (1.55) (2.55) (1.70) (1.42) (0.03) (0.85)
R-sq 0.256 0.307 0.216 0.153 0.212 0.027 0.325
df 225 225 225 225 225 225 224
Note: Newey-West t-statistics with 12 lags in parentheses. The market factor is the FTSE Global All Cap portfolio. The value, size and momentum factors are constructed similarly to the seven quality factors. The sorting variable for value is book-to-price; for size, market capitalisation; and for momentum, 12-month price returns. All factors are value-weighted and rebalanced monthly.
15
THE QUALITY FACTOR
NORGES BANK INVESTMENT MANAGEMENT / DISCUSSION NOTE
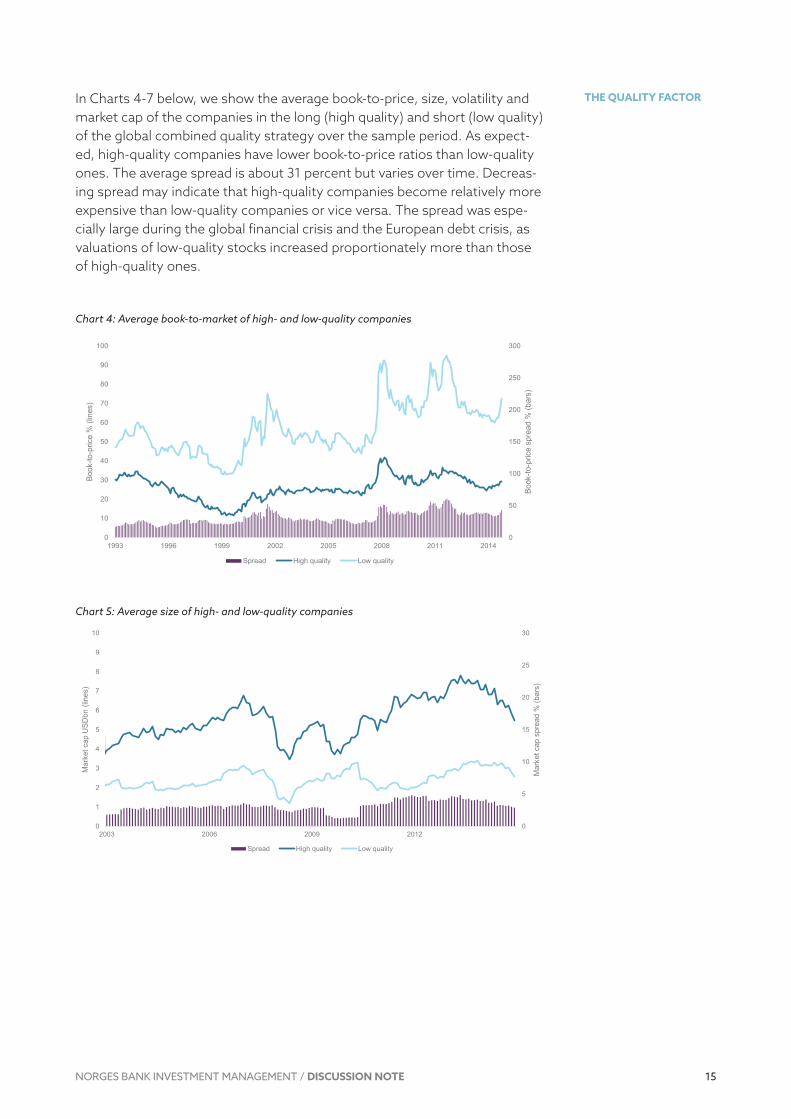
In Charts 4-7 below, we show the average book-to-price, size, volatility and market cap of the companies in the long (high quality) and short (low quality) of the global combined quality strategy over the sample period. As expect-ed, high-quality companies have lower book-to-price ratios than low-quality ones. The average spread is about 31 percent but varies over time. Decreas-ing spread may indicate that high-quality companies become relatively more expensive than low-quality companies or vice versa. The spread was espe-cially large during the global financial crisis and the European debt crisis, as valuations of low-quality stocks increased proportionately more than those of high-quality ones.
Chart 4: Average book-to-market of high- and low-quality companies
Chart 5: Average size of high- and low-quality companies
Chart 4: Average book-to-market of high- and low-quality companies
0
50
100
150
200
250
300
0
10
20
30
40
50
60
70
80
90
100
1993 1996 1999 2002 2005 2008 2011 2014
Book
-to-p
rice
spre
ad %
(bar
s)
Book
-to-p
rice
% (l
ines
)
Spread High quality Low quality
Chart 5: Average size of high- and low-quality companies
0
5
10
15
20
25
30
0
1
2
3
4
5
6
7
8
9
10
2003 2006 2009 2012
Mar
ket c
ap s
prea
d %
(bar
s)
Mar
ket c
ap U
SDbn
(lin
es)
Spread High quality Low quality

16
THE QUALITY FACTOR
NORGES BANK INVESTMENT MANAGEMENT / DISCUSSION NOTE
Chart 6: Average volatility of high- and low-quality companies
Chart 7: Average market beta of high- and low-quality companies
As shown in Chart 5, high-quality companies also tend to have larger market caps than low-quality companies. The average market cap of high-quality companies is about twice that of low-quality companies, and this spread has remained relatively constant over time. The spreads in the volatility and market beta of high- and low-quality companies, however, have exhibited strong variability. Throughout the late 1990s and early 2000s, high-quality companies had, on average, higher volatility and a higher market beta than low-quality ones. While the trend reversed between 2005 and 2010, the volatility of quality companies has been on the rise since 2011. We do not observe a clear one-directional relationship between quality and market risk as we do between quality and size and between quality and value.
Chart 8 below illustrates the risk-reduction benefits of quality when it is combined with value and size. The combined strategy is an equally weighted average of value, size and quality.1 Because of the negative correlation, the volatility of the combined strategy is reduced almost twofold, and the Sharpe
1 The weightings of the strategies can be optimised to yield higher risk-adjusted returns via for example the characteristic portfolio approach of Brandt et al. (2009).
Chart 6: Average volatility of high- and low-quality companies
-15
-10
-5
0
5
10
15
0
10
20
30
40
50
60
1993 1996 1999 2002 2005 2008 2011 2014
Vola
tility
spr
ead
% (b
ars)
Vola
tility
% (l
ines
)
Spread High quality Low quality
Chart 7: Average market beta of high- and low-quality companies
-0,40
-0,20
0,00
0,20
0,40
0,60
0,80
0,00
0,20
0,40
0,60
0,80
1,00
1,20
1,40
1,60
1993 1996 1999 2002 2005 2008 2011 2014
Mar
ket b
eta
spre
ad %
(bar
s)
Mar
ket b
eta
(line
s)
Spread High quality Low quality

17
THE QUALITY FACTOR
NORGES BANK INVESTMENT MANAGEMENT / DISCUSSION NOTE
ratio increased by 50 percent. Quality appears to be an excellent diversifier in a multi-factor portfolio setting.2
Chart 8: Combining quality, value and size
In Tables 5-7, we examine the robustness of the quality premium across geographical regions and firm size. Similar to the global quality factors, we construct regional versions of the factors for four regions – North Ameri-ca, developed Europe, developed Asia-Pacific, and emerging markets. The results by region are generally consistent with those for the global factors. Quality does not appear to be concentrated in any given part of the world but seems to be a largely global phenomenon. As with the global factors, the gross profitability, cash flows to assets, and EPS stability factors have post-ed the highest risk-adjusted returns over the sample period. The volatilities of the quality premiums are largest in emerging markets, ranging from 19.2 to 20.5 percent. The minimum monthly return of the combined strategy is 30 percent in emerging markets, compared to 10 percent in Europe and 14 percent in North America.
2 The performance of these factor strategies may be significantly affected by transaction costs, which are not considered in this analysis. Long-short strategies may in many cases not be implementable in practice, as some index constituents may be impossible to short.
Chart 8: Combining quality, value and size
Value Size Quality All threeRet 5.3 3.1 9.0 5.8Vol 7.7 6.8 9.2 4.2Sharpe 0.69 0.46 0.95 1.40
0
1
2
3
4
5
6
1993 1998 2003 2008
Value Size Quality Value + size + quality

18
THE QUALITY FACTOR
NORGES BANK INVESTMENT MANAGEMENT / DISCUSSION NOTE
Table 5: Regional factors
Gross profit / Assets
Cash flows / Assets
Lever-age
Change in net debt
EPS sta-bility
EPS quality
Com-bined
North America
Average 8.75 5.03 2.29 4.05 7.26 2.68 5.73
Std dev 12.22 10.35 15.14 10.97 10.20 11.58 10.99
Sharpe 0.72 0.49 0.15 0.37 0.71 0.23 0.52
Min monthly -12.67 -8.13 -19.09 -13.77 -10.40 -12.82 -13.77
Max monthly 14.25 11.88 14.75 14.85 10.95 15.48 12.30
4-factor alpha 0.87 0.74 0.59 0.20 0.93 0.50 0.78
(t-stat) (3.79) (4.74) (1.72) (0.73) (5.21) (1.46) (2.92)
Europe
Average 6.09 5.47 2.06 3.08 1.49 4.05 5.28
Std dev 11.15 13.17 9.72 8.20 11.68 10.77 10.69
Sharpe 0.55 0.42 0.21 0.38 0.13 0.38 0.49
Min monthly -10.09 -15.55 -10.39 -7.74 -11.19 -9.92 -10.12
Max monthly 11.66 17.60 9.68 8.47 11.76 13.73 9.98
4-factor alpha 0.65 0.72 0.30 0.02 0.20 0.58 0.71
(t-stat) (2.29) (2.80) (1.16) (0.09) (0.77) (2.19) (3.28)
Asia-Pacific
Average 6.75 4.88 1.30 4.02 2.24 4.84 5.28
Std dev 11.00 14.68 10.68 10.52 16.44 10.93 12.73
Sharpe 0.61 0.33 0.12 0.38 0.14 0.44 0.41
Min monthly -11.23 -16.21 -14.30 -12.82 -13.16 -10.60 -12.21
Max monthly 10.39 20.70 15.12 12.76 18.32 13.78 16.60
4-factor alpha 1.02 0.66 0.32 0.49 -0.08 0.67 0.77
(t-stat) (3.84) (1.90) (1.37) (2.24) (-0.21) (2.80) (2.77)
Emerging markets
Average 5.60 8.32 4.01 4.93 6.09 1.84 9.10
Std dev 20.57 17.66 20.02 17.78 19.23 14.03 19.93
Sharpe 0.27 0.47 0.20 0.28 0.32 0.13 0.46
Min monthly -26.86 -33.98 -20.84 -19.85 -19.86 -14.93 -29.98
Max monthly 28.82 16.69 21.06 17.65 26.81 17.18 22.59
4-factor alpha 0.43 0.82 1.13 0.71 0.71 0.47 1.23
(t-stat) (0.94) (2.04) (2.22) (1.55) (1.34) (1.70) (2.35)
The average quality premiums are relatively larger for the sample of large- and mid-cap stocks than for the small-cap sample, whereas the average alphas are largely similar. The average return of the unadjusted combined quality strategy for small-cap stocks is 2.3 percentage points lower than its large- and mid-cap counterpart. The leverage-based strategy has a negative average return and a negative four-factor alpha in the small-cap sample. The combined quality strategy, however, has statistically significant four-factor

19
THE QUALITY FACTOR
NORGES BANK INVESTMENT MANAGEMENT / DISCUSSION NOTE
alphas in both subsamples. Controlling for sectoral and regional differences in the factors does not eliminate the excess return in either subsample.
Table 6: Quality factors: large- and mid-cap universe
Gross profit / Assets
Cash flows / Assets
Lever-age
Change in net debt
EPS sta-bility
EPS quality
Com-bined
Global large caps
Average 8.46 6.46 2.42 2.61 7.03 4.80 7.16
Std dev 8.96 8.85 10.17 7.71 12.77 8.22 8.96
Sharpe 0.94 0.73 0.24 0.34 0.55 0.58 0.80
Min monthly -7.79 -8.60 -15.68 -10.49 -10.63 -9.37 -9.65
Max monthly 8.84 7.50 11.06 10.53 10.98 11.24 9.83
4-factor alpha 0.82 0.71 0.40 0.10 0.66 0.62 0.77
(t-stat) (3.91) (3.87) (1.71) (0.45) (2.35) (2.82) (3.56)
Correlations
Gross profit / Assets
1.00
Cash flows / Assets 0.57 1.00
Leverage 0.38 0.16 1.00
Change in net debt 0.26 0.11 0.65 1.00
EPS stability 0.34 0.36 0.31 -0.01 1.00
EPS quality 0.20 0.16 0.54 0.44 0.17 1.00
Combined 0.64 0.54 0.74 0.52 0.54 0.43 1.00
Global large caps, sector-neutral
Average 3.91 4.00 1.94 0.87 4.90 3.10 4.66
Std dev 6.35 7.10 5.99 5.91 6.95 5.37 6.59
Sharpe 0.62 0.56 0.32 0.15 0.71 0.58 0.71
Min monthly -7.82 -6.65 -9.10 -7.90 -6.90 -7.92 -6.83
Max monthly 8.48 6.37 8.33 7.06 7.93 5.78 7.51
4-factor alpha 0.49 0.50 0.26 -0.02 0.57 0.30 0.50
(t-stat) (5.24) (3.47) (2.66) (-0.10) (4.17) (2.23) (3.39)
Correlations
Gross profit / Assets
1.00
Cash flows / Assets 0.60 1.00
Leverage 0.53 0.35 1.00
Change in net debt 0.22 0.25 0.21 1.00
EPS stability 0.44 0.49 0.37 0.02 1.00
EPS quality 0.02 0.26 -0.05 0.30 -0.08 1.00
Combined 0.67 0.76 0.58 0.35 0.57 0.19 1.00

20
THE QUALITY FACTOR
NORGES BANK INVESTMENT MANAGEMENT / DISCUSSION NOTE
Table 7: Quality factors: small-cap universe
Gross profit / Assets
Cash flows / Assets
Lever-age
Change in net debt
EPS sta-bility
EPS quality
Com-bined
Global small caps
Average 3.90 5.76 -2.34 1.74 5.32 4.71 4.85
Std dev 11.02 7.05 6.68 4.04 10.71 6.21 7.97
Sharpe 0.35 0.82 -0.35 0.43 0.50 0.76 0.61
Min monthly -13.31 -5.04 -9.85 -5.11 -11.86 -4.28 -6.27
Max monthly 10.31 6.15 5.86 3.19 9.88 7.01 8.51
4-factor alpha 0.38 0.96 -0.09 -0.03 1.11 0.59 0.80
(t-stat) (1.44) (5.78) (-0.51) (-0.39) (3.24) (2.16) (3.36)
Correlations
Gross profit / Assets
1.00
Cash flows / Assets
0.37 1.00
Leverage 0.42 0.19 1.00
Change in net debt 0.34 0.13 0.60 1.00
EPS stability -0.03 0.15 0.01 -0.11 1.00
EPS quality 0.03 0.34 0.13 -0.06 0.18 1.00
Combined 0.72 0.64 0.67 0.51 0.30 0.30 1.00
Global small caps, sector-neutral
Average 3.23 4.34 -2.18 1.33 2.62 4.18 3.51
Std dev 5.65 5.62 5.73 3.51 6.70 4.19 6.39
Sharpe 0.57 0.77 -0.38 0.38 0.39 1.00 0.55
Min monthly -5.37 -4.25 -10.23 -5.48 -5.95 -2.10 -8.35
Max monthly 4.84 5.12 5.87 3.51 6.95 5.94 8.21
4-factor alpha 0.47 0.75 0.01 0.01 0.77 0.44 0.69
(t-stat) (2.92) (6.50) (0.14) (0.17) (5.24) (2.60) (5.61)
Correlations
Gross profit / Assets
1.00
Cash flows / Assets
0.69 1.00
Leverage 0.49 0.51 1.00
Change in net debt 0.38 0.37 0.49 1.00
EPS stability 0.58 0.53 0.67 0.35 1.00
EPS quality -0.13 -0.06 -0.20 -0.16 -0.13 1.00
Combined 0.77 0.77 0.76 0.59 0.83 -0.05 1.00

21
THE QUALITY FACTOR
NORGES BANK INVESTMENT MANAGEMENT / DISCUSSION NOTE
III Explanations for the quality premiumCompared to the vast literature on the size and value premiums, relatively little research has tried to explain why quality premiums exist and whether they can be considered systematic risk factors. The multi-dimensional nature of quality makes it even harder to provide a unified explanation of quality. Factors that may help explain the accrual anomaly, for example, may have nothing to do with the profitability premium. Critics of quality often point out that quality cannot be considered a single systematic risk factor, as it is likely an amalgam of various risk factors and behavioural biases. In this section, we review some of the explanations for the quality premium that researchers have put forward, focusing on the three main dimensions of quality: profita-bility, safety and earnings quality. We group the studies into statistical, risk-based and behavioural explanations.
a Statistical explanations and measurement errorsSeveral authors suggest that the quality premium, like many other anomalies, may be nothing more than a statistical artefact resulting from measurement errors, data mining and various methodological biases. As Lo and MacKinlay (1990) and Black (1993) point out, when many researchers perform tests on the same dataset to uncover pricing anomalies, a potentially serious “data snooping” problem arises. Even though researchers may test hundreds of different hypotheses, they only publish the most interesting and “statistically significant” results. The statistical significance of these results, however, is questionable because it depends on the number of tests performed to derive the particular result. Every once in a while, an interesting pattern is bound to emerge simply by chance. The quality premium is particularly prone to this criticism, as quality has no universally accepted definition, and researchers are free to define it in numerous ways.
Harvey, Liu and Zhu (2015) argue that because of the pervasiveness of data snooping in financial research, conventional levels of statistical significance (t-stat of 2.0) are no longer valid. They propose a multiple testing framework whereby significance levels are adjusted upward to account for multiple hy-pothesis tests. When adjustments for false discovery due to multiple testing are imposed, the “significant” t-statistic becomes 3.5 or more. Many of the quality-related anomalies documented in the literature would not be able to pass this higher significance hurdle.
In addition to the multiple testing bias, tests of quality may suffer from a serious overfitting bias arising from combining multiple quality metrics that are each signed to predict higher returns in-sample (Novy-Marx 2015). As Novy-Marx shows, conventional two-sided tests of significance are no longer valid when researchers evaluate a multi-signal strategy. The reason is over-fitting. Intuitively, the argument goes as follow. Suppose we test 100 ran-domly selected signals and find that five of them predict higher returns just by chance. What happens if we backtest a combination of the five “lucky” signals? We will find that the combination is still associated with high returns, but also diversifying across the five signals reduces the standard deviation of the combined strategy (Novy-Marx shows that the reduction is in the order of the square root of the number signals). The result is a highly significant Sharpe ratio simply because the combined strategy is constructed from sig-

22
THE QUALITY FACTOR
NORGES BANK INVESTMENT MANAGEMENT / DISCUSSION NOTE
nals known to predict higher returns in-sample. Moreover, Novy-Marx shows that this overfitting bias interacts with the multiple testing bias and leads to further inference issues than each of the biases alone.
b Risk-based explanationsRisk-based explanations focus on the idea that quality may be a proxy for some unidentified macroeconomic or other non-diversifiable risk factor that drives the variation in expected asset returns. Because high-quality stocks have relatively higher exposure to this quality-related systematic risk factor, they earn higher returns in equilibrium. If so, the observed quality premium represents investors’ compensation for the exposure to risk rather than an anomalous event.
The quality premium is difficult to reconcile with traditional notions of risk-based pricing. Companies that are safe, profitable and generally perceived as less risky should not earn a higher risk-adjusted return in equilibrium. As we showed in Table 3, the quality premium is counter-cyclical and performs especially well during market downturns. It is difficult to conjecture that high-quality stocks are relatively more correlated with some systematic risk factor and that this risk cannot be diversified away.
However, as Fama and French (2006) conjectured back in 2006, the profitabil-ity dimension of quality may indeed be related in the cross section to expect-ed returns via the dividend discount model and the clean surplus accounting relation:
Formula on p. 28
⁄𝑀𝑀𝑀𝑀𝑡𝑡𝑡𝑡 𝐵𝐵𝐵𝐵𝑡𝑡𝑡𝑡 = 𝐸𝐸𝐸𝐸𝑡𝑡𝑡𝑡 ��𝜏𝜏𝜏𝜏=1
∞ 𝑌𝑌𝑌𝑌𝑡𝑡𝑡𝑡+𝜏𝜏𝜏𝜏 − 𝑅𝑅𝑅𝑅𝐵𝐵𝐵𝐵𝑡𝑡𝑡𝑡+𝜏𝜏𝜏𝜏1 + 𝑝𝑝𝑝𝑝 𝜏𝜏𝜏𝜏 𝐵𝐵𝐵𝐵𝑡𝑡𝑡𝑡
where
Side 32
𝑀𝑀𝑀𝑀𝑡𝑡𝑡𝑡 t, 𝐵𝐵𝐵𝐵𝑡𝑡𝑡𝑡 𝑌𝑌𝑌𝑌𝑡𝑡𝑡𝑡+𝜏𝜏𝜏𝜏 𝑡𝑡𝑡𝑡 + 𝜏𝜏𝜏𝜏 𝑑𝑑𝑑𝑑𝐵𝐵𝐵𝐵𝑡𝑡𝑡𝑡+𝜏𝜏𝜏𝜏 𝑟𝑟𝑟𝑟 (𝑌𝑌𝑌𝑌𝑡𝑡𝑡𝑡+𝜏𝜏𝜏𝜏)
𝑟𝑟𝑟𝑟 (𝑀𝑀𝑀𝑀𝑡𝑡𝑡𝑡) (𝐵𝐵𝐵𝐵𝑡𝑡𝑡𝑡) (𝑑𝑑𝑑𝑑𝐵𝐵𝐵𝐵𝑡𝑡𝑡𝑡+𝜏𝜏𝜏𝜏) (𝑀𝑀𝑀𝑀𝑡𝑡𝑡𝑡
𝐵𝐵𝐵𝐵𝑡𝑡𝑡𝑡)
(𝑑𝑑𝑑𝑑𝐵𝐵𝐵𝐵𝑡𝑡𝑡𝑡+𝜏𝜏𝜏𝜏)
2
is the market value of the firm at time
Side 32
𝑀𝑀𝑀𝑀𝑡𝑡𝑡𝑡 t, 𝐵𝐵𝐵𝐵𝑡𝑡𝑡𝑡 𝑌𝑌𝑌𝑌𝑡𝑡𝑡𝑡+𝜏𝜏𝜏𝜏 𝑡𝑡𝑡𝑡 + 𝜏𝜏𝜏𝜏 𝑑𝑑𝑑𝑑𝐵𝐵𝐵𝐵𝑡𝑡𝑡𝑡+𝜏𝜏𝜏𝜏 𝑟𝑟𝑟𝑟 (𝑌𝑌𝑌𝑌𝑡𝑡𝑡𝑡+𝜏𝜏𝜏𝜏)
𝑟𝑟𝑟𝑟 (𝑀𝑀𝑀𝑀𝑡𝑡𝑡𝑡) (𝐵𝐵𝐵𝐵𝑡𝑡𝑡𝑡) (𝑑𝑑𝑑𝑑𝐵𝐵𝐵𝐵𝑡𝑡𝑡𝑡+𝜏𝜏𝜏𝜏) (𝑀𝑀𝑀𝑀𝑡𝑡𝑡𝑡
𝐵𝐵𝐵𝐵𝑡𝑡𝑡𝑡)
(𝑑𝑑𝑑𝑑𝐵𝐵𝐵𝐵𝑡𝑡𝑡𝑡+𝜏𝜏𝜏𝜏)
2
is the firm’s book equity,
Side 32
𝑀𝑀𝑀𝑀𝑡𝑡𝑡𝑡 t, 𝐵𝐵𝐵𝐵𝑡𝑡𝑡𝑡 𝑌𝑌𝑌𝑌𝑡𝑡𝑡𝑡+𝜏𝜏𝜏𝜏 𝑡𝑡𝑡𝑡 + 𝜏𝜏𝜏𝜏 𝑑𝑑𝑑𝑑𝐵𝐵𝐵𝐵𝑡𝑡𝑡𝑡+𝜏𝜏𝜏𝜏 𝑟𝑟𝑟𝑟 (𝑌𝑌𝑌𝑌𝑡𝑡𝑡𝑡+𝜏𝜏𝜏𝜏)
𝑟𝑟𝑟𝑟 (𝑀𝑀𝑀𝑀𝑡𝑡𝑡𝑡) (𝐵𝐵𝐵𝐵𝑡𝑡𝑡𝑡) (𝑑𝑑𝑑𝑑𝐵𝐵𝐵𝐵𝑡𝑡𝑡𝑡+𝜏𝜏𝜏𝜏) (𝑀𝑀𝑀𝑀𝑡𝑡𝑡𝑡
𝐵𝐵𝐵𝐵𝑡𝑡𝑡𝑡)
(𝑑𝑑𝑑𝑑𝐵𝐵𝐵𝐵𝑡𝑡𝑡𝑡+𝜏𝜏𝜏𝜏)
2
is the total equity earnings for period
Side 32
𝑀𝑀𝑀𝑀𝑡𝑡𝑡𝑡 t, 𝐵𝐵𝐵𝐵𝑡𝑡𝑡𝑡 𝑌𝑌𝑌𝑌𝑡𝑡𝑡𝑡+𝜏𝜏𝜏𝜏 𝑡𝑡𝑡𝑡 + 𝜏𝜏𝜏𝜏 𝑑𝑑𝑑𝑑𝐵𝐵𝐵𝐵𝑡𝑡𝑡𝑡+𝜏𝜏𝜏𝜏 𝑟𝑟𝑟𝑟 (𝑌𝑌𝑌𝑌𝑡𝑡𝑡𝑡+𝜏𝜏𝜏𝜏)
𝑟𝑟𝑟𝑟 (𝑀𝑀𝑀𝑀𝑡𝑡𝑡𝑡) (𝐵𝐵𝐵𝐵𝑡𝑡𝑡𝑡) (𝑑𝑑𝑑𝑑𝐵𝐵𝐵𝐵𝑡𝑡𝑡𝑡+𝜏𝜏𝜏𝜏) (𝑀𝑀𝑀𝑀𝑡𝑡𝑡𝑡
𝐵𝐵𝐵𝐵𝑡𝑡𝑡𝑡)
(𝑑𝑑𝑑𝑑𝐵𝐵𝐵𝐵𝑡𝑡𝑡𝑡+𝜏𝜏𝜏𝜏)
2
,
Side 32
𝑀𝑀𝑀𝑀𝑡𝑡𝑡𝑡 t, 𝐵𝐵𝐵𝐵𝑡𝑡𝑡𝑡 𝑌𝑌𝑌𝑌𝑡𝑡𝑡𝑡+𝜏𝜏𝜏𝜏 𝑡𝑡𝑡𝑡 + 𝜏𝜏𝜏𝜏 𝑑𝑑𝑑𝑑𝐵𝐵𝐵𝐵𝑡𝑡𝑡𝑡+𝜏𝜏𝜏𝜏 𝑟𝑟𝑟𝑟 (𝑌𝑌𝑌𝑌𝑡𝑡𝑡𝑡+𝜏𝜏𝜏𝜏)
𝑟𝑟𝑟𝑟 (𝑀𝑀𝑀𝑀𝑡𝑡𝑡𝑡) (𝐵𝐵𝐵𝐵𝑡𝑡𝑡𝑡) (𝑑𝑑𝑑𝑑𝐵𝐵𝐵𝐵𝑡𝑡𝑡𝑡+𝜏𝜏𝜏𝜏) (𝑀𝑀𝑀𝑀𝑡𝑡𝑡𝑡
𝐵𝐵𝐵𝐵𝑡𝑡𝑡𝑡)
(𝑑𝑑𝑑𝑑𝐵𝐵𝐵𝐵𝑡𝑡𝑡𝑡+𝜏𝜏𝜏𝜏)
2
is the change in book value (i.e. firm investment) and
Side 32
𝑀𝑀𝑀𝑀𝑡𝑡𝑡𝑡 t, 𝐵𝐵𝐵𝐵𝑡𝑡𝑡𝑡 𝑌𝑌𝑌𝑌𝑡𝑡𝑡𝑡+𝜏𝜏𝜏𝜏 𝑡𝑡𝑡𝑡 + 𝜏𝜏𝜏𝜏 𝑑𝑑𝑑𝑑𝐵𝐵𝐵𝐵𝑡𝑡𝑡𝑡+𝜏𝜏𝜏𝜏 𝑟𝑟𝑟𝑟 (𝑌𝑌𝑌𝑌𝑡𝑡𝑡𝑡+𝜏𝜏𝜏𝜏)
𝑟𝑟𝑟𝑟 (𝑀𝑀𝑀𝑀𝑡𝑡𝑡𝑡) (𝐵𝐵𝐵𝐵𝑡𝑡𝑡𝑡) (𝑑𝑑𝑑𝑑𝐵𝐵𝐵𝐵𝑡𝑡𝑡𝑡+𝜏𝜏𝜏𝜏) (𝑀𝑀𝑀𝑀𝑡𝑡𝑡𝑡
𝐵𝐵𝐵𝐵𝑡𝑡𝑡𝑡)
(𝑑𝑑𝑑𝑑𝐵𝐵𝐵𝐵𝑡𝑡𝑡𝑡+𝜏𝜏𝜏𝜏)
2
is the internal rate of return of dividends (a proxy for expected return). From the equation, it follows that, all else equal, differences in expected profitability
Side 32
𝑀𝑀𝑀𝑀𝑡𝑡𝑡𝑡 t, 𝐵𝐵𝐵𝐵𝑡𝑡𝑡𝑡 𝑌𝑌𝑌𝑌𝑡𝑡𝑡𝑡+𝜏𝜏𝜏𝜏 𝑡𝑡𝑡𝑡 + 𝜏𝜏𝜏𝜏 𝑑𝑑𝑑𝑑𝐵𝐵𝐵𝐵𝑡𝑡𝑡𝑡+𝜏𝜏𝜏𝜏 𝑟𝑟𝑟𝑟 (𝑌𝑌𝑌𝑌𝑡𝑡𝑡𝑡+𝜏𝜏𝜏𝜏)
𝑟𝑟𝑟𝑟 (𝑀𝑀𝑀𝑀𝑡𝑡𝑡𝑡) (𝐵𝐵𝐵𝐵𝑡𝑡𝑡𝑡) (𝑑𝑑𝑑𝑑𝐵𝐵𝐵𝐵𝑡𝑡𝑡𝑡+𝜏𝜏𝜏𝜏) (𝑀𝑀𝑀𝑀𝑡𝑡𝑡𝑡
𝐵𝐵𝐵𝐵𝑡𝑡𝑡𝑡)
(𝑑𝑑𝑑𝑑𝐵𝐵𝐵𝐵𝑡𝑡𝑡𝑡+𝜏𝜏𝜏𝜏)
2
should, in the cross section, be related to the rate of return
Side 32
𝑀𝑀𝑀𝑀𝑡𝑡𝑡𝑡 t, 𝐵𝐵𝐵𝐵𝑡𝑡𝑡𝑡 𝑌𝑌𝑌𝑌𝑡𝑡𝑡𝑡+𝜏𝜏𝜏𝜏 𝑡𝑡𝑡𝑡 + 𝜏𝜏𝜏𝜏 𝑑𝑑𝑑𝑑𝐵𝐵𝐵𝐵𝑡𝑡𝑡𝑡+𝜏𝜏𝜏𝜏 𝑟𝑟𝑟𝑟 (𝑌𝑌𝑌𝑌𝑡𝑡𝑡𝑡+𝜏𝜏𝜏𝜏)
𝑟𝑟𝑟𝑟 (𝑀𝑀𝑀𝑀𝑡𝑡𝑡𝑡) (𝐵𝐵𝐵𝐵𝑡𝑡𝑡𝑡) (𝑑𝑑𝑑𝑑𝐵𝐵𝐵𝐵𝑡𝑡𝑡𝑡+𝜏𝜏𝜏𝜏) (𝑀𝑀𝑀𝑀𝑡𝑡𝑡𝑡
𝐵𝐵𝐵𝐵𝑡𝑡𝑡𝑡)
(𝑑𝑑𝑑𝑑𝐵𝐵𝐵𝐵𝑡𝑡𝑡𝑡+𝜏𝜏𝜏𝜏)
2
. Keeping the market value
Side 32
𝑀𝑀𝑀𝑀𝑡𝑡𝑡𝑡 t, 𝐵𝐵𝐵𝐵𝑡𝑡𝑡𝑡 𝑌𝑌𝑌𝑌𝑡𝑡𝑡𝑡+𝜏𝜏𝜏𝜏 𝑡𝑡𝑡𝑡 + 𝜏𝜏𝜏𝜏 𝑑𝑑𝑑𝑑𝐵𝐵𝐵𝐵𝑡𝑡𝑡𝑡+𝜏𝜏𝜏𝜏 𝑟𝑟𝑟𝑟 (𝑌𝑌𝑌𝑌𝑡𝑡𝑡𝑡+𝜏𝜏𝜏𝜏)
𝑟𝑟𝑟𝑟 (𝑀𝑀𝑀𝑀𝑡𝑡𝑡𝑡) (𝐵𝐵𝐵𝐵𝑡𝑡𝑡𝑡) (𝑑𝑑𝑑𝑑𝐵𝐵𝐵𝐵𝑡𝑡𝑡𝑡+𝜏𝜏𝜏𝜏) (𝑀𝑀𝑀𝑀𝑡𝑡𝑡𝑡
𝐵𝐵𝐵𝐵𝑡𝑡𝑡𝑡)
(𝑑𝑑𝑑𝑑𝐵𝐵𝐵𝐵𝑡𝑡𝑡𝑡+𝜏𝜏𝜏𝜏)
2
, the book value
Side 32
𝑀𝑀𝑀𝑀𝑡𝑡𝑡𝑡 t, 𝐵𝐵𝐵𝐵𝑡𝑡𝑡𝑡 𝑌𝑌𝑌𝑌𝑡𝑡𝑡𝑡+𝜏𝜏𝜏𝜏 𝑡𝑡𝑡𝑡 + 𝜏𝜏𝜏𝜏 𝑑𝑑𝑑𝑑𝐵𝐵𝐵𝐵𝑡𝑡𝑡𝑡+𝜏𝜏𝜏𝜏 𝑟𝑟𝑟𝑟 (𝑌𝑌𝑌𝑌𝑡𝑡𝑡𝑡+𝜏𝜏𝜏𝜏)
𝑟𝑟𝑟𝑟 (𝑀𝑀𝑀𝑀𝑡𝑡𝑡𝑡) (𝐵𝐵𝐵𝐵𝑡𝑡𝑡𝑡) (𝑑𝑑𝑑𝑑𝐵𝐵𝐵𝐵𝑡𝑡𝑡𝑡+𝜏𝜏𝜏𝜏) (𝑀𝑀𝑀𝑀𝑡𝑡𝑡𝑡
𝐵𝐵𝐵𝐵𝑡𝑡𝑡𝑡)
(𝑑𝑑𝑑𝑑𝐵𝐵𝐵𝐵𝑡𝑡𝑡𝑡+𝜏𝜏𝜏𝜏)
2
and the expected change in book value
Side 32
𝑀𝑀𝑀𝑀𝑡𝑡𝑡𝑡 t, 𝐵𝐵𝐵𝐵𝑡𝑡𝑡𝑡 𝑌𝑌𝑌𝑌𝑡𝑡𝑡𝑡+𝜏𝜏𝜏𝜏 𝑡𝑡𝑡𝑡 + 𝜏𝜏𝜏𝜏 𝑑𝑑𝑑𝑑𝐵𝐵𝐵𝐵𝑡𝑡𝑡𝑡+𝜏𝜏𝜏𝜏 𝑟𝑟𝑟𝑟 (𝑌𝑌𝑌𝑌𝑡𝑡𝑡𝑡+𝜏𝜏𝜏𝜏)
𝑟𝑟𝑟𝑟 (𝑀𝑀𝑀𝑀𝑡𝑡𝑡𝑡) (𝐵𝐵𝐵𝐵𝑡𝑡𝑡𝑡) (𝑑𝑑𝑑𝑑𝐵𝐵𝐵𝐵𝑡𝑡𝑡𝑡+𝜏𝜏𝜏𝜏) (𝑀𝑀𝑀𝑀𝑡𝑡𝑡𝑡
𝐵𝐵𝐵𝐵𝑡𝑡𝑡𝑡)
(𝑑𝑑𝑑𝑑𝐵𝐵𝐵𝐵𝑡𝑡𝑡𝑡+𝜏𝜏𝜏𝜏)
2
constant, the variation in expected earnings should be related in a mechanical way to the variation in the rate of return. High expected profitability predicts a high rate of return, just as high valuation
Side 32
𝑀𝑀𝑀𝑀𝑡𝑡𝑡𝑡 t, 𝐵𝐵𝐵𝐵𝑡𝑡𝑡𝑡 𝑌𝑌𝑌𝑌𝑡𝑡𝑡𝑡+𝜏𝜏𝜏𝜏 𝑡𝑡𝑡𝑡 + 𝜏𝜏𝜏𝜏 𝑑𝑑𝑑𝑑𝐵𝐵𝐵𝐵𝑡𝑡𝑡𝑡+𝜏𝜏𝜏𝜏 𝑟𝑟𝑟𝑟 (𝑌𝑌𝑌𝑌𝑡𝑡𝑡𝑡+𝜏𝜏𝜏𝜏)
𝑟𝑟𝑟𝑟 (𝑀𝑀𝑀𝑀𝑡𝑡𝑡𝑡) (𝐵𝐵𝐵𝐵𝑡𝑡𝑡𝑡) (𝑑𝑑𝑑𝑑𝐵𝐵𝐵𝐵𝑡𝑡𝑡𝑡+𝜏𝜏𝜏𝜏) (𝑀𝑀𝑀𝑀𝑡𝑡𝑡𝑡
𝐵𝐵𝐵𝐵𝑡𝑡𝑡𝑡)
(𝑑𝑑𝑑𝑑𝐵𝐵𝐵𝐵𝑡𝑡𝑡𝑡+𝜏𝜏𝜏𝜏)
2
and high rates of expected investment
Side 32
𝑀𝑀𝑀𝑀𝑡𝑡𝑡𝑡 t, 𝐵𝐵𝐵𝐵𝑡𝑡𝑡𝑡 𝑌𝑌𝑌𝑌𝑡𝑡𝑡𝑡+𝜏𝜏𝜏𝜏 𝑡𝑡𝑡𝑡 + 𝜏𝜏𝜏𝜏 𝑑𝑑𝑑𝑑𝐵𝐵𝐵𝐵𝑡𝑡𝑡𝑡+𝜏𝜏𝜏𝜏 𝑟𝑟𝑟𝑟 (𝑌𝑌𝑌𝑌𝑡𝑡𝑡𝑡+𝜏𝜏𝜏𝜏)
𝑟𝑟𝑟𝑟 (𝑀𝑀𝑀𝑀𝑡𝑡𝑡𝑡) (𝐵𝐵𝐵𝐵𝑡𝑡𝑡𝑡) (𝑑𝑑𝑑𝑑𝐵𝐵𝐵𝐵𝑡𝑡𝑡𝑡+𝜏𝜏𝜏𝜏) (𝑀𝑀𝑀𝑀𝑡𝑡𝑡𝑡
𝐵𝐵𝐵𝐵𝑡𝑡𝑡𝑡)
(𝑑𝑑𝑑𝑑𝐵𝐵𝐵𝐵𝑡𝑡𝑡𝑡+𝜏𝜏𝜏𝜏)
2
predict a lower expected return.
As Fama and French (2006) and Novy-Marx (2013) point out, the clean sur-plus relation does not tell us whether expected equity returns are consistent with rational pricing; it simply suggests that expected profitability, along with book-to-market and investment, may help identify higher expected returns in the cross section. Fama and French (2006) show that profitability, as measured by net earnings before extraordinary items, is indeed related to expected returns, but that its explanatory power is relatively smaller than the explanatory power of book-to-market. Using a different measure of profitabil-ity – gross profits scaled by assets – Novy-Marx (2013) shows that profitability
23
THE QUALITY FACTOR
NORGES BANK INVESTMENT MANAGEMENT / DISCUSSION NOTE
can explain as much of the variation in expected returns as can value. Novy-Marx argues that top-line profitability “works” better in pricing tests because it is relatively less distorted by accounting estimates than net profit. In an updated version of their profitability study, Fama and French (2014) show that using operating profit instead of net profit improves the results. In fact, a four-factor model that includes the market, size, profitability and investment factors can fully explain the cross-sectional variation in value sorts, thereby rendering the value factor redundant. For practical purposes, a five-factor model that includes the market, value, size, profitability and investment pro-vides an excellent characterisation of expected equity returns.
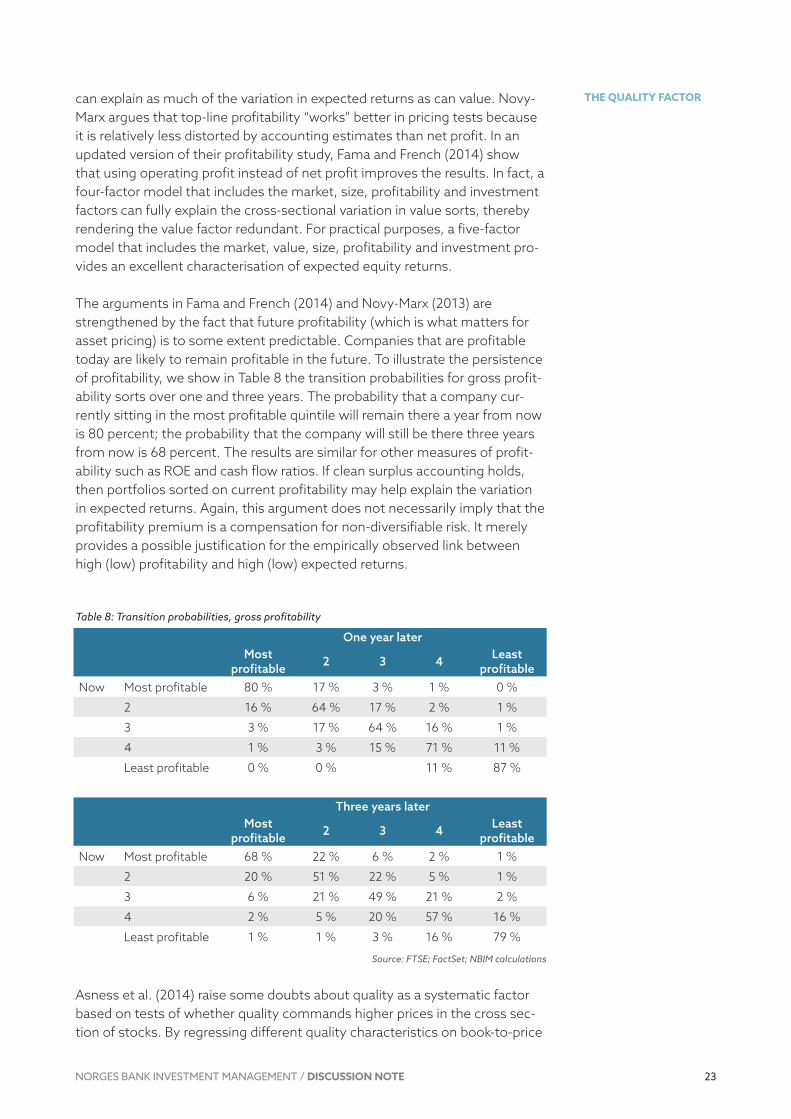
The arguments in Fama and French (2014) and Novy-Marx (2013) are strengthened by the fact that future profitability (which is what matters for asset pricing) is to some extent predictable. Companies that are profitable today are likely to remain profitable in the future. To illustrate the persistence of profitability, we show in Table 8 the transition probabilities for gross profit-ability sorts over one and three years. The probability that a company cur-rently sitting in the most profitable quintile will remain there a year from now is 80 percent; the probability that the company will still be there three years from now is 68 percent. The results are similar for other measures of profit-ability such as ROE and cash flow ratios. If clean surplus accounting holds, then portfolios sorted on current profitability may help explain the variation in expected returns. Again, this argument does not necessarily imply that the profitability premium is a compensation for non-diversifiable risk. It merely provides a possible justification for the empirically observed link between high (low) profitability and high (low) expected returns.
Table 8: Transition probabilities, gross profitability
One year laterMost
profitable 2 3 4 Least profitable
Now Most profitable 80 % 17 % 3 % 1 % 0 %
2 16 % 64 % 17 % 2 % 1 %
3 3 % 17 % 64 % 16 % 1 %
4 1 % 3 % 15 % 71 % 11 %
Least profitable 0 % 0 % 11 % 87 %
Three years laterMost
profitable 2 3 4 Least profitable
Now Most profitable 68 % 22 % 6 % 2 % 1 %
2 20 % 51 % 22 % 5 % 1 %
3 6 % 21 % 49 % 21 % 2 %
4 2 % 5 % 20 % 57 % 16 %
Least profitable 1 % 1 % 3 % 16 % 79 %
Source: FTSE; FactSet; NBIM calculations
Asness et al. (2014) raise some doubts about quality as a systematic factor based on tests of whether quality commands higher prices in the cross sec-tion of stocks. By regressing different quality characteristics on book-to-price

24
THE QUALITY FACTOR
NORGES BANK INVESTMENT MANAGEMENT / DISCUSSION NOTE
ratios, they find some evidence that quality is partly reflected in valuations, but the magnitude of the effect is too small to justify the higher returns for quality stocks. Quality can explain only 12 percent of the cross-sectional var-iation in stock prices in the US sample, and 6 percent globally. Given quality’s counter-cyclicality and favourable risk profile, the authors consider it unlikely that the unexplained portion of the quality premium is due to its correlation with some non-diversifiable risk factor.
The other two dimensions of quality – safety and earnings quality – are even more difficult to place in a risk-based pricing framework. Khan (2008) claims that rationally priced economic and financial distress risk may account for the accrual anomaly. He shows that much, but not all, of the variation in average returns on high- and low-accrual firms can be explained by a four-factor risk model that includes the Fama-French size and value factors and the cash flow news and discount rate news factors of Campbell and Vuolteenaho (2004). He claims that the two news factors capture macro risks that are also corre-lated with accruals and can therefore explain the anomaly. Wu et al. (2010) also propose a risk-based explanation for the accruals anomaly based on the “q-theory” of investments. In this framework, the authors interpret accruals as working capital investments that firms allocate in response to discount rate changes. When the discount rate is low, more projects become profita-ble, which leads to an increase in firm investment and accruals. The expected returns, however, fall as the required rate of return is relatively low. Empirical-ly, the authors show that adding an investment factor in the pricing model re-duces the magnitude of the accruals anomaly, suggesting that firms’ rational responses to discount rate shocks may be driving the anomaly rather than investor irrationality. However, as Richardson et al. (2010) argue, the measure of investment that Wu et al. (2010) use in their study is mechanically corre-lated with accruals. It is therefore not surprising that the returns of a long-short portfolio formed on accruals can be explained by a long-short portfolio formed on investment. It is not clear whether the pricing of the investment and accruals portfolios are driven by risk-based or other expanations.
Hirshleifer et al. (2012) also cast serious doubt on Kahn’s (2008) and other risk-based explanations. They construct an accrual factor-mimicking portfolio (called Conservative minus Aggressive) and show that it is not the loading on the accrual factor that matters for returns but the accrual characteristic itself. In horse-race regressions in which the future stock return is the dependent variable, the accrual characteristic tends to drive out the predictive power of the factor loadings, suggesting that investors might misvalue the profitability characteristic. Companies that load on the accrual factor (i.e. are presumably riskier) do not necessarily generate the higher returns the risk-based explana-tion would predict.
Momentè, Regianni and Richardson (2014) also present strong evidence that the accrual anomaly is unlikely to be accounted for by priced risk. They decompose different measures of accruals into firm-specific and related-firm components and find that the negative relation between accruals and returns is almost 100 percent attributable to the firm-specific component. If it were risk driving the relation between accruals and future returns, one would expect firms operating in the same environment to share the risk. Again,

25
THE QUALITY FACTOR
NORGES BANK INVESTMENT MANAGEMENT / DISCUSSION NOTE
these results are more consistent with misvaluations of accruals than with risk-based pricing.
c Behavioural explanationsA number of behavioural and institutional factors have been put forward to explain why apparently less risky companies command higher returns. Investors may have irrational preferences for volatile and skewed investments due to lottery preferences or overconfidence. Kumar (2009) argues that various socioeconomic and psychological factors lead to excess investments in lottery-type stocks. The demand for lottery-type stocks increases during bad economic times, and such shifts in demand influence the returns of lot-tery-type stocks. Similarly, Cornell (2008) argues that overconfidence induces investors who perceive themselves to possess superior security selection skill to invest more heavily in securities with highly volatile and skewed returns. The collective result of such biases is to overprice the more volatile, speculative stocks.
Institutional investors are also not exempt from biases. Leverage-constrained investors who seek maximum returns from beta risk must invest in high-beta stocks directly as opposed to a levered portfolio of low-beta stocks (Frazzini and Pedersen 2013). Short-sale constraints may prevent sophisticated inves-tors from eliminating the mispricing of risky stocks (Hong and Sraer 2012). Cohen, Gompers and Vuolteenaho (2002) provide evidence from trading between individuals and institutions, that institutional investors do not fully eliminate underreactions to cash flow news, likely due to tracking-error con-cerns and reluctance to short stocks.
Sloan (1996) argues that the accrual anomaly may be due to management overestimates of future growth. Accruals necessarily represent manage-ment’s best estimates of the future benefits that will accrue to the firm. When accruals are too high, it is less likely that the full value of the accrual will be realised, thereby leading to lower profitability for the firm. Richardson et al. (2005) provide evidence for this hypothesis by linking accrual reliabili-ty to earnings persistence. They argue that not all types of accruals are the same, and some are more likely to be realised than others. They categorise each balance sheet item according to the reliability of the accruals it contains and find that less reliable accruals lead to less earnings persistence. Inves-tors do not fully anticipate the drop in earnings, which in turn leads to stock mispricings.
IV ConclusionIn this note, we provided a brief survey of the growing literature on the quality premium and documented the outperformance of quality-based investment strategies in various markets. Quality is a multi-faceted con-cept that encompasses a number of market “anomalies” uncovered in the past 30 years. Quality has no universally agreed definition and has been far less researched than the small-cap and value effects. However, long/short portfolios based on various quality metrics such as gross profits to assets, cash flows to assets, EPS stability and EPS quality have delivered large and economically significant premiums that cannot be explained by traditional asset pricing models. Whether quality constitutes a systematic risk factor
26
THE QUALITY FACTOR
NORGES BANK INVESTMENT MANAGEMENT / DISCUSSION NOTE
is a difficult question. Some empirical evidence suggests that profitability is akin to value and has as much explanatory power in pricing the cross section of expected returns. Other dimensions of quality such as the leverage and accrual puzzles are more difficult to reconcile with notions of risk pricing. It is likely that institutional constraints and behavioural biases may account for these effects.
V ReferencesAsness, C., Frazzini, A. and Pedersen, L. (2014). Quality Minus Junk. Working paper.
Bebchuk, L., Cohen, A. and Wang, C. (2013). Learning the Disappearing As-sociation between Governance and Returns. Journal of Financial Economics, 108, 2, 323-348.
Beneish, M. (1999). The Detection of Earnings Manipulation. Financial Ana-lysts Journal, 55, 5, 24-36.
Berk, J. (2000). Sorting Out Sorts. Journal of Finance, 55, 407-427.
Bhandari, L. (1988). Debt/Equity Ratio and Expected Common Stock Returns: Empirical Evidence. Journal of Finance, 43, 507-528.
Black, F. (1972). Capital Market Equilibrium with Restricted Borrowing. Journal of Business, 45, 444-455.
Brandt, M., Santa-Clara, P. and Valkanov, R. (2009). Parametric Portfolio Poli-cies: Expoiting Characteristics in the Cross-Section of Equity Returns. The Review of Financial Studies, 22, 9, 3411-3447.
Campbell, J., Hilscher, J. and Szilagyi, J. (2008). In Search of Distress Risk. Journal of Finance, 63, 2899-2939.
Campbell, J. and Vuolteenaho, T. (2004). Bad Beta, Good Beta. American Economic Review, 94, 5, 1249-1275.
Carhart, M. (1997). On Persistence in Mutual Fund Performance. Journal of Finance, 52, 57-82.
Chen, L., Novy-Marx, R. and Zhang, L. (2011). An alternative Three Factor Model. Working paper.
Cornell, B. (2008). The Pricing of Volatility and Skewness: A New Inter-pretation. Working paper.
Dichev, I. (1998). Is the Risk of Bankruptcy a Systematic Risk? Journal of Finance, 53, 1131-1147.
Fama, E. and French, K. (1992). The Cross-section of Expected Stock Returns. Journal of Finance, 47, 427-465.
27
THE QUALITY FACTOR
NORGES BANK INVESTMENT MANAGEMENT / DISCUSSION NOTE
Fama, E. and French, K. (1993). Common Risk Factors in the Returns on Stocks and Bonds. Journal of Financial Economics, 48, 33-56.
Fama, E. and French, K. (2005). Financing Decisions: Who Issues Stock? Journal of Financial Economics, 76, 3, 549-582.
Fama, E. and French, K. (2006). Profitability, Investment and Average Returns Journal of Financial Economics, 82, 491-518.
Fama, E. and French, K. (2014). A Five-Factor Asset Pricing Model (September 2014). Fama-Miller working paper. Available at http://ssrn.com/ abstract=2287202.
Frazzini, A. and Pedersen, L. (2013). Betting against Beta. Journal of Financial Economics, 111, 1-25.
George, T. and Hwang, C. (2010). A Resolution of the Distress Risk and Leverage Puzzles in the Cross Section of Stock Returns. Journal of Financial Economics, 96, 56-79.
Gompers, P., Ishii, J. and Metrick, A. (2003). Corporate Governance and Equity Prices. Quarterly Journal of Economics, 118, 107-155.
Graham, B. (1973). The Intelligent Investor (4th rev. ed.). Harpers & Row, New York.
Grantham, J. (2004). The Case for Quality – The Danger of Junk. GMO Working paper.
Greenblatt, J. (2010). The Little Book that Still Beats the Market. John Wiley & Sons, Hoboken, New Jersey.
Griffin, J. and Lemmon, M. (2002). Book-to-Market Equity, Distress Risk, and Stock Returns. Journal of Finance, 57, 2317-2336.
Harvey, C., Liu, Y. and Zhu, H. (2015). …and the Cross-Section of Expected Returns (February 3, 2015). Available at http://ssrn.com/abstract=2249314.
Haugen, R. and Baker, N. (1996). Commonality in the Determinants of Expected Stock Returns. Journal of Financial Economics, 41, 401-439.
Hirshleifer, D., Hou, K. and Teoh, S. (2012). The Accrual Anomaly: Risk or Mispricing? Management Science, 58, 2, 320-335.
Hirshleifer, D., Hou, K., Teoh, S. and Zhang, Y. (2004). Do Investors Overval-ue Firms with Bloated Balance Sheets? Journal of Accounting and Econom-ics, 38, 297-331.
Hong, H. and Sraer, D. (2015). Speculative Betas (June 15, 2015). Available at http://ssrn.com/abstract=1967462.

28
THE QUALITY FACTOR
NORGES BANK INVESTMENT MANAGEMENT / DISCUSSION NOTE
Huang, A. (2009). The Cross Section of Cashflow Volatility and Expected Stock Returns. Journal of Empirical Finance, 16, 409-429.
Jensen, M. (1968). The Performance of Mutual Funds in the Period 1945-64. Journal of Finance, 23, 389-416.
Khan, M. (2008). Are Accruals Mispriced? Evidence from Tests of an Inter-temporal Capital Asset Pricing Model. Journal of Accounting and Economics, 45, 1, 55-77.
Kozlov, M. and Petajisto, A. (2013). Global Return Premiums on Earnings Quality, Value, and Size (January 7, 2013). Available at http://ssrn.com/ abstract=2179247.
Kumar, A. Who Gambles in the Stock Market? Journal of Finance, 64, 1889-1933.
Leippold, M. and Lohre, H. (2010). Data Snooping and the Global Accrual Anomaly. Working paper, EFA 2007 Ljubljana Meetings Paper.
Lintner, J. (1965). The Valuation of Risk Assets and the Selection of Risky Investments in Stock Portfolios and Capital Budgets. Review of Economics and Statistics, 47, 13-37.
Lo, A. and MacKinlay, C. (1990). Data-snooping Biases in Tests of Financial Asset Pricing Models. Review of Financial Studies, 3, 431-468.
Momentè, F., Reggiani, F. and Richardson, S. (2014). Accruals and Future Performance: Can It Be Attributed to Risk? Review of Accounting Studies, 20, 4, 1297-1333.
Novy-Marx, R. (2013). The Other Side of Value: Good Growth and the Gross Profitability Premium. Journal of Financial Economics, 108, 1-28.
Novy-Marx, R. (2014). Quality Investing. Working paper.
Novy-Marx, R. (2015). Backtesting Strategies Based on Multiple Signals. NBER Paper No. 21329.
Penman S., Richardson, S. and Tuna, I. (2007). The Book-to-Price Effect in Stock Returns: Accounting for Leverage. Journal of Accounting Research, 45, 427-467.
Piotroski, J. (2000). Value Investing: The Use of Historical Financial State-ment Information to Separate Winners from Losers. Journal of Accounting Research, 38, 1-41.
Richardson, S., Sloan, R., Soliman, M. and Tuna, I. (2005). Accrual Reliability, Earnings Persistence and Stock Prices. Journal of Accounting and Economics, 39, 3, 437-485.

29
THE QUALITY FACTOR
NORGES BANK INVESTMENT MANAGEMENT / DISCUSSION NOTE
Richardson, S., Tuna, I. and Wysocki (2010). Accounting Anomalies and Fundamental Analysis: A Review of Recent Research Advances. Journal of Accounting and Economics, 50, 410-454.
Sharpe, W. (1964). Capital Asset Prices: A Theory of Market Equilibrium under Conditions of Risk. Journal of Finance, 19, 425-442.
Sloan, R. (1996). Do Stock Prices Reflect Information in Accruals and Cash Flows about Future Earnings? Accounting Review, 71, 289-315.
Vassalou, M. and Xing, Y. (2004). Default Risk in Equity Returns. Journal of Finance, 59, 831-868.
Wu, J., Zhang, L. and Zhang, F. (2010). The q-Theory Approach to Understanding the Accrual Anomaly. Journal of Accounting Research, 48, 1, 177-223..

30
THE QUALITY FACTOR
NORGES BANK INVESTMENT MANAGEMENT / DISCUSSION NOTE
1 Appendix IQuality factor portfolios that include all firms (financial and non-financial) in the sample
Gross profit / Assets
Cash flows / Assets
Lever-age
Change in net debt
EPS stabil-ity
EPS quality
Com-bined
Global, unadjusted
Average 7.94 4.64 2.41 2.45 7.90 4.79 8.79
Std dev 9.09 10.69 9.10 7.40 13.00 8.47 9.74
Sharpe 0.87 0.43 0.27 0.33 0.61 0.57 0.90
Min monthly -8.00 -13.82 -10.80 -11.68 -10.23 -9.34
Max monthly 8.28 10.09 9.77 9.79 12.59 11.66 9.23
Correlations
Gross profit / Assets 1.00
Cash flows / Assets 0.49 1.00
Leverage 0.41 0.48 1.00
Change in net debt 0.23 0.45 0.67 1.00
EPS stability 0.32 0.17 0.29 -0.03 1.00
EPS quality 0.30 0.68 0.61 0.54 0.11 1.00
Combined 0.74 0.60 0.67 0.46 0.58 0.48 1.00
Region and sector neutral
Average 4.21 4.51 1.82 1.88 5.27 3.81 4.87
Std dev 6.41 7.97 5.93 5.37 6.86 5.29 6.63
Sharpe 0.66 0.57 0.31 0.35 0.77 0.72 0.73
Min monthly -7.85 -11.92 -8.50 -7.45 -6.92 -6.70 -8.44
Max monthly 8.17 9.28 9.81 5.30 6.72 6.19 7.49
Correlations
Gross profit / Assets 1.00
Cash flows / Assets 0.58 1.00
Leverage 0.55 0.50 1.00
Change in net debt 0.23 0.34 0.29 1.00
EPS stability 0.39 0.51 0.43 0.10 1.00
EPS quality 0.12 0.41 0.13 0.38 -0.04 1.00
Combined 0.68 0.75 0.60 0.36 0.55 0.22 1.00