03-04
14
1 INTRODUCTION 1.1 General Assessment of the impacts of liquefaction on earth structures is, in current state-of-practice, sep- arated into three discrete, uncoupled analyses (Byrne & Seid-Karbasi 2003): (a) will liquefac- tion be triggered, (b) if liquefaction is expected, is the slope stable assuming post-liquefaction strengths, (c) are displacement tolerable? State of practice liquefaction triggering is usually as- sessed with empirical correlations (Youd et al. 2001), and will not be discussed specifically in this paper. Post-liquefaction strengths are generally obtained from one of a number of empirical correlations, and utilized in a limit-equilibrium or infinite-slope analysis. Assuming a flow slide is not expected on the basis of the above, displacements are often estimated using a number of empirical relationships. Alternatively, the state-of-art for assessing liquefaction involves an effective stress analysis whereby liquefaction triggering, and displacements (during earthquake motion) are assessed in a fully coupled manner (Byrne & Seid-Karbasi 2003). Should liquefaction be triggered for zones of material within the model, post-liquefaction strengths are generally input to these zones based on empirical relationships, and the displacements following earthquake motion estimated (Cas- tillo et al. 2005, Beaty & Byrne 2011). If the model, with these parameters, does not achieve equilibrium prior to failure of the grid, it is assumed that a flow slide will occur. Hence, for both state-of-practice and state-of-art methods, if a flow slide is expected, esti- mates of the distance and/or extent of this flow are not made within the framework outlined above. Flow slide estimates, if made, usually rely on hydraulic-based methods. Computational fluid dynamics methods have also been utilized to simulate liquefaction flow at the laboratory scale (Huang et al. 2012). While useful for characterizing flow of liquefied material when large distances are considered, these methods operate within a different framework to that of conven- tional soil mechanics. It may therefore be difficult to implement them within the same continu- um modeling packages and/or soil mechanics-based frameworks used to assess liquefaction triggering. Thus the process of assessing liquefaction and flow distance becomes completely de- coupled, with differing approaches for each component. Simulating historic liquefaction flow slides with FLAC rezoning D. Reid University of Western Australia, Perth, WA, Australia Golder Associates Pty. Ltd., Perth, WA, Australia ABSTRACT: FLAC rezoning is utilized to model a series of historic liquefaction flow slides. Material parameters are drawn from previous analyses of these incidents. Parametric analyses are performed to assess the impacts of modifying different material parameters on the flow be- havior modeled. The work conducted produced mixed results, with many of the modeled flow failures resembling those observed, while the flow distance is generally underestimated. Poten- tial reasons for this discrepancy are outlined. Further analyses of this kind to be undertaken are listed.
-
Upload
shachen2014 -
Category
Documents
-
view
222 -
download
7
description
liquefaction analysis
Transcript of 03-04
1 INTRODUCTION
1.1 General
Assessment of the impacts of liquefaction on earth structures is, in current state-of-practice, sep-arated into three discrete, uncoupled analyses (Byrne & Seid-Karbasi 2003): (a) will liquefac-tion be triggered, (b) if liquefaction is expected, is the slope stable assuming post-liquefaction strengths, (c) are displacement tolerable? State of practice liquefaction triggering is usually as-sessed with empirical correlations (Youd et al. 2001), and will not be discussed specifically in this paper. Post-liquefaction strengths are generally obtained from one of a number of empirical correlations, and utilized in a limit-equilibrium or infinite-slope analysis. Assuming a flow slide is not expected on the basis of the above, displacements are often estimated using a number of empirical relationships.
Alternatively, the state-of-art for assessing liquefaction involves an effective stress analysis whereby liquefaction triggering, and displacements (during earthquake motion) are assessed in a fully coupled manner (Byrne & Seid-Karbasi 2003). Should liquefaction be triggered for zones of material within the model, post-liquefaction strengths are generally input to these zones based on empirical relationships, and the displacements following earthquake motion estimated (Cas-tillo et al. 2005, Beaty & Byrne 2011). If the model, with these parameters, does not achieve equilibrium prior to failure of the grid, it is assumed that a flow slide will occur.
Hence, for both state-of-practice and state-of-art methods, if a flow slide is expected, esti-mates of the distance and/or extent of this flow are not made within the framework outlined above. Flow slide estimates, if made, usually rely on hydraulic-based methods. Computational fluid dynamics methods have also been utilized to simulate liquefaction flow at the laboratory scale (Huang et al. 2012). While useful for characterizing flow of liquefied material when large distances are considered, these methods operate within a different framework to that of conven-tional soil mechanics. It may therefore be difficult to implement them within the same continu-um modeling packages and/or soil mechanics-based frameworks used to assess liquefaction triggering. Thus the process of assessing liquefaction and flow distance becomes completely de-coupled, with differing approaches for each component.
Simulating historic liquefaction flow slides with FLAC rezoning
D. Reid University of Western Australia, Perth, WA, Australia Golder Associates Pty. Ltd., Perth, WA, Australia
ABSTRACT: FLAC rezoning is utilized to model a series of historic liquefaction flow slides. Material parameters are drawn from previous analyses of these incidents. Parametric analyses are performed to assess the impacts of modifying different material parameters on the flow be-havior modeled. The work conducted produced mixed results, with many of the modeled flow failures resembling those observed, while the flow distance is generally underestimated. Poten-tial reasons for this discrepancy are outlined. Further analyses of this kind to be undertaken are listed.

Itasca introduced rezoning capabilities to the large strain formulation of FLAC in Version 6 (Itasca 2008). This feature has the potential to significantly improve post-liquefaction displace-ments estimates, and more generally, the post-failure (regardless of mechanism) deformation of earth structures. In fact, rezoning has already been utilized in a predictive design context to es-timate post-liquefaction displacements (Jacka & Norfolk 2011). However, the author is unaware of any attempts to verify it against historic dam failures. Given the novel nature of this capabil-ity, and its potential in design, it may be beneficial to assess the capabilities of rezoning in ana-lyzing some of the better documented liquefaction flow failures outlined in the literature. This will serve to provide further confidence in the geotechnical community regarding this tool, while hopefully allowing insight to be gained into the types of choices and assumptions that must be made in such an analysis, and their impact on the results.
While rezoning schemes have been implemented in other software codes (for example, Hu & Randolph 1998), FLAC offers some key advantages in the application of rezoning to embank-ment failure modeling. In particular, state-of-art liquefaction constitutive models for both dy-namic (UBCSand, see Byrne et al. 1995, Beaty & Byrne 1998. Beaty & Byrne 2011) and static liquefaction (NorSand, see Jefferies 1993, Jefferies and Shuttle 2005) have been implemented in FLAC. Therefore, “loose-coupling” of the post-liquefaction deformation analysis to triggering analyses can be implemented readily.
1.2 Background on post liquefaction strengths
As outlined above, the estimation of post-liquefaction strength, su(LIQ), is of critical importance to the assessment of the potential consequences of liquefaction, using either state-of-practice or state-of-art procedures. Early methods to estimate post-liquefaction strength were referred to as the Steady State School (Poulos et al. 1985), and involved laboratory testing. This method was subsequently abandoned, as it was found that small changes in void ratio during sampling would have major impacts on the results, and as laboratory testing cannot (in itself) capture the effects of void ratio redistribution. Void ratio redistribution appears to be fundamental to the develop-ment of post liquefaction strengths (for example, Seid-Karbasi & Byrne 2007, Been et al. 2012).
Following the Steady State method, attention turned to developing post-liquefaction strengths from empirical correlations to penetration resistance. A variety of such methods are currently available, with the most popular current methods listed in Table 1, while the relationship pro-posed by Olson & Stark (2002) is shown in Figure 1.
These methods are developed from back analysis of liquefaction flow failures, with su(LIQ) estimated from the final post-failure geometry. Assumptions regarding the zone of liquefaction, the pre-liquefaction vertical effective stresses, and the strength parameters of non-liquefied soils are all required in these analyses. The primary differences between the methods are the correc-tions applied (or not) for fines content/compressibility in the final relationship proposed, wheth-er the method normalizes su(LIQ) with pre-liquefaction vertical effective stress, how and if cog-nizance is taken of kinetics/momentum of the failure, and which set of case histories are included. Importantly, these methods include cognizance of void ratio redistribution, albeit in an empirical fashion.
Table 1. Current Empirical su(LIQ) Methods. _____________________________________________________________________________________________________
Method Fines / Compressibility Normalized by σ’vo? Corrections _____________________________________________________________________________________________________
Seed & Harder (1990) Fines Content No Olson & Stark (2001) None Yes Idriss & Boulanger (2008) Fines Content Yes and No Robertson (2010) Kc Yes _____________________________________________________________________________________________________

Figure 1. su(LIQ)/ σ’v ratio from Penetration Resistance (from Olson & Stark 2002).
1.3 Current work
The purpose of the current work is to attempt to utilize FLAC’s rezoning capabilities to make Class C1 predictions (Lambe 1973) of the flow behavior of a selected number of historic dam failures. This has been attempted through use of strength parameters previously determined by other authors in detailed examination of these events. This exercise is hoped to assess the likely accuracy, and the importance of different parameters, when using rezoning to assess flow behav-ior in a predictive (Class A) context.
2 METHODS
2.1 General
A series of case histories from the literature were selected on the basis of their relevance to the work planned. To avoid the necessity of involving displacements generated during earthquake loading, and hence requiring dynamic modeling, liquefaction case histories selected were either triggered statically, or involved flow slides that occurred following a delay from the end of earthquake shaking.
The following care histories were selected on the basis of the above criteria: Calaveras Dam (Hazen 1918) Wachusett (Olsen et al. 2000) Lower Sand Fernando Dam (LSFD) (Seed et al. 1973) Mochikoshi No. 2 (Ishihara 1984, Ishihara et al. 1990)
Calaveras, Wachusett, and LSFD were each water dams constructed primarily using the hy-draulic fill method. Mochikoshi No. 2 was a tailings dam raised by the upstream method. Of these case histories, Calaveras and Wachusett were triggered by static liquefaction during con-struction or first filling, while LSFD and Mochikosh No. 2 failed between 1-20 minutes after earthquake shaking ceased. Mochikoshi No. 1, which is similar to Mochikoshi No. 2, and ap-pears to have slightly more information available in the literature, was not selected. In that case, the flow slide began almost simultaneous to the earthquake motion (Olson 2001), and the dis-placements during the earthquake motion have been shown to be integral to the behavior of the flow slide (Byrne & Seid Karbasi 2003).

2.2 Model geometry
Pre and post-liquefaction geometries for each dam were obtained by digitizing those presented by Olson (2001). Typically, the geometry available ended at the final extent of the flow slide. While this is adequate for the limit-equilibrium analyses conducted in that work on a pre-defined failure surface, it is not sufficient for the numerical analyses performed here. The prima-ry goal of this work is to assess if the flow slide shape and distance can be reasonably predicted – something which cannot be achieved if the model extents are constrained. Hence, the existing topography has been extended in the models prepared here. This has been performed by assum-ing that the existing topography extends at a similar grade to 200 m beyond where the flow slide ended.
The pre-failure geometry for each dam considered is shown in Figures 2 through 5. An exam-ple of finite difference grid prepared for LSFD is shown as Figure 6. Each mesh was prepared with a similar overall “style” as that shown for LSFD. Average grid dimensions for each dam model were 4 m wide by 1.5 m high. The extended natural surface of each dam is not shown on these figures for clarity.
Liquefied regions were set to approximately match those estimated by Olson (2001). Mochikoshi No.2 did not appear to have a discrete zone of liquefaction noted by Olson. Hence, the same general extent as that nominated for Mochikoshi No. 1 was utilized.
Figure 2. Calaveras Dam.
Figure 3. Wachusett Dam.
Figure 4. Mochikoshi No. 2.

Figure 5. Lower San Fernando Dam.
Figure 6. Lower San Fernando Dam – Finite Difference Mesh.
2.3 Phreatic surface
In the work of Olson (2001), zones that were assumed to have not liquefied were typically as-signed drained friction angles, while pore pressures were assumed to be hydrostatic. It has there-fore been assumed in this work that zones of material outside the liquefied regions are fully drained with hydrostatic pore pressures. This is enforced via a FISH routine implemented at each rezoning event. It was found that rezoning events resulted in pockets of zero pore pressure developing at various places in the model (well below the water table), for reasons unknown to the author. Hence, manual enforcement of a hydrostatic pore pressure regime was performed.
A number of legitimate theoretical objections could be raised to the assumptions made in this work regarding pore pressures. It is highly unlikely that a hydrostatic pore pressure regime was present throughout the non-liquefied material during these failures. Given the rapid loading, and loose nature of much of these dams, contractive behavior is likely. However, appropriate model-ing of the shear-induced pore pressures throughout the dams analyzed would likely be impracti-cal. Insufficient information regarding in situ state or compressibility is available, as would be required to implement a sophisticated soil model such as NorSand. In addition, the rezoning log-
ic in its current form is only able to function on one constitutive model (Itasca 2011a) which would make it difficult to implement such a modeling technique. While contractive regions are expected, it is also likely that dilative regions were present at the perimeters of the dams and on the starter embankment for the hydraulic fill construction process. Hence, to some degree the contractive and dilative zones expected may “cancel out”. However, the limitations of this as-sumption are acknowledged.
For situations where water pressures would act on the deforming soil owing to the presence of a reservoir, FISH codes were developed to update these pressures as the geometry of the dam changed. The updating procedure selected in discussed in more detail below.
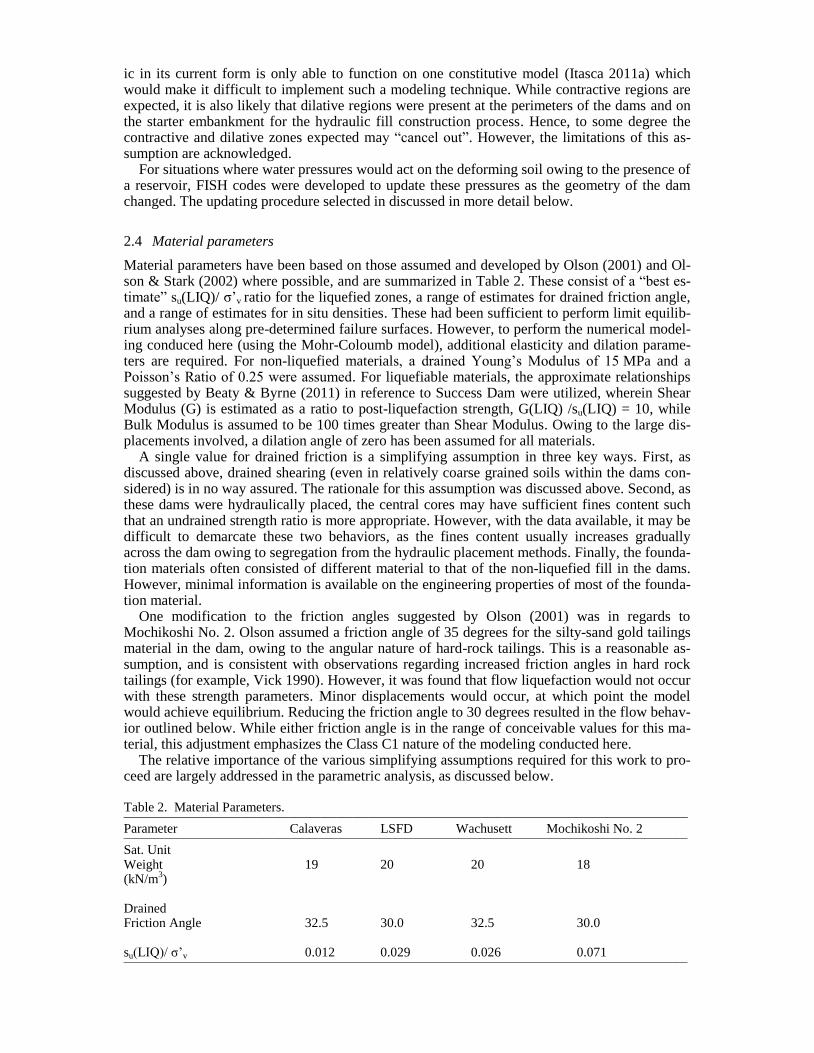
2.4 Material parameters
Material parameters have been based on those assumed and developed by Olson (2001) and Ol-son & Stark (2002) where possible, and are summarized in Table 2. These consist of a “best es-timate” su(LIQ)/ σ’v ratio for the liquefied zones, a range of estimates for drained friction angle, and a range of estimates for in situ densities. These had been sufficient to perform limit equilib-rium analyses along pre-determined failure surfaces. However, to perform the numerical model-ing conduced here (using the Mohr-Coloumb model), additional elasticity and dilation parame-ters are required. For non-liquefied materials, a drained Young’s Modulus of 15 MPa and a Poisson’s Ratio of 0.25 were assumed. For liquefiable materials, the approximate relationships suggested by Beaty & Byrne (2011) in reference to Success Dam were utilized, wherein Shear Modulus (G) is estimated as a ratio to post-liquefaction strength, G(LIQ) /su(LIQ) = 10, while Bulk Modulus is assumed to be 100 times greater than Shear Modulus. Owing to the large dis-placements involved, a dilation angle of zero has been assumed for all materials.
A single value for drained friction is a simplifying assumption in three key ways. First, as discussed above, drained shearing (even in relatively coarse grained soils within the dams con-sidered) is in no way assured. The rationale for this assumption was discussed above. Second, as these dams were hydraulically placed, the central cores may have sufficient fines content such that an undrained strength ratio is more appropriate. However, with the data available, it may be difficult to demarcate these two behaviors, as the fines content usually increases gradually across the dam owing to segregation from the hydraulic placement methods. Finally, the founda-tion materials often consisted of different material to that of the non-liquefied fill in the dams. However, minimal information is available on the engineering properties of most of the founda-tion material.
One modification to the friction angles suggested by Olson (2001) was in regards to Mochikoshi No. 2. Olson assumed a friction angle of 35 degrees for the silty-sand gold tailings material in the dam, owing to the angular nature of hard-rock tailings. This is a reasonable as-sumption, and is consistent with observations regarding increased friction angles in hard rock tailings (for example, Vick 1990). However, it was found that flow liquefaction would not occur with these strength parameters. Minor displacements would occur, at which point the model would achieve equilibrium. Reducing the friction angle to 30 degrees resulted in the flow behav-ior outlined below. While either friction angle is in the range of conceivable values for this ma-terial, this adjustment emphasizes the Class C1 nature of the modeling conducted here.
The relative importance of the various simplifying assumptions required for this work to pro-ceed are largely addressed in the parametric analysis, as discussed below.
Table 2. Material Parameters. __________________________________________________________________________________________________________
Parameter Calaveras LSFD Wachusett Mochikoshi No. 2 __________________________________________________________________________________________________________
Sat. Unit Weight 19 20 20 18 (kN/m
3)
Drained Friction Angle 32.5 30.0 32.5 30.0 su(LIQ)/ σ’v 0.012 0.029 0.026 0.071 __________________________________________________________________________________________________________

2.5 Parametric analysis
A parametric analysis was performed on the LSFD model. Inputs of friction angle of non-liquefied material, Young’s Modulus of non-liquefied material, su(LIQ)/ σ’v ratio, elastic param-eters of liquefied material, and area of liquefaction, were modified in isolation to each other. These values were varied as follows: Analysis Type 1: Friction angle – 5 degrees higher and lower, to cover a reasonable spectrum
of critical state friction angles for sandy and silty material Analysis Type 2: Young’s Modulus of non-liquefied material – a lower value of 1 MPa, and
higher value of 30 MPa, to cover a reasonable spectrum of sandy and silty material at varying effective stresses.
Analysis Type 3: su(LIQ)/ σ’v ratio lower value of 0.01 (nearing the lowest plausible value ever observed for liquefied materials), and an upper value of 0.076 which corresponds to highest estimate range for LSFD indicated by Olson (2001) and Olson and Stark (2002).
Analysis Type 4: G (LIQ) /su(LIQ) ratio was doubled and halved in comparison to the base case value of 10. A lower bound of approximately 5 appears reasonable based on a review of the post-liquefaction testing conducted by Wijewickreme et al. (2005) and James et al. (2011).
Analysis Type 5: Initial Liquefied Area – The zone of material in which liquefied strengths were assigned was increased and decreased by 50%. This was performed by modifying the slope of the “top” of the liquefied zone as required.
Analysis Type 6: Zone Density – element density was doubled. The range of values used in the parametric analyses are outlined in Table 3.
Table 3. Varied Material Parameters. _____________________________________________________________________________________________________
Analysis Fri. Angle E’ (MPa) su(LIQ)/ σ’v G (LIQ) /su(LIQ) _____________________________________________________________________________________________________
1-H 35 1-L 25 2-H 30 2-L 1 3-H 0.076 (0.1) 3-L 0.015 (0.01) 4-H 20 4-L 5 _____________________________________________________________________________________________________
2.6 Model development and implementation
Analyses have been conducted using FLAC v7.00.415 (Itasca 2011b) using the Mohr-Coloumb model. Models were developed as follows: a) Bring the model to static equilibrium in a single stage, with hydrostatic pore water pressures
based on pre-failure information (discussed below), and with external upstream water pres-sures acting on the model based on the reservoir water elevation. This reservoir water eleva-tion remained constant throughout the model runs.
b) Adjust strengths in the estimated zone of liquefaction on the basis of the su(LIQ)/ σ’v ratio selected (and reduce friction angle to zero in these zones).
c) Allow the model to run until equilibrium is achieved. As indicated by the above, staged development of the dams was not performed. It is generally
recognized that staging the development of embankment models similar to field conditions pro-duces the most realistic in situ stresses (Potts & Znidarcic 2001, Itasca 2011b). However, staged construction modeling, in order to improve the realism of in situ stresses, requires both construc-tion information, and calibration of an appropriate soil model for use in the staging process. Of these, the former is available in varying degrees, while the latter would be essentially impossible for many of the dams considered. Hence, given the number of unknowns and assumptions that must be adopted for this work to proceed, the author has elected to develop in situ strengths for

each dam analyzed in a single stage using the Mohr-Coloumb constitutive model. The limita-tions of this method are acknowledged.
A number of different strategies could be employed to implement running of the model while updating relevant external pressures resulting from reservoir water. These include: a) Running the model with solve, allowing rezoning to occur automatically when grid distortion
becomes unacceptable, and not updating pressures acting on the model b) Running the model with solve, allowing rezoning to occur automatically when grid distortion
becomes unacceptable, and updating pressures when rezoning is implemented c) Running the model via a loop function, allowing rezoning to occur automatically when grid
distortion becomes unacceptable, and updating pressures continuously during the model run Of these, (a), and to a lesser degree (b), result in the external pressures applied to the up-
stream portion of the embankments departing from correct values as the model steps. As defor-mation occurs in the upstream direction, the surface of the distorting material often decreases in depth below the reservoir surface level. Hence, if the external pressures utilized to simulate the reservoir water are not updated regularly, this provides additional (unrealistic) resistance against deformation. This was seen to reduce deformations in early development models using methods (a) and (b). Method (c) was utilized on this basis.
3 RESULTS
3.1 “Base Case” runs
The final profiles obtained using FLAC rezoning, compared to the observed post-failure behav-ior for Calaveras, Wachussets, and LSFD, are shown in Figure 7-9. In addition, in order to allow a quantitative comparison, two measures of the performance of the modeling have been com-pared for these three dams in Table 4: distance of the flow slide from the existing embankment toe, and cross sectional area of the flow slide outside the original dam area.
Table 4. Base Case Results. ________________________________________________________________________________________________________
Measure Calaveras Wachusett LSFD ________________________________________________________________________________________________________
Flow Slide Actual 219 96 50 Distance from FLAC 62 61 22 Toe of existing Dam (m) Cross Sectional Actual 3972 509 490 Area Outside of FLAC 2050 528 370 Original Dam (m
2)
________________________________________________________________________________________________________
Figure 7. Calaveras Dam Results.

Figure 8. Wachusett Dam Results.
Figure 9. Lower San Fernando Dam Results.
As indicated above, the qualitative performance of the modeling, i.e. when compared to the
observed post-failure slopes, is perhaps best described as “fair”. The overall shape of the de-formed geometry is in relative agreement. While in some cases the overall slope/shape of the model matches the post-failure observed behavior, they do so only in a general sense. Two rea-sons for this appear likely: It is likely that dams constructed with the hydraulic fill method, such as these, would have
dense dilative regions at the perimeter. The potential increased strength in these regions has not been allowed for in the models. A manifestation of the effect of these zones is observed clearly in the post-failure behavior of LSFD. Site observations indicated that the final de-formed profile consisted of large “blocks” of material, which floated/moved on liquefied ma-terial below (Olson 2001). Some of this liquefied material emerged from between these blocks. The presence of such blocks can be discerned from the post-failure profiles in Fig-ure 9. As the modeling conducted here has not allowed for stronger zones on the perimeter of the pre-failure dams, it is not surprising that this effect has not been reproduced.
The geometry of the final model profile often differs from that of the observed behavior in the core and on the downstream side of the failure. This is likely a result of zones of cohesive and/or dilative materials in these regions allowing steeper slopes than those possible with the

drained friction angle input utilized in this modeling. It is noteworthy that some of these in-ternal post-failure slopes have a FoS lower than unity using the material parameters suggest-ed by Olson (2001). This was not directly relevant to the limit equilibrium analyses conduct-ed in Olson’s work, as those were performed on discrete user-specific failure surfaces. Hence, localized areas of instability (under an assumed set of input parameters) were not de-tected, and were not relevant. When conducting a numerical analysis of these dams, where failure occurs without specific user input, and where the entire dam is modeled, these local-ized areas “flatten out” to achieve equilibrium under the relevant friction angle inputs. This flattening is evident in the model results for the Calaveras and Wachussets dams. In regards to the quantitative measures, area outside of the original dam and the distance of
flow slide, the modeling results generally underestimated these values. Possible causes for these discrepancies are discussed in more detail below.
3.2 Mochikoshi No. 2
Given the different type of behavior observed on site at Mochikoshi No. 2, the results of this model have been presented separately. As indicated above, initial runs of this model using a friction angle of 35 degrees did not result in a flow failure, only minor displacements. Once ad-justed to 30 degrees, the model exhibited flow failure, with the flowing tailings reaching the edge of the model. The model failed in what appears to be a similar manner to that observed on site. The zone of material above the crest of the starter embankment overtopped and flowed down the adjacent slope.
The model used did not extend far enough to model the actual flow slide, which was observed to extend approximately 800 m. As behavior on site likely involved channeling into an existing stream bed at the center of the valley, a 2D section within a continuum mechanics framework is likely inappropriate and hydraulic methods should be implemented. However, the rezoning analysis conducted would have indicated this if it had been performed in a Class A context. This is an important observation when considering applying this method in design.
A snap shot during the model run is shown in Figure 10. Interestingly, a flow depth of ap-proximately 2 m was observed, compared to 1.6 – 2.0 m observed in the field (Ishihara 1984).
Figure 10. Mochikoshi No. 2 – During Failure.

3.3 Parametric analysis
The Parametric Analyses indicated that modification of different parameters had the following effects on final post-failure profile: a) Increasing the initial liquefied zone had the greatest impact. However, an increase of this area
by 50% was insufficient to result in a flow extent as great as that observed on site. b) Changes to su(LIQ)/ σ’v ratio, particularly increasing this value, resulted in moderate
changes. c) Increasing the element density resulted in moderate changes, nearly identical in magnitude to
reduction of the su(LIQ)/ σ’v ratio change discussed above. d) Friction angle of non-liquefied regions had a minor impact. e) Elastic parameters, for liquefied and non-liquefied regions, had negligible impact.
The post-failure profiles with decreased su(LIQ)/ σ’v ratios and increased initial liquefaction area are presented in Figure 11. The final surface obtained when element density was increased has not been shown for clarity. It was almost identical to the result for analysis 3-L, where su(LIQ)/ σ’v ratio was reduced.
The importance of shear strengths / liquefied area, and negligible impacts of elastic parame-ters, appears to be reasonable as inspection of the failures indicated significant zones undergoing plastic deformation. This greater importance of strengths is also convenient, as shear strengths are easier to estimate than elastic parameters (particularly post-liquefaction) with the infor-mation available in the investigation of an existing dam conducted in typical consulting practice.
Figure 11. LSFD Parametric Results – Case 3.
3.4 Discussion
The results of the modeling and parametric analysis indicate that some features of the flow slides have been reproduced successfully. However, the extent of flow, and area of material out-side the original dam have been underestimated to varying degrees in most of the analyses con-ducted. A number of potential reasons for this of varying complexity are possible.
Some “smearing” effects were noted on the distribution of material parameters after rezoning occurs. The potential for this to occur is noted by Itasca (2011a). This process resulted in the “liquefied” area of the model, i.e. that which had no frictional strength, reducing by approxi-mately 20% by the end of deformation, using LSFD as an example. Zones near the perimeter of this area begin to gain small amounts of frictional strength as the smearing occurs. The cohesive strengths utilized to simulate su(LIQ) in the liquefied area also smear outwards, increasing the area of the model with cohesion greater than zero. This process has not been explicitly prevent-ed in the work presented here. This smearing effect was reduced when element density was in-creased in the parametric analysis. However, increasing zone density to reduce smearing had a
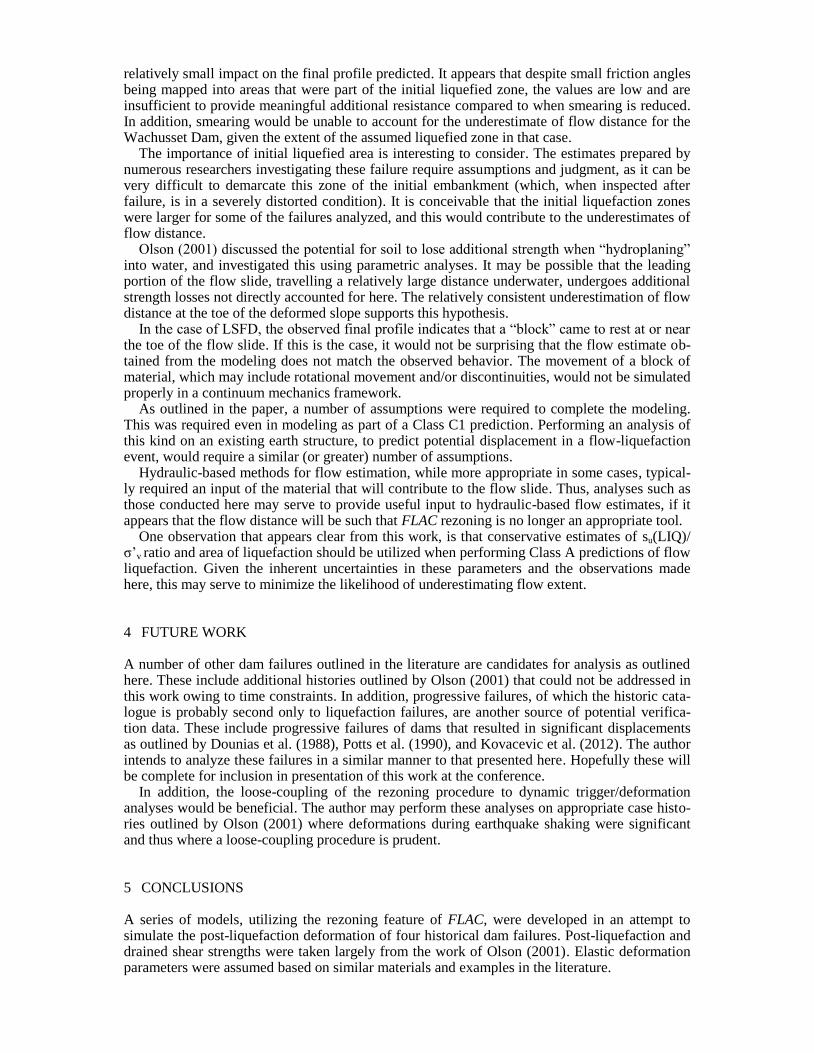
relatively small impact on the final profile predicted. It appears that despite small friction angles being mapped into areas that were part of the initial liquefied zone, the values are low and are insufficient to provide meaningful additional resistance compared to when smearing is reduced. In addition, smearing would be unable to account for the underestimate of flow distance for the Wachusset Dam, given the extent of the assumed liquefied zone in that case.
The importance of initial liquefied area is interesting to consider. The estimates prepared by numerous researchers investigating these failure require assumptions and judgment, as it can be very difficult to demarcate this zone of the initial embankment (which, when inspected after failure, is in a severely distorted condition). It is conceivable that the initial liquefaction zones were larger for some of the failures analyzed, and this would contribute to the underestimates of flow distance.
Olson (2001) discussed the potential for soil to lose additional strength when “hydroplaning” into water, and investigated this using parametric analyses. It may be possible that the leading portion of the flow slide, travelling a relatively large distance underwater, undergoes additional strength losses not directly accounted for here. The relatively consistent underestimation of flow distance at the toe of the deformed slope supports this hypothesis.
In the case of LSFD, the observed final profile indicates that a “block” came to rest at or near the toe of the flow slide. If this is the case, it would not be surprising that the flow estimate ob-tained from the modeling does not match the observed behavior. The movement of a block of material, which may include rotational movement and/or discontinuities, would not be simulated properly in a continuum mechanics framework.
As outlined in the paper, a number of assumptions were required to complete the modeling. This was required even in modeling as part of a Class C1 prediction. Performing an analysis of this kind on an existing earth structure, to predict potential displacement in a flow-liquefaction event, would require a similar (or greater) number of assumptions.
Hydraulic-based methods for flow estimation, while more appropriate in some cases, typical-ly required an input of the material that will contribute to the flow slide. Thus, analyses such as those conducted here may serve to provide useful input to hydraulic-based flow estimates, if it appears that the flow distance will be such that FLAC rezoning is no longer an appropriate tool.
One observation that appears clear from this work, is that conservative estimates of su(LIQ)/ σ’v ratio and area of liquefaction should be utilized when performing Class A predictions of flow liquefaction. Given the inherent uncertainties in these parameters and the observations made here, this may serve to minimize the likelihood of underestimating flow extent.
4 FUTURE WORK
A number of other dam failures outlined in the literature are candidates for analysis as outlined here. These include additional histories outlined by Olson (2001) that could not be addressed in this work owing to time constraints. In addition, progressive failures, of which the historic cata-logue is probably second only to liquefaction failures, are another source of potential verifica-tion data. These include progressive failures of dams that resulted in significant displacements as outlined by Dounias et al. (1988), Potts et al. (1990), and Kovacevic et al. (2012). The author intends to analyze these failures in a similar manner to that presented here. Hopefully these will be complete for inclusion in presentation of this work at the conference.
In addition, the loose-coupling of the rezoning procedure to dynamic trigger/deformation analyses would be beneficial. The author may perform these analyses on appropriate case histo-ries outlined by Olson (2001) where deformations during earthquake shaking were significant and thus where a loose-coupling procedure is prudent.
5 CONCLUSIONS
A series of models, utilizing the rezoning feature of FLAC, were developed in an attempt to simulate the post-liquefaction deformation of four historical dam failures. Post-liquefaction and drained shear strengths were taken largely from the work of Olson (2001). Elastic deformation parameters were assumed based on similar materials and examples in the literature.

The deformation shapes predicted using the models prepared agreed somewhat with the ob-served behavior in a qualitative sense. Over much of the deformed areas, the profile predicted by the models appears reasonable compared to the observed behavior. However, the extents of the flow slide were not predicted well. In fact, these were underestimated in almost all cases. The reasons for this are theorized to involve a possible combination of further reduction in strengths in material that has travelled a large distance under-water, artificial increases in strength within the model owing to rezoning “smearing” effects, and possible underestimation of liquefied area. Improvements to the modeling technique to minimize or accommodate these issues appear to be possible and shall be pursued.
Perhaps most importantly, it has been shown that post-liquefaction analyses such as those performed here can discern between a flow slides such as at Mochikoshi No. 2 where hydraulic-based methods become more appropriate, and slides where the extent of flow is of a magnitude that can be dealt with through rezoning within a continuum mechanics framework.
6 DATA FILES
The author would be happy to provide the data files prepared in this work to anyone interested in viewing them and/or providing comments and critique on the modeling techniques used.
REFERENCES
Beaty, M.H. & Byrne, P.M. 1998. An effective stress model for predicting liquefaction behaviour of sand. In P. Dakoulas, M. Yegian, & R.D. Holtz (eds.) Geotechnical Earthquake Engineering and Soil Dy-namics III: Proceedings of a Specialty Conference, Seattle, Wash., 3-6 August 1996. ASCE Geotech-nical Special Publication 75, Vol. 1, pp. 766-777.
Beaty, M.H. & Byrne, P.M. 2011. UBCSAND Constitutive Model – Documentation Report Been, K., Obermeyer, J., Parks, J. & Quinonez, A. 2012. Post-liquefaction undrained shear strength of
sandy silt and silty sand tailings. In Proc. Tailings and Mine Waste Conference, Keyston, Colorado, 14-17 October 2012.
Byrne, P.M., Roy, D., Campanella, R.G., & Hughes, J. 1995. Predicting liquefaction response of granular soils from pressurementer tests. In M.D. Evans & R.J. Fragaszt (eds.) Static and Dynamic Properties of Gravelly Soil: Proc. Sessions of the ASCE National Convention, Sand Diego, Calif., 23-24 October 1995. ASCE Geotechnical Special Publication 56, pps. 122-135.
Byrne, P.M. & Seid-Karbasi, M. 2003. Seismic stability of impoundments. 17th
Annual Symposium, Van-couver Geotechnical Society, Vancouver, B.C.
Castillo, J., Hallman, D., Byrne, P.M., Parra, D. 2005. Dynamic analysis of heap leach pad under high phreatic levels. Proc. XXVII Mining Convention, Arequipa, Peru, September 2005.
Dounias, G.T., Potts, D.M., & Vaughn, P.R. Finite element analysis of progressive failure: two case stud-ies. Computers and Geotechnics, 1988, Vol. 6., No. 2, pps. 155-175.
Hazen, A. 1918. A study of the slip in the Calaveras Dam. Engineering News Record, Vol. 81, No. 26, pps. 1158-1164.
Hu, Y. & Randolph, M.F. 1998. A practical numerical approach for large deformation problem in soil. Int. J. Numer. Anal. Methods Geomech. Vol 22, No. 5, pps. 327-350.
Huang, Y., Mao, W., Zheng, H., Li, G. 2012. Computational fluid dynamics modelling of post-liquefaction soil flow using the volume of fluid method. Bull. Eng. Geol. Env. Vol. 71 No. 2 pps. 359-366
Idriss, I. M., and Boulanger, R. W. 2008. Soil liquefaction during earthquakes. Monograph MNO-12, Earthquake Engineering Research Institute, Oakland, CA
Ishihara, K. 1984. Post-earthquake failure of a tailings dam due to liquefaction of the pond deposit. Proc., Inter. Conf. on Case Histories in Geotechnical Engineering, Rolla, Missouri, May 6-11, Vol. 3, pps. 1129-1143.
Ishihara, K., Yasuda, S. & Yoshida, Y. 1990. Liquefaction-induced flow failure of embankments and re-sidual strength of silty sands. Soils and Foundations. Vol 30, No. 3. Pps. 69-80.
Itasca Consulting Group, Inc. 2008. FLAC – Fast Lagrangian Analysis of Continua, Ver. 6.0 User’s Man-ual. Minneapolis: Itasca.
Itasca Consulting Group, Inc. 2011a. FLAC – Fast Lagrangian Analysis of Continua, Ver. 7.0 Theory and Background. Minneapolis: Itasca.

Itasca Consulting Group, Inc. 2011b. FLAC – Fast Lagrangian Analysis of Continua, Ver. 7.0 User’s Guide. Minneapolis: Itasca.
Jacka, M.E. & Norfolk, P.D. 2011. Large-strain, rezoned-mesh FLAC analysis of embankment post-liquefaction performance. In D. Sainsbury, R. Hart, C. Detournay, & M. Nelson (eds.), 2
nd Int’l.
FLAC/DEM Symposium on Continuum and Distinct Element Numerical Modeling in Geomechanics – 2011, Melbourne, Australia 14-16 February 2011.
James, M., Aubertin, M., Wijewickreme, D. & Wilson, G.W. 2011. A laboratory investigation of the dy-namic properties of tailings. Canadian Geotechnical Journal. Vol. 48, No. 11, pps. 1587-1600.
Jefferies, M. 1993. NorSand: a simple critical state model for sand. Geotechnique, Vol. 43, No. 1., pp. 91-103.
Jefferies, M. & Shuttle, D.A. 2005. NorSand: Calibration and use. In 11th
Conference of the International Association for Computer Methods and Advances in Geomechanics, Turin, 19-24 June, 2005.
Kovacevic, N., Hight, D.W., Potts, D.M., & Carter, I.C. 2012. Finite element analysis of the failure and reconstruction of the main dam embankment at Abberton Reservoir, Essex, UK. Geotechnique: Ahead of print.
Lambe, T.W. 1973. Predictions in soil engineering. Geotechnique, Vol. 23, No. 2, pps. 151-202. Olson, S.M. 2001. Liquefaction analysis of level and sloping ground using field case histories and pene-
tration resistance. Ph.D. thesis, University of Illinois at Urbana-Champaign, Urbana, Illinois. Olson, S.M., Stark, T.D., Walton, W.H., & Castro, G. 2000. Static liquefaction flow failure of the North
Dike of Wachusset Dam. Journal of Geotechnical and Geoenvironmental Engineering, ASCE, Vol 126, No. 12, pps. 1184-1193.
Olson, S.M. & Stark, T.D. 2002. Liquefied strength ratio from liquefaction case histories. Canadian Ge-otechnical Journal, Vol. 39., No. 3, pps. 629-647.
Potts, D.M., Dounias, G.T., & Vaughn, P.R. 1990. Finite element analysis of progressive failure of Carsington embankment. Geotechnique, Vol. 40, No. 1, pps. 79-101.
Potts, D.M. & Zdravkovic, L. 2001. Finite Element Analysis in Geotechnical Engineering: Theory and Application. Institution of Civil Engineers Publishing.
Poulos, S.J., Castro, G. & France, K.W. 1985. Liquefaction evaluation procedure. Journal of Geotech-nical Engineering Division, ASCE, 111, GT6, pps. 772-792.
Robertson, P.K. 2010. Evaluation of flow liquefaction and liquefied strength using the cone penetration test. J. Geotech. and Geoenvir. Eng. Vol. 136, No. 6, pps. 842-853.
Seed, H.B., Lee, K.L., Idriss, I.M. & Makdisi, F. 1973. Analysis of the slides in the San Fernando Dams during the earthquake of Feb. 9, 1971. Earthquake Engineering Research Centre 73-2, University of California, Berkeley, Ca.
Seed, R.B. & Harder, L.F. 1990. SPT-Based analysis of cyclic pore pressure generation and undrained re-sidual strength. In Proceedings of the H.B. Seed Memorial Symposium, Bi-Tech Publishing Ltd., Vol. 2, pps. 351-376.
Seid-Karbasi, M. & Byrne, P.M. 2007. Seismic liquefaction, lateral spreading, and flow slides: a numeri-cal investigation into void redistribution. Canadian Geotechnical Journal. Vol. 44 No. 7 pps. 873-890.
Vick, S.G. 1990. Planning, Design, and Analysis of Tailings Dams. Vancouver: BiTech Publishers Ltd. Wijewickreme, D., Sanin, M.V., & Greenaway, G. 2005. Cyclic shear response of fine-grained mine tail-
ings. Canadian Geotechnical Journal, Vol. 42, No. 5 pps. 1408-1421. Youd et al. 2001. Liquefaction resistance of soils: summary report from the 1996 NCEER and 1998
NCEER/NSF workshops on evaluation of liquefaction resistance of soils. Journal of Geotechnical and Geoenvironmental Engineering, ASCE, Vol. 127, No. 10, pps. 817-833.