02DFLO-81 TO inI EhIIIIIIIIIIII CA H D SCHULZ ET ...axial compressor and to a novel radial cascade...
56
AD-Ri68 772 APPLICATION OF FINITE ELEMENT CODE 02DFLO-81 TO inI TURBOMACHINERY FLOW FIELDS(U) NAVAL POSTGRADUATE SCHOOL MONTEREY CA H D SCHULZ ET AL. SEP 84 NPS67-84-885 1RUNCLASSIFIED F/G 28/4 N EhIIIIIIIIIIII Iflllflflfl..lll I lfllfllf IflflIlf EllllEEEElhllIE
Transcript of 02DFLO-81 TO inI EhIIIIIIIIIIII CA H D SCHULZ ET ...axial compressor and to a novel radial cascade...
AD-Ri68 772 APPLICATION OF FINITE ELEMENT CODE 02DFLO-81 TO inITURBOMACHINERY FLOW FIELDS(U) NAVAL POSTGRADUATE SCHOOLMONTEREY CA H D SCHULZ ET AL. SEP 84 NPS67-84-885
1RUNCLASSIFIED F/G 28/4 NEhIIIIIIIIIIIIIflllflflfl..lllI lfllfllf IflflIlfEllllEEEElhllIE

2'
$ •
iii,
V., . --.. ..
"'- : -"
v-:,-' ,
. -,*". ,
,-:.-:..:.-
'-,,:.. :-. . . .. ... ::":..'.:'. .:..',
NIPS67-84-005~
NAVAL POSTGRADUATE SCHOOL
00 .'..
. v.
APPLICATION OF FINITE ELEMENT CODE Q3DFLO-81TO TURBOMACHINERY FLOW FIELDS
H. D. SCHULZ
F. NEUHOFF i
CH. HIRSCH
R. P. SHREEVE .
SEPTEMBER 1984 S
Interim Report for Period 1 October 1983-September 1984
Approved for public release, distribution unlimited -
Prepared for:Naval Air Systems CommandWashington DC 20361
%I

NAVAL POSTGRADUATE SCHOOL
Monterey, California
Rear Admiral R. H. Shumaker D. A. SchradySuperintendent Provost
The work in this report results directly from the appointment of Dr. Ir.Charles Hirsch, who is Professor and Head of the Department of Fluid Mechanicsat Vrije Universiteit, Brussel, Belgium. as the Naval Air Systems CommandVisiting Research Professor in Aeronautics during FY84. This appointment,under the cognizance of Dr. G. Heiche (Air 03D), was funded by the Naval AirSystems Command Air-Breathing Propulsion Research Program.
Professor Hirsch read his finite element computer program Q3DFLO-81 into theNPS IBM 370 system and subsequently instructed Turbopropulsion Laboratorystudents and researchers in its use.
The results herein are collected from applications of the code in severa.independent, but technically related, research programs. In particular, a
- -- program to examine controlled-diffusion blading designs for compressorcascades is acknowledged. Support for this exploratory development programwas provided by Naval Air Systems Command under the cognizance of G. Derderian(AIR310E).
Appreciation is expressed to Professor Hirsch for the use of his code and forhis contributions to the research programs.
Reproduction of all or part of this report is authorized.
This report was prepared by:
11. D. SCHULZ F. NEUHOFF 0*-. EXOTECH, Inc. EXOTECH, Inc.
1091 S. Bascom Avenue, Ste 337 1091 S. Bascom Avenue, Ste 337Campbell, CA 95008 Campbell, CA 95008
',, 1 L . ,4
R. P. SHREEVE
Professor of Aeronautics
O, Reviewed byt Released by:
M. F. PLATZER, Chairman JOHN N. DY9RDepartment of Aeronautics Dean of Science and Engineering
, .----
UNC 1ASSIFIED
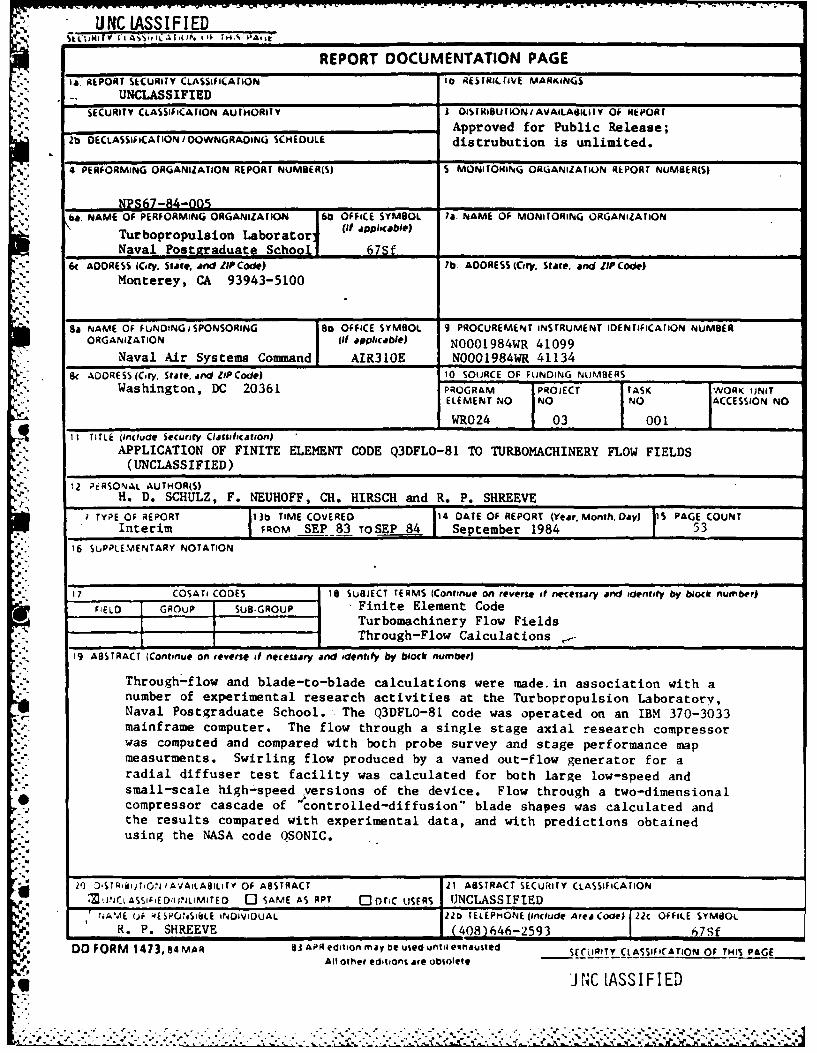
REPORT DOCUMENTATION PAGEI& REPORT SECURITY CLASSIFICATION to RWIilloo' MARKiNCAS
-- UNCLASSIFIED ______________________
SECURITY CLASSIFICATION AUTHORITY J DiSrTKIBUTIONIAVAILAOILI1v Of RIEPORTS.. ___________________________________ Approved for Public Release;
2b DECLASSIfICATION IDOWNGRAOiNGs SCHEDULE distrubution is unlimited.
4 PERFORMING ORGANIZATION REPORT NUMBER(S) 5 MONITORING ORIGANIZATION REPORT NUMBER(S)
NPS6-94-00___________________ba. NAME OF PERFORMING ORGANIZATION 60 OFFICE SYMBOL Is. NAME OF MONITORING ORGANIZATION
Turbopropulsion Laborator (i plcbe
Naval Postgraduate Schooll 67Sf ______________________
6C ADDRESS (City, State. and ZIP Codit) 7b. ADDRESS (City, State, and ZIP Code)2'. Monterey, CA 93943-5100
Sa8. NAME OF FUNDING i SPONSORING 18o OFFICE SYMBOL 9 PROCUREMENT INSTRUMENT IDENTIFICATION NUMB3ERORGANIZATION j(it applicabie) N0001984WR 41099
Naval Air Systems Commandi AIR310E N0001984WR 411348c ADDRES (Cory. State, and ZIP Code) 10 SOURCE OF FUNDING NUMBERS
Washington, DC 20361 PROGRAM PROJECT ITASK ~ WRI UNITELEMENT NO INO INO. ACE0INN
_____________________________WR024 03 00 Iw11 TITLE (dfluoIl Security Classiication)
APPLICATION OF FINITE ELEMENT CODE Q3DFLO-81 TO TURBOMACHINERY FLOW FIELDS(UNCLASSIFIED)
12 PERSONAL AUTHOR(S)H. D. SCHULZ, F. NEUHOFF, CH. HIRSCH and R. P. SHREEVE
iTYPE OF REPORT 1t3b TIME COVERED 114 DATE OF REPORT (Year, Month, Daly) IS PAGE COUNT* Interim 1FROM SEP 83 TO SEP 84 ISeptember 1984 53
16 SUJPPLEMENTARY NOTATION
17 COSATI CODES 18 SUBJECT TERMS (Continue on revert* of necessary and identity by bilocir number)
- FIELD IGROUP ISUB-GROUP Finite Element CodeTurbomachinery Flow FieldsThrough-Flow Calculations ,-
19 ABSTRACT (Continue on reverse of necessary and identsfy br block number)
Through-flow and blade-to-blade calculations were made in association with anumber of experimental research activities at the Turbopropulsion Laboratory,Naval Postgraduate School. The Q3DFLO-81 code was operated on an IBM 370-3033mainframe computer. The flow through a single stage axial research compressorwas computed and compared with both probe survey and stage performance mapmeasurments. Swirling flow produced by a vaned out-flow generator for aradial diffuser test facility was calculated for both large low-speed andsmall-scale high-speed versions of the device. Flow through a two-dimensionalcompressor cascade of ' ontrolled-dif fusion" blade shapes was calculated andthe results compared with experimental data, and with predictions obtainedusing the NASA code QSONIC.
* 20 )-STRiiLfiiON /AVAILAILITY OF ABSTRACT 21 ABSTRACT SECURITY CLASSIFICATIONZ04jCtASSIFED/IINLMITED 0 SAME AS APT C DtiC UISERS UNCLASSIFIED
N.AME (UF RESPONSIBLE INDIVIDUAL 22o TELEPHONE (include Area Code) 22C OFFIC.E SYMBOL
R. P. SHREEVE (408)646-2593 6 7SfD O FORM 1473, 84 MAR ai APR edition may be used until eitnausted SECULRITY CIASSIFICATION OF THIS PAGE
All other edition% are obtolete
*J NIC L.ASS IF IED

ABSTRACT
Through-flow and blade-to-blade calculations were made in association
with a number of experimental research activities at the Turbopropulsion
Laboratory, Naval Postgraduate School. The Q3DFLO-81 code was operated on an
IBM 370-3033 mainframe computer. The flow through a single stage transonic
axial research compressor was computed and compared with both probe survey and
stage performance map measurements. Swirling flow produced by a vaned
out-flow generator for a radial diffuser test facility was calculated for both
large low-speed and small-scale high-speed versions of the device. Flow
,,...through a two-dimensional compressor cascade of "controlled-diffusion" blade
shapes was calculated and the results compared with experimental data, and
with predictions obtained using the NASA code QSONIC.
.5 ...

TABLE OF CONTENTS
1. INTRODUCTION . . . . . . . . . . . . . . . . . . . . . .
II. THROUGH FLOW CALCULATION.. . . . . . . . . . . . . . . . . . . .3
A. Axial Compressor ...................... 3
B. Low Speed CDTD... . . . . . . . . . . . . . . . . . . . 6
C. High Speed CDTD . . . . . . . . . . . * . . . . . . . . 7
III. BLADE TO BLADE CALCULATION .................... 8
A. NASA Controlled Diffusion Blades . .... . .......... .. 9
B. Comparison With Finite Volume Code QSONIC . . . . . . . . . . II
IV. CONCLUSION . . . . . . . . . . . . . . . . . . . . . . . . . . . . 13
FIGURES . . . . . . . . . . . . . . . . . . . .. . . . . . . . . . . 14
REFERENCES .. .. .. .. .. .. .. .. .. .. .... .. .. 37
DISTRIBUTION LIST . . . . . . . . . . . . . . . . . . . . . . . . . .. 38
oili
S4b M

4. LIST OF FIGURES4i
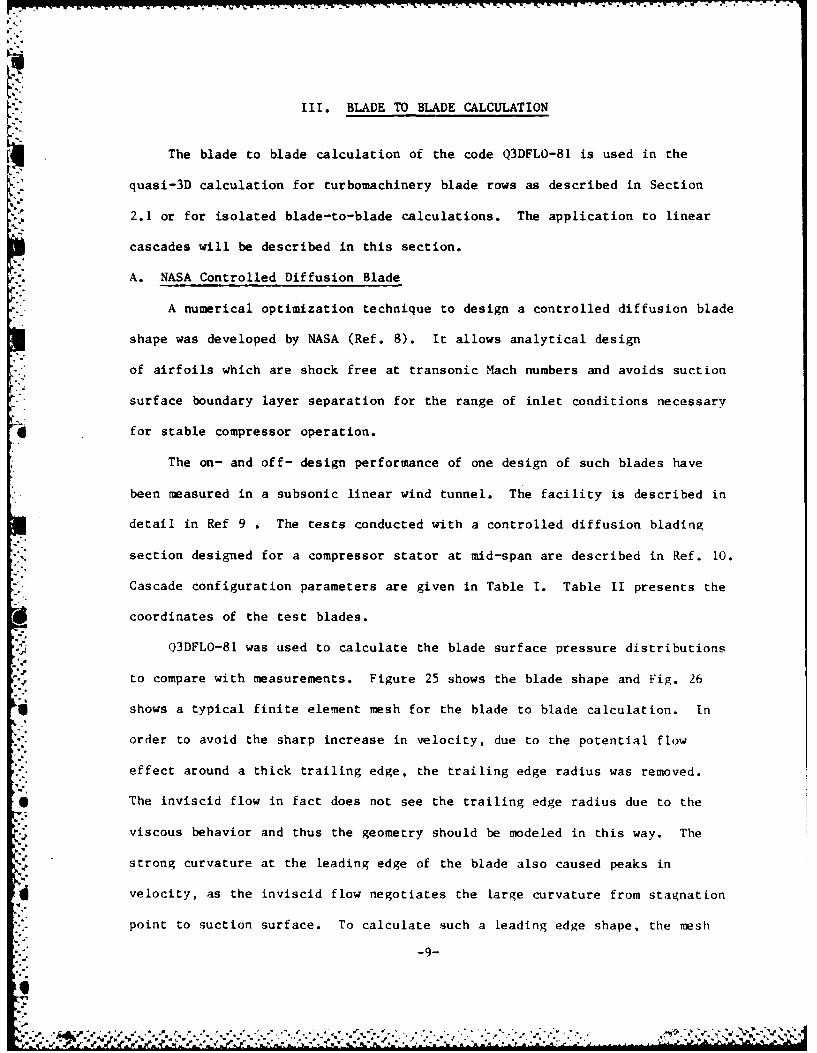
1. Transonic compressor cross-section . ............ 14
2. Compressor computational mesh . . . . . ........... 15
3. Absolute flow angle vs. % distance from hub ......... 16
4. Axial velocity vs. % distance from hub ........... 16
5. Radial velocity vs. % distance from hub ........... 17
6. Absolute Mach Number vs. % distance from hub ......... 17
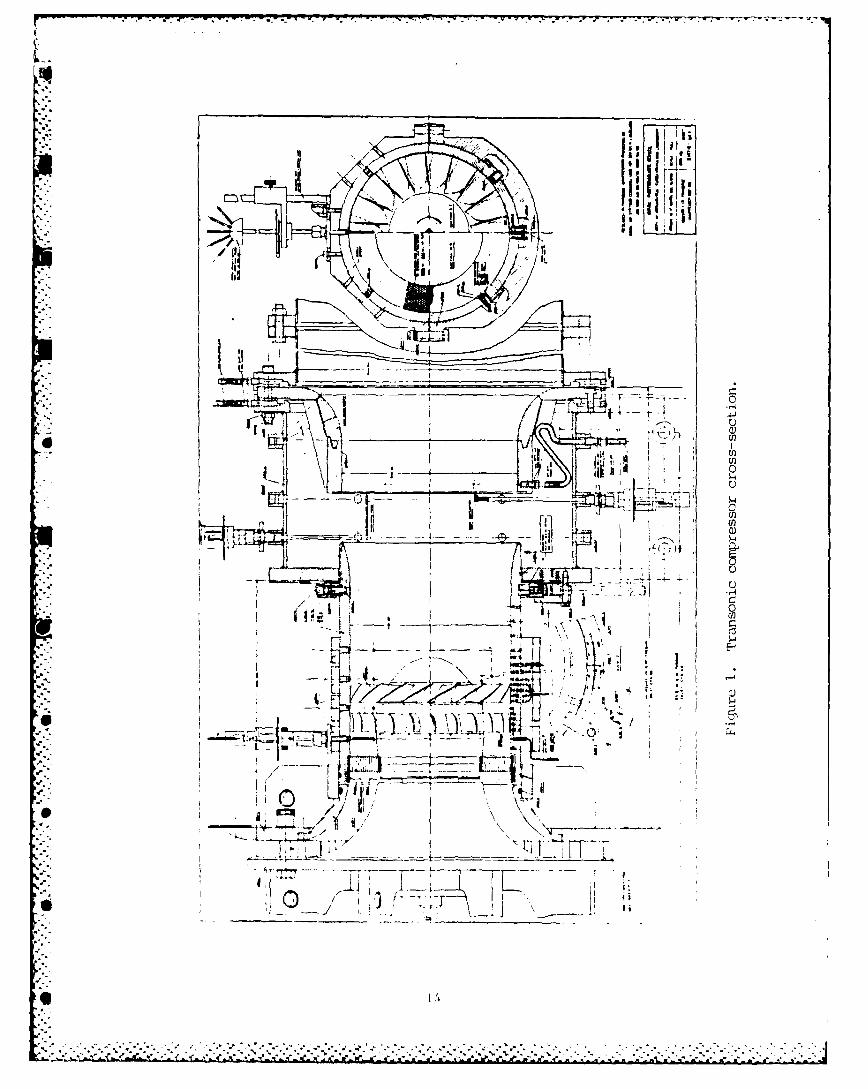
7. Absolute total pressure vs. % distance from hub ....... 18
8. Absolute total temperature vs. % distance from hub . . . . . . 18
9. Incidence angle vs. % distance from hub . . . . . . . . 19
10. Deviation angle vs. % distance from hub ........... 19
11. Loss coefficient vs. % distance from hub . . . . . . . . . 20
12. Static pressure vs. % distance from hub . . . . . . . . . . 20
13. Absolute tangential velocity vs. % distance from hub . . . . * 21
14. Absolute total velocity vs. % distance from hub . . . . . . . 21
* 15. Relative Mach Number vs. % distance from hub . . . . . . . .. 22
16. Relative flow angle vs. % distance from hub . . . . . .... 22
17. Calculated and measured compressor performance maps at 60%,and 70% design speed . . . . . . . . . . 23
18. Calculated compressor performance map ............ 24
19. CDTD test section cross section . . . .... .............. 25
20. Spanwise distribution of flow properties as a function offlow station . . . . . . . . .... . . ........................ 26
21. Boundary layer development as a function of flow station . . . 27
22. Comparison of predicted and measured flow angles . . . . . . . 27
* 23. High speed CDTD streamlines . . . . . . . . . . . ...... 28
iv

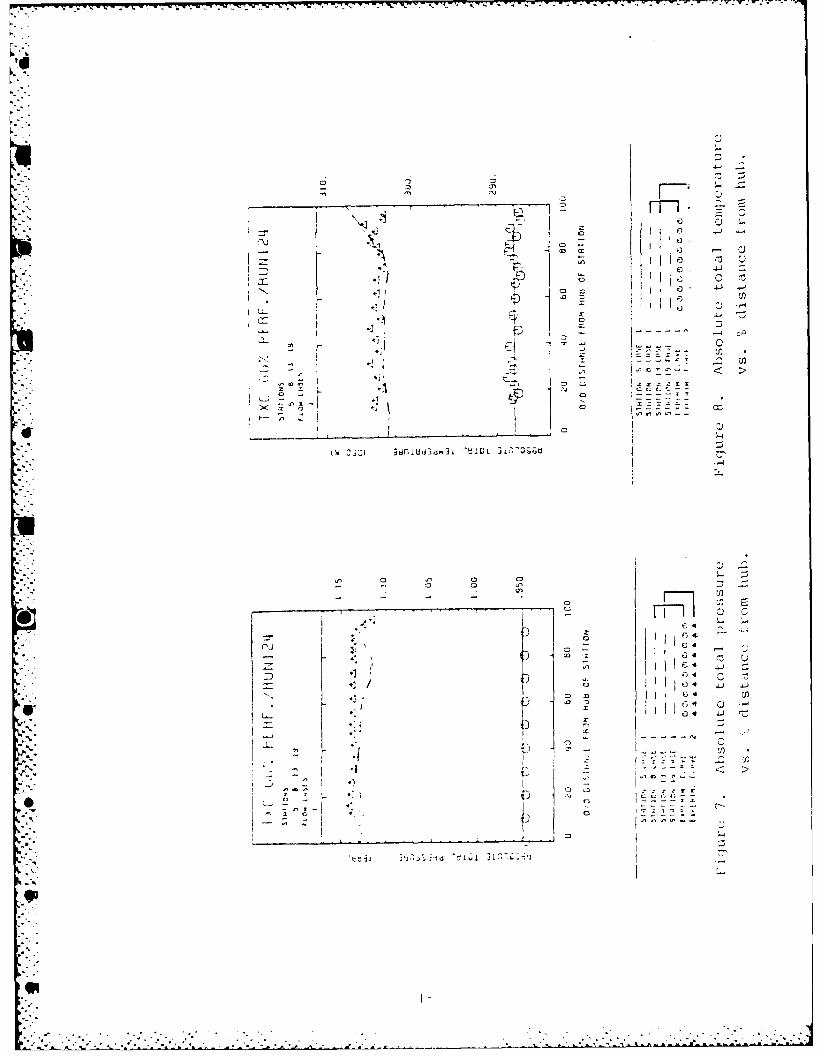
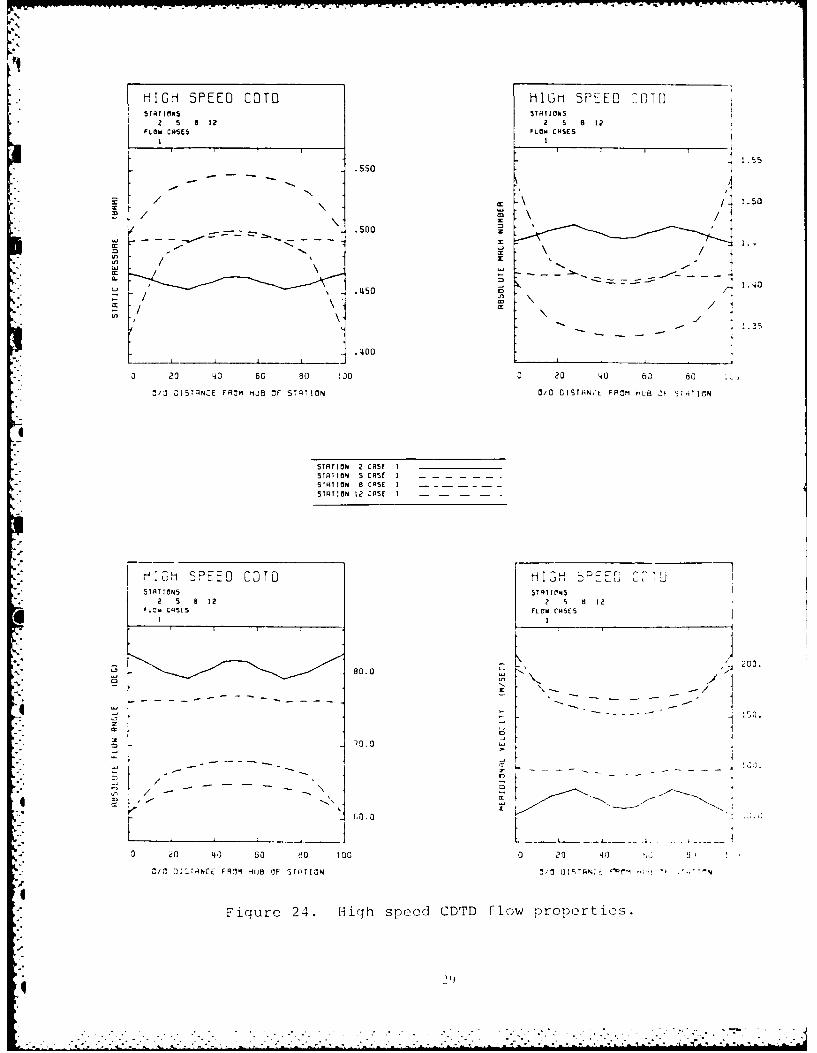
24. High speed CDTD flow properties . . . . . . . . . . . . . . . 29
25. NASA CD blade profile .................... 30
26. NASA CD blade finite element mesh . . . . . . . . . . . . . . 31
27. Plot of streamlines through the cascade . . . . . . . . . . . 32
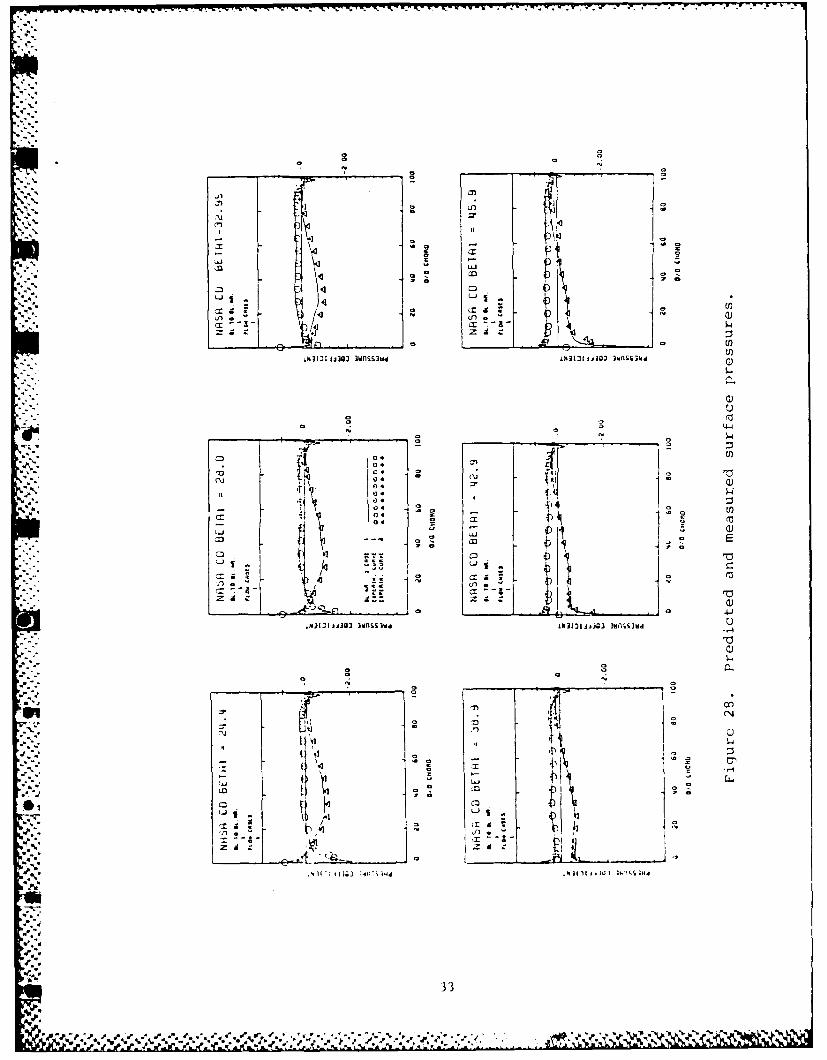
28. Predicted and measured surface pressures . . . . . . . . . . . 33
29. AVDR vs. air inlet angle ................... 34
30. AVDR vs. static pressure rise coefficient. . . ......... 35
31. Comparison of Q3DFLO-81 and QSONIC .... .............. .36
I~
.4
-p-p

LIST OF TABLES
1. TABLE I - CD COMPRESSOR CASCADE PARAMETERS. . . . . . . . . . 37
2. TABLE II - CD BLADE COORDINATES. ............... 37
Awi
, .
• v°
- . ° ,

I. INTRODUCTION
Attempts to model the complex three-dimensional flow in turbomachines
have resulted in the development of various quasi three-dimensional numerical
techniques.
Most methods follow the work of Wu (Ref. I), wherein the fully 3D flow is
resolved into a succession of 2D-calculations. The flow is solved on
meridional surfaces (S2), and blade to blade surfaces (Si). In general, the
intersection of an Sl surface and an S2 surface is a twisting line with three
dimensional variations. The interaction of. the two families of surfaces c, n
be quite complicated. However, if an axisymmetric assumption is made, the S2
surfaces will become identical to the meridional plane. An important drawback
in this method is the lack of knowledge on the degree of approximation which
is made by assuming axisymmetry.
The program used in the present study, therefore, follows another
approach where the S2-surface calculation is replaced by the calculation of
the flow in the true meridional section (R-2 plane), based on the solution of
exact pitch averaged equations. The numerical method used to solve the
equations in the meridional and blade to blade plane is the finite element
method. An interconnection of the meshes allows for a consistent interaction
to be defined in the calculation.
Q3DFLO-81 is only valid in the absence of backflow and hence does not
handle separation regions or secondary flow. The calculations are based on
o the existence of an inviscid core flow, but accommodates empirical input with
regard to loss levels, slip factors and axial-velocity-density ratio (AVDR),
or superimposes a two dimensional boundary layer calculation. The program is

described in References 2 and 3. The procedure to run the code on the Naval
Postgraduate School (NPS) computer is given in Reference 4. The present
report describes the application of this code to various turbomachinery flow
fields. Results from applying the through-flow calculation to a transonic
axial compressor and to a novel radial cascade are given in Section 2. In
Section 3 results from the blade to blade calculations applied to a controlled
diffusion compressor stator section are compared with measurements taken in a
linear cascade and with the results from the finite difference code QSONIC.
The conclusions drawn from these applications are given in Section 4.
-2-
-..

,-46 - W
II. THROUGH FLOW CALCULATION
A. Axial Compressor
A single stage, small diameter (11 inches) high speed axial flow
compressor, of in house design, was investigated (Fig. 1). Test data from
radial surveys at different axial locations and overall machine performance at
various stage conditions were compared with results of corresponding computer
runs. Furthermore, a compressor performance map for machine speeds higher
*than those already tested was calculated to estimate the machine conditions at
higher speeds. Figure 2 shows the calculation mesh for the compressor.
Thirteen streamlines run from three rotor tip chord lengths upstream of the
rotor leading edge to about 2 rotor tip chord lengths downstream of the rotor
trailing edge. Station lines 5, 8 and 13 are placed axially in a way that
they coincide with probe traverse locations. The rotor leading edge
corresponds to station 9, trailing edge to station 12, and the stator leading
edge is located at station 15, with its trailing edge at station 18. Rotor
and stator geometry input is limited to blade inlet and outlet angles, maximum
relative blade thickness, solidity, chord length and leading edge radius.
These quantities have to be given for a number of blade cuts at different
radii. They must also be parallel to the centerline. This made a
recalculation of the blade profile coordinates necessary, since in the
original design they were specified on conical surfaces. The cross-section of
stage inlet and outlet up and downstream of the regime shown in Fig. 2 is
constant and cylindrical. A small fillet at the tip of the rotor spinner was
incorporated in the geometry input to eliminate the blunt stagnation point
singular condition. Using the mesh shown in Fig. 2, calculations were
performed in which input quantities (besides the geometry) were taken from a
-3-
-

compressor test run. This test run provided results from three radial surveys
*i at locations corresponding to calculation stations 5, 8 and 13. These
stations serve to evaluate flow into and out of the rotor. Stator outlet
measurements were not available. Figures 3 through 16 show comparisons of
measured and calculated radial distributions. In Fig. 3 fair to good
agreement is shown for the absolute flow angle. The axial velocity component
(Fig. 4) does not agree too well for the lower portion (40%) of the channel
height at station 5. The change in geometry used in the calculation is
probably the cause for this variation.
In the following figures, comparisons are shown only for calculation
stations 8 and 13 and the corresponding test results, since the main purpose
of the investigation was to evaluate the compressor rotor. The radial
*' velocity component (Fig. 5) seems to have rather large discrepencies for
station 8 (rotor inlet), especially in the hub region. If, however, the
* radial velocity component is converted to flow pitch angle, the difference
shown represents an error of no more than four degrees. In Fig. 6 the
*absolute flow Mach number for rotor inlet and outlet are compared. The
discrepencies in the tip areas, also apparent in Figures 3 and 4, are the
result of a measurement error due to a casewall effect on the probes used.
For the evaluation of the rotor performance, total pressure (Fig. 7) and total
temperature (Fig. 8) at the inlet and outlet were observed. The total
pressure distribution measured is constant over the blade span. A distinct
increase of the outlet total temperature was calculated in the tip region.
Variations in total temperature measurements are known to reflect changes in
ambient conditions. Thus a temperature differential calculated between rotor
inlet and outlet would not show the variations of those in Fig. 8. Further
S-4-
. ..

evaluating the stage flow, Figures 9 through 11 show incidence angle,
deviation angle and loss distributions, hub to tip. Again, for the rotor a
comparison between measurement and calculation is given. The discrepencies in
rotor incidence angle at the hub and tip are rather large while the stator
shows good agreement near the tip and qualitative agreement along the span
(Fig. 9). The rotor deviation angle also shows disagreement near hub and tip.
The stator deviation angles predicted by the program appear to be fairly
i large, especially ia the tip region. No test data are available for
comparison, but the magnitudes used in the design of the blading were similar
to those in Fig. 10. Figures 12 through 16 show distributions of other flow
quantities calculated for the same axial positions.
For the compressor stage, the performance was carefully measured for the
full throttle range at 60% and 70% of design speed. The program calculates
the overall stage performance data. In Fig. 17, calculated and measured
-' compressor performance are compared. The agreement in the total pressure
ratio is quite good. Two efficiencies calculated by the program are shown.
The total efficiency takes the casewall boundary layer and the losses
associated with it into account, while the adiabatic efficiency excludes case
wall effects. The discrepency between measured and calculated total efficiency
is quite large and has yet to be explained.
In order to estimate the compressor performance for higher speeds,
calculations were carried out for 80, 90 and 100% of design speed for a
variety of flow rates. Uncertainties in the efficiency calculation were
accepted. In Fig. 18, the predicted performance map is shown. It can be
observed, that the efficiency curves drop off more drastically for higher flow
-5-
'p " , , ' ,Z ' -" - ' . " - " . - " . " - " " " - " ." . " - " . " • • . " - " • " . ' " , ' ' . ' " . " '

rates at high speeds. This is typical for high speed compressors. The
calculated pressure ratio of 1.715 at 100% design speed is considerably higher
than the value expected in the design process (1.5-1.6), and the referred flow
rate of 19.7 lbs/sec is somewhat lower than the design value of 21.24 lbs/sec.
However, this is the first attempt to predict the performance of the
compressor hardware, as built, and the differences may well be explained by
an error which was built in to the rotor blade setting angles (Ref 5).
B. Low Speed CDTD
* . A large scale subsonic radial cascade wind tunnel has been designed at
the Turbopropulsion Laboratory (TPL) at NPS to investigate flow phenomena in
rand the performance of radial diffusers (Ref. 6). Various approaches to
analyze the aerodynamic operating conditions and the flow at the test section
inlet of the Centrifugal Diffuser Test Device (CDTD) have been conducted (Ref.
7).
Q3DFLO-81 accepts cylindrical inlet flow planes and was applied to the
CDTD geometry. Figure 19 shows a plot of streamlines and a cross section of
the axisymmetric flow channel between the inlet "swirl vane cylinder" (station
1) and diffuser-vane leading edge (station 18). The flow is introduced almost
tangentially along the inlet plane at a radius of 19 inches, and then passes
outward through an angular contraction to the test section inlet at a radius
of 25 inches. The flow however, does not follow the physical contour of the
wall (see Fig. 19) and separates in the corners between station 4 and
.W station 6. The corner shape of the flow channel had to be approximated by a
smooth contour in order for the code to operate.
03DFLO-81 accommodates a very versatile post processor and deliversVo"W
printouts and plots of the calculated flow properties at every required flow
-6-
gq-;
:':

station. Figure 20 shows plots of spanwise distribution of axial velocity,
Mach number, static pressure and flow angle for the different flow stations
shown in Fig. 19.
The plots represent the inviscid solution of the core flow, considering a
blockage factor determined by the end wall boundary layer calculations for hub
and tip. It can be seen that the influence of the strong curvature in the
." contraction region (stations 7-15) has almost decayed at the test section
inlet (station 18), and the flow properties are almost evenly distributed over
the span. Figure 21 shows a boundary layer thickness of 20% at the test
section. The boundary layer also experiences a strong acceleration in the
contraction region. The velocities in the boundary layers are smaller, and
more nearly tangential. Figure 22 is a comparison of predicted and measured
spanwise flow angle distribution. The solid line represents the predicted
flow angle for the inviscid solution as in Fig. 19. The circle indicates the
calculated boundary layer thickness and the maximum angle at hub and tip. The
S. triangles are data acquired by the first author (Ref 7). The plot shows good
agreement of predicted and measured flow angles. The deviation in the mass
averaged measured and calculated flow angles is only 0.5%.
C. High Speed CDTD
One of the main objectives of the low speed cascade was to examine the
design concepts with a view to applying them to the design of a transonic
device; the high speed CDTD.
Q3DFLO-81 is capable of calculating transonic flow in a metidional
through flow calculation as long as the meridional velocity remains subsonic.
A high speed cascade has been proposed with a nearly tangential Mach number of
1.48 and a total pressure of 1.6 bar at the inlet plane. The geometry of the
-7-
C."

flow channel is qualitatively similar to that of the low speed cascade. The
dimensions are smaller to reduce the massf low required to obtain higher
velocities and the curvatures are :educed to avoid flow separation. Figure 23
shows the flow channel geometry which was analyzed. Station 1 is at a radius
of 10 inches. Station 12 is at a radius of 12 inches.
The results obtained by applying Q3DFLO-81 to the high speed CDTD are
shown in Fig 24. Shown are results for the inviscid core flow, including
spanwise distributions of static pressure, Mach number, flow angle and
. meridional velocity. Even though the Mach number of the overall velocity was
.-- always supersonic, the meridional velocity remained subsonic. Consequently,shocks should not appear in the flow into the test section.
.J.
III. BLADE TO BLADE CALCULATION
The blade to blade calculation of the code Q3DFLO-81 is used in the
quasi-3D calculation for turbomachinery blade rows as described in Section
2.1 or for isolated blade-to-blade calculations. The application to linear
cascades will be described in this section.
A. NASA Controlled Diffusion Blade
A numerical optimization technique to design a controlled diffusion blade
shape was developed by NASA (Ref. 8). It allows analytical design
of airfoils which are shock free at transonic Mach numbers and avoids suction
surface boundary layer separation for the range of inlet conditions necessary
for stable compressor operation.
The on- and off- design performance of one design of such blades have
been measured in a subsonic linear wind tunnel. The facility is described in
detail in Ref 9 . The tests conducted with a controlled diffusion blading
section designed for a compressor stator at mid-span are described in Ref. 10.
Cascade configuration parameters are given in Table I. Table II presents the
coordinates of the test blades.
Q3DFLO-81 was used to calculate the blade surface pressure distributions
to compare with measurements. Figure 25 shows the blade shape and Fig. 26
shows a typical finite element mesh for the blade to blade calculation. In
order to avoid the sharp increase in velocity, due to the potential flow
effect around a thick trailing edge, the trailing edge radius was removed.
*The inviscid flow in fact does not see the trailing edge radius due to the
viscous behavior and thus the geometry should be modeled in this way. The
strong curvature at the leading edge of the blade also caused peaks in
velocity, as the inviscid flow negotiates the large curvature from stagnation
point to suction surface. To calculate such a leading edge shape, the mesh
-9-
P. -A Z,~

has to be much finer around the leading edge than Q3DFLO-81 is able to produce
(due to a restriction in the number of mesh points). The leading edge,
therefore, also had to be adapted to this situation. The remainder of the
flow field should be reliable since the occurance of velocity peaks seldom
invalidates more than a few grid points in their vicinity. Particularly with
these compressor blade geometries, the adverse pressure gradient tends to
discourage the velocity variation from propagating very far or reflecting off
the downstream boundaries. The influence of the flow at 5% of chord
downstream of the leading edge, and 5% of chord upstream of the trailing edge
is only 0.1%, therefore the calculation is accurate for 90% of the chord.
Figure 27 is a plot of streamlines which shows that the flow tangency
condition is very well satisfied along the blade surface and no flow
separation is encountered. Figure 28 is a comparison of predicted and
measured pressure coefficients along the blade surface for different inlet air
angles. Very good agreement is achieved for high inlet angles (38.90, 42.90,
45.90). The two smaller values at the suction side between 60% and 80% chord
are errors in the measurements, probably due to plugged pressure taps. For
smaller inlet air angles (24.48, 28.00, 32.950) the measured values are
slightly smaller than those predicted by Q3DFLO-81. The highest deviations
are noticed at 32.950 incidence. Figure 29 is a plot of the measured AVDR
versus inlet air angle. It is noted that the AVDR does not depend simply on
the static pressure rise as is shown in Fig. 30. The AVDR in the tests
reported in Ref. 10 was determined by measuring and integrating mass flux
distributions at midspan upstream and downstream of the blade row. The
technique is described in detail in Ref. 11. In the present calculations the
AVDR was assumed to be constant from the measuring plane upstream of the blade
,....
-" -,-

row to the leading edge, and from the trailing edge to the downstream
measuring plane, and to have a linear distribution along the chord. The AVDR
is input to Q3DFLO-81 to account for quasi-3D-effects. The assumed
distribution of the AVDR along the chord of the blade might not be
sufficiently representative of the experimental conditions and this could be
responsible for the observed deviations.
B. Comparison with Finite Volume Code QSONIC
QSONIC is a FORTRAN computer code developed by NASA and is described in
detail in Ref. 12. It is capable of calculating the flow field about a
cascade of arbitrary 2-D airfoils and approximating the three-dimensional flow
in turbomachinery blade row by correcting for streamtube convergence (AVDR)
and radius change in the through flow direction. The program uses a
conservative solution of the full potential equation combined with the finite
volume method on a body-fitted periodic mesh. It is capable of calculating
through weak shocks (peak relative Mach number less than 1.4) by introducing
an artificial density in the transonic regions. The code has been adapted to
the NPS computer (Ref. 13) and was used for comparison with O3DFLO-81.
3DFLO-81 and QSONIC are both inviscid codes and solve the potential flow
equations. In the Mach number range of the linear cascade (the Mach number of
the flow at the inlet to the blade row is 0.25), they were expected to ,ive6
basically the same results. Figure 31 compares the results of both codes with
measurements from Ref. 10. They are in good agreement and show the same
limitations for the calculation of the flow around the leading and trailing
edges.
Even though grid generator and flow solution runs can be separated while
operating OSONIC, it requires 12 minutes CPU time for the flow solution
-11-
4"
***.

while Q3DFLO-81 requires only eight seconds. For applications at low Mach
numbers Q3DFLO-81 is much faster for the same degree of accuracy. It also
provides a convenient post-processor which produces plots of mesh, blade shape
and the calculated results. QSONIC should be used for Mach numbers on the
blade surface from 1.0 to 1.4.
eq,12
* a- - '* .

IV. CONCLUSIONS
The experience of applying the computational code Q3DFLO-81 to several
turbomachinery flow problems allowed the following conclusions to be drawn:
I. Despite the apparent complexity of the geometry, the application ofthe code to the transonic compressor stage was straight-forward. Themesh was simple and resulted in very modest CPU times.
2. In the compressor stage analysis, the inlet flow to the rotor wasvery well predicted. Flow incidence angles were computed well except
near the hub. Deviation angles from the rotor were within 30 of themeasured values with the largest departures near hub and tip. Thecomputed rotor losses agreed qualitatively with measured distributionsbut were smaller in magnitude. The stage efficiency was computed to belower than the measured values, suggesting an inconsistency which must
yet be explained.
3. Application of the code to the swirling flow generation within acentrifugal diffuser test device (CDTD) required only that minor
"E geometrical approximations be introduced. Inlet and outlet boundaryconditions were within the capability of the existing code.
4. In the low speed CDTD, the computed spanwise distribution of flowproperties at the outlet did not agree with the measured valuessuggesting the importance of viscous effects. The mass-averaged outletflow properties agreed quite well.
5. The code was applied with apparent success to calculate transonicswirling flow within a high-speed CDTD, and could therefore be used todesign a suitable channel shape.
6. The prediction of the code in blade-to-blade calculations agreed wellwith measurements made in a linear subsonic cascade. Leading and trail-ing edges of the blades had to be modified to avoid non-physical velocitypeaks, but the influences of the modifications were negligible 5% chorddownstream of the leading edge and 5% chord upstream of the trailing
edge.
7. Excellent agreement was obtained with the blade-to-blade predictionsof NASA's code OSONIC at a test Mach number of 0.2. However, theO3DFLO-81 code required 8 seconds of CPU time compared to 12 minutes forOSONIC.
Overall, the experience of the individual investigators was .hat the code
could be applied successfully with limited guidance from the code's author.
The post processor package was extremely valuable, and was implemented without
4 difficulty on the NPS computer.
-13-
S.. . , ,.." - .- . - , - . . . , . . - . . - . - . , - , . - . . . . . . - . . - , ,- , . . . . , r -- - . . , . '. *1 . , .'._'-.. :,, :r ' - " ,- . . .. , , " " " ' " :
L.r
f 7
IT 21

C
co
0
4Jj

C 00
- (liii
~-r-' ~2 U) .Q
0 II 2
K Ii
T at -f-ICc~)
Ii I
I- I CC)'I I :~ u
C
I -~ r~
11 'a
41 I -v-I w-- i
CrC
N -
- - iCr- N
C)I-I
#1 C- 2L7E~ t:xu
7-
K 'C- . 4-
C 2 *~ 89. .- C-
3- U C 0 4-v
p - 4 's- ~)4- .9
9. I C
@1 * I -
-'P .1 4-2- 'I)
-. I - - 0 -'
-. - -
C.. I Cl
Cfl
0e C)
I I
C
'UN.
-h
"-4.
-M
lb
-. :-~---&. .;~%~;g;.%............,. -.
--. ---. - * *.*.*.*.
* . - - 9 .9 -

r
CU 4-4
L C -)
,iZ,
-~ 7~
16 1 :
44-1
-T 1
.11 C 1
C)j
0 .0
-D-4
c
0- 4 41
fm. ~ I-"--~

C, c
00
0 0T o4
'44LZ
.J
m 0 1)
LJ0 0 1
U
C3 to -t t C) 1
do I' -4- 3
C3 0)
CC
I o -4
03 0) 0
o~ 0 0 C
0 I~ 4
.
C 41
1011 4
43 I 0 '
CL or 4
Le 7,.. ~

-.- C.7 -aV
Q)4
LiI -W- 4-j
z z z VME A~ ~O
C, 0 0N
z ~ - IQcc
.0 ---
U4
/ iZ Z
200

4J
0- - -) -
Zn4
41 4
I U.
m Ij
(a 0
4J Q-
4.)
C.)
C- Zn z) 7
Znto

Co C) CC3
-.
CDz
0 ~-4tn 044
ijl 2C
-~~~ CILftftf
0 F3 z zz z
C.3)
4-
12)
0 ) C:I i
-~ u
Ii t~I 41
I'\/ 'K Z3

v 0.9--
,::.. .,x +++ - "
0.8-
X Adiabatic efficiency (calculated)
0.7
+ Total efficiency (calculated)
-? Total pressure ratio (calculated).
0( Test data
0
. 1.2-
"*I 0
10 11 0 I i" Referred flow rate (lb/sec)
* Fiqure 17. Calculated and measured compressor per-
formance maps at 60', and 70", design speed.
i":;" -.. ,.-. .*.-.. -... .-. -. -. - -' . -, .".. . . . '. .- " ". . . . v ,*. -. ,-" -..-. .. .,-" . . '

m o r - oL.Qrr N
4-4404-4
.- 1U
4-4
~~ -4 4J () 4of
* -4 Mf
* r> 0
C0'.-
V-0.
CDC
-4
C> C)
00-. r
A3U3TTJJ ~ oi Iei a-T nss a--4 %

I' 0
-I -H
-1 4-)
~ I u
0
U)
U)
- ~/.* I
U)
2- -.
r- -
-4J
C)
In
* -
I ___
Ci 0
-. -- *--- - I
*
*--..-.~-.-.~--.J~-. .- '~
I I
*
I ~I I
I, -4 -4
--.4 ,'
~t. - -~--~ Li -7-
K)
@1* ( N -
ELF-(~~-.J U:
25
- * . - . . . -
p *Iv. ~
- - -

COTO JWS=8.0 51=2.6 COTO JW5=-6.0 B1=2.65TAT[ON5 5TRY 1OW3
2 5 IZ 2 5 12 18FLOW CRSES FLOW iASES
7~~~ - - - - - - -~ - .8a !n/ / 10.O0
-, 2 .2W
-4L
" . ." /-1-.0~- - - - - - - - - -
"i-" r," ./
. SO
0 20 40 60 80 100 0 20 tiO 60 80 iG3
3/n" CISTRNCE FROM HUB OP 5TATION 0/0 OIJTANCE FHOM H68 OF STRTION
CO TO JNS=8.0 51=2.6 COlO J0Tn 5.B B1=2.6STAT 10W5 SIATIONSI
2 5 12 15 2 5 12 l1FLOW EASES FLOW c5E5
I 1 ISS. 0
r - 4. 00 10" t
3. 75 - - - -
Lr
3.25)
0 J 40 60 10 1J O 20 40 bO ' 6 ..
1/0 I'7P NCE FPfT.q "'J !c II~t 0/0 1 *C F7' ! ST .N
5T1nT 1 2 CI5' I _Ti11:'4 S rP r I .. . . . . .
511. TlI ti L&Afr - -. . . .
Figure 20. Spanwise distribution of flow properties
as -I function of flow station.
2 6

o~ Q ~C!I
00 1
0 ~~-4 (
.104 C3 0
00- I 04 a
0 04 0
4
0 cr
-4
271

LL-
CI,
4
E7-
/1 "F i)
I '.J 44
'/-
HIGH SPEED COTO HIGH 5PEED LDT[}OT1 8N$ 5TATION5
1 5 12 2 S a 12FLO! CASES FLOM C1i4SES
1 1
1.50
.550
-Z7~
* " / X T, \.so0s
\ .4500z
Ucc
-/
- 20 40 0 0 1o 0 20 40 60 80 j
:13 015TANCE FRIM HUB nF STATION i/0 l ISTi NCt ¢FRM HLtB SRTjTION
SliI ON 2 CASE I
5 1 AT 04 S CASE I1SIRTIN 8 C5E I -
STATION 12 CASE I - - - - -
.. Lh SPEED CDTO nIGH DP-fl 2,5lT ICN5 STAIITiS
2 S 8 12 2 a1 12F-- CASES FLOW CA4SES
- - ,/3 20--
"o 4- 80 .0 0 2 )
0/" DI TIC F9 " HJ IF 'T-
K 2f
'. . 'I<~l"-'. -'/
'"0 70 0 0o io I OO 0 20 10 ,C t I '
I': Figure 24. Hligh speed CDTD flow properties.
,I

r~r':+ + , i + , . . . . . . ..
,,::.:
0 .- /
I . -t± ' -
+::":2
'- / C °
"2".-Z,' t I
:- I!
. /b .. .

-nn
C(Xi
___ C)
7-E
t,7 fi)'L

I 1
K--
It71
I3'
o a
It'
LU 0J
0 M
L14 Li
Lij
z g
it 04
00
(NJ0
Ito
LU A
!II --- 4J'mi~~jo p ws~dim ijj3jnsw
- -Ca
- (f( -
- ~ -.- in
-I Vto
o LM
~. j
I.; fl- 4 ' 11 - 0
r 33

- .. 1 lii I
0
4-jcc
.J
V)
oco
r, CC
co C) C3 C
34~

14.4
-4
44
4
CL
C4r
41
c C:
C C:)
cC:
0 C3
CD C)CD C
ua-
35C

o Sa
1 0
a0 '-4 E-
C_ H U
0
CCn 0 E- E--
X C)
"I FJ
o~t 0 0 U) U
t:t
Lm - 3 ' -
C3 0
3 4 9
rn C3~ 3
J 1 oijiw lte w
363
)if a ogA4-mNIN )

TABLE I - CD COMPRESSOR CASCADE PARAMETERS
Bade type
Number of blades 20
Spacing (inches) 3.0
Sol idity 1.
hichless (% chord) ".
Stagger angle 11.27
TABLE II - CD BLADE COORDINATES
X-COMRD. Y-PRESS. Y-:;i CT.0.0 0.0450.022 -.-- 0 4
0..0570.057 0.0020.222 0.044 0.1960.414 0.101 0.1070.666 0.155 0.4030.888 0.207 0.131.110 0.255 0. 5(t11.332 0.299 0.t211.554 0.330 0.6631.776 0.350 0.6911.998 0.359 0.7052.220 0.359 0. ,082.442 0.352 0.1012.664 0.342 0. i's I2.886 0.331 O.,'o3.108 0.317 0.t10S3.330 0.301 0.-,633.r52 0.2813.774 0.157 0.1533.996 0.227 0. 3934.218 0.191 332
0, 4.440 0.1.16 0.2704.662 0.089 0.268.'..." 4.884 0.019 0.154.925 0.0045.914 01225.10 0.062 0.LC2
37
00:
REFERENCES
1. Wu, C. H., "A General Theory of Three Dimensional Flow in Subsonic andSupersonic Turbomachines of Axial-Radial and Mixed Flow Type," NACA, TN2604, 1952.
2. Hirsch, CH. and Warzee, G., "A Finite Element Method for Through FlowCalculations in Turbomachines," ASME Journal of Fluid Engineering,
pp. 403-421, September 1976.
3. Hirsch, CH. and Warzee, G., "An Integral Quasi-3D Finite ElementCalculation Program for Turbomachinery Flow," ASME Journal of Engineeringfor Power, Vol. 01, pp. 141-148, January 1979.
4. Schulz, H. D., "Guide to Using the Finite Element Code Q3DFLO-81 on theNPS IBM 370," Naval Postgraduate School, Turbopropulsion LaboratoryTechnical Note TPL-TN-84-01, June 1984.
5. Erwin, J. R., "A Review of the Design of the NPS/TPL TransonicCompressor," Contractor Report NPS67-83-004CR, Naval Postgraduate School,Monterey, CA, March 1983.
6. Erwin, J. R., Phillips, R., Schulz, H. D. and Shreeve, R. P.,"Development of a Centrifugal Diffuser Test Device, Part I - Design andConstruction of Low Speed Aparatus," Naval Postgraduate School ProjectReport, NPS67-84-003PR, September 1984.
" 7. Schulz, H. D. and Shreeve, R. P., "Development of a Centrifugal DiffuserTest Device, Part II - Initial Measurements and Flow Analysis," NavalPostgraduate School Project Report, NPS67-84-O04PR, September 1984.
8. Sanger, N. L., "The Use of Optimization Techniques to Design ControlledDiffusion Compressor Blading," NASA Technical Memorandum 82763, LewisResearch Center, Cleveland, Ohio, 1982.
9. Rose, C. C. and Guttormson, D. L., "Installation and Test of aRectilinear Cascade," Master's Thesis, Naval Postgraduate School,Monterey, California, 1964.
10. Koyuncu, Y, "Report of Tests of a Compressor Configuration of CDBlading," Master's Thesis, Naval Postgraduate School, Monterey,California, 1984.
11. Himes, S. J., "Report of Tests of a Compressor Configuration of DCABlading," Master's Thesis, Naval Postgraduate School, Monterey,California, 1983.
. -38-
Ud
REFERENCES
12. Farrell, Ch., "Quasi-3D Full Potential Transonic Blade-to-Blade-Code,"NASA Hand out, Draft of Technical Paper, Conference on TurbomachineryFlow Analysis Methods-A Status Report on Maturing Codes, Conference atNASA Lewis Research Center, 14-15 October 1981.
13. Molloy, Jr., W. D., "Preliminary Measurements and Code Calculations ofFlow Through a Cascade of DCA Blading at a Solidity of 1.67," Master'sThesis, Naval Postgraduate School, Monterey, California, 1982.
4r
-9
A.-
@1
m..
... '..-39-
P....
_,r ,,,' ,,e,€, .,,, . ,'.",,.......•.' ." ..,., -.... . .," ,' '.,' . . , ,. ,. ."...,",. ,".._.",. ,L, 4 ." , *: ,

INITIAL DISTRIBUTION LIST
1. CommanderNaval Air Systems CommandWashington. DC 20361
Attention: Code AIR 310 1
Code AIR 310E 1
Code AIR 320D ICode AIR 530 1
Code AIR 536 1
Code AIR OOD 14Code AIR 03D I
2. Office of Naval Research800 N. Quincy Street
Arlington, VA 22217
* Attention: Dr. A. D. Wood I
Dr. M. K. Ellingsworth 1
3. Commanding Officer
Naval Air Propulsion Center
Trenton, NJ 08628Attention: G. Mangano, PE-31 1
4. Commanding OfficerNaval Air Development CenterWarminster, PA 19112
Attention: AVTD
5. LibraryArmy Aviation Material LaboratoriesDepartment of the Army
Fort Eustis, VA 23604
6. Dr. Arthur J. Wennerstrom1AFWAL/POTX
oi Wright-Patterson AFB
Dayton, OH 45433
7. Air Force Office of Scientific Research IS-. AFOSR/NA
Bolling Air Force BaseOi Washington, DC 20332
Attention: Mr. James Wilson
*'-. - 0-
-%.4"4 . '
.

8. National Aeronautics & Space AdministrationLewis Research Center21000 Brookpark RoadCleveland, OH 44135Attention: Chief, Internal Fluid Mechanics Division 3
Library 1
9. LibraryGeneral Electric CompanyAircraft Engine Technology DivisionDTO Mail Drop H43Cincinnati, OH 45215
10. LibraryPratt & Whitney Aircraft GroupPost Office Box 2691West Palm Beach, FL 33402
11. LibraryPratt-Whitney Aircraft GroupEast Hartford, CT 06108
12. LibraryCurtis Wright CorporationWoodridge, NJ 07075
13. LibrarykVCO/Lycoming550 S. Main StreetStratford, CT 06497
14. LibraryTeledyne CAE, Turbine Engines1330 Laskey RoadToledo, OH 43612
15. LibraryWilliams InternationalP. 0. Box 200
-9 Walled Lake, MI 48088
16. LibraryDetroit Diesel Allison Division G.M.C.P. 0. Box 894Indianapolis, IN 46202
6
17. LibraryGarrett Turbine Engine Company111 S. 34th StreetP. 0. Box 5217Phoenix, AZ 85010
-41-
.1i . . . .. . . . : . . . . .. .. . . .. • . .. . ..- . .-. . . . .-.- , . ... : ,.. . --- . . . ., , , - -
..." " "-' J " ' :-" ,- 7 . .,. i ' i .i " i: ,! - _ '.: - ", " '-"'

8. Professor J. P. GostelowSchool of Mechanical EngineeringThe New South Wales Institute of TechnologyNew South Wales
AUSTRALIA
19. Dr. G. J. WalkerCivil and Mechanical EngineeringDepartment
The University of Tasmania
Box 252CGPO Hobart, Tasmania 7110AUSTRALIA
20. Professor F, A. E. BreugelmansInstitut von Karman de la Dynamique
des Fluides72 Chausee de Waterloo1640 Rhode-St. GeneseBELGIUM
621. Professor Ch. Hirsch
Vrije Universiteit BrusselPleinlaan 21050 BrusselsBELGIUM
22. DirectorGas Turbine EstablishmentP. 0. Box 305
Jiangyou CountySichuan ProvinceCHINA
23. Professor C. H. WuP. 0. Box 2706
Beijing 100080CHINA
24. Director, Whittle LaboratoryDepartment of EngineeringCambridge University
ENGLAND
" 25. Professor Jacques ChauvinUniversite d'Aix-Marseille1 Rue Honnorat
" Marseille
FRANCE
-42-

26. Mr. Jean FabriONERA29, Ave. de la Division Leclerc
92 Chatillon
27. Professor D. Adler* Technion Israel Institute of Technology
Department of Mechanical EngineeringHaifa 32000
* . ISRAEL
-. ~.28. Dr. P. A. ParanjpeHead, Propulsion DivisionNational Aeronautics LaboratoryPost Bag 1700Bangalore - 17INDIA
29. Dr. W. SchlachterBrown, Boveri Company Ltd.Dept. T-TP. 0. Box CH-5401 BadenSWITZERLAND
30. Professor Leonhard FottnerDepartment of Aeronautics and AstronauticsGerman Armed Forces UniversityHochschule des BundeswehrWerner Heisenbergweg 398014 Neubiberg near MunichWEST GERMANY
31. Professor Dr. Ing. Heinz E. GallusLehrstuhl und Institut feur Strahiantiebeund Turbourbeitsmashinen
Rhein.-Westf. Techn. Hochschule Aachen* . Templergraben 55
5100 AachenWEST GERMANY
-.7.32. Dr. Ing. Hans-J. HeinemannDFVLR-AVABunsenstrasse 103400 Geottingen
* WEST GERMANY
33. Dr. H. WeyerDFVLRLinder Hohe505 Porz-Wahn
* WEST GERMANY
V.-43-

34. Dr. Robert P. DringUnited Technologies Research CenterEast Hartford, CT 06108
v.,35. Chairman3 hAeronautics and Astronautics Department
31-265 Massachusetts Institute of Technology--" Cambridge, Massachusetts 02139
*. 36. Dr. B. Lakshminarayana
Professor of Aerospace EngineeringThe Pennsylvania State University233 Hammond BuildingUniversity Park, Pennsylvania 16802
37. Mr. R. A. LangworthyArmy Aviation Material LaboratoriesDepartment of the ArmyFort Eustis, VA 23604
38. Professor Gordon C. OatesDepartment of Aeronautics and AstronauticsUniversity of WashingtonSeattle, Washington 98105
39. Mechanical Engineering DepartmentVirginia Polytechnic Institute and
State UniversityBlacksburg, VA 24061Attn: Professor W. O'Brian
Professor H. Moses
40. Professor T. H. OkiishiProfessor of Mechanical Engineering208 Mechanical Engineering BuildingIowa State UniversityAmes, Iowa 50011
41. Dr. Fernando SistoProfessor and Head of Mechanical
Engineering DepartmentStevens Institute of TechnologyCastle PointHoboken, NJ 07030
. Dr. Leroy H. Smith, Jr.Manager, Compressor and FanTechnology Operation
General Electric CompanyAircraft Engine Technology DivisionDTO Mail Drop H43
* Cincinnati, OH 45215
.-.
43. Dr. W. Tabakoff
Professor, Department of AerospaceEngineering
& University of CincinnatiCincinnati, OH 45221
* 44. Mr. P. TrammManager, Research LabsDetroit Diesel Allison DivisionGenteral MotorsP. O. Box 894Indianapolis, IN 46206
45. Mr. P. F. YaggyDirectorU. S. Army Aeronautical Research LaboratoryAMES Research CenterHoffett Field, CA 94035
46. Library 2Code 1424Naval Postgraduate SchoolMonterey, CA 93943
47. Office of Research AdministrationCode 012Naval Postgraduate SchoolMonterey, CA 93943
48. Defense Technical Information Center 2Cameron StationAlexandria, VA 22314
49. Naval Postgraduate SchoolMonterey, CA 93943Attn: Professor M. F. Platzer (67PL)
Turbopropulsion Laboratory (67Sf) 2()
,%.
',%
: , , -',~~~~~~~~~~~~~~..... .. ....... ,.....<......... .. .. .. .- ,• ,'..- ... .. ,,, . o

1., 7-- -- ; ,w v
4rco
'
le L''L