022707 BMO Nesbitt Burns Conference final -...
43
Delivering Disciplined Delivering Disciplined G R O W T H G R O W T H BMO Nesbitt Burns - Global Resources Conference February 27, 2007 BMO Nesbitt Burns - Global Resources Conference February 27, 2007
Transcript of 022707 BMO Nesbitt Burns Conference final -...
Delivering DisciplinedDelivering Disciplined
G R O W T HG R O W T H
BMO Nesbitt Burns -Global Resources Conference
February 27, 2007
BMO Nesbitt Burns -Global Resources Conference
February 27, 2007

2
Bema Closing – Feb. 27/07Bema Closing – Feb. 27/07

3
Cautionary StatementCautionary Statement
All dollar amounts used throughout this presentation are expressed in US dollars, unless otherwise noted.
All statements, other that statements of historical fact, contained or incorporated by reference in this presentation, including any information as to the future financial or operating performance of Kinross constitute "forward-looking statements" within the meaning of certain securities laws, including the “safe harbour” provisions of the Securities Act (Ontario) and the United States Private Securities Litigation Reform Act of 1995 and are based on expectations, estimates and projections as of the date of this presentation. Forward-looking statements include, without limitation, statements with respect to the future price of gold and silver, the estimation of mineral reserves and resources, the realization of mineral reserve and resource estimates, the timing and amount of estimated future production, costs of production, expected capital expenditures, costs and timing of the development of new deposits, success of exploration activities, permitting time lines, currency fluctuations, requirements for additional capital, government regulation of mining operations, environmental risks, unanticipated reclamation expenses, title disputes or claims and limitations on insurance coverage. The words “plans,” “expects,” or “does not expect,” “is expected,” “budget,” “scheduled,” “estimates,” “forecasts,” “intends,” “anticipates,” or “does not anticipate,” or “believes,” or variations of such words and phrases or statements that certain actions, events or results “may,” “could,” “would,” “might,” or “will be taken,” “occur” or “be achieved” and similar expressions identify forward-looking statements. Forward-looking statements are necessarily based upon a number of estimates and assumptions that, while considered reasonable by Kinross as of the date of this presentation, are inherently subject to significant business, economic and competitive uncertainties and contingencies. The estimates and assumptions of Kinross include, but are not limited to, the various assumptions set forth in Kinross’ most recent annual information form and management’s discussion and analysis as well as: (1) there being no significant disruptions affecting operations, whether due to labourdisruptions, supply disruptions, damage to equipment or otherwise during the balance of 2006; (2) development at Paracatu proceeding on a basis consistent with our current expectations; (3) permitting and development at Buckhorn proceeding on a basis consistent with Kinross’ current expectations; (4) that a long-term lease replacing the short-term lease for the Kupol lands will be obtained from the Russian government on a basis consistent with our current expectations (5) that the exchange rate between the Canadian dollar, Brazilian real, Chilean peso and the U.S. dollar will be approximately consistent with current levels; (6) certain price assumptions for gold and silver; (7) prices for natural gas, fuel oil, electricity and other key supplies remaining consistent with current levels; (8) production forecasts meet expectations for the balance of 2006; and (9) the accuracy of our current mineral reserve and mineral resource estimates. Known and unknown factors could cause actual results to differ materially from those projected in the forward-looking statements. Such factors include, but are not limited to: fluctuations in the currency markets; fluctuations in the spot and forward price of gold or certain other commodities (such as silver, diesel fuel and electricity); changes in national and local government legislation, taxation, controls, regulations and political or economic developments in Canada, the United States, Chile, Brazil, Russia or other countries in which we do or may carry on business in the future; business opportunities that may be presented to, or pursued by, us; operating or technical difficulties in connection with mining or development activities; the speculative nature of gold exploration and development, including the risks of obtaining necessary licenses and permits; and diminishing quantities or grades of reserves. In addition, there are risks and hazards associated with the business of gold exploration, development and mining, including environmental hazards, industrial accidents, unusual or unexpected formations, pressures, cave-ins, flooding and gold bullion losses (and the risk of inadequate insurance, or inability to obtain insurance, to cover these risks). Many of these uncertainties and contingencies can affect Kinross’ actual results and could cause actual results to differ materially from those expressed or implied in any forward-looking statements made by, or on behalf of, Kinross. There can be no assurance that forward-looking statements will prove to be accurate, as actual results and future events could differ materially from those anticipated in such statements. All of the forward-looking statements made in this presentation are qualified by these cautionary statements. Specific reference is made to Kinross’ most recent annual information form, annual management’s discussion and analysis and other filings with the securities regulators of Canada and the United States of Kinross. In addition, the following factors, among others, related to the proposed business combination of Kinross and Bema could cause actual results to differ materially from the forward-looking statements: the businesses of Kinross and Bema may not be integrated successfully or such integration may be more difficult, time-consuming or costly than expected; and the expected combination benefit from the Kinross and Bema transaction may not be fully realized or not realized within the expected time frame. These factors are not intended to represent a complete list of the factors that could affect Kinross or the combination of Kinross and Bema. Kinross disclaims any intention or obligation to update or revise any forward-looking statements whether as a result of new information, future events or otherwise, or to explain any material difference between subsequent actual events and such forward-looking statements, except to the extent required by applicable law.For further information regarding Proven and Probable Mineral Reserves and Measured and Indicated Mineral Resources for either of Kinross or Bema, please refer to each companies 2005 Mineral Reserve and Resource statements as filed with regulatory authorities.Qualified persons as defined by National Instrument 43-101 are:
Rob Henderson, Kinross Gold Corporation for all Kinross assets Brian Scott, Bema Gold Corporation for JuliettaTom Garagan, Bema Gold Corporation for Kupol and Cerro Casale L. Smith, AMEC for Cerro Casale
4
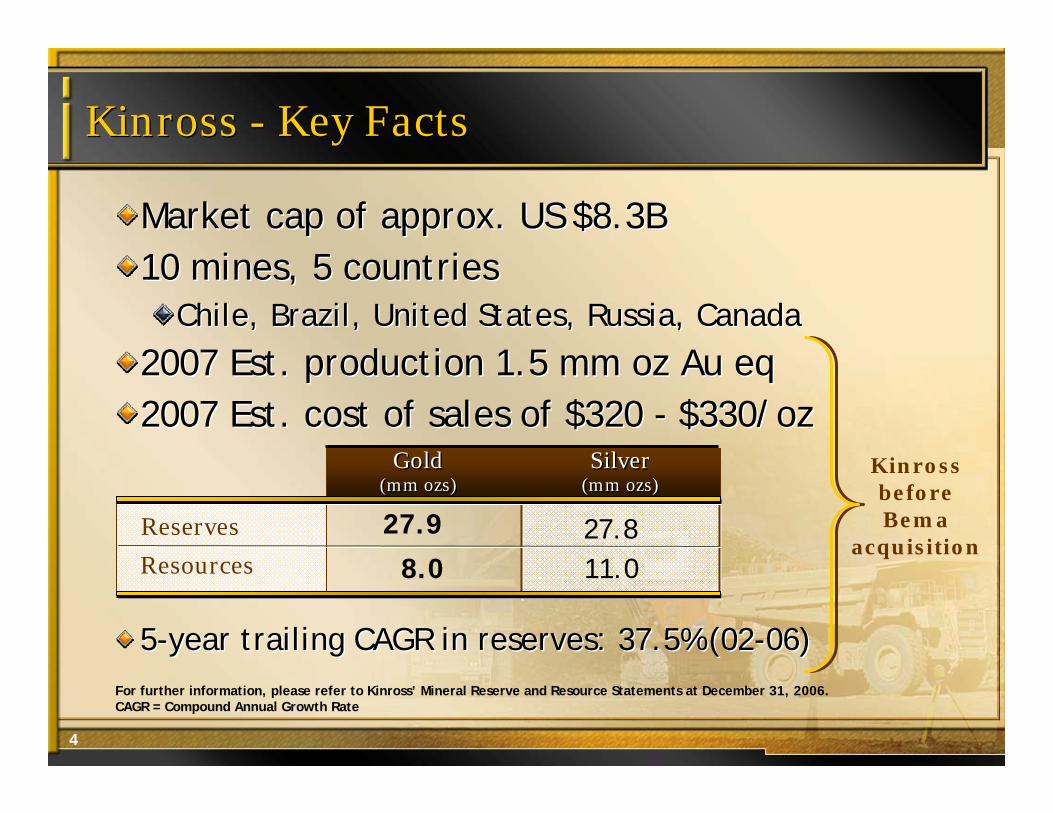
Kinross - Key FactsKinross - Key Facts
Reserves
Resources
Gold(mm ozs)
Gold(mm ozs)
Silver(mm ozs)Silver
(mm ozs)
27.9
Market cap of approx. US $8.3B 10 mines, 5 countries
Chile, Brazil, United States, Russia, Canada
2007 Est. production 1.5 mm oz Au eq2007 Est. cost of sales of $320 - $330/oz
Market cap of approx. US $8.3B 10 mines, 5 countries
Chile, Brazil, United States, Russia, Canada
2007 Est. production 1.5 mm oz Au eq2007 Est. cost of sales of $320 - $330/oz
8.027.811.0
5-year trailing CAGR in reserves: 37.5% (02-06)5-year trailing CAGR in reserves: 37.5% (02-06)
Kinross before Bema
acquisition
For further information, please refer to Kinross’ Mineral Reserve and Resource Statements at December 31, 2006. CAGR = Compound Annual Growth Rate

5
Focused PortfolioFocused Portfolio
Refugio (100%)Chile (Open pit)
Cerro Casale (49%)Chile
Kupol (75%)Magadan, Russia (Open pit, U/G) Fort Knox (100%)
Alaska, USA (Open pit)
Musselwhite (32%)Ontario, Canada (U/G)
Porcupine (49%)Ontario, Canada (Open pit, U/G)Round Mountain (50%)
Nevada, USA (Open Pit)
La Coipa (50%)Chile (Open Pit)
Paracatu (100%)Brazil (Open pit)
Crixas (50%)Brazil (U/G)
Julietta (90%)Russia (U/G)
Kettle River (100%)Washington, USA (U/G)
Operating PropertiesDevelopment Properties
6
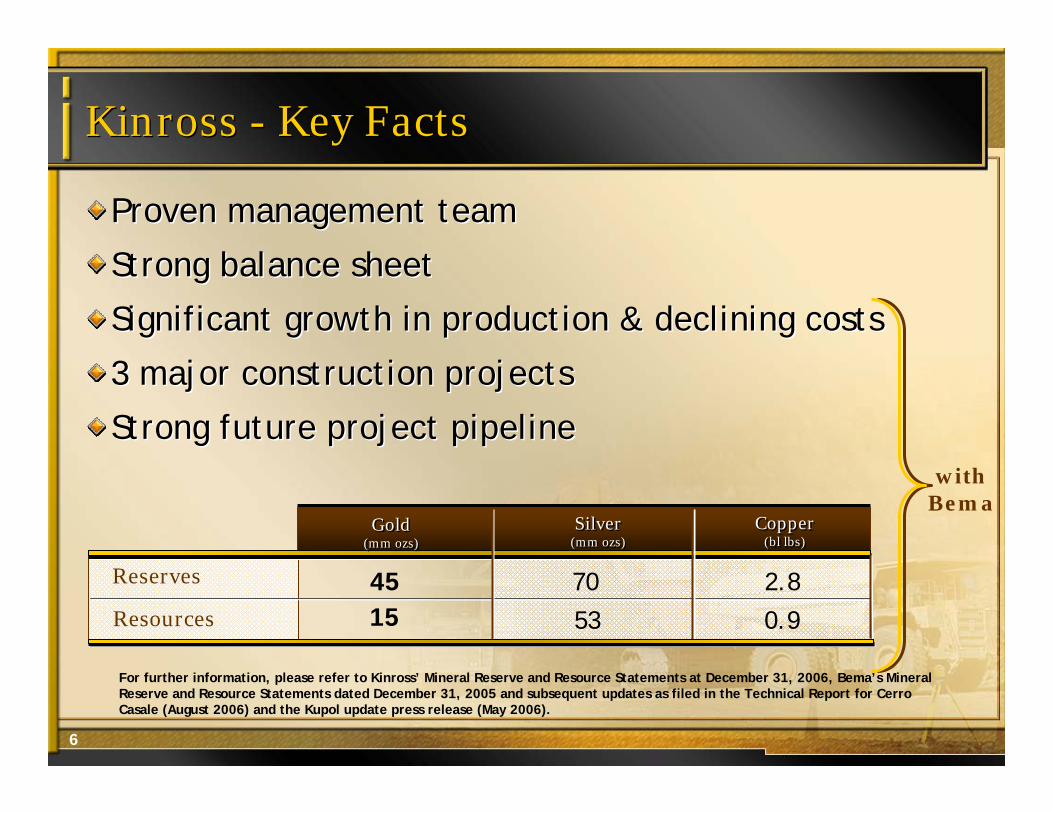
Kinross - Key FactsKinross - Key Facts
Proven management team
Strong balance sheet
Significant growth in production & declining costs
3 major construction projects
Strong future project pipeline
Proven management team
Strong balance sheet
Significant growth in production & declining costs
3 major construction projects
Strong future project pipeline
Reserves
Resources
Gold(mm ozs)Gold
(mm ozs)Silver
(mm ozs)Silver
(mm ozs)
4515
70
53
Copper(bl lbs)
Copper(bl lbs)
2.8
0.9
For further information, please refer to Kinross’ Mineral Reserve and Resource Statements at December 31, 2006, Bema’s Mineral Reserve and Resource Statements dated December 31, 2005 and subsequent updates as filed in the Technical Report for Cerro Casale (August 2006) and the Kupol update press release (May 2006).
with Bema

7
A Unique, High-Growth MajorA Unique, High-Growth Major
Long-life Reserves
& ResourcesLong-life Reserves
& Resources
Focused Geographic
PortfolioFocused Geographic
Portfolio
Proven
Management TeamProven
Management Team
Strong Financial Position
Strong Financial Position
SuperiorGrowth Profile
SuperiorGrowth Profile
Competitive Cost
StructureCompetitive Cost
Structure

8
2006: A Record Year For Kinross2006: A Record Year For Kinross
Revenue $905.6 mm
EarningsPer share
22%
$165.8 mm$0.47
Cash Flow from Operations $292.0 mm
1,476,329Production (oz Au eq.)
Cost of Sales per oz- on gold equivalent sales of:
Cash Margin
118%
$319/oz
65%
1,510,836 ozs
Gold Price 36%
Year-over-year
9
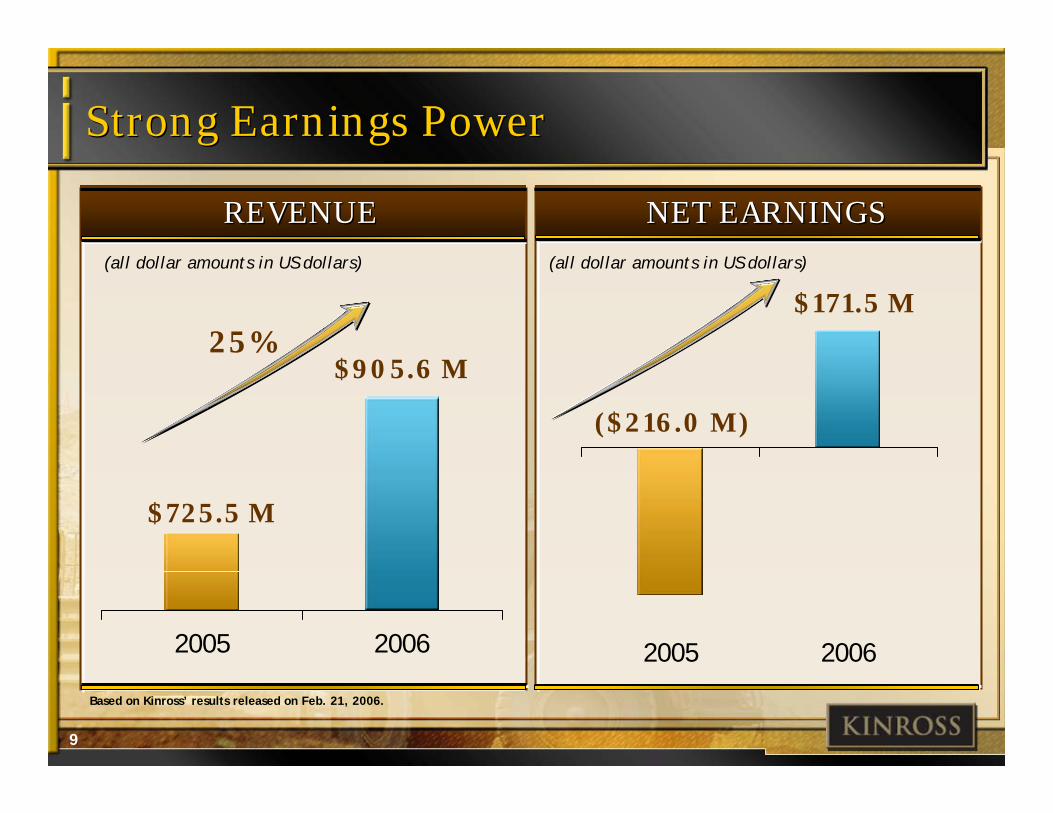
Strong Earnings PowerStrong Earnings Power
(all dollar amounts in US dollars)
2005 2006
($216.0 M)
$171.5 M
(all dollar amounts in US dollars)
REVENUEREVENUE NET EARNINGSNET EARNINGS
25%
2005 2006
$725.5 M
$905.6 M
Based on Kinross’ results released on Feb. 21, 2006.
10
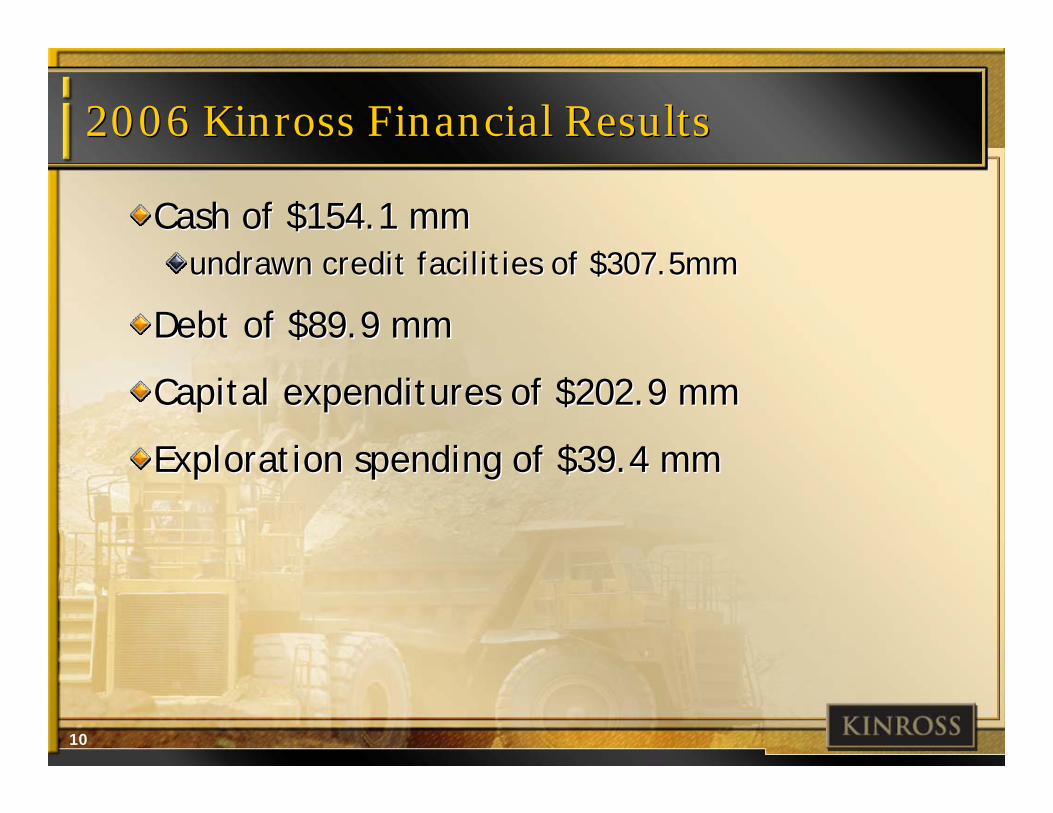
2006 Kinross Financial Results2006 Kinross Financial Results
Cash of $154.1 mmundrawn credit facilities of $307.5mm
Debt of $89.9 mm
Capital expenditures of $202.9 mm
Exploration spending of $39.4 mm
Cash of $154.1 mmundrawn credit facilities of $307.5mm
Debt of $89.9 mm
Capital expenditures of $202.9 mm
Exploration spending of $39.4 mm
11
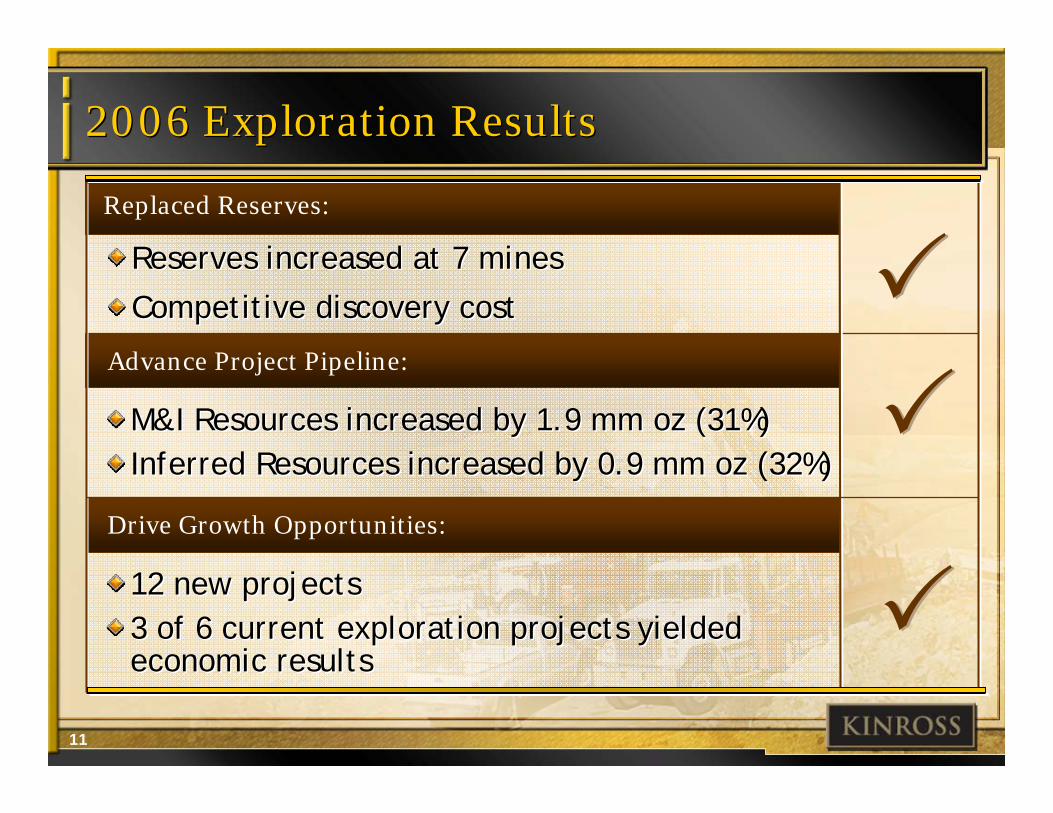
2006 Exploration Results2006 Exploration Results
Replaced Reserves:
Advance Project Pipeline:
Drive Growth Opportunities:
Reserves increased at 7 mines
Competitive discovery cost
Reserves increased at 7 mines
Competitive discovery cost
M&I Resources increased by 1.9 mm oz (31%)Inferred Resources increased by 0.9 mm oz (32%)M&I Resources increased by 1.9 mm oz (31%)Inferred Resources increased by 0.9 mm oz (32%)
12 new projects3 of 6 current exploration projects yielded economic results
12 new projects3 of 6 current exploration projects yielded economic results
12
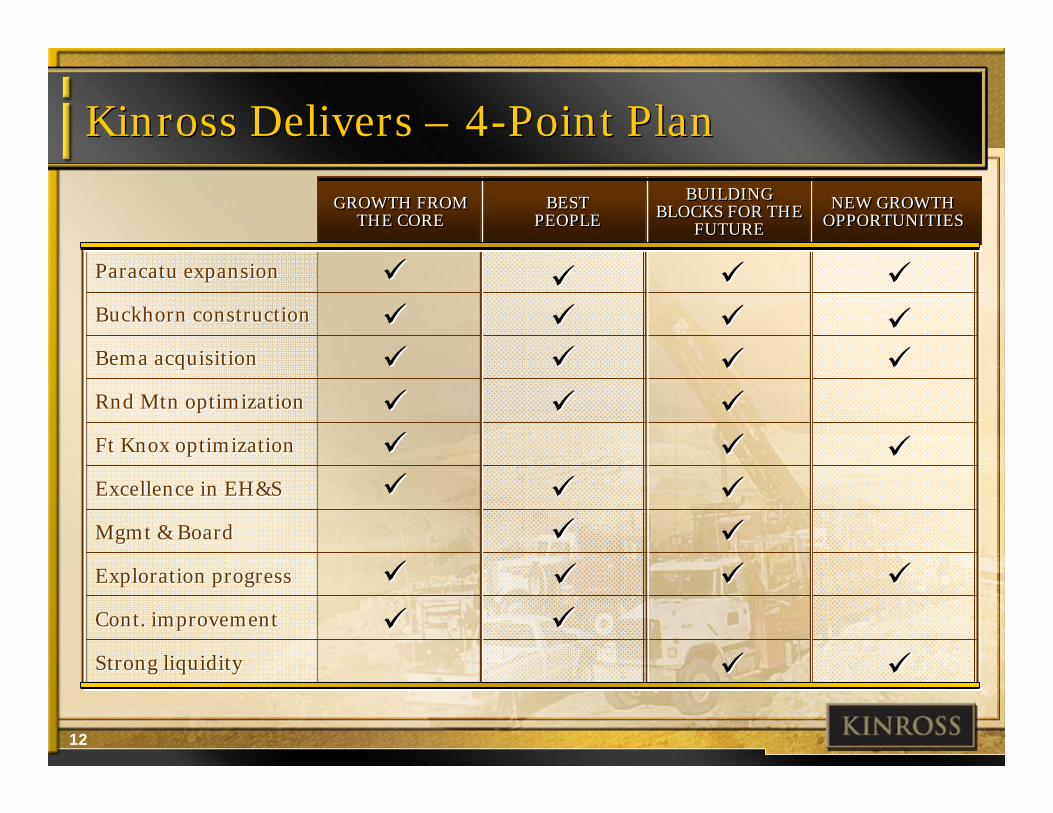
Kinross Delivers – 4-Point Plan Kinross Delivers – 4-Point Plan
GROWTH FROM THE CORE
GROWTH FROM THE CORE
NEW GROWTH OPPORTUNITIESNEW GROWTH
OPPORTUNITIES
BUILDING BLOCKS FOR THE
FUTURE
BUILDING BLOCKS FOR THE
FUTURE
BEST PEOPLE
BEST PEOPLE
Paracatu expansion
Buckhorn construction
Bema acquisition
Rnd Mtn optimization
Ft Knox optimization
Excellence in EH&S
Mgmt & Board
Exploration progress
Cont. improvement
Strong liquidity
Paracatu expansion
Buckhorn construction
Bema acquisition
Rnd Mtn optimization
Ft Knox optimization
Excellence in EH&S
Mgmt & Board
Exploration progress
Cont. improvement
Strong liquidity
13
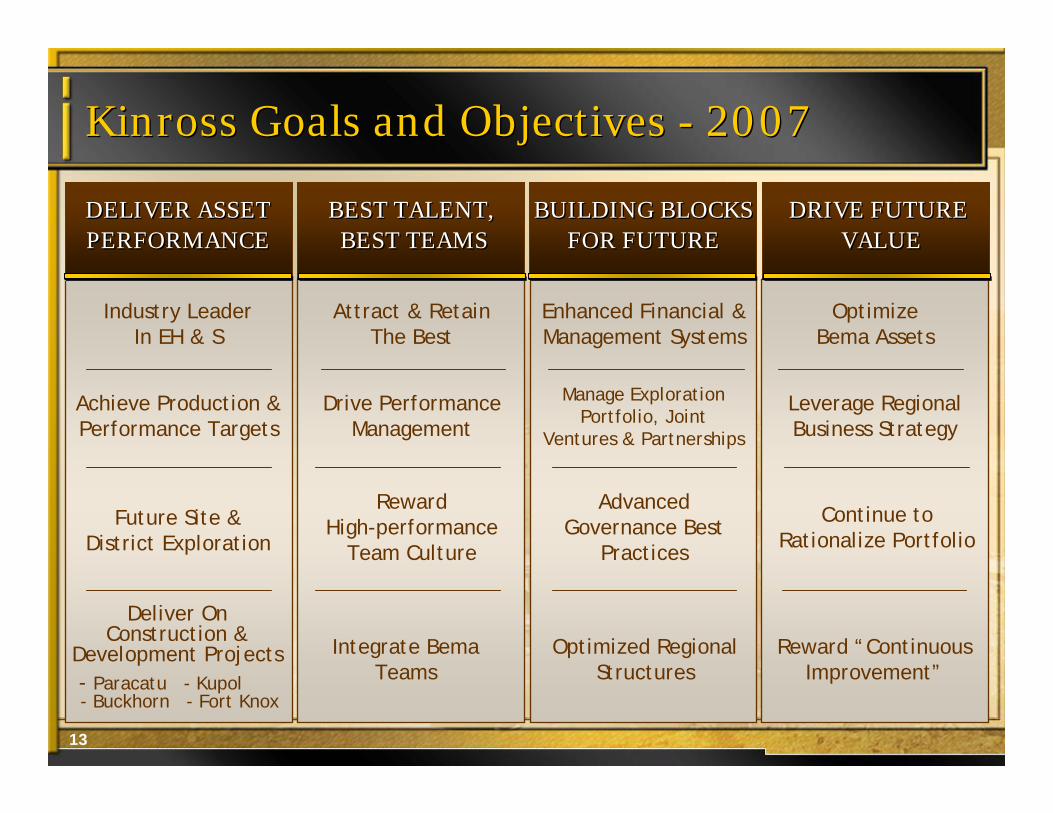
Kinross Goals and Objectives - 2007Kinross Goals and Objectives - 2007
BUILDING BLOCKSFOR FUTURE
BUILDING BLOCKSFOR FUTURE
DRIVE FUTUREVALUE
DRIVE FUTUREVALUE
BEST TALENT,BEST TEAMS
BEST TALENT,BEST TEAMS
Reward High-performance
Team Culture
Advanced Governance Best
Practices
Enhanced Financial & Management Systems
Optimize Bema Assets
Attract & Retain The Best
Leverage Regional Business Strategy
Drive Performance Management
Manage Exploration Portfolio, Joint
Ventures & Partnerships
Continue to Rationalize Portfolio
DELIVER ASSETPERFORMANCEDELIVER ASSETPERFORMANCE
Industry Leader In EH & S
Deliver On Construction &
Development Projects- Paracatu - Kupol- Buckhorn - Fort Knox
Achieve Production & Performance Targets
Optimized Regional Structures
Reward “Continuous Improvement”
Future Site & District Exploration
Integrate Bema Teams
14
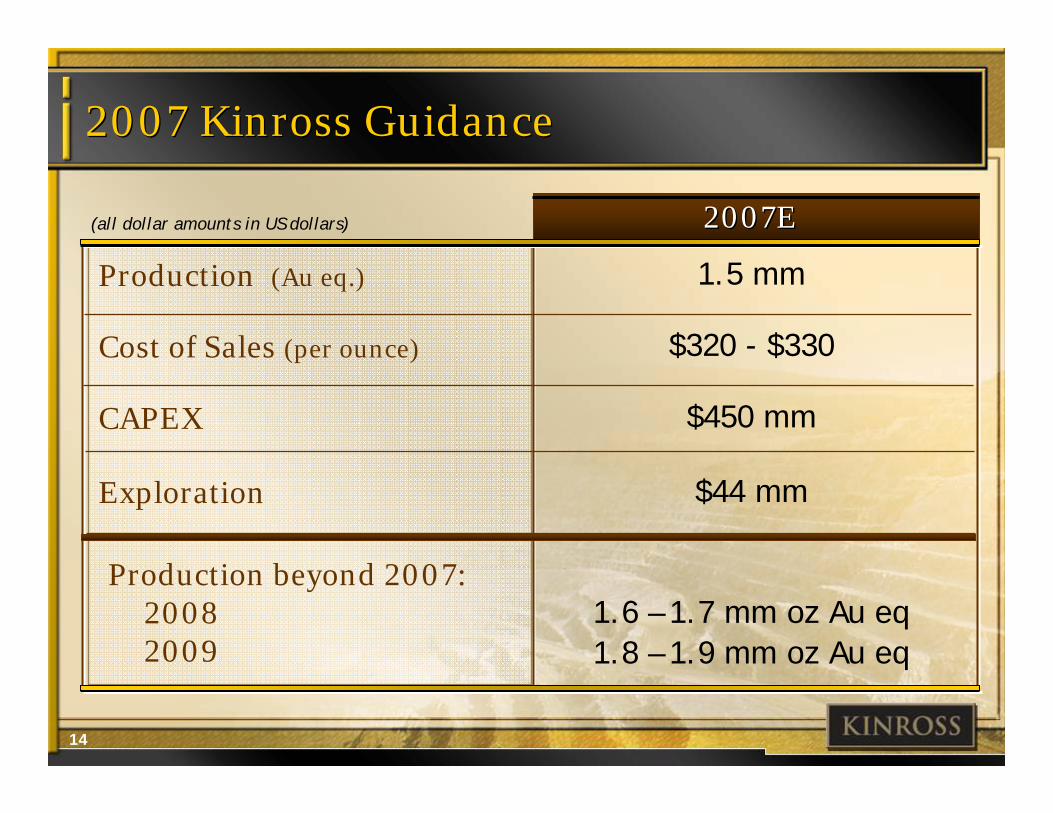
2007 Kinross Guidance2007 Kinross Guidance
2007E2007E
Production (Au eq.)
(all dollar amounts in US dollars)
1.5 mm
$320 - $330
$44 mm
Cost of Sales (per ounce)
CAPEX
1.6 – 1.7 mm oz Au eq
Exploration
Production beyond 2007: 20082009 1.8 – 1.9 mm oz Au eq
$450 mm
15
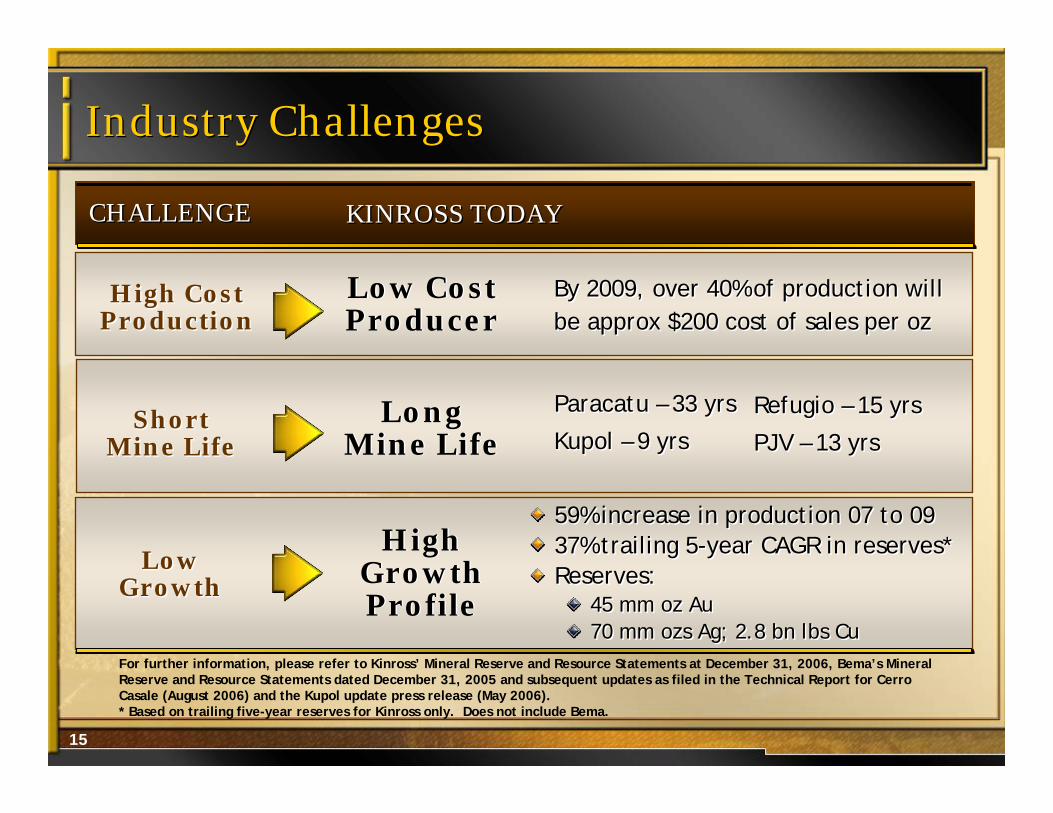
Industry ChallengesIndustry Challenges
KINROSS TODAYKINROSS TODAYCHALLENGECHALLENGE
High Cost ProductionHigh Cost
Production
Short Mine Life
Short Mine Life
Low Growth
Low Growth
Low Cost ProducerLow Cost Producer
Long Mine Life
Long Mine Life
High Growth Profile
High Growth Profile
By 2009, over 40% of production will be approx $200 cost of sales per ozBy 2009, over 40% of production will be approx $200 cost of sales per oz
Paracatu – 33 yrs
Kupol – 9 yrs
Paracatu – 33 yrs
Kupol – 9 yrs
59% increase in production 07 to 0937% trailing 5-year CAGR in reserves*Reserves:
45 mm oz Au70 mm ozs Ag; 2.8 bn lbs Cu
59% increase in production 07 to 0937% trailing 5-year CAGR in reserves*Reserves:
45 mm oz Au70 mm ozs Ag; 2.8 bn lbs Cu
Refugio – 15 yrs
PJV – 13 yrs
Refugio – 15 yrs
PJV – 13 yrs
For further information, please refer to Kinross’ Mineral Reserve and Resource Statements at December 31, 2006, Bema’s Mineral Reserve and Resource Statements dated December 31, 2005 and subsequent updates as filed in the Technical Report for Cerro Casale (August 2006) and the Kupol update press release (May 2006).* Based on trailing five-year reserves for Kinross only. Does not include Bema.

16
Kinross UndervaluedKinross Undervalued
Price/Net Asset Value (0% Discount)Price/Net Asset Value (0% Discount)
Source: BMO Capital Markets research
HMY GFI KGC NCM NEM ABX AU G BVN
100%100%95%95%
77%77%
103%103%
71%71%
79%79%
118%118%
82%82%
90%90%2007
E P/
NAV
Senior average 92%

17
Competitive Cash MarginCompetitive Cash Margin
2006 Cash Margin More Than Doubled Over 2005
Rela
tive
Gro
wth
Cash Margin Per OunceCash Margin Per Ounce
50%
100%
150%
200%
250%
300%
2002 2003 2004 2005 2006
Based on company disclosure.
Kinross (+28%)Newmont (+24%)Gold Price (+18%)AngloGold (+15%)Barrick (+12%)

18
Competitive Cost ControlCompetitive Cost ControlRe
lati
ve C
hang
e
1
1.2
1.4
1.6
2004 2005 2006 2007E
KinrossNewmont AngloGoldBarrick
Based on company disclosure for 2004-2006; guidance or the mid-point of company guidance where ranges exist for 2007.
19
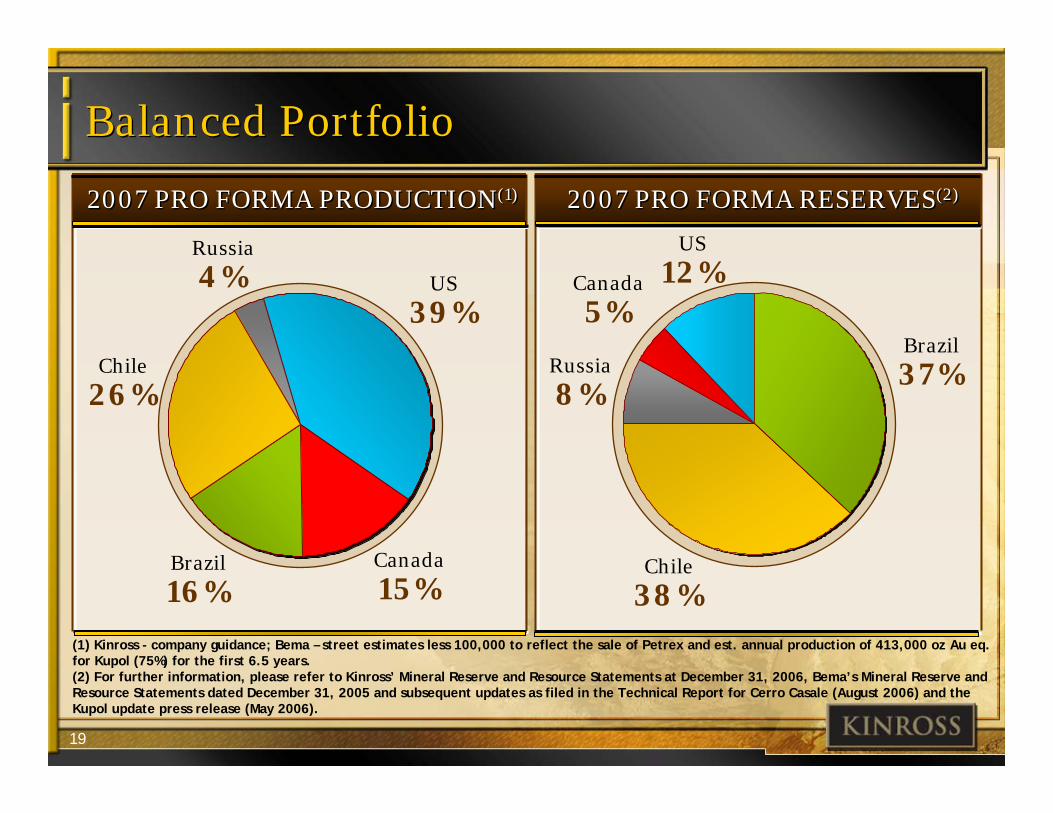
Balanced PortfolioBalanced Portfolio
2007 PRO FORMA PRODUCTION(1)2007 PRO FORMA PRODUCTION(1) 2007 PRO FORMA RESERVES(2)2007 PRO FORMA RESERVES(2)
Canada
15%
US
39%
Brazil
16%
Russia
4%
Chile
26%
Canada
5%
US
12%
Brazil
37%Russia
8%
Chile
38%(1) Kinross - company guidance; Bema – street estimates less 100,000 to reflect the sale of Petrex and est. annual production of 413,000 oz Au eq. for Kupol (75%) for the first 6.5 years.(2) For further information, please refer to Kinross’ Mineral Reserve and Resource Statements at December 31, 2006, Bema’s Mineral Reserve and Resource Statements dated December 31, 2005 and subsequent updates as filed in the Technical Report for Cerro Casale (August 2006) and the Kupol update press release (May 2006).
20
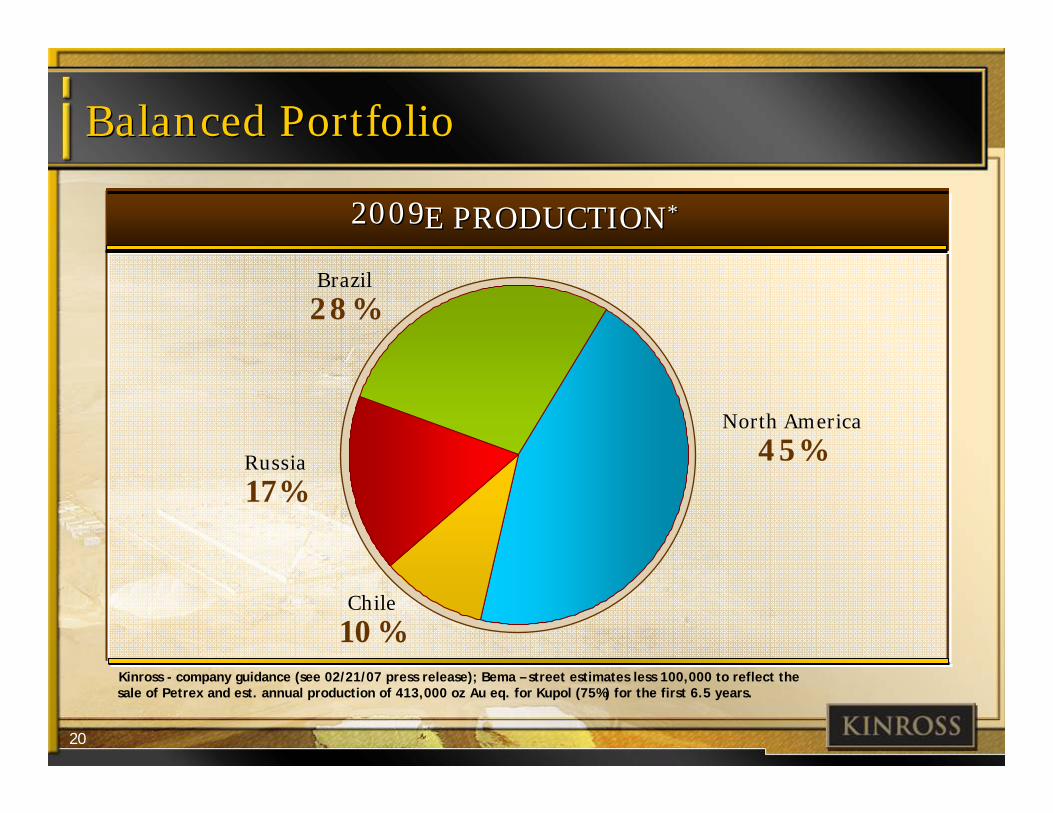
Balanced PortfolioBalanced Portfolio
Kinross - company guidance (see 02/21/07 press release); Bema – street estimates less 100,000 to reflect the sale of Petrex and est. annual production of 413,000 oz Au eq. for Kupol (75%) for the first 6.5 years.
Chile
10%
North America
45%
Brazil
28%
Russia
17%
E PRODUCTION*E PRODUCTION*20092009
21
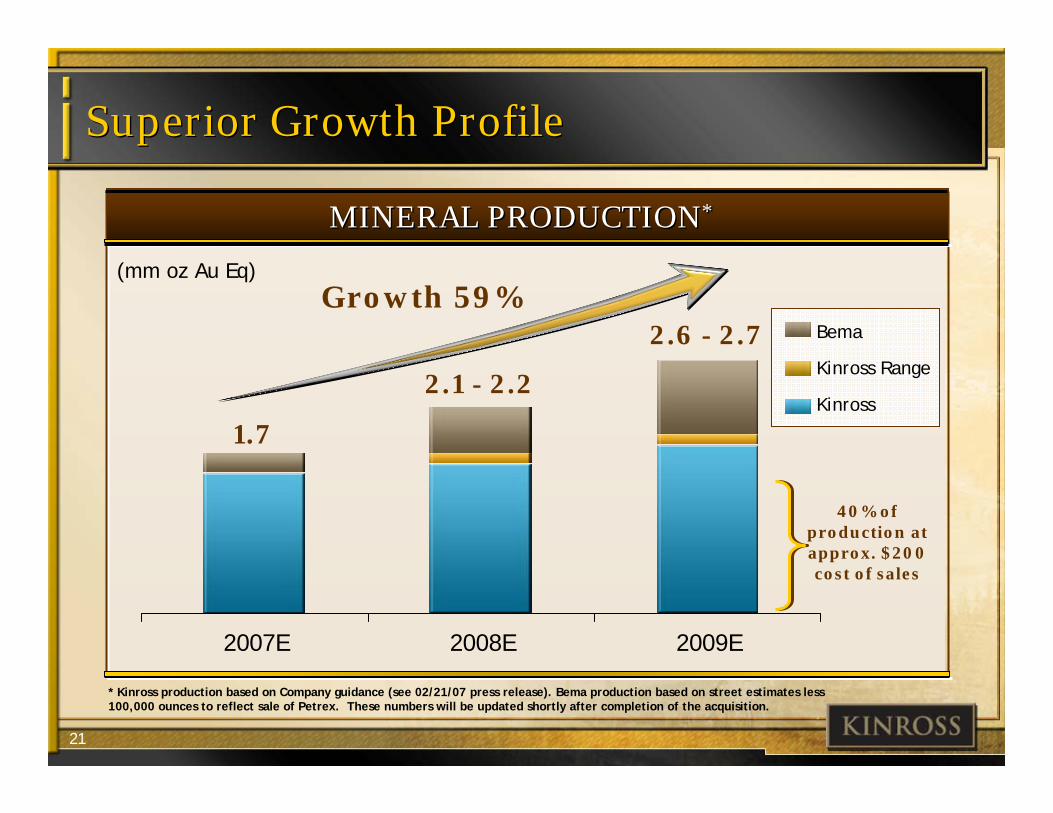
MINERAL PRODUCTION*MINERAL PRODUCTION*
Superior Growth ProfileSuperior Growth Profile
2007E 2008E 2009E
* Kinross production based on Company guidance (see 02/21/07 press release). Bema production based on street estimates less 100,000 ounces to reflect sale of Petrex. These numbers will be updated shortly after completion of the acquisition.
(mm oz Au Eq)
40% of production at approx. $200 cost of sales
Growth 59%
1.7
2.6 - 2.7
2.1 - 2.2Kinross Range
Bema
Kinross
22
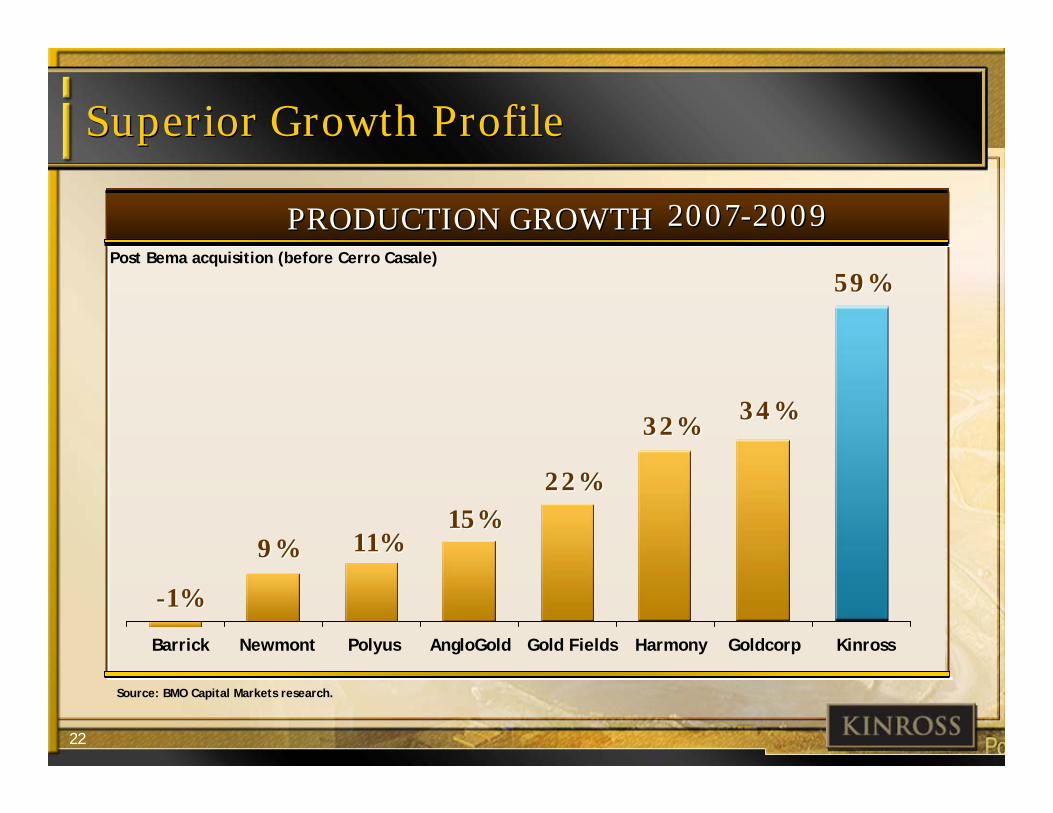
Superior Growth ProfileSuperior Growth Profile
-1%-1%
9%9% 11%11%15%15%
22%22%
32%32% 34%34%
59%59%
Source: BMO Capital Markets research.
HarmonyGold Fields KinrossNewmont AngloGoldBarrick Polyus Goldcorp
2007-20092007-2009PRODUCTION GROWTHPRODUCTION GROWTHPost Bema acquisition (before Cerro Casale)
23
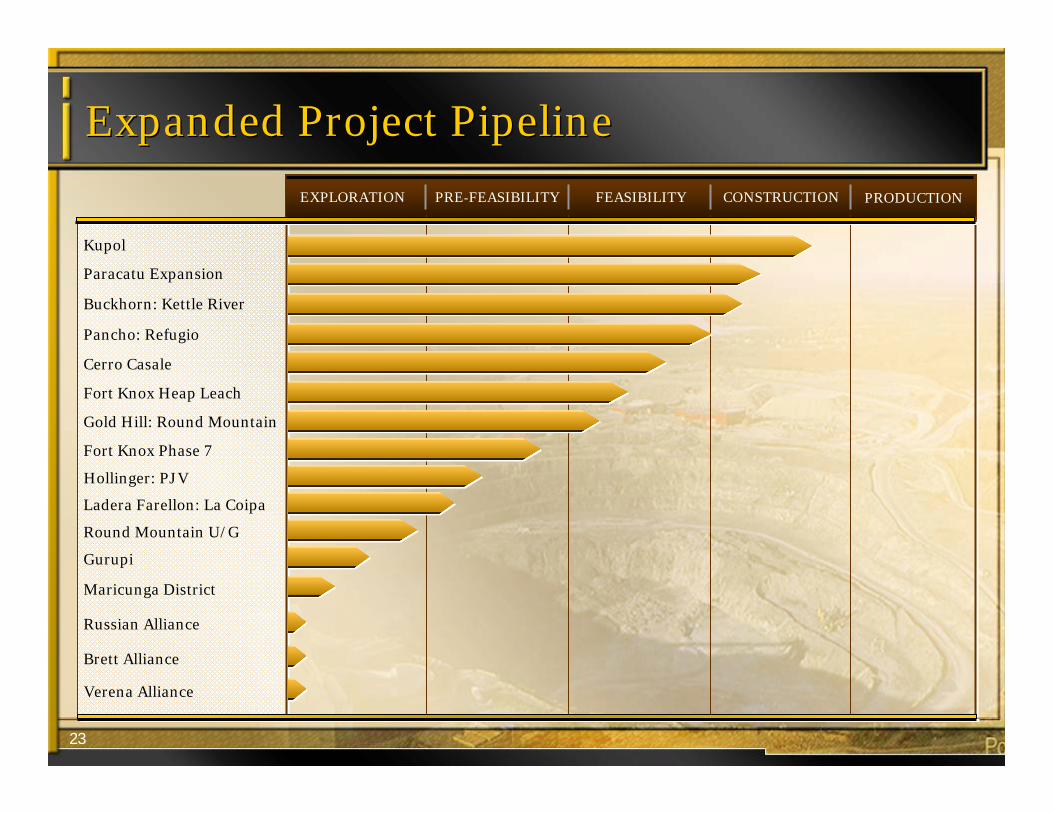
Expanded Project PipelineExpanded Project Pipeline
EXPLORATION PRE-FEASIBILITY FEASIBILITY CONSTRUCTION PRODUCTION
Kupol
Paracatu Expansion
Buckhorn: Kettle River
Cerro Casale
Pancho: Refugio
Fort Knox Heap Leach
Gold Hill: Round Mountain
Fort Knox Phase 7
Ladera Farellon: La Coipa
Round Mountain U/G
Gurupi
Maricunga District
Russian Alliance
Brett Alliance
Hollinger: PJV
Verena Alliance
24
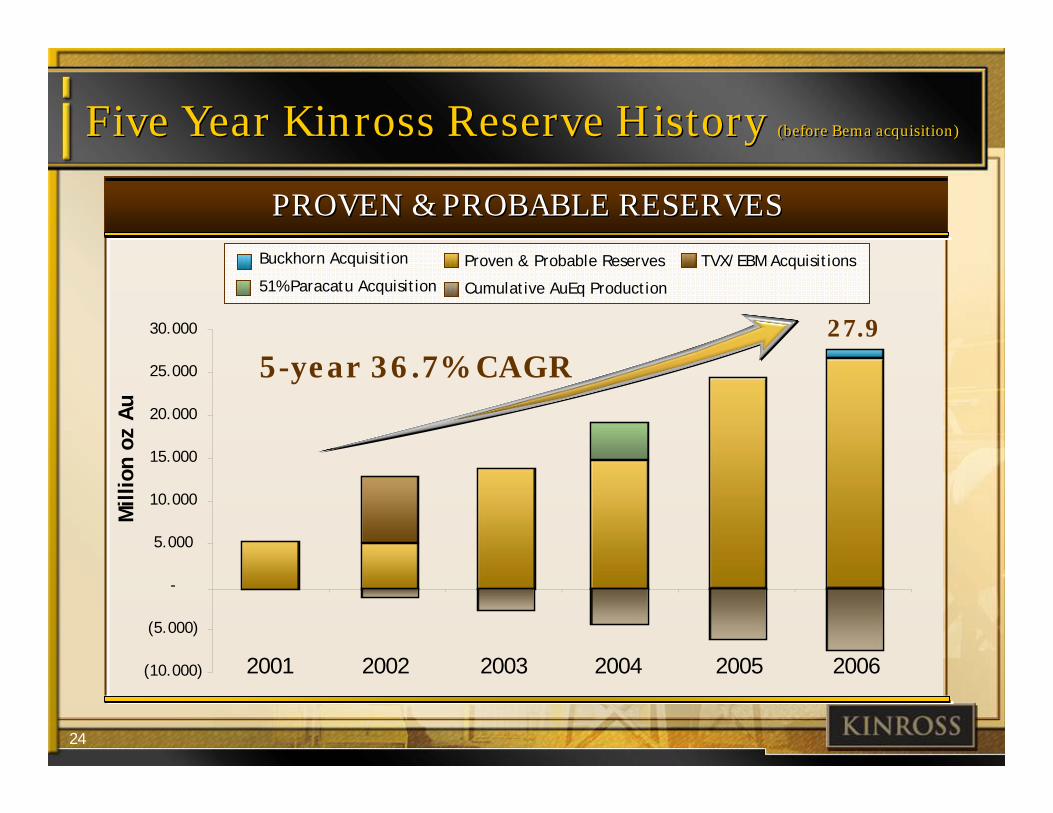
Five Year Kinross Reserve History (before Bema acquisition)Five Year Kinross Reserve History (before Bema acquisition)
PROVEN & PROBABLE RESERVESPROVEN & PROBABLE RESERVES
200620052004200320022001(10.000)
(5.000)
-
5.000
10.000
15.000
20.000
25.000
30.000
Mill
ion
oz A
u
Buckhorn Acquisition
51% Paracatu Acquisition
TVX/EBM AcquisitionsProven & Probable Reserves
Cumulative AuEq Production
5-year 36.7% CAGR27.9

25
Attractively Priced ReservesAttractively Priced Reserves
Does not include silver or copper reserves.As at close of business February 23, 2007
MARKET CAP PER OUNCE OF RESERVESMARKET CAP PER OUNCE OF RESERVES
Harmony Kinross + Bema
NewmontAngloGold Barrick GoldcorpGold Fields Polyus
$10$10
$130$130$177$177 $186$186 $198$198 $221$221 $229$229
$491$491
26
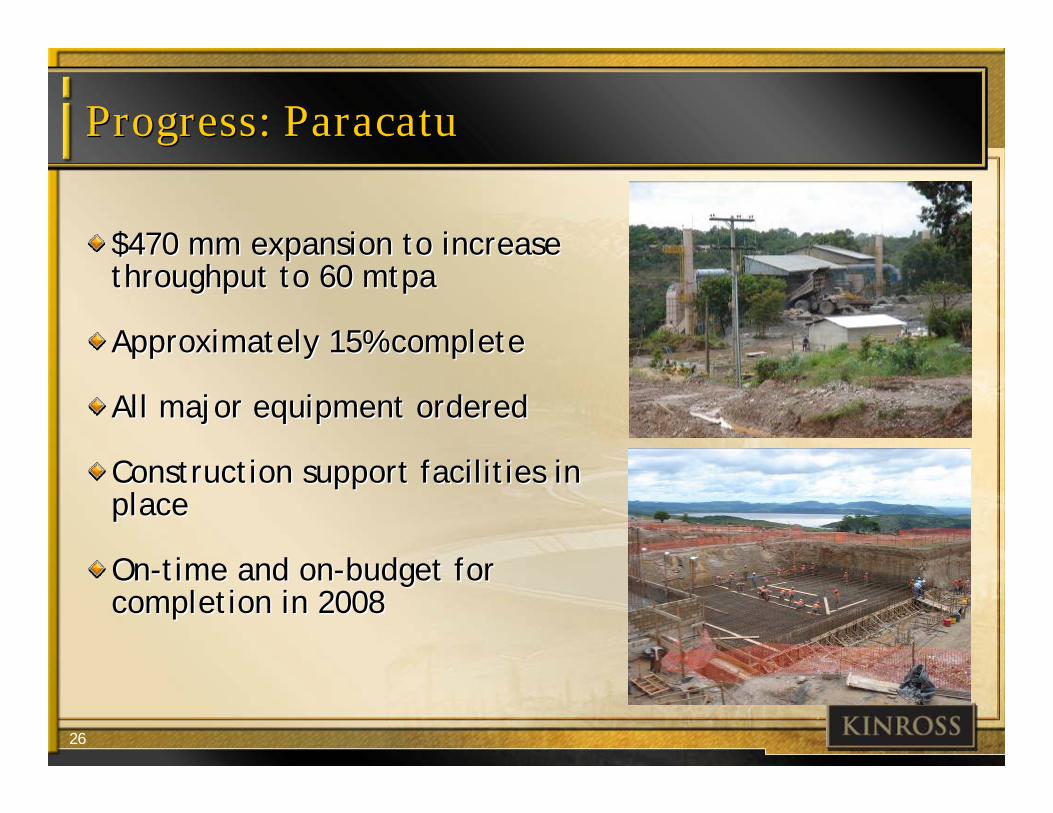
Progress: ParacatuProgress: Paracatu
$470 mm expansion to increase throughput to 60 mtpa
Approximately 15% complete
All major equipment ordered
Construction support facilities in place
On-time and on-budget for completion in 2008
$470 mm expansion to increase throughput to 60 mtpa
Approximately 15% complete
All major equipment ordered
Construction support facilities in place
On-time and on-budget for completion in 2008
27
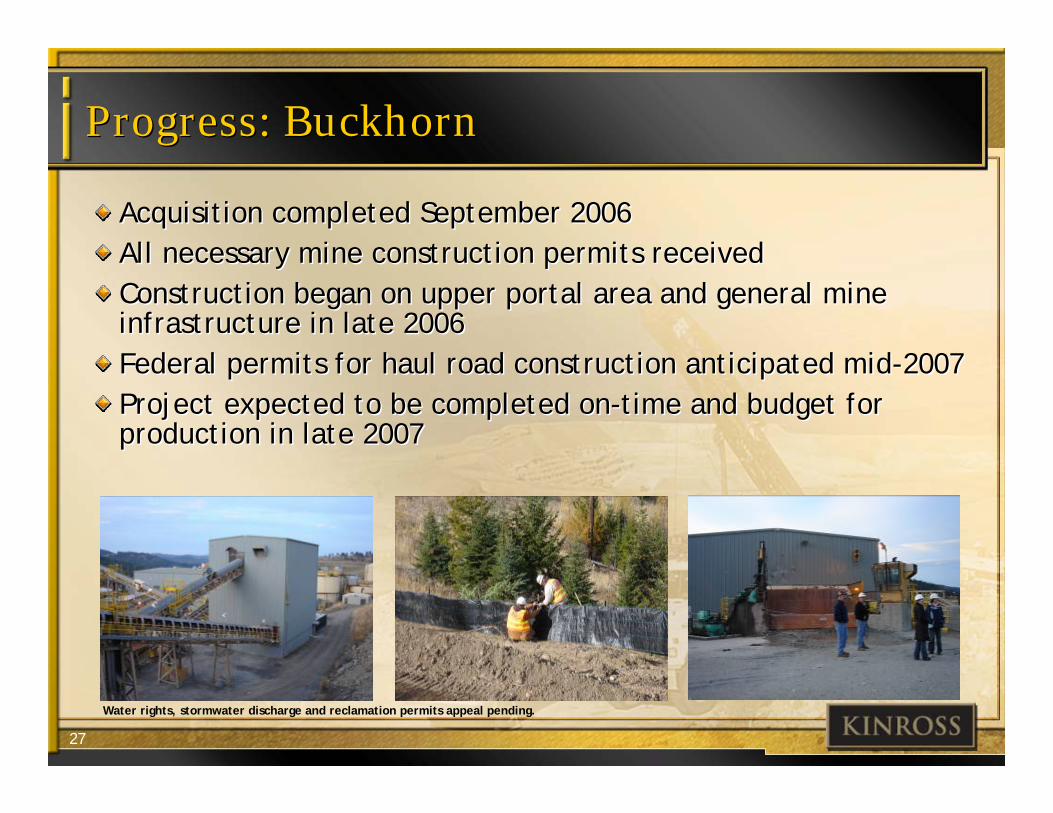
Progress: Buckhorn Progress: Buckhorn
Water rights, stormwater discharge and reclamation permits appeal pending.
Acquisition completed September 2006 All necessary mine construction permits receivedConstruction began on upper portal area and general mine infrastructure in late 2006Federal permits for haul road construction anticipated mid-2007Project expected to be completed on-time and budget for production in late 2007
Acquisition completed September 2006 All necessary mine construction permits receivedConstruction began on upper portal area and general mine infrastructure in late 2006Federal permits for haul road construction anticipated mid-2007Project expected to be completed on-time and budget for production in late 2007
28
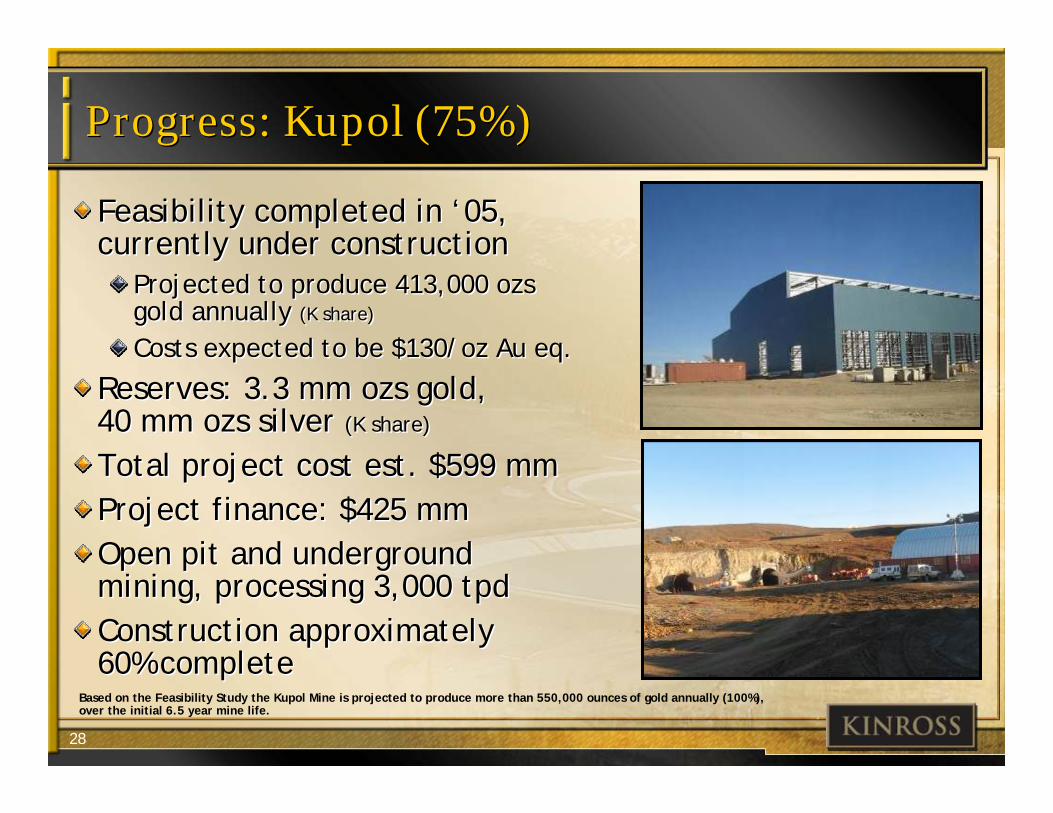
Progress: Kupol (75%)Progress: Kupol (75%)
Feasibility completed in ‘05, currently under construction
Projected to produce 413,000 ozsgold annually (K share)
Costs expected to be $130/oz Au eq.
Reserves: 3.3 mm ozs gold, 40 mm ozs silver (K share)
Total project cost est. $599 mmProject finance: $425 mmOpen pit and underground mining, processing 3,000 tpdConstruction approximately 60% complete
Based on the Feasibility Study the Kupol Mine is projected to produce more than 550,000 ounces of gold annually (100%), over the initial 6.5 year mine life.

29
Declining Cash CostsDeclining Cash Costs
2009E PRODUCTION(Ounces)
2009E PRODUCTION(Ounces)
2009E COST(US$/oz Au eq.)2009E COST(US$/oz Au eq.)
Kupol Approx. $130
Paracatuw/Expansion
Kettle River
Total
Approx. $230
Approx. $200
Approx. $200
Approx. 413,000(1)
Approx. 557,000(2)
Approx. 200,000
Approx. 1,170,000
MINEMINE
(1) Based on the Feasibility Study the Kupol Mine is projected to produce more than 550,000 ounces of gold annually (100%), over the initial 6.5 years.(2) Paracatu is expected to produce on average approx. 557,000 annually over the first five years once the expansion is completed.

30
Kinross OutperformsKinross Outperforms
Major North American Gold Producers include: Barrick and NewmontAll shares prices are based on the February 26, 2007 closing prices on the New York Stock Exchange
0.80
1.00
1.20
1.40
1.60
Feb-
06
Mar
-06
Apr
-06
May
-06
Jun-
06
Jul-
06
Aug
-06
Sep-
06
Oct
-06
Nov
-06
Dec
-06
Jan-
07
Feb-
07
Rela
tive
Per
form
ance
Major North American Gold Producers (Average) Kinross Gold Price
-4%-4%
+22%+22%
+47%+47%

Delivering DisciplinedDelivering Disciplined
G R O W T HG R O W T H
BMO Nesbitt Burns -Global Resources Conference
February 27, 2007
BMO Nesbitt Burns -Global Resources Conference
February 27, 2007
32
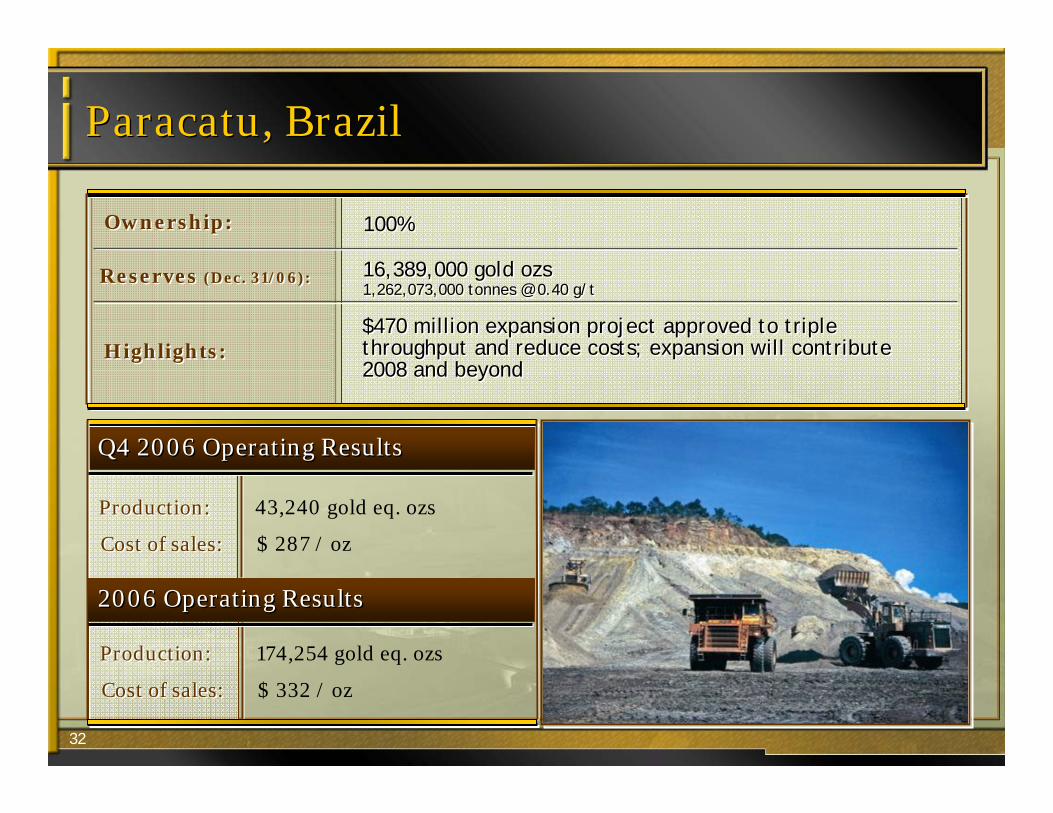
Paracatu, BrazilParacatu, Brazil
100% 100% Ownership:Ownership:
16,389,000 gold ozs1,262,073,000 tonnes @ 0.40 g/t16,389,000 gold ozs1,262,073,000 tonnes @ 0.40 g/t
$470 million expansion project approved to triple throughput and reduce costs; expansion will contribute 2008 and beyond
$470 million expansion project approved to triple throughput and reduce costs; expansion will contribute 2008 and beyond
Highlights:Highlights:
Q4 2006 Operating ResultsQ4 2006 Operating Results
Production:Production: 43,240 gold eq. ozs
2006 Operating Results2006 Operating Results
Production:Production: 174,254 gold eq. ozs
Cost of sales:Cost of sales: $ 287 / oz
Cost of sales:Cost of sales: $ 332 / oz
Reserves (Dec. 31/06):Reserves (Dec. 31/06):
33
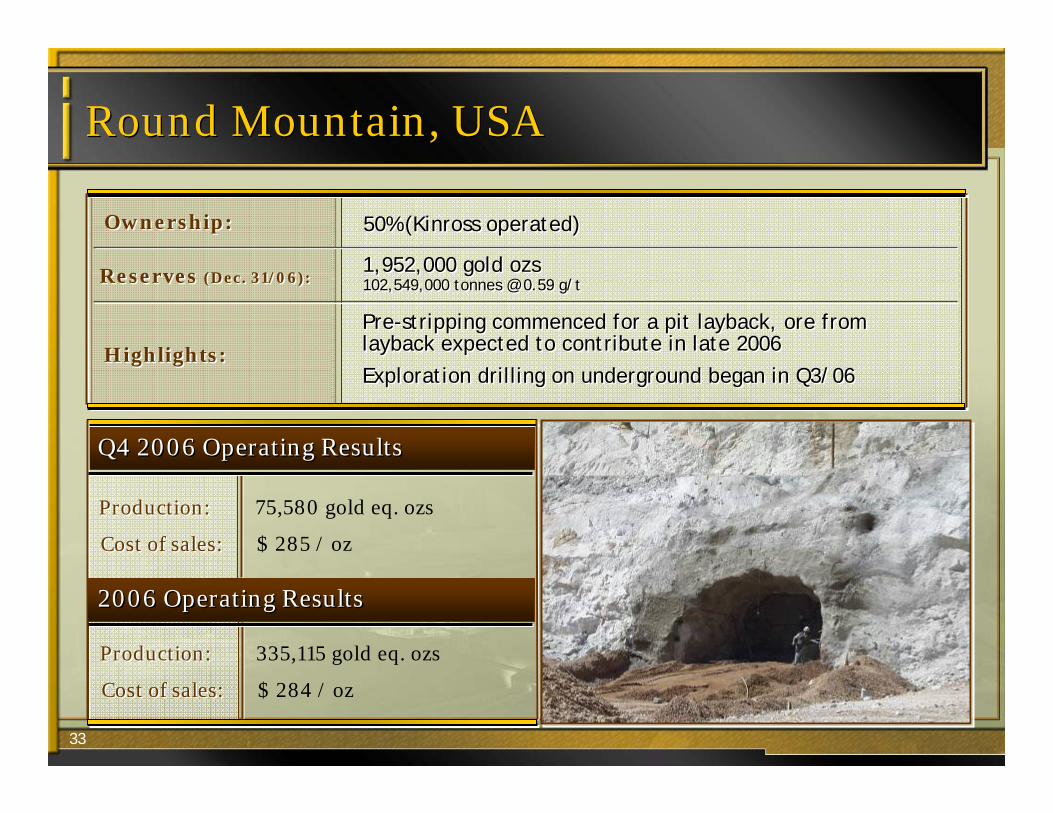
Round Mountain, USARound Mountain, USA
50% (Kinross operated) 50% (Kinross operated) Ownership:Ownership:
1,952,000 gold ozs102,549,000 tonnes @ 0.59 g/t1,952,000 gold ozs102,549,000 tonnes @ 0.59 g/t
Pre-stripping commenced for a pit layback, ore from layback expected to contribute in late 2006
Exploration drilling on underground began in Q3/06
Pre-stripping commenced for a pit layback, ore from layback expected to contribute in late 2006
Exploration drilling on underground began in Q3/06Highlights:Highlights:
Q4 2006 Operating ResultsQ4 2006 Operating Results
Production:Production: 75,580 gold eq. ozs
2006 Operating Results2006 Operating Results
Production:Production: 335,115 gold eq. ozs
Cost of sales:Cost of sales: $ 285 / oz
Cost of sales:Cost of sales: $ 284 / oz
Reserves (Dec. 31/06):Reserves (Dec. 31/06):

34
Refugio, ChileRefugio, Chile
50% (Kinross operated) 50% (Kinross operated) Ownership:Ownership:
2,720,000 gold ozs111,325,000 tonnes @ 0.76 g/t2,720,000 gold ozs111,325,000 tonnes @ 0.76 g/t
Restart is complete, producing as plannedDrilling commenced on nearby Pancho depositRestart is complete, producing as plannedDrilling commenced on nearby Pancho depositHighlights:Highlights:
Q4 2006 Operating ResultsQ4 2006 Operating Results
Production:Production: 28,060 gold eq. ozs
2006 Operating Results2006 Operating Results
Production:Production: 116,868 gold eq. ozs
Cost of sales:Cost of sales: $ 325 / oz
Cost of sales:Cost of sales: $ 341 / oz
Reserves (Dec. 31/06):Reserves (Dec. 31/06):
35
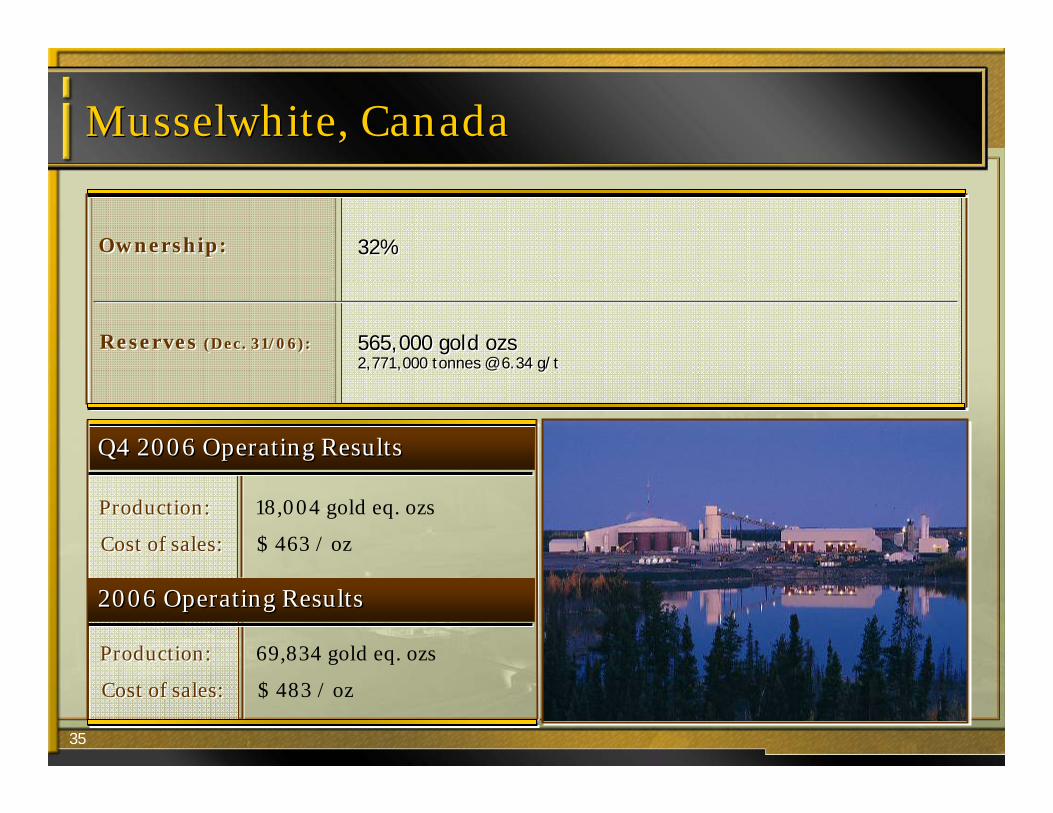
Musselwhite, CanadaMusselwhite, Canada
32% 32% Ownership:Ownership:
565,000 gold ozs2,771,000 tonnes @ 6.34 g/t565,000 gold ozs2,771,000 tonnes @ 6.34 g/t
Q4 2006 Operating ResultsQ4 2006 Operating Results
Production:Production: 18,004 gold eq. ozs
2006 Operating Results2006 Operating Results
Production:Production: 69,834 gold eq. ozs
Cost of sales:Cost of sales: $ 463 / oz
Cost of sales:Cost of sales: $ 483 / oz
Reserves (Dec. 31/06):Reserves (Dec. 31/06):
36
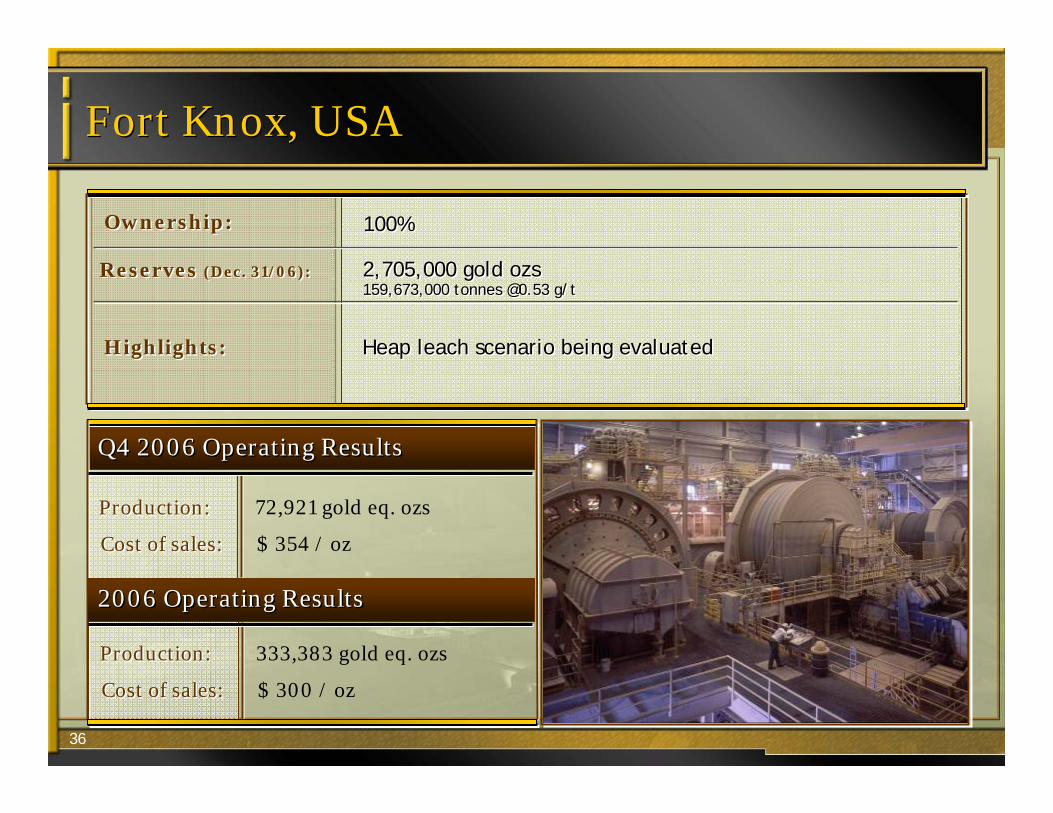
Fort Knox, USAFort Knox, USA
100% 100% Ownership:Ownership:
2,705,000 gold ozs159,673,000 tonnes @0.53 g/t2,705,000 gold ozs159,673,000 tonnes @0.53 g/t
Heap leach scenario being evaluatedHeap leach scenario being evaluatedHighlights:Highlights:
Q4 2006 Operating ResultsQ4 2006 Operating Results
Production:Production: 72,921 gold eq. ozs
2006 Operating Results2006 Operating Results
Production:Production: 333,383 gold eq. ozs
Cost of sales:Cost of sales: $ 354 / oz
Cost of sales:Cost of sales: $ 300 / oz
Reserves (Dec. 31/06):Reserves (Dec. 31/06):

37
Porcupine JV, CanadaPorcupine JV, Canada
49% 49% Ownership:Ownership:
1,709,000 gold ozs30,169,000 tonnes @ 1.76 g/t1,709,000 gold ozs30,169,000 tonnes @ 1.76 g/t
Pamour pit now contributing to productionPamour pit now contributing to productionHighlights:Highlights:
Q4 2006 Operating ResultsQ4 2006 Operating Results
Production:Production: 44,021 gold eq. ozs
2006 Operating Results2006 Operating Results
Production:Production: 156,735 gold eq. ozs
Cost of sales:Cost of sales: $ 351 / oz
Cost of sales:Cost of sales: $ 372 / oz
Reserves (Dec. 31/06):Reserves (Dec. 31/06):
38
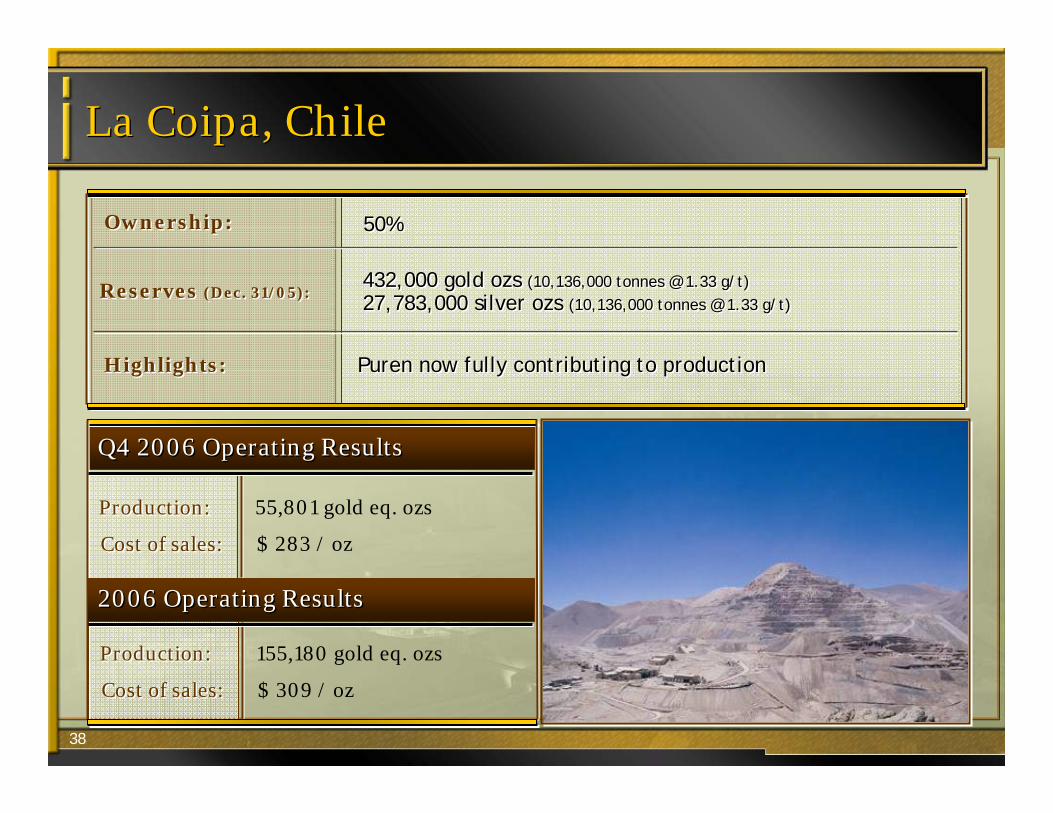
La Coipa, ChileLa Coipa, Chile
50% 50% Ownership:Ownership:
432,000 gold ozs (10,136,000 tonnes @ 1.33 g/t)27,783,000 silver ozs (10,136,000 tonnes @ 1.33 g/t)
432,000 gold ozs (10,136,000 tonnes @ 1.33 g/t)27,783,000 silver ozs (10,136,000 tonnes @ 1.33 g/t)
Puren now fully contributing to productionPuren now fully contributing to productionHighlights:Highlights:
Q4 2006 Operating ResultsQ4 2006 Operating Results
Production:Production: 55,801 gold eq. ozs
2006 Operating Results2006 Operating Results
Production:Production: 155,180 gold eq. ozs
Cost of sales:Cost of sales: $ 283 / oz
Cost of sales:Cost of sales: $ 309 / oz
Reserves (Dec. 31/05):Reserves (Dec. 31/05):

39
Crixas, BrazilCrixas, Brazil
50% 50% Ownership:Ownership:
433,000 gold ozs2,652,000 tonnes @ 5.08 g/t433,000 gold ozs2,652,000 tonnes @ 5.08 g/t
Q4 2006 Operating ResultsQ4 2006 Operating Results
Production:Production: 24,401 gold ozs
2006 Operating Results2006 Operating Results
Production:Production: 97,009 gold ozs
Cost of sales:Cost of sales: $ 183 / oz
Cost of sales:Cost of sales: $ 186 / oz
Reserves (Dec. 31/06):Reserves (Dec. 31/06):
40
Kettle River, USAKettle River, USA
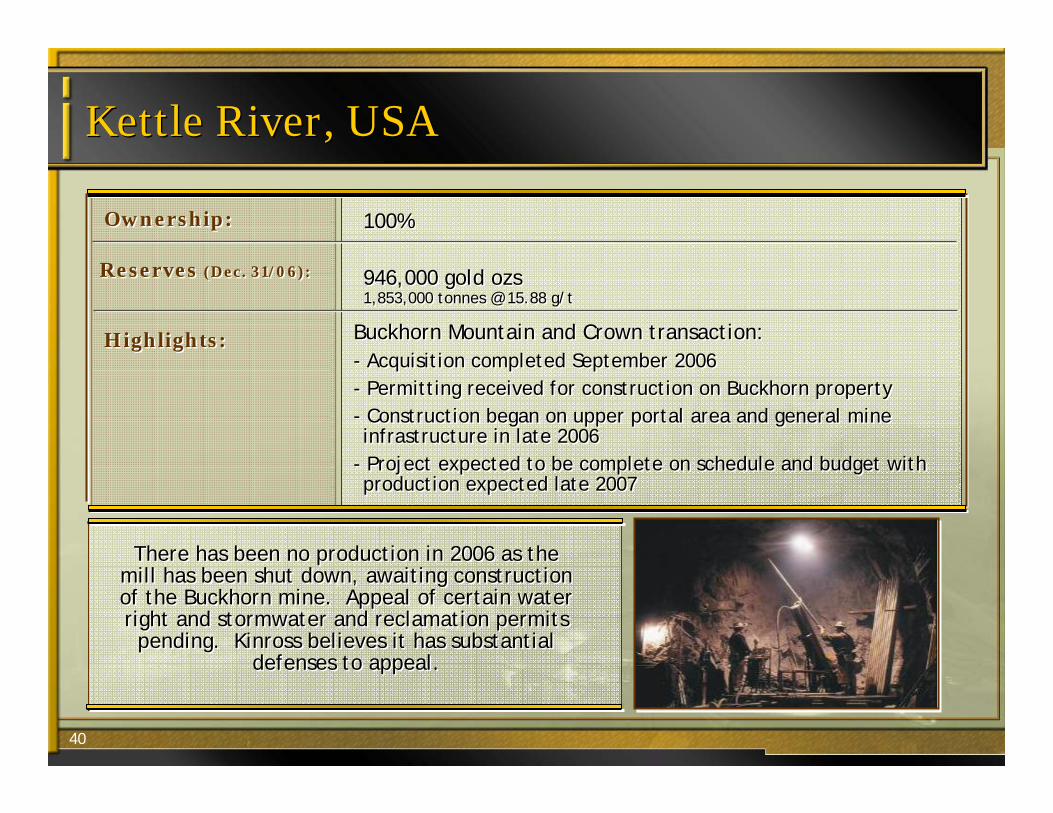
100%100%Ownership:Ownership:
Buckhorn Mountain and Crown transaction:- Acquisition completed September 2006- Permitting received for construction on Buckhorn property- Construction began on upper portal area and general mine infrastructure in late 2006
- Project expected to be complete on schedule and budget with production expected late 2007
Highlights:Highlights:
There has been no production in 2006 as the mill has been shut down, awaiting construction of the Buckhorn mine. Appeal of certain water right and stormwater and reclamation permits
pending. Kinross believes it has substantial defenses to appeal.
There has been no production in 2006 as the mill has been shut down, awaiting construction of the Buckhorn mine. Appeal of certain water right and stormwater and reclamation permits
pending. Kinross believes it has substantial defenses to appeal.
946,000 gold ozs1,853,000 tonnes @ 15.88 g/t946,000 gold ozs1,853,000 tonnes @ 15.88 g/t
Reserves (Dec. 31/06):Reserves (Dec. 31/06):

41
Environmental ResponsibilityEnvironmental Responsibility
A W A R D SA W A R D S
DELAMAR MINE DELAMAR MINE
Received the Top Quality Environmental 2006 award from the
Parliamentary Association of Brazil
Received the Top Quality Environmental 2006 award from the
Parliamentary Association of Brazil
PARACATUPARACATU
Received the Idaho Interagency Award for Excellence in
Reclamation
Received the Idaho Interagency Award for Excellence in
Reclamation
The Northwest Mining Association
Excellence in Reclamation Award
The Northwest Mining Association
Excellence in Reclamation Award
HARD ROCK MINESHARD ROCK MINES

42
Health and SafetyHealth and Safety
MARICUNGAMARICUNGA
Achieved Excellent distinction from
Mutual de SeguridadCompetitive Company
certification
Achieved Excellent distinction from
Mutual de SeguridadCompetitive Company
certification
PARACATUPARACATU
Brazilian Safety Agency Silver Award for Health and Safety
Management
Brazilian Safety Agency Silver Award for Health and Safety
Management
KETTLE RIVER KETTLE RIVER
Awarded the Sentinel of Safety in the Large Underground Metal
Category
Awarded the Sentinel of Safety in the Large Underground Metal
Category
ROUND MOUNTAIN ROUND MOUNTAIN
Awarded Best Safety Performance for a
Large Open Pit Metal Mine, by the Nevada Mining Association
Awarded Best Safety Performance for a
Large Open Pit Metal Mine, by the Nevada Mining Association
Placed first in the Elko Mine Rescue
Olympiad – Gases and Hazardous Material
competitions
Placed first in the Elko Mine Rescue
Olympiad – Gases and Hazardous Material
competitions
ROUND MOUNTAIN ROUND MOUNTAIN
A W A R D SA W A R D S
43
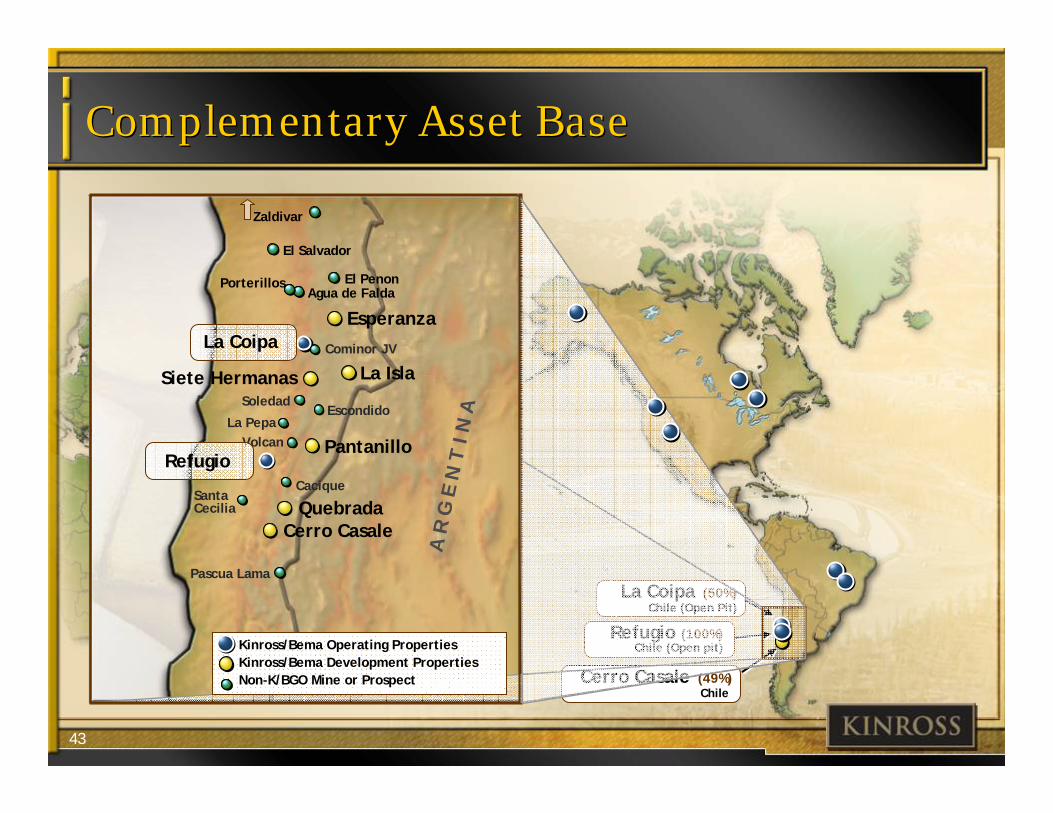
Refugio (100%)Chile (Open pit)
Cerro Casale (49%)Chile
La Coipa (50%)Chile (Open Pit)
Complementary Asset BaseComplementary Asset Base
Esperanza
Quebrada
Pantanillo
La Isla
Kinross/Bema Operating PropertiesKinross/Bema Development PropertiesNon-K/BGO Mine or Prospect
EscondidoLa Pepa
Soledad
Volcan
Santa Cecilia
Cacique
A R
G E
N T
I N
A
La Coipa
Refugio
Cerro Casale
El Penon
Pascua Lama
Zaldivar
Cominor JV
Siete Hermanas
Agua de FaldaPorterillos
El Salvador