02-18-14 GDBPR PDF (1)
91
The Commonwealth of Puerto Rico Update on Fiscal and Economic Progress Investor Webcast – February 2014
-
Upload
natalalbelo -
Category
Documents
-
view
25 -
download
1
Transcript of 02-18-14 GDBPR PDF (1)

The Commonwealth of Puerto Rico
Update on Fiscal and Economic Progress Investor Webcast – February 2014
Forward-Looking Statements
2
The information included in this presentation contains certain “forward-looking” statements. These forward-looking statements
may relate to the fiscal and economic condition, economic performance, plans and objectives of the Commonwealth of Puerto
Rico (the “Commonwealth”) and/or its agencies or instrumentalities. All statements contained herein that are not clearly
historical in nature are forward-looking, and the words “anticipates,” “believes,” “continues,” “expects,” “estimates,”
“intends,” “aims,” “projects,” and similar expressions, and future or conditional verbs such as “will,” “would,” “should,”
“could,” “might,” “can,” “may,” or similar expressions, are generally intended to identify forward-looking statements.
These statements are not guarantees of future performance and involve certain risks, uncertainties, estimates, and assumptions
by the Commonwealth and/or its agencies or instrumentalities that are difficult to predict. The economic and financial
condition of the Commonwealth and its agencies or instrumentalities is affected by various financial, social, economic,
environmental, and political factors. These factors can be very complex, may vary from one fiscal year to the next, and are
frequently the result of actions taken or not taken, not only by the Commonwealth and/or its agencies or instrumentalities, but
also by entities such as the government of the United States of America or other nations that are not under the control of the
Commonwealth. Because of the uncertainty and unpredictability of these factors, their impact cannot, as a practical matter,
be included in the assumptions underlying the Commonwealth’s or its agencies or instrumentalities’ projections.
The projections set forth in this presentation were not prepared with a view toward complying with the guidelines established
by the American Institute of Certified Public Accountants with respect to prospective financial information, but, in the view of
the officers of the Commonwealth or its agencies or instrumentalities responsible for the preparation of such information, were
prepared on a reasonable basis, reflect the best currently available estimates and judgments, and present, to the best of such
officers’ knowledge and belief, the expected course of action and the expected future financial performance of the
Commonwealth and/or its agencies or instrumentalities, as applicable. However, this information is not fact and should not be
relied upon as being necessarily indicative of future results, and readers of this presentation are cautioned not to place undue
reliance on the prospective financial information. Neither the Commonwealth’s nor any agency or instrumentality’s
independent auditors, nor any other independent auditors, have compiled, examined, or performed any procedures with
respect to the prospective financial information contained herein, nor have they expressed any opinion or any other form of
assurance on such information or its achievability and disclaim any association with the prospective financial
information. Neither the Commonwealth’s nor any agency or instrumentality’s independent auditors, nor any other
independent auditors, have been consulted in connection with the preparation of the prospective financial information set forth
in this presentation, which is solely the product of the Commonwealth and/or its agencies or instrumentalities, and the
independent auditors assume no responsibility for its content.

Not an Offering of Securities
3
This webcast presentation does not constitute, nor does it form part of, an offer to sell or purchase, or the
solicitation of an offer to sell or purchase, any securities or an offer or recommendation to enter into any
transaction. This presentation has been prepared for informational purposes only. Any offer or sale of any security
may only be made pursuant to the relevant offering documents and binding transaction document and is subject to
the detailed provisions therein, including risk considerations. Prospective purchasers should obtain a copy of the
relevant offering materials prior to making any investment decisions.
Commonwealth Report
This webcast presentation should be read in conjunction with the information contained in the Commonwealth of
Puerto Rico Quarterly Report, dated as of February 18, 2014 (the “Quarterly Report”), which is intended to update
certain information included in the Commonwealth’s Financial Information and Operating Data Report dated October
18, 2013. The Quarterly Report contains a summary of the principal fiscal and economic challenges faced by the
Commonwealth. In case of any conflict between this presentation and the Quarterly Report, the Quarterly Report
shall prevail.

Agenda
Recent Accomplishments 1
Liquidity and Plan of Finance 2
Revenue and Expense Update 3
Comprehensive TRS Reform and Other Legislation 4
Economic Development 5
Concluding Remarks 6

Challenges faced… …Puerto Rico has taken action:
Funding of Teacher’s
Pension System
• Enacted Act 160-2013 delivering on the promise of enacting meaningful and
comprehensive pension reform to the Teachers Retirement System (“TRS”).
• TRS reform projected to eliminate approximately $560 million of future annual pay-as-
you-go contributions and ensures cash flow sufficiency to pay pension obligations as
they become due.
Meeting Revenue
and Spending Targets
• For the first seven months of fiscal year 2014 general fund revenues are $39 million
above budgeted estimates
• For fiscal year 2014 revised total revenue projection continues to be in line with budget
and expenses are expected to be reduced by $170 million when compared to the
original budget.
• The Governor has pledged to submit a balanced budget for fiscal year 2015 to the
legislature, improving the fiscal year 2015 budget outlook by approximately $400
million.
Financing Options
and GDB Liquidity
• PR Legislature passed key new measures to:
i. Strengthen COFINA’s financial capacity: raised the state portion of SUT to 6.0%
from 5.5%, increasing by approximately 9% revenues available for COFINA debt
service.
ii. Enhance financing options for municipalities: created a new financing entity
similar to COFINA to issue debt backed by the municipal SUT, which should allow
(“COFIM”) municipalities to refinance outstanding municipal SUT debt with GDB.
iii. Improve GDB Liquidity: granted GDB additional oversight authority, including the
power to require the transfer of certain public funds to GDB.
The Government of Puerto Rico has worked aggressively to strengthen
Puerto Rico’s fiscal condition
2
3
1
5

Challenges faced…
…Puerto Rico has taken action:
Public Corporations’
Dependence on the
Commonwealth and
GDB
• Newly–enacted legislation limiting GDB’s ability to provide deficit financing is expected
to result in additional fiscal discipline in public corporations.
o Limitations on new loans expected to help GDB preserve its liquidity
o Exceptions in case of possible debt service non-payment or emergencies that may
impact level of service (subject to certain limits)
• Proposed new Mass Transit Authority* would merge mass transit assets currently held by
Highway and Transportation Authority (HTA), including “Tren Urbano”, Metropolitan Bus
Authority and Maritime Transportation Authority into new entity
o Expected to result in operational and budgetary efficiencies and help lead HTA to
financial self-sufficiency, accelerating its return to the capital markets.
Economic
Development
Prospects
• Commonwealth continues to execute short-term, aggressive outreach plan with clear
and achievable goals and benchmarks that we are confident will result in thousands of
new jobs and reposition Puerto Rico as a competitive business and investment
destination.
• Key wins include Seabourne, Crowley, Puma Energy, Lilly, Sazerac, as well as
noteworthy projects in agriculture. Key economic markers reveal improved month to
month conditions.
• Our focus on job creation has already led to commitments expected to generate
approximately 25,000 direct and indirect jobs.
6
The Government of Puerto Rico has worked aggressively to strengthen
Puerto Rico’s fiscal condition (cont’d)
4
5
*Legislation creating new MTA currently in public hearing process. Expected to pass Legislature shortly.

Agenda
Recent Accomplishments 1
Liquidity and Plan of Finance 2
Revenue and Expense Update 3
Comprehensive TRS Reform and Other Legislation 4
Economic Development 5
Concluding Remarks 6

Investment Portfolio Composition* ($ in millions, mark-to-market)
8
December 31, 2013
Money Market
26%
US Agencies
and Treasuries
45%
MBS 25%
Other 4%
• High-grade investment portfolio (96% > A-)
• Portfolio average life is 2.64 years
Market Value: $2.71 B
GDB’s stable, liquid investment portfolio continues to be a primary
source of liquidity for GDB and the Commonwealth
* GDB liquidity has served during last 120 days to finance approximately $923 million in short term liabilities of the Commonwealth and its instrumentalities. Preliminary
financial information is unaudited as of September 30, 2013 and December 31, 2013, and subject to change.
September 30, 2013
Money Market
13%
US Agencies
and Treasuries
55%
MBS 28%
Other 4%
• High-grade investment portfolio (96% > A-)
• Portfolio average life is 3.48 years
Market Value: $2.77 B
During the past months, GDB has sought to shorten the average life of its investment portfolio in
order to increase financial flexibility.

* Unaudited and preliminary financial information as of December 31, 2013.
Cost and Average Life of Funding Sources*
Public sector deposits have increased at GDB by more than $500
million in Q2 of Fiscal Year 2014
9
in $ millions
Deposits $4,733 (48%),
Avg. Life: 0.39 Y
Bonds & Notes
$5,043 (51%),
Avg. Life: 4.92 Y
Repo $1,236 (11%),
Avg. Life: 0.13 Y
Average Cost Average Life
Liabilities 2.52% 2.43 Y
Deposits Detail (in $ millions) *
Average cost of funding has decreased by 20 basis
points since September 30, 2013.
GDB Notes outstanding have remained stable. GDB
issued $110 million in notes in December 2013.
Approximately $70 million in GDB notes were paid off
during the same month.
Outstanding repos have increased from $437 million to
$1.24 billion during period.
Public sector CDs experienced a net increase of
approximately $500 million from September 30, 2013
to December 31, 2013.
Total deposits have increased by $77 million during
period.
Private sector CDs have decreased as such CDs have
matured.
GDB has identified approximately $450 million in public
deposits that GDB’s management currently expects to
capture during the remainder of FY2014. According to
OCIF, public deposits at private financial institutions
amounted to approximately $2.2 billion as of December
31, 2012.
$2,195 $2,305
$1,853 $1,335
$522 $521
$159 $493
Dec 31, 2013 Sep 30, 2013
CD (Private) Escrow Deposits (Public) CD (Public) Demand Deposits (Public)
$4,656 $4,733

$320
$481
$876
$269 $277
$848
$432 $434
$143 $47
$541
$248 $127
$-
$250
$500
$750
$1,000
2014 2015 2016 2017 2018 2019 2020 2021 2022 2023 2024 2026 2027
Notes Outstanding – Total of $5 billion
10
* As of December 30, 2013. Outstanding amount distributed as of fiscal year.
FY
Staggered maturities of our Senior Notes' program reduce roll-over
risk
in $ millions
In December, GDB issued $110 million in GDB notes to the Puerto Rico State Insurance Fund.

MTM (Net of Collateral
Posted) on Swaps
Subject to ATEs (2)
GO $129.8M
Non-GO $61.8M
11
Certain short-term obligations of the Commonwealth and its instrumentalities
may be accelerated due to the recent downgrades
Downgrades also give option to swap counterparties to request additional collateral or
terminate. To date, no counterparty has exercised acceleration or termination rights.
(1) BAN counterparty has waived certain acceleration rights as a result of downgrade. BAN may still accelerate upon occurrence of certain events.
(2) Swap obligations may be terminated at current mark-to-market (net of collateral posted), plus cost.
(3) $188.7 million may be accelerated only if liquidity provider (i) causes mandatory tender of bonds and (ii) cancels bond insurance policy.
(4) Negotiations to renew and/or waive accelerations provisions in PREPA working capital lines at advanced stage.
GO Financing Plan expects to refinance approximately $1.1 billion of these short-term liabilities
Note: Shaded boxes denote obligations that are subject to acceleration within seven to thirty days.
59.8
401.3
103.7
526.0
135.0
50.0
50.0 50.0
$200.0
333.0
$150.0
5/31/14 6/30/14 9/30/14 12/31/14 3/31/15 6/30/15
Month Ended Quarter Ended
GO Bond Remarketing PREPA Working Capital Lines PRHTA Bond Anticipation Note
PRHTA Variable Rate Debt Obligation COFINA BAN PRASA Credit Agreement
$859.0
1
3
4
4
$363.5
$185.0 $200.0
($ in millions)

Puerto Rico G.O. Series 2014A Plan of Finance
Potential Financing Components Up to
1. Restructuring of FY2013 G.O. Debt Service $600M
2. Restructuring of FY2014 G.O. Debt Service $575M
3. Redemption of COFINA BANs $333M
4. Refunding of G.O. Floating Rate Bonds and Termination of Related
Swaps $540M
5. FY2014 Deficit Financing $245M
6. FY2012 and FY2014 New Money GOs $390M
7. Restructuring of FY2013 PBA Debt Service $175M
8. Appropriation Debt at GDB TBD
9. Capitalized Interest and Issuance Expenses TBD
The principal purpose of the GO Plan of Finance is to repay outstanding line of credits with GDB and
refinance other outstanding debt. Additional transaction details will be announced shortly.
12

Agenda
Recent Accomplishments 1
Liquidity and Plan of Finance 2
Revenue and Expense Update 3
Comprehensive TRS Reform and Other Legislation 4
Economic Development 5
Concluding Remarks 6

$2,864 $2,724
$1,801
$2,375
$1,374
$650
839
170
$2,213
$820
$0
FY 2009 FY 2010 FY 2011 FY 2012 FY 2013e FY 2014e FY 2015e
Puerto Rico continues on track to achieve a significant reduction in,
and eliminate, the General Fund deficit
Historical and Projected Deficita (in $ millions)
(a) Source for Fiscal Years 2009-2012: Commonwealth of Puerto Rico – Financial Information and Operating Data Report, dated October 18, 2013. Deficits for fiscal years 2013
and 2014 are preliminary and subject to change. Results presented for FY 2009 and FY 2010 exclude approximately $442 million and $50 million, respectively, of non-
recurring expenses accrued during prior fiscal years that have been previously accounted as part of total expenditures for such fiscal years.
(b) After implementation of corrective measures by the current Administration, deficit for FY 2013 was initially revised from $2.213 billion as of January 31, 2013 to $1.602
billion as of April 30, 2013, and again revised to $1.290 billion as of June 30, 2013. As of January 24, 2014, the audit process produced $84 million of additional expenses
attributable to FY2013, and based on these adjustments, the revised estimate for FY2013 is $1.374 billion.
(c) Assumes (i) deficit will be in line with budgetary projections notwithstanding that YTD revenues are above projections and expenditures are below budgeted appropriations
for the period and (ii) passage of proposed Administration bill to decrease budget appropriations for fiscal year 2014 by $170 million.
(d) Estimated, preliminary and subject to change.
(e) Assumes balanced budget.
b
b,d
14
Projected deficit
as of 1/31/14 to
be reduced by
$170MM
c
c,d
e
Projected deficit
as of 1/31/13
was reduced by
$839MM

FY2013 CAFR is on schedule as a result of Administration's measures
to ensure compliance with May 1, 2014, filing deadline
Significant risk at start of audit process: (i) Decentralized accounting system;
(ii) Large amount of component units included in the CAFR;
(iii) Change of auditors; and
(iv) Implementation of New GASB pronouncements (i.e. GASB 61).
Measures taken by Administration: (i) Assignment of additional resources from local and international audit firms to component units whose financial
statements have not been timely provided to the Commonwealth;
(ii) Execution of a memorandum of understanding between the Treasury Department, OMB and GDB for the coordination
of all financial statement-related tasks and the designation of GDB, in its role as fiscal agent of the Commonwealth,
to review and monitor the progress of certain component units;
(iii) Establishment of an Audit Oversight Committee comprised of Treasury Department and GDB personnel in order to
continuously monitor the status and progress of the audit and the Commonwealth’s financial statements; and
(iv) Taken action to speed the provision of data to Central Accounting and outside auditors.
Audit Status: (i) As of February 7, 2014, 42 of 68 (62%) component units and other fiscal independent agencies have issued their
financial statements.
(ii) 16 component units and other fiscal independent agencies are expected to issue their financial statements before
February 28, 2014, at which point approximately 85% of relevant entities will have had their financial statements
issued.
(iii) Financial statements of the remaining entities (15%) are expected to be received on or before March 31, 2014. This
would represent a significant advance over last year, when several entities (i.e. UPR, Ports Authority, PRGERS)
issued their financials after July 2013.
(iv) Speed of providing auditing data and support to auditors has increased significantly when compared to the prior
year.
15
Due to delayed audit process, the FY2012 CAFR was issued on September 16, 2013, four and a half
months after the May 1 filing date.
With FY2013 audit in an advanced stage, in contrast to FY2012, audit process to date has not
uncovered material revisions to previously reported General Fund deficit.

FY2014 Revenue Update

17
General Fund Revenues (July – December FY 2014)
Estimated July-
Dec FY2014
Revenues vs.
Estimate
($)
Revenues vs.
Estimate
(%)
Results
Tax Type FY13 FY14 Variance % Change
Individual $926 $879 ($47) -5.08% $929 ($50) -5.69%
Corporations $486 $924 $438 90.12% $816 $108 11.69%
Non-Resident Withholdings $345 $433 $88 25.51% $422 $11 2.54%
Sales and Use Tax $0 $0 $0 0.00% $26 ($26) -100.00%
Property Taxes $6 $10 $4 66.67% $0 $10 0.00%
Foreign (Act 154) $898 $901 $3 0.33% $892 $9 1.00%
Alcoholic Beverages $145 $143 ($2) -1.38% $146 ($3) -2.10%
Tobacco Products $89 $81 ($8) -8.99% $89 ($8) -9.88%
Motor Vehicles $195 $196 $1 0.51% $196 $0 -0.00%
Off-Shore Shipment Rum $134 $158 $24 17.91% $144 $14 8.86%
Others $197 $234 $37 18.78% $206 $28 11.97%
Total Results $3,421 $3,959 $538 15.73% $3,866 $93 2.35%
July-December FY 2014 revenue results are above the original
budget estimates
The Commonwealth exceeded its total revenue budget for the first six months. Certain revenue
components were either over or under budget, and Treasury has revised the estimates for individual
revenue components, while keeping the same total revenue estimate, as discussed in the following
slides.

$7
$672
$103
$42
$83
$8
$348
$53
$17
$73
$0 $200 $400 $600 $800
Assessed
Estimated tax payment
Payment with tax return
Payment without tax return
Tax withheld for services rendered
FY 2013 Results FY 2014 Original Estimates
Net Corporate income tax revenues were $408 million over July-December 2013 and $108 million over
July-December 2014 original budget estimate.
Corporate income tax revenues were substantially above the original
budget estimates for the first six months of FY 2014
18
Corporate Income Tax Revenue Breakdown*
July-Dec 2013 : $499 millions
July-Dec 2014: $907 millions
* Results mostly because estimate was based on 2010 tax data, which was the latest data available when the estimates were
prepared. These numbers are net of the reserve for reimbursement and other accounting adjustments. Gross corporate tax
revenues are estimated to be $438 million as shown on slide 17.
(in $ millions)

SUT has increased versus historical years; SUT Revenues for First Half
FY 2014 were $36 million higher than the same period in FY2013
19
July-Dec 2014 SUT Actuals vs. Budget and vs. July-Dec 2013
July-December FY 2014 SUT collections of $608 million are
(i) 6.3% above the same period of FY 2013 and (ii) 9.3% below original budget estimates.
$572
$671
$608
First Half FY 2013 Results First Half FY 2014 Budget First Half FY 2014 Results

First Half Second Half Total Original 2014 Revised vs.
Actuals Revised Revised 2014 Estimate Original
2013 Revenues $572 $591 $1,163 $1,176 ($13)
Additions for 2014
Business to Business Services $13 $28 $41 $155 ($114)
Institutional purchases 1 5 6 54 (48)
Others (e.g. enforcement, reseller’s) 22 43 65 129 (64)
Total Additional Revenues $35 $76 $111 $338 ($227)
2014 Estimate $608 $666 $1,274 $1,514 ($240)
Component Funds
Film Fund $3 $3 $0
COFINA Debt Service 644 644 0
Amnesty 13 0 13
General Fund 614 865 (251)
2014 Estimate $1,274 $1,514 ($240)
Given the results of the First Half of FY 2014, FY 2014 budget estimate was
revised for the remainder of the year, including SUT budget estimate
20
• FY2014 SUT Revenues are expected to be $240 million under budget for the year
o General Fund SUT revenues are expected to be $251 million lower than originally estimated (after
accounting for film fund and amnesty revenues)
• Primary drivers:
o Lower than expected total sales after elimination of certain business-to-business services sales tax
exemptions.
o Approved budget assumed that certain tax-exempt transactions would become taxable. However, certain of
these transactions were already being taxed, resulting in a lower than expected increase in taxable
transactions/revenues.
* FY 2014 COFINA debt service payment is $644 million, which was satisfied during January 2014. Figures may not always add to the totals due
to rounding.

FY2014 revenue estimates have been revised to reflect YTD results.
Total FY 2014 revenues are still projected to total $9.53 billion
21
$- $2,000 $4,000
Individual
Corporations
Non-Resident Withholdings
Sales and Use Tax
Property Taxes
Foreign (Act. 154)
Alcoholic Beverages, Total
Tobacco Products
Motor Vehicles
Excises on Off-Shore Shipment Rum
Lottery
Insurance Premiums
Slot Machines
Miscellaneous
Others Revised Estimate
Original Estimate
Revenues Revision for FY2014 (in $ millions)
• Increases in corporate taxes were offset by reduced estimates for sales and use tax and individual income tax
• Corporate taxes:
o Actual July-December FY 2014 corporate income tax revenue was already $108 million over the original budget estimate
o In order to address potential shortfalls, the budget excluded two FY 2014 estimate tax payments related to new
legislation that was enacted in June 2013 (approximately $250 million in total)
• Individual taxes: Estimates for individual tax revenues were lowered due to headcount reduction by government employers
• Sales tax: As explained in previous slides
FY2014 General Fund Revenue Estimates Estimate
(in $ millions) Original Revised Change
General Fund Net Revenues $9,525 $9,525 -
Components:
Individual Tax $2,088 $2,004 ($84)
Corporate Tax 2,123 2,513 390
Non-Resident Withholdings 820 820 -
Sales and Use Tax 865 614 (251)
Property Taxes 16 16
Foreign (Act. 154) 1,956 1,938 (18)
Alcoholic Beverages, Total 284 283 (1)
Tobacco Products 186 174 (12)
Motor Vehicles 432 432 -
Excises on Off-Shore Shipment Rum 222 222 -
Lottery 120 99 (21)
Insurance Premiums 72 48 (24)
Slot Machines 39 32 (7)
Miscellaneous 224 234 10
Others 94 96 2

22
YTD General Fund Revenues (July - January)
Tax Type
Actual
Year over Year
Variance Actual Estimated
FY 2014
Actual vs Estimated
FY 2013 FY 2014 ($) (%) FY 2014 FY2014 ($) (%)
Individual $1,102.7 1,054.7 (48.0) -4.4% $1,054.7 1,030.0 24.7 2.4%
Corporations 546.3 1,017.6 471.3 86.3% 1,017.6 1,003.4 14.2 1.4%
Non-Resident
Withholdings 411.2 476.4 65.2 15.9% 476.4 500.2 (23.8) -4.8%
Sales and Use Tax(1) 75.8 79.0 3.2 4.2% 79.0 76.0 3.0 3.9%
Property Taxes 7.4 11.3 3.9 52.7% 11.3 11.1 0.2 1.8%
Foreign (Act 154) 1,034.7 1,042.0 7.3 0.7% 1,042.0 1,032.4 9.6 0.9%
Alcoholic Beverages 168.4 164.6 (3.8) -2.3% 164.6 164.5 0.1 0.1%
Tobacco Products 106.6 101.4 (5.2) -4.9% 101.4 97.8 3.6 3.7%
Motor Vehicles 234.6 231.7 (2.9) -1.2% 231.7 235.6 (3.9) -1.7%
Off-Shore Shipment Rum 171.2 174.1 2.9 1.7% 174.1 174.0 0.1 0.1%
Others 227.1 272.5 45.4 20.0% 272.5 261.3 11.2 4.3%
Total YTD Revenues $4,086 $4,625.3 +539.3 +13.2% $4,625.3 $4,586.3 +39.0 +0.9%
Based on revised estimates, July-January FY 2014 revenues
continue to exceed estimates
1 Sales and Use tax revenues flow to COFINA until satisfying the Pledged Sales Tax Base Amount.
• Revenues for FY 2014 have significantly exceeded FY 2013 revenues and are above budget YTD
• Individual taxes, corporate income taxes, and foreign (Act 154) are up versus revised estimates;
and year to date revenues are nearly $40 million over revised budget estimates

FY2014 Expense Update

2,698
1,304
623
207
123
112
103
205
The Consolidated Budget for FY14 totals $29.0 billion, with
$9.77 billion appropriated to the General Fund
Consolidated Budget - $29,066M
($ in millions)
Purchased
Services
29,066
100
595
1,252
1,522
6,590
9,236
9,770
Capital ImprovementBonds
Miscellaneous
Special State Funds
Proceeds from Financing
Federal Grants
Fee Income (includesPublic Corporations)
General Fund
Consolidated TotalBudget
Subsidies
Transportation
Unclassified (Non
Distributed) Utilities
Payroll
1,663
309
332
691
895
103
448 73
Formulas
GOs & Non Govt
Debt
Pension Laws
Health
Reform
OMB Custody
Special
Appropriations
Others
GDB &
Inter
Govt.
Debt
Formulas (UPR; Judicial;
Municipalities)
Public Health Insurance
Pension Laws
Program Appropriations
GOs & Non Govt Debt
GDB & Inter Govt Debt
OMB Custody
Others
Payroll
Unclassified
(Non Distributed)
Utilities
Purchased Services
Transportation
Professional Services
Others
17%
9%
7%
5%
3%
1%
1%
3%
Special Appropriations $4,515M
28%
13%
6%
2%
($ in millions)
($ in millions)
Professional
Services
Others
1%
1%
1%
General Fund Budget - $9.77 billion
2
46% Special Appropriations %
Operating Expenses $5,255M 54% Operating Expenses %
24

The net budget increase for FY14 was largely due to fiscal
responsibility measures and not to operating cost increases
Net Year over Year Changes in the Approved General Fund Budget ($ in millions)
$292 $202
$122 $616 $121 -$49 $72
FY 2013 Debt Service Payments toPension Systems
Others Dep. Education Other OperatingExpenses
FY 2014
+$171M
Debt Service
Existing PBA
Bonds
+$14M
TRANS
Incremental
Interest Cost
+$73M
Other
(including GDB
lines of credit)
+$46M
1% Increase in
Employer
Contribution
+$140M
Additional
Payments to
PERS
+$77M
UPR Formula
+$13M
Public Health
Insurance
+$5M Other
Non-Operating
Expenses
Increases in Non-Operating Expenses
-$16M Payroll
-$3M
Operating
Expenses
-$30M
Non-
Distributed
+$32M Payroll
+$89M
Operating
Expenses
Increases in Operating
Expenses
+$37M
Incremental
Annuities
Act 70
-$21M Other
Special Laws to
PERS
+6M
Judicial Branch
Formula
DE Operated
in FY13 with
$185 million in
non-recurring,
non General
Fund sources
$9,770
$9,082
+$34M Debt
Service Existing
GO’s
+$21M
OMB Custody
($ in millions)
25

OMB projects an underspending in the General Fund FY14 of
$28 million prior to the proposed budget cuts
FY14 Expense Projection (December 2013)2 • OMB projects expenses and obligations chargeable
to FY2014 appropriations will be lower than the
approved balance.
• Department of Education: Projection assumes
- Continued implementation of DOE corrective
action plan leading to a $9 million deficit.
- Does not consider following expenses: payment
of FY13 school dining debt, potential FY14
special education service and transportation
overruns
- Does not consider application of $58 million in
carryforward surplus reserve to FY14 non-
recurring expenses
• Projected deficit/surplus of public corporations are
not included in the General Fund forecast. PR
Health Insurance Administration’s currently
forecasted deficit is $60 million, down from $110
million included in the Commonwealth Report
dated October 18, 2013.
• Expenses charged to Non General Fund revenue
sources or prior year General Fund carryover
special appropriations are not included as FY14
General Fund expenses (1).
(in $ millions)
(1) OMB transferred surplus about-to-expire nonrecurring balances totaling $47.6m from FY12 General Fund special appropriations to another FY12 General Fund special appropriation being used to cover certain FY14 recurring retirement
contributions. The corresponding FY14 appropriation as budgeted, however, is sufficient to cover all FY14 expenses for such retirement contributions. Thus, an equivalent remaining balance on the corresponding FY14 appropriation is expected
at FY14 end.
(2) Preliminary and subject to change. Expenses for special appropriations considered fully expended due to three year life. Operating expenses YTD per PRIFAS Treasury system with adjustments by OMB, including related to correction of intra-year
timing delays in the procurement cycle and normalizing the intra-year timing effect of budget reserves and transfers. Operating expense forecast based on agency projections adjusted by OMB analysts, managers and executive team to correct
for errors, projected but yet unauthorized hires, and analogous adjustments. Additional adjustments for intra-year timing. Department of Education projection not adjusted by OMB (either expense level or intra-year timing).
$4,890 $4,831
$4,880 $4,911
$9,770 $9,742 $28
Budget Actual Improvement
FY2014 (July-Dec.) FY2014 (Jan.-Jun.) Change
-1%
1% Prior to the
implementation
of the legislation
filed to amend
FY14 budget
26

The proposed budget amendment would empower OMB to reduce
authorized appropriations by $170 million
27
Fiscal Year 2014 General Fund Budget
(in $ millions)
$9,770
$9,600
Approved Budget ProposedAmended Budget
Decrease
$170
• Reduced GDB
deficit
financing by
$152.5M
(remaining
undisbursed
amount)
• Balance of
$17.5 million of
budget savings
proposed to
fund a reserve
to pay debt
from prior
fiscal years
• Adjustments
are preliminary
and their
distribution
may change
Reserves and Contingencies under OMB Custody
• Accounts created to cover anticipated expenses that we
do not expect will materialize in FY14
• Includes $40M appropriation to cover municipal debt in
anticipation of the reduction in the municipal SUT, which
was effectively eliminated
• Includes $27M of the $62M appropriated to subsidize non-
General Fund employers in the incremental cost imposed
by the Act 3 Retirement System Reform.
Special Appropriations for Programs or Operations
• Appropriations to cover program expenses that we
believe may be reduced because they are no longer
necessary, are not a priority, or are a priority but are
being funded or could be funded by other agency
resources including their fee income or prior year
carryforward appropriations
• Example: $5M appropriation to cover the pilot for a new
model for the Public Health Insurance Program
• ~$16M of this reduction will come from appropriations in
the Budgetary Support Fund that will be reduced to make
room for the expenditures formerly slated to be covered
by remaining balance on the $245M GDB deficit financing
Reduction in Agency Operating Budget
• Reduction in the appropriations from the Joint Resolution
for Operating Expenses for accounts such as payroll and
purchased services
• Excludes the Department of Education and certain
autonomous agencies (for example, Office of the
Comptroller)
• Approximately 2% of the operating budget, adjusted
individually according to agency conditions
• Given pre-existing forecast, incremental savings of net
$36 million would be required.
• OMB will push for the full $64 million and for maximum
underspending
Specia
l A
ppro
pri
ati
ons
Opera
ting E
xpense
77M
29M
64M
Includes
the $28
million
under-
spending
currently
forecast.

14,905
7,010
Terminations Additions Change
17,932
8,068
Terminations Additions Change
98,812 100,168 99,370
97,844 96,744
90,473
92,087 91,475
Jul Aug Sept Oct Nov Dec Jan Feb Mar Apr May Jun Jul Aug Sept Oct Nov Dec
Headcount (Jul 2012 – Dec 2013)
-8%
112,291 114,820 113,976
111,717 110,397
103,027 104,692
104,112
Jul Aug Sept Oct Nov Dec Jan Feb Mar Apr May Jun Jul Aug Sept Oct Nov Dec
Headcount (Jul 2012 – Dec 2013)
-9% Central
Government
Agency
Employees
Chargeable to
All Origins (1)
Central
Government
Agency
Employees
Chargeable to
the General
Fund (Joint
Resolution)
(1)
1. Information collected from the Treasury RHUM payroll system. Excludes irregular (part time) employees. Excludes employees for (i) agencies whose payroll is drawn from General Fund Special
Appropriations, including the Judicial Branch and the UPR; and (ii) agencies whose payroll is drawn from the Joint Resolution of the General Fund but not processed through RHUM, primarily
smaller or autonomous entities such as the Government Ethics Office and the Comptroller. For the PR Police Department, which is outside RHUM, the net change in total employees are self-
reported, but adds and terms are not detailed. Not an official statistic and subject to data quality and manual error.
A
B
-7,895
2013 Calendar Year: January to December
-8%
B
2%
1%
-9,864
2013 Calendar Year: January to December
-9%
A
2012 2013
2012 2013
The budget amendment is enabled in part by a substantial decline in
headcount at agencies funded by the General Fund
28
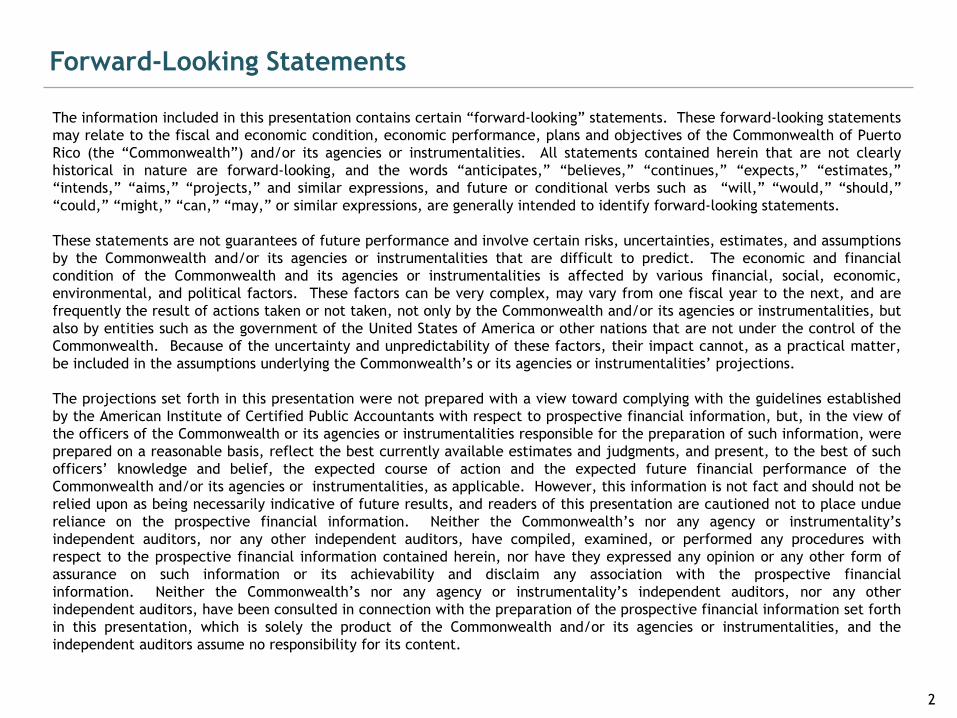
• We face substantial challenges in cost
escalators such as revenue-based
formula appropriations, collective
bargaining agreements, and higher
retirement contributions
• These are partially offset by cost
reductors, particularly a lower starting
operating payroll expense base
• We have not yet made final decisions
on specific expense measures. Certain
expense data pending including agency
budget petitions. The revenue forecast
is still in process. We expect the
recommended budget to be presented
in March or April.
• The Governor has a proven track record
with respect to his commitment, and
that of the Commonwealth, to fiscal
responsibility
COST ESCALATORS COST REDUCTORS
Revenue-based Formula Appropriations
(UPR; Judicial Branch; Municipalities) Lower Starting Base Headcount + -
Collective Bargaining Agreements Economies from Teacher Retirement + -
Higher Water Utility Rates +
Higher Retirement Contributions
and Debt Cost (GO & TRANs)
Lower Leave Liquidation Payments
+
-
Higher GDB Debt Service
Potentially Lower Electricity Rate
+
-
Subsidized Public Corporation
Shortfalls
No IVU Municipal Debt and Other
Non-Priority Appropriations
+
-
Expenses Charged Against Non
General Fund Revenue Sources
Better Leverage of Agency Fee Income
+
-
The configuration of the Fiscal Year 15 General Fund recommended budget is underway
The Governor has announced the commitment of the Commonwealth
to a balanced budget in FY15, earlier than anticipated
Availability of Non-General Fund
Sources including Carryover
Appropriations -
29

Agenda
Recent Accomplishments 1
Liquidity and Plan of Finance 2
Revenue and Expense Update 3
Comprehensive TRS Reform and Other Legislation 4
Economic Development 5
Concluding Remarks 6

TRS Reform

Commonwealth’s enactment of meaningful, comprehensive pension
reform of Teachers Retirement System (“PRTRS”) is a credit positive
Key Takeaways: Everyone contributes:
Current Retirees
Active Employees
Taxpayers Generally
• Reduced Special Law Benefits
• Similar to Act 3-2013, Act 160-2013 is designed to
eliminate projected need for pay-as-you-go contributions
from General Fund by:
(i) restructuring the System’s benefits so as to decrease
projected System disbursements; and
(ii) increasing contributions to the System so as to provide
additional cash flow to pay pension benefits as they
become due.
• The restructuring of future liabilities of the System,
coupled with an increase in inflows into the System, is
projected to allow the System to pay all pension benefits
as they become due.
• Reform is designed to protect accrued pension benefits.
Core pension benefits of all current retirees are left
untouched.
• Restructuring of System benefits expected to result in
present value reduction in System pension payments of
approximately $3.7 billion*.
• The constitutionality of Act 160 is currently being
challenged in several lawsuits brought by participants of
the Teachers Retirement System. The Puerto Rico
Supreme Court appointed a Special Master to conduct an
evidentiary hearing on the facts and suspended the
effectiveness of Act 160 pending final resolution at the
constitutional challenge. On February 7, 2014, the Special
Master issued its report and on February 11, 2014, the
Puerto Rico Supreme Court issued an order granting
parties until March 3, 2014 to file briefs on the
constitutionality of Act 160.
32 * Disbursement reduction from FY2015 through FY2050, assuming a 5.95% discount rate.
• Act 160-2013 conforms employer contributions with
employer contributions for PRGERS (max 20.525% in
FY2022, an increase of an additional 0.525%)
• Annual contribution of $30 million from FY17 until FY18
and $60 million from FY19 until FY42
• Additional variable annual contribution from FY19 until
FY42 to maintain PRTRS’s assets above $300M
• PRTRS keeps savings resulting from changes in Special
Laws’ benefits
• Change in benefit structure and retirement age
– Elimination of defined benefits plan
– Increase in minimum pension for future retirees to
compensate for the fact that teachers do not
receive Social Security benefits
• Gradual increase in employee contribution

33
* Disbursement reduction from FY2015 through FY2050, assuming a 5.95% discount rate.
Note: Numbers presented are estimates; final results could vary. Projection considers an investment return of 5.95%, teacher hiring,
retirement and attrition at historical levels, among other important assumptions. For a summary of TRS actuarial assumptions, consult the
FY2012 Actuarial Report. Variation in asset depletion will depend on the number of teachers that retire earlier than expected, hiring
activity and investment return.
$0
$200
$400
$600
$800
$1,000
$1,200
$1,400
$1,600
$1,800
$2,000
2014 2016 2018 2020 2022 2024 2026 2028 2030 2032 2034 2036 2038 2040 2042 2044 2046 2048 2050
Deficit Pre-Reform
Assets - Pre-Reform
Assets - Post-Reform
Cash Flow Deficit Projection Before and After Act 160 of 2013 (in millions)
FY
• Annual cash flow deficit prior to Act 160-2013 averaged $562 million per year beginning in FY2019-FY2020 until
FY2049-2050, which would have required the General Fund to contribute, on average, $562 million, in addition to (i)
employer contributions already legislated under Act 114-2011 and (ii) funding annually of “Special Law” benefits.
• Post-reform, based on existing assumptions and expected investment returns, the pension system is expected to be
self-sufficient.
Act 160-2013 reduces TRS disbursements by approximately $3.7 billion* on a present
value basis and is expected to eliminate the Systems’ the projected cash flow deficit
DEFICIT POST-REFORM: $0
ASSETS EXHAUSTED BY: N/A
DEFICIT PRE-REFORM: $562 million
ASSETS EXHAUSTED BY: AF2019-2020

$0
$2,000
$4,000
$6,000
$8,000
$10,000
2015 2016 2017 2018 2019 2020 2021 2022 2023 2024 2025 2026 2027 2028 2029 2030 2031 2032 2033 2034 2035 2036 2037 2038 2039 2040
General Fund Revenues Contribution to ERS Contribution to TRS
As a result of 2013 PRGERS and PRTRS pension reforms, aggregate General Fund
contributions to cover pension obligations are expected to remain manageable
34
$0
$2,000
$4,000
$6,000
$8,000
$10,000
2015 2016 2017 2018 2019 2020 2021 2022 2023 2024 2025 2026 2027 2028 2029 2030 2031 2032 2033 2034 2035 2036 2037 2038 2039 2040
General Fund Revenues Contribution to ERS Contribution to TRS
Impact on General Fund before ERS and TRS Reforms
Impact on General Fund after ERS and TRS Reforms
7%
8%
28%
15%
33%
18%
*Analysis assumes that General Fund revenues during the next 25 years to be $9.5 billion, consistent with FY2014 projected General Fund revenues. General Fund
contributions to Systems include standard Employer Contribution, Special Laws transfers, fixed additional annual contributions ($140 million in the case of ERS, $60 million in
the case of the TRS) and, in the case of graph before ERS and TRS reforms, any projected annual “pay-as-you-go” deficit.

Other Legislative Measures

New legislative measures, taken together with strong YTD financial
results, should enhance market access and liquidity
New financing
vehicle
analogous to
COFINA that can
issue debt
backed by
municipal SUT.
Allows GDB to
refinance
approx. $500M
of GDB SUT-
backed loans on
its books.
Legislation
transfers mass
transit assets
currently held by
HTA (i.e. Tren
Urbano) to new
MTA (approx. $90
million in annual
budgetary relief).
Transfer
intended to
speed HTA’s
return to self-
sufficiency and
capital markets.
COFIM HTA
TRS Reform
materially
reduces future
“pay-as-you-go”
pressure.
FY14 YTD
revenues and
expenses on
track with
budget.
FY15 Balanced
Budget pledge
improves fiscal
outlook.
GO
$3.0 B+
New pledge of
0.5% of SUT
revenues
reinforces
existing Senior
and First Sub
liens.
Pledge also
expands
potential
COFINA Third
Lien bond
capacity.
COFINA
$1.0 B+ $500 M+
New law grants
GDB new fiscal
oversight powers
over
governmental
deposits.
Reinforcement
of other credits
speeds up
repayment of
interim
financing.
GDB
N/A $1.0 B+
36
Approx.
max
principal
capacity1:
Legislative measures facilitate the refinancing of GDB loans.
1 Subject to certain market assumptions, including yield and maturity.

From 2008 to 2012, GDB loans to
HTA increased from $647 million
to $2,211 million.
A. The public corporations have required significant GDB funding,
compromising GDB’s balance sheet and liquidity.
To protect GDB’s financial condition, new legislation limits GDB’s
ability to provide deficit financing
37
Measure seeks to impose additional fiscal discipline on public corporations and
help preserve GDB liquidity.
1 For example, GDB will continue to extend loans to public corporations to ensure the timely payment of principal and interest on maturing debt
obligations. Legislation also provides for “emergency” lines of credit to particular public corporations in the aggregate of up to 10% of such public
corporations average annual revenues, up to a $50M cap per public corporation. 2 Sept. 2013 reduction due to issuance of $400 million RBC BAN to repay outstanding GDB lines to HTA. 3 Reduction due to issuance during fiscal year 2012 of PRASA Series 2012A Bonds.
$647 $960
$1,845 $2,211
$1,711
2009 2010 2011 2012 Sep. 2013
$686 $978
$1,509
$2,089
$72
2009 2010 2011 2012 Sep. 2013
From 2009 and 2012, GDB loans to
PRASA increased from $686 million
to $2,089 million.
B. Deficit financing loans by GDB have
been paid based on future increases in
rates, taxes or other charges, which
permitted public corporations to unduly
rely on GDB and avoid making decisions
necessary to ensure self-sufficiency.
Legislation requires public
corporations to approve any rate
increases for the repayment of
loans prior to loans being
approved, subject to certain
exceptions.1
New Substantive Restrictions
HTA loans in GDB Portfolio
PRASA loans in GDB Portfolio
3
2

Recently enacted legislation seeks to further strengthen GDB’s
liquidity and oversight role
Legislation grants GDB the ability to require public funds deposited at private financial
institutions, with certain exceptions (i.e. municipalities, Judicial Branch, UPR, pensions
plans), to be deposited at GDB and to receive periodic reports from the financial industry
with respect to the amount and location of such public funds.
Measure also grants OMB additional visibility and leverage over non-General Fund resources,
allowing for integrated budgeting and efficient resource allocation.
Additional oversight authority over public funds will
maximize liquidity and efficient use of public
resources
Legislation increases the cap of GDB debt that can be guaranteed by the full faith and credit
of the Commonwealth from $550 million to $2 billion.
This additional GO guarantee capacity will be used as necessary to reinforce GDB’s liquidity
position.
Increase in GO guarantee of GDB Notes will grant additional
financial flexibility and strengthen its role as interim lender
38

New State and Municipal SUT flow of funds allows Commonwealth to
better leverage the strength and stability of SUT cash flow
39
SUT Flow of Funds
Measures expand COFINA capacity and coverage levels, improve General Fund
finances and create new municipal SUT financing vehicle
NEW FLOW OF FUNDS FORMER FLOW OF FUNDS
7% Sales and Use Tax
Municipalities
1% .5%
1.5% 5.5%
Central
Government
COFINA
Base Amount (3.5%)
Commonwealth
General Fund Municipalities
General Fund
Redemption
Fund
Development
Fund
Legislative
Fund
.2
.2
.1
7% Sales and Use Tax
Municipalities
1%
1% 6%
Central
Government
COFINA
Base Amount (3.5%)1
Commonwealth
General Fund Municipalities
General Fund
COFIM
Base Amount (.3%)
Redemption
Fund
Development
Fund
Legislative
Fund
.2
.2
.1
Municipal
Administration
Fund (0.5%) .1
1 SUT amounts not leverage by COFINA are returned to General Fund after Base Amount is filled.

Increase in State SUT from 5.5% to 6.0% strengthens COFINA credit
profile
$0
$500
$1,000
$1,500
$2,000
$2,500
2014
2015
2016
2017
2018
2019
2020
2021
2022
2023
2024
2025
2026
2027
2028
2029
2030
2031
2032
2033
2034
2035
2036
2037
2038
2039
2040
2041
2042
2043
2044
2045
2046
2047
2048
2049
2050
2051
2052
2053
2054
2055
2056
2057
Millions
Outstanding Senior Lien Debt Service Outstanding First Subordinate Lien Debt Service
COFINA I Base Amount COFINA II Base Amount
Proposed COFINA III Base Amount
COFINA Outstanding Debt Service by Lien1
40
• New 0.5% pledge of State SUT increases revenue available for
COFINA debt service/coverage by approximately 9%,
expanding potential COFINA Third Lien principal capacity to
more than $1 billion assuming 6% FY2014 revenue growth and
1.75x coverage requirement.
• Additional SUT pledge also improves the state SUT break-even
growth rates for outstanding Senior Lien and First Subordinate
Lien bonds. • Break-even growth rate for the Senior lien and for First
Subordinated lien in the aggregate is now projected to
be approximately -0.3% and 1.1%, respectively.
Expands COFINA Third Lien Capacity
• New measures also cancel (i) legislated decrease in
aggregate (State + Municipal) SUT from 7.0% to 6.5%2
and (ii) assumption of outstanding Municipal SUT debt
by General Fund.
• Legislation is therefore expected to result in recurrent
avoided General Fund expenses. For FY2014, $40
million was appropriated to service Municipal SUT debt.
Results in General Fund Savings
Potential COFINA III Debt Program
1 Preliminary and included for illustrative purposes only. 2 Law 40-2013 provided for a decrease, commencing December 1, 2013, in the municipal SUT without a corresponding increase.

New COFIM structure mimics COFINA to create a potentially highly-rated
SUT-backed financing vehicle
41
— Dedicated SUT cash-flow with established seven-year
history.
— 1.5% annual growth in Base Amount requires low SUT
break-even growth rates.
— Ratio of Base Amount to 1.0% SUT would provide at least 3.3x debt service coverage.
— No “claw-back” risk at either the Commonwealth or
municipal level.
— Municipal SUT applies to certain articles not covered by
State SUT.
COFIM senior lien debt has the potential to
become a highly rated credit.
COFIM should allow municipalities to refinance up to approximately $500 million in Municipal
SUT-backed loans in GDB’s books, which should strengthen GDB’s liquidity.
COFIM could leverage up to 0.3% of 1.0% municipal SUT (approximately $250 million in annual SUT
revenues).
As with COFINA, entire municipal SUT would flow through COFIM until the highest of (i) COFIM Base
Amount ($65.5 million for fiscal year 2015, growing annually at 1.5%) and (ii) COFIM Deposit (0.3% of
municipal SUT) is satisfied.
— Potential capacity of up to +$500 million
Credit strengths include:
In $
millions
Pledged Revenues and Debt Service1
1 Preliminary and included for illustrative purposes only.
0
20
40
60
80
100
120
140
2015
2016
2017
2018
2019
2020
2021
2022
2023
2024
2025
2026
2027
2028
2029
2030
2031
2032
2033
2034
2035
2036
2037
2038
COFIM Deposit Base Amount Existing Municipal SUT DS

42
New Mass Transit Authority will result in operational efficiencies and
speed HTA’s return to self-sufficiency and the capital markets
New entity expected to result in operational and budgetary efficiencies, including improved
capturing of available federal grants, all of which should reduce Commonwealth resources destined
to mass transit.
MTA
ATI
AMA ATM
Proposed legislation creates new Mass Transit Authority (“MTA”) to merge mass transit assets
at Highways and Transportation Authority (“HTA”), the Metropolitan Bus Authority and the
Maritime Transportation Authority:
Once MTA receives FTA grantee status, Tren
Urbano’s assets and liabilities will be transferred
from HTA to MTA. Such transfer is expected to
transfer the cost of Tren Urbano to MTA, leading
HTA to financial self-sufficiency and paving the way for its return to the capital markets.
New issuance will allow HTA to refinance short-
term liabilities (including $400M BAN with RBC) and outstanding debt with GDB
MTA STRUCTURE
Agenda
Recent Accomplishments 1
Liquidity and Plan of Finance 2
Revenue and Expense Update 3
Comprehensive TRS Reform and Other Legislation 4
Economic Development 5
Concluding Remarks 6

Near-term goal
Shore up and diversify the economy by
leveraging Puerto Rico's competitive advantages
and consolidating its productive base
Long-term goal
Build sustainable competitive advantage with a
diversified, adaptive economy and workforce
driven by technology and innovation
• Defend anchor industries while diversifying job sources on the Island
• Stimulate local entrepreneurship – drive growth of small and medium enterprises (SMEs)
• Restore Puerto Rico's credibility as a stable, business-friendly jurisdiction
• Take full advantage of opportunities tied to Puerto Rico's relative fiscal autonomy
By beginning of 2016
Over 90,000 jobs created
$6 to $7 billion in incremental GDP
By beginning of 2018
Over 130,000 jobs created
$10 to $12 billion in incremental GDP
Goals
Policy
Priorities
Impact
1
2
3
4
Robust Roadmap guiding successful execution
Build upon Puerto Rico's historic strengths to achieve a more diversified,
knowledge-driven economy that addresses the challenges of globalization and
seizes upon emerging opportunities Vision
44
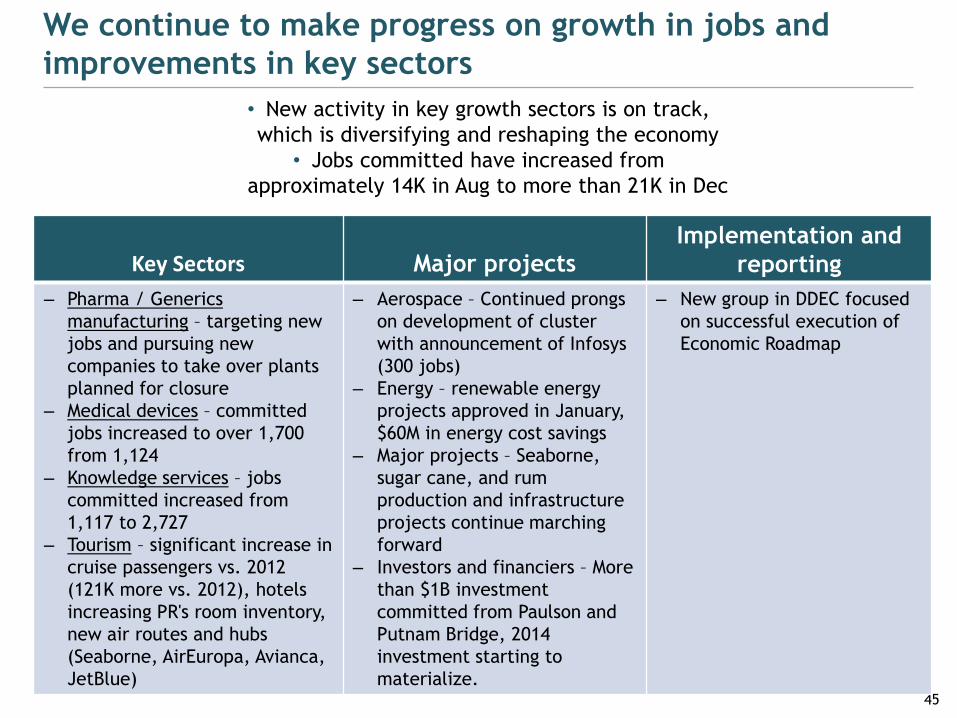
• New activity in key growth sectors is on track,
which is diversifying and reshaping the economy
• Jobs committed have increased from
approximately 14K in Aug to more than 21K in Dec
We continue to make progress on growth in jobs and
improvements in key sectors
45
Key Sectors Major projects Implementation and
reporting
– Pharma / Generics
manufacturing – targeting new
jobs and pursuing new
companies to take over plants
planned for closure
– Medical devices – committed
jobs increased to over 1,700
from 1,124
– Knowledge services – jobs
committed increased from
1,117 to 2,727
– Tourism – significant increase in
cruise passengers vs. 2012
(121K more vs. 2012), hotels
increasing PR's room inventory,
new air routes and hubs
(Seaborne, AirEuropa, Avianca,
JetBlue)
– Aerospace – Continued prongs
on development of cluster
with announcement of Infosys
(300 jobs)
– Energy – renewable energy
projects approved in January,
$60M in energy cost savings
– Major projects – Seaborne,
sugar cane, and rum
production and infrastructure
projects continue marching
forward
– Investors and financiers – More
than $1B investment
committed from Paulson and
Putnam Bridge, 2014
investment starting to
materialize.
– New group in DDEC focused
on successful execution of
Economic Roadmap

46
More than 21k jobs committed by EOY 2013, showing continued
positive trend toward Roadmap 2016 goal of ~48.7k
1,124 1,117
2,607
1,523 1,433
2,758
1,972
918529
1,7932,827
4,600
1,270
0
2,000
4,000
6,000
8,000
Bus. in
development
1,616
698
Expansion
of existing
business
2,591
619
New business
4,983
2,225
Tourism2
4,273
1,047
Other
(Industrial
and Services)1
5,045
695
# of Jobs
Textiles
and Military
Apparel
2,859
252
Knowledge
Services and
Aerospace
7,327
1,610
Medical
Devices and
other life
sciences
2,986
592
BioPharma
529
Committed by Aug/13
Additional committed Jan/14
Negotiations / In pipeline
Manufacturing and Services SMEs3 Tourism
Sample of jobs committed by sector (figures for Sept 2013 report vs. present)
Committed jobs in Aug were 13.9K; figure has risen to 21.7K for EOY, with
>10.4K jobs in negotiations pipeline
1. Includes electronics, IT, Construction & Engineering and Other 2. Includes Casino & gaming, airlines and cruises, tourism products, hotels under construction and hotels opened 3. Data as of Feb, 10th, 2014. Source: Puerto Rico Industrial Development Corporation, Puerto Rico Trade Company, Puerto Rico Tourism Company and Fortaleza

47
7K of the 21K job commitments in Manufacturing and Services,
Tourism and SMEs have already turned into created jobs
Jobs created: Manufacturing and Services, Tourism and SMEs (Jan – Dec 2013)
7,0292,644
960
775
401848
905
496
0
2,000
4,000
6,000
8,000
# of Jobs
Medical Devices and
other life sciences
BioPharma Other (Industrial
and Services)
Tourism SMEs1 Total Textiles and Military
Apparel
Knowledge Services and Aerospace
Total Manufacturing and Services 3,4K
1. Data as of Jan, 23rd, 2014 Source: Puerto Rico Industrial Development Corporation, Puerto Rico Trade Company, Puerto Rico Tourism Company

Source: PRTC, news clips
Travel & Tourism – Clear progress in improving air access,
generating jobs and increasing hotel offerings
48
Recent wins, progress and main projects in pipeline (Feb 2014)
Seaborne
Airlines
• In Dec/13 Seaborne announced flights to 16 destinations & 2,600 monthly flights
• In March they will consolidate hub (management, operations, reservations and customer
service) in PR (from Saint Croix), 400 jobs
Additional Air
Access
• New routes in 2013: JetBlue and United to Chicago, Southwest to Orlando, Avianca to
Bogota, Colombia, JetBlue to Santiago and Punta Cana, Dominican Republic
• Negotiated direct air access to Madrid with Air Europa starting May 2014
Hyatt Place,
Bayamon • Inaugurated on Dec/13; 352 direct jobs in casino, hotel and restaurant
Hyatt Place,
Manati
• To be inaugurated on March/5th - 104 rooms, $38M investment, 205 jobs when in operation
and 308 construction jobs
Cruise-lines • New routes in 2013: MSC’ s Divina arrival in November 2013, Norwegian Cruises’ Breakaway
arrival in December 2013
Additional
Cruise-line
announcements
• Disney Cruises with 4 homeport visits in Sept.-Oct. 2014
• Quantum of the Seas from Royal Caribbean arriving Dec. 2014, +6k passengers each visit
• Larger Navigator of the Seas replacing Jewel of the Seas in Spring 2015, 52k passengers
annualized
Goal to increase room inventory to 20K in 5 years.
Currently 14.5K ; 2.2K rooms in construction or operation
in 2013
Cruise passenger movement
increase by 121k
(11.5% increase 2012 vs.2013)

Sector Sample Recent wins & progress (Sept -Jan 2014)
SMEs • Jobs Now Act continues promoting growth – 9,190 jobs committed & 2,644
created by Jan/2014
• Organizational enhancements to support SMEs (announced by CCE and EDB)
Textiles &
Apparel
• Federal contract win: $137M 3-year military apparel manufacturing (2,200
jobs)
• Lifestyle Footwear – LOI in Jan 2014 (180 jobs)
Agriculture
• First harvest of rice in last 30 years (420K pounds of rice, initial investment
of $1.5M)
• Sugar cane: 20K acres, $9.5 M investment, 4K jobs potential, ~ $75M
investment
Rum • Working with producers to increase volume to achieve higher cover over
Other Mfg. • Poultry plants reopening in Coamo and Salinas (750 direct jobs with salaries
avg. $27,5K), $7M investment
Impactful progress in all additional economic sectors
49

Sample relevant deals negotiated and executed during 2013 and early
2014
50
Company Job Commitment / Date Segment
Lifestyle Footwear 180 / January 2014 Military Apparel
Infosys 300 / January 2014 Aerospace & Knowledge Services
Sugarcane 150 / January 2014 Rums & Agriculture
Seaborne 400 / December 2013 Tourism & Aerospace
Medtronic 150 / December 2013 Medical Devices
Lilly 400 / November 2013 Pharmaceutical
Rock Solid 100 / November 2013 Knowledge Services & IT
Vention 100 / October 2013 Medical Devices
Proper International 2,200 / September 2013 Military Apparel
SNC Technical Services 200 / July 2013 Military Apparel
Johnson Control 214 / June 2013 Industrial Services
IBM / True North 400 / May 2013 Knowledge Services
CooperVision 350 / April 2013 Medical Devices
Covidien 200 / April 2013 Medical Devices
AON Hewitt 200 / February 2013 Knowledge Services

Sector Sample Recent wins & progress (Sept -Jan 2014)
Supporting
areas
Energy
• Continuing to maintain reduced energy prices (lowest levels since early
2011 with temporary increase in Jan/2014 due to scheduled maintenances)
• Transition to natural gas - first plant converted June 2013; Major Aguirre
plant for 2015
• Increasing share of energy produced with natural gas from 24% to 72% by
2017
• Agreements with six companies to provide renewable energy (photovoltaic
systems), $635 million investment, 365 MW
Permitting
• IT systems improvement plan in place
• $71M (10%) increase in value of total construction permits ($747 million)
from 2012 to 2013 {$300 million increase as compared to 2011}
Progress in Energy and Permitting support growth in other economic
sectors
51

0
10
20
30
40
Dec Nov Oct Sep Aug Jul Jun May Apr Mar Feb Jan
Y Axis
0
10
20
30
40
Dec Nov Oct Sep Aug Jul Jun May Apr Mar Feb Jan
Y Axis
Residential
(800 kWh avg. consumption)
Small business
(1,200 kWh avg. consumption)
Medium-sized business
(91,800 kWh avg. consumption)
Medium industrial
(550,800 kWh avg. consumption)
2014 2013 2012 Real 2012 2011
0
10
20
30
40
Dec Nov Oct Sep Aug Jul Jun May Apr Mar Feb Jan
Y Axis 2014 2013 2012 2011
29.85 (12 mo avg.)
28.98 (Jan-14)
26.50 (12 mo avg.)
25.76 (Jan-14) 23.66 (12 mo avg.)
23.13 (Jan-14)
During 2013, achieved lowest prices in Puerto Rico since early
2011, when price of crude was much lower (<$80 vs. >$97)
2014 2013 2012 2011
0
10
20
30
40
Dec Nov Oct Sep Aug Jul Jun May Apr Mar Feb Jan
Y Axis 2013 2014 2011 2012
Source: Fortaleza, PREPA
52
26.82(12 mo avg.)
25.91 (Jan-14)
Continuing to maintain reduced energy prices, with temporary
increase in January due to scheduled maintenance of plants
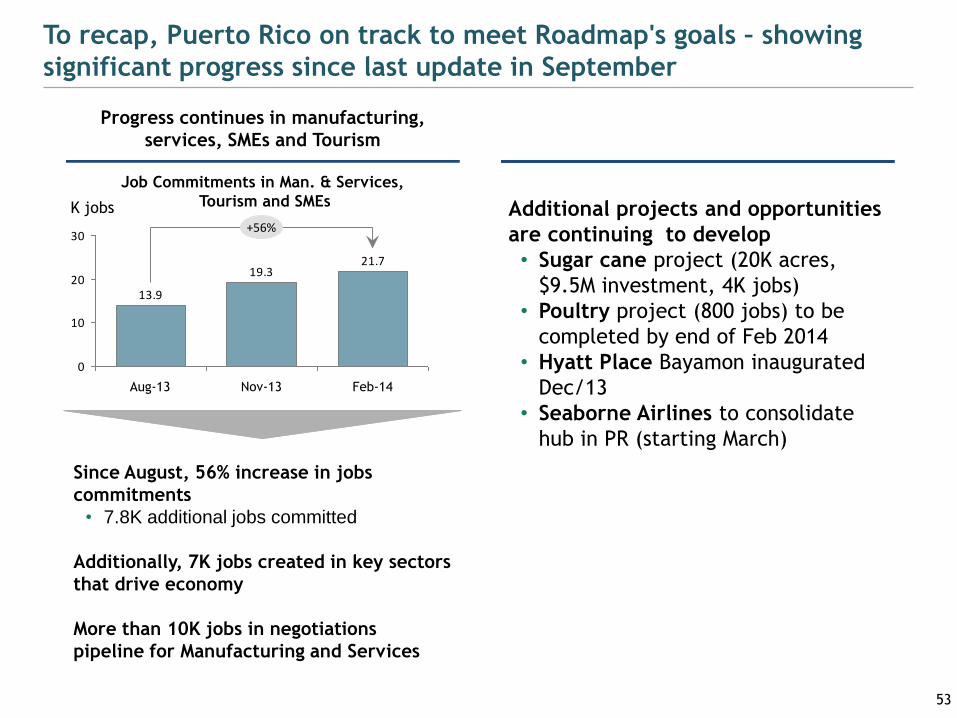
To recap, Puerto Rico on track to meet Roadmap's goals – showing
significant progress since last update in September
21.719.3
13.9
0
10
20
30
K jobs
Feb-14 Nov-13 Aug-13
+56%
53
Progress continues in manufacturing,
services, SMEs and Tourism
Additional projects and opportunities
are continuing to develop
• Sugar cane project (20K acres,
$9.5M investment, 4K jobs)
• Poultry project (800 jobs) to be
completed by end of Feb 2014
• Hyatt Place Bayamon inaugurated
Dec/13
• Seaborne Airlines to consolidate
hub in PR (starting March)
Job Commitments in Man. & Services,
Tourism and SMEs
Since August, 56% increase in jobs
commitments
• 7.8K additional jobs committed
Additionally, 7K jobs created in key sectors
that drive economy
More than 10K jobs in negotiations
pipeline for Manufacturing and Services

Companies Expected
Investment Major activities
John Paulson
and Co.
$500M in 2014
$500M in 2015
($1B total)
Acquired an 80% interest in the Bahía Beach Resort &
Golf Club, including the St. Regis Resort, and plan to
invest $500 million in further development
Putnam
Bridge
Investments
$200M in 2014
Invested $450 million in renovating Marina Puerto Del
Rey, creating up to 400 construction jobs and up to
500 permanent jobs
Total
$700M in 2014
$1.2B expected by
2015 (cumulative)
Investments committed for 2014 starting to materialize and will help
drive job growth and economic activity
Number of investment funds exploring new operations in
Puerto Rico, with some (e.g., Blue Fund) already in process
54

Agenda
Recent Accomplishments 1
Liquidity and Plan of Finance 2
Revenue and Expense Update 3
Comprehensive TRS Reform and Other Legislation 4
Economic Development 5
Concluding Remarks 6

Year-over-year comparisons underscore the Administration’s achievements
Topic Status December 2012 Status January 2014
Pension Systems • Pension systems represented a significant
future burden on General Fund
• Comprehensive central employee
pension and teachers employee pension
systems reforms executed
Budget
Deficit • Projected $2.2B budget deficit for FY2013
• $820M budget deficit for FY 2014 was
reduced by $170M mid fiscal year,
demonstrating fiscal discipline
• FY2015 target budget deficit was
reduced from $400M to $0
Market Access • Limited capacity to issue through COFINA,
the only “A” rated vehicle
• Strengthened COFINA to increase
issuance capacity & created COFIM
PRASA Finances • Significant operating deficits at PRASA
• PRASA rate increases makes it less
dependent on funding from General
Fund and GDB
PRHTA/GDB • $2B in PRHTA loans at the GDB without clear
source of repayment
• Raised over $270M in new revenues to
refinance and/or amortize these loans
• Reformed GDB’s lending practices to
limit its funding of operating deficits at
public corporations
Workforce Size • Decreasing consistently Jan – Dec 2012 (-22k)
• Increasing consistently Jun-Dec 2013
(+26K), economic development plan has
resulted in thousands of new jobs
✓
✓
✓
✓
✓
56
The Commonwealth has demonstrated it has the political will to
address long-standing fiscal and economic challenges.
✓
✓
✓
We are confident investors will recognize what we have accomplished through hard
work and shared sacrifice.

Recognizing the significant achievements of this Administration, we
are nonetheless aware of the significant challenges that remain…
Public corporations cannot continue to rely on the Commonwealth or the GDB to satisfy its
fiduciary needs
Near-term self-sufficiency of our public corporations is a critical challenge to the long-term
economic health of the Commonwealth
Reform our public corporations, beginning with the Puerto Rico Electric Power
Authority, so they achieve operational and financial self-sufficiency
The Commonwealth will present a FY 2015 budget that is balanced.
The goal is also not to have any deficit financing at the public corporations.
Shall act decisively to address any projected revenue shortfall or overspending for FY2014..
Present a balanced budget for FY 2015
The Commonwealth is committed to continue demonstrating its willingness and
determination to further strengthen its fiscal and economic health. 57
The Commonwealth will continue on its aggressive agenda to create jobs, expand our
industrial base and attract foreign investment in order to reshape and diversify the economy.
Continue executing on an ambitious economic plan
In the upcoming year, we shall:
We will update the market shortly about how this transaction is expected to address the
Commonwealth's liquidity needs for FY 2014 and FY 2015
Access the market with a GO transaction

The Commonwealth of Puerto Rico
Update on Fiscal and Economic Progress
Q & A Session

What is the status of obtaining waivers from creditors
regarding impact of credit rating downgrades? Are
acceleration and collateral triggers based on downgrade
from one rating agency, or more than one?
- Gene Caponi from Deutsche Investment Management
1

When will the GDB release its FY13 financial statement?
- Steve Hong from HIMCO
2

How early into FY15 will you need to issue additional
debt?
- Jennifer Johnston from Franklin Templeton Investments
3

What is the under-funded amount of general pension
after the reform is accomplished? What is the required
annual contribution for the next several years?
- Jon Pruchansky from Arrowgrass Capital Partners
4

What is the status of the Teachers’ Pension reform?
What will be the plan if the Court does not in fact
uphold the reform?
- Jon Pruchansky from Arrowgrass Capital Partners
5

Any discussion on raising the 154 excise tax?
- Joe Rosenblum from AllianceBernstein
6

Please explain how corporate collections are ahead of
schedule, was this a onetime patent collection in
October or sustainable?
- Michael Friedman from Amici Capital, LLC
7

When will the Governor release the FY15 budget and
when will it be available in English?
- Jennifer Johnson from Franklin Templeton Investments
8

More details on the announcement of plans to present a
balanced budget for FY 2015? How is that to be
achieved? Where are the cuts being made?
- Joe Rosenblum from AllianceBernstein
9

The U.S. Treasury has repeatedly commented that they
do not intend to provide a bail out, and Puerto Rico has
not requested one. However, what other grants are
available and to what amount of proceeds could they
add?
- Jon Pruchansky, Arrowgrass Capital Partners
10
What is the status of the conversion from oil to natural
gas of northern generators?
- Linda Murphy from T. Rowe Price
11

What is the status of the Roosevelt Roads and Science
City RFP, and time frame for potential land parcel
transactions?
- Gene Caponi from Deutsche Management
12

Appendix A – YTD Revenue Detail

General Fund Monthly Revenue Estimates and Actual Results
TaxType Jul Aug Sep Oct Nov Dec Jan Feb Mar Apr May Jun
Total Actual FY 2014 Q1 & Q2 Results Revised Monthly Revenue Estimates for Remainder of FY 2014
Individuals $140,399 $129,189 $145,765 $159,559 $131,971 $172,586 $150,607 $137,744 $166,953 $360,689 $155,681 $152,857 $2,004,000
Corporations 83,261 23,924 250,501 230,779 29,690 305,535 79,661 24,893 138,070 776,234 104,397 466,055 2,513,000
Non-
ResidentWithh
oldings
28,711 41,600 49,392 176,579 62,510 73,787 67,636 60,303 75,265 60,000 43,634 80,583 820,000
Sales and Use
Tax (SUT) 0 0 0 0 0 0 76,008 105,704 96,991 109,027 108,857 117,413 614,000
Act 154
ExciseTax 134,984 150,312 149,727 153,677 135,290 176,534 131,858 175,994 163,373 184,727 194,163 187,361 1,938,000
AlcoholicBever
ages 19,215 25,200 19,292 26,670 26,361 26,445 21,332 20,197 22,074 20,552 24,063 31,599 283,000
Tobacco
Products 17,299 10,728 9,691 17,705 9,360 15,725 17,296 13,429 15,382 15,578 14,764 17,043 174,000
Motor Vehicles 13,292 37,187 30,182 43,035 31,245 40,720 39,896 38,145 42,401 37,546 38,455 39,896 432,000
Off-Shore
RumShipmentE
xciseTax
29,176 31,522 27,515 29,963 14,437 25,643 15,754 8,686 9,596 8,077 8,824 10,807 220,000
Other 28,664 23,048 49,038 23,517 32,161 88,349 27,599 27,681 64,728 50,744 31,471 80,000 527,000
Total $495,001 $472,710 $731,103 $861,484 $473,025 $925,324 $627,647 $612,776 $794,833 $1,623,174 $724,309 $1,183,614 $9,525,000
Revised General Fund Monthly Revenue Estimates
72
Source: Department of the Treasury

Sales and Use Tax Fiscal 2014 YTD Revenue
73
SUT Revenues (in millions)
FY13 FY14
FY13 to
FY14
Variance
FY13 to
FY14 %
FY2014
Budget
FY2014
Actual Vs
Budget ($)
FY2014
Actual Vs
Budget (%)
July $102.9 $111.5 $8.6 8.4% $105.2 $6.3 6.0%
August $93.9 $96.3 $2.4 2.6% $96.1 $0.2 0.2%
September $92.6 $97.5 $4.9 5.3% $99.3 ($1.8) -1.8%
October $88.5 $97.1 $8.6 9.7% $116.8 ($19.7) -16.9%
November $94.5 $97.6 $3.1 3.3% $123.3 ($25.7) -20.8%
December $99.8 $107.7 $7.9 7.9% $130.7 ($23.0) -17.6%
YTD Results $572.2 $607.7 $35.5 6.2% $671.4 ($63.7) -9.5%

90% increase in corporate revenue has driven 16% growth in YTD
General Fund revenues vs. FY 2013
General Fund July-December preliminary revenues are higher by (i) $537 million above FY 2013
results and (ii) $93 million over budgeted estimates for FY 2014 (July-December).
74
FY 2013 vs. FY 2014 FY 2014 Budget vs. FY 2014 Results
1 Sales and Use tax revenues flow to COFINA until receiving the Pledged Sales Tax Base Amount.
$0 $200 $400 $600 $800 $1,000
Individual
Corporations
Non-Resident Witholdings
Sales and Use Tax¹
Property Taxes
Foreign (Act 154)
Alcoholic Beverages
Tobacco Products
Motor Vehicles
Off-Shore Shipment Rum Excise
Others FY 2013 Results
FY 2014 Results
FY 2013 YTD Results: $3,421 million
FY 2014 YTD Results: $3,959 million
$0 $200 $400 $600 $800 $1,000
Individual
Corporations
Non-Resident Witholdings
Sales and Use Tax
Property Taxes
Foreign (Act 154)
Alcoholic Beverages
Tobacco Products
Motor Vehicles
Off-Shore Shipment Rum Excise
Others FY 2014 Budget
FY 2014 Results
FY 2014 YTD Budget: $3,866 million
FY 2014 YTD Results: $3,959 million

Appendix B – Expense & Budget
Detail

FY2014 YTD Payroll Expenses and Budget versus Actual
617 602 679 629
1,296 1,230
Q1 FY13Expense
Q1 FY14Expense
Q2 FY13Expense
Q2 FY14Expense
YTD FY13Expense
YTD FY14Expense
(In $ millions)
Year over Year Payroll by Quarter, FY14 versus FY13 1 • Average monthly payroll has decreased from $204 million in July 2013 to $190 million in November 2013.
• Improved BvA performance in 2Q FY14 due both to a relatively steeper drop in payroll expense versus the prior year and conservative forecasting of the Christmas bonus expense.
• Not all of the year over year reduction flows into budget
versus actual savings since:
- $75 million of the initial reserves of $87 million for one-time liquidation payments have been transferred to OMB custody and are excluded from the payroll budget figures.
- some payroll savings were already built into the budget, particularly to cover previously agreed-upon collective bargaining increases.
• Payroll accounts represent approximately $2.7 billion or 28% of the General Fund Budget.
- excludes payroll from entities funded with special appropriations (UPR; Judicial Branch) and smaller agencies with payroll outside the central Treasury RHUM payroll system. The budget of these entities represents 14.4% of the General Fund.
- excludes payroll from the pooled federal-and-state funds “Schoolwide” appropriation, which is accounted for in the Treasury PRIFAS system as a non-distributed appropriation (transfer out). This covers most teachers, and represents ~10.5% of the General Fund budget.
-2.5%
-15M
-7.5%
-51M
-5.1%
-66M
591 602 682 628
1,273 1,230
Q1 FY14Budget
Q1 FY14Expense
Q2 FY14Budget
Q2 FY14Expense
YTD FY14Budget
YTD FY14Expense
(In $ millions)
Budget versus Actual by Quarter, Fiscal Year 2014 2
+1.8%
+10.5M
-7.9%
-54M
-3.4%
-43M
76

4,940 4,880
60
Adjusted FY14 Expenses FY2014 Budget Surplus(+)/Deficit(-)
FY14 Remainder Projected Expenses (Adjusted)
5,127 4,940
187
Projected FY14 RemainingExpenses
Expense Adjustments(OMB Estimate)
Adjusted FY14 Expenses
FY14 Remainder Projected Budget versus Actual (Adjusted)
• The same pro-ration methodology for adjustments is utilized for the projected year end expenses as for the estimated YTD expenses.
• The main adjustments to expenses for the remainder of the year are (i) implementation of the Dep. Education corrective action plan; and (ii) projection, based on forecast by agencies, that approximately 10% of the initial OMB-imposed liquidation reserve will be unused for liquidation and not required to be returned to the agencies.
• PR DoE adjustment reflect the management corrective action plan savings estimate with a discount by OMB for implementation risk. Summary of DOE plan: (i) starting deficit projection of $173 million; (ii) recurring corrective actions for $95 million including rationalization of school security; revised utilization of federal funds; strict hiring oversight; and others; (iii) non-recurring correction actions for $83 million, including utilization of an LOC to pay extraordinary leave liquidation expenses, and application of a non-General Fund carryover surplus reserve of $59 million. After such plan, the Department would project a General Fund surplus of $5 million.
FY14 Remainder Projected Budget versus Actual
B
Adjustments to Expenses
(in $ millions)
(in $ millions)
(43)
(31)
(17)
(3)
5
29
Transportation
OMB-Imposed Liquidation Reserve
Non Distributed Appropriations
Others
Payroll
Purchased Services
Primary Contributors to Surplus (+)/Deficit (-)
77
Appendix C – TRS Reform

• Freezes accrual under defined benefit plan (annual accrual rate of 1.8% of average salary) for current
teachers
– Under New Plan, an existing participant will receive, at retirement, a pension equal to (i) what they have
accumulated up to July 31, 2014 under existing defined benefit plan, plus (ii) an additional annuity based on
contributions made by such participant under a defined contribution plan on or after August 1, 2014.
– Eliminates future accrual of “merit pension” (payable once the participant has achieved 30 years of
creditable service), equivalent to 65% or 75% (if participant is 50 years or older) of average salary (calculated
based on the highest salaries earned by the participant during any 36 months).
• Any new teacher hired on or after August 1, 2014 will receive, at retirement, an annuity based on the
contributions made by such participant and any corresponding investment return.
• Current teachers will benefit from a minimum pension of $1,625 per month if they retire with at least 30
years of service and at age 55 or older. New teachers hired on or after August 1, 2014 will also benefit
from a minimum pension if they retire with at least 30 years of service and at age 62 or older.
Creation of a New Defined Contribution Plan1 1
79
By closing the existing defined benefit plan and increasing the retirement
age, projected obligations/cash outflows are substantially reduced
Increase in Retirement Age 2
Prior to Reform Post Reform
• Age 47 (with 25 years of service)
• 30 years of service with a minimum of 47 years of age
• Age 60 (with 10 years of service)
• Age 55 (with 30 years of service)
• Age 60 (with 10 years of service)
• Age 62 (with 5 years of service) for new teachers
1Minimum pension benefit of $1,625 per month could be deemed to be a “defined benefit” feature within defined contribution plan.

Gradual increase in employee contribution, along with previously legislated
increase in employer contribution, will significantly improve System cash flow
$100
$150
$200
$250
$300
$350
$400
$450
$500
2015
2017
2019
2021
2023
2025
2027
2029
2031
2033
2035
2037
2039
2041
2043
2045
Increase in Employee Contribution
(in millions)
+$163
+$13
$455
$133
$120
$292
Estimated Employee
Contribution @9.00%
Estimated Employee
Contribution @10.000%
until FY2017, 13.12% until
FY2020 and 14.02%
thereafter*
$100
$200
$300
$400
$500
$600
$700
$800
2015
2017
2019
2021
2023
2025
2027
2029
2031
2033
2035
2037
2039
2041
2043
2045
Increase in Employer Contribution**
(in millions)
+$332
+$27
$681
$170
$143
$349
Estimated Employer
Contribution @10.50%
Estimated Employer Contribution
after Act 160-2013
* Unless actuaries determine no actuarial need for such increase.
** Act 114-2011 gradually increased employer contribution to the System up to a maximum of 19.750% in FY2022. Act-160 increases employer contribution
in fiscal year 2022 from 19.750% to 20.525%, making it equivalent to the PRGERS employer contribution legislated under Act 116-2011.
4 3
Estimated Employer Contribution
under Act 114-2011
$656
80

Reduction and gradual phase out of “Special Law” benefits will also result
increase cash flowing into the System, extending life of System assets
Impact of Change in “Special Law” Benefits
(in millions)
$-
$10
$20
$30
$40
$50
$60
$70
2015
2017
2019
2021
2023
2025
2027
2029
2031
2033
2035
2037
2039
2041
2043
2045
Net cash inflow
to the System
+$20
Net cash inflow
to the System
+$42
Projected Employer Contribution
for/in lieu of Special Law Benefits
Modification of “Special” Law Benefits
• “Special Law” benefits for retirees as of
August 1, 2014 are modified as follows: – Christmas Bonus is reduced by 66% (from
$600 to $200);
– Summer Bonus is eliminated ($100); and
– Medical Plan Contribution (up to $1,200
per year) and Medication Bonus ($100)
are maintained in full.
• “Special Law” benefits are eliminated for
all future retirees.
• Notwithstanding reductions, General Fund
will continue to make annual contributions
to the System of $1,675 (average annual
cost of “Special Law” benefits) per
retiree, with reduction in System outflows
benefiting net System assets.
5
Projected Disbursements of Special
Law Benefits to Retirees
81

Appendix D – Economic Roadmap

Life Sciences – Bio Pharma focused on shoring up industry while
increasing generics & advanced technologies (biologics)
83
Goals: Cumulative
direct jobs created1 Status and accomplishments
Jobs activity – 529 jobs committed
Recent wins
• Expansion of Johnson & Johnson with 308 new jobs and $226
million in investment – 31 jobs already created by November
• Expansion of Bristol Myers Squibb with the creation of 100 new
jobs and an investment of $200 million in expansion and
renovation of the physical plant and factor equipment
• Investment of Eli Lilly of $200 million to strengthen its
competitiveness and manufacturing capacity resulting in the
creation of up to 400 construction jobs and 100 indirect jobs
Strategy and outreach
• Target new companies (e.g., LatAm generics producers) to
replace outgoing manufacturing operations
• Recent outreach to > 60 companies, some firms actively
engaging with government (PRIDCO) to discuss options in Puerto
Rico
– e.g. contract manufacturing, plant purchases
3,8002,640
1,8001,071
4250
2018 2017 2016 2015 2014 2013
2014 Establish relations with all
global HQs of Big Pharma
2015 "Go" or "no go" decision for
contract manufacturing
2017
Spin off contract mfg of
orphans to self-
manufacturing
2018 Solidify biotech cluster
Milestones and targets
1. Represents end-of-year cumulative numbers (e.g., 3,800 jobs created by the end of 2018).

Life Sciences – more than 1,700 jobs committed in Medical Devices
sector, with continued positive momentum
84
Status and accomplishments
Jobs activity - 1,716 new jobs committed (up from 1,124
committed in August)
• Nearly 1,500 jobs in pipeline
Recent wins
• Expansion of Medtrocnics generating 150 new jobs
• Expansion of CooperVision’s manufacturing facilities attracting
$250 million investment and 350 new jobs
• Expansion of Covidien's mfg. facilities attracting 200 new jobs
• Expansion of Saint Jude Medical with the creation of 150 new
jobs over a period of 5 years, with estimated payroll expansion
worth $6.2 million
Strategy and outreach
• Increase awareness and target newly-growing companies that
are increasingly sensitive to cost and tax pressures
• Focus on key sub-sectors: Cardiovascular, Orthopedics-Trauma,
Minimally Invasive Surgery, and Vision
• Recent outreach to over 50 companies with two new companies
in discussions with PRIDCO
Goals: Cumulative
direct jobs created1
7,500
5,8004,500
2,650800400
2018 2017 2016 2015 2014 2013
2013
Strengthen relationship with
existing med tech companies
in PR; Launch med tech
marketing campaign
2014 Upgrade PRIDCO facilities
2014
Recruit suppliers, support
investments in contract
manufacturing
2015 Establish public-private
partnership with universities
2016 Host Caribbean/LatAm med
tech congress
Milestones and targets
1. Represents end-of-year cumulative numbers (e.g., 7,500 jobs created by the end of 2018). Incremental to baseline of 19,323 med tech jobs (as of July 2012)

85
Knowledge Services & Aerospace – over 2,700 committed jobs cover
goals through 2014, with over 4,000 jobs in the pipeline
Status and accomplishments
Jobs - 2,727 jobs committed (up from 1,117 in August)
• More than 4K jobs in pipeline
Recent wins
• Accenture looking for clients to start operation, searching for
potential clients
• Infosys to create 300 Jobs (LOI in Jan 2014)
• Expansion of IBM / True North with the creation of 400 new jobs
• Expansion of AON Hewitt with the creation of 200 new jobs
• Expansion of Rock Solid Technologies with the creation of 100
new computer engineering jobs
Strategy and outreach
• Increase awareness and promote Puerto Rico's value
proposition, particularly in most sophisticated sub-sectors (e.g.,
R&D / engineering)
• Tied to broader strategy targeting "under the flag" industries
• Recent outreach to over 40 companies
• Confidential negotiations with several multinational companies,
some of which are considering Q1 pilots in 2014
– One company starting pilot to ramp up to 100 employees by
end of 2014
Goals: Cumulative
direct jobs created
Knowledge Services1
8,7005,600
3,2001,600750
2018 2017
12,600
2015 2016 2014 2013
2014
Infrastructure "Plug & play"
experimental initiative
launched
2014 Host industry reps in PR
2014 Sign internship agreements
with universities
2015 Launch PR's outsourcing
white paper
2015 Implement KS cluster
2016 Host outsourcing trade show
in San Juan
Milestones and targets
1. Represents end-of-year cumulative numbers (e.g., 12,600 jobs created by the end of 2018).

86
Travel and Tourism – more than 600 created jobs and several
milestones accomplished (e.g. new JetBlue route to CHI)
Status and accomplishments
Jobs – 2,354 new jobs committed (up from 1,433 committed in
August), includes 960 created jobs
Recent wins
• Increased air access, with potential to scale via code-sharing
– (Southwest to Orlando, Avianca to Bogota, expanded
Caribbean services via Seaborne); with focus on LatAm.
– Negotiated direct air access to Madrid with Air Europa
starting May 2014. Expansion ongoing (e.g. Brazil)
• Cruise ships visits increased 84% in August 2013 vs. year before
and targeted incentives in place to drive traffic in years to
come, supported by Pier 3 infrastructure improvement
• Over 900 hotel rooms under construction and hundreds more
in the pipeline
• Successful marketing campaigns – "Summer is easy" and "Five-
Star Reviews" through alliance with TripAdvisor
Strategy and outreach
• Increasing air/sea routes, building new hotel capacity
• Spain and Bogota tourists can bring up to $200M in GDP impact
• Exploring new activity in specific geographies (e.g., Brazil,
Russia, Germany, UK,) – potential to add over $800M to GDP
impact
Goals: Cumulative
direct jobs created1
7,5006,500
5,500
2,900
400
2017 2015 2016 2014 2013
2013 JetBlue and United open
route to CHI
2013 "Posadas" project launch
2013 LMM International airport and
Aguadilla airport remodeling
2014 Reinitiated direct flight to
Madrid
2016 Increase hotel rooms from
15k to 20k
2016 Tourism accounts for 8%
GDP
2016 10m annual flight passengers
Milestones and targets
1. Represents end-of-year cumulative numbers

Type of Project Expected
Investment ($M) Jobs Comment
Public-Private Partnerships 1,265 13,651
Correctional Facilities 356 3,346 Beginning June 2014 (two facilities)
Housing 217 2,605 Puerto Rico Housing Authority / AVP
Sugarcane processing for rum prod. 17 800 $10M initial investment (2014)
Other 675 6,900 Valenciano Dam, Caguas – San Juan train
Public Infrastructure 200 2,402
Water and Sewage 21 247 Three PRASA projects (Ponce, Palo Hincado, Río Arriba)
Other 179 2,155 Includes Cancer Center ($131 M investment)
Private Construction 560 9,120
Housing and Commercial 550 9,000 Murano Town Center, Ramblas de Guaynabo, Finca Elena
Ports 10 120 Sea Star
Energy 1,599 15,015 Includes Aguirre Offshore Gasport, $254M investment ; 24 projects, with
numerous projects in renewable energy (solar, wind)
Air Transportation 719 5,813
International airports 205 2,455 Aerostar: Luis Muñoz Marín Airport
Regional airports 73 894 7 projects, includes Rafael Hernandez airport ($45M investment)
Aerial access 441 2,464 Seaborne airlines, Jet Blue , Southwest, Avianca, Air Europa
Hotels 579 5,960 7 projects of different size and location throughout the island
Cruises 18 487 Navigator of the Seas, Disney, Quantum of the Seas
Other 71 3,100 Roosevelt Road (four initial RFPs due Dec 20th), Port of Americas
TOTAL 5,011 55,548
Major projects driving jobs and increasing PR's competitiveness Selected projects with clear commitments and progress; total potential of $5B, 56K jobs
Source: Fortaleza Puerto Rico, January 2014 87
~$800M in projects starting in H1 2014
$626 million in public infrastructure in
2013, Comprehensive Cancer Center started
Dec 2013

$9,525
Group Initiative 2013 2014 2015 2016 2017 Description
Life
sciences
Biopharma. mfg.
0 400 1,100 1,800 2,600
1. Defend pharma: Goal to defend projected jobs
loss. 2. Generics, co-mfg, supply chain: Goal of 5
plants / packing operations each
Medical devices mfg 400 800 2,700 4,500 5,800
Target of 40 new projects in 5 yrs. Attract global
giants, cardiac, high growth segments.
Ag-bio (scientists) 100 200 300 400 500
Jobs growth driven by creation and expansion of seed
research laboratories.
Ag-bio (contract farmers)
400 800 1,300 1,900 2,600
Assumes 5x contract farmer jobs created per
scientist job created. Contract farmer works 8-12
months/yr
Services
Knowledge services 800 1,600 3,200 5,600 8,700
Target of 28 new co's in 5 yrs. Attract ITO, BPO, KPO,
Integrated outsourcers, Aerospace & defense.
Insurance & financial
services 0 100 100 200 300
Target attract 90 insurers incl. 15 class 4 co's in 5
yrs.
Tourism
Traditional tourism 400 2,900 5,500 6,500 7,500
90% jobs growth is in new hotel, diversifying
offerings
Medical tourism & related
health services 0 300 500 900 2,700
Based on PRHA projections for US and LatAm market
penetration
SMEs SMEs 4,600 7,400 7,800 8,100 8,400
Jobs mostly driven by Jobs Now. Others include
incubator, Urban Center programs.
Agriculture
Traditional agriculture
2,500 5,000 7,500 10,000 10,000
Jobs driven by 5.5k jobs in coffee, 4k in sugarcane
and 500 jobs in greenhouses
Agriculture - seasonal
workers 1,600 3,300 4,900 6,500 6,500 Seasonal workers for coffee picking
Other
Film & media production 0 100 100 200 200 Jobs driven by Film Co's incentive promotions
MRO 0 0 400 400 400
Potential MRO facility – currently in discussion w/
co's
Military apparel mfg 0 2,200 2,200 2,200 2,200 Jobs growth from one large Federal contract.
INITIATIVES TOTAL 10,800 24,900 37,400 49,300 58,600
Roadmap has clear cumulative direct jobs targets (I/II)
88

$9,525
Group Initiative 2013 2014 2015 2016 2017 Description
Strategic
bets
Roosevelt Roads
-
100
1,600
1,700
1,700
Construction of Industrial Zone, Academic
project, Eco-tourism, Marina
Science Trust
-
-
100
200
300
Estimates for Oso Blanco, Cancer Center,
Biomolecular bldg, & Bioprocess Dev't
Complex – to be refined
Port of the Americas
-
-
400
400
400 350 operating jobs once begins operations.
Strategic bets total
-
100
2,000
2,200
2,300
Infra-
structure
Airport P3
-
600
600
600
600
PPP w/ $195M investment in 3yrs, $1,400M
in 40 yrs
Highways (PR-22)
-
-
4,000
4,000
4,000 $1B investment across 2015-2017.
Caguas Commuter Rail
-
-
1,200
1,200
1,200
$400M investment. Currently in feasibility
/ desirability phase.
PRASA (water)
-
1,300
1,300
1,300
-
$354M construction for Valencia water
treatment plant and reservoir
Correctional facilities
-
-
900
900
900
$220M investment. Feasibility /
desirability phase set to finish Oct. 2013
Natural Gas Infrastructure
-
1,300
1,300
-
-
$180M-$300M investment . Feasibility /
desirability phase set to finish Dec. 2013
Infrastructure total
-
3,200
9,300
8,000
6,700
TOTAL DIRECT JOBS 10,900 28,200 48,700 59,500 67,600
Roadmap has clear cumulative direct jobs targets (II/II)
89

150
100
50
0
2
Jan, 2018
(5 years)
TBD
Jan, 2016
(3 years)
TBD
July, 2014
(18 months)
40 - 50
22
11 5 2 2
Retail & food (DDEC)
Private construction (OGPe)
Construction (DDEC)
Workforce dev’t (CGU)
Public private works
Non-initiative PRIDCO
employees (k)
1. Jobs added in non-focus sectors based on La Fortaleza's job tracker, but excludes jobs which overlap w/ strategic initiatives in Economic Roadmap (eg. Jobs Now). Assumes all committed jobs will be created within 18 months, given current run-rate of 22k jobs created in 7 months. 2. Includes strategic bets (RR, Port of the Americas); 3. Total number of jobs will depend on degree of overlap between indirect jobs created from strategic initiatives and jobs projected outside of strategic initiatives; Note: Initiative job impacts estimated by PR initiative leads w/ BCG validation; Sources: BCG economic model, PR Economic Planning Board, Bureau of Labor Statistics, Bureau of Economic analysis, Initiative leads, La Fortaleza jobs tracker
16 31
50
11
9
17
49
72
0
50
100
150
Jan, 2018
(5 years)
130 – 150
9
Jan, 2016
(3 years)
90 – 100
6
July, 2014
(18 months)
35 – 45
3 3
Strategic initiatives
Infrastructure projects 2
Seasonal jobs
Indirect jobs
employees (k)
Jobs created by strategic initiatives in
Economic Roadmap
Jobs added by broader economic
growth in non-focus sectors1
After accounting for overlap, Puerto Rico's economy expected to
create 55 – 65k jobs by July 20143
Estimated potential jobs creation
90

Initial investments to support growth will see fiscal returns as
economy returns to growth trajectory
1. Upper range assumes historical average effective tax rates from 2008 to 2012 multiplied by incremental GDP over baseline. Note that recent tax changes and revenue collection efforts may push average effective tax rates upwards in the future. 2. Includes impact from both direct and indirect jobs created. Source: Puerto Rico Planning Board, Puerto Rico Treasury Department, BCG analysis
0
100
200
300
400
500
$M (fixed 2012)
FY2017
$350- $500M1
FY2016
$250 - $350M
FY2015
$150 - 250M
FY2014
$50 - 100M
Potential gross tax revenue from
Roadmap's strategic initiatives
Example: Potential gross
tax revenue by sector2
0
100
200
300
400
500
$M (fixed 2012)
Tourism
Biopharma
10%
39%
Medical devices
Ag-Bio
Infrastructure and
strategic bets
Knowledge services
SMEs
Agriculture
Other
FY2017
$350-$500M
13%
10%
9%
8% 5%
5% 1%
Estimated potential impact on go-forward tax revenues
91