+/0.10(,+/%,. 10',./ /1!/.(-0(,+/ +#%1.0'$.#$0 ()/ '00 ...
26
Transcript of +/0.10(,+/%,. 10',./ /1!/.(-0(,+/ +#%1.0'$.#$0 ()/ '00 ...

Instructions for authors, subscriptions and further detai ls:
http: //remie.hipatiapress.com
Overburdened and Underfunded: California Public Schools
Amidst the Great Recession
Rhoda Freelon, Melanie Bertrand & John Rogers1
1 ) Institute for Democracy, Education, and Access, Universtity of California Los
Angeles, United States of America.
Date of publication: June 1 5th, 201 2
To cite this article: Freelon, R. , Bertrand, M. & Rogers, J. (201 2).
Overburdened and Underfunded: California Public Schools Amidst the Great
Recession. Multidisciplinary Journal of Educational Research , 2(2), 1 52-1 76.
doi: 1 0.4471 /remie.201 2.08
To link this article: http://dx.doi.org/1 0.4471 /remie.201 2.08
PLEASE SCROLL DOWN FOR ARTICLE
The terms and conditions of use are related to the Open Journal System
and to Creative Commons Non-Commercial and Non-Derivative License.

REMIE - Multidisciplinary Journal ofEducational Researh Vol. 2 No. 2
June 2012 pp. 152-176
Overburdened & Underfunded:
California Public Schools
Amidst the Great Recession
Rhoda Freelon, Melanie Bertrand & John Rogers
University ofCalifornia, Los Angeles
Abstract
Since 2008, many nations, including the United States, have struggled with the
effects of a global recession. The state of California has been particularly
impacted by the Great Recession. Unemployment rates in California are among
the highest in the United States, and a weak fiscal environment has forced deep
cutbacks to a variety of state services. This study uses California as a case to
explore the effects of economic crisis on public schools and the students they
serve. The study draws on survey and interview data with a representative
sample of public high school principals across California. The data show that,
during the Great Recession, students have experienced growing social welfare
needs that often shape their well-being and their performance in schools. We
also find that the capacity of public schools to meet these needs and provide
quality education has been eroded by budget cuts. This study finds that schools
primarily serving low-income families have been hardest hit during the
recession, in part because they cannot raise private dollars to fill the gap left by
public sector cuts. The Great Recession thus has undermined educational
quality while producing widening educational inequality in California.
Keywords: Public schools, Inequality, School finance, Economic recession.
2012 Hipatia Press
ISSN 2014-2862
DOI: 10.4471 /remie.2012.08

1 53REMIE - Multidisciplinary Journal ofEducational Research, 2 (2)
sential school services. Unfortunately, this principal’s story is not
unique. As the impacts of the current global economic recession have
yet to abate, schools and students have suffered across the United States.
This crisis in United States’ public schools has occurred within the
context of myriad hardships caused by the economic slump that have
taken a significant toll on the well-being ofAmericans. Throughout the
recession, which began near the end of 2007, many Americans have
experienced job loss, long bouts of unemployment, and record numbers
of home foreclosures. As recent as December 2011 , the average duration
of unemployment reached about 40 weeks (39.7), suggesting a painfully
slow economic recovery (Bureau of Labor Statistics, 2012). An
increasing need for social supports has placed a strain on the
administration of social services, which have experienced budget
uncertainty in recent years.
Concurrent with this decline in the economic standing of the average
American household, there have been calls for improving public
education to maintain America’s global competitiveness (U.S.
Department of Education, 2010). Also, there have been growing
concerns about the educational progress of students from low
socioeconomic backgrounds and immigrant families. This focus on
educational improvement generally and addressing the so-called
“achievement gap” emerged before the Great Recession. However, the
pressure to reform public education has grown in the last few years,
even as education budgets have been slashed across the country (Dillon,
2011 ). Amidst calls for improvement, teacher positions have been cut,
after-school programs narrowed, and text book purchases put on hold
(Ceasar & Watanabe, 2011 ; Dillon, 2011 ; Mehta, 2009).
T
"In the last two years, because ofthe fiscal crisis and budget
cuts, I am down eight teachers.… I’m down six counselors.
I’m down 10 clerks. I’ve lost all my security. And I almost lost
my nurse and my school psychologist. . . "
his was the desperate commentary of Martin Baker, a high
school principal in a low-income community in California
who was facing unprecedented teacher layoffs and cuts to es-

While these problems plague schools throughout America, Cali-fornia
provides an interesting case study to demonstrate how students most in
need of increased educational investments are receiving less opportunity
in their schools because of cuts to public K-12 education and social
support services. Education has been a target for cost savings in recent
years as California legislators desperately seek to address budget
shortfalls created by declining tax revenues (Shambaugh, Kitmitto,
Parrish, Arellanas & Nakishama, 2011 ). Even prior to the recession,
California had consistently spent less per pupil than the national
average. Cost-adjusted per-pupil expen-ditures from 2008 show
California ranked 43rd out of the 50 states in the nation, spending
$2,371 less for each student than the national average (Education Week,
2011 ). The long-term underinvestment in public schools, combined with
California’s more recent fiscal problems, heightens the challenges
facing students and school staff in public schools.
This paper draws upon the insights of public high school principals
in the state of California to explore the impacts of the budget cuts on
schools and students. Below we discuss survey and interview data from
hundreds of principals across the state. Principals are particularly well-
positioned to illuminate these issues because they deal with school
budgets and have direct contact with teachers and students. Principals
are often the public face that represents the school to the community as
well as district and state officials. Given their roles as administrative,
instructional, and community leaders, principals have a unique vantage
point from which to assess school and community conditions and
student well-being. The principals’ commentary provides a picture of
how schools and students in California have fared in a recession that has
reached across the globe. This context is of particular interest to an
international audience because California is the eighth largest economy
in the world (Legislative Analyst’s Office, 2011 ), and due to a weak
fiscal infrastructure and vulnerability to the mortgage crisis, one of the
epicenters of the economic crisis in the United States (Bardham &
Walker, 2010). The responses of California schools to global economic
pressures can be instructive to education stakeholders worldwide.
1 54 Freelon, Bertrand & Rogers - Overburdened & Underfunded

1 55
As stated previously, California’s most recent per-pupil education
spending lags behind the nation and the majority of other states. Policy
analysts argue that California has struggled to keep pace with national
spending on education since the passage of Proposition 13 (McComb &
Carroll, 2005). Proposition 13 was passed in 1978 by California voters
as a backlash against taxation. The measure limited property tax rates to
1% of the assessed value of residential and commercial property. This
proposition had several unintended consequences, including shifting the
primary source of education revenues from local districts to the state of
California. While most other states dramatically increased education
funding in the 1980s and 1990s, California failed to keep pace, falling
farther and father behind the national average in per pupil expenditures
(McComb & Carroll, 2005). By 2008, California spent $2,371 less for
each student than the national average, when cost of living differences
are taken into account (Education Week, 2011 ). Initial indications
suggest that the gap between California and the rest of the United States
has grown in subsequent years, although data that would allow for
definitive comparison is not yet available (California Budget Project,
2011a). With a growing population of immigrant families and low-
income students who benefit greatly from additional educational
supports, California is at a disadvantage in meeting the needs of a large
proportion of students due to these continued fiscal challenges
(Shambaugh et al. , 2010).
REMIE - Multidisciplinary Journal ofEducational Research, 2 (2)
California Context Before and During the Great Recession
California’s context before the recession set the stage for the current
weak infrastructure of California’s public schools. From state tax
initiatives and their impact on education funding, to growing economic
inequality, and California’s relative importance in the overall national
economic collapse, funding for education and social services has been
particularly challenging. In this section, we outline how each of these
factors converged to create limited educational opportunities.
Proposition 13 and California Education Spending

California, like the nation, is also experiencing increasing income
inequality with income gains accruing to those at the top of the income
distribution. Data from the California Budget Project (2011a) show that
the average income of most Californians declined as those of the
wealthiest increased substantially from the early 1970s to 2009.
Additionally, during the recession, income for the lowest 10% of the
income distribution fell by more than 21% compared to a 5% decline for
those in the 90th percentile (Bohn & Schiff, 2011 ). This growing
inequality, coupled with decreasing financial investments in public
education, intensifies the challenges facing low-income families.
1 56
California as an Epicenter ofthe Great Recession’s Impact
California has the largest economy in the United States and is among the
top 10 economies in the world (Bardhan & Walker 2010). The state’s
economy accounts for 1 3% of the nation’s Gross Domestic Product
(Bureau of Economic Analysis, 2011 ). Yet, during the recession,
California consistently has experienced one of the highest unemploy-
ment rates of any state in the nation. According to Bardhan and Walker
(2010), because California has relied on construction and housing as key
sectors for economic growth, the mortgage crisis left the state
particularly vulnerable to the economic downturn. This, along with the
state’s longstanding budget shortfalls, placed California in worse shape
than most other states in the nation during the height of the recession
(Bardhan & Walker, 2010).
Growing Economic Inequality
Freelon, Bertrand & Rogers - Overburdened & Underfunded
Impact ofthe Recession on Education and Social Welfare in California
The recession has taken a considerable toll on Californians as growing
joblessness has pushed many families into tenuous financial positions.
California lost more than 950,000 jobs between 2007 and 2009, placing
many Californians out of work (California Budget Project, 2009).
Further, the number of underemployed workers (who are unable to
secure sufficient hours of regular work) more than doubled to
approximately 1 .4 million during this same time frame (California

Budget Project, 2009). These employment realities undoubtedly led to
the higher levels of poverty many families in California are currently
experiencing. The overall poverty rate in California increased to 16% by
2010, up from a low of 12% in 2006, the lowest rate since the mid-
1980s (Bohn, 2011a). However, children and single-female households
suffered the most, with a significant percentage slipping into poverty.
According to Bohn (2011b), there has been considerable growth in child
poverty since the beginning of the Great Recession. By 2010, 23% -
almost one in four of California’s children were living in poverty (Bohn,
2011b). In 2010, the poverty rate for single-mother households was
35.4%, compared to 10.6% for married-couple families (California
Budget Project, 2012).
The confluence of California’s budget deficit, growing economic
inequality, and the Great Recession have been detrimental to the state’s
fiscal support for K-12 education, higher education, and social services.
As a consequence, the proposed state budget for 2012-1 3 reflects cuts to
the state’s health insurance program for low-income families, Medi-Cal,
as well as the Healthy Families insurance program, resulting in
increased premiums for families. Additionally, the state’s welfare
assistance, CalWorks, is expected to see cuts to programs resulting in a
disproportionate amount of stress and strain on women and children.
Hence, the state is shrinking social services during a period of growing
need. Between 2007 and 2009, the number of Californians receiving
assistance from food stamps, CalWorks grants, Medi-Cal or the Healthy
Families program all increased (California Budget Project, 2011 ).
The state of education funding in California is quite precarious. Over
the last three years, funding for K-12 public education has fallen by
almost 10% (Taylor, 2011 ). Further cuts will be made if California
voters fail to pass a referendum on new taxes in November 2012.
Meanwhile, fee increases in California’s public higher education
systems are making post-secondary education less affordable for
students and families (Gandara & Orfield, 2011 ).
In subsequent sections of this article, we turn to the interview and
survey results from California’s public school principals as they provide
detailed accounts of how the economic downturn has affected students,
their families, and teaching and learning at their school sites.
1 57REMIE - Multidisciplinary Journal ofEducational Research, 2 (2)

1 58
Methods
In this article, we report the findings of a study conducted during the
summer of 2010 by a cadre of researchers from the University of
California, Los Angeles, Institute for Democracy, Education, and Access
(UCLA IDEA). We interviewed and surveyed principals of schools from
across the state of California, asking about the effects of the economic
crisis on families and the impact of the budget cuts on schools. We
surveyed 277 high school principals and interviewed 78 of those
surveyed. These data illuminate not only the breadth of the impacts of
the budget cuts and economic crisis on California high schools, but also
the day-to-day struggles of students, families, and school personnel.
In recruiting participants for the study, we strived to create a sample
that represented the demographic diversity of high schools within
California. Our survey sample included roughly the same percentage of
schools with low, medium, and high proportions of African American,
Latino, and American Indian students (who are underrepresented in
California’s public universities) as the state as a whole. Our subsample
for follow-up interviews slightly overrepresented schools with low and
high proportions of these students.
We also sought to create a sample that reflected the income diversity
in the state, as measured by the percentage of students receiving free or
reduced price school meals (Children from families with incomes at or
below 130 percent of the federal poverty level qualify for free meals.
Children from families with incomes between 130 and 185 percent of
the poverty line can be charged no more than 30 cents per meal.) The
schools in our survey sample and interview subsample closely matched
schools statewide in terms of free and reduced price meal rates. We
analyzed differences among schools by free and reduced price meal
rates, designating a school as low, medium, or high poverty or income
depending on whether it landed in the bottom, middle, or top third of
free and reduced price meal rates in the state as a whole.
In spring 2010, we created an online survey of 54 questions intended
for California high school principals. The questions asked principals to
assess the impacts of budget cuts at their schools and gauge the well-
being of their students in relation to the economic crisis. Most questions
were multiple choice, such as this example: “To what extent have bud-
Freelon, Bertrand & Rogers - Overburdened & Underfunded
get cuts for technology and technology maintenance impacted student
access to computers and online resources at your school?” Possible
answers for this question ranged from “No negative impact” to
“Significant negative impact.”
Our research team used the 2010 California Public School Directory
to collect all the email addresses of public high school principals in the
state. Then each principal was emailed a link to the online survey.
Throughout July and August, after an initial wave of principals had
responded, researchers sent second and third emails to principals who
had not yet completed the survey. We also placed recruitment phone
calls to targeted groups of non-responders in order to ensure that we
collected a representative sample. The 277 principals who completed the
survey represented 22% of all high school principals in California.
From the pool of 277 principals who completed the survey, our
research team recruited principals to participate in follow-up interviews.
This recruitment process began with the survey itself, which asked
principals to indicate days and times when an interview would be
convenient. Many interviews were scheduled in this way. As the
interview pool grew, we analyzed the characteristics of the schools
connected to the principals, noting whether schools serving certain
demographics were over- or underrepresented. In particular, we
examined racial breakdowns of the schools, free and reduced price meal
rates, and geographic location. These on-going analyses guided us to
focus additional recruitment efforts on principals of schools that were
underrepresented in our pool.
Graduate students in UCLA’s Principal Leadership Institute conduc-
ted half of the principal interviews, while the UCLA IDEA research
team interviewed the other half. These interviews were audio-recorded
and conducted over the phone, lasting about 30 minutes. Interview
questions asked principals to elaborate on their survey responses. For
example, if a principal had reported that budget cuts had negatively
impacted professional development, we asked her or him to describe the
impact and its consequences. Documents indicating which interview
questions to ask a given principal were electronically generated and
given to each interviewer.
We analyzed the survey data using a series of frequency tables and
cross-tabulations by several categories of schools. We examined the
159REMIE - Multidisciplinary Journal ofEducational Research, 2 (2)

differences in survey responses by free and reduced meal concentra-
tions, whether a school was in a high-revenue school district (with local
revenue greater than $1 ,000 per pupil), and whether the school was
located in a low or high unemployment neighborhood. We looked for
different patterns across these categories of schools to examine principal
responses to questions about how budget cuts were disparately
impacting schools.
We transcribed the audio recordings of each interview, resulting in 78
transcripts, which we then loaded into an online qualitative research
program. In the program, each interview transcript was linked with
demographic information about the high school of a given principal,
including the proportion of racially underrepresented students and
students receiving free and reduced price meals, geographic location,
school size, and whether the school was in a high-revenue district. We
coded these transcripts with more than 100 codes. Some of the
overarching categories of the codes included: money matters, the
principal’s role, school conditions, stressors on students from the
economy, and impacts on students. The coding scheme also included a
floating codes category to capture compelling quotes, impacts on special
populations, equity matters, and mentions of the economic crisis. We
ensured that each researcher applied the codes in a consistent manner by
coding several common transcripts and discussing our results. Once we
had achieved inter-rater reliability, we coded the 78 transcripts, with two
team members coding each one. After we had coded all the transcripts,
we used functions within the research program to analyze code co-
occurrence, or instances where two or more codes were applied to the
same passage. We also used the software to investigate trends related to
certain demographic or geographic types of schools. Finally, the
research program helped us collect similar types of quotes, which we
then analyzed by hand.
160 Freelon, Bertrand & Rogers - Overburdened & Underfunded

161REMIE - Multidisciplinary Journal ofEducational Research, 2 (2)
Growing Social Welfare Needs
As the economic downturn lingers, students’ social welfare needs
continue to grow. Throughout 2010, statewide unemployment exceed-ed
12% and underemployment was estimated at more than 20%, leaving
many California families without secure housing, food, and clothing
(U.S. Bureau of Labor Statistics, 2010). The principals in our study
indicated how the failure of the economy has impacted the students at
their schools.
In our study, 75% of high school principals reported that homeless-
ness had increased among their students. Homelessness rose even in
schools within affluent neighborhoods. A principal of one such school
commented:
In addition to homelessness, 82% of principals reported higher rates of
residential mobility amongst their students. When jobs are lost, homes
foreclosed, or eviction notices served, students end up moving.
Principals indicated that residential mobility hampered students’
academics. As Principal Sue Booth explained, “The stability alone
affects how our students are growing and having the ability to do
homework or not do homework. A home plays a very important part of
students’ lives and their ability to be successful at school.” Another
principal pointed out that this mobility impacted standardized testing, a
major focus of education policy in California and the United States
generally.
Fifty-six percent of the principals we surveyed reported an increase in
food insecurity amongst their students. Some principals reported an
increase in applications for free and reduced price school lunches.
Principal Kristin Hughes commented on the academic impact of hunger:
We’ve just seen more kids who have needed more support, either
with transitional housing or that are living in hotels, being evicted.
It used to be, I mean, we’re in a pretty good area socio-
economically, and I think it’s been shocking over the last couple of
years to see how many more of our kids are either evicted or
[forced to move] because families lose their home.
We see a lot more kids that are stressed out about it, They’re
worried about losing their homes, you know, Kids are hungrier,
they’re not making it to the end of the month with the salary that
their parents have, and so we’re seeing a lot more kids just in a
state of struggle all the way around with their basic needs. You
know, that’s going to impact their academics because…learning
math today is not immediate, whereas eating is.
162 Freelon, Bertrand & Rogers - Overburdened & Underfunded
Fifty-three percent of the principals indicated that they had seen a
decrease in social welfare and health services provided to their students
by government agencies or community groups.
Effects on Schooling Conditions
In addition to shaping the lives of young people outside of school, the
Great Recession has impacted the quantity and quality of student
learning. One of the main targets of budget cuts has been instructional
time. Sixty-five percent of principals in our study reported cutting back
or eliminating summer school. They expressed concerns about summer
school cuts impacting students’ ability to retake classes they had failed.
Steven Chavez, a principal from Southern California, commented,
“Students are going to not be able to make the credits up…and that’s
going to impact their eligibility to graduate.” Another principal, Mike
Mendez, argued that the loss of summer school also would have a
“major impact” on college-going. His students would no longer be able
to take “accelerated” classes in the summer that allowed “them to take a
third or fourth year of science or a third or fourth year of foreign
language” during the regular school year.
Schools have also cut after-school time and instructional days. Almost
half (49%) of the principals from our study led schools that had reduced
instructional days since 2008. Maria Sanchez, who took over a Los
Angeles-area school that had fared poorly on standardized testing,
commented, “Every day that students aren’t in the classroom impacts
their progress.” Given her students’ low scores in math and reading, she
pointed to the “need to find time to have them in school longer.” Thirty-
two percent of the principals from our study reported reductions to after-
school programs, including services for struggling students.
163REMIE - Multidisciplinary Journal ofEducational Research, 2 (2)
Many principals, such as Susan Louden, worried that struggling students
would not catch up without tutoring and other support services.
In addition to cuts to instructional time, curricula have narrowed.
Twenty-nine percent of principals reported that their schools offered
fewer art or music classes. In addition, 34% of principals indicated that
their schools cut back social studies electives. “Last year we were able
to offer psychology, sociology…Latin American studies, and an
international relations class,” explained Principal Rebecca Stevens. “But
right now, in order to keep the class sizes from growing, we’ve had to
pull our teachers to do the core classes.” Another principal reasoned that
restricting course choices “negatively impacts motivation and engage-
ment.”
Instructional materials have been impacted as well. The majority
(57%) of principals in our study reported that their schools had cut
instructional materials generally. Students at 63% of study high schools
had less access to calculators, measuring instruments, and other key
mathematical tools. Also, science laboratory equipment had been
depleted, as principal Craig Galloway commented: “Kids are sharing
microscopes, which gives them less time individually using
them….Without the money to purchase equipment and supplies,
instruction and learning suffers.” Another principal, Paula Diamond,
described how her science teachers can no longer purchase a class set of
frogs for dissection. Now there is just one set “for the class [which] the
teacher shows on a document camera, and so that’s not really engaging
learning.” Other principals reported that their schools have been unable
to upgrade computers or purchase sufficient copy paper.
Principals also reported cuts to the schools’ essential infrastructure for
teaching and learning—for example, custodians and community
liaisons. Sixty-seven percent of principals revealed that budget cuts had
impacted school cleanliness. Principal Mike Bianco noted that his
smaller custodial staff had not been able to keep up with trash disposal,
and this has led to “an increase in rodents, roaches, and other living
things.” Glen Cohen in Santa Cruz County bemoaned the fact that
despite the efforts of the depleted grounds staff, his “beautiful facility”
is being “beat to a pulp.” Many principals noted that budget cuts had
impacted their ability to foster a welcoming and empowering environ-

ment for parents. Forty-five percent of principals whose schools had
community liaisons reported that these positions had been cut or
reduced in hours. A similar proportion of principals noted reductions to
parent workshops. Such programs, argued Principal Linda Garfield, play
a key role in providing parents with the information “they need to know
to help navigate their child through high school.” In addition, 34% of
principals whose schools provided translation services said that these
services had been cut. Ana Lopez, whose high school serves a primarily
Spanish-speaking community, worried that reductions to translators
would “create barriers” for parents to participate in school meetings.
1 64 Freelon, Bertrand & Rogers - Overburdened & Underfunded
Effects on Teaching and Learning
One of the most common ways for schools and districts to cut budgets
has been through teacher layoffs, resulting in class-size increases. Such
measures may hinder the creation of personalized learning environments
in which student-teacher interactions are fostered, according to research
(Blatchford, Bassett, & Brown, 2005, 2011 ; Folmer-Annevelink,
Doolaard, Mascareño, & Bosker, 2009) and the principals in our study.
Seventy-four percent of principals reported class-size increases at their
schools. And this increase often has been dramatic. “We were blessed
with 20 to 1 in English and 24 to 1 in math in my first two years, at the
9th grade,” noted one principal. Now those classes are at 35 to 1 . Many
other principals reported class sizes of more than 40. Another principal
remarked, “I think it’s very difficult for them to come and ask questions,
come and ask for help when they know the teachers. . . just have so much
to do.” Principal Craig Galloway said, “Sitting in a sea of 42 kids per
class, they barely have room to get through the aisles, they get less
teacher time, less interaction.” Galloway calculated that with each
assignment, English teachers grade 210 papers across five classes. “I
shudder to think what the long-term impact of 40 students per class is
going to have.”
Academic counselors have also been laid off. Half of the principals
reduced the academic counseling staff at their schools. “Having less
counselors for the same number of kids” has consequences for college
access, argued Principal Henry Gonzalez. “It impacts their ability to
165
sit one-on-one to talk to kids about what they want to do.. . [and to
provide] the information and tools to go to college.” Principal Scott
Townsend saw a 20% increase in college admissions at his school after
hiring a full-time college counselor a few years ago, but recently had to
cut this position. He said, “With him gone now, all that [has] been
eliminated. You know, you’re going to have a significant and immediate
detrimental impact on that link. It’s a vital link.”
REMIE - Multidisciplinary Journal ofEducational Research, 2 (2)
Effects on Educational Improvement
Researchers and policy makers agree that professional collaboration and
professional learning are key to improving high schools (Wilson et al. ,
2009). Both beginning teachers and seasoned professionals stand to
benefit from quality professional development that draws on teachers’
expertise, exposes them to new strategies, and supports them to tailor
these ideas to their students and the unique context of their classrooms
(Bryk, Sebring, Allensworth, Luppescu, & Easton, 2010). Such
professional development requires time for teachers to meet, access to
outside experts and networks of reforming educators, and a collegial and
supportive environment (Darling-Hammond & Richardson, 2009). Few
California high schools provide these conditions today.
Eighty-eight percent of the principals reported that budget cuts had
impacted reform and school improvement efforts at their schools. These
impacts usually took the form of cuts to professional development.
Indeed, 86% of principals indicated that opportunities for teachers’
professional growth and development had been impacted by budget
cuts. Henry Gonzales’ school had been in the middle of introducing
teachers into professional learning communities when the recession hit.
“That all has been shot down,” he noted, “and now we’re scrambling
around.” Principal Kim Rogers similarly recounted how reform in her
school “just sort of came to a standstill” after “the district froze our
budget and said…you can’t pay to release them to give them time to
work together.” Faced with the loss of professional development days,
many principals tried to find smaller blocks of time for teachers to meet
within the existing schedule. But, as principal Maritza Sandoval noted,
“To really do the work you can’t do it in 45 minutes a week.” She
concluded, “Yeah, they’re not going to be able to work together to the

same degree that they did before.”
Teacher layoffs have also been a barrier to school improvement.
Many principals echoed the sentiment of Denise Garrison, who acknow-
ledged that she and her staff had become “just so very demoralized” by
the spate of recent layoffs. The layoffs are particularly hard on high-
poverty schools struggling to build a cohesive school culture in spite of
their longstanding patterns of high teacher turnover. These patterns are
largely due to unequal distribution of school resources (including highly
qualified teachers) and other factors that negatively affect teachers’
work lives in poorer neighborhoods (Futernick, 2007).
As teachers are laid off and budgets tighten, remaining teachers are
asked to do extra work. Mike Mendez said his “teachers feel like they’re
being pounded and pounded” as they are asked to do “more and more
and more with less, less, less.” The furloughs imposed by Linda
Garfield’s school district left her with a deep sense of ambivalence
about whether to request her teachers to take on important additional
work. “So then when you say, we’re going to cut you, but yeah, we want
you to do these five things for free now, are there people who would do
it? Yes. But do I feel like we should ask them? No.… I mean, you can
only squeeze the turnip so much.”
166 Freelon, Bertrand & Rogers - Overburdened & Underfunded
Growing inequality
As budget shortfalls continue and education quality suffers, existing
inequalities have grown. Even prior to the recession, California schools
inequitably distributed resources along racial lines. During the 2007-
2008 school year, schools with 90-100% African American, Latino, and
American Indian student populations were more likely to be
overcrowded, lack qualified teachers, and offer inadequate college
preparatory curriculum than schools serving fewer of these students and
more white and Asian American students (Fanelli, Bertrand, Rogers,
Medina, & Freelon, 2010). For example, 55.7% of the 90-100% high
schools were overcrowded, compared to 16% of schools serving
populations that were 0-49% African American, Latino, and American
Indian (Fanelli et al. , 2010). These inequalities also exist along social
class and wealth lines. Here we examine growing school inequality by

167
social class only, but research (Darling-Hammond, 2010; Ferguson,
2007; Muller, Riegle-Crumb, Schiller, Wilkinson & Frank, 2009)
suggests that these inequalities are present along race lines as well.
Our data indicate that schools serving wealthier communities have
been better protected from the budget cuts described in this article. For
example, high schools in districts that relied less on state funding
because of their substantial local revenue base were better able to
protect instructional days and counseling staff. We compared survey
responses of principals in school districts with additional local revenues
greater than $1 ,000 per pupil to the responses of other principals in our
sample. One quarter of principals from high-local-revenue districts
reported cutting instructional days compared with more than half of
principals from other districts. Similarly, whereas one quarter of
principals from high-local-revenue districts reported reductions to
counseling staff, more than half of principals in other districts reported
such cuts.
REMIE - Multidisciplinary Journal ofEducational Research, 2 (2)
Table 1 . Percentage of principals reporting cuts by school district affluence
% Principalsreporting cuts to. . .
Schools in high-wealth districts
Schools in allother districts
Instructional days 25% 51%
25% 52%Counselors
The affluent schools are better able to protect educational quality by
drawing upon the wealth of neighborhood residents. One method of
raising funds has been through increases to property taxes. In the state
of California, school districts can ask voters to approve “parcel taxes,"or
additional levies on top of regular property taxes. Requiring approval by
two-thirds of the voters, parcel taxes are based on a fixed amount of
money per “lot,” and are not calculated according to the value of the
land itself. In 2009, 29 districts in the state (out of more than 1 ,000)
placed parcel tax votes before their communities. In the 20 districts that
passed a parcel tax, the average percentage of students receiving free or
reduced price meal was 15.3%. In the nine districts that placed the
parcel tax on the ballot and lost, an average of 56% of students received

free or reduced priced meal. No district in the state enrolling more than
40% of students receiving free and reduced price meals passed a parcel
tax (Rogers et al. , 2010). Hence, while local revenue generation through
parcel taxes may hold some hope for more affluent districts, it does not
seem to be a strategy that can ease the burden of districts serving
substantial numbers of low-income families.
Our research also found that high-poverty schools have less capa-city
to generate private donations than low-poverty schools. Of the schools
represented in our study, high-poverty schools raised one dollar for
every twenty raised by schools serving few poor students. Schools with
few students from low-income families received an average of $100,000
in donations compared to $5,000 for schools with a high proportion of
poor students.
1 68 Freelon, Bertrand & Rogers - Overburdened & Underfunded
Table 2. Median donations by concentration of poverty for schools
All highschools insurvey
Low-povertyhigh schools
Mid-levelpoverty highschools
High-povertyhigh schools
% Free andreduced pricedmeals
0-100% 0% - 33.9% 34% - 62.9% 63% - 100%
Median $20,000 $100,000 $20,000 $5,000
In addition to soliciting donations, California’s schools increasingly are
calling upon families to pay for services that had previously been
covered by the school. Our study data indicated that principals were
most likely to ask families to pay for field trips and sports, but a sizeable
number of principals reported requiring parents to contribute for
instructional materials or arts and music. Again, the impact differs
according to whether a school is high or low poverty. For every service,
principals from low-poverty schools were much more likely to require
family contributions than principals from high-poverty schools. Six
times as many (54% to 9%) principals of low-poverty schools reported
that they required family contributions for arts and music. These
differences are not surprising: Principals in high-poverty schools know
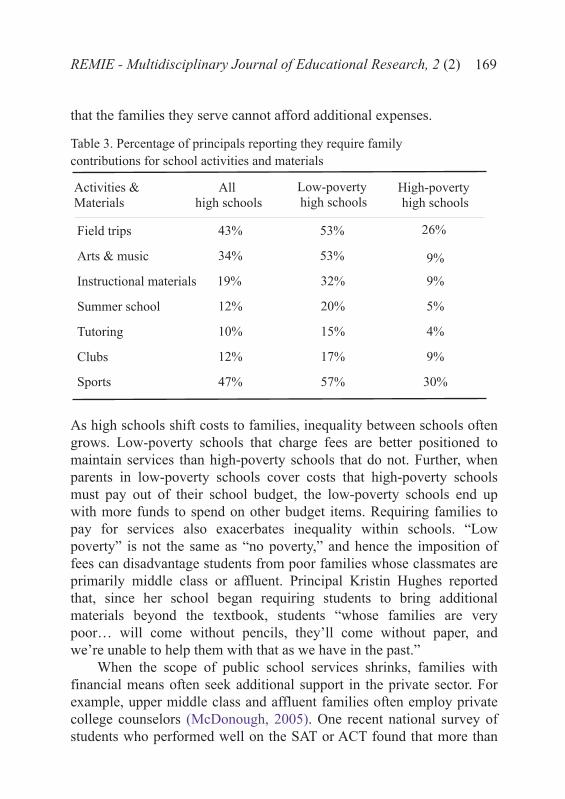
169
that the families they serve cannot afford additional expenses.
REMIE - Multidisciplinary Journal ofEducational Research, 2 (2)
Table 3. Percentage of principals reporting they require family
contributions for school activities and materials
Activities &Materials
Allhigh schools
Low-povertyhigh schools
High-povertyhigh schools
Field trips 43% 53%
Arts & music 34% 53% 9%
Instructional materials 19% 32% 9%
Summer school 12% 20% 5%
Tutoring 10% 15% 4%
Clubs 12% 17% 9%
Sports 47% 57% 30%
26%
As high schools shift costs to families, inequality between schools often
grows. Low-poverty schools that charge fees are better positioned to
maintain services than high-poverty schools that do not. Further, when
parents in low-poverty schools cover costs that high-poverty schools
must pay out of their school budget, the low-poverty schools end up
with more funds to spend on other budget items. Requiring families to
pay for services also exacerbates inequality within schools. “Low
poverty” is not the same as “no poverty,” and hence the imposition of
fees can disadvantage students from poor families whose classmates are
primarily middle class or affluent. Principal Kristin Hughes reported
that, since her school began requiring students to bring additional
materials beyond the textbook, students “whose families are very
poor… will come without pencils, they’ll come without paper, and
we’re unable to help them with that as we have in the past.”
When the scope of public school services shrinks, families with
financial means often seek additional support in the private sector. For
example, upper middle class and affluent families often employ private
college counselors (McDonough, 2005). One recent national survey of
students who performed well on the SAT or ACT found that more than

one quarter hired a private educational consultant to help them with the
college admissions process (van Der Water, Abrahamson, & Lyons,
2009). Data from the United States Bureau of Labor Statistics point to
the advantages that more affluent parents provide to high school
students. On average, families of 15-17-year-olds with earnings above
$98,000 spent more than seven times as much on education-related
expenses as families earning less than $57,0000 (Lino, 2009). Students
from low-income families have few options when public schools cut
back on counseling and other college access programs. Principal Larry
McLaughlin explained, “We’ve been able in the past to contract
someone to help our students, particularly students of color and first-
generation…going to college, help them with writing their essays to get
into college and support. And those programs, we don’t have the money
for that.”
170 Freelon, Bertrand & Rogers - Overburdened & Underfunded
Conclusion
California’s public schools have faced significant challenges as the
economic recession placed great strain on their ability to provide a
quality education for students. Principals consistently reported that cuts
have been felt and educational quality is suffering, but the suffering is
not distributed equally. Our research demonstrates that during these
difficult economic times, schools have cut back on instructional time
and narrowed the curriculum, which denies students a holistic
educational experience. Further, school improvement efforts have been
undermined as teachers and principals have less time and resources for
professional development activities that help enhanceinstructional
practices. This, coupled with teacher layoffs or threats of teacher
layoffs, made school improvements especially difficult. Our results also
show that the economic crisis was challenging for schools serving low-
income families and helped to create growing inequality. Most schools
represented in our survey and interview data experienced numerous cuts
as a result of the crisis, but schools serving low-income students were
less able to provide a buffer for these challenges through private
fundraising from parents and the broader community. While economists
suggest an economic recovery is on the horizon in California, to date,
this rebound has been sluggish. However, once the full economic reco-

171
very gathers steam, important questions should be answered. Will future
economic prosperity in California provide a restoration of funding for
public schools that was lost before and during the Great Recession? Or
will schools have to learn to make do with less in the future? Given the
national rhetoric regarding the importance of education in today’s global
economy, public investment in education and social support services for
students’ families seems to be a key ingredient to ensuring a quality
education for all.
REMIE - Multidisciplinary Journal ofEducational Research, 2 (2)

References
Alternative measures of labor underutilization for states, 2010 annual
averages, U.S. Bureau ofLabor Statistics [Electronic. (2010).
Version] . Retrieved Feb. 28, 2011 , from
http://www.bls.gov/lau/stalt.htm
Bardhan, A. & Walker, R. (2010). California, pivot ofthe Great
Recession. Working Paper No. 203-10, Institute for Research on
Labor and Employment, University ofCalifornia, Berkeley.
Blatchford, P., Bassett, P., & Brown, P. (2005). Teachers' and pupils'
behavior in large and small classes: A systematic observation
study of pupils aged 10 and 11 years. Journal ofEducation
Psychology, 97(3), 454-467.
Blatchford, P., Bassett, P., & Brown, P. (2011 ). Examining the effect of
class size on classroom engagement and teacher-pupil
interaction: Differences in relation to pupil prior attainment and
primary vs. secondary schools. Learning and Instruction, 21 ,
71 5-730.
Bohn, S. (2011a). Poverty in California, Public Policy Institute of
California. Retrieved from
http://www.ppic.org/content/pubs/j tf/JTF_PovertyJTF.pdf
Bohn, S. (2011b). Child Poverty in California, Public Policy Institute
ofCalifornia. Retrieved from
http://www.ppic.org/content/pubs/j tf/JTF_ChildPoverty.pdf
Bohn, S. & Schiff, E. (2011 ). The Great Recession and distribution of
income in California. Public Policy Institute ofCalifornia.
Bryk, A. S., Sebring, P. B., Allensworth, E., Luppescu, S., & Easton, J.
Q. (2010). Organizing schools for improvement: Lessons from
Chicago. Chicago: University ofChicago Press.
Bureau ofEconomic Analysis. (2011 ). Economic Recovery Widespread
Across States in 2010. Retreived from
http://www.bea.gov/newsreleases/regional/gdp_state/2011 /pdf/gs
p0611 .pdf
Bureau ofLabor Statistics. (2012). Economic News Release. Table A-
12: Unemployed persons by duration ofemployment. Retrieved
from http://www.bls.gov/news.release/empsit.t1 2.htm
172 Freelon, Bertrand & Rogers - Overburdened & Underfunded

California Budget Project. (2009). In the midst ofthe Great Recession:
The state ofworking California 2009. Retrieved from
http://www.cbp.org/pdfs/2009/090906_labor_day.pdf
California Budget Project. (2010). Searching for balance: The social
and economic context ofthe Governor's proposed 2010-11 Budget.
Retrieved from
http://www.cbp.org/pdfs/2010/100202_Searching_for_Balance.pdf
California Budget Project. (2011a). A decade ofdisinvestment:
California education spending near the bottom. Retrieved from
http://www.cbp.org/pdfs/2011/111012_Decade_of_Disinvestment_%20SFF.pdf
California Budget Project. (2011b). A generation ofwidening inequality.
Retrieved from
http://www.cbp.org/pdfs/2011 /111101_A_Generation_of_Widenin
g_Inequality.pdf
California Budget Project. (2012). Falling behind: The impact ofthe
great recession and the budget crisis on California’s women and
their families. Retrieved from
http://www.cbp.org/pdfs/2012/120201_Falling_Behind.pdf
Ceasar, S. & Watanabe, T. (2011 ). Education takes a beating
nationwide. Los Angeles Times. Retrieved from
http://articles.latimes.com/2011 /jul/31 /nation/la-na-education-
budget-cuts-20110731 .
Darling-Hammond, L. (2010). The flat world and education: How
America's commitment to equity will determine our future. New
York: Teachers College Press.
Darling-Hammond, L., & Richardson, N. (2009). Teacher learning:
What matters? Educational Leadership, 66(5), 46 - 53.
Dillon, S. (2011 ). Tight budgets whittle away school days. The New
York Times. Retrieved from
http://articles.latimes.com/2009/aug/08/local/me-textbooks8.htm
Education Week (2011 ). Quality Counts: Cost Adjusted Per-Pupil
Expenditures by State. Retrieved from
http://www.edweek.org/media/ew/qc/2011 /QualityCounts2011_Pr
essRelease.pdf
Fanelli, S., Bertrand, M., Rogers, J. , Medina, D., & Freelon, R. (2010).
Before the recession: Conditions, opportunities, and outcomes in
California public schools. LA: UCLA IDEA, UC/ACCORD.
REMIE - Multidisciplinary Journal ofEducational Research, 2 (2) 173

Ferguson, R. (2007). Toward excellence with equity: An emerging
vision for closing the achievement gap. Cambridge, MA: Harvard
University.
Folmer-Annevelink, E., Doolaard, S., Mascareño, M., & Bosker, R. J.
(2009). Class size effects on the number and types of student-
teacher interactions in primary classrooms. Journal ofClassroom
Interaction, 44(2), 30-38.
Futernick, K. (2007). A possible dream: Retaining California’s teachers
so all students can learn. Long Beach: The Center for Teaching
Quality at California State University.
Gandara, P. & Orfield, G. (2011 ). Squeezed from all sides: The CSU
crisis and California’s future. UCLA Civil Rights
Project/Proyecto Derechos Civiles. Retrieved from
http://civilrightsproject.ucla.edu/research/college-
access/financing/squeezed-from-all-sides-the-csu-crisis-and-
californias-future/crp-squeezed-all-sides-2011 .pdf
Legislative Analyst’s Office (2011 ). Cal Facts. Retrieved from
http://www.lao.ca.gov/reports/2011 /calfacts/calfacts_010511 .pdf
Lino, M. (2009). Expenditures on children by families, publication
number 1528-2009: U.S. Department ofAgriculture: Center for
Nutrition Policy and Promotion.
McCombs, J.S. & Carroll, S. J. (2005). Ultimate Test: Who is
Accountable for Education IfEverybody Fails? RAND Review.
Retrieved from
http://www.rand.org/publications/randreview/issues/spring2005/ul
ttest.html
McDonough, P. (2005). Counseling and college counseling in
America's high schools. Alexandria, Virginia: National
Association for College Admission Counseling.
Mehta, S. (2009). Budget cuts put new textbook purchases on hold.
Los Angeles Times. Retrieved from
http://articles.latimes.com/2009/aug/08/local/me-textbooks8.
Muller, C., Riegle-Crumb, C., Schiller, K. S., Wilkinson, L., & Frank,
K. A. (2009). Race and academic achievement in racially diverse
high schools: Opportunity and stratification. Teachers College
Record, 112(4), 1 038-1063.
1 74 Freelon, Bertrand & Rogers - Overburdened & Underfunded

Rogers, J. , Fanelli, S., Freelon, R., Medina, D., Bertrand, M., & Del
Razo, M. (2010). Educational opportunities in hard times: The
impact ofthe economic crisis on public schools and working
families. Los Angeles: UCLA IDEA, UC /ACCORD.
Shambaugh, L., Kitmitto, S., Parrish, T., Arellanas, M., & Nakishama,
N. (2011 ). California’s Education System During a Fiscal Crisis,
American Institutes ofResearch.
Taylor, M. (2011 ). The budget package: 2011-12 California spending
plan. Legislative Analyst’s Office. Retrieved from
http://www.lao.ca.gov/reports/2011 /bud/spend_plan/spend_plan_
081211 .pdf
U.S. Department ofEducation. (2010). A blueprint for reform:
Reauthorization ofthe Elementary and Secondary Education Act.
Washington, DC: U.S. Department ofEducation, Office of
Planning, Evaluation and Policy Development.
van Der Water, D., Abrahamson, T. D., & Lyons, K. (2009). High
achieving seniors and the college decision. Retrieved from
http://www.lipmanhearne.com/home/newsResources/resourceDet
ails.aspx?id=38
Wilson, S., Ball, D., Bryk, A., Figlio, D., Grossman, P., Jordan Irvine,
J. et al. (2009). Teacher quality. Retrieved from
http://www.naeducation.org/White_Papers_Project_Teacher_Qua
lity_Briefing_Sheet.pdf
REMIE - Multidisciplinary Journal ofEducational Research, 2 (2) 175

Rhoda Freelon is a graduate student researcher at UCLA IDEA
and a Ph.D candidate in Education.
Melanie Bertrand is a graduate student researcher at UCLA IDEA
and recently earned her Ph.D in Education.
John Rogers is director ofUCLA IDEA and associate professor at
the Graduate School ofEducation & Information Studies, UCLA.
Contact Address: Moore Hall 1 032B, 405 Hilgard Avenue, Los
Angeles, CA 90095-1 521 , United States ofAmerica. Email:
Freelon, Bertrand & Rogers - Overburdened & Underfunded176


![Asymptotic properties of Bayesian nonparametrics and ... · 0.5 1.0 1.5 x f2[, 1]-4 -2 0 2 4 0.00 0.05 0.10 0.15 x f1[, 1]-4 -2 0 2 4 0.00 0.05 0.10 0.15 0.20 0.25 0.30 x f2[, 1]](https://static.fdocuments.us/doc/165x107/5f3c5356aa1d1f57795ed1b5/asymptotic-properties-of-bayesian-nonparametrics-and-05-10-15-x-f2-1-4.jpg)


![Series 1.0/2.3 (50 Ohm/75 Ohm) - Farnell element14 · Series 1.0/2.3 (50 Ohm/75 Ohm) RF Coax Connectors ... 2 GHz Reflection factor, referred to 50 ... Pitch 2.54 [0.10] Ø 1.5](https://static.fdocuments.us/doc/165x107/5ad930307f8b9a86378ba91d/series-1023-50-ohm75-ohm-farnell-1023-50-ohm75-ohm-rf-coax-connectors.jpg)

![123./*0() ˘FLEX...Ü m @ ¡ A 0.00 0.0 0.00 0.05 0.15 0.20 0.10 0.25 -0.05 fi fl fi fl Efi fl ‘RST 8 9 5 0.10 0.15 ]RST ]RST E]RST–!†‡ :!ÜmO¡U 0 20 0.25 0.30 ·a µa](https://static.fdocuments.us/doc/165x107/60b660f2f3e5e60452499947/1230-flex-oe-m-a-000-00-000-005-015-020-010-025-005-i.jpg)