
01 SHM532986 491.
22
http://shm.sagepub.com/ Structural Health Monitoring http://shm.sagepub.com/content/13/5/491 The online version of this article can be found at: DOI: 10.1177/1475921714532986 2014 13: 491 originally published online 13 May 2014 Structural Health Monitoring Yanfeng Shen and Victor Giurgiutiu guided wave propagation and interaction with damage WaveFormRevealer: An analytical framework and predictive tool for the simulation of multi-modal Published by: http://www.sagepublications.com can be found at: Structural Health Monitoring Additional services and information for http://shm.sagepub.com/cgi/alerts Email Alerts: http://shm.sagepub.com/subscriptions Subscriptions: http://www.sagepub.com/journalsReprints.nav Reprints: http://www.sagepub.com/journalsPermissions.nav Permissions: http://shm.sagepub.com/content/13/5/491.refs.html Citations: What is This? - May 13, 2014 OnlineFirst Version of Record - Aug 20, 2014 Version of Record >> by guest on August 20, 2014 shm.sagepub.com Downloaded from by guest on August 20, 2014 shm.sagepub.com Downloaded from
Transcript of 01 SHM532986 491.

http://shm.sagepub.com/Structural Health Monitoring
http://shm.sagepub.com/content/13/5/491The online version of this article can be found at:
DOI: 10.1177/1475921714532986
2014 13: 491 originally published online 13 May 2014Structural Health MonitoringYanfeng Shen and Victor Giurgiutiu
guided wave propagation and interaction with damageWaveFormRevealer: An analytical framework and predictive tool for the simulation of multi-modal
Published by:
http://www.sagepublications.com
can be found at:Structural Health MonitoringAdditional services and information for
http://shm.sagepub.com/cgi/alertsEmail Alerts:
http://shm.sagepub.com/subscriptionsSubscriptions:
http://www.sagepub.com/journalsReprints.navReprints:
http://www.sagepub.com/journalsPermissions.navPermissions:
http://shm.sagepub.com/content/13/5/491.refs.htmlCitations:
What is This?
- May 13, 2014OnlineFirst Version of Record
- Aug 20, 2014Version of Record >>
by guest on August 20, 2014shm.sagepub.comDownloaded from by guest on August 20, 2014shm.sagepub.comDownloaded from
Original Article
Structural Health Monitoring
2014, Vol. 13(5) 491–511
� The Author(s) 2014
Reprints and permissions:
sagepub.co.uk/journalsPermissions.nav
DOI: 10.1177/1475921714532986
shm.sagepub.com
WaveFormRevealer: An analyticalframework and predictive tool for thesimulation of multi-modal guided wavepropagation and interaction withdamage
Yanfeng Shen and Victor Giurgiutiu
AbstractThis article presents the WaveFormRevealer—an analytical framework and predictive tool for the simulation of guidedLamb wave propagation and interaction with damage. The theory of inserting damage effects into the analytical model isaddressed, including wave transmission, reflection, mode conversion, and nonlinear higher harmonics. The analyticalmodel is coded into MATLAB, and a graphical user interface (WaveFormRevealer graphical user interface) is developedto obtain real-time predictive waveforms for various combinations of sensors, structural properties, and damage. In thisarticle, the main functions of WaveFormRevealer are introduced. Case studies of selective Lamb mode linear and non-linear interaction with damage are presented. Experimental verifications are carried out. The article finishes with sum-mary and conclusions followed by recommendations for further work.
KeywordsGuided waves, structural health monitoring, damage detection, piezoelectric wafer active sensors, analytical model, non-linear ultrasonics
Introduction
Guided waves retain a central function in the develop-ment of structural health monitoring (SHM) systemsusing piezoelectric wafer active sensor (PWAS) princi-ples. The modeling of Lamb waves is challenging,because Lamb waves propagate in structures withmulti-mode dispersive characteristics. At a certainvalue of the plate thickness-frequency product, severalLamb modes may exist simultaneously, and their phasevelocities vary with frequency.1–3 When Lamb wavesinteract with damage, they will be transmitted,reflected, scattered, and mode converted. Nonlinearinteraction with damage may also exist, and this willintroduce distinctive features like higher harmonics.4–6
These aspects give rise to the complexity of modelingthe interaction between Lamb waves and damage. Tosolve such complicated problems, numerical methodslike finite element method (FEM) and boundary ele-ment method (BEM) are usually adopted. However, toensure the accuracy of simulating high-frequency wavesof short wavelengths, the transient analysis requiresconsiderably small time step and very fine mesh
(T=Dt; l=lFEM � 20 ; 30), which is expensive both incomputational time and computer resources.7,8
Analytical model provides an alternative approach toattack the same problem with much less cost.9
PWAS transducers are a convenient way of transmit-ting and receiving guided waves in structures for SHMapplications.3 The analytical model of PWAS-generatedLamb waves and its tuning effect has been investigated,and a close-form solution for straight crested guidedLamb wave was derived by Giurgiutiu.10 Extension oftuning concepts to 2D analytical models of Lamb wavesgenerated by finite-dimensional piezoelectric transdu-cers was given in Raghavan and Cesnik.11 These analy-tical developments facilitate the understanding ofPWAS-coupled Lamb waves for SHM applications.
Department of Mechanical Engineering, University of South Carolina,
Columbia, SC, USA
Corresponding author:
Yanfeng Shen, Department of Mechanical Engineering, University of South
Carolina, Columbia, SC 29208, USA.
Email: [email protected]
by guest on August 20, 2014shm.sagepub.comDownloaded from
However, these analytical solutions only applied toguided wave propagation in pristine structures, whereasthe use of Lamb waves in SHM applications requiresthat their interaction with damage also be studied.After interacting with damage, Lamb waves will carrydamage information resulting in waveforms with spe-cial characteristics (phase change, new wave packetsgeneration through mode conversion, higher harmoniccomponents, etc.), which need to be investigated fordamage detection.
Several investigators have studied the interactionbetween guided waves and damage analytically usingnormal-mode expansion and boundary-conditionmatching.12–18 Damage interaction coefficients werederived to quantify the guided wave transmission,reflection, mode conversion, and scatter at the damagesite. Due to their mathematical complexity, these analy-tical solutions are restricted to simple damage geome-tries: notches, holes, and partially through holes.Extension to more complicated damage geometries hasbeen attempted through series expansion of the ruggeddamage contour. In the generic case of arbitrary-shapedamage, the numerical approaches using space discreti-zation (FEM, BEM) are used due to their convenience,but on the expense of orders of magnitude increase incomputational time and/or computer resources.
The design of a SHM system requires computation-ally efficient predictive tools that permit the explorationof a wide parameter space to identify the optimal com-bination between the transducers type, size, number,and guided wave characteristics (mode type, frequency,and wavelength) to achieve best detection and quantifi-cation of a certain damage type. Such parameter spaceexploration desiderate can be best achieved with analy-tical tools which are fast and efficient.
In this article, we describe an analytical approachbased on the one-dimensional (1D) (straight crested)guided wave propagation analysis. In our study, weinserted the damage effect into the analytical model byconsidering wave transmission, reflection, mode con-version, and higher harmonics components describedthrough damage interaction coefficients at the damagesite. We do not attempt to derive these damage interac-tion coefficients here, but assume that they are availableeither from literature or from FEM, BEM analysis per-formed separately in a separate computational module.This analytical approach was coded into MATLABand the WaveFormRevealer (WFR) graphical userinterface (GUI) was developed. The WFR can generatefast predictions of waveforms resulting from Lambwave interaction with damage for arbitrary positioningof PWAS transmitters and receivers with respect todamage and with respect to each other. The users maychoose their own excitation signal, PWAS size, struc-tural parameters, and damage description. The current
version of the WFR code is limited to 1D (straightcrested) guided wave propagation; extension of thisapproach to two-dimensional (2D) (circular crested)guided wave propagation will be attempted in thefuture.
PWAS Fundamentals
PWAS couple the electrical and mechanical effects(mechanical strain, Sij; mechanical stress, Tkl; electricalfield, Ek ; and electrical displacement, Dj) through thetensorial piezoelectric constitutive equations
Sij ¼ sEijklTkl þ dkijEk
Dj ¼ djklTkl þ eTjkEk
ð1Þ
where sEijkl is the mechanical compliance of the material
measured at zero electric field (E ¼ 0), eTjk is the dielec-
tric permittivity measured at zero mechanical stress(T ¼ 0), and djkl represents the piezoelectric couplingeffect. PWAS utilize the d31 coupling between in-planestrains, S1; S2, and transverse electric field E3.
PWAS transducers can be used as both transmittersand receivers. Their modes of operation are shown inFigure 1. PWAS can serve several purposes3: (a) high-bandwidth strain sensors, (b) high-bandwidth waveexciters and receivers, (c) resonators, and (d) embeddedmodal sensors with the electromechanical (E/M) impe-dance method. By application types, PWAS transducerscan be used for (a) active sensing of far-field damageusing pulse-echo, pitch-catch, and phased-array meth-ods, (b) active sensing of near-field damage using high-frequency E/M impedance method and thickness gagemode, and (c) passive sensing of damage-generatingevents through detection of low-velocity impacts andacoustic emission at the tip of advancing cracks(Figure 1). The main advantage of PWAS over conven-tional ultrasonic probes is in their small size, light-weight, low profile, and small cost. In spite of theirsmall size, PWAS are able to replicate many of thefunctions performed by conventional ultrasonic probes.
Analytical modeling of Lamb wavesinteracting with damage
Analytical modeling of guided Lamb wavespropagation in a pristine structure
One aspect of the difficulties in modeling Lamb wavepropagation is due to their multi-mode feature. WFRis capable of modeling multi-mode Lamb wave propa-gation in structures. From Rayleigh–Lamb equation, itis found that the existence of certain Lamb modedepends on the plate thickness-frequency product. Thefundamental S0 and A0 modes will always exist, but
492 Structural Health Monitoring 13(5)
by guest on August 20, 2014shm.sagepub.comDownloaded from

the higher modes will only appear beyond the cutofffrequencies.1
This section describes how an electrical tone burstapplied to a transmitter PWAS (T-PWAS) transducerpropagates through a structural waveguide to the recei-ver PWAS (R-PWAS) transducer in pitch-catch mode(Figure 2).
The propagation takes place through ultrasonicguided Lamb waves which are generated at theT-PWAS through piezoelectric transduction and thencaptured and converted back into electric signal at theR-PWAS. Since several Lamb wave modes travelingwith different wave speeds exist simultaneously, theelectrical tone-burst applied on the T-PWAS will
generate several wave packets. These wave packets willtravel independently through the waveguide and willarrive at different times at the R-PWAS where they areconverted back into electric signals through piezoelec-tric transduction. The predictive analytical model forLamb wave propagation between the T-PWAS and R-PWAS is constructed in frequency domain in the fol-lowing steps (Figure 3(a)).
Step 1. Perform Fourier transform of the time-domainexcitation signal VT ðtÞ to obtain the frequency-domainexcitation spectrum, ~VT ðvÞ. For a tone burst, the signalVT ðtÞ and its Fourier transform ~VT ðvÞ are shown inFigure 4.
Step 2. Calculate the frequency-domain structural trans-fer function Gðxr;vÞ from T-PWAS to R-PWAS. Thestructure transfer function Gðxr;vÞ is given in equation(99) in the study by Giurgiutiu,3 page 327, which givesthe in-plane wave strain at the plate surface as
ex x; tð Þ ¼ �iat0
m
XjS
ðsin jSaÞNS jS� �
D0S jS� � e�i jSx�vtð Þ
8<:
þX
jA
ðsin jAaÞNA jA� �
D0A jA� � e�i jAx�vtð Þ
)ð2Þ
Figure 1. Schematic of PWAS application modes (from Giurgiutiu19): (a) propagating Lamb waves, (b) standing Lamb waves (E/Mimpedance), and (c) PWAS phased arrays.E/M: electromechanical; PWAS: piezoelectric wafer active sensor; AE: acoustic emission.
Piezoelectric transduction
Mech.→Elec.
Transmitter PWASExcitation: ( )TV ω
Piezoelectric transduction
Elec.→Mech.
Ultrasonic guided waves from T-PWAS undergo dispersion according to structural
transfer function ( ),rG x ω
Receiver PWAS Signal: ( ),R rV x ω
T-PWAS R-PWAS
x = 0 x=xr
Figure 2. A pitch-catch configuration between a transmitterPWAS (T-PWAS) and a receiver PWAS.PWAS: piezoelectric wafer active sensor.
Shen and Giurgiutiu 493
by guest on August 20, 2014shm.sagepub.comDownloaded from

where j is the frequency-dependent wavenumberof each Lamb wave mode and the superscripts S andA refer to symmetric and antisymmetric Lambwave modes. If only the two fundamental modes,S0 and A0, are present, then Gðxr;vÞ can be writtenas
G xr;vð Þ ¼ S vð Þe�ijS xr þ A vð Þe�ijAxr
S vð Þ ¼ kPWAS sin jSaNS jS� �
D0S jS� � ;
A vð Þ ¼ kPWAS sin jAaNA jA� �
D0A jA� � ð3Þ
Perform inverse Fourier transform
( ) ( ){ }, ,T r R rV x t IFFT V x ω= �
Mul�ply excita�on with structural transfer func�on
( ) ( ) ( ), ,R r r TV x G x Vω ω ω=� �i
Calcula�on of structural transfer func�on
( ),rG x ω
Fourier transform of excita�on signal
( ) ( )FFT
T TV t V ω→ �
This new wave source is mul�plied with structural transfer func�on from damage
upto R-PWAS
( ) ( ) ( ), , , ,R d r r d NewSource dV x x G x x V xω ω ω= − �� i
New wave source
( ),NewSource dV x ω�
Transmission, reflec�on, mode conversion, and
higher harmonics
Perform inverse Fourier transform
( ) ( ){ }, , , ,T d r R d rV x x t IFFT V x x ω=
Mul�ply excita�on with structural transfer func�on to the damage loca�on
( ) ( ) ( ), ,D d d TV x G x Vω ω ω=� �i
Calcula�on of structural transfer func�on up to damage loca�on
( ),dG x ω
Fourier transform of excita�on signal
( ) ( )FFT
T TV t V ω→ �
Flow chart for pris�ne caseguided wave propaga�on
Flow chart for guided wave propaga�on with damage interac�on
(a) (b)
Figure 3. WaveFormRevealer flow charts: (a) propagation in a pristine structural waveguide and (b) propagation and interactionwith damage at location xd.
494 Structural Health Monitoring 13(5)
by guest on August 20, 2014shm.sagepub.comDownloaded from

where
Ns jð Þ ¼ jb j2 þ b2� �
cosad cosbd;
Ds ¼ j2 � b2� �2
cosad sinbd þ 4j2ab sinad cosbd
NA jð Þ ¼�jb j2 þ b2� �
sinad sinbd;
DA ¼ j2 � b2� �2
sinad cosbd þ 4j2ab cosad sinbd
a2 ¼ v2
c2p
� j2; b2 ¼ v2
c2s
� j2; cp ¼ffiffiffiffiffiffiffiffiffiffiffiffiffiffiffilþ 2m
r
s;
cs ¼ffiffiffiffim
r
r; kPWAS ¼ �i
at0
mð4Þ
kPWAS is the complex transduction coefficient that con-verts applied voltage into guided wave strain at theT-PWAS, a is half length of PWAS size, and d is platehalf thickness. The modal participation functions SðvÞand AðvÞ determine the amplitudes of the S0 and A0wave modes. The terms sinðjSaÞ and sinðjAaÞ controlthe tuning between the PWAS transducer and theLamb waves. l and m are Lame’s constants of thestructural material, and r is the material density. Thewavenumber j of a specific mode for certain frequencyv is calculated from Rayleigh–Lamb equation
tanbd
tanad¼ �4abj2
j2 � b2� �2
" #61
ð5Þ
where +1 exponent corresponds to symmetric Lambwave modes and 21 exponent corresponds to antisym-metric Lamb wave modes.
Step 3. Multiply the structural transfer function byfrequency-domain excitation signal (Figure 4(b)) toobtain the frequency-domain signal at the R-PWAS,
that is, ~VRðxr;vÞ ¼ Gðxr;vÞ � ~VT ðvÞ. Hence, the wavearriving at the R-PWAS location is
~VR xr;vð Þ ¼ S vð Þ~VT ðvÞe�ijSxr þ A vð Þ~VT ðvÞe�ijAxr ð6Þ
This signal in equation (6) can be decomposed intosymmetric and antisymmetric components
~V SR xr;vð Þ ¼ S vð Þ~VT ðvÞe�ijSxr ð7Þ
~V AR xr;vð Þ ¼ A vð Þ~VT ðvÞe�ijAxr ð8Þ
Step 4. Perform the inverse Fourier transform toobtain the time-domain wave signal at the R-PWAS,that is
VRðxr; tÞ ¼ IFFTf~VRðxr;vÞg ð9Þ
Due to the multi-mode character of guided Lambwave propagation, the received signal has at least twoseparate wave packets, S0 and A0 (Figure 5).
This analysis can be extended to include higherguided wave modes (S1, A1, etc.), that is
Figure 4. Tone burst signal: (a) time domain and (b) frequency domain (From Giurgiutiu,3 p. 153).
Figure 5. (a) T-PWAS signal and (b) R-PWAS signal.T-PWAS: transmitter piezoelectric wafer active sensor; R-PWAS:
receiver piezoelectric wafer active sensor.
Shen and Giurgiutiu 495
by guest on August 20, 2014shm.sagepub.comDownloaded from

~VR xr;vð Þ ¼X
jS
S vð Þ~V T ðvÞe�ijS xr þX
jA
A vð Þ~V T ðvÞe�ijAxr
ð10Þ
All the wave modes propagate independently in thestructure. The final waveform will be the superpositionof all the propagating waves and will have the contribu-tion from each Lamb mode.
Insertion of damage effects into the analytical model
Figure 6 shows the pitch-catch active sensing methodfor damage detection: the T-PWAS transducer gener-ates ultrasonic guided waves which propagate into thestructure, interact with structural damage at x ¼ xd ,carry the damage information with them, and arepicked up by the R-PWAS transducer at x ¼ xr.
To model the damage effect on Lamb wave propa-gation, we consider the damage as a new wave sourceat x ¼ xd , and we add mode conversion and nonlinearsources at the damage location through damage inter-action coefficients. The predictive analytical model forLamb wave interaction with damage is constructed infrequency domain in the following steps:
Step 1. This step is identical to step 1 of the pristinecase. Perform Fourier transform of the time-domainexcitation signal VT ðtÞ to obtain the frequency-domainexcitation spectrum, ~VT ðvÞ.Step 2. Calculate the frequency-domain structural trans-fer function up to the damage location, Gðxd ;vÞ. Thestructure transfer function Gðxd;vÞ is similar to equa-tion (3) of previous section, only that x ¼ xd , that is
G xd ;vð Þ ¼ S vð Þe�ijSxd þ A vð Þe�ijAxd ð11Þ
Step 3. Multiply the structural transfer function byfrequency-domain excitation signal to obtain the
frequency-domain signal at the damage location, thatis, ~VDðxd ;vÞ ¼ Gðxd ;vÞ � ~VT ðvÞ. Hence, the signal atthe damage location is
~VD xd ;vð Þ ¼ S vð Þ~VT ðvÞe�ijSxd þ A vð Þ~VT ðvÞe�ijAxd ð12Þ
This signal could be decomposed into symmetric andantisymmetric components
~V SD xd ;vð Þ ¼ S vð Þ~VT ðvÞe�ijS xd ð13Þ
~V AD xd ;vð Þ ¼ A vð Þ~VT ðvÞe�ijAxd ð14Þ
Step 4. The wave signal at the damage location takesthe damage information by considering transmission,reflection, mode conversion, and higher harmonics.Each of these addition phenomena is modeled as a newwave source at the damage location using damageinteraction coefficients (Figure 7). We distinguish twodamage interaction types: (a) linear and (b) nonlinear,as discussed next.
Linear damage interaction. Wave transmission, reflection,and mode conversion are realized by using complex-amplitude damage interaction coefficients. Our nota-tions are as follows: we use three letters to describe theinteraction phenomena, with the first letter denotingthe incident wave type, the second letter standing forresulting wave type, and the third letter meaning propa-gation direction (transmission/reflection). For instance,symmetric-symmetric-transmission (SST) means theincident symmetric waves transmitted as symmetricwaves, while symmetric-antisymmetric-transmission(SAT) means incident symmetric waves transmitted andmode converted to antisymmetric waves. Thus, thecomplex-amplitude damage interaction coefficientCSST � e�iuSST denotes the transmitted symmetric modegenerated by incident symmetric mode with magnitude
Piezoelectric transduction
Mech.→Elec.
Transmitter PWASExcitation: ( )TV ω
Piezoelectric transduction
Elec.→Mech.
Nonlinear damage: new wave sourceTransmission, reflection, mode
conversion, and higher harmonics
Ultrasonic guided waves from T-
PWAS
Transfer function ( ),dG x ω
dx x= rx x=0x =
Receiver PWAS Signal:( ), ,R d rV x x ω
T-PWAS R-PWAS
Damage
with damage
Transfer function ( ),r dG x x ω−
information
Ultrasonic waves
Figure 6. A pitch-catch configuration between a transmitter PWAS and a receiver PWAS.PWAS: receiver piezoelectric wafer active sensor.
496 Structural Health Monitoring 13(5)
by guest on August 20, 2014shm.sagepub.comDownloaded from

CSST and phase uSST . Similarly, CSAT � e�iuSAT representsthe transmitted antisymmetric mode generated by inci-dent symmetric mode with magnitude CSAT and phaseuSAT . These coefficients are determined by the features ofthe damage and are to be imported into the WFR model.
Nonlinear damage interaction. The center frequency ofwaves arriving at the damage location can be obtainedfrom equations (13) and (14) as vc. The second andthird higher harmonics act as wave sources with centerfrequencies of 2vc and 3vc, respectively. Modeling ofhigher harmonics is achieved by moving the frequency-domain signal at the damage location to the right-handside of the frequency axis by vc and 2vc, that is,~V2Dðxd ;vÞ ¼ ~VDðxd ;v� vcÞ and ~V3Dðxd ;vÞ ¼~VDðxd ;v� 2vcÞ represent the second and third higherharmonics nonlinear wave source.
The nonlinear damage interaction coefficients aredefined in the same way as the linear ones. For instance,the complex-amplitude damage interaction coefficientCM
SST� e�iuM
SST denotes the Mth higher harmonics trans-mitted symmetric mode generated by incident sym-metric mode with magnitude CM
SSTand phase uM
SST.
Step 5. The guided waves from the new wave sources cre-ated at the damage location propagate through the restof the structure and arrive at the R-PWAS. The receivedwave signal is calculated in frequency domain as
~V R xd ; xr;vð Þ ¼Xm
M¼1
CMSST e�iuM
SST � ~V SMD xd ;vð Þ þ CM
AST e�iuMAST � ~V A
MD xd ;vð Þh i
e�ijS xr�xdð Þ
þXm
M¼1
CMAAT e�iuM
AAT � ~V AMD xd ;vð Þ þ CM
SAT e�iuMSAT � ~V S
MD xd ;vð Þh i
e�ijA xr�xdð Þð15Þ
whereM is the number of higher harmonics considered.For linear interaction with damage, M equals to one.
Step 6. Perform inverse Fourier transform to obtainthe time-domain receiver sensing signal
VRðxd ; xr; tÞ ¼ IFFTf~VRðxd ; xr;vÞg ð16Þ
It should be noted that the above analysis only con-siders S0 and A0 modes. But the principle could be eas-ily extended to higher modes (S1, A1, etc.). Thedifficulty with extending to higher modes will be ondefining the increasing number of transmission, reflec-tion, and mode conversion coefficients. For eachexcited Lamb mode, the interaction with damage mayresult in more mode conversion possibilities. In thisstudy, the WFR has been designed to simulate (a)multi-mode (S0, A0, S1, A1) Lamb waves propagationin pristine plates and (b) fundamental modes (S0 andA0) Lamb wave interaction with damage.
WFR interface and main functions
The analytical representation of this process was codedin MATLAB and resulted in the GUI called WFRshown in Figure 8.
Figure 7. Modeling wave transmission, reflection, mode conversion, and higher harmonics components.
Shen and Giurgiutiu 497
by guest on August 20, 2014shm.sagepub.comDownloaded from

WFR allows users to control several parameters:structure material properties, PWAS size, location ofsensors, location of damage, damage type (linear/non-linear damage of various severities), and excitation sig-nal (frequencies, count numbers, signal modeexcitation, arbitrary waveform type, etc.). Dual displayof waveforms allows for the sensing signals to be shownat two different sensor locations. For instance, Figure 8shows two receiver waveforms at locations x1 ¼ 0 mmand x2 ¼ 500 mm as measured from the transmitter (inthis case x1 ¼ 0 mm means that R-PWAS-1 collocatedwith the T-PWAS). Thus, PWAS-1 shows the reflec-tions from damage, and PWAS-2 shows the signalmodified after passing through the damage. Users areable to conduct fast parametric studies with WFR. Itmay take several hours for commercial finite elementsoftware to obtain an acceptable-accuracy solution forhigh-frequency, long distance propagating waves, but ittakes only several seconds to obtain the same solutionwith WFR. Besides analytical waveform solutions, theWFR can also provide users with wave speed
dispersion curves, tuning curves, frequency componentsof received wave packets, structure transfer function,and so on. All the calculated results are fully availableto the user, and could be saved in Excel files by clickingthe ‘‘SAVE’’ button. Figure 9 shows a case study forLamb wave propagation of a 100 kHz tone burst in a1-mm-thick aluminum plate. Figure 9(a) shows the dis-persion curves; Figure 9(b) shows the excitation spec-trum overlap with the S0 and A0 tuning curves. Figure9(c) shows the spectra of the S0 and A0 packets dis-playing frequency shifts to the right and to the left,respectively, due to the interaction between excitationspectrum and the tuning curves. Figure 9(d) shows thestructure transfer function Gðx;vÞ.
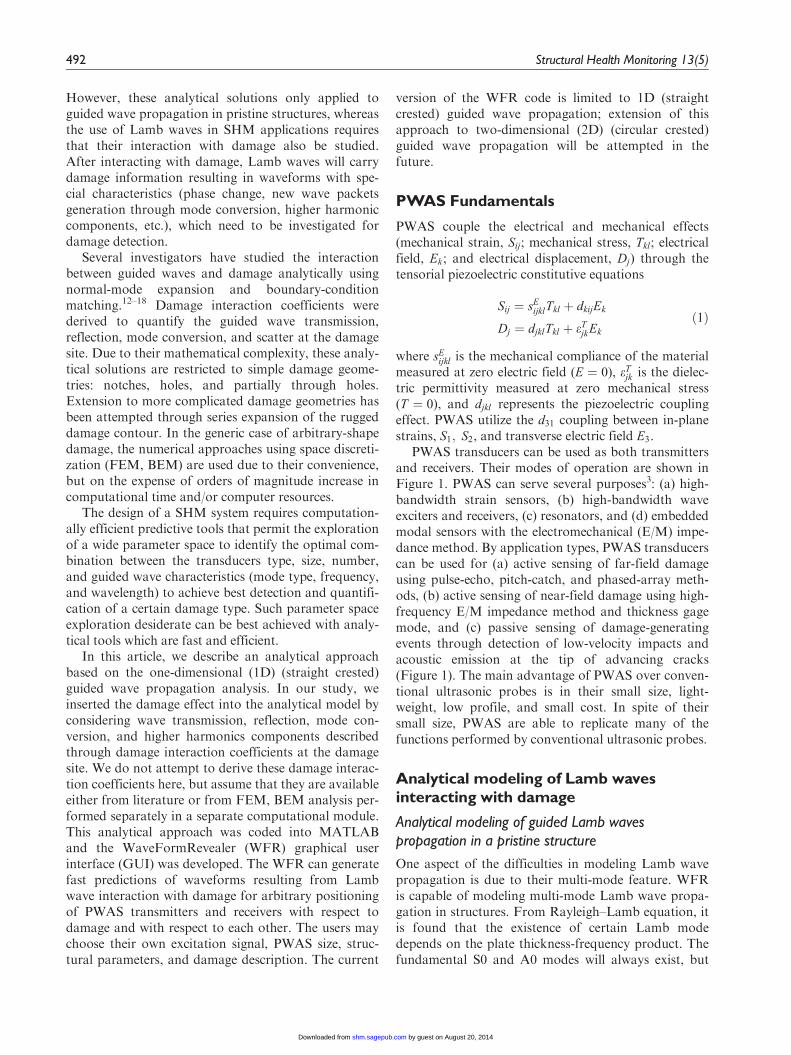
Besides the main interface, WFR has two sub-interfaces shown in Figure 10: (a) damage informationplatform and (b) guided wave spatial propagation sol-ver. The damage information platform allows users toinput the damage location and damage interactioncoefficients. For example, SST represents the magni-tude of transmitted S0 mode generated by an incoming
Figure 8. Main GUI of WaveFormRevealer.GUI: graphic user interface.
498 Structural Health Monitoring 13(5)
by guest on August 20, 2014shm.sagepub.comDownloaded from

S0 mode, whereas SAT and phi-SAT represent the mag-nitude and phase of the transmitted A0 mode resultingfrom the mode conversion of an incoming S0 mode. Thevalues of these damage interaction coefficients are notcalculated by the WFR. This gives the users the freedomto define their own specific problem. For instance, a par-ticular type of damage (plastic zone, fatigue, cracks)with certain degree of severity will have different interac-tion characteristics with the interrogating guided waves.These coefficients may be determined experimentally orcalculated through other methods (analytical, FEM,BEM, etc.). Among all the above methods, FEMapproach shows good results for obtaining the interac-tion coefficients of arbitrary shaped damage. Successfulexamples and details can be found in Velichko andWilcox20,21 and Moreau et al.22 In an example presentedlater in this study, we used a trial-and-error approach totune the WFR coefficients to the data obtained fromexperiments and finite element simulations.
The spatial propagation solver is like a B-scan. Usingthe analytical procedure, we obtain the time-domainwaveform solution at various locations along the struc-ture. Thus, the time-domain waveform solutions of asequence of points along the wave propagation path are
obtained. If we select the sequence of solution pointsfine enough, a time-spatial domain solution of the wavefield is obtained. The spatial solution of wave field at aparticular instance in time is available as shown inFigure 10(b). After the time-spatial solution of wavefield is obtained, we can do the frequency–wavenumberanalysis23 to see the wave components of the signal(Figure 11). These will be illustrated in the case studiesdiscussed later in this article.
Case studies
Linear interaction with damage of selective Lambwave modes
WFR allows users to select single mode (S0 and A0) ormulti-mode (S0 and A0) to be excited into the struc-ture. Three test cases were conducted: (a) incident S0wave linear interaction with damage, (b) incident A0wave linear interaction with damage, and (c) combinedS0 and A0 waves linear interaction with damage. Thetest case setup is shown in Figure 12. The T-PWAS andR-PWAS are placed 600 mm away from each other ona 1-mm-thick aluminum 2024-T3 plate. The damage is
(a)
0 2000 4000 6000 8000 100000
0.5
1
1.5
2x 10
4
f (kHz)
c (m
/s)
A0
S0
A1S3A3A2
S2
S1
0 200 400 600 800 10000
0.2
0.4
0.6
0.8
1
1.2
Frequency kHz
Nor
mal
ized
Am
plitu
de
S0
A0
Excitation
0 50 100 150 2000
0.2
0.4
0.6
0.8
1
1.2
Frequency kHz
Nor
mal
ized
Am
plitu
de
S0A0
Excitation 100 kHz
0 100 200 300 400 5000
0.5
1
1.5
Frequency kHz
Mag
nitu
de
(d)(c)
(b)
Figure 9. Calculation of various quantities in Lamb wave propagation: (a) wave speed dispersion curve, (b) tuning curve, (c)frequency contents of received wave packets, and (d) structure transfer function.
Shen and Giurgiutiu 499
by guest on August 20, 2014shm.sagepub.comDownloaded from
placed 200 mm from the T-PWAS. A 5-count Hanningwindow modulated tone burst centered at 100 kHz isused as the excitation. The time-domain and the time–frequency domain signals of the test cases are shown inFigure 13.
Figure 13 shows that new wave packets appear dueto the interaction between interrogation Lamb wavesand damage. Incident S0 wave will generate A0 wavefrom mode conversion at the damage, whereas incidentA0 wave will generate S0 wave from mode conversionat the damage. However, from the time-frequency anal-ysis, it could be observed that after linear interaction,the frequency spectrum of the waves still center aroundthe excitation frequency 100 kHz.
Nonlinear interaction with damage of selective Lambwave modes
As test cases for nonlinear interaction between Lambwaves and damage, three simulations were carried out:
Figure 10. User interfaces: (a) damage information platform and (b) guided wave spatial propagation solver.
Figure 11. Frequency–wavenumber display window.
500 Structural Health Monitoring 13(5)
by guest on August 20, 2014shm.sagepub.comDownloaded from

(a) incident S0 wave nonlinear interaction with damage,(b) incident A0 wave nonlinear interaction with dam-age, and (c) combined S0 and A0 waves nonlinear inter-action with damage. The test case setup is the same asshown in Figure 12, only the interaction with damage isnonlinear. The time signals and the time-frequencyanalysis of the test cases are shown in Figure 14.
It can be observed in Figure 14 that after nonlinearinteraction with the damage, the waveforms becomedistorted and contain distinctive nonlinear higher har-monics. For S0 waves which are less dispersive at thegiven frequency range, the nonlinear higher harmonicsstay inside the wave packet. However, for A0 waveswhich are dispersive at the given frequency range, the
higher harmonic components travel faster, leading theway and may escape from the fundamental wavepacket.
Experimental verifications
Multi-mode Lamb wave propagation in a pristineplate
In our study, two PWAS transducers were mounted ona 3.17-mm-thick aluminum 7075-T6 plate. Figure 15shows the experiment setup. The T-PWAS sends outultrasonic guided waves into the structure. The guidedwaves, that is, Lamb waves propagate in the plate,
0 50 100 150 200 250 300 350 400 450 500
-1
-0.5
0
0.5
1
Time domain signal from WFR
Time (microsecond)
Nor
mal
ized
am
plitu
de
Time-frequency domain signal
Time (microsecond)Fr
eque
ncy
(kH
z)0 50 100 150 200 250 300 350 400 450 500
0
100
200
300
400
500
0 50 100 150 200 250 300 350 400 450 500
-1
-0.5
0
0.5
1
Time domain signal from WFR
Time (microsecond)
Nor
mal
ized
am
plitu
de
Time-frequency domain signal
Time (microsecond)
Freq
uenc
y (k
Hz)
0 50 100 150 200 250 300 350 400 450 5000
100
200
300
400
500
0 50 100 150 200 250 300 350 400 450 500
-1
-0.5
0
0.5
1
Time domain signal from WFR
Time (microsecond)
Nor
mal
ized
am
plitu
de
Time-frequency domain signal
Time (microsecond)
Freq
uenc
y (k
Hz)
0 50 100 150 200 250 300 350 400 450 5000
100
200
300
400
500
Transmitted S0
Mode converted A0 from incident S0 wave
Mode converted S0 from incident A0 wave
Transmitted A0
S0 Excitation
A0 Excitation
S0 and A0 Excitation
Transmitted S0 Transmitted A0New packet from mode conversion at damage
(a)
(b)
(c)
Figure 13. Simulation of linear interaction between Lamb waves and damage: (a) S0 mode excitation, (b) A0 mode excitation, and(c) S0 and A0 modes excitation. It should be noted that no higher harmonics are observed.WFR: WaveFormRevealer.
200 mm
T-PWAS R-PWAS Damage
400 mm
Figure 12. Test case setup for pitch-catch Lamb wave interaction with damage.T-PWAS: transmitter piezoelectric wafer active sensor; R-PWAS: receiver piezoelectric wafer active sensor.
Shen and Giurgiutiu 501
by guest on August 20, 2014shm.sagepub.comDownloaded from

undergoing dispersion and are picked up by theR-PWAS. The Lamb waves are multi-modal, henceseveral wave packets appear in the received signal.Agilent 33120A Arbitrary Waveform Generator is usedto generate 3-count Hanning window modulated toneburst excitations. A Tektronix Digital Oscilloscope isused to record the experimental waveforms. The excita-tion frequency is increased from 300 to 600 kHz.
Corresponding plate material, thickness, PWAS size,and sensing location information is input into theWFR. The analytical waveforms of various frequenciesare obtained. Figure 16 shows the comparison betweenanalytical solution from WFR and experimental data.
It can be observed that at 300 kHz, only S0 and A0modes exist. The WFR solution matches well withexperimental data. At 450 kHz, S0 mode becomes more
dispersive; besides S0 and A0 modes, A1 mode starts topick up with highly dispersive feature. At 600 kHz, S0,A0, and A1 modes exist simultaneously. The simula-tion results and the experimental data have slight dif-ferences due to the fact that 1D analytical formulasand pin force excitation assumptions are used in thisstudy. To further validate WFR predictions, we alsoconducted 2D FEM simulation with pin force excita-tion (1D Lamb wave propagation simulation). Figure17 shows the comparison between WFR and FEMsimulations. It can be observed that the 300 and450 kHz waveforms match very well between WFRand FEM. Signals of 600 kHz also have reasonablygood agreement. It should be noted, even for 1D Lambwave propagation simulation, that the 600 kHz wavecomputation requires considerably small element sizeand time marching step. The FEM simulation for suchhigh-frequency, short-wavelength situation is becomingprohibitive due to the heavy consumption of computa-tion time and computer resources. On the contrary,WFR only requires several seconds to obtain the sameresults due to its highly efficient analytical formulation.
The guided wave spatial propagation solver in WFRis used to obtain the time–space wave field (B-scan) asshown in Figure 18(a). The frequency–wavenumberanalysis is conducted next, as shown in Figure 18(b).
0 50 100 150 200 250 300 350 400 450 500
-1
-0.5
0
0.5
1
Time domain signal from WFR
Time (microsecond)
Nor
mal
ized
am
plitu
de
Time-frequency domain signal
Time (microsecond)
Freq
uenc
y (k
Hz)
0 50 100 150 200 250 300 350 400 450 5000
100
200
300
400
500
0 50 100 150 200 250 300 350 400 450 500
-1
-0.5
0
0.5
1
Time domain signal from WFR
Time (microsecond)
Nor
mal
ized
am
plitu
de
Time-frequency domain signal
Time (microsecond)
Freq
uenc
y (k
Hz)
0 50 100 150 200 250 300 350 400 450 5000
100
200
300
400
500
0 50 100 150 200 250 300 350 400 450 500
-1
-0.5
0
0.5
1
Time domain signal from WFR
Time (microsecond)
Nor
mal
ized
am
plitu
de
Time-frequency domain signal
Time (microsecond)
Freq
uenc
y (k
Hz)
0 50 100 150 200 250 300 350 400 450 5000
100
200
300
400
500
S0 Excitation
A0 Excitation
S0 and A0 Excitation
Transmitted S0 with distortion
Mode converted A0 from incident S0 wave
Mode converted S0 with distortion from incident A0 Transmitted A0
Transmitted S0 with distortion
New packet from mode conversion at damage Transmitted A0
Distinctive nonlinear higher harmonics
(a)
(b)
(c)
Dispersive A0 mode generated from mode
conversion from S0 wave
Dispersive transmitted A0 wave
Figure 14. Simulation of nonlinear interaction between Lamb waves and damage: (a) S0 mode excitation, (b) A0 mode excitation,and (c) S0 and A0 modes excitation. It should be noted that distinctive higher harmonics are observed.WFR: WaveFormRevealer.
R-PWAST-PWAS303 mm propagation path
Figure 15. Experiment setup for multi-mode Lamb wavepropagation.WFR: WaveFormRevealer.
502 Structural Health Monitoring 13(5)
by guest on August 20, 2014shm.sagepub.comDownloaded from

The 600 kHz case is used as an example. From the B-scan, S0, A0, and A1 wave components can beobserved. Frequency–wavenumber analysis gives veryclear information on the wave mode components of thewave field. Transmitted S0 wave (S0-T), A0 wave(A0-T), and A1 wave (A1-T) are clearly noticed inFigure 18(b).
Linear interaction between Lamb waves and damage
Pitch-catch mode. Figure 19 shows the experimental spe-cimen (3.17-mm-thick Aluminum-7075-T6 plate), withPWAS #3 used as the transmitter (T-PWAS) andPWAS #4 used as the receiver (R-PWAS). A notch(h1 ¼ 2:5 mm; d1 ¼ 0:25 mm) is machined on the plate,143.5 mm from the T-PWAS. The wave propagationpath from T-PWAS to R-PWAS is 303 mm. The 3-count Hanning window modulated tone burst signalswith center frequencies varying from 150 to 300 kHzare used as the excitation.
S0 and A0 waves are transmitted by the T-PWAS.At the notch, S0 waves will be transmitted as S0 waves
and also will be mode converted to transmitted A0waves. A0 waves will be transmitted as A0 waves andalso will be mode converted to transmitted S0 waves.All these transmitted waves will propagate along therest of the structure and be picked up by the R-PWAS.The damage interaction coefficients are physicallydetermined by the size, severity, type of the damage. Inthis study, we used a trial-and-error approach to tunethe WFR damage interaction coefficients to the dataobtained from the experiments. The adjusted damageinteraction coefficients which gave best match withexperiments for 150 kHz excitation case are shown inTable 1.
Figure 20 shows the WFR simulation results com-pared with experiments. It can be noticed that the ana-lytical waveforms agree well with experimental data. Anew wave packet is generated due to mode conversionat the notch.
Pulse-echo mode. Figure 21 shows the experimentalsetup for pulse-echo active sensing method. The samespecimen is used, with an R-PWAS bounded side by
0 20 40 60 80 100 120 140 160 180
-1
-0.5
0
0.5
1 ExperimentWFR
0 20 40 60 80 100 120 140 160 180
-1
-0.5
0
0.5
1 ExperimentWFR
0 20 40 60 80 100 120 140 160 180
-1
-0.5
0
0.5
1
Time (microsecond)
ExperimentWFR
450 kHz
600 kHz
300 kHz
Nor
mal
ized
Am
plitu
de
S0 A0
S0 dispersive wave A0 A1 dispersive wave
S0 dispersive wave A0
A1 dispersive wave
Figure 16. Comparison between WFR and experiment for multi-mode Lamb wave propagation in a pristine 3.17-mm aluminumplate.WFR: WaveFormRevealer.
Shen and Giurgiutiu 503
by guest on August 20, 2014shm.sagepub.comDownloaded from

side to the T-PWAS. The 3-count Hanning windowmodulated tone burst signals with the center frequencyof 95.5 kHz is used as the excitation. Guided Lamb
waves generated by the T-PWAS will propagate intothe structure, reach the notch, and be reflected back asechoes. At the notch, S0 waves will be reflected as S0
0 20 40 60 80 100 120 140 160 180
-1
-0.5
0
0.5
1 WFRFEM
0 20 40 60 80 100 120 140 160 180
-1
-0.5
0
0.5
1 WFRFEM
0 20 40 60 80 100 120 140 160 180
-1
-0.5
0
0.5
1
Time (microsecond)
WFRFEM
450 kHz
600 kHz
Nor
mal
ized
Am
plitu
de
300 kHz
Figure 17. Comparison between WFR and FEM for multi-mode Lamb wave propagation in a pristine 3.17-mm aluminum plate.WFR: WaveFormRevealer; FEM: finite element method.
(a) Time-Space Domain Signal
Time (microsecond)
Spa
ce (m
m)
0 20 40 60 80 100 1200
50
100
150
200
250
300Frequency-Wavenumber Domain Signal
Frequency (kHz)
Wav
enum
ber
S0-T
S0-R
A0-T
A0-R
S1-T
S1-R
A1-T
A1-R
0 500 1000 1500 2000-2000
-1000
0
1000
2000(b)
S0
A0
A1
Time-space wave field (B-scan) Frequency-wavenumber analysis
Figure 18. (a) Time–space wave field (B-scan) and (b) frequency–wavenumber analysis from WFR.WFR: WaveFormRevealer.
504 Structural Health Monitoring 13(5)
by guest on August 20, 2014shm.sagepub.comDownloaded from

0 20 40 60 80 100 120 140 160 180
-1
-0.5
0
0.5
1 ExperimentWFR
0 20 40 60 80 100 120 140 160 180
-1
-0.5
0
0.5
1ExperimentWFR
0 20 40 60 80 100 120 140 160 180
-1
-0.5
0
0.5
1ExperimentWFR
0 20 40 60 80 100 120 140 160 180
-1
-0.5
0
0.5
1
Time (microsecond)
ExperimentWFR
A0S0
New packet from mode conversion (S0+A0)
150 kHz
200 kHz
250 kHz
300 kHz
New packet from mode conversion (S0+A0)
Nor
mal
ized
Am
plitu
de
Figure 20. Comparison between WFR simulations and experiments for Lamb wave interaction with a notch in pitch-catch mode.WFR: WaveFormRevealer.
Figure 19. Experiment for Lamb wave linear interaction with a notch (pitch-catch mode).T-PWAS: transmitter piezoelectric wafer active sensor; R-PWAS: receiver piezoelectric wafer active sensor.
Shen and Giurgiutiu 505
by guest on August 20, 2014shm.sagepub.comDownloaded from

waves and also will be mode converted to reflected A0waves. A0 waves will be reflected as A0 waves and alsowill be mode converted to reflected S0 waves. All theechoes will reach the R-PWAS and be picked up.
The adjusted damage interaction coefficients whichgave best match with the experiment are shown inTable 2.
Figure 22 shows the WFR simulation result com-pared with the experiment. The reflected S0 and A0wave packets could be observed. The new wavesbetween S0 and A0 wave packets are from mode
conversion at the notch. The analytical simulationmatches the experiment data. Differences are noticed:first, the direct waves have a phase shift due to the factthat the R-PWAS and T-PWAS are some distanceaway from each other, while in our analytical model,we consider them to be at the same location; second,the boundary reflections are present and mixed withthe weak echoes from the notch in the experiment, butin our model, the boundary reflections are notconsidered.
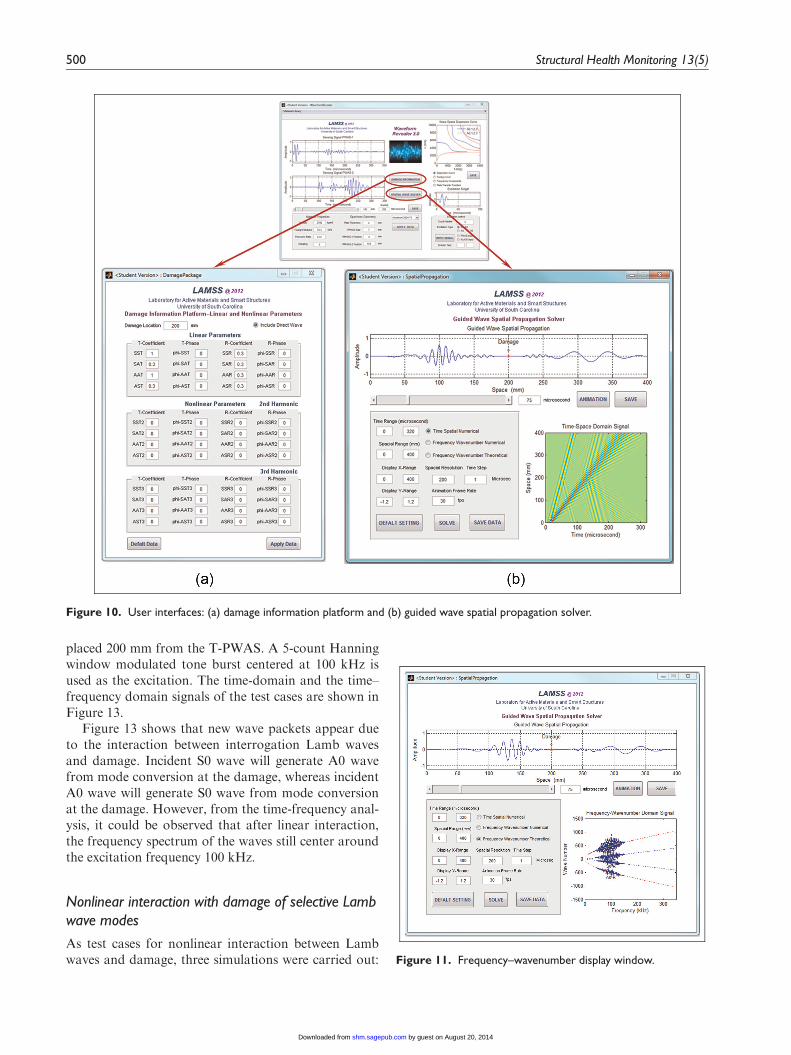
Figure 23 shows the results from WFR spatial pro-pagation solver. The wave transmission, reflection, andmode conversion can be clearly noticed in both the B-scan and frequency–wavenumber analysis. It is appar-ent that the wave field contains transmitted S0 and A0modes, and reflected S0 and A0 modes.
Nonlinear interaction between Lamb waves anddamage
A guided wave pitch-catch method may be used tointerrogate a plate with a breathing crack which opensand closes under tension and compression.6,24 Theultrasonic waves generated by the T-PWAS propagateinto the structure, interact with the breathing crack,acquire nonlinear features, and are picked up by the R-PWAS. This process is shown in Figure 24. The non-linear interaction between Lamb waves and the breath-ing crack will introduce nonlinear higher harmonicsinto the interrogation waves. A multi-physics transientfinite element model was used to simulate the Lambwave interaction with a nonlinear breathing crack. Thedamage interaction coefficients obtained from fittingthe FEM solution (Table 3) were input into the WFRsimulator.
Figure 25 shows the comparison between FEM andthe WFR analytical solution. It is noticed that theFEM results and the analytical solution agree very wellbecause the damage interaction coefficients were fittedto the FEM solution. The time-domain waveformsshow nonlinear characteristics of noticeable nonlinear
0 50 100 150 200 250 300
-0.2
-0.1
0
0.1
0.2
Time (microsecond)
Nor
mal
ized
am
plitu
de ExperimentWFR
ReflectedS0 ReflectedA0
Wave packet from mode conversion Boundary reflections
Direct waves
Figure 22. Comparison between WFR simulations and experiments for Lamb wave interaction with a notch in pulse-echo mode.WFR: WaveFormRevealer.
143.5 mm T-PWAS
R-PWAS Notch
Figure 21. Experiment for Lamb wave linear interaction with anotch (pulse-echo mode).T-PWAS: transmitter piezoelectric wafer active sensor; R-PWAS:
receiver piezoelectric wafer active sensor.
Table 2. Damage interaction coefficients for pulse-echo mode.
Magnitude coefficient C1SSR C1
SAR C1AAR C1
ASRValue (normalized) 0.2 0.04 0.12 0.04Phase coefficient u1
SSR u1SAR u1
AAR u1ASR
Value (�) 60 60 260 60
Table 1. Damage interaction coefficients for pitch-catch mode.
Magnitude coefficient C1SST C1
SAT C1AAT C1
ASTValue (normalized) 0.55 0.11 0.8 0.06Phase coefficient u1
SST u1SAT u1
AAT u1AST
Value (�) 230 30 0 30
506 Structural Health Monitoring 13(5)
by guest on August 20, 2014shm.sagepub.comDownloaded from
distortion in S0 packet and zigzags in the new packet.The frequency spectrums show distinctive nonlinearhigher harmonics (200 and 300 kHz). Since we onlyconsider up to the third higher harmonic in this casestudy, the frequency domain of analytical solutionshows only the first three peaks, while the finite elementsolution have even higher harmonics. But the solutionup to the third higher harmonics is accurate enough torender an acceptable waveform in time domain.
The guided wave spatial propagation solver in WFRwas used to obtain the time–space wave field. Figure 26shows the time–space wave field and frequency–wavenumber analysis of Lamb wave interaction withnonlinear breathing crack.
Transmission, reflection, and mode conversion phe-nomena at the damage can be clearly noticed. Thefrequency–wavenumber analysis reveals the wave com-ponents during the interaction process. The wave fieldcontains transmitted S0 and A0 waves and reflected S0and A0 waves. Nonlinear higher harmonics can beobserved at 200 kHz.
The WFR-guided wave spatial propagation solvercan provide the spatial wave pattern at any instance oftime. The spatial waveforms at 0, 25, 50, 75, 100, 125,150, 175, and 200 ms are displayed in Figure 27. Thespatial waveforms shows (a) Lamb waves propagatinginto the structure at T ¼ 25 ms, (b) Lamb modes separ-ating into distinct packets at T ¼ 50 ms, (c) Lamb wave
Time (microsecond)
Spa
ce (m
m)
0 50 1000
50
100
150
200
250
300
Frequency (kHz)
Wav
enum
ber S0-T
S0-R
A0-T
A0-R
0 100 200 300 400 500-1500
-1000
-500
0
500
1000
1500
Damage
SST
SAT
AST AAT
SSR
SARASR AAR
Forward transmission through damage
Backward reflection from damage
(a) (b)
Figure 23. (a) Time–space domain solution (B-scan) and (b) frequency–wavenumber analysis from WFR with transmission,reflection, and mode conversion damage effects.WFR: WaveFormRevealer.
T-PWAS R-PWAS Breathing crack
……..Generation of higher harmonics
Figure 24. Pitch-catch method for the detection of breathing crack; the mode conversion at the crack is illustrated by the twoarrows.T-PWAS: transmitter piezoelectric wafer active sensor; R-PWAS: receiver piezoelectric wafer active sensor.
Table 3. Nonlinear interaction coefficients.
Magnitude coefficient C1SST C1
SAT C1AAT C1
AST C2SST C2
SAT C2AAT C2
AST C3SST C3
SAT C3AAT C3
ASTValue (normalized) 0.900 0.420 0.820 0.100 0.082 0.100 0.050 0.110 0.032 0.038 0.005 0.025Phase coefficient u1
SST u1SAT u1
AAT u1AST u2
SST u2SAT u2
AAT u2AST u3
SST u3SAT u3
AAT u3AST
Value (�) 0 100 235 90 0 0 120 90 0 0 0 0
Shen and Giurgiutiu 507
by guest on August 20, 2014shm.sagepub.comDownloaded from

0 50 100 150 200 250 300 350
-1
-0.5
0
0.5
1
Time (microsecond)
Nor
mal
ized
am
plitu
de
0 200 400 600 800 1000
10-5
100
Frequency (kHz)
Mag
nitu
de
0 200 400 600 800 1000
10-5
100
Frequency (kHz)0 200 400 600 800 1000
100
Frequency (kHz)
WFR
FEM
FEM
WFR
FEM FEM
WFR WFR
Distorted S0 New wave packet from nonlinear interaction
A0 Waveform with zigzags
(a)
(b) (c) (d)
Figure 25. (a) Comparison between finite element simulation (FEM) and analytical simulation (WFR), (b) frequency spectrum of S0packet, (c) frequency spectrum of new packet and (d) frequency spectrum of A0 packet.WFR: WaveFormRevealer; FEM: finite element method.
Frequency (kHz)
Wav
e N
umbe
r
S0-T
S0-R
A0-T
A0-R
0 50 100 150 200 250 300 350-1500
-1000
-500
0
500
1000
1500
Time (microsecond)
Spa
ce (m
m)
0 50 100 150 200 250 3000
100
200
300
400
500
Damage
Nonlinear higher harmonics Forward transmission
through damage
Backward reflection from damage
(a) (b)
Figure 26. (a) Time–space wave field (B-scan) and (b) frequency–wavenumber analysis from WFR.WFR: WaveFormRevealer.
508 Structural Health Monitoring 13(5)
by guest on August 20, 2014shm.sagepub.comDownloaded from

0 50 100 150 200 250 300 350 400 450 500-1
0
1Damage
↓
0 50 100 150 200 250 300 350 400 450 500-1
0
1Damage
↓
0 50 100 150 200 250 300 350 400 450 500-1
0
1Damage
↓
0 50 100 150 200 250 300 350 400 450 500-1
0
1Damage
↓
0 50 100 150 200 250 300 350 400 450 500-1
0
1Damage
↓
0 50 100 150 200 250 300 350 400 450 500-1
0
1Damage
↓
0 50 100 150 200 250 300 350 400 450 500-1
0
1Damage
↓
Space (mm)
0 50 100 150 200 250 300 350 400 450 500-1
0
1Damage
↓
T = 0 μs
T = 25 μs
T = 50 μs
T = 75 μs
T = 100 μs
T = 125 μs
T = 150 μs
T = 200 μs
Waves propagating into the structure; S0 and A0 mixed together
S0 and A0 model separation
S0
S0 wave interacting with damage
A0
Transmitted S0
Transmitted A0 from mode conversion
Transmitted S0 New wave packet from mode conversion
A0 wave interacting with damage
Reflected S0
Reflected A0 from mode conversion
New wave packet from mode conversion containing both S0 and A0 modes
Transmitted A0
Reflected S0 from mode conversion
Reflected A0
Reflected A0 from mode conversion
Reflected S0 from mode conversion
Reflected A0 Transmitted A0
Nor
mal
ized
Am
plitu
de
Figure 27. Spatial wave propagation of Lamb wave interaction with breathing crack (calculated using WFR).WFR: WaveFormRevealer.
Shen and Giurgiutiu 509
by guest on August 20, 2014shm.sagepub.comDownloaded from

packets interaction with the damage also at T ¼ 50 ms,and (d) wave transmission, reflection, mode conversion,and nonlinear distortion of waveforms at variousinstances (T ¼ 75; 100; 125; 150; and 200 ms).
Summary, conclusions, and future work
Summary
In this study, we presented the WFR—an analyticalframework and predictive tool for the simulation ofguided Lamb wave interaction with damage. The the-ory of inserting damage effects into the analyticalmodel was addressed, including wave transmission,reflection, mode conversion, and nonlinear higher har-monics components. The analytical model was codedinto MATLAB, and the WFR GUI was developed toobtain fast predictive waveforms for arbitrary combi-nations of sensors, structural properties, and damage.Main functions of WFR were introduced, including thecalculation for dispersion curves, tuning curves, fre-quency spectrum of sensing signal, plate transfer func-tion, time–space domain waveforms with damageeffects, frequency–wavenumber analysis, and the capa-bility of considering arbitrary user defined excitationsignals. Test cases were carried out. Experimental veri-fications were presented. The predictive solution fromWFR agreed well with experiments and finite elementsimulations. WFR can be downloaded from: http://www.me.sc.edu/Research/lamss/html/software.html.
Conclusion
The WFR was capable of calculating dispersion curves,tuning curves, frequency components of wave packets,and structural transfer function. It could be used toobtain time–space domain waveforms with damageeffects and frequency–wavenumber analysis. WFRcould provide fast predictive solutions for multi-modeLamb wave propagation and interaction with linear/nonlinear damage. The solutions compared well withexperiments and finite element simulations. It was alsofound that computational time savings of several ordersof magnitude are obtained by using the analyticalmodel WFR instead of FEM methods. WFR allowedusers to conduct fast parametric studies with their owndesigned materials, geometries, and excitations.
Future work
Rational methods for determining damage interactioncoefficient values need to be found (not trial and error).Work should be carried out to extend the analysis to2D wave propagation (three-dimensional (3D) FEMand 2D WFR). The 2D WFR with damping effect
should be built to simulate wave attenuation in wave-guides. Boundary reflection and damage effects in 2Dwave propagation should be investigated. Attempts forsimulating guided wave propagation in compositestructures should be made using WFR.
Declaration of conflicting interests
The authors declare that there is no conflict of interest.
Funding
The following funding supports for this study are thankfullyacknowledged: Office of Naval Research # N00014-11-1-0271, Dr. Ignacio Perez, Technical Representative; Air ForceOffice of Scientific Research # FA9550-11-1-0133, Dr. DavidStargel, Program Manager.
References
1. Graff KF. Wave motion in elastic solids. New York:
Dover publications, Inc., 1991.2. Rose JL. Ultrasonic waves in solid media. Cambridge:
Cambridge University Press, 1999.3. Giurgiutiu V. Structural health monitoring with piezoelec-
tric wafer active sensors. Oxford, UK: Elsevier Academic
Press, 2007.4. Jhang KY. Nonlinear ultrasonic techniques for nondes-
tructive assessment of micro damage in material: a
review. Int J Precis Eng Man 2009; 10: 123–135.5. Dutta D, Sohn H and Harries KA. A nonlinear acoustic
technique for crack detection in metallic structures. Struct
Health Monit 2009; 8: 251–262.6. Shen Y and Giurgiutiu V. Simulation of interaction
between Lamb waves and cracks for structural health
monitoring with piezoelectric wafer active sensors. In:
Proceedings of the ASME 2012 conference on smart mate-
rials, adaptive structures and intelligent systems, Stone
Mountain, GA, 19–21 September 2012. New York:
ASME.7. Moser F, Jacobs LJ and Qu J. Modeling elastic wave pro-
pagation in waveguides with the finite element method.
NDT&E Int 1999; 32: 225–234.8. Gresil M, Shen Y and Giurgiutiu V. Predictive modeling
of ultrasonics SHM with PWAS transducers. In: Proceed-
ings of the 8th international workshop on structural health
monitoring, Stanford, CA, 13–15 September 2011.
9. Giurgiutiu V, Gresil M, Lin B, et al. Predictive modeling
of piezoelectric wafer active sensors interaction with high-
frequency structural waves and vibration. Acta Mech
2012; 223: 1681–1691.10. Giurgiutiu V. Tuned Lamb wave excitation and detection
with piezoelectric wafer active sensors for structural health
monitoring. J Intel Mat Syst Str 2005; 16: 291–305.11. Raghavan A and Cesnik CES. Finite-dimensional piezo-
electric transducer modeling for guided wave based struc-
tural health monitoring. Smart Mater Struct 2005; 14:
1448–1461.12. Norris AN and Vemula C. Scattering of flexual waves in
thin plates. J Sound Vib 1995; 181: 115–125.
510 Structural Health Monitoring 13(5)
by guest on August 20, 2014shm.sagepub.comDownloaded from

13. Vemula C and Norris AN. Flexual wave propagationand scattering on thin plates using Mindlin theory. Wave
Motion 1997; 26: 1–12.14. McKeon JCP and Hinders MK. Lamb waves scattering
from a through hole. J Sound Vib 1999; 224: 843–862.15. Hinders MK. Lamb wave scattering from rivets. In:
Thompson DO and Chimenti DE (eds) Review of prog-
ress in quantitative nondestructive evaluation, vol. 15A.New York: Plenum Press, 1996, pp. 209–216.
16. Grahn T. Lamb wave scattering from a circular partlythrough-thickness hole in a plate. Wave Motion 2002; 37:63–80.
17. Moreau L, Caleap M, Velichko A, et al. Scattering ofguided waves by flat-bottomed cavities with irregularshapes. Wave Motion 2012; 49: 375–387.
18. Moreau L, Caleap M, Velichko A, et al. Scattering ofguided waves by through-thickness cavities with irregular
shapes. Wave Motion 2011; 48: 586–602.19. Giurgiutiu V. Structural health monitoring with piezo-
electric wafer active sensors—predictive modeling andsimulation. INCAS Bull 2010; 2: 31–44.
20. Velichko A and Wilcox P. Efficient finite element model-
ing of elastodynamic scattering from near surface and
surface-breaking defects. AIP Conf Proc 2011; 1335: 59–
66.21. Velichko A and Wilcox P. Efficient finite element model-
ing of elastodynamic scattering with non-reflective
boundary conditions. AIP Conf Proc 2012; 1430: 142–
149.22. Moreau L, Velichko A and Wilcox P. Accurate finite ele-
ment modelling of guided wave scattering from irregular
defects. NDT&E Int 2012; 45: 46–54.23. Ruzzene M. Frequency-wavenumber domain filtering for
improved damage visualization. Smart Mater Struct
2007; 16: 2116–2129.24. Shen Y and Giurgiutiu V. Predictive simulation of non-
linear ultrasonics. In: Proceedings of the 2012 SPIE smart
structures and materials & nondestructive evaluation and
health monitoring, San Diego, CA, 11–15 March 2012.
Washington, USA: SPIE.
Shen and Giurgiutiu 511
by guest on August 20, 2014shm.sagepub.comDownloaded from


![ERTH 491-01 / GEOP 572-02 Geodetic Methods [20pt] · PDF fileSandwell et al., 2011, GMTSAR documentation assume parallel paths: B ... ERTH 491-01 / GEOP 572-02 Geodetic Methods [20pt]](https://static.fdocuments.us/doc/165x107/5ab661e77f8b9ab7638d9cd2/erth-491-01-geop-572-02-geodetic-methods-20pt-et-al-2011-gmtsar-documentation.jpg)


