01 Project Management - College of Charlestonhodgesh.people.cofc.edu/DSCI304/PPT/01 Project...
29
Lesson 01 – Project Management Copyright – Harland E. Hodges, Ph.D 01- 01 - 1 planning, preparing, and coordinating efforts to a accomplish a specific set of objectives Lesson 01 Project Management 01 - 2 A Project is a unique one time operation designed to accomplish a specific set of tasks in a limited time frame. . Olympic Games . Producing a movie . Software development . Product development . ERP implementation Leadership/Participation in a successful project will enhance your opportunities for career advancement! Typically success is defined by . On time . Within budget Project 01 - 3 Managers have day to day operations as well as routine projects with which to deal. Some typical projects include: . New product design . Updating old products . Marketing and advertising campaigns . Information system development . Quality improvement . Process improvement . Location selection, etc. Doing day to day activities and routine projects will get you a “met expectations” on your performance review. Day To Day Activities & Projects
Transcript of 01 Project Management - College of Charlestonhodgesh.people.cofc.edu/DSCI304/PPT/01 Project...

Lesson 01 – Project Management
Copyright – Harland E. Hodges, Ph.D 01-
01 - 1
planning, preparing, and coordinating efforts to a accomplish a specific set of objectives
Lesson 01Project Management
01 - 2
A Project is a unique one time operation designed to accomplish a specific set of tasks in a limited time frame.
. Olympic Games
. Producing a movie
. Software development
. Product development
. ERP implementation
Leadership/Participation in a successful project will enhance your opportunities for career advancement!
Typically success is defined by. On time. Within budget
Project
01 - 3
Managers have day to day operations as well as routine projects with which to deal. Some typical projects include:
. New product design
. Updating old products
. Marketing and advertising campaigns
. Information system development
. Quality improvement
. Process improvement
. Location selection, etc.
Doing day to day activities and routine projects will get you a “met expectations” on your performance review.
Day To Day Activities & Projects
Lesson 01 – Project Management
Copyright – Harland E. Hodges, Ph.D 01-
01 - 4
Those projects which are non-routine continual improvement projects are usually undertaken as a company initiative. However, no matter what your position in the organization, you have an opportunity to develop projects within your sphere of influence. These non-routine projects which add value to your organization will also add value to your career.
Projects which are undertaken outside of the normal routine day to day activities will set you apart from your peers. It is also what many superiors will use to evaluate you as a person who “exceeds expectations” or “does superior work”.
In my opinion, this is the secret to success!
Continual Improvement Projects
01 - 5
Size - some projects are larger than others and have thousands of complex, large components requiring careful planning and coordination. Projects typically have a specified time-frame and a budget for costs. All projects require
. Goals
. Priorities
. Activities & tasks .. time estimates.. responsibility assignments
. Planning
. Scheduling
. Coordinating
. Resolving conflict
. Monitoring
Project Issues
01 - 6
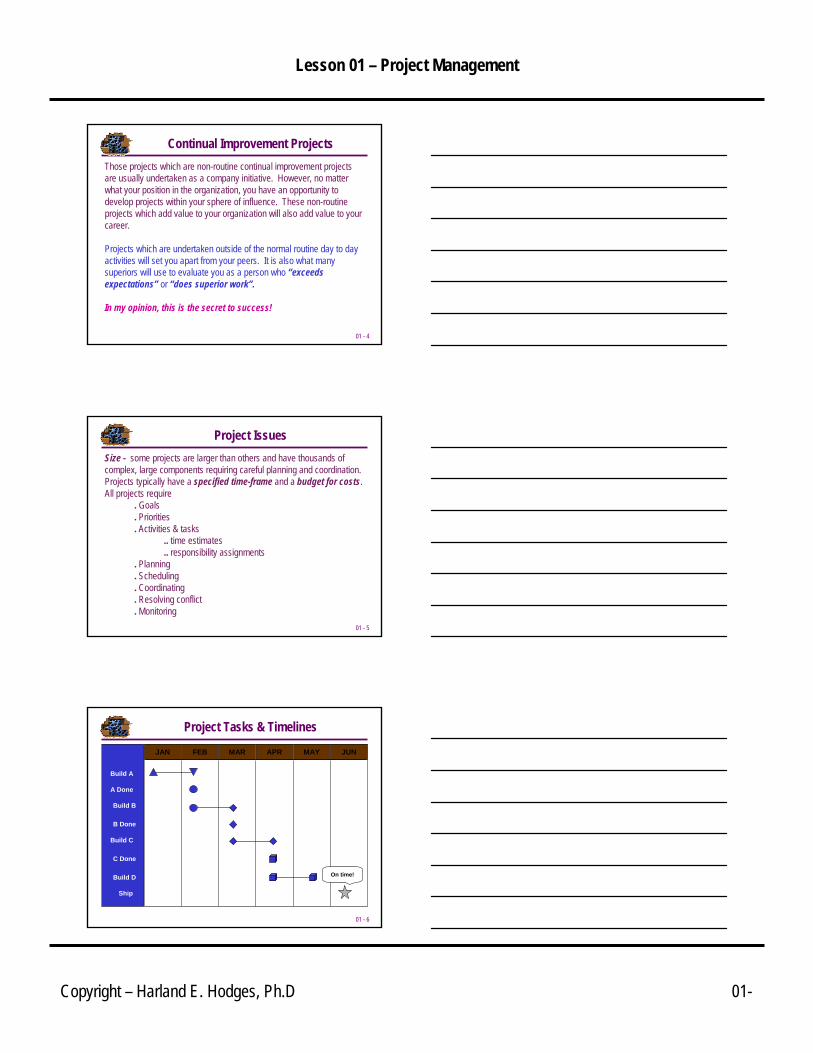
JAN FEB MAR APR MAY JUN
On time!
Build A
A Done
Build B
B Done
Build C
C Done
Build D
Ship
Project Tasks & Timelines
Lesson 01 – Project Management
Copyright – Harland E. Hodges, Ph.D 01-
01 - 7
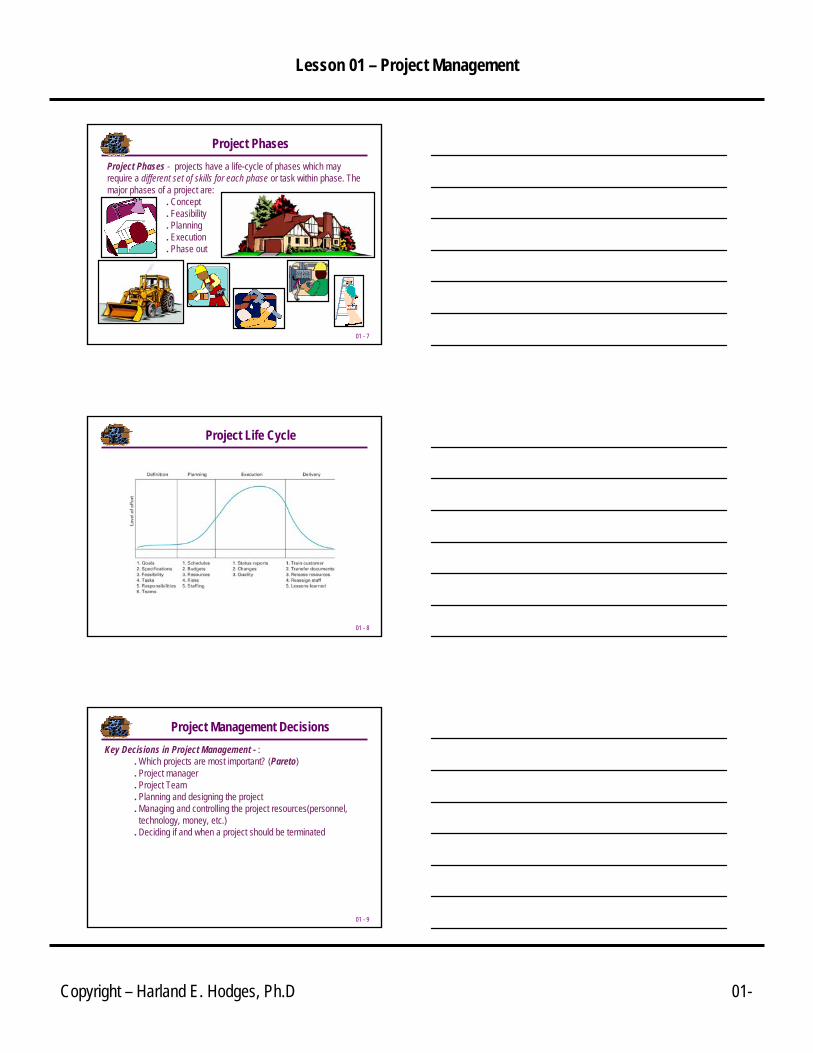
Project Phases - projects have a life-cycle of phases which may require a different set of skills for each phase or task within phase. The major phases of a project are:
. Concept
. Feasibility
. Planning
. Execution
. Phase out
Project Phases
01 - 8
Project Life Cycle
01 - 9
Key Decisions in Project Management - :. Which projects are most important? (Pareto). Project manager. Project Team. Planning and designing the project. Managing and controlling the project resources(personnel, technology, money, etc.)
. Deciding if and when a project should be terminated
Project Management Decisions

Lesson 01 – Project Management
Copyright – Harland E. Hodges, Ph.D 01-
01 - 10
Project IssuesProjects may be departmental or company wide. In either case selection of the project participants is extremely important.
. Team members.. Departmental.. From many departments
within the company. Matrix organization … because the project member may be assigned to the project effort on a part time basishe/she may wind up with two supervisors. Conflicts will have to be resolved.
. Project manager
01 - 11
Work QualityHuman Resources TimeCommunications Costs
Project ManagerThe project manager is key to the project success. Many hard decisions will have to be made and it will test their leadership abilities.
Many young managers are given projects to tests leadership ability.
01 - 12
Complexity of projects - because large projects usually involve a very large number of activities, project managers and project planners must break down a project into the tasks and sequence them according to priority, timing, task length, and costs. Visual aids are very important for communicating the project tasks to all persons involved and interested in the project.
Two key tools to accomplish this are:. Work Breakdown Structures. Gantt Charts (named for Henry Gantt)
Project Issues
Lesson 01 – Project Management
Copyright – Harland E. Hodges, Ph.D 01-
01 - 13
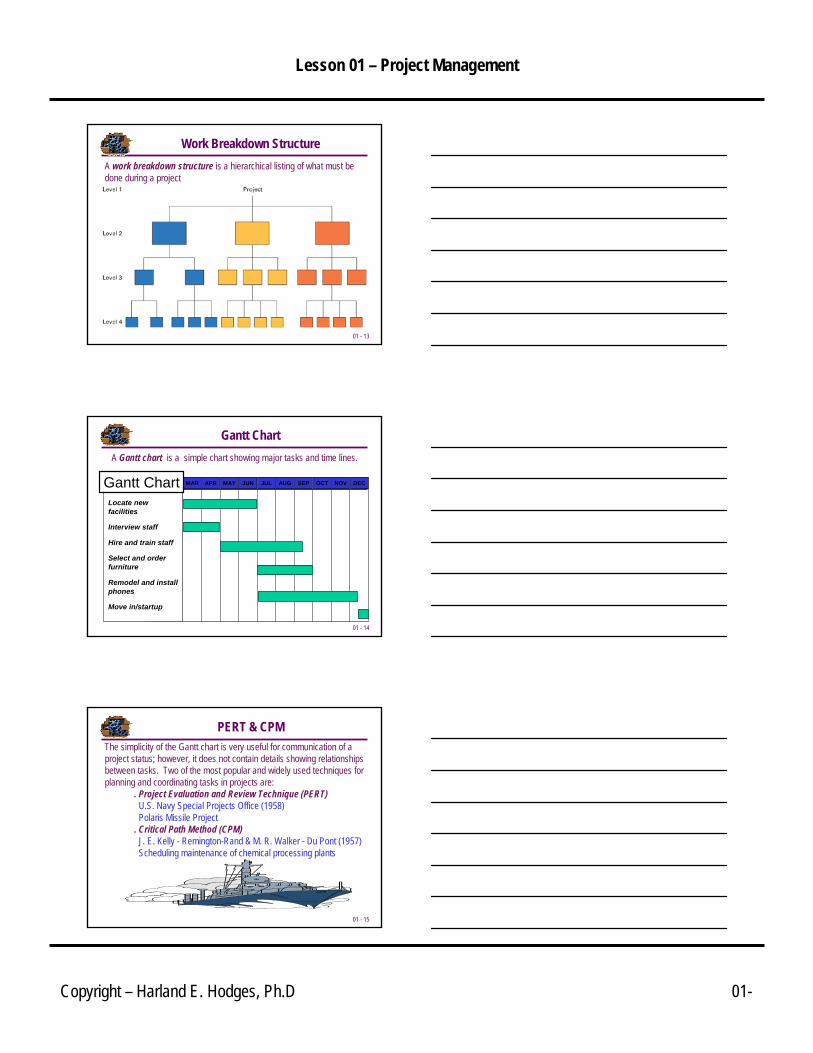
A work breakdown structure is a hierarchical listing of what must be done during a project
Work Breakdown Structure
01 - 14
MAR APR MAY JUN JUL AUG SEP OCT NOV DEC
Locate new facilities
Interview staff
Hire and train staff
Select and order furniture
Remodel and install phones
Move in/startup
Gantt Chart
Gantt ChartA Gantt chart is a simple chart showing major tasks and time lines.
01 - 15
The simplicity of the Gantt chart is very useful for communication of a project status; however, it does not contain details showing relationships between tasks. Two of the most popular and widely used techniques for planning and coordinating tasks in projects are:
. Project Evaluation and Review Technique (PERT) U.S. Navy Special Projects Office (1958)Polaris Missile Project
. Critical Path Method (CPM)J. E. Kelly - Remington-Rand & M. R. Walker - Du Pont (1957)Scheduling maintenance of chemical processing plants
PERT & CPM
Lesson 01 – Project Management
Copyright – Harland E. Hodges, Ph.D 01-
01 - 16
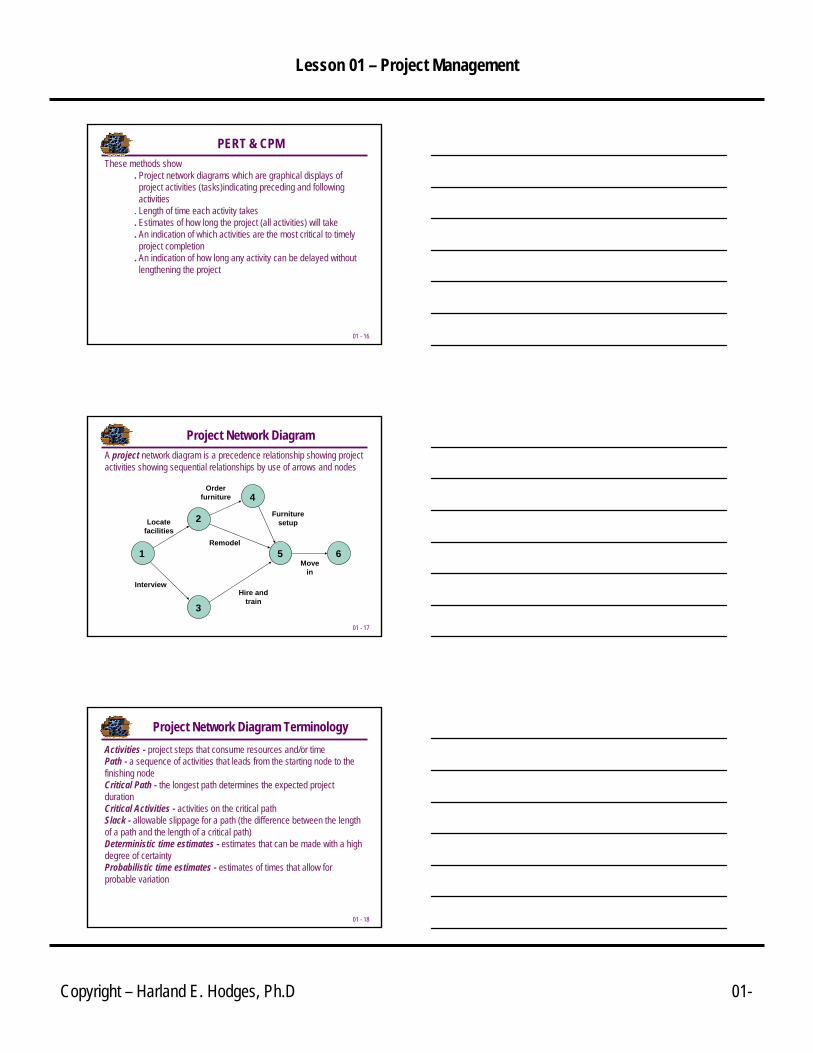
These methods show . Project network diagrams which are graphical displays of project activities (tasks)indicating preceding and following activities
. Length of time each activity takes
. Estimates of how long the project (all activities) will take
. An indication of which activities are the most critical to timely project completion
. An indication of how long any activity can be delayed without lengthening the project
PERT & CPM
01 - 17
1
2
3
4
5 6
Locatefacilities
Orderfurniture
Furnituresetup
InterviewHire and
train
Remodel
Move in
A project network diagram is a precedence relationship showing project activities showing sequential relationships by use of arrows and nodes
Project Network Diagram
01 - 18
Activities - project steps that consume resources and/or timePath - a sequence of activities that leads from the starting node to the finishing nodeCritical Path - the longest path determines the expected project durationCritical Activities - activities on the critical pathSlack - allowable slippage for a path (the difference between the length of a path and the length of a critical path)Deterministic time estimates - estimates that can be made with a high degree of certaintyProbabilistic time estimates - estimates of times that allow for probable variation
Project Network Diagram Terminology

Lesson 01 – Project Management
Copyright – Harland E. Hodges, Ph.D 01-
01 - 19
Activity On Arrow (AOA)
Activity On Node (AON)
Network Conventions
S
T
U
1
2
3T
S
4U
01 - 20
a
b
c
Both activities a and b have to be completed before activity c can begin. Activities a and b are independent of each other.
Network Conventions (AOA)
01 - 21
ab
c
Activity a must precede activities b and c. Activities b and c are independent of each other.
Network Conventions (AOA)

Lesson 01 – Project Management
Copyright – Harland E. Hodges, Ph.D 01-
01 - 22
a
b
c
d
Both activities a and b have to be completed before activity c or d can begin. Activities a, b, c, and d are independent of each other.
Network Conventions (AOA)
01 - 23
a
b
c
Dummyactivity
Independent activities a and b both have the same ending node. To preserve the independence a dummy node and activity must be created. The time allocated to a dummy activity is 0.
Network Conventions (AOA)
01 - 24
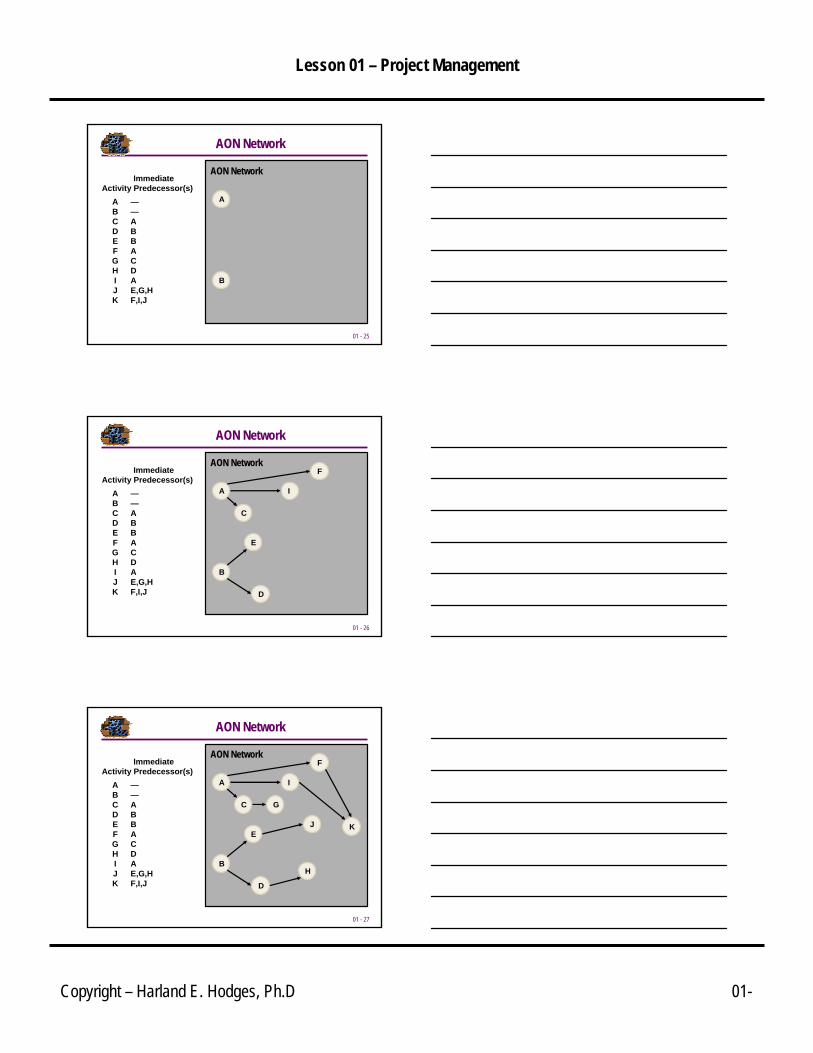
AON Network
ImmediateActivity Predecessor(s)
A —B —C AD BE BF AG CH DI AJ E,G,HK F,I,J
Lesson 01 – Project Management
Copyright – Harland E. Hodges, Ph.D 01-
01 - 25
AON Network
ImmediateActivity Predecessor(s)
A —B —C AD BE BF AG CH DI AJ E,G,HK F,I,J
AON Network
B
A
01 - 26
AON Network
ImmediateActivity Predecessor(s)
A —B —C AD BE BF AG CH DI AJ E,G,HK F,I,J
AON Network
B
A
C
D
E
F
I
01 - 27
AON Network
ImmediateActivity Predecessor(s)
A —B —C AD BE BF AG CH DI AJ E,G,HK F,I,J
AON Network
B
A
C G
H
K
D
JE
F
I

Lesson 01 – Project Management
Copyright – Harland E. Hodges, Ph.D 01-
01 - 28
AON Network
ImmediateActivity Predecessor(s)
A —B —C AD BE BF AG CH DI AJ E,G,HK F,I,J
AON Network
B
A
C G
H
K
D
JE
F
I
01 - 29
ImmediateActivity Predecessor(s)
A —B —C AD BE BF AG CH DI AJ E,G,HK F,I,J
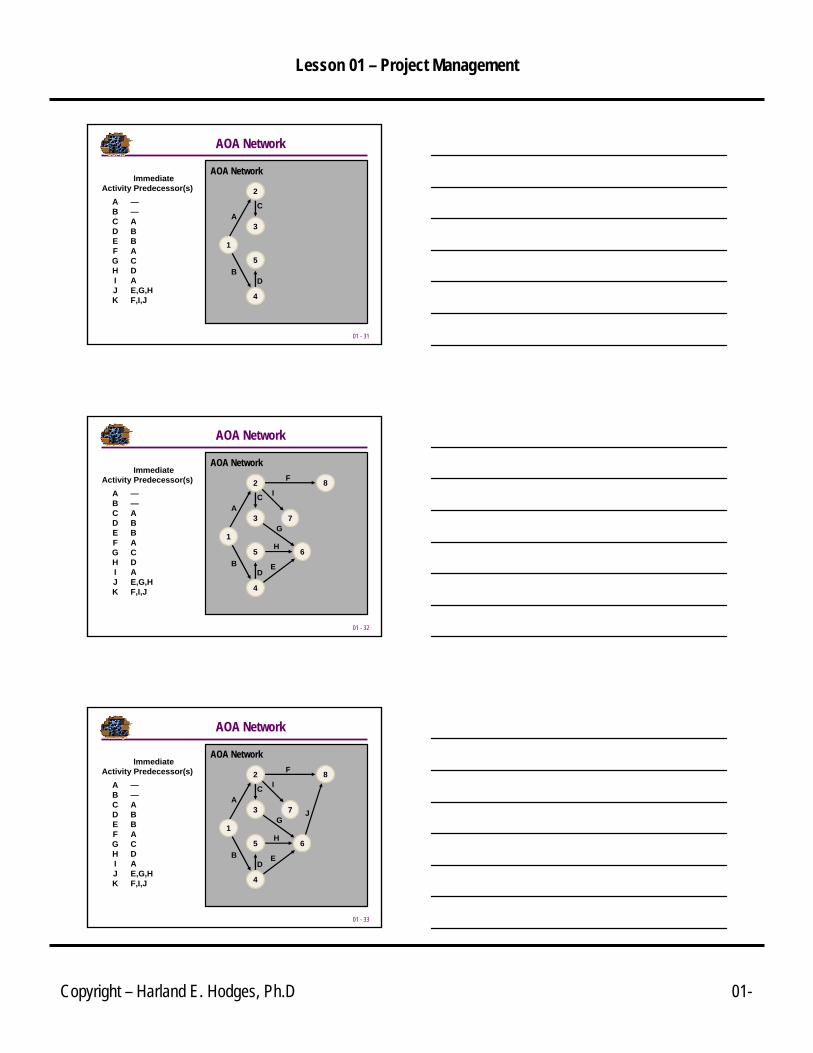
AOA Network
01 - 30
ImmediateActivity Predecessor(s)
A —B —C AD BE BF AG CH DI AJ E,G,HK F,I,J
AOA Network
A
B
2
4
1
AOA Network
Lesson 01 – Project Management
Copyright – Harland E. Hodges, Ph.D 01-
01 - 31
ImmediateActivity Predecessor(s)
A —B —C AD BE BF AG CH DI AJ E,G,HK F,I,J
AOA Network
A
B
C
D
2
3
5
4
1
AOA Network
01 - 32
ImmediateActivity Predecessor(s)
A —B —C AD BE BF AG CH DI AJ E,G,HK F,I,J
AOA NetworkF
A
B
C
D
H
E
G
I82
3 7
65
4
1
AOA Network
01 - 33
ImmediateActivity Predecessor(s)
A —B —C AD BE BF AG CH DI AJ E,G,HK F,I,J
AOA NetworkF
A
B
C
D
H
E
GJ
I82
3 7
65
4
1
AOA Network
Lesson 01 – Project Management
Copyright – Harland E. Hodges, Ph.D 01-
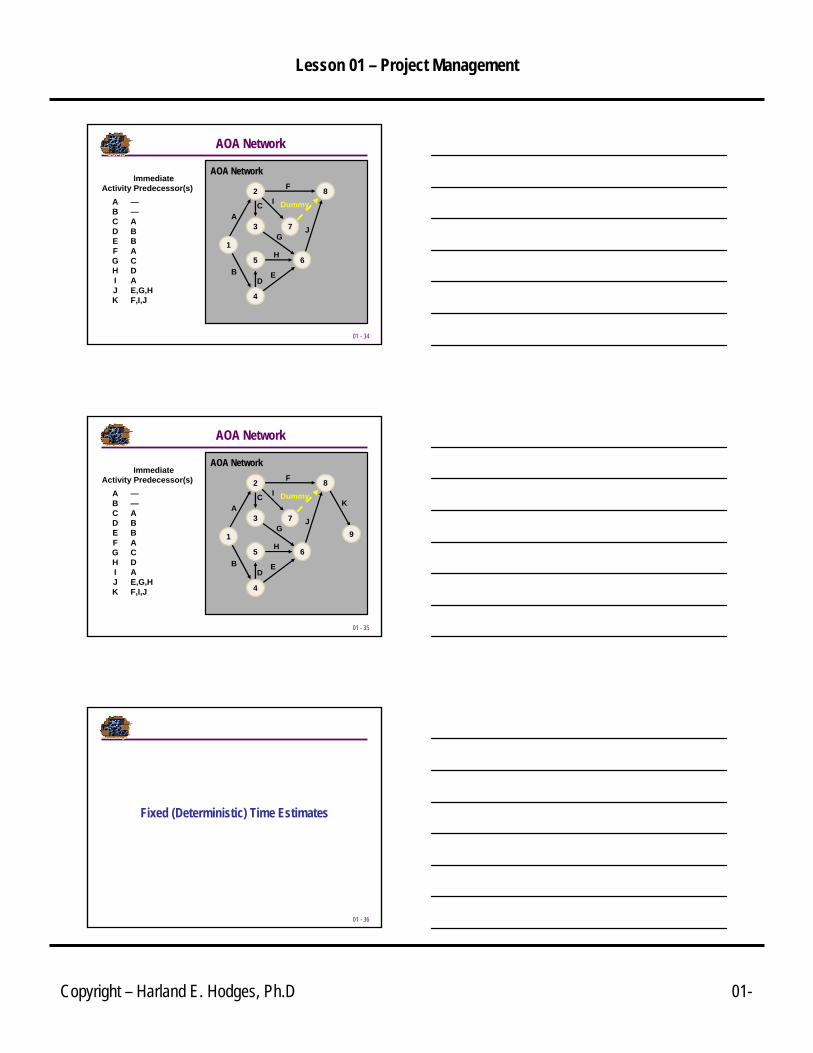
01 - 34
ImmediateActivity Predecessor(s)
A —B —C AD BE BF AG CH DI AJ E,G,HK F,I,J
AOA NetworkF
A
B
C
D
H
E
GJ
I Dummy82
3 7
65
4
1
AOA Network
01 - 35
ImmediateActivity Predecessor(s)
A —B —C AD BE BF AG CH DI AJ E,G,HK F,I,J
AOA NetworkF
A
B
C
D
H
E
G
K
J
I Dummy82
3 7
65
4
91
AOA Network
01 - 36
Fixed (Deterministic) Time Estimates

Lesson 01 – Project Management
Copyright – Harland E. Hodges, Ph.D 01-
01 - 37
*Predecessors* Duration Times
*Task* Start 1 2 3 "O" "M" "P" *Task*
A 0 8 Locate facilities
C A 6 Order furniture
D A 11 Remodel
E C 3 Furniture Setup
G E D F 1 Move in
B 0 4 Interview
F B 9 Hire and train
01 - 38
ALocate
facilities8 Weeks
COrder
furniture6 Weeks E
Furnituresetup
3 Weeks
BInterview4 Weeks
FHire and
train9 Weeks
DRemodel11 Weeks G
Move in1 Week
Draw the . AOA network diagram
01 - 39
Locatefacilities8 Weeks
Orderfurniture6 Weeks
Furnituresetup
3 Weeks
Interview4 Weeks
Hire and train9 Weeks
Remodel11 Weeks
Move in1 Week
CA
B
E
G
F
D
Locatefacilities8 Weeks
Orderfurniture6 Weeks
Furnituresetup
3 Weeks
Interview4 Weeks
Hire and train9 Weeks
Remodel11 Weeks
Move in1 Week
CA
B
E
G End
F
Start D
Draw the . AON network diagram
Lesson 01 – Project Management
Copyright – Harland E. Hodges, Ph.D 01-
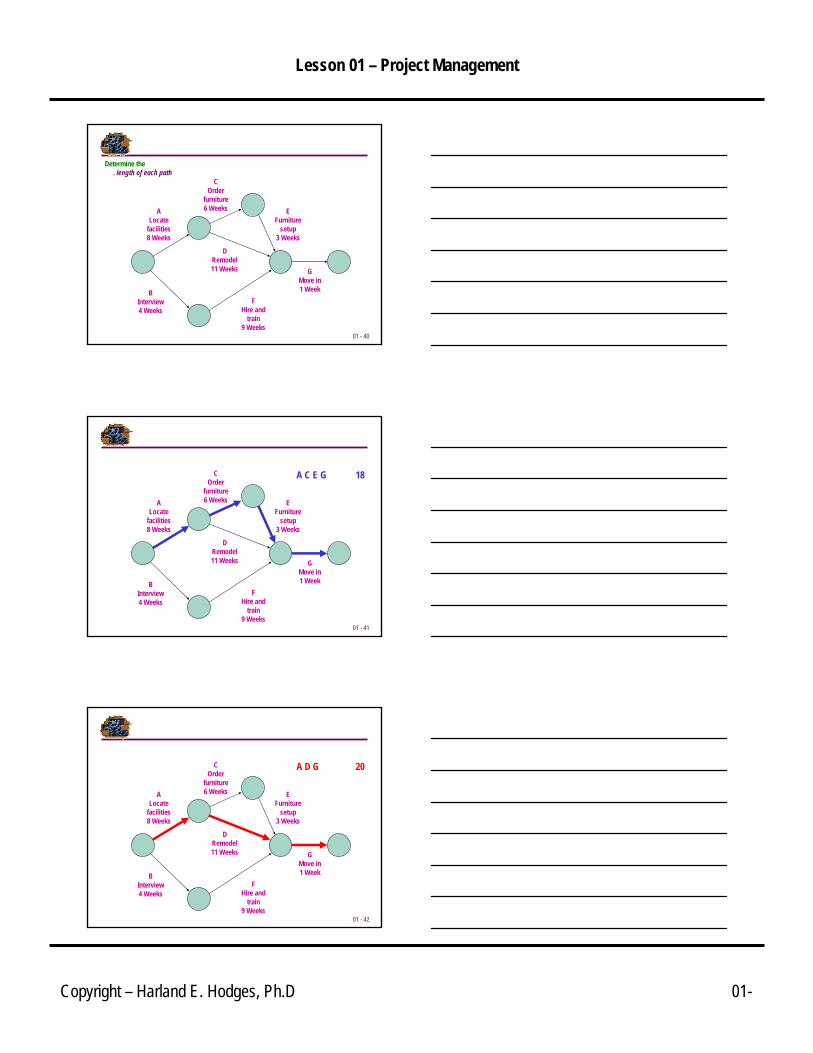
01 - 40
ALocate
facilities8 Weeks
COrder
furniture6 Weeks E
Furnituresetup
3 Weeks
BInterview4 Weeks
FHire and
train9 Weeks
DRemodel11 Weeks G
Move in1 Week
Determine the . length of each path
01 - 41
ALocate
facilities8 Weeks
COrder
furniture6 Weeks E
Furnituresetup
3 Weeks
BInterview4 Weeks
FHire and
train9 Weeks
DRemodel11 Weeks G
Move in1 Week
A C E G 18
01 - 42
ALocate
facilities8 Weeks
COrder
furniture6 Weeks E
Furnituresetup
3 Weeks
BInterview4 Weeks
FHire and
train9 Weeks
DRemodel11 Weeks G
Move in1 Week
A D G 20

Lesson 01 – Project Management
Copyright – Harland E. Hodges, Ph.D 01-
01 - 43
ALocate
facilities8 Weeks
COrder
furniture6 Weeks E
Furnituresetup
3 Weeks
BInterview4 Weeks
FHire and
train9 Weeks
DRemodel11 Weeks G
Move in1 Week
B F G 14
01 - 44
A C E G 18 A D G 20B F G 14
Determine the . critical path. project duration
ALocate
facilities8 Weeks
COrder
furniture6 Weeks E
Furnituresetup
3 Weeks
BInterview4 Weeks
FHire and
train9 Weeks
DRemodel11 Weeks G
Move in1 Week
01 - 45
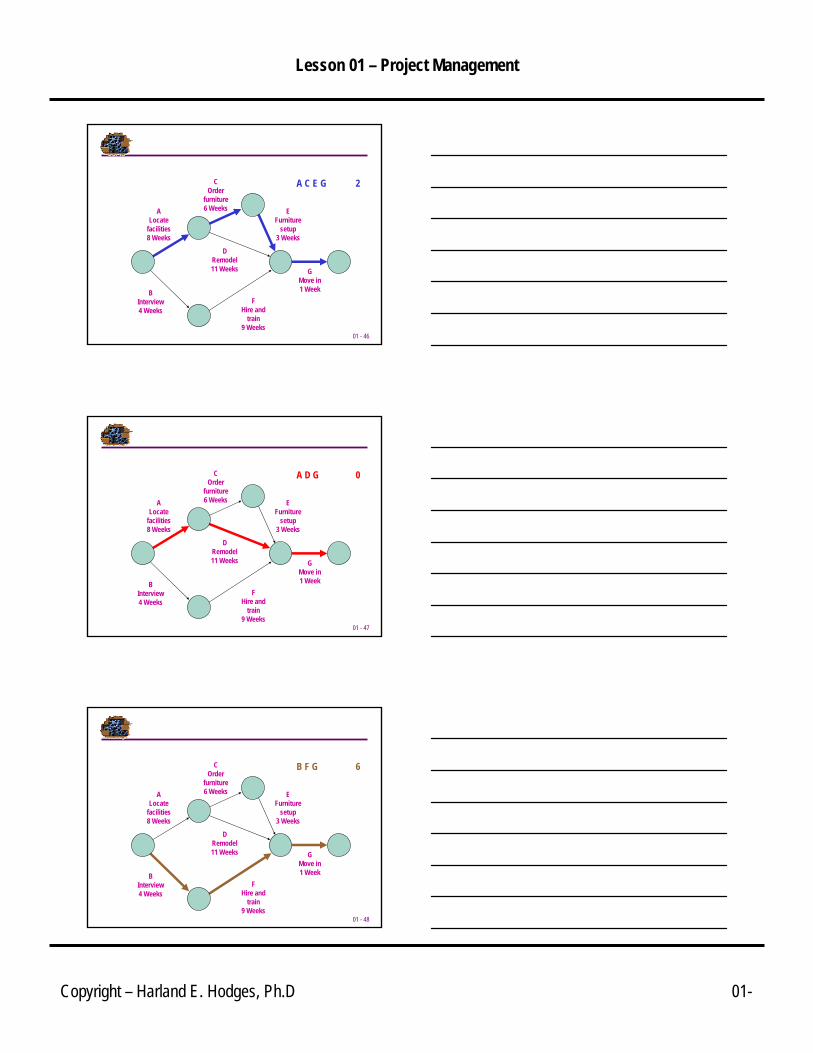
Determine the . slack for each path
ALocate
facilities8 Weeks
COrder
furniture6 Weeks E
Furnituresetup
3 Weeks
BInterview4 Weeks
FHire and
train9 Weeks
DRemodel11 Weeks G
Move in1 Week
Lesson 01 – Project Management
Copyright – Harland E. Hodges, Ph.D 01-
01 - 46
A C E G 2
ALocate
facilities8 Weeks
COrder
furniture6 Weeks E
Furnituresetup
3 Weeks
BInterview4 Weeks
FHire and
train9 Weeks
DRemodel11 Weeks G
Move in1 Week
01 - 47
A D G 0
ALocate
facilities8 Weeks
COrder
furniture6 Weeks E
Furnituresetup
3 Weeks
BInterview4 Weeks
FHire and
train9 Weeks
DRemodel11 Weeks G
Move in1 Week
01 - 48
B F G 6
ALocate
facilities8 Weeks
COrder
furniture6 Weeks E
Furnituresetup
3 Weeks
BInterview4 Weeks
FHire and
train9 Weeks
DRemodel11 Weeks G
Move in1 Week

Lesson 01 – Project Management
Copyright – Harland E. Hodges, Ph.D 01-
01 - 49
A 8 Weeks
C6 Weeks
E3 Weeks
B4 Weeks
F9 Weeks
D11 Weeks G
1 Week
Determine the earliest start time and the earliest finish time for each activity.
0 8
8 14
14 17
8 19
19 204 130 4
Forward Pass
ES EFES = max(preceeding tasks)EF = ES + Time
01 - 50
13.04.0F
4.00.0B
20.019.0G
17.014.0E
19.08.0D
14.08.0C
8.00.0A
FinishStartTask
EarlyA
Locatefacilities8 Weeks
COrder
furniture6 Weeks
EFurniture
setup3 Weeks
BInterview4 Weeks
FHire and
train9 Weeks
DRemodel11 Weeks G
Move in1 Week
01 - 51
Determine the latest start time and the latest finish time for each activity.
A 8 Weeks
C6 Weeks
E3 Weeks
B4 Weeks
F9 Weeks
D11 Weeks G
1 Week
0 8
10 16
16 19
8 19
19 2010 196 10
Backward Pass
LS LFLF = min(following tasks)LS = LF - Time
Lesson 01 – Project Management
Copyright – Harland E. Hodges, Ph.D 01-
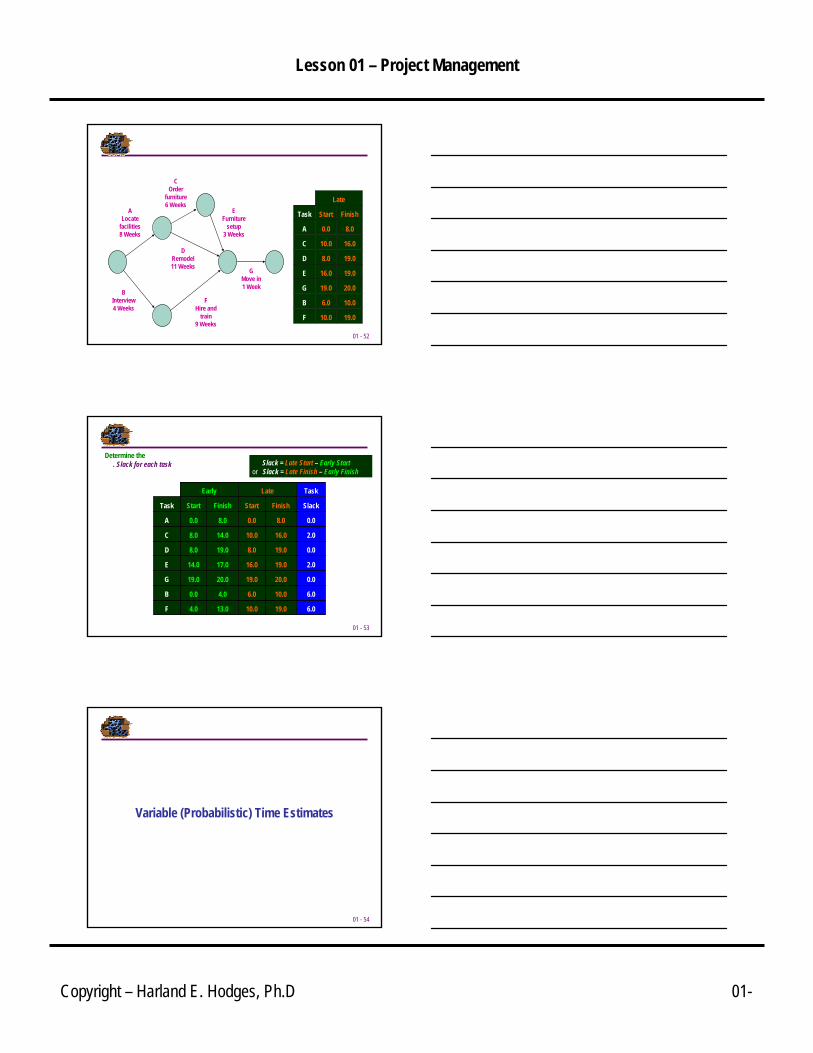
01 - 52
19.010.0F
10.06.0B
20.019.0G
19.016.0E
19.08.0D
16.010.0C
8.00.0A
FinishStartTask
LateA
Locatefacilities8 Weeks
COrder
furniture6 Weeks
EFurniture
setup3 Weeks
BInterview4 Weeks
FHire and
train9 Weeks
DRemodel11 Weeks G
Move in1 Week
01 - 53
Slack = Late Start – Early Startor Slack = Late Finish – Early Finish
Determine the . Slack for each task
6.019.010.013.04.0F
6.010.06.04.00.0B
0.020.019.020.019.0G
2.019.016.017.014.0E
0.019.08.019.08.0D
2.016.010.014.08.0C
0.08.00.08.00.0A
SlackFinishStartFinishStartTask
TaskLateEarly
01 - 54
Variable (Probabilistic) Time Estimates
Lesson 01 – Project Management
Copyright – Harland E. Hodges, Ph.D 01-
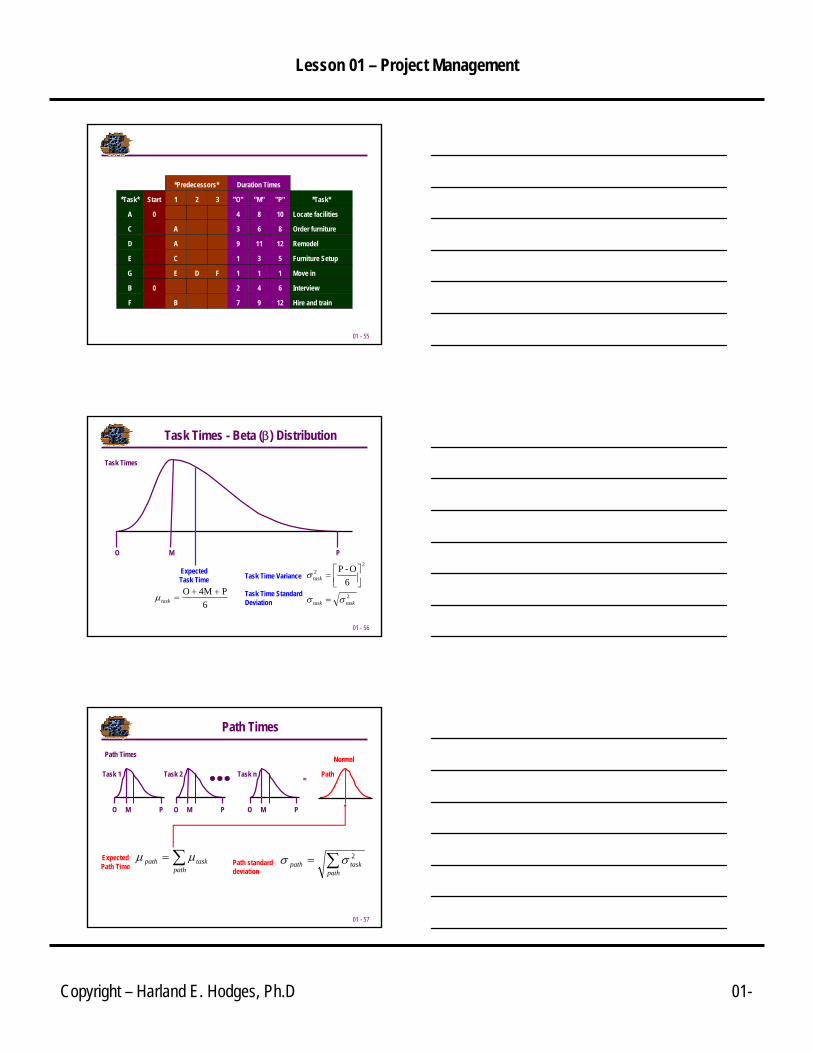
01 - 55
*Predecessors* Duration Times
*Task* Start 1 2 3 "O" "M" "P" *Task*
A 0 4 8 10 Locate facilities
C A 3 6 8 Order furniture
D A 9 11 12 Remodel
E C 1 3 5 Furniture Setup
G E D F 1 1 1 Move in
B 0 2 4 6 Interview
F B 7 9 12 Hire and train
01 - 56
Task Times - Beta (β) Distribution
O PM
Task Time Variance
Task Time Standard Deviation
2
22
6O-P
tasktask
task
σσ
σ
=
⎥⎦⎤
⎢⎣⎡=
6P4MO ++
=taskμ
Expected Task Time
Task Times
01 - 57
Path Times
O M P O M P O M P
Task 1 Task 2 Task n = Path
Normal
∑=path
taskpath μμExpected Path Time ∑=
pathtaskpath2σσPath standard
deviation
Path Times
Lesson 01 – Project Management
Copyright – Harland E. Hodges, Ph.D 01-
01 - 58
ALocate
facilities4 – 8 - 10
COrder
furniture3 – 6 - 8
EFurniture
setup1 – 3 - 5
BInterview2 – 4 - 6
FHire and
train7 – 9 - 12
DRemodel
9 – 11 - 12 GMove in1 – 1 - 1
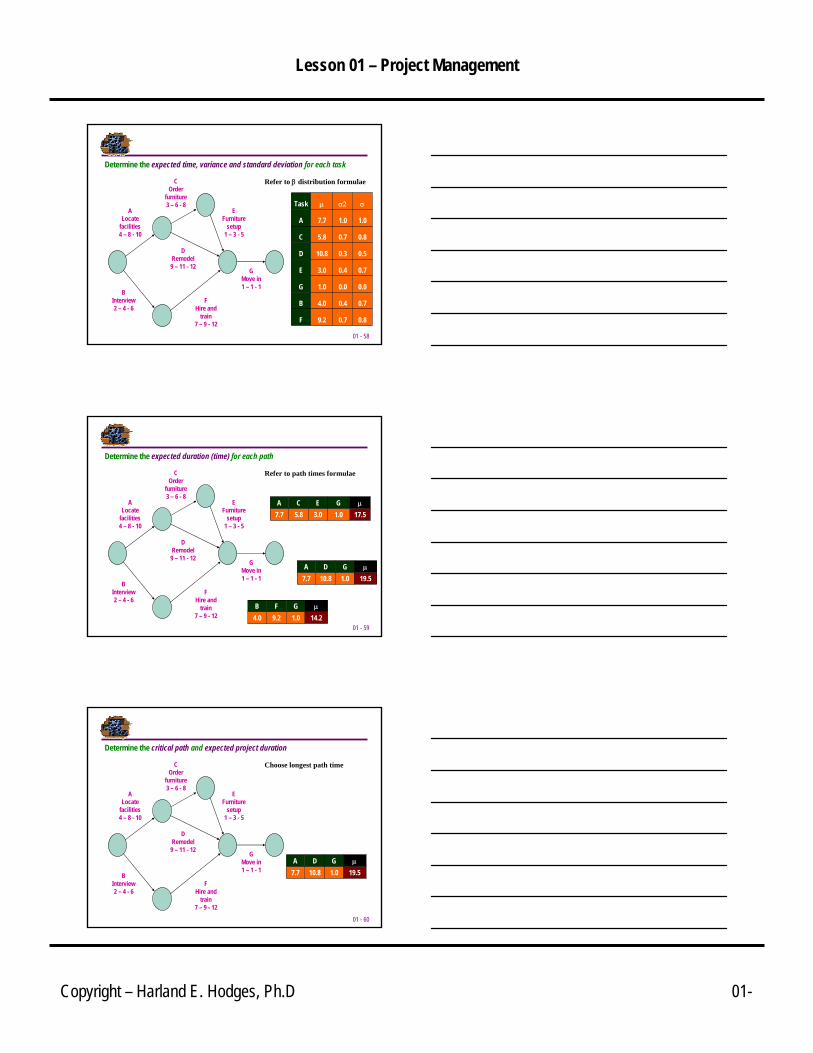
Determine the expected time, variance and standard deviation for each task
Task μ σ2 σ
A 7.7 1.0 1.0
C 5.8 0.7 0.8
D 10.8 0.3 0.5
E 3.0 0.4 0.7
G 1.0 0.0 0.0
B 4.0 0.4 0.7
F 9.2 0.7 0.8
Refer to β distribution formulae
01 - 59
Determine the expected duration (time) for each path
ALocate
facilities4 – 8 - 10
COrder
furniture3 – 6 - 8
EFurniture
setup1 – 3 - 5
BInterview2 – 4 - 6
FHire and
train7 – 9 - 12
DRemodel
9 – 11 - 12 GMove in1 – 1 - 1
17.51.03.05.87.7μGECA
19.51.010.87.7μGDA
14.21.09.24.0μGFB
Refer to path times formulae
01 - 60
Determine the critical path and expected project duration
ALocate
facilities4 – 8 - 10
COrder
furniture3 – 6 - 8
EFurniture
setup1 – 3 - 5
BInterview2 – 4 - 6
FHire and
train7 – 9 - 12
DRemodel
9 – 11 - 12 GMove in1 – 1 - 1 19.51.010.87.7
μGDA
Choose longest path time
Lesson 01 – Project Management
Copyright – Harland E. Hodges, Ph.D 01-
01 - 61
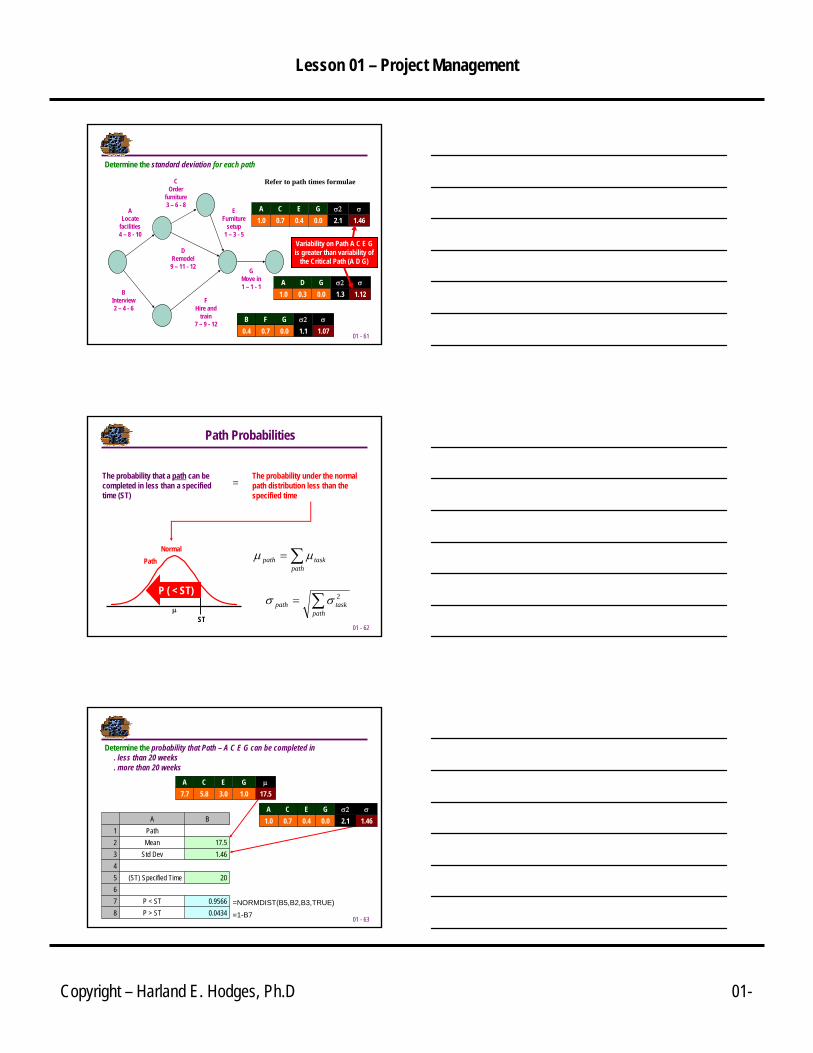
Determine the standard deviation for each path
ALocate
facilities4 – 8 - 10
COrder
furniture3 – 6 - 8
EFurniture
setup1 – 3 - 5
BInterview2 – 4 - 6
FHire and
train7 – 9 - 12
DRemodel
9 – 11 - 12 GMove in1 – 1 - 1
1.462.10.00.40.71.0σσ2GECA
1.121.30.00.31.0σσ2GDA
1.071.10.00.70.4σσ2GFB
Refer to path times formulae
Variability on Path A C E G is greater than variability of
the Critical Path (A D G)
01 - 62
Path Probabilities
The probability that a path can be completed in less than a specified time (ST)
The probability under the normal path distribution less than the specified time
=
∑=path
taskpath2σσ
∑=path
taskpath μμPathNormal
μST
P ( < ST)
01 - 630.0434P > ST80.9566P < ST7
620(ST) Specified Time5
41.46Std Dev317.5Mean2
Path1BA
=NORMDIST(B5,B2,B3,TRUE)
=1-B7
Determine the probability that Path – A C E G can be completed in . less than 20 weeks . more than 20 weeks
17.51.03.05.87.7μGECA
1.462.10.00.40.71.0σσ2GECA
Lesson 01 – Project Management
Copyright – Harland E. Hodges, Ph.D 01-
01 - 64
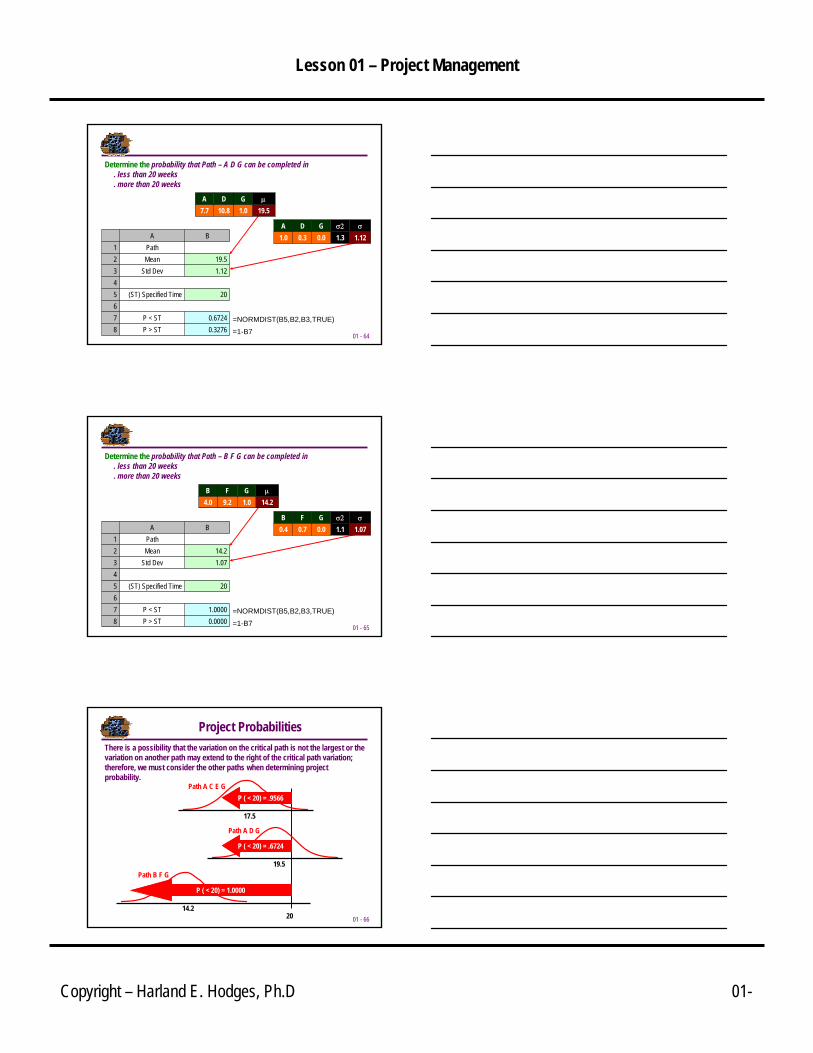
Determine the probability that Path – A D G can be completed in . less than 20 weeks . more than 20 weeks
0.3276P > ST80.6724P < ST7
620(ST) Specified Time5
41.12Std Dev319.5Mean2
Path1BA
=NORMDIST(B5,B2,B3,TRUE)
=1-B7
19.51.010.87.7μGDA
1.121.30.00.31.0σσ2GDA
01 - 650.0000P > ST81.0000P < ST7
620(ST) Specified Time5
41.07Std Dev314.2Mean2
Path1BA
=NORMDIST(B5,B2,B3,TRUE)
=1-B7
Determine the probability that Path – B F G can be completed in . less than 20 weeks . more than 20 weeks
14.21.09.24.0μGFB
1.071.10.00.70.4σσ2GFB
01 - 66
Project ProbabilitiesThere is a possibility that the variation on the critical path is not the largest or the variation on another path may extend to the right of the critical path variation; therefore, we must consider the other paths when determining project probability.
20
Path A C E G
17.5
P ( < 20) = .9566
Path A D G
19.5
P ( < 20) = .6724
Path B F G
14.2
P ( < 20) = 1.0000
Lesson 01 – Project Management
Copyright – Harland E. Hodges, Ph.D 01-
01 - 67
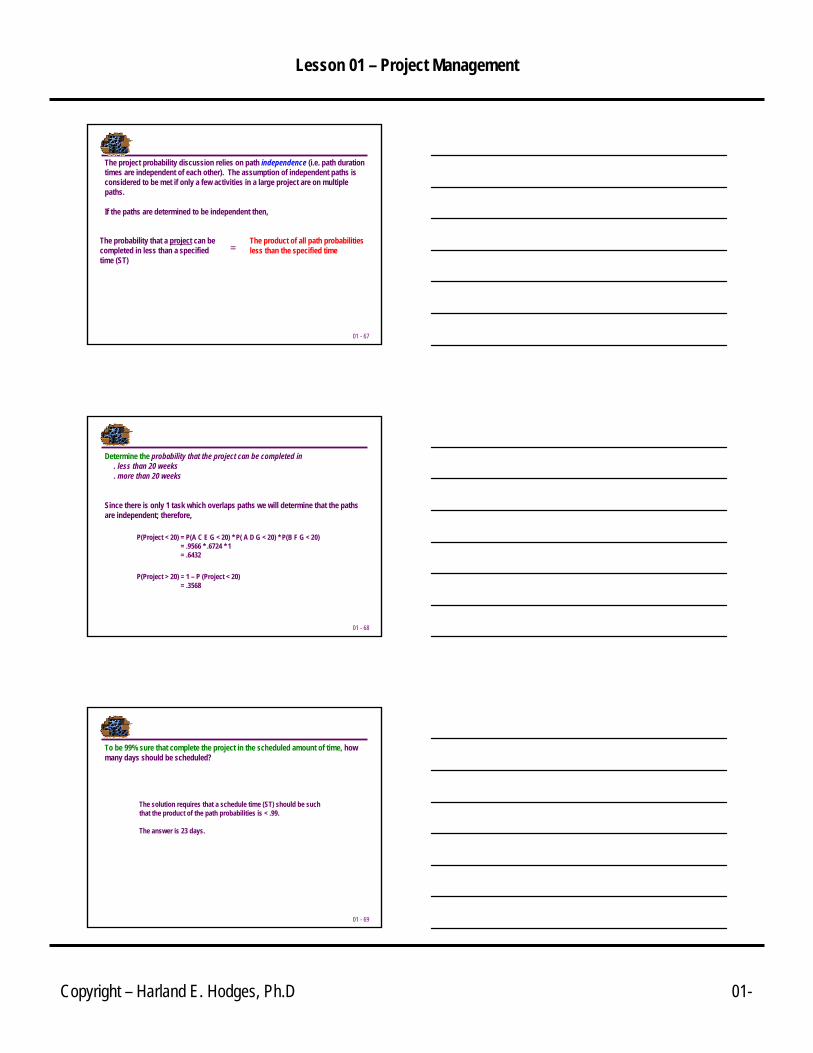
The probability that a project can be completed in less than a specified time (ST)
=The product of all path probabilities less than the specified time
The project probability discussion relies on path independence (i.e. path duration times are independent of each other). The assumption of independent paths is considered to be met if only a few activities in a large project are on multiple paths.
If the paths are determined to be independent then,
01 - 68
Determine the probability that the project can be completed in . less than 20 weeks . more than 20 weeks
P(Project < 20) = P(A C E G < 20) * P( A D G < 20) * P(B F G < 20)= .9566 * .6724 * 1= .6432
P(Project > 20) = 1 – P (Project < 20)= .3568
Since there is only 1 task which overlaps paths we will determine that the paths are independent; therefore,
01 - 69
To be 99% sure that complete the project in the scheduled amount of time, how many days should be scheduled?
The solution requires that a schedule time (ST) should be such that the product of the path probabilities is < .99.
The answer is 23 days.
Lesson 01 – Project Management
Copyright – Harland E. Hodges, Ph.D 01-
01 - 70
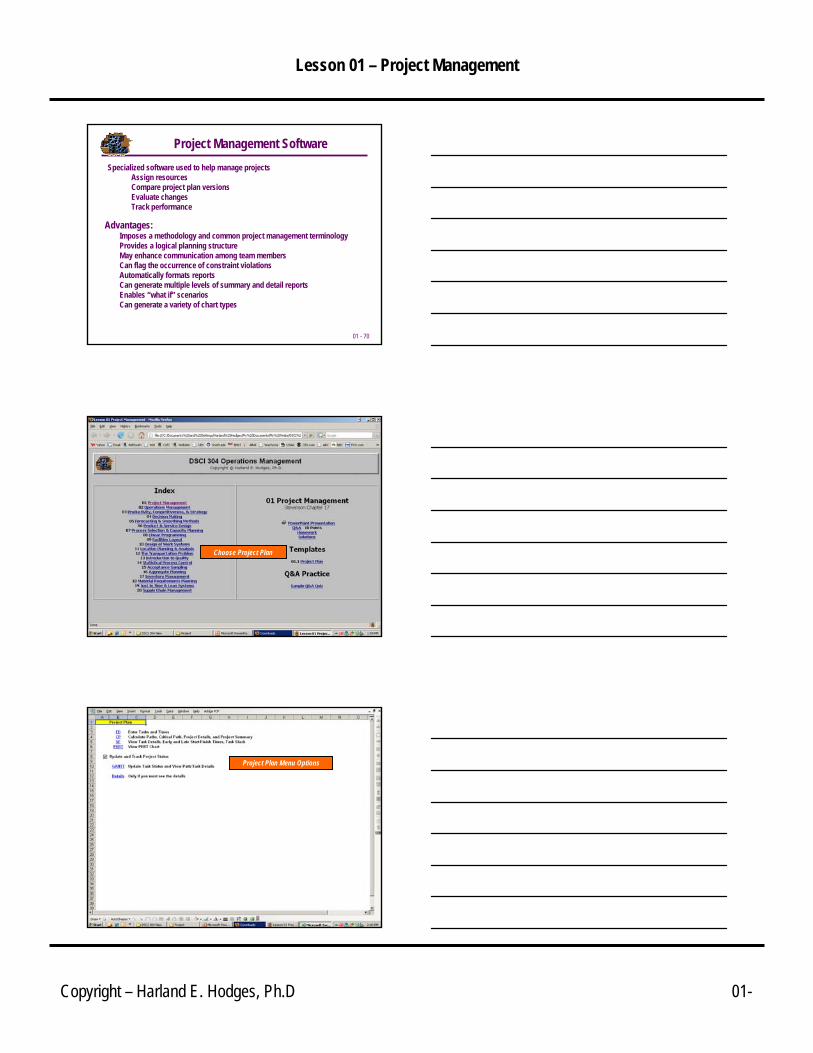
Project Management SoftwareSpecialized software used to help manage projects
Assign resourcesCompare project plan versionsEvaluate changesTrack performance
Advantages:Imposes a methodology and common project management terminologyProvides a logical planning structureMay enhance communication among team membersCan flag the occurrence of constraint violationsAutomatically formats reportsCan generate multiple levels of summary and detail reportsEnables “what if” scenariosCan generate a variety of chart types
01 - 71
Choose Project Plan
01 - 72
Project Plan Menu Options
Lesson 01 – Project Management
Copyright – Harland E. Hodges, Ph.D 01-
01 - 73
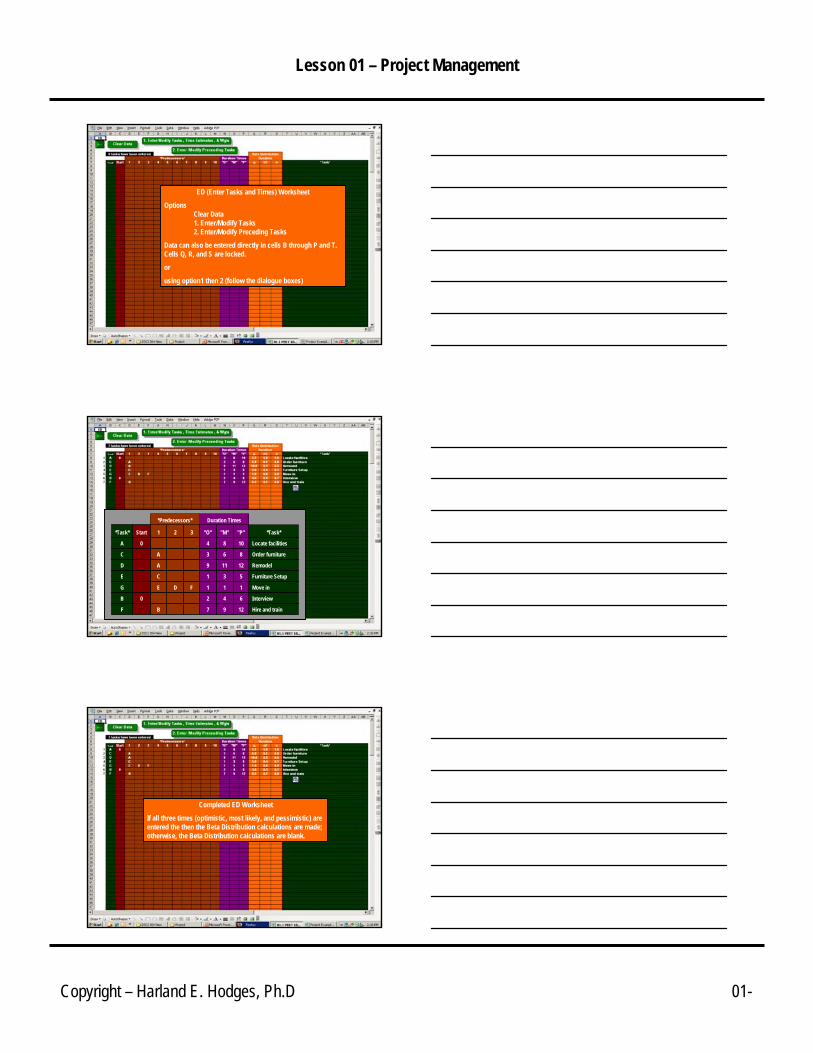
ED (Enter Tasks and Times) Worksheet
OptionsClear Data1. Enter/Modify Tasks2. Enter/Modify Preceding Tasks
Data can also be entered directly in cells B through P and T. Cells Q, R, and S are locked.
or
using option1 then 2 (follow the dialogue boxes)
01 - 74
Hire and train1297BF
Interview6420B
Move in111FDEG
Furniture Setup531CE
Remodel12119AD
Order furniture863AC
Locate facilities10840A
*Task*"P""M""O"321Start*Task*
Duration Times*Predecessors*
01 - 75
Completed ED Worksheet
If all three times (optimistic, most likely, and pessimistic) are entered the then the Beta Distribution calculations are made; otherwise, the Beta Distribution calculations are blank.

Lesson 01 – Project Management
Copyright – Harland E. Hodges, Ph.D 01-
01 - 76
CP Worksheet
Select the time estimate for the analysis you wish to perform from the drop down box at the upper left.
01 - 77
All paths in the project network diagram are automatically calculated showing the expected duration, variance, slack and tasks for each path. The Critical Path is also identified.
Here, we see there are 3 paths, 1 critical path, and 7 tasks in the project.
If the “Expected” time estimate was chosen, the Project Summary shows the expected project duration (same as critical path), and provides a warning of whether the critical path variance is maximum.
01 - 78
If the “Expected” time estimate was chosen, the Project Summary also shows project probability estimates.
Here, we see that the probability of completion in less than a specified time of 20 days is 64.33%.
The slider increments can be used to change the specified time.

Lesson 01 – Project Management
Copyright – Harland E. Hodges, Ph.D 01-
01 - 79
SF Worksheet
Shows each task early and late start finish times, slack, and whether or not the task is a Critical Task.
01 - 80
For each path (selected by the slider increment in the upper left corner), it also show a GANTT Chart with the early start –early finish (bright green) and late start – late finish (bright orange) on the same graph.
The slider increments at the graph upper right can be used to adjust spacing in the graph.
01 - 81
PERT Worksheet
Shows the AON project network diagram which may need to be adjusted (Adjust Task Y Plot Points) to minimize the overlapping lines.
You can also scroll (select path increment slider in upper left corner) through each of the paths in the project.

Lesson 01 – Project Management
Copyright – Harland E. Hodges, Ph.D 01-
01 - 82
Adjusted AON project network diagram showing Path (A C E
G) in highlighted (green)
01 - 83
GANTT Worksheet
Can be used to track the project status by path task (Update Task Status). The project day (slider increment below paths) to the current project day.
Here we see task A can start (CS in yellow above task).
01 - 84
Here we see for Project Day 5, Path (A C E G) that Task A has started at time 0 (yellow) and 5 days have been completed (blue).
None of the other tasks on this path can start because preceding tasks have not been completed.

Lesson 01 – Project Management
Copyright – Harland E. Hodges, Ph.D 01-
01 - 85
Here we see for Project Day 5, Path (A D G) that Task A has started at time 0 (yellow) and 5 days have been completed (blue).
None of the other tasks on this path can start because preceding tasks have not been completed.
01 - 86
Here we see for Project Day 5, Path (B F G) that Task B is complete (blue). It started at time 0 (yellow) and 4 days have been completed (blue). We also see that Task F started at time 4 (yellow) and 1 day (blue) has been completed.
None of the other tasks on this path can start because precedingtasks have not been completed.
01 - 87
HomeworkRead and understand all material in the chapter.
Discussion and Review Questions
Do not begin the homework until you have recreated and understand all the examples in this presentation.
Exercises on chapter web page