01-1 NEBRASKA BASKETBALL PINNACLE BANK ARENA · Opened on Aug. 29, 2013, Pinnacle Bank Arena is the...
4
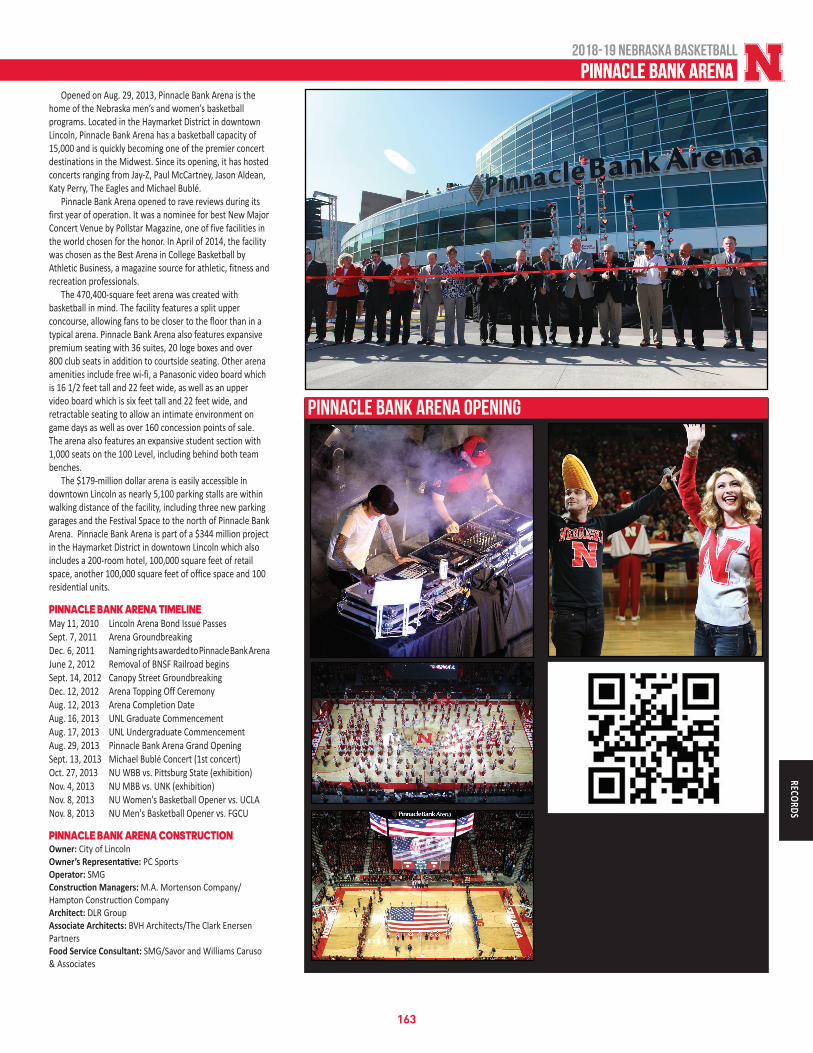
Opened on Aug. 29, 2013, Pinnacle Bank Arena is the home of the Nebraska men’s and women’s basketball programs. Located in the Haymarket District in downtown Lincoln, Pinnacle Bank Arena has a basketball capacity of 15,000 and is quickly becoming one of the premier concert destinations in the Midwest. Since its opening, it has hosted concerts ranging from Jay-Z, Paul McCartney, Jason Aldean, Katy Perry, The Eagles and Michael Bublé. Pinnacle Bank Arena opened to rave reviews during its first year of operation. It was a nominee for best New Major Concert Venue by Pollstar Magazine, one of five facilities in the world chosen for the honor. In April of 2014, the facility was chosen as the Best Arena in College Basketball by Athletic Business, a magazine source for athletic, fitness and recreation professionals. The 470,400-square feet arena was created with basketball in mind. The facility features a split upper concourse, allowing fans to be closer to the floor than in a typical arena. Pinnacle Bank Arena also features expansive premium seating with 36 suites, 20 loge boxes and over 800 club seats in addition to courtside seating. Other arena amenities include free wi-fi, a Panasonic video board which is 16 1/2 feet tall and 22 feet wide, as well as an upper video board which is six feet tall and 22 feet wide, and retractable seating to allow an intimate environment on game days as well as over 160 concession points of sale. The arena also features an expansive student section with 1,000 seats on the 100 Level, including behind both team benches. The $179-million dollar arena is easily accessible in downtown Lincoln as nearly 5,100 parking stalls are within walking distance of the facility, including three new parking garages and the Festival Space to the north of Pinnacle Bank Arena. Pinnacle Bank Arena is part of a $344 million project in the Haymarket District in downtown Lincoln which also includes a 200-room hotel, 100,000 square feet of retail space, another 100,000 square feet of office space and 100 residential units. PINNACLE BANK ARENA TIMELINE May 11, 2010 Lincoln Arena Bond Issue Passes Sept. 7, 2011 Arena Groundbreaking Dec. 6, 2011 Naming rights awarded to Pinnacle Bank Arena June 2, 2012 Removal of BNSF Railroad begins Sept. 14, 2012 Canopy Street Groundbreaking Dec. 12, 2012 Arena Topping Off Ceremony Aug. 12, 2013 Arena Completion Date Aug. 16, 2013 UNL Graduate Commencement Aug. 17, 2013 UNL Undergraduate Commencement Aug. 29, 2013 Pinnacle Bank Arena Grand Opening Sept. 13, 2013 Michael Bublé Concert (1st concert) Oct. 27, 2013 NU WBB vs. Pittsburg State (exhibition) Nov. 4, 2013 NU MBB vs. UNK (exhibition) Nov. 8, 2013 NU Women's Basketball Opener vs. UCLA Nov. 8, 2013 NU Men's Basketball Opener vs. FGCU PINNACLE BANK ARENA CONSTRUCTION Owner: City of Lincoln Owner’s Representave: PC Sports Operator: SMG Construcon Managers: M.A. Mortenson Company/ Hampton Construcon Company Architect: DLR Group Associate Architects: BVH Architects/The Clark Enersen Partners Food Service Consultant: SMG/Savor and Williams Caruso & Associates Opening night for the Huskers at Pinnacle Bank Arena was a smashing success. The pregame ceremonies included performances from Tommy Lee and DJ Aero (upper left), the Cornhusker Marching Band (middle and lower left) while Karmin (top right) sang the national anthem. A sellout crowd of 15,119 was on hand as Nebraska defeated Florida Gulf Coast, 79-55, behind a game-high 28 points from Shavon Shields. Use your smart phone to watch some of the highlights from opening night at Pinnacle Bank Arena. 163 RECORDS 2018-19 NEBRASKA BASKETBALL PINNACLE BANK ARENA PINNACLE BANK ARENA OPENING PINNACLE BANK ARENA
Transcript of 01-1 NEBRASKA BASKETBALL PINNACLE BANK ARENA · Opened on Aug. 29, 2013, Pinnacle Bank Arena is the...
Opened on Aug. 29, 2013, Pinnacle Bank Arena is the home of the Nebraska men’s and women’s basketball programs. Located in the Haymarket District in downtown Lincoln, Pinnacle Bank Arena has a basketball capacity of 15,000 and is quickly becoming one of the premier concert destinations in the Midwest. Since its opening, it has hosted concerts ranging from Jay-Z, Paul McCartney, Jason Aldean, Katy Perry, The Eagles and Michael Bublé.
Pinnacle Bank Arena opened to rave reviews during its first year of operation. It was a nominee for best New Major Concert Venue by Pollstar Magazine, one of five facilities in the world chosen for the honor. In April of 2014, the facility was chosen as the Best Arena in College Basketball by Athletic Business, a magazine source for athletic, fitness and recreation professionals.
The 470,400-square feet arena was created with basketball in mind. The facility features a split upper concourse, allowing fans to be closer to the floor than in a typical arena. Pinnacle Bank Arena also features expansive premium seating with 36 suites, 20 loge boxes and over 800 club seats in addition to courtside seating. Other arena amenities include free wi-fi, a Panasonic video board which is 16 1/2 feet tall and 22 feet wide, as well as an upper video board which is six feet tall and 22 feet wide, and retractable seating to allow an intimate environment on game days as well as over 160 concession points of sale. The arena also features an expansive student section with 1,000 seats on the 100 Level, including behind both team benches.
The $179-million dollar arena is easily accessible in downtown Lincoln as nearly 5,100 parking stalls are within walking distance of the facility, including three new parking garages and the Festival Space to the north of Pinnacle Bank Arena. Pinnacle Bank Arena is part of a $344 million project in the Haymarket District in downtown Lincoln which also includes a 200-room hotel, 100,000 square feet of retail space, another 100,000 square feet of office space and 100 residential units.
PINNACLE BANK ARENA TIMELINEMay 11, 2010 Lincoln Arena Bond Issue Passes Sept. 7, 2011 Arena GroundbreakingDec. 6, 2011 Naming rights awarded to Pinnacle Bank ArenaJune 2, 2012 Removal of BNSF Railroad beginsSept. 14, 2012 Canopy Street GroundbreakingDec. 12, 2012 Arena Topping Off CeremonyAug. 12, 2013 Arena Completion DateAug. 16, 2013 UNL Graduate CommencementAug. 17, 2013 UNL Undergraduate CommencementAug. 29, 2013 Pinnacle Bank Arena Grand OpeningSept. 13, 2013 Michael Bublé Concert (1st concert)Oct. 27, 2013 NU WBB vs. Pittsburg State (exhibition)Nov. 4, 2013 NU MBB vs. UNK (exhibition)Nov. 8, 2013 NU Women's Basketball Opener vs. UCLANov. 8, 2013 NU Men's Basketball Opener vs. FGCU
PINNACLE BANK ARENA CONSTRUCTIONOwner: City of Lincoln Owner’s Representative: PC Sports Operator: SMGConstruction Managers: M.A. Mortenson Company/Hampton Construction CompanyArchitect: DLR Group Associate Architects: BVH Architects/The Clark Enersen PartnersFood Service Consultant: SMG/Savor and Williams Caruso & Associates
Opening night for the Huskers at Pinnacle Bank Arena was a smashing success. The pregame ceremonies included performances from Tommy Lee and DJ Aero (upper left), the Cornhusker Marching Band (middle and lower left) while Karmin (top right) sang the national anthem. A sellout crowd of 15,119 was on hand as Nebraska defeated Florida Gulf Coast, 79-55, behind a game-high 28 points from Shavon Shields. Use your smart phone to watch some of the highlights from opening night at Pinnacle Bank Arena.
163
RECORDS
2018-19 NEBRASKA BASKETBALL
PINNACLE BANK ARENA
PINNACLE BANK ARENA OPENING
PINNACLE BANK ARENA
RECORD VS. OPPONENTS AT PINNACLE BANK ARENAOpponent W-L Pct.Abilene Christian 1-0 1.000Arkansas Pine Bluff 1-0 1.000Arkansas State 1-0 1.000Boston College 1-0 1.000Central Arkansas 1-0 1.000Cincinnati 1-0 1.000Creighton 0-2 .000Delaware State 2-0 1.000Eastern Illinois 1-0 1.000Florida Gulf Coast 1-0 1.000Gardner-Webb 0-1 .000Illinois 3-1 .750Incarnate Word 0-1 .000Indiana 2-2 .500Iowa 2-1 .667Kansas 0-1 .000Louisiana Tech 1-0 1.000Mary 1-0 1.000Maryland 1-2 .333Miami (Fla.) 1-1 .500Michigan 1-3 .250Michigan State 1-1 .500Minnesota 4-0 1.000Mississippi Valley State 1-0 1.000
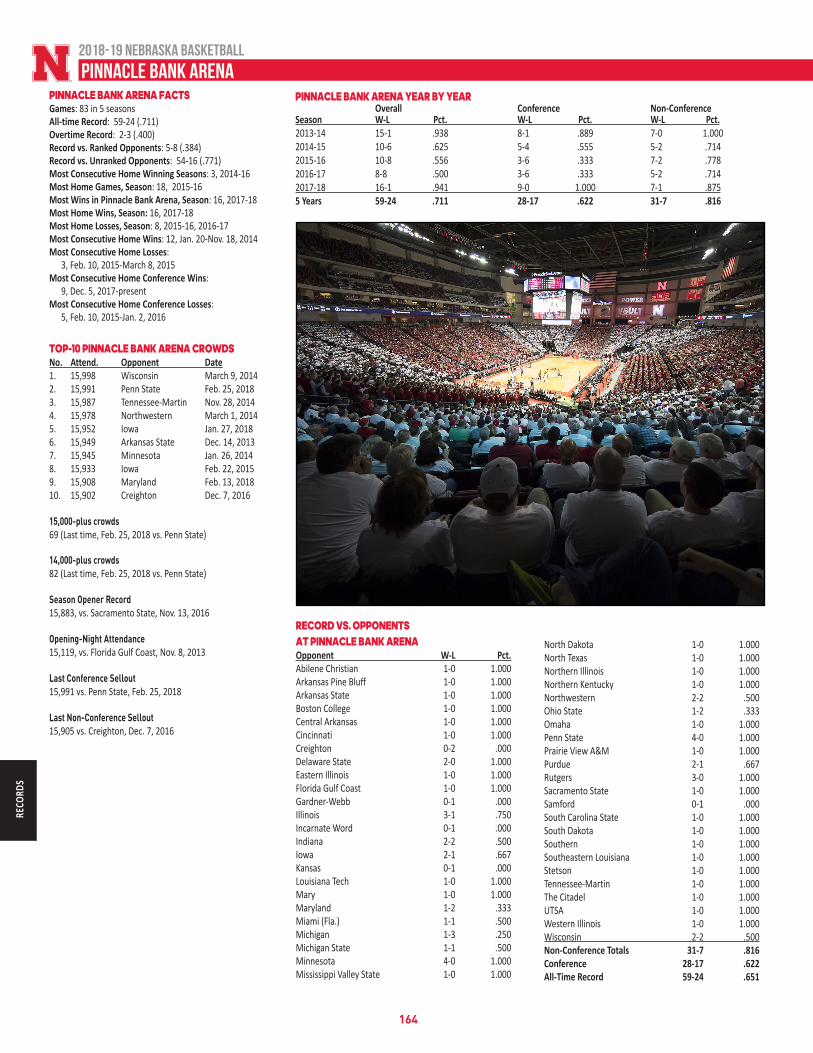
PINNACLE BANK ARENA FACTSGames: 83 in 5 seasonsAll-time Record: 59-24 (.711)Overtime Record: 2-3 (.400)Record vs. Ranked Opponents: 5-8 (.384)Record vs. Unranked Opponents: 54-16 (.771)Most Consecutive Home Winning Seasons: 3, 2014-16Most Home Games, Season: 18, 2015-16Most Wins in Pinnacle Bank Arena, Season: 16, 2017-18Most Home Wins, Season: 16, 2017-18Most Home Losses, Season: 8, 2015-16, 2016-17Most Consecutive Home Wins: 12, Jan. 20-Nov. 18, 2014Most Consecutive Home Losses: 3, Feb. 10, 2015-March 8, 2015Most Consecutive Home Conference Wins: 9, Dec. 5, 2017-presentMost Consecutive Home Conference Losses: 5, Feb. 10, 2015-Jan. 2, 2016
TOP-10 PINNACLE BANK ARENA CROWDSNo. Attend. Opponent Date1. 15,998 Wisconsin March 9, 20142. 15,991 Penn State Feb. 25, 20183. 15,987 Tennessee-Martin Nov. 28, 20144. 15,978 Northwestern March 1, 20145. 15,952 Iowa Jan. 27, 20186. 15,949 Arkansas State Dec. 14, 20137. 15,945 Minnesota Jan. 26, 20148. 15,933 Iowa Feb. 22, 20159. 15,908 Maryland Feb. 13, 201810. 15,902 Creighton Dec. 7, 2016
15,000-plus crowds 69 (Last time, Feb. 25, 2018 vs. Penn State)
14,000-plus crowds 82 (Last time, Feb. 25, 2018 vs. Penn State)
Season Opener Record15,883, vs. Sacramento State, Nov. 13, 2016
Opening-Night Attendance15,119, vs. Florida Gulf Coast, Nov. 8, 2013
Last Conference Sellout15,991 vs. Penn State, Feb. 25, 2018
Last Non-Conference Sellout15,905 vs. Creighton, Dec. 7, 2016
North Dakota 1-0 1.000North Texas 1-0 1.000Northern Illinois 1-0 1.000Northern Kentucky 1-0 1.000Northwestern 2-2 .500Ohio State 1-2 .333Omaha 1-0 1.000Penn State 4-0 1.000Prairie View A&M 1-0 1.000Purdue 2-1 .667Rutgers 3-0 1.000Sacramento State 1-0 1.000Samford 0-1 .000South Carolina State 1-0 1.000South Dakota 1-0 1.000Southern 1-0 1.000Southeastern Louisiana 1-0 1.000Stetson 1-0 1.000Tennessee-Martin 1-0 1.000The Citadel 1-0 1.000UTSA 1-0 1.000Western Illinois 1-0 1.000Wisconsin 2-2 .500Non-Conference Totals 31-7 .816Conference 28-17 .622All-Time Record 59-24 .651
PINNACLE BANK ARENA YEAR BY YEAR Overall Conference Non-ConferenceSeason W-L Pct. W-L Pct. W-L Pct.2013-14 15-1 .938 8-1 .889 7-0 1.0002014-15 10-6 .625 5-4 .555 5-2 .7142015-16 10-8 .556 3-6 .333 7-2 .7782016-17 8-8 .500 3-6 .333 5-2 .7142017-18 16-1 .941 9-0 1.000 7-1 .8755 Years 59-24 .711 28-17 .622 31-7 .816
MEDIA
RECO
RDS
2018-19 NEBRASKA BASKETBALL
164
PINNACLE BANK ARENA

NEBRASKA INDIVIDUALPoints: 35, Terran Petteway vs. Minnesota, Jan. 26, 2014 35, Shavon Shields vs. Omaha, Nov. 25, 2014 35, Andrew White III vs. Penn State, Feb. 13, 2016 Field Goals: 12, Shavon Shields vs. Omaha, Nov. 25, 2014 12, Isaac Copeland Jr., vs. North Dakota, Nov. 19, 2017Field Goal Attempts: 25, Shavon Shields vs. Miami, Dec. 1, 2015 (11 made)Field Goal Percentage: 1.000, David Rivers vs. No. Kentucky, Nov. 16, 2014 (5-5) 1.000, Ed Morrow Jr. vs. SE Louisiana, Nov. 22, 2015 (5-5)Field Goals, No Misses: 5, David Rivers vs. No. Kentucky, Nov. 16, 2014 (5-5) 5, Ed Morrow Jr. vs. SE Louisiana, Nov. 22, 2015 (5-5)3-Point Field Goals: 6, Glynn Watson Jr., vs. Iowa, Jan. 5, 2017 (8 att) 3-Point Field Goals Attempted: 12, Andrew White III vs. Abilene Christian, Dec. 6, 2015 (4 made)3-Point Field Goal Percentage: (Most w/o Miss) 1.000, Shavon Shields vs. Omaha, Nov. 22, 2014 (4-4) 1.000, Jack McVeigh vs. Miss. Valley St., Nov. 14, 2015 (4-4)Free Throws: 15, Shavon Shields vs. Illinois, Feb. 12, 2014 (15 att.)Free Throw Attempts: 19, Terran Petteway vs. Penn State, Feb, 20, 2014 (14 made)Free Throws, No Misses: 15, Shavon Shields vs. Illinois, Feb. 12, 2014Rebounds: 13, Isaiah Roby vs. Eastern Illinois, Nov. 11, 2017Assists: 9, Glynn Watson Jr. vs. Rutgers, Feb. 6, 2016 9, Tai Webster vs. South Dakota, Dec. 3, 2016Blocked Shots: 6, Isaiah Roby vs. Eastern Illinois, Nov. 11, 2017Steals: 5, Tai Webster vs. Michigan, Jan. 23, 2016 5, James Palmer Jr. vs. Boston College, Nov. 29, 2017Minutes Played: 49, Tai Webster vs. Iowa (2 OT), Jan. 5, 2017
NEBRASKA OPPONENTPoints: 34, Peter Jok, Iowa, Jan. 5, 2017Field Goals: 13, Udoka Azubuike, Kansas, Dec. 16, 2017 (17 att.)Field Goal Attempts: 24, Travis Trice, Michigan State, Jan. 24, 2015 (9 made) 24, Peter Jok, Iowa, Jan. 5, 2017 (12 made)Field Goal Percentage: 1.000, Kenny Goins, Michigan State, Feb. 2, 2017 (5-5)Field Goals, No Misses (Min. 5 att.): 5, Kenny Goins, Michigan State, Feb. 2, 20173-Point Field Goals: 8, Malik Smith, Minnesota, Jan. 26, 2014 (12 att.)3-Point Field Goals Attempted: 12, Malik Smith, Minnesota, Jan. 26, 2014 (8 made)3-Point Field Goal Percentage: (Most w/o Miss) 1.000, Rick Kreklow, Creighton, Dec. 7, 2014 (3-3) 1.000, JerShon Cobb, Northwestern, Feb. 3, 2015 (3-3) 1.000, Joshua Langford, Michigan St., Feb. 2, 2017 (3-3) 1.000, Alvin Ellis III, Michigan State, Feb. 2, 2017 (3-3) 1.000, Terrell Lewis, Eastern Illinois, Nov. 11, 2017 (3-3) 1.000, DJ Draper, North Texas, Nov. 13, 2017 (3-3)Free Throws: 9, Melo Trimble, Maryland, March 8, 2014 (10 att.) Free Throw Attempts: 11, Rayvonte Rice, Illinois, Feb. 12, 2014 (7 made) 11, Ghaivonni Robinson, Arkansas-Pine Bluff, Nov. 24,
2015 (6 made) 11, Nigel Hayes, Wisconsin, Feb. 9, 2017 (7 made) 11, Tony Carr, Penn State, Feb. 25, 2018 (7 made)Free Throws, No Misses: 8, Christen Cunningham, Samford, Dec. 20, 2015Rebounds: 18, Brandon Dawson, Michigan State, Jan. 24, 2015Assists: 16, Derrick Walton Jr., Michigan, March 5, 2017Blocked Shots: 8, Diamond Stone, Maryland, Feb. 3, 2016Steals: 7, Josh Reeves, Penn State, Feb. 25, 2018Minutes Played: 45, Tony Caupain, Cincinnati, Dec. 13, 2014 (2 OT)
NEBRASKA TEAMPoints in a Game: 104, vs. UTSA, Dec. 20, 2017Fewest Points in a Game: 46, vs. Iowa, Feb. 22, 2015Points in a Half: 55, vs. UTSA, Dec. 20, 2017 (2nd) Fewest Points in a Half: 13, vs. Wisconsin, Feb. 10, 2015 (1st)Margin of Victory: 46, vs. Mississippi Valley State, Nov. 14, 2015 (97-51)Margin of Defeat: 36, vs. Michigan, March 5, 2017 (57-93)Field Goals: 36, vs. North Dakota, Nov. 19, 2017 (68 att.)Field Goal Attempts: 71, vs. Iowa, Jan. 5, 2017 (32 made)Field Goal Percentage: .628, vs. Northwestern, Feb. 3, 2015 (27-43)Lowest Field Goal Percentage: .271, vs. Ohio State, Feb. 20, 2016 (19-70)3-Point Field Goals: 13, vs. Delaware State, Dec. 22, 2017 (27 att.)3-Point Field Goals Attempted: 35, vs. Ohio State, Feb. 20, 2016 (9 made)3-Point Field Goal Percentage: .750, vs. Rhode Island, Dec. 13, 2015 (6-8)Free Throws Made: 37, vs. Penn State, Feb. 20, 2014 (48 att.) 37, vs. UTSA, Dec. 20, 2018 (50 att.)Fewest Free Throws Made: 3, vs. Michigan, March 5, 2017 (15 att.)Free Throw Attempts: 50, vs. UTSA, Dec. 20, 2017 (37 made)Fewest Free Throws Attempted: 5, vs. Illinois, Jan. 11, 2015 (5 made)Free Throw Percentage (Min. 10 att.): .923, vs. Penn State, Feb. 13, 2016 (12-13)Rebounds: 52, vs. Southeastern Louisiana, Nov. 22, 2015 52, vs. Stetson, Dec. 29, 2017Fewest Rebounds: 22, vs. Indiana, Jan. 30, 2014Personal Fouls: 26, vs. Purdue, Feb. 23, 2014Fewest Personal Fouls: 10, vs. Illinois, Jan. 11, 2015 10, vs. Rutgers, Feb. 10, 2018Assists: 24, vs. Delaware State, Dec. 22, 2017Turnovers: 22, vs. Cincinnati, Dec. 13, 2014 22, vs. Wisconsin, Feb. 9, 2017Fewest Turnovers: 5, vs. South Carolina State, Nov. 17, 2013
5, vs. Wisconsin, March 9, 2014Blocked Shots: 9, vs. Eastern Illinois, Nov. 11, 2017 9, vs. North Texas, Nov. 13, 2017 9, vs. Minnesota, Dec. 5, 2017 9, vs. Stetson, Dec. 29, 2017Steals: 14, vs. Iowa, Jan. 5, 2017
OPPONENT TEAMPoints in a Game: 94, by UTSA, Dec. 20, 2017Fewest Points in a Game: 38, by Mary, Nov. 15, 2016Points in a Half: 52, by Michigan State, Jan. 24, 2015 (2nd) 52, by UTSA, Dec. 20, 2017 (2nd)Fewest Points in a Half: 13, by Miami (Fla.), Dec. 4, 2013 (1st)Margin of Victory: 36, by Michigan, March 5, 2017 (57-93)Field Goals: 35, by UTSA, Dec. 20, 2017 (78 att.)Field Goal Attempts: 78, by UTSA, Dec. 20, 2017 (35 made)Field Goal Percentage: .630, by Michigan, March 5, 2017 (34-54)Lowest Field Goal Percentage: .259, by Mississippi Valley St., Nov. 14, 2015 (15-48)3-Point Field Goals: 15, by UTSA, Dec. 20, 2017 (31 att.)3-Point Field Goals Attempted: 31, by UTSA, Dec. 20, 2017 (15 made)3-Point Field Goal Percentage: .647, by Michigan State, Feb. 2, 2017 (11-17)Free Throws: 24, by Wisconsin, Feb, 10, 2015 (31 att.)Fewest Free Throws: 3, by Michigan, Jan. 9, 2014 (9 att) 3, by Michigan State, Feb. 2, 2017 (6 att.)Free Throw Attempts: 31, by Wisconsin, Feb, 10, 2015 (24 made)Fewest Free Throw Attempts: 6, by Michigan State, Feb. 2, 2017 (3 made)Free Throw Percentage (Min. 10 att.): .929, by Northwestern, Jan. 8, 2017 (13-14)Rebounds: 51, by Iowa, Jan. 5, 2017Fewest Rebounds: 18, by Northwestern, Feb, 3, 2015 Personal Fouls: 34, by North Texas, Nov. 13, 2017Fewest Fouls: 11, by Northwestern, Dec. 30, 2015 Assists: 22, by Purdue, March 1, 2016 Turnovers: 21, by Arkansas State, Dec. 14, 2013 21, by Mississippi Valley State, Nov. 14, 2015Fewest Turnovers: 6, by Penn State, Feb. 20, 2014 6, by UTSA, Dec. 20, 2014Blocked Shots: 13, by Maryland, Feb. 3, 2016Steals: 14, by Gardner-Webb, Dec. 18, 2017
165
RECORDS
2018-19 NEBRASKA BASKETBALL
PINNACLE BANK ARENA RECORDS

LARGEST CROWDS TO SEE NEBRASKA1. 25,348 Xavier, at Minneapolis, Minn., March 14, 1991 (NCAA)2. 21,229 Ohio State, at Chicago, March 16, 2013 (B1GT)3. 19,667 Purdue, at Chicago, March 15, 2013 (B1GT)4. 18,999 Kansas, at Dallas, March 11, 2006 (B12T)5. 18,910 Oklahoma State, at Kansas City, Mo., March 9, 2011 (B12T)6. 18,892 Oklahoma, at Dallas, March 10, 2006 (B12T)7. 18,879 Oklahoma State, at Oklahoma City, March 8, 2007 (B12T)8. 18,596 Ohio State, at Indianapolis, March 14, 2014 (B1GT)9. 18,268 Missouri, Dallas, Texas, March 10, 2004 (B12T)10. 17,876 Iowa State, at Kansas City, Mo., March 8, 1996 (B8T)
PINNACLE BANK ARENA Total Conference Year G Att. Avg. G Att. Avg.2013-14 16 246,702 15,419 9 140,700 15,6332014-15 16 249,101 15,569* 9 139,693 15,521 2015-16 18 277,739* 15,430 9 139,510 15,5012016-17 16 246,832 15,427 9 139,550 15,5062017-18 17 263,367 15,492 9 142,242* 15,805*Totals 83 1,283,741 15,467 45 701,695 15,593*Single-season record
BOB DEVANEY SPORTS CENTER Total Conference Year G Att. Avg. G Att. Avg.1976-77 11 106,868 9,715 7 74,243 10,6061977-78 17 172,892 10,170 7 90,514 12,9311978-79 11 131,769 11,979 7 87,502 12,5001979-80 16 145,626 9,102 7 79,015 11,2881980-81 15 136,483 9,099 7 82,009 11,7161981-82 14 143,819 10,273 7 79,329 11,3331982-83 18 195,333 10,852 7 86,511 12,3591983-84 17 173,721 10,219 7 82,233 11,7461984-85 15 176,045 11,736 7 95,221 13,6031985-86 15 146,117 9,741 7 78,208 11,1731986-87 17 197,395 11,611 7 81,680 11,6691987-88 14 159,100 11,364 7 90,875 12,9821988-89 18 193,545 10,753 7 87,283 12,4691989-90 15 150,190 10,013 7 81,894 11,6991990-91 15 199,605 13,307 7 100,740 14,3911991-92 16 207,950 12,997 7 100,079 14,2971992-93 16 213,715 13,357 7 100,620 14,3741993-94 16 212,447 13,278 7 100,973 14,4751994-95 17 202,688 11,923 7 95,768 13,6811995-96 16 168,225 10,514 7 87,065 12,4381996-97 16 174,119 10,882 8 99,167 12,3961997-98 15 141,472 9,431 8 87,060 10,8831998-99 16 146,653 9,166 8 77,477 9,6851999-2000 16 117,466 7,342 8 70,321 8,7902000-01 14 122,602 8,757 8 77,057 9,6322001-02 16 130,053 8,128 8 78,637 9,8302002-03 15 121,179 8,079 8 70,264 8,7832003-04 18 144,663 8,037 8 79,274 9,9092004-05 16 131,763 8,235 8 72,869 9,1092005-06 19 125,267 6,593 8 72,233 9,0292006-07 16 134,981 8,436 8 75,009 9,3762007-08 19 155,258 8,171 8 80,875 10,1092008-09 18 146,964 8,164 8 81,744 10,2182009-10 18 122,387 6,799 8 66,777 8,3472010-11 19 178,507 9,395 8 90,131 11,2662011-12 17 170,019 10,019 9 96,264 10,6962012-13 18 186,342 10,352 9 98,909 10,990
MEDIA
RECO
RDS
2018-19 NEBRASKA BASKETBALL
166
ATTENDANCE