
006092
18
1 Protocol for Designing and Conducting Potato Field Experiments for Modeling Purposes
-
Upload
international-potato-center -
Category
Documents
-
view
215 -
download
2
description
This document summarizes the minimum information required to obtain the parameters for a simplified potential growth model. The experiments developed for this purpose should be conducted under optimal conditions; that is, without water or nutrient limitations and without damage from diseases, pests or weed competition
Transcript of 006092

1
Protocol for Designing and
Conducting Potato Field
Experiments for Modeling
Purposes

2
Protocol for Designing and Conducting Potato Field Experiments for Modeling Purposes
© International Potato Center (CIP), 2013
ISBN: 978-92-9060-430-3DOI: 10.4160/9789290604303
CIP publications contribute important development information to the public arena. Readers are encouraged to quote or reproduce material from them in their own publications. As copyright holder CIP requests acknowledgement, and a copy of the publication where the citation or material appears. Please send a copy to the Communication and Public Awareness Department at the address below.
International Potato CenterP.O. Box 1558, Lima 12, [email protected] • www.cipotato.org
Produced by the CIP Communication and Public Awareness Department (CPAD)
Correct citation:Production Systems and the Environment (PSE). International Potato Center (CIP). 2013. Protocol for Designing and Conducting Potato Field Experiments for Modeling Purposes. CIP. Lima, Peru. 16 p.
Production CoordinatorCecilia Lafosse
Design and LayoutNini Fernandez-Concha
Noviembre 2013

3
Protocol for Designing and
Conducting Potato Field
Experiments for Modeling
Purposes
The following document summarizes the minimum
information required to obtain the parameters for a
simplifi ed potential growth model. The experiments
developed for this purpose should be conducted
under optimal conditions; that is, without water
or nutrient limitations and without damage from
diseases, pests or weed competition.

4
General Information
• Leader• Collaborators• Institution
Location
Register the geographical coordinates of the experimental site. Use the spherical coordinate system and express coordinates in sexagesimal de-grees (Degrees:Minutes:Seconds). Otherwise, specify the coordinate sys-tem and datum used. Make use of a GPS or a National Map at the scales 1:25000 or 1:100000.
Minimun data• Country• Administrative Division 1• Administrative Division 2• Administrative Division 3• Site• Latitude (Degrees:Minutes:Seconds)• Longitude (Degrees:Minutes:Seconds)• Elevation (m.a.s.l.)• Ecological classifi cation or agro-ecological zone
Experimental Design
More information• Steel, R., J. Torrie, D. A. Dickey. 1997. Principles and procedures of statistics:
a biometrical approach. McGraw-Hill. 666 pages• Kuehl, R. O. 2000. Design of Experiments: Statistical Principles of Research
Design and Analysis. Duxbury/Thomson Learning. 666 pages.
ScopeIt is recommended to select a homogeneous experimental fi eld for imple-menting modeling trials of potential growth. A varietal trial in the fi eld may be blocked to lessen eff ects of soil fertility diff erences between locations. The completely randomized block design can be used when the experi-mental units can be meaningfully grouped. Such a group is called a block or replication. The object of grouping is to have the units in a block as uniform as possible. Variability among units in diff erent blocks will be greater, on the average, than variability among units in the same block. Ideally the vari-ability among experimental units is controlled so that the variation among

5blocks is maximized while the variation within is minimized (Steel and Tor-rie 1997).
Genotypes will be assigned to blocks. In order to implement destructive samplings in the fi eld, each block will include 6 small randomized sub-plots, by 20 plants (Appendix 1). Considering 20 plants per sub-plot, 6 destructive samplings and 3 blocks, approximately 360 tuber-seeds will be required and approximately 250 m2 of land per each genotype.
Data for experimental design• Experiment type• Experimental design• Number of blocks • Treatments• Experiment total area (m2)
Data of genotype
More information• International Potato Center (CIP). Genetics and Crop Improvement; Inte-
grated IT & Computational Research. 2013. Catalogue of potato varieties and advanced clones [CD-ROM]. Lima (Peru). CIP. ISBN 978-92-9060-382-5.https://research.cip.cgiar.org/redlatinpapa/pages/home.php
Minimum data• Number of genotypes to be tested• Variety name, clone code or CIP number• Growing cycle: short (<120 days), intermediate (120-150 days), long (>150
days)• Response to photoperiod: short (N<13), intermediate (N=13-15), long
(N>15)
Desirable data• Tolerance or resistance to biotic and abiotic factors• Parental material
Agronomic data
Minimum data• Planting date• Planting method• Tuber-seed type: basic, pre-basic, commercial, botanic seed, cutting• Tuber-seed mean size: weight (gr), diameter (mm)• Sprout mean length at planting (mm)

6 • Planting density (plant/m2)• Distance between rows (m)• Distance between plants (m)• Planting depth (cm)• Harvest date
Desirable data• Dates and volume of water applied (m3/ha) • Irrigation type• Sources and doses of fertilization• Fertilizers application dates• Organic matter application (t/ha)• Pests and diseases control
Meteorological data
More information• World Meteorological Organization. 2008. Guide to Meteorological Instru-
ments and Methods of Observation. WMO-No. 8. Seventh edition. Geneva http://www.wmo.int/pages/prog/gcos/documents/gruanmanuals/CIMO/
CIMO_Guide-7th_Edition-2008.pdf• World Meteorological Organization. 2011. Guide to Climatological Prac-
tices. WMO-No. 100. Geneva http://www.wmo.int/pages/prog/wcp/ccl/documents/WMO_100_en.pdf
ScopeIt is required to install an automatic weather station in the experimentation site in order to record daily meteorological data (Figure 1). For that purpose, consider the World Meteorological Organization (WMO) procedures. If you do not have a weather station, try to identify the closest one. It is advisable to check the continuous operation of sensors and data loggers.
Minimum data• Location of the weather station• Latitude (Degrees:Minutes:Seconds)• Longitude (Degrees:Minutes:Seconds)• Altitude (m.a.s.l.)• Daily records of Minimum temperature (ºC)• Daily records of Maximum temperature (ºC)• Daily records of Solar radiation or sunshine hours (MJ. m-2.day-1)
Recommended data• Daily records of Rainfall (mm.day-1)• Daily records of Relative humidity (%)• Daily records of Reference evapotranspiration (mm.day-1)• Daily records of Dew point temperature (ºC)• Daily records of Wind speed and direction (km.hour-1)

7Figure 1
Soil data
Minimum data• Texture classifi cation• Sand (%)• Silt (%)• Clay (%)
Figure 1. Meteorological Weather Station

8 Recommended data• Soil characterization LAB ANALYSIS by soil profi le.• Field capacity and wilting point (%vol)• Daily records of Soil temperature (ºC) and Soil water content (%vol), by
soil profi le
Phenology
More information • Haverkort, A.J., MacKerron, D.K.L. (eds.). 1995. Potato ecology and mod-
eling of crops under conditions limiting growth: Proceedings. Dordrecht (Netherlands). Kluwer Academic Press.
• Federal Biological Research Centre for Agriculture and Forestry. 2001. Growth stages of mono-and dicotyledonous plants. BBCH Monograph. Edited by Uwe Meier. Second Edition.
http://www.bba.de/veroeff /bbch/bbcheng.pdf
ScopeCrop phenology characterization contributes to many scientifi c disciplines from biodiversity, agriculture, agrometeorology and forestry to human health. Potato phenology stages include: emergence, tuber initiation, tu-ber fi lling and senescence (Haverkort & MacKerron 1995). Identifi cation of these phases brings important information about the ef-fect of climate on the growth and development of the crop (Figure 2).
Basic PrincipleThe fi rst ideas about the quantitative study of the relationship between plant growth and temperature were proposed by Reaumur in 1730. The concept of heat units or degree days, as the summation of temperatures above a certain threshold value, will be used for the assessment of physi-ological time scales in potato. Degree day calculation, has vastly improved the description and prediction of phenological events.
EquipmentWeather station for daily records of Minimum and Maximum temperature
ProcedureIn order to determine the emergence day, it is necessary to perform daily monitoring of the number of plants that emerge per plot and repetition. The percentage of emergence is calculated by comparing the number of plants emerged with the total number of plants per plot and repetition. The emergence onset is considered once this ratio reaches 50%. It is possible to express the emergence initiation using thermal time units (GDD). The other phenological stages will be estimated from the canopy cover and dry matter periodic data.

9
GDD =
2
(TMAX + TMIN )- TBASE
Calculation
Where:GDD Growing degree daysTMAX Maximum temperatureTMIN Minimum temperatureTBASE Threshold temperature for which plant growth begins
Figure 2. Potato phenology stages
Canopy cover
More information• Haverkort, A.J., Uenk, D., Veroude, H., Waart, M. van de. 1991. Relation-
ships between ground cover, intercepted solar radiation, leaf area index and infrared refl ectance of potato crops. Potato Research. (Netherlands). 34(2):113-121.
ScopeCanopy structure is essential to understand the infl uence that structure has on plant-environment interactions. Canopy cover measurements bring an indirect estimation of the crop’s light interception capacity.
Basic PrincipleCoupling digital photography and computer software applied in a strict monitoring protocol enabled rapid sampling and recording of quantitative canopy cover values. Image segmentation techniques can be used to sepa-rate healthy green vegetation from the other components of the scene.
Figure 2

10 Equipment1. A digital camera (point and shoot camera or single-lens refl ex (SLR) cam-
era) with a standard lens (approximate focal length of 50 mm, if avail-able).
2. Bubble level.3. Measuring tape.4. Software for data processing
Sampling intensityFor monitoring purposes, take pictures of the canopy cover every fi fteen days at 25, 40, 55, 70, 85, 100 and 115 days after planting (dap). We can select diff erent sampling periods taking into account the growing cycle of an early or late variety. Establish preferably a fi xed hour to take the photo-graphs considering the time with the best lighting during the day. It is rec-ommended to take 16 canopy cover photos per sub-plot and repetition.
Procedure
1. Set up the camera in automatic mode considering the following features:
a. No zoomb. No fl ashc. Iso 100 (if available)d. Maximum image resolution
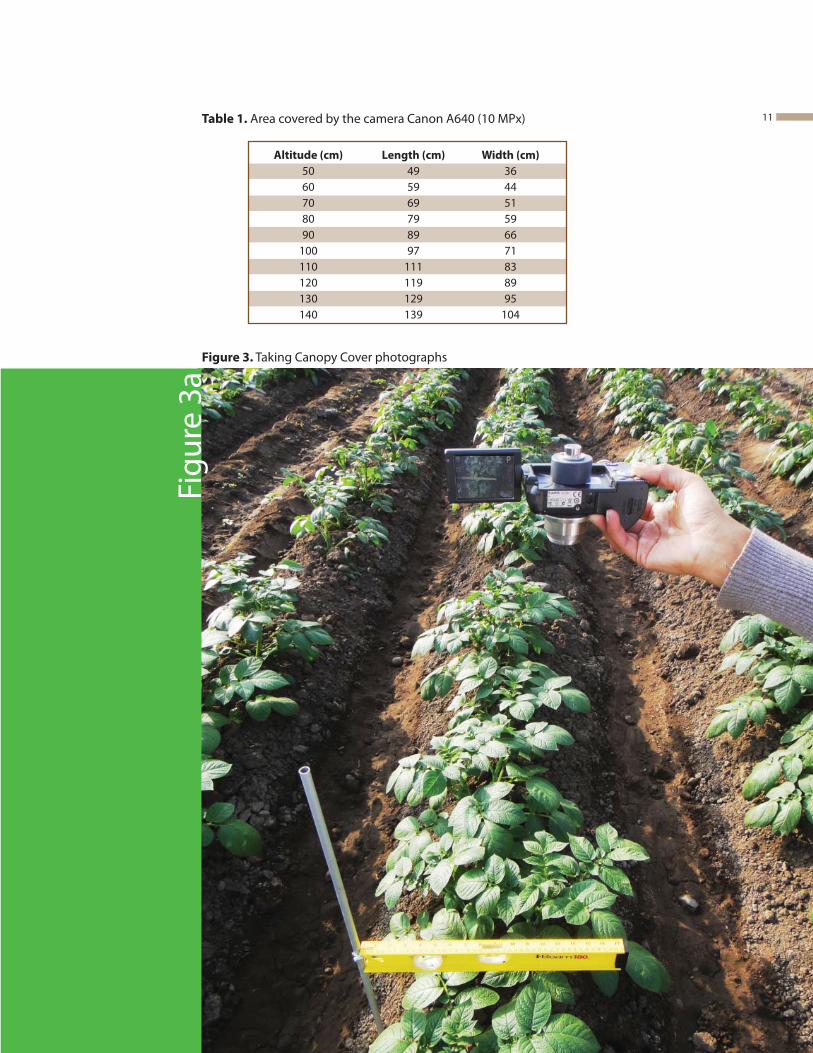
2. Estimate the frame covered by your camera at diff erent altitudes (Use Table 1 as a reference).
3. Select the appropriate height according to the crop distance. It is recom-mended to include two plants per picture.
4. Place the camera with its lens oriented directly to the top of the plant, using the selected altitude from the top of the plant (e.g.: 1 meter from the top of the plant to the camera’s lens). Put the long side of the camera along the row distance and the short side along the plant distance of the crop. See Figure 3a.
5. Make use of the bubble level to locate the camera parallel to the ground.
6. Use the previous settings to take a single picture of an object with a known distance. A retractable tape measure could be used. See Figure 3b.
7. Take pictures of canopy cover, after having verifi ed the altitude, level and the frame position of the camera. See Figure 3c.
8. If available, make use of a tripod and a remote control or a cable and a laptop for shooting to avoid being part of the image.
9. The desirable number of photographs should be a function of the local variability. As a rule of thumb, we recommend at least 15% of the total number of plants. If infeasible, as many pictures as you can take, pro-vided you sample the heterogeneity of the plots.
10. Download the images and use software to estimate canopy cover area and percentage.
11
Figu
re 3
a Altitude (cm) Length (cm) Width (cm)
50 49 36 60 59 44 70 69 51 80 79 59 90 89 66 100 97 71 110 111 83 120 119 89 130 129 95 140 139 104
Table 1. Area covered by the camera Canon A640 (10 MPx)
Figure 3. Taking Canopy Cover photographs

12 1), or in completely randomized blocks (CRB), when there is any gradient of humidity, salinity or slope (Steel and Torrie 1997). See an illustrative example in Figure 1. In the fi rst case (CRD), considering three repetitions per plot, 300 tubers-seeds will be required, and approximately 200m2 per each genotype.
Data for experimental design
• Experiment type• Experiment design• Plot name• Sub-plot name• Plot number• Sub-plot number• Number of plants per plot• Number of repetitions per plot• Number of plants per sub-plot• Number of furrows per sub-plot• Number of plants per row• Experiment total area (m2)
Data of genotype
References• https://research.cip.cgiar.org/redlatinpapa/pages/home.php
Minimum data• Number of genotypes to be tested• Variety name, clone code or CIP number• Growing cycle: short (<120 days), intermediate (120-150 days), long (>150 days)• Response to photoperiod: short (N<13), intermediate (N=13-15), long (N>15)
Desirable data• Tolerance or resistance to biotic and abiotic factors• Parental material
Data of experimental agronomic management
Figu
re 3
bFi
gure
3c

13
Figure 4
Calculation Image processing software will be used to count the number of pixels cov-ered by healthy green vegetation and estimate the area and percentage of canopy cover (Figure 4).
Figure 4. Canopy Cover Photograph and Classifi cation Results
UnitsCanopy cover (%), percentageDays after planting (dap)Days after emergence (dae)
Dry weight by organs
More information• Undersander D., Mertens D., Thiex N. 1993. Forage Analyses Procedures.
National Forage Testing Association. http://www.foragetesting.org/fi les/Laboratory Procedures.pdf
ScopeUse this procedure in order to study the crop growth dynamics. Total dry-matter protocol should be used in order to determine the dry matter con-tent of leaves, stems and tubers on potato individual plant samples. Total dry weight of leaves, stems and tubers is based on the dry matter content estimation and the total fresh weight by organs. Samples dried by this pro-cedure are not appropriate for subsequent fi ber, lignin, or acid detergent insoluble nitrogen analysis.
Basic PrincipleThe functional method of growth analysis allows us to describe the crop growth in a continuous way, adapting mathematical functions or other functions to the original growth data. Moisture is evaporated from sample by oven drying. Total dry matter is determined gravimetrically as the resi-due remaining after drying. Weighing may be done on hot samples.

14 Equipment• Digging fork and shovel • Pruning shears • Vegetable cutting machine or cutting board and a knife• Paper bags and labels • Top loading electronic balance, accurate to 0.1 mg• Forced-air drying oven at 100ºC, capable of maintaining temperature at
±2ºC.
Sampling intensitySequential destructive sampling of a group of complete individual plants will be carried out for growth monitoring. Dry weight of leaves, stems and tubers is recorded every 15 days at 40, 55, 70, 85 and 100 days after planting (dap). Reserve the last sub-plot for the harvest sampling.Minimum 6 complete plants should be sampled per plot, selecting them from the central part. In this way, 18 plants are collected per genotype, at each sampling. Selected plants should be representative of the average condition of the plot. Any plant showing anomalous growth should be not considered for the sampling.
Procedure• Before start the sampling at fi eld, dry the paper bags at 55 ºC for 8 hours.
Weigh paper bags on a top loading balance and record weight to nearest 0.01 g.
• Extract and transfer each selected plant to a processing area. It is recom-mended to identify plants using codes. Prevent the loss of weight of plant material.
• Clean or rinse the tubers and stems if necessary and let them aerate or drain for a few minutes to air then separate by organ, leaves, stems and tubers.
• Record the total fresh weight (TFW) of leaves, stems and tubers separately.• Reserve an individual sub-sample of approx. 150 g. of leaf, stem and tu-
ber per each individual plant sample. Cut up the sub-samples in uniform pieces.
• Place the sub-samples in previously dried paper bags and label.• Tare empty bags to zero and weigh constant volume of coarse leaves,
stems and tubers and register the fresh weight (SFW), recording weight to nearest 0.01 g.
• Place sub-samples into an oven which has been preheated to 100 ºC (or 105 ºC) for at least 3 hours. Oven should return to temperature within 1 hour after samples have been placed into it.
• Leave samples in oven for 24 hrs. at 100 ºC.• Individually remove paper bags from the oven and immediately weigh to
obtain the dry weight of the sub-samples (SDW). Record weight to nearest 0.1 mg.
Comments• Use a forced-air oven so that drying is more rapid and uniform and tem-
perature drop is minimized during weighing.• Samples should be placed in drying oven in such a way that air can circu-
late freely. Samples should not touch each other.

15• The balance must be located next to the oven; carrying samples any dis-tance will allow cooling and absorption of moisture.
• Samples should be removed from oven one at a time and immediately weighed.
• Use of computer software to electronically record weight can reduce vari-ance in weights due to operator diff erences in determining minimum weight.
CalculationTotal dry weight by leaves, stems and tubers can be calculated using this equation:
TDW = (TFW*SDW)/SFW
Where:TDW Total dry weight (g/plant)TFW Total fresh weight (g/plant)SDW Sub-sample dry weight (g/plant)SFW Sub-sample fresh weight (g/plant)
Dry matter content of tubers
At harvest, register the total fresh weight of tuber per plant and perform a commercial quality selection.Select a sub-sample of the tuber yield to calculate dry matter content of tubers by genotype. Use the previous procedure to estimate dry matter content of tubers.
CalculationTotal dry matter content of tubers, can be estimated using this equation:
DMCt= (DW
t / FW
t)*100.
WhereDMC
t Dry matter content of tubers
DWt Dry weight of tubers
FWt Fresh weight of tubers

16
0.9 m
1 m
Block I a2b2 a4b5 a3b2 a1b1 a2b5 a4b6 a3b5 a1b4 a2b4 a4b1 a3b6 a1b2 a2b1 a4b4 a3b1 a1b3 a2b6 a4b3 a3b4 a1b5 a2b3 a4b2 a3b3 a1b6 Block II
a4b5 a1b1 a2b3 a3b1 a4b3 a1b5 a2b6 a3b3 a4b6 a1b4 a2b1 a3b4 a4b4 a1b6 a2b5 a3b2 a4b2 a1b3 a2b4 a3b6 a4b1 a1b2 a2b2 a3b5 Block III a3b3 a1b2 a4b5 a2b4 a3b6 a1b5 a4b3 a2b3 a3b1 a1b4 a4b6 a2b6 a3b5 a1b1 a4b1 a2b2 a3b2 a1b3 a4b4 a2b5 a3b4 a1b6 a4b2 a2b1
a: Genotype
b: Destructive sampling order
a1b1
Rows0.9 m
Plants0.3 m
Sampling area
Border plants
Appendix 1
Layout for fi eld experimentsComplete Randomized Block Design

17

18
The International Potato Center (known by its Spanish acronym CIP) is a research-for-development organization with a focus on potato, sweetpotato, and Andean roots and tubers. CIP is dedicated to delivering sustainable science-based solutions to the pressing world issues of hunger, poverty, gender equity, climate change and the preservation of our Earth’s fragile biodiversity and natural resources.www.cipotato.org
CIP is a member of CGIAR.CGIAR is a global agriculture research partnership for a food secure future. Its science is carried out by the 15 research centers who are members of the CGIAR Consortium in collaboration with hundreds of partner organizations. www.cgiar.org
International Potato Center • Av. La Molina 1895, La Molina •
Apartado 1558 Lima 12, Perú


