0 . - William J. Hughes Technical Center · 8 CF6 Engine Fuel Control Incidents by Year for...
119
DOT/FAA/CT-92/29 FAA Technical Center Atlantic City International Airport, N.J. 08405 Aircraft Turbine Engine Reliability and Investigations Final Report through Information Service, Springfield, Virginia 22161. 0 . U.S. Department of Transportation Federal Aviation Administration
Transcript of 0 . - William J. Hughes Technical Center · 8 CF6 Engine Fuel Control Incidents by Year for...

DOT/FAA/CT-92/29
FAA Technical Center Atlantic City International Airport, N.J. 08405
Aircraft Turbine Engine Reliability and Investigations
Final Report
through Information Service, Springfield, Virginia 22161.
0 . U.S. Department of Transportation Federal Aviation Administration

This doct of the U. S. I of informatior assumes no li.:
The Unite or manufact h ure erein sol 1
objecti e y ve of t
ooT/FAA /CT-92/ 29 c.l
Richter, aruce A· Aircraft turbine engine reliabilitY and inspection investigations
lip est
lucts
the

1. Report No. 2. Government Acceaaion No.
DOT/FAA/CT-92/29 4. Title ond Subtitle
AIRCRAFT TURBINE ENGINE RELIABILITY AND INSPECTION INVESTIGATIONS
Technical i(eport Documentation Page
3. Recipient" a Cotolog No.
S. Report l)ote
October 1993 6. Perfoflfting Orgoni 1otion Code
f-::~~~;--;----------------------------18' Performing Orgoni1otion Report No. 7. Author' a)
Bruce A. Richter, Margaret Ridenour-Bender, Mike Tsao 9. Performino Orooni1otion Nome ond Addreu
Science Applications International Corporation Logistics Technology Division 4335 Piedras Drive, West, Suite #223 San Antonio, TX 78228 ~---------------~~--------------------------~ 12. Sponaoring Agency Nome ond Addreu
U.S. Department of Transportation and* Federal Aviation Administration Technical Center
DOT/FAA/CT-92/29 10. Work Unit No. ITRAIS)
11. Contract or Grant No.
67-6733 13. Typo of Report ond Period Co.,orod
Final Report
14. Sponsoring Agency Code
ACD-220 Atlantic City International Airport, NJ 08405 ~ .. ---------------~~-------------------~ 15. Supplementary Hotn
*Sandia National Laboratories Albuquerque, New Mexico 87185 FAA Technical Center Project Manager: David Galella
16. Abatract
This study of JT9D, CF6, and PT6 aircraft engine reliability represents a follow-on effort to the JT8D engine study which was published in the Federal Aviation Administration (FAA) Technical Center Final Report DOT/FAA/CT-91/10. As with the JT8D engine study, this study trended in-flight shutdowns and unscheduled removal rates of JT9D, CF6, and PT6 turbine aircraft engines for a thirty-six-month period covering February 1988 through January 1991. As in the previous report the methodology was to review which air carriers consistently exceeded the standard deviation norm for in-flight shutdowns and unscheduled engine removals on a monthly basis and then examine the engine component failures reported by those carriers. Engine component failures were grouped as follows: bearings, airfoils, cases, controls and accessories, fuel/oil systems, and others (not trended). For this study of the JT9D, CF6, and PT6 engines, controls and accessories typically produced the largest number of in-flight flameouts, compressor stalls, and engine shutdowns. In addition to the actuarial analysis and component failure mode trending performed on the JT9D, CF6, and PT6 engines, application of an inspection procedure developed for the JT8D engine was made on the JT9D and CF6 engine cases.
17, Key Worda
Actuarial Analysis In-flight Shutdowns Unscheduled Engine
Removals Service Difficulty
Engine Case Data Base Ultrasonic Inspection
Report (SDR)
18. Diatribution Stotomont
Document is available to the public through the National Technical Information Service, Springfield, Virginia 22161
19. Security Clonif, (of thia report) 20. Security Ciani f. (of thia pogo) 21. No. of Pagn 22. Price
Unclassified Unclassified 119
Form DOT F 1700.7 <B-721 Reproduction of completed pogo authorized

PREFACE
This report was prepared by Science Applications International Corporation (SAIC) under contract number 67-6733 with Sandia National Laboratories, Albuquerque, New Mexico, for the Federal Aviation Administration (FAA) Technical Center. The FAA has established an Aging Aircraft Nondestructive Inspection (NDI) Development and Demonstration Center (AANC) at Albuquerque International Airport and Sandia National Laboratories. This work supports the AANC and the FAA's National Aging Aircraft Research Program.
The JT9D, CF6, and PT6 engine trending and component analysis was conducted by the SAIC Logistics Technology Division located in San Antonio, Texas. A. Bruce Richter and Margaret Ridenour-Bender performed the actuarial data analysis. The development of the NDI technique for the JT9D engine diffuser, the CF6 turbine mid-frame and compressor rear frame cases was accomplished by the SAIC Ultra Image International Division located in New London, Connecticut, under the direction of Robert H. Grills and Mike C. Tsao.
ii
TABLE OF CONTENTS
EXECUTIVE SUMMARY
INTRODUCTION
Purpose
Background
PROCEDURE
Data Sources
Trending Methodology
DISCUSSIONS AND RESULTS
Trending Results
Macro Scan Results
JT9D Engine Component Failure Analysis
CF6 Engine Component Failure Analysis
Pf6 Engine Component Failure Analysis
JT9D Engine Case Failure Analysis
JT9D Diffuser Case NDI Development
CF6 Engine Case Failure Analysis
CF6 Engine Case NDI Development
CONCLUSIONS
APPENDICES
A - Actuarial In-flight Shutdown and Engine Removal Data
B - Airline Macro Scans
C- UI-JVI'M- Ultrasonic Imaging System Specifications
D- NDI Procedure Description
iii
Page
ix
1
1
1
2
2
2
8
8
10
10
20
24
29
30
47
47
58

LIST OF FIGURES
Figure Page
1 Sample Data Comparing Airline ABC to the Rest of the Industry for B-7 4 7 JT9D In-flight Engine Shutdown Rates 9
2 Sample Data Comparing Airline ABC to the Rest of the Industry for B-7 4 7 JT9D Unscheduled Engine Removal Rates 9
3 JT9D Engine Fuel Control Removals by Year for Selected Carriers 13
4 JT9D Engine Fuel Pump Removals by Year for Selected Carriers 14
5 JT9D Engine Vane Control Removals by Year for Selected Carriers 15
6 JT9D Engine Tr2 Sensor Removals by Year for Selected Carriers 16
7 JT9D Engine Pressure Ratio Bleed Control Valve Removals by Year for Selected Carriers 16
8 CF6 Engine Fuel Control Incidents by Year for Selected Carriers 22
9 CF6 Engine Fuel Pump Failure Incidents by Year for Selected Carriers 23
10 PT6 Engine Reported Fuel Control Incidents by Year for Selected Carriers 26
11 PT6 Bleed Valve Failure Incidents by Year for Selected Carriers 27
12 PT6 Fuel Pump Removals by Year for Selected Carriers 28
13 JT9D Outer Combustor Diffuser- Sample 1 32
14' JT9D - Sample 1 and Surface Identification 32
15 JT9D- Sample 1 Possible Angle Beam Directions Through Weld Repair of Service Induced Crack 33
16 JT9D- Sample 1 Angle Beam Through Weld Repair Material of Crack 33
17 Ultra Image Test 45D5M2G, Shear Wave, Sample 1, Scanning From Inner Surface, E 34
18 Ultra Image Test 5MQTR60, Shear Wave, Sample 1, Scanning From Inner Surface, E 35
19 Ultra Image Test 5MREJSK, Shear Wave, Sample 1, Scanning From Outer Surface, D 36
20 Ultra Image Test FAAT2, Shear Wave, Sample 1. Scanning From Outer Surface, A 37
21 JT9D Outer Combustor Diffuser - Sample 2 38
22 JT9D Sample 2 with 20 mil Saw Cut 38
23 Ultra Image Test Ll5DNOMC, Compression Wave, Sample 2. Scanning From Inner Surface 39
24 Ultra Image Test PYCRKSAM, Shear Wave, Sample 2 40
iv

Figure
25
26
27
28
29
30
31
32
33
34
35
36
37
38
39
40
41
LIST OF FIGURES (CONTINUED)
Ultra Image Test NYCRKSAM, Shear Wave, Sampl~ 2
JT9D Automated Scanner Motor Controller
JT9D Motorized Scanner Sketch
JT9D Motorized Scanner Track and Arm Mechanism
JT9D Motorized Scanner and Sample 2
Picture of JT9D Motorized Scanner and Sample 2
Ultra Image Test BSC2PYCK, Shear Wave, Sample 2, A-and B-Scan
Ultra Image Test SANDIA-7, Shear Wave, Sample 2, Motorized Scan From Inner Surface of Case
Picture of CF6 Samples, TMF, CRF
Sketch of CF6 Turbine Mid-Frame (TMF) Sample 1
Ultra Image Test CF6S2A, Shear Wave, TMF Sample 1
Sketch of CF6 Turbine Mid-Frame (TMF) Sample 2
Ultra Image Test CF6S2Al, Shear Wave, TMF Sample 2
Sketch of CF6 Turbine Mid-Frame (TMF) Sample 3
Ultra Image Test CF6 TMFS3, Shear Wave , TMF Sample 3
Sketch of CF6 Compressor Rear Frame (CRF) Sample
Ultra Image Test CF6CRFA2, Shear Wave, CRF Sample
v
Page
41.
42
42
43
43
44
45
46
49
50
51
52
53
54
55
56
57

LIST OF TABLES
Table
1 ACAU and PRR Data 2/88 (JT9D)
2 B-747 /JT9D In-flight Shutdown Monthly Performance
3 B-7 4 7 I JT9D Engine Removal Monthly Performance
4 B-747 /JT9D In-flight Shutdowns 36 Month Data Summary Sheet
5 B-747 /JT9D Engine Removals 36 Month Data Summary Sheet
6 Masked Airlines Identified For Component Performance Analysis
7 JT9D Engine Inventory Failure Incident Analysis for Selected Carriers
8 JT9D Engine Component Failure Incidents for Selected Carriers
9 JT9D Engine Fuel Control Failure Incidents for Selected Carriers
10 JT9D Engine Vane Controller Failure Incidents for Selected Carriers
11 JT9D Engine Trouble-shooting, Engine S/N. XXXXXX
12 JT9D Engine Trouble-shooting, Fuel Control
13 JT9D Engine Trouble-shooting, Engine S/N YYYYYY
14 JT9D Engine Trouble-shooting, Engine S/N XXXYYY
15 CF6 Engine Component Failure Incidents for Selected Carriers
16 CF6 Engine Fuel Control Failure Incidents for Selected Carriers
1 7 CF6 Engine Fuel Pump Failure Incidents for Selected Carriers
18 PT6 Engine Component Incidents for Selected Carriers
19 Pr6 Engine Fuel Control Failure Incidents for Selected Carriers
20 PT6 Engine Bleed Valve Failure Incidents for Selected Carriers
21 Pr6 Engine Fuel Pump Failure Incidents for Selected Carriers
22 PT6 En~ne Trouble-shooting
vi
Page
4
5
6
7
7
10
11
12
14
15
17
18
18
19
21
22
23
25
26
27
28
29

ACAUPRR
CRF
DS
EC
EDM
EGT
EVC
FAA
FOD
GE
NDI
NG
PRBC
PWA
SAIC
SDR
TIG
TMF
UI-IV'fM
ABBREVIATIONS
Air Carrier Aircraft Utilization and Propulsion Reliability Reports
Compressor Rear Frame
Directionally Solidified
Eddy Current
Electrode Discharge Machine
Exhaust Gas Temperature
Engine Vane Controller
Federal Aviation Administration
Foreign Object Damage
General Electric
Nondestructive Inspection
Gas Generator
Pressure Ratio Bleed Control
Pratt & Whitney Aircraft
Science Applications International Corporation
Service Difficulty Reports
Tungsten Inert Gas
Turbine Mid-Frame
Ultra Image IV'fM
vii

EXECUTIVE SUMMARY
This study of JT9D, CF6, and PT6 aircraft engine reliability represents a follow-on effort to one which initially focused on the JT8D engine. The results of the JT8D engine study were published in the FAA Technical Center final report DOT/FAA/CT-91/10.
The actuarial analysis approach used in the JT8D engine study had been to trend in-flight shutdowns and unscheduled engine removals over a twenty-four month period. The same approach has been used in this study of JT9D, CF6, and PT6 engines, using a thirty-six month period covering February 1988 through January 1991. The methodology, as in the previous report, was to review which air carriers consistently exceeded the standard deviation norm on a monthly basis and then to examine the component failures reported by those air carriers. Only FAA data has been used in this report. Conversations with the engine manufacturers and selected air carriers were used to confirm trends exhibited by the analysis of the FAA data.
Two JT8D engine components identified in the initial study for possible development of NDI procedures were the #6 bearing oil tube and the 13th stage bleed air duct. It was determined that NDI procedure development was inappropriate for each of these items since recent modifications had resolved the documented problems.
Each of the three engines (JT9D, CF6, and PT6) has been reviewed for component failure trends. The original tasking was to review engine component failure information from 1983 through 1991. However, the FAA central data bank containing Service Difficulty Report (SDR) information could only provide data from January 1986 through November 1991. Major engine component areas reviewed have included: bearings, airfoils, cases, controls and accessories, and fuel/oil systems. These engines represent different design types (turbofan versus turboprop}, improved component designs (air cooled turbine air foils}, and materials technology so direct comparisons should be avoided. However, the percent of failure incidents is shown below for each engine type including the JTSD engine:
ORIGIN OF FAILURE JT8D CF6 JT9D PT6
BEARINGS 12% 5% 4% 7% AIRFOILS 26% 26% 10% 7% CASES 2% 3% 2% CONTROLS & ACCESSORIES 23% 39% 44% 55% FUEL/OIL SYSTEMS 20% 11% 10% 15% OTHERS (NOT TRENDED) 17% 16% 30% 16%
For this study of the CF6, JT9D, and PT6 engines, controls and accessories typically produced the largest number of in-flight flameouts, compressor stalls, and engine shutdowns. Diagnostic troubleshooting procedures for controls and accessories for these engines have not been effective as multiple accessories are removed for precautionary measures to resolve in-flight flameouts. This practice drives high spares inventories and increases backshop repair costs for units retesting "okay".
Other major observations from the analysis of this failure data include:
1. Although bearing material and design technology has improved, main bearings continue to be a reliability problem.
2. Airfoil component reliability has significantly improved with the use of air cooling technology and Directionally Solidified (DS) material, but airfoils suffer because these
. materials are damaged during compressor stalls when cooling air flows are disrupted.
3. Fuel/oil system failures are highly susceptible to maintenance errors such as unsecured oil caps, pinched seals, stripped mounting studs, and gaskets/shims left out.
Reviews with Pratt & Whitney Aircraft (PWA) personnel on the JT9D engine and General Electric (GE) Aircraft Engine personnel on the CF6 engine validated the component failure trending accomplished. Several engine component failure trends already had configuration upgrades defined and implemented, while others were under study or not yet addressed by the engine manufacturer. A listing of the components identified during the SDR failure trending, by engine, follows:
ix

JT9D ENGINE COMPONENT FAILURE TRENPS
#3 BEARING 8TH STAGE COMPRESSOR BLADE 1ST STAGE TURBINE BLADE FUEL PUMP SHAFT ENGINE VANE CONTROLLER FUEL PUMP /FUEL CONTROL DIFFUSER CASE
CF6 ENGINE COMPONENT FAILURE TRENDS
1ST STAGE TURBINE BLADES COMPRESSOR REAR FRAME CASE TURBINE MID-FRAME CASE FUEL CONTROL/FUEL PUMP INLET GEARBOX
PT6 ENGINE COMPONENT FAIWRE TRENDS
FUEL CONTROL BLEED VALVE FUEL PUMP
In addition to the actuarial analysis and component failure mode trending performed on the JT9D, CF6, and PT6 engines, application of an inspection procedure developed for the JT8D engine was made on JT9D and CF6 engine cases. The ultrasonic inspection procedure developed for JT8D engine outer combustor case drain bosses has applicability to other engine cases. This study applied that technology to inspection of manufacturing and repair welds on JT9D engine diffuser cases, CF6 engine turbine midframe cases, and CF6 engine compressor rear frame cases. The focus of the inspection work was to be able to detect small flaws in both manufacturing and repair welds and the adjacent heat affected zones. The larger grain size of these welds typically distorts ultrasonic inspection signals searching for flaws within the weld material. This same phenomenon also occurs when cast material is used in engine cases, as in the CF6-6/ -50 engine compressor rear frame cases. This study successfully demonstrated the ability to penetrate weld material and detect flaws of 0.020 inch in length.
A permanent record of the inspection findings is a very necessary part of component life management. Recording compliance of a required inspection is not as effective as documenting the exact inspection results. The ultrasonic inspection procedure used in this study produced permanent records of the inspections made.
X

INTRODUCTION
PURPQSE
This study is a follow on effort to the Turbine Aircraft Engine Operational Trending and JT8D Static Component Reliability Study (Report DOT/FAA/CT-91/10) dated March 1992. In this study an actuarial trending analysis was conducted to review the operational reliability of the JTSD, CF6, and JT3D engines, and to also develop an NDI procedure for the JT8D engine outer combustor case. The actuarial analysis consisted of trending in-flight shutdowns and unscheduled engine removal rates of JT8D, CF6, and JT3D turbine aircraft engines for the two-year period from February 1988 to January 1990. These data are currently collected each month by the FAA and published in the Air Carrier Aircraft Utilization and Propulsion Reliability Reports (ACAUPRR). Using actuarial data from these reports, the monthly industry average and standard deviation of shutdown and unscheduled removal rates were calculated for each airframe and engine combination. The industry norm was then calculated as one standard deviation above the industry average. Rate data from individual U.S. operators of those engines were then compared to the monthly industry norm and the results were trended to determine which operators were experiencing higher than industry normal values for engine shutdown and unscheduled removal rates. Once the operators were identified, the FAA's SDR data base was queried for each of those operators to determine which components may have caused the higher than normal engine shutdowns and unscheduled engine removal rates. Actuarial trending was completed on JT8D, CF6, and JT3D engines, however, component failure analysis was completed only for the JT8D. The following JT8D components and conditions were discovered and reported in DOT/FAA/CT-91/10:
Hard Failures - #3 Bearing - #4.5 to #6 Oil Bearing Tube
Wear and Tear /Inspection Failures - 13th Stage Bleed Air Duct - Turbine Blades
Structural Failures - Case Cracking
Diagnostic Troubleshooting - Fuel Controls, Fuel Pumps
Maintenance Practices - Oil Cap Unsecured - Fuel/Oil Heater Valve Wired Open - Oil Screen Studs Pulled Loose - Oil Seals Pinched
The #6 bearing oil tube and the 13th stage bleed air duct had been identified in the initial study as possibly requiring enhanced NDI procedures. This study reviewed the status of those items and determined recent modifications had resolved the documented reliability problems. Both modifications are being incorporated by the air carriers.
The purpose of this study was to conduct an actuarial trending and component analysis to review the operational reliability of the JT9D, CF6, and PT6 engines. In addition, the NDI procedure for the JT8D engine outer combustor case developed under the Turbine Aircraft Engine Operational Trending and JT8D Static Component Reliability Study was applied to the JT9D engine diffuser case and the CF6 engine turbine mid-frame (TMF) and compressor rear frame (CRF) cases. Close coordination with the original engine manufacturers, PWA and GE, was maintained. Observations derived from the actuarial analysis and the NDI procedures were briefed to and accepted by the original engine manufacturer.
Observations, conclusions, and recommendations on specific airline operational performance and maintenance practices were not part of the purpose of this task. In that regard, no identities of specific airline performance and their respective component failures have been made.
Although the orlginal tasking required a component review for the period 1983 through 1991, the FAA data bank only contained data that was reported from January 1986 through the requested date of information output, which was November 1991. Some component failure incidents occurred in 1985 but were not reported to the FAA data bank until 1986; therefore only partial data for 1985 is included in this study.
BACKGROUND
The aerospace industry's attention toward aging aircraft has generally been focused upon aircraft fuselage structures. The philosophy towards aircraft engines has historically been that engines were periodically "regenerated" through scheduled maintenance and modification programs. For many of the dynamic components, like blades, disks, and spacers, this is basically true and applies equally to some static parts such as vanes and combustors. However, other static parts such as fan, compressor,
1

diffuser, turbine and exhaust cases are not life limited and therefore not subj~ct to periodic replacement. The engine subpanel of the June 1988 International Conference on Aging Airplanes and subsequent conferences identified the need for improved NDI procedures for aircraft turbine engine cases and frames. The Turbine Aircraft Engine Operational Trending and JTBD Static Component Reliability Study outlines an ultrasonic NDI procedure for the JT8D engine outer combustor case. A failure analysis using data from the SDR data bank was completed on the JT9D and CF6 engine cases to determine if a failure pattern was evident that would benefit from the development of an NDI procedure. In addition, the original engine manufacturers and air carriers were contacted to identifY which areas of the engine required enhanced inspection procedures. The analysis identified the JT9D engine diffuser case, the CF6 TMF and the CF6 CRF. Using the JT8D engine outer combustor case NDI procedure as a foundation, preliminary ultrasonic NDI procedures were developed for the JT9D engine diffuser case. An analysis was conducted to determine the applicability of using an ultrasonic inspection to detect cracks in the CF6 TMF and CRF.
In general, the original engine manufacturers are quick to respond to any immediate inspection procedure requirement especially when safety of flight is involved. This study investigated the practicability of applying the ultrasonic inspection procedure developed for the JTBD engine outer combustor case on either cases or frames for the JT9D or CF6 engines. Application of successful NDI procedures from one type of engine to another is not a common practice. As such, development of a successful cross application procedure could provide substantial economic benefits for the airlines.
PROCEDURE
DATA SOURCES
This study included an analysis of the JT9D, CF6, and Pf6 engine inventories to determine which air carriers reported higher than normal engine in-flight shutdowns and engine removal rates. The objective of the data analysis was to identifY those engine components recorded as causing the high rates of in-flight shutdowns and engine removals. The following sources of information were used for this actuarial study:
1. The FAA ACAUPRR, as published on a monthly basis by the Aviation Standards National Field Office at Oklahoma City, Oklahoma. This report provides the following monthly information by aircraft, engine type, and air carrier:
- Number of aircraft by aircraft model and engine series - Engine shutdowns & shutdowns/ 1000 hours - Engine removal & removals/ 1000 hours for premature unscheduled removals - 3-month moving average of engine shutdowns/ 1000 hours - Engine fleet hours
2. FAA SDRs as published by the Aviation Standards National Field Office with each issue covering a one week period. The engine section of this report provides:
- Information on specific engine incidents, identifYing the air carriers involved, aircraft models, aircraft serial number, description of the problem and often the investigation results and corrective actions taken.
3. Printouts from the FAA Operational Systems Branch, AVN-120 on the JT9D, CF6 and PT6 engine component failures from January 1986 through November 1991 that provide:
- Information on specific engine incidents, identifYing the air carriers involved, aircraft and engine dash models, date of component failures, takeoff aborts, engine shutdowns, flights diverted, description of failures, tear down results and corrective actions taken.
TRENDING METHQDOLOGY
The data analyzed in this study came from the monthly FAA ACAUPRR. For the 36-month period from February 1988 through January 1991, in-flight shutdowns and unscheduled engine removal rates were trended for all U.S. operated JT9D, CF6, and PT6 engines. From these data, monthly industry-wide average rates of in-flight shutdowns and engine removals were calculated for each of the following airframe/ engine combinations:
Engine: JT9D Airframe: B-747, B-767, DC-10
2

Engine: CF6 Airframe: A-300, B-767, DC-10
Engine: PT6 Airframe: BE-1900, BE-99, DHC-6, DHC-7, EMB-110, SH SD-330,
The actuarial analysis methodology has five steps as follows:
Step 1: Collect in-flight shutdown and unscheduled engine removal date from the ACAUPRR.
Step 2: Calculate the standard deviation of the in-flight shutdown and unscheduled engine removal rates by month, for specific airframe/engine combinations.
Step 3: Develop a summary data sheet reflecting airlines' experiences with in-flight shutdowns and unscheduled engine removals.
Step 4: Based upon the percentages calculated from the data, identify airlines to be reviewed for specific component failures.
Step 5: Review the specific component failures identified by airline for failure causes and analysis of trends.
A complete definition of each step is included below with examples of the data products developed. It should be noted these data products have been developed from FAA data sources only and no additional input has been received from the engine manufacturers or airlines.
STEP 1: COLLECT DATA
Data is obtained from the FAA ACAUPRR. Table 1 is a sample of JT9D engine data for the month of February 1988. Data from the ACAUPRR is recorded verbatim on the data sheet and a standard deviation is calculated by airframe/engine combination. When either the aircraft model series number or the engine model series number was not specified, the FAA ACAUPRR identifies this lack of information by placing an asterisk (*) adjacent to the aircraft model or the engine model. This same identification was used on the actuarial trending throughout this report.
STEP2: CALCULATE STANDARD DEVIATION
Line item information collected during Step 1 is used to calculate the monthly standard deviation. This calculation is based upon the number of incidents per 1000 flying hours. A separate calculation is made for in-flight shutdowns and for unscheduled engine removals. The standard deviation is calculated based on the ratio of the pooled in-flight shutdowns and pooled unscheduled engine removals to the total number of engine hours. Using the pooled rates creates a normalized standard deviation calculation. Therefore one exceptionally high entry will not artificially skew the data. The following equations were used for the standard deviation calculation:
summation of incidents, I:l
summation of fleet engine hours, I.H
average X (norm) per 1000 flying hours, X= (~l/lli)*1000
standard deviation, [ (X/lli)*1000 ]1/2
red range; average X + standard deviation
Whenever an air carrier flew more than one airframe/engine combination, a weighted average was calculated for that air carrier. Table 2 identifies the B-747 aircraft with JT9D engine monthly performance for in-flight shutdown rates per 1000 hours for the 36-month period. ND means No Data.
Table 3 identifies the B-7 4 7 aircraft with JT9D engine monthly performance for unscheduled engine removal rates per 1000 hours for the 36-month period.
3

TABLE 1. ACAU AND PAR DATA 2/88 (JT9D)
Engine Shutdowns Engine Removals Aircraft Engine Airline Number Daily Fleet SD Per REM Per. Model Model ACFT Util Hrs Eng Hrs 4tSD 1000 HRS 4tREM 1000 HRS 747* JT9* CTA 2 11 2636 2 0. 76 0 0.00 747* JT9* ABC 35 11 46364 3 0.06 3 0.06 747* JT9* AAA 6 4 3124 0 0.00 0 0.00 747* JT9D7 QQQ 1 11 1260 0 0.00 0 0.00 747* JT9D70A QQQ 1 11 1328 0 0.00 0 0.00 747* JT9D7A QQQ 7 9 7680 9 1.17 1 0.13 747* JT9D7A 8K8 11 8 10156 1 0.10 3 0.30 747* JT9D7A DAR 4 8 3900 1 0.26 1 0.26 747* JT9D7A RAB 11 11 13980 1 0.07 1 0.07 747* JT9D7AH LWZ 18 10 20844 1 0.05 2 0.10 747* JT9D7F 8K8 9 8 8504 0 0.00 3 0.35 747* JT9D7R4G2 RAB 2 11 2640 0 0.00 0 0.00 747122 JT9D3A RAB 13 12 17536 0 o. o·cr 3 0.17 747133 JT9D7A QQQ 1 7 808 1 1.24 1 1.24 7472008 JT9* CTA 6 8 5616 4 0.71 1 0.18 747245F JT9D70A QQQ 4 11 5240 0 0.00 1 0.19 747245F JT9D7Q QQQ 2 7 1600 0 0.00 1 0.63 747249F JT9D7Q QQQ 4 11 5116 0 0.00 1 0.20 7472518 JT9D7Q 8K8 13 9 14288 3 0.21 1 0.07 7472518 JT9D7R4G2 8K8 5 10 5968 0 0.00 1 0.17 747273C JT9D7F ILT 1 9 1056 0 0.00 0 0.00
' 7472878 JT9D7Q QQQ 1 7 844 0 0.00 0 0.00
747SP31 JT9D7A DDA 2 5 1160 0 0.00 0 0.00
SUM 181648 26 24
AVERAGE X (NORM) 0.14 0.13
STANDARD DEVIATION 0.03 0.03
RED RANGE 0.17 0.16
767 JT9D7R4D LWZ 11 11 7098 0 0.00 1 0.14
767222 JT9D7R4D RAB 19 11 12100 0 0.00 2 0.17
SUM 19198 0 3 AVERAGE X (NORM) 0.00 0.16
STANDARD DEVIATION 0.00 0.09
RED RANGE 0.00 0.25
DC1040 JT9D20 8KB 18 7 10323 2 0.19 0 0.00
DC1040 JT9D20 NZT 1 8 687 0 0.00 0 0.00
SUM 11010 2 0 AVERAGE X (NORM) 0.18 0.00
STANDARD DEVIATION 0.13 0.00
RED RANGE 0.31 0.00
4

TABLE 2. B-747/JT9D IN-FUGHT SHUTDOWN MONTHLY PERFORMANCE
FEB MAR APR MAY JUN JUL AUG SEPT OCT NOV DEC JAN FEB MAR APR MAY JUN JUL •as •sa •sa •sa •sa •sa •as •as •sa '88 '88 1 89 '89 1 a9 1 89 1 89 '89 '89
INDUSTRY 0 •. 17 0.20 0.16 0.16 0.19 0.15 0.14 0.13 0.15 0.10 0.13 0.13 0.12 0.15 0.18 0.14 0.09 0.15
CTA o. 72 0.44 0.08 0.11 0.28 o.oa 0.00 o.oo 0.10 0.00 0.00 0.19 0.00 0.12 0.23 0.00 0.17 o.oo
ABC 0.06 0.25 0.18 0.17 0.22 0.15 0.15 0.10 0.18 0.09 0.13 0.00 0.08 0.08 0.16 0.20 0.04 0.17
AAA 0.00 0.27 0.00 0.25 o.oo 0.52 1. 69 0.00 1. 62 0.00 NO o.oo 0.00 0.00 0.00 NO NO NO QQQ 0.45 0.20 0.07 0.00 0.20 0.04 0.11 0.06 0.17 0.13 0.21 0.13 0.14 0.23 0.04 0.11 0.03 ND DEF NO NO NO NO NO ND NO NO NO NO NO NO ND ND NO ND ND NO BKB 0.10 0.09 0.24 0.20 0.16 0.17 0.09 0.19 0.16 0.11 0.15 0.13 0.08 0.04 0.10 0.10 0.12 0.17
DAR NO 0.00 0.00 0.51 0.00 0.34 0.17 0.00 0.24 0.41 0.20 0.40 0.00 0.26 0.32 0.00 0.00 o.oo LWZ 0.05 0.14 0.09 0.12 0.10 0.13 0.16 0.19 0.14 ND 0.05 0.19 0.16 0.04 0.04 0.16 0.07 0.10 RAB 0.03 0.08 0.08 0.08 0.10 0.08 0.09 0.03 0.00 0.00 0.07 0.13 0.09 0.28 0.30 0.12 0.04 0.07 DDA 0 .. 00 0.00 0.00 0.00 0.00 0.00 0.00 0.00 0.00 0.00 0.00 0.00 0.00 0.00 0.00 0.00 0.00 0.71 ILT 0.00 NO 0.00 ··0.00 0.00 0.00 NO o.oo NO ND o.oo 0.00 NO NO 0.59 0.00 ND 0.40 JKL NO NO NO NO NO 0.00 0.00 0.00 0.30 0.00 0.00 0.31 0.62 0.00 0.31 0.00 0.00 0.001
·NNN NO NO NO NO NO NO NO NO NO ND NO ND ND NO I
NO :~o ND ND !
01 AUG SEPT OCT NOV DEC JAN FEB MAR APR MAY JUN JUL AUG SEPT OCT NOV DEC JAN I '89 1 89 1 89 1 89 1 89 '90 1 90 1 90 '90 1 90 1 90 I 90 1 90 '90 '90 1 90 I 90 1 91
INDUSTRY 0.17 0.12 0.09 0.13 0.21 0.14 0.15 0.10 0.19 0.12 0.20 0.16 0.16 0.11 0.20 0.18 0.17 0.15 CTA 0.08 0.08 0.08 0.09 0.26 0.09 0.00 0.00 0.20 0.21 0.09 0.00 ND NO 0.31 0.00 0.55 o.oa·
ABC 0.06 0.09 0.07 0.17 0.26 0. 26 0.18 0.16 0.18 ND 0.41 0.35 0.14 0.04 0.25 0.17 0.16 0.20 I
AAA NO NO NO NO NO NO NO NO NO NO NO NO ND NO NO NO NO NO QQQ NO NO NO NO NO ND NO NO NO NO NO NO ND NO NO NO NO ND DEF 0.04 0.11 0.00 0.11 0.08 0.05 0.06 0.04 0.43 0.17 0. 26· 0.05 0.22 0.00 0.13 0.09 0.00 0.06
' BKB 0.25 0.12 0.13 0.02 0.25 0.08 0.19 0.13 0.13 0.10 0.14 0.16 0.16 0.21 ND ND ND ND DAR 0.36 0.00 0.23 0.24 0.20 0.00 0.00 0.00 NO 0.00 0.27 0.<'0 0.34 0.00 1.09 0.55 0.39 0. 75 LWZ 0.10 0.11 0.09 0.09 0.17 0.04 0.15 0.04 0.00 0.00 0.07 0.04 0.04 0.08 0.13 0.17 0.22 0.12 RAB 0.11 0.10 0.06 0.19 0.05 0.10 0.05 0.00 0.12 0.10 0.02 0.04 0.13 0.04 0.02 ND 0.02 0.04 DDA o.oo 0. 76 0.00 0.36 0.00 0.00 o.oo 0.35 0.37 0.00 0.00 0.37 0.39 0.00 0.00 0.00 NO 0.00 ILT 0.32 NO NO 0.00 NO ND 0.00 o.oo 0.00 0.00 o.oo NO 0.00 0.19 0.20 0.12 0.18 0.18 JKL 1.02 NO 0.00 0.00 0.25 0.59 0.31 0.00 0.52 0.25 0.27 0.00 0.25 0.00 0.00 0.00 0.00 0.00
_NNN_. NO NO 0.00 O.OQ _Q' QO Q_, QQ_ 0.00 _Q,QQ 0.00 Q,QO Q.OQ Q,OQ 0.00 0.43 0.00 0.20 0.00 0.00

TABLE 3. B-747/Jf9D ENGINE REMOVAL MONTHLY PERFORMANCE
FEB MAR APR MAY JUN JUL AUG SEPT OCT NOV DEC JAN FEB MAR APR MAY JUN JUL 1 88 '88 '88 '88 '88 '88 '88 '88 '88 '88 '88 1 89 1 89 1 89 1 89 1 89 '89 '89
INDUSTRY 0.16 0.31 0.20 0.32 0.2'7 0.25 0.25 0.20 0.23 0.24 0.26 0.18 0.21 0.19 0.26 0.22 0.19 0.25 CTA 0.14 0.33 0.24 0.15 0.28 0.34 0.26 0.00 0.48 0.00 0.20 0.18 0.13 0.23 0.20 0.41 0.17 0.33 ABC 0.06 0.23 0.22 0.27 0.30 0.34 0.30 0.22 0.16 0.19 0.18 0.00 0.08 0.14 0.18 0.22 0.08 0.23 AAA 0.00 0.55 0.30 0.00 0.00 0.00 0.00 0.00 0.00 0.00 ND 0.00 1.32 0.00 0.00 ND ND ND 000 0.19 0.28 0.08 0.15 0.17 0.22 0.14 0.17 0.21 0.14 0.32 0.04 0.25 0.10 0.38 0.20 0.18 ND DEF ND ND ND ND ND ND ND ND ND ND ND ND ND ND ND NO NO NO BKB 0.22 0.28 0.17 0.10 0.24 0.25 0.27 0.21 0.20 0.18 0.20 0.23 0.25 0.13 0.14 0.12 0.21 0.23! DAR ND 0.2'7 0.62 o.oo 0.00 0.00 0.17 0.24 0.24 0.41 0.20 0.00 0.00 0.00 0.00 0.5'7 0.00 0.00 LWZ 0.10 0.14 0.14 0.16 0.14 0.13 0.03 0.00 0.05 ND 0.14 0.29 0.21 0.22 0.26 0.04 0.17 0.261 RAB 0.11 0.25 0.15 0.66 0.2'7 0.14 0.28 0.16 0.28 0.24 0.29 0.24 0.11 0.28 0.28 0.27 0.17 0.14
DDA 0.00 0.00 0.85 0. 72 0.00" 0.00 0.00 0.00 o.oo 0.37 0.00 0.00 1.85 0.00 0.00 0.00 0.00 0.00
ILT 0.00 ND 0.00 0.00 2.25 0.00 ND 0.41 ND ND 0.00 0.00 ND ND 1.02 0.00 ND 3.01
JKL ND ND ND ND ND 0.00 0.00 0.33 0.30 0.29 0.77 0.31 0.31 0.00 0.31 0.27 0. 28 0.00 . m NNN ND ND ND ND ND ND ND ND ND ND ND ND ND NO ND NO NO ND
AUG SEPT OCT NOV DEC JAN FEB MAR APR MAY JUN JUL AUG SEPT OCT NOV DEC JAN 1 89 1 89 1 89 1 89 1 89 '90 '90 '90 1 90 '90 1 90 '90 1 90 1 90 1 90 1 90 '90 1 91
INDUSTRY 0.24 0.23 0.22 0.26 0.23 0.23 0.23 0.21 0.25 0.21 0.31 0.26 0.29 0.24 0.20 0.18 0.17 0.15
CTA 0.24 0.17 0.23 0.27 0.56 0.34 0.13 0.16 0.20 0.21 0.44 0.07 ND ND 0.31 0.00 0.55 0.08
ABC 0.19 0.16 0.21 0.27 0.33 0.16 0.34 0.14 0.28 ND 0.26 0.31 0.26 0.19 0.25 0.17 0.16 0.20
AAA ND ND ND ND ND ND ND ND ND ND ND ND NO ND ND NO ND ND 000 ND ND ND ND ND ND ND ND ND ND ND ND ~D ND ND ND ND ND DEF 0.16 0.27 0.30 0.26 0.22 0.41 0.29 0.12 0.37 0.05 0.46 0.10 .0.32 0.24 0.18 0.14 0.18 0.30
BKB 0.27 0.31 0.23 0.22 0.17 0.14 0.14 0.26 0.28 0.22 0.19 0. 26 0.28 0.29 ND NO ND ND DAR 0.54 0.00 0.23 o.oo 0.20 0.43 0.00 0.00 ND 0.00 0.27 0.19 0.00 0.20 0.00 0.00 0.00 0.00 --------- ..--·---- --LWZ 0.20 0.19 0.17 0.28 0.00 0.09 0.21 0.17 0.22 0.08 0.33 0.26 0.18 0.20 0.27 0.23 0.09 0.12 RAB 0.20 0.20 0.15 0.13 0.13 0.15 0.20 0.16 0.05 0.25 0.26 0.18 0.30 0.17 0.27 NO 0.16 0.21
DDA 0.00 0.00 0.35 0.36 o.oo 0.49 0.00 0.35 0.37 0.00 0.37 0.37 0.39 0.38 0.00 0.00 ND 0.00 ILT 0.00 ND ND 0.63 ND ND 0.00 0.00 0.00 0.16 0.26 ND 0.00 0.19 0.12 0.12 0.53 0.43 JKL 0.25 ND 0.21 0.53 0.25 0.59 0.31 0.28 0.26 0.25 0.27 0.83 0. 49 0.00 0.52 1.02 0.22 0.20 NNN ND ND 0.00 O.()Q (L_Q_Q_ _Q_._ 38 ()_!_ 00 0.00 O.OQ '--0.35 0.00 0.00 0.00 0.22 0.00 0.41 0.00 0.26

STEP3: SUMMARY DATA SHEET DEVELOPMENT
For each month, an operator's reported rates of ln-tught shutdowns and engine removals were compared with the calculated Industry nonn for a particular airframe/engine combination. A summary data sheet was developed for both In-flight shutdowns and unscheduled engine removals for each airframe/engine application for the 36 month trendL'1g period. The fact that the fractional denominator is less than 36 indicates that in one or more months no data (ND) were available for a given airline. Table 4 and 5 are the data summary sheets for the B-747 /JT9D engine in-tllght shutdowns and unscheduled engine removals, respectively.
TABLE 4. B-747 /JT9D IN-FLIGHT SHUTDOWNS 36 MONTH DATA SUMMARY SHEET
AVERAGE NUMBER NUMBER OF %OF
CARRIER OF AIRCRAFT EXCEEDANCES EXCEEDANCES CTA 8 11/34 320A» ABC 34 19/35 54% AAA 1 5/14 36% 9!1!) 21 9/17 153% DEF 21 4/lB 22% BKB 40 19/32 59% DAR 4 lB/34 153% LWZ 17 8/35 23% RAB 31 4/35 11% DDA 2 7/35 20% ILT 2 7/24 29% JKL 6 12/00 40% NNN 3 2/16 13%
TABLE 5. B-747 /JT9D ENGINE REMOVALS 36 MONTH DATA SUMMARY SHEET
AVERAGE NUMB~B. NUMBERQF ~
CARRIER QF AIRCRAFT E;XCEEDANCg EXCEEDANCES CTA 8 lB/34 53% ABC 34 11/35 31% AAA 1 3/14 21% 9!1!) 21 4/17 24% DEF 21 11/lB 61% BKB 40 :US/32 47% DAR 4 8/34 24% LWZ 17 10/35 29DA» RAB 31 13/35 37% DDA 2 13/35 37% ILT 2 7/24 29o/o JKL 6 '12./00 73% NNN 3 4/16 25%
Percentage of monthly exceedances is calculated for each of the carriers. The carriers are then ranked based on their calculated percentage of monthly exceedances.
7

STEP4: SELECTION OF AIRLINES TO STUDY
The selection of specific airlines to trend for component failures is a subjective judgment with emphasis placed upon in-flight shutdown exceedance percentages and engine removal exceedance percentages. The number of months the airline has reported data and the average number of aircraft operated are other factors which were considered. The purpose of this macro analysis is to determine which airlines may be having engine reliability problems.
STEP 5: COMPONENT FAILURE ANALYSIS
Once the airline carriers are identified and the macro scan ranking completed, a detailed analysis of component failures for each of the engine models is conducted. A printout is·requested on JT9D, CF6, and PT6 engine component failures as recorded in the SDRs. This printout covered the reporting time frame of January 1986 through November 1991. Specific information provided included the following: operating condition that occurred, which engine incurred the damage, aircraft model and serial number, engine model and serial number, air carrier, and date of incident. A brief narrative was included describing the incident and corrective action taken. This narrative also documented whether a takeoff was aborted, a flight tum back occurred, if the flight was diverted, and whether or not an engine flameout occurred. Each of these flight occurrences was considered significant in determining the severity of the specific engine component failure.
The information from this printout was used to develop each of the JT9D, CF6, and PT6 engine component failure trends. The trends identify the component failures and number of failure occurrences. It should be noted this in-depth component failure analysis was conducted only on those air carriers identified during step four as having consistently higher than normal in-flight shutdown and unscheduled engine removal rates for the 36-month trending period.
DISCUSSIONS AND RESULTS
TRENDING RESULTS
Data for the 36-month period from February 1988 to January 1991 were collected for the following airframe/engine configurations: B-747 /JT9D, B-767 /JT9D, DC-10/JT9D, A-300/CF6, B-767 /CF6, DC-10/CF6, BE-1900/PT6, BE-99/PT6, DHC-6/PT6, DHC-7 /PT6, EMB-110/PT6, and SH SD-330/PT6. For each airframe/engine combination, the industry average and standard deviation for inflight shutdowns and unscheduled engine removal rates per 1000 hours of operating time were calculated. For this study the industry normal range is the monthly pooled average plus one standard deviation. Anything greater than one standard deviation from the industry average was considered to be outside the norm and marked as an exceedance to the industry norm. Monthly actuarial trending results for each airframe/engine combination are contained in Appendix A.
With the monthly industry norms calculated, bar charts comparing individual airlines to the monthly norms for the respective airframe/engine combinations were developed. Figures 1 and 2 are examples of such charts. The negative bar indicates the airline did not report data for that particular month. The percentage of months that each airline operated over the industry's normal rate of in-flight shutdowns and unscheduled engine removals was calculated. The airlines which most often exceeded the monthly normal rates were identified for each airframe/ engine combination. Again, it should be noted that the ranking of the airlines by percent of monthly exceedances was necessary to facilitate the identification of engine components causing the exceedances and not to target individual airlines in any way.
8

B-747 IN-FLIGIITSHUIDOWNS 2/88TiiRU 1/91
0.5 "!"
0.4
~ ::r: 0.3 -~ §
0.2 ....... --.... Q) •n p..
0 0.1 ........ (/)
0
-0.1
-I I I, I IL 1a I I I
~ < ..., < 0 0 f:t. < ..., < 0 0 C;z;. < I~ < 0 I.
Jr9D ENGINE
Ci3 INDUSTRY • ABC
FIGURE 1. SAMPLE DATA COMPARING AIRLINE ABC TO 1HE REST OF'IHE INDUSTRY FOR B-747 Jf9D IN-FLIGHT ENGINE SHUIDOWN RA'IES.
B-747 ENGINE REMOVALS 2/88 TIIRU 1/91
0.35
0.3
~ 0.25
::r: 0.2 § 0.15 ....... .... 0.1 & 0:: 0.05 ........ w 0
-0.05 < ..., < 0 0 f:t. < ..., < 0 0 f:t. < ..., < 0
-0.1
Jr9DENGINE
~INDUSTRY .ABC
FIGURE 2. SAMPLE DATA COMPARING AIRLINE ABC TO 1HE REST OF 1HE INDUSTRY FOR B-747 Jf9D UNSCHEDULED ENGINE REMOVAL RA'IES.
9
0
0

MACRO SCAN RESULTS
A masked listing of each of the alrllne macro scans Is contained In Appendix B. Based on the results from the actuarial analysts, seven airlines operating the Jr9D engines, ten airlines operating the CF6 engines, and 21 airlines operating the PI'6 engines were further analyzed to Identify which engine components caused the higher than normal shutdown and unscheduled engine removal rates. The airlines were chosen based on the ln-Oight shutdown percent exceedance, unscheduled engine removal percent exceedance, number of aircraft In the alrllne's Inventory, and how many months data had been reported. Table 6 Usts the masked airlines and their airframe models.
TABLE 8. MASKED AIRLINES IDENTIFIED FOR COMPONENT PERFORMANCE ANALYSIS
I CONFIGURATION OF PERFORMANCE SUMMARY
JI'9D JI'9D JT9D CF6 CF6 CF6 B-747 B-767 DC-10 A-300 B-767 DC-10
ABC RAB BKB ABC FPC DEl" (H) LWZ NZT DDA sss DDA BKB XYZ DDA TMR DEl" CTA LWZ
00:' RAB
PT6 PT6 PT6 PT6 P1'6 PT6 BE-1900 BE-99 DHc-6 DHc-7 EMB-110 SHSD-330
OTR OIR SLP MAD MAD EKV CJU YHS WGR RC\V QXC IMX EKV AIT KNY URW TUC LOZ NPA JJJ GOP GLW PQB CBA
JTQD ENGINE COMPONENT FAILURE ANALYSIS
The Jr9D engine Inventory reviewed In this study was Installed on three different airframes which Included DC-I 0, B-7 47 and B-767. The review of the JT9D engine and these three airframes Involved fourteen carriers, operating on a monthly average of 883 Jr9D engines during the pertod of observaUon. The actuarial trending of ln-Oight shutdowns and unscheduled engine removals resulted In seven alr carders being examined more closely for speclftc component failure Incidents.
The JT9D-7 Inventory was Introduced Into operaUonal service In the mid-1960's and had a rated thrust of 45,600 pounds. Vartous thrust growth models of the -7 engine were developed to Include the -7F at 48.000 pounds of thrust, the -7Q at 53,000 pounds of thrust and the -7R402 with 54,750 pounds of thrusl The Jr9D-7R4G engine Is considered by PWA to be a slgnlflcant growth model of the engine, not just In thrust produced but In reUabiUty enhancements. Therefore, where possible, the data for the Jr9D-7R4G has been compared to the remainder of the Jr9D Inventory. This comparison Is shown In table 7 by major groupings of components. There were slgnlftcantly fewer number of Jf9D-7R4G2 Incidents when compared to the complete JT9D Inventory, as shown In table 7. The percentage of beartng Incidents (II percent) for the 7R4G2 Inventory was greater than the complete Jf9D Inventory, as was the percentage of fuel/oU system Incidents (28 percent). However, overall the 7R4G Inventory exhibited high reUabUity.
10

TABLE 7. JT9D ENGINE INVENTORY FAIWRE INCIDENT ANALYSIS FOR SELECTED CARRIERS
COMPONENT I INCIDENTS REPORTED % OF TOTAL* INCIDENTS
JT9D TOTAL* JT9D-7R4G JT9D JT9D-7R4G
BEARINGS 35 2 4% 11%
AIRFOILS 80 1 10% 6%
CASES 13 0 2% 0%
FUEL / OIL SYSTEMS 84 5 10% 28%
CONTROLS &: ACCESSORIES 366 7 44% 39%
OTHER 254 3 30% 16%
TOTAL 832 18
• Total includes JT9D-7R4G information
Review of the engine bearing failure incidents showed the #3 bearing to exhibit the highest number of failures with fifteen incidents reported. The failure modes documented involved leaking breather seals, carbon plugged scavenge tubes and cracked bearing compartments. For the six reported #4 bearing failure incidents, failed oil pressure lines, packings and the housing were the most common reported incidents.
Of the airfoil failure incidents reported, the eighth stage compressor blades and first stage turbine blades \.Vere the most prevalent. Ten eighth stage compressor blade failures were reported, with some failures in the root area of the blades. The thirty-seven first stage turbine blades reported generally failed one inch above the platform, although some failed in the root area. The turbine blade failures were due to material stress not foreign object damage (FOD).
The review of the failure data of the JT9D engine inventory showed controls and accessories to be a dominant failure trend. Of the 832 reported incidents for the five year component trending period, 366 (44 percent) of all reported failures involved controls and accessories. Table 8 exhibits the type of component failures reported. Of the controls and accessories reviewed, the following five accessories exhibited the strongest trends: fuel control, fuel pump. engine vane controller (EVC), Tf2 sensor and pressure ratio bleed control (PRBC). The fuel control and fuel pump each had numerous individual failure incidents as well as 25 reported incidents of removal of both items. Dual removals indicate the diagnostic trouble shooting information and practices were not sufficiently efficient to isolate fuel management problems to one particular item. In addition, dual removals of fuel controls and fuel pumps generate at least one good item to depot repair, where a RE1EST OK event occurs. This necessarily increases the workload and costs to the accessory backshop repair area.
1 1

TABLE 8. JT9D ENGINE COMPONENT FAIWRE INCIDENTS FOR SELECTED CARRIERS
COMPONENT NUMBER OF TOTAL INCIDENTS INCIDENTS
BEARINGS n Bearing 4 35 12 Bearing 4 13 Bearing 15 14 Bearing 6 Gearbox Bearings 6
AIRFOILS 80 Fan Blades 9 5th Stage Compressor Blades 3 7th Stage Variable Vane arm/pin 3 8th Stage Compressor Blades 10 13th Stage Compressor Blades 4 15th Stage Compressor Blades 1 1st Stage ~ Blades 37 "' 2nd Stage~ Blades 8 1st Stage HPT Vanes 1 2nd Stage ~ Vanes 4
CASES 13 Fan Case 4 Intermediate Case 1 Diffuser Case 4 Combustor Case 2 EmaustCase 2
FUEL / OIL SYSTEMS 84 Fuel Filter 28 Fuel Line 9 PS-4 Tube 8 Oil Contamination 5 on cap Missing 12 Oil Breather Tube Packing 3 on Filter 19
CONTROLS AND ACCESSORIES 366 Fuel Control 47 Fuel Control I Fuel Pump 25 Fuel Pump 57 Fuel Pump Sheared Shaft 13 Engine Vane Controller 82 Engine Electronic Control 1 TT2 Sensor 22 Thrust Control Computer 1 Pressure Ratio Bleed Control 32 Bleed Converter Valve 19 8th Stage Bleed Valve 3 15th Stage Bleed Valve 5 Flapper Valve 1 HP Butterfly Valve 1 TCC Control Valve 1 N2 Tach Generator 7 Constant Speed Drive 5 Main Gearbox 2 Au.z: Gearbox 1 Angle Gearbox 13 Angle Gearbox Coverplate Stud. 9 Hydraulic Pump 7 Fuel I on Cooler 7 on Pump 5
OTHER 254
12

The historical failure pattern for Jf90 engine fuel controls Is shown In figure 3. The number of failure Incidents Increased ln 1990 and 1991 over the previous five years. Typical fuel control part numbers Involved Included P/N 748000-5 and P/N 77-333-3. The fuel controls were generally removed for adverse performance Impact upon the engine. Some specific failures were reported as broken PS4 alr line and sheared drive shaft. Occasionally, adjustments could be made for the Idle speed being too low. However, most of the Incidents resulted In fuel control removal with depot backshop testing required. Table 9 shows the Impact upon the aircraft fllght profile by type of fuel control induced engine malfunction. The most common occurrence was engine flameout whtle In cruise. A total of 28 flameouts. or 39 percent of the total incidents, were recorded. Compressor stalls frequently occurred at the start of descent and power surges were recorded whUe In cruise.
1/l ca ~ e ~ ..... 0 1-o Q)
~ ;:l z
25
20
15
10
5
'85 (Partial
Data)
'86 '87 '88
l?.l Number of Incidents
'89 '90 '91 (Partial
Data)
FlGURE 3. Jf90 ENGINE FUEL CONTROL REMOVALS BY YEAR FOR SELEC'IED CARRIERS
The J190 engine fuel pump exhibited 95 failure Incidents, or 26 percent of all reported controls and accessories Incidents. The most frequent failure mode was fuel pump sheared shafts with thirteen specific Incidents reported. A hlstograph of these 95 reported Incidents Is Included as figure 4. The fuel pump sheared shaft Incidents peaked In 1986 and 1987 for the data reviewed. Also documented was the tendency for the fuel pump shaft splines to become stripped or severely worn, thus disengaging the pump from operation. 'JYplcal fuel pump part numbers Involved were P/N 373401-26, P/N 706800 and P/N389400.
The EVC removals recorded 82 failure Incidents over the observation period which represented 22 percent of all controls and accessories Incidents. The lncldents have been lricreaslng since 1988. peaking at 231ncldents In 1990. Figure 5 shows this historical failure performance. The EVC filter was often changed In addition to the removal of the unll There were several incidents of air and fuel lines broken at the unit. Table 10 reviews the Impact upon a1rcra.ft operation resulting from EVC failures. The most frequent Impact was to create engine compressor stalls with resultant shutdowns or flameouts, occurring during In cruise operation and turbulent weather conditions. Engine flameouts also occurred when Initiating a descent flight profile. The part number for most EVC Incidents was P /N 7 47955-5.
13

TABLE 9. JT9D ENGINE FUEL CONTROL FAILURE INCIDENTS FOR SELECTED CARRIERS
ENGINE OPERATIONAL CHARACTERISTIC TAKEOFF CLIMBOUT CRUISE DESCENT APPROACH TOTAL
FLAMEOUT -- 8 17 3 -- 28
SHUTDOWN 2 -- 3 1 1 7
STALL I SHUTDOWN -- 2 4 8 -- 14
POWER LOSS I RPM ROLLBACK '3 4 1 -- 2 10
INCORRECT THROTTLE MOVEMENT I SETTING -- -- 3 -- 1 4
POWER SURGES 1 1 7 -- -- 9
TOTAL 6 15 35 12 4 72
30
25 rn ca ~ 20 8 ~ ...... 0
15 I.. 0 ..0 10 8 ::l z
5
0. '85 '86 '87 '88 '89 '90 '91
(Partial r----------------------------------------------,CPartial Data) • Sheared Shaft Incidents ~Total Number of Incidents Data)
FIGURE 4. JT90 ENGINE FUEL PUMP REMOVALS BY YEAR FOR SEI.EC'IED CARRIERS
14

rJl ca > 0
25
20
s 15 cz '-0
b 10 s = z
5
'85 (Partial
Data)
'86 '87 '88
~ Number of Incidents
'89 '90 '91 (Partial
Data)
FlGURE 5. JT9D ENGINE VANE CONTROL REMOVALS BY YEAR FOR SELECTED CARRIERS
TABLE 10. JT9D ENGINE VANE CONTROLLER FAILURE INCIDENTS FOR SELECTED CARRIERS
ENGINE OPERATIONAL CHARACTERISTIC TAKEOFF CLIMB OUT CRUISE DESCENT APPROACH TOTAL
FLAMEOUT 1 4 5 7 1 18
SHUTDOWN -- 1 2 1 -- 4
STALL I SHUTDOWN I FLAMEOUT 2 13 21 7 -- 43
SMOKE I FUMES IN CABIN 3 3 2 -- -- 8
RPM SPOOLDOWN I SURGE 1 2 3 -- -- 6
OIL OUT BLEEDS / HIGH CONSUMPTION 3 -- -- -- -- 3
TOTAL 10 23 33 15 1 82
The TT2 sensor exhibited 22 failure incidents for the operational pertod reviewed. Of these 22 failures, over 75 percent of them produced flameouts or compressor stalls with resultant engine shutdowns. Restarts were attempted on only about 50 percent of the documented events and several of those were unsuccessful on the Initial attempt. Figure 6 shows the histortcal failure trend of the TT2 sensor.
1 5

g ~ '($ ~ u
1 z
10
9
8
7
6
5
4
3
2
1
0
'85 '86 '87 '88 '89 '90
(Partial Data) t:::l Number of Incidents
FIGURE 6. Jf9D ENGINE 1T.Z SENSOR REMOVALS BY YEAR FOR SELEC'IED CARRIERS
'91
(Partial Data)
The PRBC exhibited 32 faJlure Incidents over the period reviewed. F1gure 7 shows the number of failure Incidents peaking in 1987 then stabUJztng. FaUure of this Item typically resulted tn compressor stalls and subsequent engine shutdowns to avoid over temp damage to the turbine. Shutdowns or flameouts occurred tn 48 percent of the reported Incidents.
15
13
fl) 11
1 9
7 'a D 5
1 z 3
1
-1 '85 '86 (Partial
Data)
'87 '88 '89
E3 Number of Incidents
'90 '91 (Partial
Data)
FIG. 7. Jf9D ENGINE PRE..."5URE RA110 BLEED CONfROL VALVE REMOVALS BY YEAR FOR SELECTED CARRIERS
16

By using the data base created from documenting JT9D engine reported fallure Incidents, an engine serial number search can be made to determine the fallure history of speclflc serlal numbered engines. This engine serlal number search provides documented Information on trouble-shooting procedures, technical data Inadequacies, hard (allures of speclflc components and maintenance practices. Table 11 shows a series of reported Incidents over a five month period In 1987 of the trouble shooting problem of a JT9D engine experiencing compressor stalls and flameouts. The engine was ultimately replaced after the removal of several controls and accessories.
TABLE 11. JT9D ENGINE TROUBLE-SHOOTING, ENGINE S/N, :xxxxX:X
A/ C TYP:!:: B-747, ENGINE S/N: XXIII X
uam& lARAMETEBft DATES Ql INCIDENTS
08/12/87 07/20/87 07/27/87 11/08/S7 08/24/88
COMPRESSOR STALL y y N N y
POWER REDUCTION AND/OR THROTTLE MOVEMENT y y y y y
FLAMEOUT N N N Y-2 N
ENGINE SHUTDOWN y y y N y
EGT RISE (DEGREE C) y N 800 N N
N1/N2DROP N N N N N
ENGINE VIB MEASUREMENT -- -- -- -- --OIL PRESSURE DROP -- -- -- -- --EPRDROP y N y N N
RESTART ATTEMPT (YES / SUCCESSFUL) Y/S Y/S Y/S Y/S N
INFLIGHT BLEED CK REQ N N N N N
COMPONENTS REPLACED: -T1'2 -IIAD'f ·TI'2 ·FUEL COl'fTROL ·REPL'D SENSOR OIL 8CiliZl'f SEI'fSOR FUELPUIIP El'fGINE
IIADI FUEL PUIIP 111L'I1!:R
The data base also permits the historical review of speclflc engine components, such as the JT9D engine fuel control shown In table 12. The malfunction Impact upon other engine parameters can be used to adjust trouble shooting guidelines for the fuel controL
The tracking of speclflc engine serlal numbers could also be used to review the maintenance events preceding a hard fallure to determine what might have contributed to the fallure event. Table 13 shows a specific engine serlal number series of reported events prior to the fallure of sixth stage compressor blade locks, which produced significant high pressure compressor damage.
Information from this data bank can also provide Insight Into maintenance practices. Table 14 shows the difficulties encountered on a JT9D engine angle gear box repair.
The JT9D engine has a proven rellabWty record and this actuarlal review did not document any serious, safety-of-fllght component fallure patterns. However, the actuarial analysis did document some rellabWty problems, some of which are being worked by the prime engine manufacturer, requiring prompt lnstallatlon of improved rellablllty configurations.
17
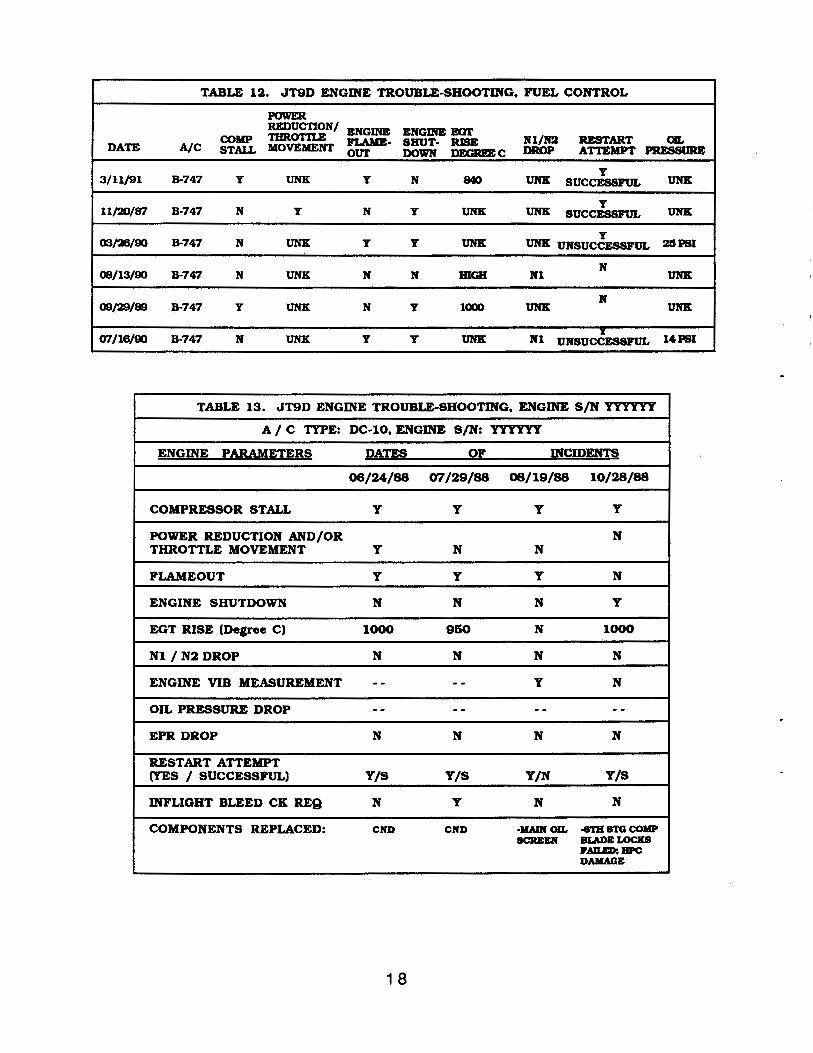
TABLE 12. JT9D ENGINE TROUBLE-SHOOTING. FUEL CONTROL
POWER REDUCTION/ ENGINE ENGINE 1!Xn'
COMP 111ROT'll.E FLAIIIB· SHUT· RJSE N1/N2 RESTART OJL DATE A/C STALL MOVEMENT our DOWN DEGKI!EC DROP ATTEMPT PRESSURE
3/11/91 B-747 y UNK y N 840 UNK y
t1NK SUCCESSFUL
11/'.liJ/fil B·747 N y N y UNK UNK y
SUCCESSFUL UNK
03/?Jj/90 B-747 N UNK y y UNK y
UNK UNSUCCESSFUL 25PSI
08/13/90 B-747 N UNK N N mGB N1 N
UNK
00/29/88 B-747 y UNK N N y 1000 UNK UNK
fTl/16/90 B-747 N UNK y y UNK N1 UNSUCCESSFUL 14PSI
TABLE 13. JT9D ENGINE TROUBLE-SHOOTING. ENGINE S/N YYYYYY
A/ C TYPE: DC-10. ENGINE S/N: yyyyyy
~NGUil PARAMII~RS J1ATES OF m:cmENTS 06/24/88 fYl/29/88 08/19/88 10/28/88
COMPRESSOR STALL y y y y
POWER REDUCTION AND/OR N THROTTLE MOVEMENT y N N
FLAMEOUT y y y N
ENGINE SHUTDOWN N N N y
EGT RISE (Degree C) 1000 950 N 1000
Nl /N2DROP N N N N
ENGINE VIB MEASUREMENT -- . - y N
OIL PRESSURE DROP . - -- -- --EPR DROP N N N N
RESTART ATTEMPT (YES / SUCCESSFUL) Y/S Y/S Y/N Y/S
INFLIGHT BLEED CK REQ N y N N
COMPONENTS REPLACED: CN:O CN:O ·IIADI OIL ..4JTB STG COIIP SCREEN BLADE LOCKS
J'AILED: BPC DAMAGE
1 8

TABLE 14. JT9D ENGINE TROUBLE-SHOOTING, ENGINE S/N XXXYYY
A/C TYPE: B-747, ENGINE S/N: XXXYYY
ENGINE PARAMETERS DATES OF INCIDENTS
08/03/87 08/24/87 11/06/87 11/06/87
COMPRESSOR STALL N N N N
POWER REDUCTION AND/OR THROTTLE MOVEMENT N y N N
FLAMEOUT N y N N
ENGINE SHUTDOWN y N y y
EGT RISE N N N N
Nl/N2DROP N N N N
ENGINE VIB MEASUREMENT -- -- -- --OIL PRESSURE DROP y -- y y
EPR DROP N N N N
RESTART ATTEMPT (YES / SUCCESSFUL) N Y/S N N
INFLIGHT BLEED CK REQ N N N N
COMPONENTS REPLACED:.ANGLE GEARBOX -FUEL -ANGLE -ANGLE COVERPLATE BOLT nL'n!:R GEARBOX GEARBOX INSERT PULLED HELICon. LINE LEAK FROM GEARBOX REPL'D
The Jf9D engine SDR review identified three hard failure items: the #3 main bearing, ~e eighth stage compressor blade, and the fuel pump shaft. Six of the fifteen #3 main bearing failures were due to a quality control problem which PWA has since corrected. The remaining nine failures exhibited various failure modes, however due to the seriousness of a #3 bearing failure, consideration should be given for a redesign of the #3 main bearing. There were ten incidents reported on the eighth stage compressor blade. All the failures occurred in the root area of the blade, were self-induced and caused excessive damage to the compressor and some damage to the turbine. The Implications associated with the extensive downstream damage and maintenance repair costs indicate the eighth stage compressor blade is a candidate for redesign. Airlines reported 95 fuel pump failures and specifically identified a fuel pump sheared shaft in thirteen incidents. The number of incidents identified by the airlines of the fuel pump shaft failures warrants an investigation by the engine manufacturer as to the feasibility of a redesign.
Several wear and tear failure patterns were evident, however, PWA has developed reliability modifications and is awaiting complete implementation by the airlines. There were 37 reported incidents for first stage turbine blade failures. PWA has modified the design of the blades using DS material designated as PWA 1422 and has made this new material available to the airlines for several years. This material offers improved stress rupture properties and thereby enables first stage turbine blades to withstand the higher than normal turbine inlet temperatures associated with compressor stalls. The PWA 1422 blades are the only replacement blades available and are being Incorporated into the airlines Inventory through attrition. The airlines reported 82 incidents related to the EVC accessory. The number of failures per year has steadily increased over the past five years. As a result of the limited reliability of the EVC and other controls and accessories, PWA has incorporated numerous reliability enhancements in the growth model Jf9D-7R4G engine. The EVC has been redesigned for the Jf9D-7R4G engine and modifications are available to upgrade the engine EVC on the older engine models. Implementation of the rellability
19

modifications In the EVC will greatly decrease the number of In-flight shutdowns and unscheduled engine removals, thus Increasing the overall reltabUity of the JT9D engine.
Due to the concern expressed by air carriers for engine cases lacking assigned service lives, an Increased emphasis to Identify all engine case failures was pursued. To this effect thirteen JI'9D engine case failures were Identified from the component trending period ofFebrwny 1988 through January 1991. A complete review, conducted with engineers at PWA. summarized and prioritized the criticality of these case failures. Discussions included background Information on engine cases, case thickness, the . manufacturing and welding processes, material properties, case failure modes, and current Inspection methods. The greatest concern experienced by PWA was the Integrity of a weld repair being accompllshed by the air carriers. Their concern centers around the inabUlty of the current Inspection procedure to detect Internal defects (I.e. cracks and voids) of repair welds, particularly those welds on the JT9D diffuser case exceeding 1.5 Inches In length and lnvolvlng the case rail area. SAIC worked closely with PWA to develop a prellmlnary ultrasonic Inspection procedure to validate the structural Integrity of repair welds on the JT9D engine diffuser case. These results are documented elsewhere In this report.
The SDR review also Identified some diagnostic troubleshooting problems. The most prevalent diagnostic troubleshooting observation Involved dual removals of engine fuel controls and engine fuel pumps for suspected malfunctions. Diagnostic troubleshooting guidelines had previously been publtshed by PWA on the Jf9D engine for air carrier maintenance personneL However, the technical data was considered too voluminous and compltcated by the air carriers and has not satisfied Its Intended purpose. There Is not an on-board engine diagnostic system available for the Jf9D engine, and that lack of capabtllty severely ltmlts the amount of fault isolation possible on controls and accessory Items. The current practice of the Jf9D operators Is to make dual or even triple control/afcessory removals to assure the source of the In-flight compres8or stall or flameout has been removed.
The analysis identified maintenance practices as contributing to ln-tllghf shutdowns. 'I)rplcal maintenance practice problems included: engine oll cap unsecured, oll screen studs pulled loose and oll seals pinched. These practices often resulted In loss of power and/or loss of oll with the resultant engine shutdown and unscheduled engine removal. PWA Incorporated a flapper valve In the oll tank of the J1'9D~ 7R40 growth model in order to prevent ollloss If the oll cap Is unsecured. The flapper valve modification Is available to all air carriers to Incorporate Into the older Jf9D engine models. The flapper valve, however, does make the task of adding oll to the engine more dlfllcult and time consuming.
CF8 ENGINE COMPONENT FAILURE ANALYSIS
The CF6 engine Inventory Is operated on three different airframes: A-300, B-767 and DC-1 0 aircraft. Sixteen air carrier and aircraft combinations were reviewed Involving eleven air carriers. The component failure Incidents on twelve CF6/alrframe combinations were recorded and trended. These air carriers operated on an average of 792 CF6 engines per month.
The Initial CF6 engine represents technology from the late 1960's and early 1970's. This review of the CF6 engine Inventory Included the CF6-6, CF6-50 and CF6-80 engine models. The CF6-6 engine typically develops 39,300 to 40,900 pounds of static thrust at takeoff power settings. The CF6-50 engine typically develops 45,600 to 53,200 pounds of static thrust at takeoff power settings, and the CF6-80A engine typically develops 48,000 to 50,000 pounds of thrust at takeoff power settings. The CF6-80C2 engine configuration Includes a thrust growth of 52,500 to 61,500 pounds of thrust at takeoff power. The CF6-80A and C2 engines are considered by CE to be a significant growth model of the engine, not just In thrust produced but In reltabll1ty enhancements.
The failure data base for the CF6 engine Inventory covered the five year component trending period. This data base was comprised of218 air carrier reported SDRs. Table 15 exhibits the types of failures reported.
The reported failures of controls and accessory Items were slgnUlcantly greater In number than the failures reported for other component catagorles. Thirty-nine percent of all reported failures Involved controls and accessories. Of the control and accessory Incidents reviewed, three Items contributed to 76 percent of all reported failures: fuel controls, fuel pumps, and inlet gearboxes.
20

TABLE 15. CF6 ENGINE COMPONENT FAILURE INCIDENTS FOR SELECTED CARRIERS
COMPONENT BEARINGS
#1 Bearing #2 Bearing #3 Bearing #4 Bearing
AIRFOILS Fan Blades 5th Stage CoEnpressor Blades 6th Stage CoEnpressor Blades 7th Stage Variable Vane &rEB/pin 8th Stage CoEnpressor Blades 9th Stage CoEnpressor Blades CoEnpressor Blades Variable Vanes 1st Stage Turbine Blades 2nd Stage Turbine Blades 4th Stage Turbine Blades 1st Stage Turbine Vanes
CASES Turbine Mid-FraEne Compressor Rear Frame
FUEL / OIL SYSTEMS Oil Line Seals Fuel Filter Fuel Manifold Contained Fuel Fuel Line Fuel Nozzle
CONTROLS AND ACCESSORIES Fuel Control Fuel Control I Fuel Pump Fuel Pump CIT Sensor Engine Electronic Control Fuel IOU Heat Exchanger Bleed Valve Connector Speed Sensor Inlet Gearbox: Starter
COMPRESSOR SECTION 14th Stage Bleed Air Duct Cross Over Duct Discharge Tube Fan Shaft 5th Stage Disc
COMBUSTION INNER LINER TURBINE SECTION
HPT Disc Borescope Plugs Not Installed Turbine Shaft Bolts 1st Stage Turbine Shroud Damage
OTHER Bird Strike Domestic Object Damage Unknown (Engine Replaced)
21
NUMBER OF INCIDENTS
4 1 2 4
2 1 2 1 3 3 4 7
26 3 1 3
5 2
9 3 3 4 1 2 2
19 26
8 8 6 1 2 1
12 2
2 3 2 1 1 1
1 1 2 1 1
3 2
14
TOTAL INCIDENTS
11
56
7
24
85
9
1 6
19

As reported in the SDR. a fuel control failure produced an in-tllght 11ameout. but the fuel control was generally not the only control or accessory replaced by maintenance personnel to resolve the problem. Of the 45 reported fuel control failures. 73 percent of the incidents replaced another accessory in additlon to the fuel control. For these multiple removal incidents. 75 percent involved replacement of the fuel pump along with the fuel control. The 1m pact of fuel control malfunctions was such that 69 percent of all fuel controllncldents produced flameouts. Table 16 shows the fuel control malfunction impact upon the flight proffie of the aircraft. Figure 8 shows the reported fuel control incidents per year over the five . year component trending period. The number of fuel control incidents per year is basically constant with a high of nine incidents in 1989 and a low of four incidents in 1985.
ENGlNE
TABLE 16. CF6 ENGINE FUEL CONTROL FAILURE INCIDENTS FOR SELECTED CARRIERS
OPERATIONAL TAKE- CLIMB- AFTER CHARACTERISTICS OFF OUT CRUISE DESCENT APPROACH LANDING TOTAL
FLAMEOUT
SHUTDOWN
STALL/SHUTDOWN
POWER LOSS/RPM ROLLBACK
THROTTLE MOVEMENT /SETTING
POWER SURGES
FUEL FILTER CLOG UGHT
12
10
8
6
4
2
'85 (Partial
Data)
2 2
1 1
2
2
5
'86
7 12
1
1
1 1
1
1
1
11 15
'88
~Number of Incidents
4 4
1
5 4
'89 '90
31
4
1
4
1
3
'91 (Partial
Data)
FIGURE 8. CF6 ENGINE FUEL CONTROL INCIDENI'S BY YEAR FOR SELECTED CARRIERS
22
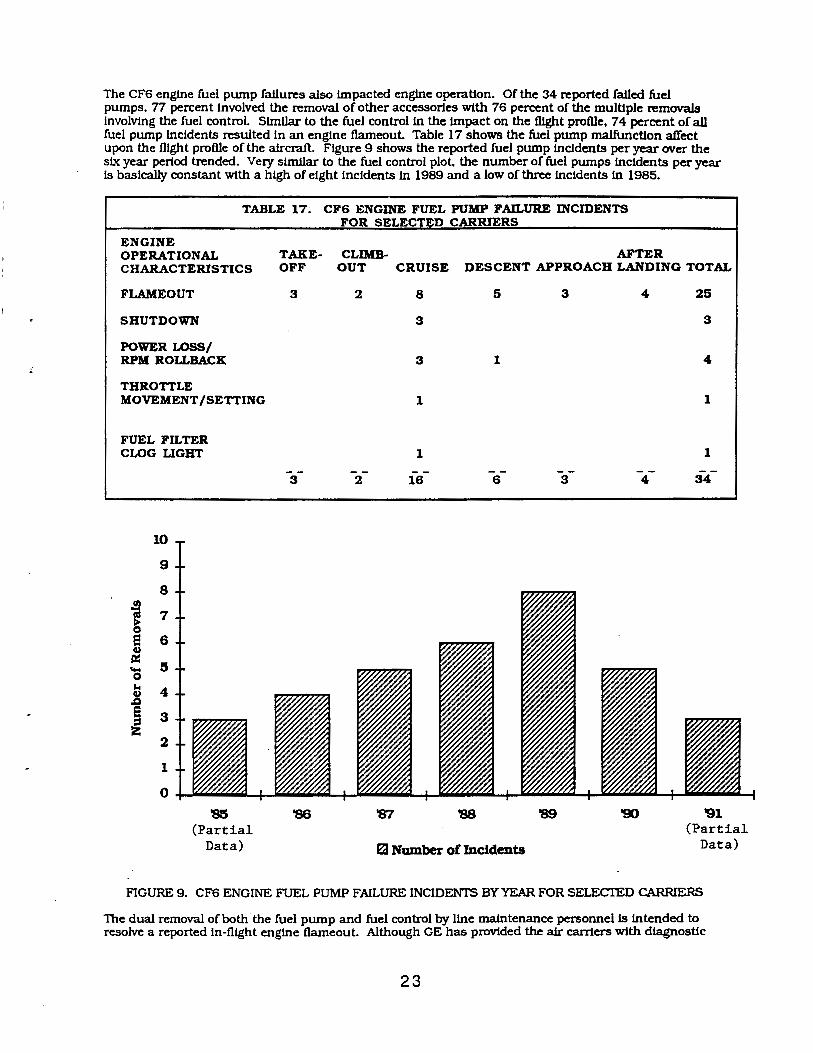
The CF6 engine fuel pump failures also impacted engine operation. Of the 34 reported failed fuel pumps. 77 percent involved the removal of other accessories With 76 percent of the multiple removals Involving the fuel control. Simllar to the fuel control in the Impact on the tllght profile, 74 percent of all fuel pump Incidents resulted In an engine flameout. Table 17 shows the fuel pump malfunction affect upon the flight profile of the aircraft. Figure 9 shows the reported fuel pump incidents per year over the six year period trended. Very simllar to the fuel control plot, the number of fuel pumps incidents per year Is basically constant with a high of eight incidents in 1989 and a low of three incidents in 1985.
TABLE 17.
ENGINE OPERATIONAL TAKE· CHARACTERISTICS OFF
FLAMEOUT 3
SHUTDOWN
POWER LOSS/ RPM ROLLBACK
THROTTLE MOVEMENT /SETTING
FUEL FILTER CLOG LIGHT
3
10
9
8
i 7
e 6 u ~
5 '"" () ... 4
i 3 lii!:
2
1
0
'85 '86 (Partial
Data)
CF6 ENGINE FUEL PUMP FAILURE INCIDENTS FOR SELECTED CARRIERS
CLIMB· AFTER OUT CRUISE DESCENT APPROACH LANDING TOTAL
2 8 5
3
3 1
1
1
2 16 6
'89
~Number of Incidents
3 4
3 4
'90
25
3
4
1
1
34
'91 (Partial
Data)
FIGURE 9. CF6 ENGINE FUEL PUMP FAILURE INCIDENTS BY YEAR FOR SELECI'ED CARRIERS
The dual removal of both the fuel pump and fuel control by line maintenance personnel is intended to resolve a reported in-flight engine flameout. Although GE has provided the air carriers With diagnostic
23

trouble-shooting Information, the air carrier maintenance concept to perform dual or multiple pulls continues to ensure the engine Is completely repaired. In addition, the CF6-6 and CFS-50 engines are designed such that the fuel control and fuel pwnp are mounted piggyback. The piggyback mount design makes It convenient for maintenance personnel to perform dual removals of the fuel control and fuel pwnp. The CF6-80 series engine has the fuel control and the fuel pump on opposite sides of the engine. The physical separation of the fuel pwnp and fuel control plus rellabll1ty enhancements to each unit has significantly reduced the Incidents of dual accessory removal for the CF6-80 series engine.
There were twelve reported Incidents of CF6 engine Inlet gearbox failures. The two most notable gearbox failure trends were failure of the radial bevel gear and failure of the bevel gear shaft. Eleven of the twelve reported Inlet gearbox failures occurred on the CF6-6 engine lnventocy with the remaining failure having occurred on a CFS-50 engine. The CF6-6 engine model had employed a black oxide coating on the Inlet gearbox bevel gears and the shaft for corrosion protection and Improvement In the retention of a lubricating fllm. The Inlet gearbox bevel gear and shaft are highly stressed parts and the application procedure for the black oxide coating created a corrosive environment. often leading to stress corrosion cracking In subsequent flight operation. The use of black oxide coating has been discontinued.
Of the 218 reported fallures, 26 percent Involved alrfoU components, with the largest percentage of the alrfod failures (46 percent) Involving first stage turbine blades. Approximately half of the reported first stage turbine blade failures were Installed on the CF6-6 engine lnventocy. The CF6 engine configuration does not have the DS turbine blade as Its standard bill of material. The later growth models of the CF6 engines, such as the CF6-80 series, Incorporate the DS turbine blades and only four lncldents of first stage turbine blade failures were reported on the CF6-80 engine series. 1be DS material turbine blade Is providing Improved reliablllty.
There was a definite trend ofTMF case failures. The CF6-6 and -50 engine TMF cases are made ofinconel 718 material using a Tungsten Inert Gas fllG) weld fabrication process. The TMF case has an approximate 0.04 Inch thick plasma sprayed thermal barrier coating on the Inside surface. Thls coating llmtts the sensltlvity of the currently approved Inspection procedure. The objective Is to develop an Inspection procedure for cracks In the heat affected zone of weld areas, cracks under the thermal barrier· coating and cracks In the circumferential welds around the case bosses. Samples were provld~ by GE to evaluate the abll1ty of the UI-JVTM system to satisfY this Inspection requirement The prellmtnary results of that evaluation are docwnented later In this report.
There were only two failures reported on the CF6-80A engine CRF case. However, due to the severity of the failure that occurs when a CRF cracks, this Item has been previously identified as requlrlng an enhanced Inspection procedure. The CRF Is made of cast Inconel 718 material that is difficult to inspect due to the large grain micro structure. GE has an eddy current (EC) procedure used to Inspect cracks In the mid flange scallop area. Ultrasonic Inspection of this area has proven difficult due to the large grain size. GE provided a CRF sample that contained an EDM notch to be used for Inspection system sensitivity checks and preliminary validation of an ultrasonic Inspection procedure. The UI-fVTM system identified the EDM notch dimensions and those results are identified later In this report
PT6 ENGINE COMPQNENT FAILURE ANALYSIS
The Pr6 engines reviewed In this study were Installed on six different airframes which Included the Beech 99, Beech 1900, Empresa Brasll1era de Aeronautlca 110, deHavilland DHC6 and DJC7, and Short Brothers 330 aircraft. Over 108 air carriers and airframe/engine oomblnatlons were reviewed and the component failure lncldents on 24 Pr6/alrframe combinations were recorded and trended. These air carriers operated an average of 1416 Pr6 engines per month.
The Pr6 engine represents 1960's technology and has performed reliably In numerous applications for 30 years. Of the various Pr6 engine models reviewed, the Pf6A-27 on the deHavilland Twin Outer airframe had the lowest rated takeoff horsepower at 680 foot pounds (torque), whUe the Pr6-45R engine on the Short Brothers 330 had the highest rated takeoff shaft horsepower at 1196 foot-pounds (torque).
The failure data base for the Pr6 engine lnventocy covered the five year period from 1986 to 1991. This data base was comprised of 410 reported SDRs. Table 18 exhibits the types offailures reported.
The greatest number of engine shutdowns occurred during takeoff. Approximately 30 percent of all reported SDRs Involved aborted takeoffs, normally as the engine failed to meet the required takeoff torque. The dominant cause for the aborted takeoff was control and accessory failures. Control and accessory failures were also responsible for 60 percent of all the SDR reported failures. The most significant failure trends were recorded by fuel controls, bleed valves and fuel pumps.
24
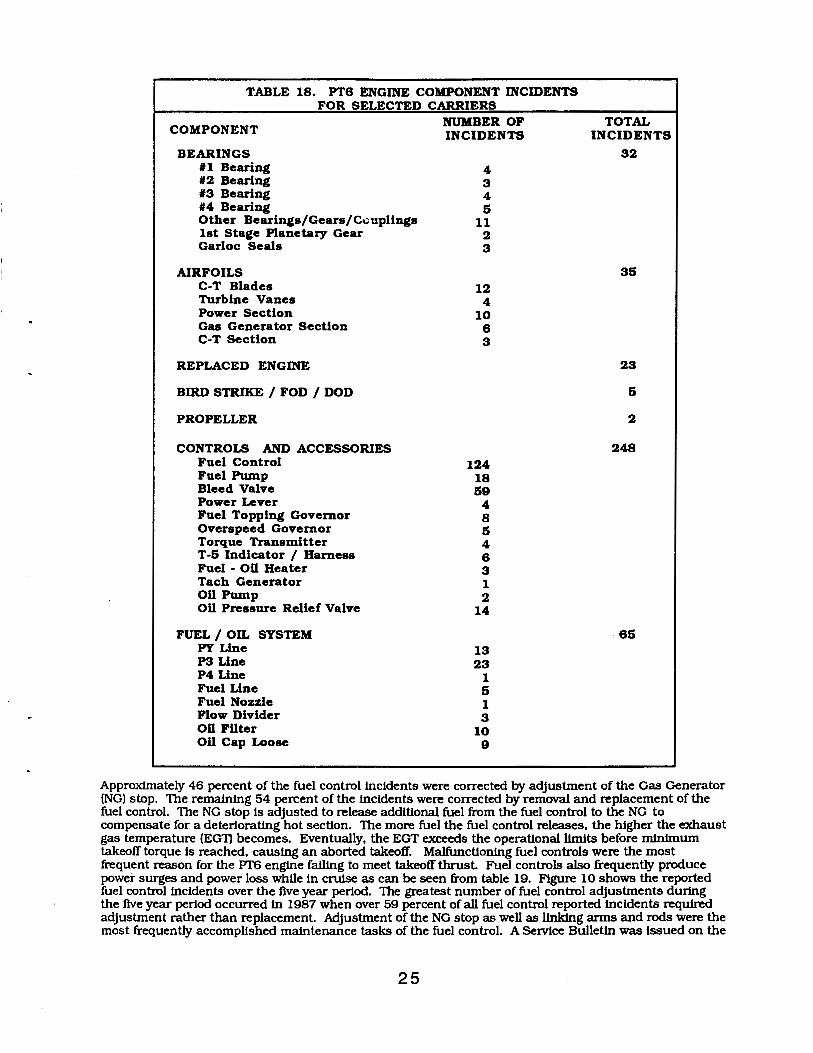
TABLE 18. PT6 ENGINE COMPONENT INCIDENTS FOR SELECTED CARRIERS
COMPONENT
BEARINGS #1 Bearing #2 Bearing #3 Bearing 114 Bearing Other BearingsiGearsiC.:;uplings 1st Stage Planetary Gear Garloc Seals
AIRFOILS C-T Blades Turbine Vanes Power Section Gas Generator Section C-T Section
REPLACED ENGINE
BIRD STRIKE I FOD I DOD
PROPELLER
CONTROLS AND ACCESSORIES Fuel Control Fuel Pwnp Bleed Valve Power Lever Fuel Topping Governor Overspeed Governor Torque Transmitter T-5 Indicator I Harness Fuel - Oil Heater Tach Generator Oil Pump Oil Pressure Relief Valve
FUEL I OIL SYSTEM PY Line P3 Line P4 Line Fuel Line Fuel Nozzle Flow Divider Oil Filter Oil Cap Loose
NUMBER OF INCIDENTS
4 3 4 5
11 2 3
12 4
10 6 3
124 18 59
4 8 5 4 6 3 1 2
14
13 23
1 5 1 3
10 9
TOTAL INCIDENTS
32
35
23
5
2
248
65
Approximately 46 percent of the fuel control incidents were corrected by adjustment of the Gas Generator (NG) stop. The remaining 54 percent of the incidents were corrected by removal and replacement of the fuel control. The NG stop is adjusted to release additional fuel from the fuel control to the NG to compensate for a deteriorating hot section. The more fuel the fuel control releases, the higher the exhaust gas temperature (EG11 becomes. Eventually, the EGT exceeds the operational limits before minimum takeoff torque is reached, causing an aborted takeoff. Malfunctioning fuel controls were the most frequent reason for the IYr6 engine failing to meet takeoff thrust. Fuel controls also frequently produce power surges and power loss while in cruise as can be seen from table 19. Figure 10 shows the reported fuel control incidents over the five year period. The greatest number of fuel control adjustments during the five year period occurred in 1987 when over 59 percent of all fuel control reported incidents required adjustment rather than replacement. Adjustment of the NG stop as well as linking arms and rods were the most frequently accomplished maintenance tasks of the fuel control. A SeiVice Bulletin was issued on the
25

Woodward fuel control changing the contact end of the compressor discharge bellows rod from round to a more square surface, thus enhancing the opportunity for a positive contact of mating surfaces.
TABLE 19. PT6 ENGINE FUEL CONTROL FAILURE INCIDENTS
ENGINE OPERATIONAL CHARACTERISTICS
FAILED TO MEET TORQUE REQUIREMENT
FLAMEOUT
SHUTDOWN
POWER LOSS/RPM ROLLBACK
POWER SURGES
POWER LEVER MOVEMENT
FUEL LEAK
60
50
~ 40 e ~
~ ~ '0 ..
.8
~ 20
10
0
'85 (Partial
Data)
FOR SELECTED CARRIERS
TAKE- CLIMB- AFTER OFF OUT CRUISE DESCENT APPROACH LANDING TOTAL
68 68
1 1
2 1 4 1 8
4 12 1 3 2 22
2 2 13 2 1 20
1 1 1 3
2 2
74 7 30 4 4 -5- 124-
'86 'fn '88 '89 '90 '91 (Partial
•Adjusted &::1 Total Number of Incidents Data)
FIGURE 10. PT6 ENGINE REPORIED FUEL CONfROL INCIDENI'S BY YEAR. FOR SELEC'IED CARRIERS
The second largest number of control and accessory reported failure incidents occurred on bleed valves. Of the 59 reported incidents, nineteen occurred during 1990 as shown in figure 11. Bleed valve failure modes included ruptured diaphragms. scored or missing valve seats and a few incidents of improper bleed valve installation. Bleed valves are extremely sensitive to maintenance repair actions. A
26

configuration upgrade to Incorporate a piston operated valve 1n lleu of the original diaphragm operated valve is now available and greatly increases the reltabtllty of the bleed valve accessory. As shown 1n table 20. a malfunctioning bleed valve either causes the PT6 engine to not meet the required takeoff torque and abort takeoff or causes a compressor stall while 1n cruise.
2D
18
16
! 14
a 12 ~
10 '"" 0 ... 8
i 6 z
4
2
0
ENGINE
'85 '86 '87 '88 '89 '90 (Partial
Data) fa Number of Incidents
FIGURE 11. PT6 BLEED VALVE FAILURE INCIDEN1S BY YEAR. FOR SELECTED CARRIERS
TABLE 20. PT6 ENGINE BLEED VALVE FAILURE INCIDENTS FOR SELECTED CARRIERS
OPERATIONAL TAKE· CLIMB· AFTER
'91 (Partial
Data)
CHARACTERISTICS OFF OUT CRUISE DESCENT APPROACH LANDING TOTAL
FAILED TO MEET TORQUE REQUIREMENT 20
COMPRESSOR STALL 3
SHUTDOWN
POWER LOSS/RPM ROLLBACK
POWER SURGES 5
28
3
1 6
4
4 4
2
8 16
4 2
1
4 3
23
16
5
8
The third largest number of control and accessory reported failure Incidents occurred on the fuel pump. During the five year period. eighteen fuel pump fatlure Incidents were reported. The greatest number of failure incidents were reported 1n 1989 as shown 1n figure 12. The two most frequently reported failure modes for the fuel pump Included sheared drive shaft and worn/stripped splines on the drive shaft. The spline wear and drive shaft failures are caused by loss of lubrication Inside the fuel pump.
27

8
7
Ul 6
1 5 e 4.1 ~
4 .... Cl ... .8 3
~ 2
1
0
'85 (Partial
Data)
'86 '88 '89
fZI Number of Incidents
FIGURE 12. PI'S FUEL PUMP REMOVALS, BY YEAR FOR SELECfED CARRIERS
'90 '91 (Partial
Data)
The PT6 engine is designed with the fuel control mounted piggyback to the fuel pump. Line maintenance is required to perfonn a fuel leak check at the bearing drain cavity where the two controls are connected. If a leak is detected, both the fuel pump and fuel control must be removed and replaced. Once the seal connecting the two accessories begins to leak. a typical failure is bearing seizure on both controls. A redesign of the fuel pump shaft should be considered to reduce spline wear and the incidents of sheared shaft. Table 21 shows the impact fuel pump failures had upon aircraft operation. Failed fuel pumps often produced power losses or surges while in cruise rather than causing aborted takeoffs.
TABLE 21. PT6 ENGINE FUEL PUMP FAILURE INCIDENTS FOR SELECTED CARRIERS
ENGINE OPERATIONAL TAKE- CUMB AFTER CHARACTERISTICS OFF OUT CRUISE DESCENT APPROACH LANDING TOTAL
FAILED TO MEET TORQUE REQUIRE¥ENT
FLAMEOUT 1 1 2
SHUTDOWN 1 1 2
POWER LOSS/RPM ROLLBACK 2 5 2 9
POWER SURGES 2 2
FUEL LEAK 3 3
3 2 9 2 2 18
28

The data base created for the Pf6 engine component failure analysis also pennlts review of reported fallwe history by engine serial number. These reviews can be useful in tracking specific serial numbered engines for maintenance and trouble shooting deficiencies. Table 22 provides data on two separate · engines with fuel control problems. Inltlal adjustments of the fuel control were insufficient to produce the required takeoff torque. The fuel control was eventually replaced within 45 to 60 days of the lnltlally reported incident
TABLE 22. PT6 ENGINE TROUBLE SHOOTING
A/CUPE
EMB 110
ENGINE SIN
xx:xxx
TAKEOFF ABORTED FAILED TO MEET T /0 TORQUE FLAMEOUT SHUTDOWN FAaUREITEM REPORTED
REPLACED ADJUSTED
EMB no
TAKEOFF ABORTED
ttYYt
FAILED TO MEET T/0 TORQUE FLAMEOUT SHUTDOWN I'~ ITEM REPORTED
REPLACED ADJUSTED
JT9D ENGINE CAS£ FAILURE ANALYSIS
DATES OF BEPORIED INCIDENtS 8/4/87 11/23/87
y y N N
FUEL CONTROL y
5/17/88
y y N N
FUEL CONTROL N y
y y N N
FUEL CONTROL
y
7/7/88
y y N N
FUEL CONTROL y . N
Review of the Jf9D engine component failures documented tn the FAA SDR data base from 1986 through the end of 1991 identlfted thirteen engine case fallures: siX fan case fatlures, five diffuser case failures, one outer combustor case fallure, and one Intermediate case fallure.
None of the fan case fallures were of a catastrophic nature. Flve of the siX fan cases were removed from seJVice due to excessive vibration or in-flight compressor stall. The most common cause of fallwe was excessive fan blade tlp clearance exceedance. These excessive clearances were produced by fan blade shingllng and gouges tn the fan case rub strip areas. The abradable seal in the fan case slot would tear away causing some downstream FOD. As a result, engine vibration or a compressor stall would occur.
Three of the five diffuser case failures occurred when internal struts collapsed at the strut to case weld allowing hot alr to enter the number three bearing cavity. This increased pressure would eventually cause the breather elbows to fall and occasionally produce oU vapors that would catch fire. The other two diffuser case !allures occurred from ruptures and cracks in the 6 o'clock posltlon on the diffuser case. Both incidents originated from a weld repair.
The one recorded Incident of an outer combustor case failure produced a catastrophic failure that caused the pUot to abort take-off which resulted tn a fire that burned for more than ten mtnutes. The outer combustor case had a wall/flange rupture which the rear flange mates to the turbine case, resulting in the attach bolts shearing.
The one recorded incident of an Intermediate case fallure initiated in the heat affected zone of a weld from a previous repair at the 12 o'clock position. The crack produced an oU leak. in the case.
There were several incidents where case fallures emanated from the weld zones of previous repair and orlglnal fabrication welds. The current inspection procedure Is not sufficiently sensitive to detect small flaws in repair welds. SAIC, using the UI-IVfM system, has demonstrated the ablllty to characterize weld
29

zones around boss welds and previous repair welds to assure the structurallntegrlty of the welds. 1be prellmlruuy procedures and results for weld charactertzations on the JT90 diffuser case are outlined In the following section.
JT9D DIFfUSEB CASE NQI DEVELOPMENT
The JT90-7A series dUfuser case Is experiencing a faUure mode In the stiffener raU. PWA has developed an on-wing EC Inspection procedure to detect cracks along the dUfuser case stiffener raU. When a crack Indication occurs on the stiffener rail during an on-wing tnspecUon. the engine Is required to be . · reinspected within certain cycles depending on the Indicated crack size. If the crack Indication runs from the stiffener rail to the dUfuser case or Is longer than 1.25 Inches but less than 2 Inches, the engine Is required to be removed within 25 cycles In order to weld repair the crack. If the crack tndtcation exceeds 2 Inches In length, the engine Is required to be removed bnmedtately In order to weld repair the crack. Weld repairs of cracks are Inspected In the shop before the dUfuser case Is released back Into seiVIce. However, cracks In the weld repair region have been found shortly after pedormtng the weld repair. It Is a vety difficult task to detect and Identify small cracks hiding behind the coarse grain structure of the weld repair matertal. This Is espectally true for the conventional ultrasonic testing method where A-scans result In different signal-to-noise ratios at dUferent locations. The problem Is to reliably detect small cracks behind the weld where background noise occurs due to the gratn structure mJxed with ultrasonic signals caused by the crack.
Various approaches have been attempted by SAIC to solve the problem Including signal and noise spectrum analysis, adapted learning algorithms, and the feature analysis Q!ethod. The SAIC approach Included using the Imaging equipment In conjunction with transducer frequency optimization, signal processing and mtertng prior to Image display. 1be final approach, chosen by S)Jc, was an ultrasonic Imaging technique which uses an angle beam.
The basic principle of ultrasonic Imaging Is to record relevant ultrasonic signals which have been transmitted through the material. Due to refraction, reflection, diffraction, scattering and tntederence of the sound beam on grain boundaries, true charactertzation of ultrasonic signals from dUferent size cracks at different locations requires sophisticated equipment and extensive testing and an~ts. The process of conducting ultrasonic tests Involves optlmJzation of transducer parameters, frequencies and size. Other factors Include beam diameter, near and far field, beam angle. beam spread, crack size, crack orientation and crack location. To correlate measured signals with actual crack locations, an encoder or encoded scanner Is required. PWA provided two JT9D diffuser case samples to SAIC In order to conduct the tests and perform the analysts required to develop a prellmlnaty ultrasonic Inspection procedure for crack detection Inside a weld repair. Included as part of the prellmlnaJy Inspection procedure, SAIC developed a computer controlled motorized (automated) scanner for the JT9D outer combustor dUfuser case.
The first sample from PWA was approximately 5 Inches wide by 7 Inches long with a crack In the middle of the weld repair section In the stiffener rail. Figure 13 Is a picture of the JT9D diffuser case ldentlfled as Sample 1. Figure 141s a sketch of Sample 1 annotating the surface ldentiflcation. The stiffener rail Is located on the outer diameter of the top surface of the dUfuser case. Based on the configuration of the dUfuser case, figure 15 Indicates aU the possible scanning directions. The typical crack required to be detected Is a small crack In the stiffener rail behind the large grain structures In the weld repair as sketched In figure 16. Shear wave angle beam tests have been conducted with transducers scanning surface A. surface D and surface E.
Two representative tests conducted by SAIC using a transducer scanning Inner surface E of Sample 1 are ldentifled as Test 45D5M2G and Test 5MQ1R60. Figure 17 shows the UI-JVIM C-scan results ofTest 4505M2G with a X-Y Image resolution of 1mm. A 5 MHz shear wave angle beam transducer with a 45-degree refraction angle to direct the beam normal to the stiffener rail was used to obtain the results for Test 4505M2G. The stiffener rail and the crack are clear Images as annotated by the arrows In figure 17. Figure 18 shows the UI-fVTM C-scan results of Test 5MQTR60. A 5 MHz shear wave angle beam transducer with a 60-degree refraction angle to direct the beam normal to the stiffener rail was used to obtain the results for Test 5MQTR60. In both tests, the sound path passed through the welds before reaching the crack.
Two additional tests were pedormed with the transducer scanning the top surface of Sample 1. Test 5MREJSK was performed scanning surface D using a 5 MHz 60 degree angle beam transducer. 1be beam direction was normal to and toward the stiffener rail. The skip path signal with a reject level threshold was used to eliminate background noise. Ultrasonic Imaging results are shown In figure 19. Test 5MREJSK ldentifles the stiffener rail and the crack In the middle of the stiffener rail. Teat FAAT2 was conducted similarly to Test 5MREJSK except the transducer was placed on surface A. The beam direction
30

Is normal to and toward the stUTener ran. UI-IVTM C-scan results are shown In figure 20 and Identifies the stUTener ran and the crack In the middle of the stUTener ran. After completing ultrasonic tests of Sample 1, PWA supplied a larger sample of the JT9D outer combustor dJJfuser case which measured 12 Inches wide by 17 Inches high. Figure 211s a picture oftheJT9D dJJfuser case Identified as Sample 2. A 20 mll deep saw cut was Introduced In the stUTener ran, as shown In figure 22. Ftgure 22 shows the configuration of both the outside and Inside views. Due to the numerous obstructions on the outer diameter surface of the dUTuser case, transducer placement Is not possible on the outside surface of the dUTuser case. Surface E, the Inner diameter surface, is accessible except for the vane areas. All tests on Sample 2 were conducted from the toner diameter surface.
Three representative tests conducted by SAIC which used a transducer scanned from the Inner diameter surface of Sample 2 are Identified as Test Ll5DNOMC, Test PYCRKSAM and Test NYCRKSAM. Ul- IVlltl results ofTest Ll5DNOMC are shown In figure 23. This test used a 15 MHz longttudtnal wave transducer with a delay ltne scanned In a circumferential direction. The ultrasonic gate was set to the nominal thickness of the dUTuser case. Ultrasonic results clearly show the Image of the stUTener ran and other contour patterns of the outer diameter surface.
Figures 24 and 25 show the UI-J'Vlltl results of Test PYCRKSAM and Test NYCRKSAM respectively. These tests used a shear wave angle beam transducer with the beam directed toward the positive and negative circumference direction along the stUTener rail. The recorde<:l signals were reflected from the 20 mll saw cut on the stUTener raU. Image results of the same saw cut In the two tests showed the crack at two different locations relative to the transducer clockwise coordinates. For accurate ultrasonic Imaging results, both the signals and locations of the transducer must be accurate. Thel1efore, the computer controlled motorized encoded scanner adapted for the JT9D outer diffuser case configuration was developed.
The encoded scanner Is made up of a motor, encoder system and motion controller. A schematic of the encoded scanner control Is shown In figure 26. The scanner is driven by two small 4 watt DC motors. The scanner posltlon is maintained by the attached encoders. The gear ratios for drtvlng the assembly are 500:1 and 50:1 for the track and ann axis. Figure 27 Is a sketch of the motodzed scanner. The track axis Is located In the circumferential direction around the Inner diameter surface of the dUTuser case. The arm axis Is along the longitudinal direction of the dUTuser case as shown In figure 28. Figure 29 Is a sketch of the motorized scanner In relation to Sample 2. Figure 30 presents photograph of the motorized scanner set-up to perform scans on Sample 2.
Prior to starting the computer controlled scanner, the ultrasonic lmagtng system and the ultrasonic angle beam signals must be set for data collection. Standard operating procedures are developed for each ultrasonic imaging Inspection system. The description of the UI-J'Vlltl and set up procedure Is shown In Appendix C. To establish the ultrasonic settings a B-scan was run for Sample 2 and recorded as Test BSC2PYCK with the transducer beam directed along the circumferential direction of the stiffener ran. A 5MHz. 45 degree, 0.251nch diameter transducer was used. Figure 31 shows the results of Test BSCZPYCK where an A-scan of the ultrasonic signal from the 20 mll saw cut on the stUTener rail Is displayed.
The operation procedures of the computer controlled scanner are described below:
1: Put program disk In the motion controller processor: manual selections will appear on the screen.
2: Use JOG command and arrow keys to move the transducer to any designated home location/position.
3 Enter scanning parameters, Le. scanner speed and acceleration, length of scanning direction and Increment direction.
4; Press SCAN to start scan: the transducer w1ll move from home position to scan along the X-dlrection and Increment In the Y-dlrection. When the entire area Is scanned, the scanner will return to the home position and stop automatically.
The computer controlled motorized scanner was used to perform the Test SANDIA-7. The UI-IVTM results of Test SANDIA-7 are shown In figure 32. Test SANDIA-7 recorded the 20 mt1 saw cut In the stiffener ran as annotated by the arrows. The C-scan image Is shown In the top of the figure and an ampUtude prorue plot Is shown at the bottom of the figure for the Intersecting Une shown In the C-scan. TI1e preUmtnary Inspection procedures for the JT9D dUTuser case are outlined In Appendix D.
31

Figure 13. JT9D Outer Combustor Diffuser • Sample 1
\ \ B \
A C
SECTION F-F--~k~/'--D-~p SURFACE)
E (BACK INNER SURFACE) ,.
JT9D SAMPLE 1 INSPECTION SURFACES
Figure 14. JT9D Outer Combustor Diffuser
32

NORMAL PROBE ANGLE PROBE (COMPRESSION WAVE) (45 DEC, 60 DEC)
ANGLE PROBE ( 45 DEC, 60 DEC)
Vl N \ /
ANGLE PROBE (45 DEC. 60 DEC)
Figure 15. JT9D - Sample 1 Possible Angle Beam Directions Through Weld Repair Of Service Induced Crack
CRACK
ANGLE BEAM
WELD BASE METAL
Figure 16. JT9D- Sample 1 Angle Beam Through Weld Repair Material Of Crack
33

34
r-

w 01
Figure 18. Ultra Image Test 5MQTR60, Shear Wave, Sample 1, Scanning From Inner Surface, E

36
... Cl)
'5 0 E
0
u: bll
·= t: t: ~
(.) V
)
Cl)
... ::::1 t>ll
l.i:

w -.....!
Figure 2G. Ultra Image Test FAAT2, Shear Wave, Sample 1, Scanning From Outer Swface, A

.JT9D OUTER DifFUSER TOP VIEW
1 CUT OF'F' SAMPLE/ / I
// I L
REAR VIEW
INNER VIEW
Figure 21. JT9D Outer Combustor Diffuser · Sample 2
INSPECTION
AREA
(DOTTED AREA) '
20 MIL
SAW CUT
INSIDE
VIEW
OUTSIDE
VIEW
Figure 22. JT9D . Sample 2 with 20 mil Saw Cut
38

w <0
Figure 23. Ultra Image Test L15DNOMC, Compression Wave, Sample 2, Scanning From Inner Surface

40
.... Vl
Cl.l rCl.l 0
0
"" E .......

41
.... Vl
C1)
E-< C1) b
ll C':l E
-C':l !::: 5

1-·Monilo~r
Keyboard ._.1}·~ . fL_
PC/AT
Optical lncreTnental Encoder
_C_-. - ~--[ IJC Aris·-1
4323 Afolor
DC Motor
t___,cf,t-2"=-0:ptical lncreTnental Encoder
Figure 26. JT9D Automated Scanner Motor Controller
TRACK \ MOTOR & _j ENCODER
& ENCODER
/ TRANSDUCER
/ TRANSDUCER
Figure 27. Jf9D Motorized Scanner Sketch
42

TRACK \ MOTOR & _j ENCODER
/ TRANSDUCER
TRANSDUCER /
""-ARM MOTOR & ENCODER
Figure 28. JI'90 Motorized Scanner Track and Arm Mechanism
TRACK MOTOR & ENCODER
20 MIL SAW CUT
OUTSIDE
VIEW
Figure 29~ JI'9D Motorized Scanner and Sample 2
43

Figure 30. Picture of JT9D Motorized Scanner and Sample 2
44

~ (]1
:-·
F1-Help <Esc>-Previous menu
Figure 31. U1tra Image Test BSC2PYCK, Shear Wave, Sample 2, A- and B-Scan

~ Q)
u~e •• O{'{'a..i~ to change J <Esc> to exit.
Figure 32. Ultra lmJge Test SANDIA-7, Shear Wave, Sample 2, Motorized Scan From Inner Surface Of Case

CF6 ENGINE CASE FAILURE ANALYSIS
Review of the CF6 engine component failures documented In the FAA SDR data base from 1986 through the end of 1991 Identified six case failures; one fan case failure, one CRF case failure, and four twblne midframe case failures.
The fan case failure Included a crack at the 5 o'clock position (looking Into the engine) between the frame support strut and the hub. This area Is In the heat affected zone of the abutment weld area.
The CRF failure began In a weld area and progressed 360 degrees around the Inner diffuser wall separating the aft flange. This type of failure can cause catastrophic engine failures as the case alignment shifts when the aft. flange separates from the remainder of the case.
All four of the 1'MF failures were case cracks occurring In the case walls or at the C-sump area near the number 5 bearing attachment location. The cracks varied In length from 1.51nches to four feet. The more severe cracks caused in-Olght vibration and fire warning lights as high pressure turbine rotor shifts caused hot gases to activate the fire warning systems. The cracks occurred In case weld fabrication areas such as the number 5 bearing attachment fittings and engine mounts.
As with the JT9D engine case failure patterns, there were a series of failures originating In the fabrication weld, repair weld, or the weld affected zone. For early detection of weld deformities, some technique other than the surface detection approach using fluorescent penetrant Is required. SAIC, using the UI-JVTM system, has demonstrated the ability to detect and track crack propagation In weld areas. Prellmlnary Inspection procedures and data results using the UI-JVTM system for the TMF and the rear compressor case are described below.
CF6 ENGINE CASE NDI DEVELOPMENT
Four CF6 engine case samples were acquired from the GE Aircraft Engines Technology Quality Center In Cincinnati, Ohio. The samples consisted of three TMF samples and one CRF sample. A picture of each of the samples Is shown In figure 33.
The first TMF sample, designated as CF6 Sample 1, Is a section of the aft. flange weld from a CF6-5D TMF. The material Is forged Inconel718 with a TIG weld fabrication. Two EDM notches were located on the Inner diameter surface of the aft flange circumferential weld as shown In figure 34. Test CF6S2A was conducted on CF6 Sample 1 with the prellminruy C-scan and amplltude plot Imaging results shown In figure 35. The two EDM notches on either side of the weld are shown In figure 35, using an amplltude scan for sensitivity In defining the size of the EDM notches. A time of flight scan would exhibit the relative positions of the notches, but that view Is not Included In figure 35.
The second TMF sample, designated as CF6 Sample 2, ls slmllar to CF6 Sample 1 except lt Includes a thermal coating on the Inner diameter surface as shown In figure 36. On this sample, the EDM notch was over sprayed with a thermal coating. No Information regarding size, shape or location was provided by GE. Test CF6S2A1 was performed using an angle beam transducer on the outer surface of the sample. The defects beneath the thermal coating were bnaged using an UI-IVIld amplitude scan. The prellmlnary results of Test CF6S2A1 are shown In figure 37.
The thJrd sample, designated as CF6 Sample 3, Is also a portion of the TMF. CF6 Sample 3 contains two welded areas; a circumferential weld similar to those In CF6 Sample 1 and CF6 Sample 2, and a clrcular weld around the boss area. A sketch of CF6 Sample 3 Is shown In figure 38. 1ltls sample contained seven notches as Initiated and described by GE with the largest flaws being 0.250 Inches long by 0.00151nches deep and the smallest flaws being 0.0030 Inches long by 0.00151nches deep. Test CF6TMFS3 was conducted to Inspect for flaws In the weld areas. Flaws In the circumferential weld as well as the boss weld area were not obvious In appearance, but were bnaged using the Ul-fVTM amplltude scan. The prellmlnary results of Test CF6TMF33 are shown In figure 39, which exhibits three flaws. Detection of all of the flaws would be possible with transducer optimization.
The fourth sample was obtained from a CF6-80A CRF mid-flange and Is designated CF6 Sample 4. The sample contained an EDM notch on the mid-flange scallop as shown In figure 40. The CRF mid-flange Is manufactured from cast lnconel718. Due to the coarse grain structure of the parent material, the background noise level Is extremely high when using ultrasonics and the feedback made this Inspection attempt a complex problem. A transducer selection was made to provide prellmlmuy results. Test CRFA2 was performed and indications of the EDM notch In the flange scallop were exhibited. Figure 41
47

shows the results of Test CRFA2. Transducer optlmtzation Is required to improve image contrast in the cast grain structure.
The CF6 sample examinations provided prellmlnary results only. For comprehensive NDI procedures for the two CF6 engine cases, more development tests are needed. These development tests would include transducer parameter optimization, flaw signal charactertzation and tests of the UI-IIJTM and UI-JVTM systems for data acquisition and Information displaying format. Continued collaboration with the engine manufacture and demonstrations of the acceptability of a procedure for either on-wing or maintenance shop application would be part of any valldation cycle.
48
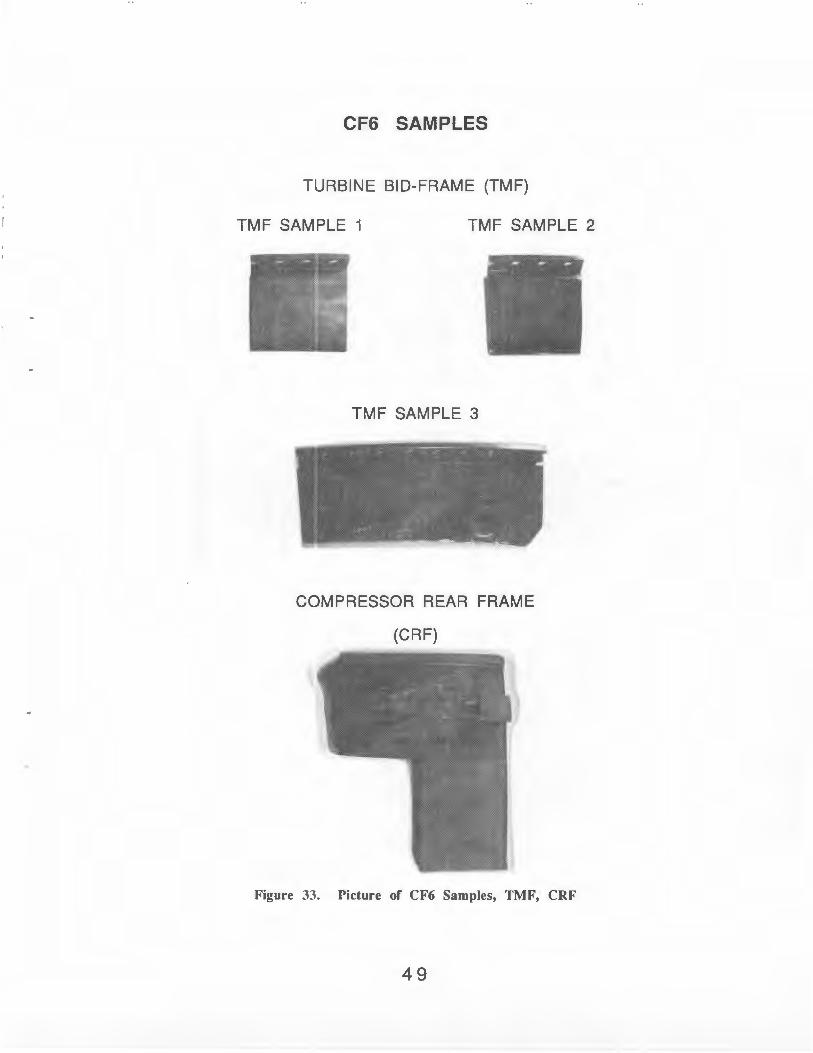
CF6 SAMPLES
TURBINE BID-FRAME (TMF)
TMF SAMPLE 1 TMF SAMPLE 2
TMF SAMPLE 3
COMPRESSOR REAR FRAME
(CRF)
Figure 33. Picture of CF6 Samples, TMF, CRF
49
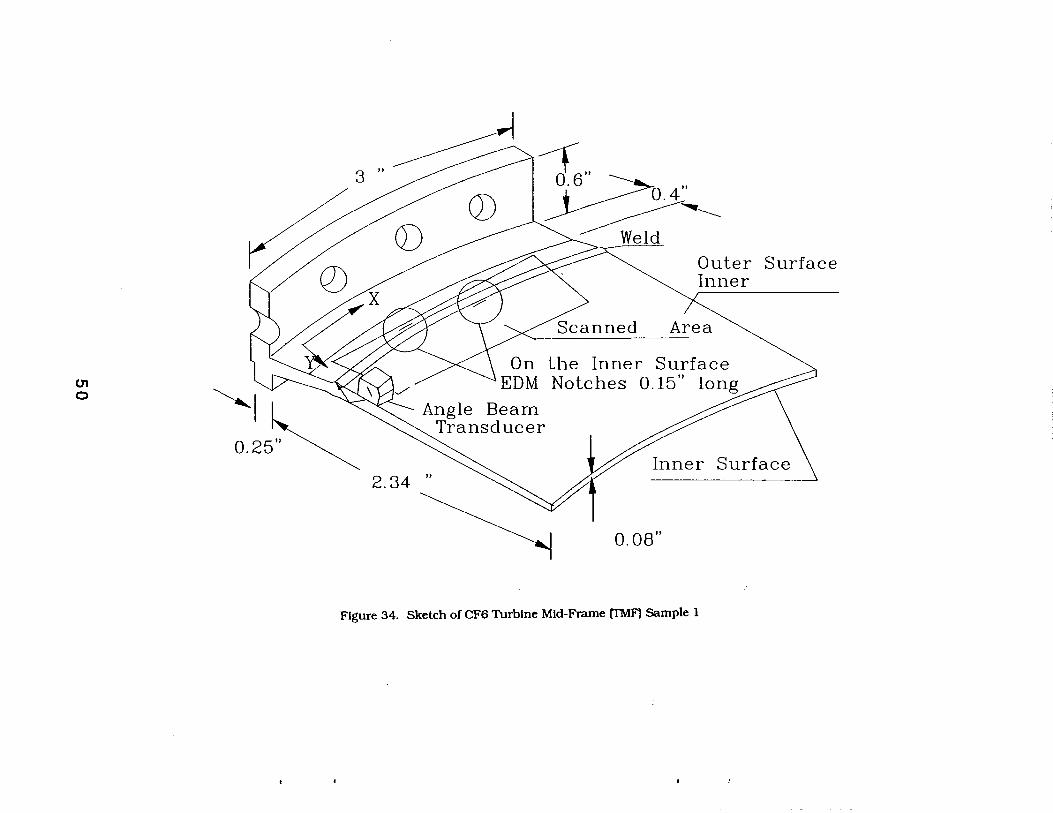
01 0 ~I ~ ---..__ '\"'l '
0.25"~ 2. 34 ,
Outer Surface Inner
____ _ __ Area
On the Inner Surface EDM Notches 0.15" long
Inner Surface
0. 08"
Figure 34. Sketch of CF6 Turbine Mid-Frame (IMF) Sample 1

01 ~
!J_:::::He l p < ~~!~':__!'t-·f:~-d ous ment~--- :~;:::..:.
Figure 35_ Ultra Image Test CF6S2A, Shear Wave, TMF, Sample l

01 1\)
"'I~ 0.25" ~~
"
Q)
2. 34 "
----1 0.6"
___J>-n.4" ~
Area
Outer Surface Inner
Inner Surface
I (Coating 0.04") 0. 08"
Figure 36. Sketch of CF6 Turbine Mid-Frame (TMF) Sample 2

(}1
w
Figure 37. Ultra Image Test CF6S2Al. Shear Wave, Tl'v1F Sample 2

01 ~ 8.5"
Figure 38. Sketch of CF6 Turbine Mid-Frame (TMF) Sample 3
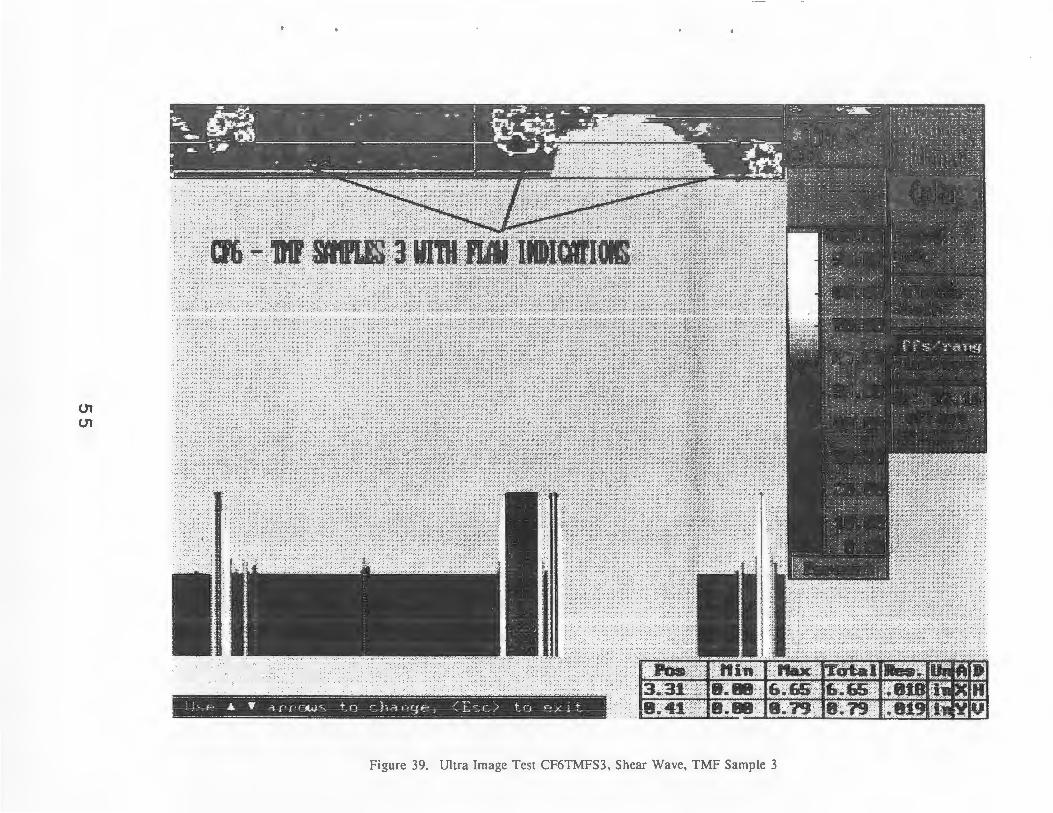
55
01 0)
4-"
5.6"
------~ 7'' --~
0.162" Transducer
Figure 40. Sketch of CF6 Compressor Rear Frame (CRF) Sample
57

CONCLUSIONS
The actuarial analysts methodology was effective In determining low rellablllty components for each engine reviewed. This was further confirmed through discussions with the engine manufacturers and selected carriers.
Although the design technology and material used for engine malo bearings has Improved, bearings were documented as a rellablllty problem.
Controls and accessories were responsible for the majority of In-flight shutdowns, flameouts and compressor stalls exhibited In the failure Incident data covering the five year component trending period.
Diagnostic trouble shooting procedures for controls and accessories appear to be Ineffective since multiple accessories are removed for precautloruuy measures to resolve ln-Olght flameouts and stalls.
Turbine airfoil component rellablllty has significantly Improved with air coollng technology and OS material, but air cooled airfoils suffered severe damage during the compressor stalls and resulting rapidly Increased EGT.
Some fuel/oil system failures were caused by maintenance errors such as oU caps unsecured, pinched seals, stripped mounting studs and left out gasket/shims.
The Jf8D engine #6 bearing oU tube and 13th stage bleed air duct do not require Improved NDI procedures. The enhanced configurations developed by the manufacturers- of these Items wUI resolve the documented low rellablllty performance.
The ultrasonic automated Image enhancement method developed for the Jf8D engine outer combustor case Is applicable to similar weld Inspection requirements on the JT9D engine diffuser case, CF6 engine compressor rear frame case and CF6 engine turbine mid-frame case. ·
Improved Inspection procedures for characterization of repair welds Is of Interest to PWA and GE Aircraft Engines and their full cooperation In this study was obtained.
Defects 0.030 Inch long and 0.020 Inch deep In repair welds of service Induced cracks of the JT9D engine diffuser case stiffener rail can be detected and Imaged with a permanent recording using the UI-JVTM system. This documentation recorded compltance of the Inspection requirement and provided a basellne for structural integrity assessments.
58

APPENDIX A- ACTUARIAL IN-FLIGHT SHUTDOWN AND ENGINE REMOVAL DATA

JT9D MONTHLY PERFORMANCE IN-FLIGHT SHUTDOWNS
Feb-88 Mar-88 Apr-88 May-88 Jun-88 Jul-88 Aug-88 Sep-88 8747 INDUSTRY 0.17 0.20 0.16 0.16 0.19 0.15 0.14 0.13 CTA 0.72 0.44 0.08 0.11 0.28 0.08 0.00 0.00 ABC 0.06 0.25 0.18 0.17 0.22 0.15 0.15 0.10 AAA 0.00 0.27 0.00 0.25 0.00 0.52 1.69 0.00 QQQ 0.45 0.20 0.07 0.00 0.20 0.04 0.11 0.06 DEF ND ND ND ND ND ND NO ND BKB 0.10 0.09 0.24 0.20 0.16 0.17 0.09 0.19 DAR ND 0.00 0.00 0.51 0.00 0.34 0.17 0.00 LWZ 0.05 0.14 0.09 0.12 0.10 0.13 0.16 0.19 RAB 0.03 0.08 0.08 0.08 0.10 0.08 0.09 0.03 DDA 0.00 0.00 0.00 0.00 0.00 0.00 0.00 0.00 ILT 0.00 ND 0.00 0.00 0.00 0.00 NO 0.00 JKL ND ND ND ND ND 0.00 0.00 0.00 NNN ND ND ND ND ND ND NO ND
8767 INDUSTRY 0.00 0.24 0.00 0.17 0.17 0.10 0.00 0.00 LWZ 0.00 0.13 0.00 0.00 0.00 0.12 0.00 0.00 RAB 0.00 0.16 0.00 0.17 0.17 0.00 0.00 0.00
DC10 INDUSTRY 0.31 0.27 0.16 0.25 0.30 0.42 0.20 0.39 BKB 0.19 0.17 0.08 0.15 0.20 0.30 0.12 0.27 NZT 0.00 0.00 0.00 0.00 0.00 0.00 0.00 0.00
Oct-88 Nov-88 Dec-88 Jan-89 Feb-89 Mar-89 Apr-89 May-89 8747 INDUSTRY 0.15 0.10 0.13 0.13 0.12 0.15 0.18 0.14 CTA 0.10 0.00 0.00 0.19 0.00 0.12 0.23 0.00 ABC 0.18 0.09 0.13 0.00 0.08 0.08 0.16 0.20 AAA 1.62 0.00 ND 0.00 0.00 0.00 0.00 NO QQQ 0.17 0.13 0.21 0.13 0.14 0.23 0.04 0.11 DEF NO NO ND ND NO NO NO NO BKB 0.16 0.11 0.15 0.13 0.08 0.04 0.10 0.10 DAR 0.24 0.41 0.20 0.40 0.00 0.26 0.32 0.00 LWZ 0.14 NO 0.05 0.19 0.16 0.04 0.04 0.16 RAB 0.00 0.00 0.07 0.13 0.09 0.28 0.30 0.12 DDA 0.00 0.00 0.00 0.00 0.00 0.00 0.00 0.00 ILT NO ND 0.00 0.00 ND NO 0.59 0.00 JKL 0.30 0.00 0.00 0.31 0.62 0.00 0.31 0.00 NNN NO ND ND ND ND ND NO NO
8767 INDUSTRY 0.00 0.00 0.00 0.17 0.00 0.00 0.00 0.17 LWZ 0.00 ND 0.00 0.00 0.00 0.00 0.00 0.13 RAB 0.00 0.00 0.00 0.15 0.00 0.00 0.00 0.08
DC10 INDUSTRY 0.22 0.00 0.33 0.00 0.14 0.67 0.00 0.22 BKB 0.27 0.00 0.21 0.00 0.08 0.50 0.00 0.13 NZT 0.00 0.00 0.00 0.00 0.00 0.00 0.00 0.00
A-1

Jun-89 Jul-89 Aug-89 Sep-89 Oct-89 Nov-89 Dec-89 Jan-90 8747 INDUSTRY 0.09 0.15 0.17 0.12 0.09 0.13 0.21 0.14 CTA 0.17 0.00 0.08 0.08 0.08 0.09 0.26 0.09 ABC 0.04 0.17 0.06 0.09 0.07 0.17 0.26 0.26 AAA ND ND ND ND NO ND ND ND 000 0.03 ND ND ND NO ND ND ND DEF ND ND 0.04 0.11 0.00 0.11 0.08 0.05 BKB 0.12 0.17 0.25 0.12 0.13 0.02 0.25 0.08 DAR 0.00 0.00 0.36 0.00 0.23 0.24 0.20 0.00 LWZ 0.07 0.10 0.10 0.11 0.09 0.09 0.17 0.04 RAB 0.04 0.07 0.11 0.10 0.06 0.19 0.05 0.10 DDA 0.00 0.71 0.00 0.76 0.00 0.36 0.00 0.00 ILT ND 0.40 0.32 ND ND 0.00 ND ND JKL 0.00 0.00 1.02 ND 0.00 0.00 0.25 0.59 NNN ND ND ND ND 0.00 0.00 0.00 0.00
8767 INDUSTRY 0.17 0.00 0.00 0.25 0.00 0.00 0.00 0.00 LWZ 0.00 0.00 0.00 0.00 0.00 0.00 0.00 0.00 RAB 0.16 0.00 0.00 0.27 0.00 0.00 0.00 0.00
DC10 INDUSTRY 0.25 0.31 0.31 0.40 0.33 0.21 0.28 0.20 BKB 0.17 0.22 0.22 0.29 0.23 0.13 0.19 0.12 NZT 0.00 0.00 0.00 0.00 0.00 0.00 0.00 0.00
Feb-90 Mar-90 Apr-90 May-90 Jun-90 Jul-90 Aug-90 Sep-90 8747 INDUSTRY 0.15 0.10 0.19 0.12 0.20 0.16 0.16 0.11 CTA 0.00 0.00 0.20 0.21 0.09 0.00 ND ND ABC 0.18 0.16 0.18 ND 0.41 0.35 0.14 0.04 AAA ND ND ND ND ND ND ND ND 000 ND ND ND ND NO ND ND ND DEF 0.06 0.04 0.43 0.17 0.26 0.05 0.22 0.00 BKB 0.19 0.13 0.13 0.10 0.14 0.16 0.16 0.21 DAR 0.00 0.00 ND 0.00 0.27 0.00 0.34 0.00 LWZ 0.15 0.04 0.00 0.00 0.07 0.04 0.04 0.08 RAB 0.05 0.00 0.12 0.10 0.02 0.04 0.13 0.04 DDA 0.00 0.35 0.37 0.00 0.00 0.37 0.39 0.00 ILT 0.00 0.00 0.00 0.00 0.00 ND 0.00 0.19 JKL 0.31 0.00 0.52 0.25 0.27 0.00 0.25 0.00 NNN 0.00 0.00 0.00 0.00 0.00 0.00 0.00 0.43
8767 INDUSTRY 0.00 0.00 0.10 0.10 0.00 0.10 0.00 0.00 LWZ 0.00 0.00 0.00 0.14 0.00 0.11 0.00 0.00 RAB 0.00 0.00 0.09 0.00 0.00 0.00 0.00 0.00
DC10 INDUSTRY 0.66 0.19 0.20 0.12 0.24 0.17 0.46 0.34 BKB 0.51 0.12 0.12 0.06 0.16 0.10 0.35 0.24 NZT 0.00 0.00 0.00 0.00 0.00 0.00 0.00 0.00
A-2

JT9D MONTHLY PERFORMANCE IN-FLIGHT SHUTDOWNS (CONTINUED)
Oct-90 Nov-90 Dec-90 Jan-91 8747 INDUSTRY 0.20 0.18 0.17 0.15 CTA 0.31 0.00 0.55 0.08 ABC 0.25 0.17 0.16 0.20 AAA NO NO NO NO QQQ NO NO NO NO DEF 0.13 0.09 0.00 0.06 BKB NO NO NO NO DAR 1.09 0.55 0.39 0.75 LWZ 0.13 0.17 0.22 0.12 RAB 0.02 NO 0.02 0.04 DDA 0.00 0.00 NO 0.00 ILT 0.20 0.12 0.18 0.18 JKL 0.00 0.00 0.00 0.00 NNN 0.00 0.20 0.00 0.00
8767 INDUSTRY 0.10 0.26 0.00 0.00 LWZ 0.13 0.13 0.00 0.00 RAB 0.00 NO 0.00 0.00
DC10 INDUSTRY NO NO NO NO BKB NO NO NO NO NZT NO NO NO NO
A-3

JT9D MONTHLY PERFORMANCE ENGINE REMOVALS
Feb-88 Mar-88 Apr-88 May-88 Jun-88 Jul-88 Aug-88 Sep-88 8747 INDUSTRY 0.16 0.31 0.20 0.32 0.27 0.25 0.25 0.20 CTA 0.14 0.33 0.24 0.15 0.28 0.34 0.26 0.00 ABC 0.06 0.23 0.22 0.27 0.30 0.34 0.30 0.22 AAA 0.00 0.55 0.30 0.00 0.00 0.00 0.00 0.00 QQQ 0.19 0.28 0.08 0.15 0.17 0.22 0.14 0.17 DEF NO NO NO NO NO NO NO NO BKB 0.22 0.28 0.17 0.10 0.24 0.25 0.27 0.21 DAR NO 0.27 0.62 0.00 0.00 0.00 0.17 0.24 LWZ 0.10 0.14 0.14 0.16 0.14 0.13 0.03 0.00 RAB 0.11 0.25 0.15 0.66 0.27 0.14 0.28 0.16 DDA 0.00 0.00 0.85 0.72 0.00 0.00 0.00 0.00 ILT 0.00 NO 0.00 0.00 2.25 0.00 NO 0.41 JKL NO NO NO NO NO 0.00 0.00 0.33 NNN NO NO NO NO NO NO NO NO
8767 INDUSTRY 0.25 0.30 0.17 0.44 0.17 0.35 0.29 0.17 LWZ 0.14 0.00 0.00 0.28 0.00 0.62 0.00 0.00 RAB 0.17 0.31 0.16 0.33 0.17 0.00 0.32 0.16
DC10 INDUSTRY 0.00 0.48 0.27 0.25 0.61 0.49 0.49 0.55 BKB 0.00 0.33 0.17 0.15 0.44 0.37 0.36 0.41 NZT 0.00 0.00 0.00 0.00 0.17 0.00 0.00 0.00
Oct-88 Nov-88 Dec-88 Jan-89 Feb-89 Mar-89 Apr-89 May-89 8747 INDUSTRY 0.23 0.24 0.26 0.18 0.21 0.19 0.26 0.22 CTA 0.48 0.00 0.20 0.18 0.13 0.23 0.20 0.41 ABC 0.16 0.19 0.18 0.00 0.08 0.14 0.18 0.22 AAA 0.00 0.00 NO 0.00 1.32 0.00 0.00 NO QQQ 0.21 0.14 0.32 0.04 0.25 0.10 0.38 0.20 DEF NO NO NO NO NO NO NO NO BKB 0.20 0.18 0.20 0.23 0.25 0.13 0.14 0.12 DAR 0.24 0.41 0.20 0.00 0.00 0.00 0.00 0.57 LWZ 0.05 NO 0.14 0.29 0.21 0.22 0.26 0.04 RAB 0.28 0.24 0.29 0.24 0.11 0.28 0.28 0.27 DDA 0.00 0.37 0.00 0.00 1.85 0.00 0.00 0.00 ILT NO NO 0.00 0.00 NO NO 1.02 0.00 JKL 0.30 0.29 0.77 0.31 0.31 0.00 0.31 0.27 NNN NO NO NO NO NO NO NO NO
8767 INDUSTRY 0.23 0.26 0.17 0.10 0.32 0.41 0.38 0.36 LWZ 0.13 NO 0.13 0.14 0.00 0.28 0.15 0.00 RAB 0.15 0.15 0.15 0.08 0.33 0.30 0.32 0.40
DC10 INDUSTRY 0.55 0.35 0.51 0.14 0.63 0.75 0.24 0.39 BKB 0.41 0.23 0.36 0.07 0.47 0.50 0.15 0.26 NZT 0.00 0.00 0.00 0.00 0.00 2.03 0.00 0.00
A-4

JT9D MONTHLY PERFORMANCE ENGINE REMOVALS (CONTINUED)
Jun-89 Jul-89 Aug-89 Sep-89 Oct-89 Nov-89 Dec-89 Jan-90 8747 INDUSTRY 0.19 0.25 0.24 0.23 0.22 0.26 0.23 0.23 CTA 0.17 0.33 0.24 0.17 0.23 0.27 0.56 0.34 ABC 0.08 0.23 0.19 0.16 0.12 0.27 0.33 0.16 AAA ND ND ND ND ND ND ND ND QQQ 0.18 ND NO ND ND ND ND ND DEF ND ND 0.16 0.27 0.30 0.26 0.22 0.41 BKB 0.21 0.23 0.27 0.31 0.23 0.22 0.17 0.14 DAR 0.00 0.00 0.54 0.00 0.23 0.00 0.20 0.43 LWZ 0.17 0.26 0.20 0.19 0.17 0.28 0.00 0.09 RAB 0.17 0.14 0.20 0.20 0.15 0.13 0.13 0.15 DDA 0.00 0.00 0.00 0.00 0.35 0.36 0.00 0.49 ILT ND 3.01 0.00 ND ND 0.63 ND ND JKL 0.28 0.00 0.25 ND 0.21 0.53 0.25 0.59 NNN ND ND NO ND 0.00 0.00 0.00 0.38
8767 INDUSTRY 0.36 0.36 0.00 0.25 0.33 0.19 0.17 0.31 LWZ 0.26 0.13 0.00 0.13 0.17 0.15 0.00 0.13 RAB 0.24 0.33 0.00 0.18 0.25 0.09 0.17 0.26
DC10 INDUSTRY 0.45 0.38 0.38 0.27 0.33 0.12 0.28 0.56 BKB 0.33 0.27 0.27 0.17 0.23 0.06 0.19 0.43 NZT 0.00 0.00 0.00 0.00 0.00 0.00 0.00 0.00
Feb-90 Mar-90 Apr-90 May-90 Jun-90 Jul-90 Aug-90 Sep-90 8747 INDUSTRY 0.23 0.21 0.25 0.21 0.31 0.26 0.29 0.24 CTA 0.13 0.16 0.20 0.21 0.44 0.07 ND ND ABC 0.34 0.14 0.28 ND 0.26 0.31 0.26 0.19 AAA ND ND ND ND ND ND ND ND QQQ ND ND ND ND ND ND ND ND DEF 0.29 0.12 0.37 0.05 0.46 0.10 0.32 0.24 BKB 0.14 0.26 0.28 0.22 0.19 0.26 0.28 0.29 DAR 0.00 0.00 ND 0.00 0.27 0.19 0.00 0.20 LWZ 0.21 0.17 0.22 0.08 0.33 0.26 0.18 0.20 RAB 0.20 0.16 0.05 0.25 0.26 0.18 0.30 0.17 DDA 0.00 0.35 0.37 0.00 0.37 0.37 0.39 0.38 ILT 0.00 0.00 0.00 0.16 0.26 ND 0.00 0.19 JKL 0.31 0.28 0.26 0.25 0.27 0.83 0.49 0.00 NNN 0.00 0.00 0.00 0.35 0.00 0.00 0.00 0.22
8767 INDUSTRY 0.48 0.54 0.31 0.58 0.17 0.29 0.22 0.29 LWZ 0.28 0.37 0.00 0.28 0.12 0.00 0.11 0.00 RAB 0.37 0.42 0.35 0.52 0.08 0.34 0.16 0.33
DC10 INDUSTRY 0.52 0.41 0.42 0.42 0.42 0.29 0.29 0.62 BKB 0.39 0.30 0.30 0.29 0.31 0.20 0.20 0.47 NZT 0.00 0.00 0.00 0.00 0.00 0.00 0.00 0.00
A-5

JT90 MONTHLY PERFORMANCE ENGINE REMOVALS (CONTINUED)
Oct-90 Nov-90 Dec-90 Jan-91 8747 INDUSTRY 0.20 0.18 0.17 0.15 CTA 0.31 0.00 0.55 0.08 ABC 0.25 0.17 0.16 0.20 AAA NO NO NO ND QQQ NO NO NO ND DEF 0.18 0.14 0.18 0.30 BKB NO ND ND NO OAR 0.00 0.00 0.00 0.00 LWZ 0.27 0.23 0.09 0.12 RAB 0.27 ND 0.16 0.21 DDA 0.00 0.00 ND 0.00 ILT 0.12 0.12 0.53 0.43 JKL 0.52 1.02 0.22 0.20 NNN 0.00 0.41 0.00 0.26
8767 INDUSTRY 0.42 0.26 0.30 0.17 LWZ 0.13 0.13 0.13 0.00 RAB 0.41 NO 0.24 0.16
DC10 INDUSTRY NO ND ND NO BKB NO NO NO NO NZT ND NO ND ND
A-6
CF6 MONTHLY PERFORMANCE IN-FLIGHT SHUTDOWNS
Feb-88 Mar-88 Apr-88 May-88 Jun-88 Jul-88 Aug-88 Sep-88 A300 INDUSTRY 0.14 0.00 0.00 0.08 0.08 0.00 0.26 0.08 ABC 0.00 0.00 0.00 0.00 0.00 0.00 0.18 0.00 CTA 0.19 0.00 0.00 0.00 0.00 0.00 0.00 0.20 XYZ 0.08 0.00 0.00 0.00 0.08 0.00 0.09 0.00 DDA NO NO 0.00 1.68 0.00 0.00 0.00 0.00
8767 INDUSTRY 0.00 0.00 0.06 0.00 0.00 0.00 0.04 0.04 DDA 0.00 0.00 0.04 0.00 0.00 0.00 0.00 0.00 sss 0.00 0.00 0.00 0.00 0.00 0.00 NO 0.00 FPC 0.00 0.00 0.00 0.00 0.00 0.00 0.06 0.06 GGA NO NO NO NO NO NO NO NO
DC10 INDUSTRY 0.10 0.07 0.07 0.08 0.05 0.08 0.09 0.06 DDA 0.02 0.10 0.07 0.08 0.04 0.09 0.07 0.04 CTA 0.21 0.13 0.07 0.14 0.00 0.00 0.05 0.00 FPC 0.00 0.00 0.00 0.00 0.00 0.00 0.00 0.00 DEF 0.46 0.00 0.00 0.18 0.00 0.20 0.16 0.00 PPP NO NO NO NO NO NO NO NO RAB 0.07 0.00 0.03 0.02 0.00 0.04 0.09 0.07 TMR 0.00 0.00 0.38 NO 0.51 0.00 0.00 0.00 XYZ 0.00 0.00 0.00 0.00 0.51 0.00 0.00 0.00
Oct-88 Nov-88 Dec-88 Jan-89 Feb-89 Mar-89 Apr-89 May-89 A300 INDUSTRY 0.08 0.19 0.08 0.12 0.08 0.00 0.10 0.00 ABC 0.00 0.20 0.19 0.00 0.00 0.00 0.21 0.00 CTA 0.00 0.00 0.00 0.00 0.00 0.00 0.00 0.00 XYZ 0.00 0.12 0.00 0.10 0.11 0.00 0.00 0.00 DDA 0.18 0.16 0.00 0.15 0.00 0.00 0.00 0.00
8767 INDUSTRY 0.00 0.00 0.04 0.00 0.00 0.00 0.04 0.00 DDA 0.00 0.00 0.00 0.00 0.00 0.00 0.03 0.00 sss 0.00 0.00 0.25 0.00 0.00 0.00 0.00 0.00 FPC NO 0.00 0.00 0.00 0.00 NO 0.00 0.00 GGA NO NO NO NO NO NO NO NO
DC10 INDUSTRY 0.04 0.05 0.05 0.09 0.05 0.07 0.09 0.07 DDA 0.02 0.07 0.00 0.06 0.04 0.04 0.06 0.06 CTA 0.00 0.00 0.00 0.00 0.00 0.00 0.00 0.05 FPC NO 0.00 0.00 NO NO NO NO NO DEF 0.00 0.00 0.08 0.09 0.18 0.00 0.00 0.09 PPP NO NO NO NO NO NO NO 0.00 RAB 0.00 0.00 0.00 0.08 0.03 0.10 0.11 0.04 TMR 0.00 0.00 0.00 0.29 0.00 0.00 0.17 0.00 XYZ 0.00 0.00 0.00 0.00 0.00 0.00 0.00 0.00
A-7
CF6 MONTHLY PERFORMANCE IN-FLIGHT SHUTDOWNS (CONTINUED)
Jun-89 Jul-89 Aug-89 Sep-89 Oct-89 Nov-89 Oec-89 Jan-90 A300 INDUSTRY 0.08 0.12 0.06 0.00 0.00 0.12 0.00 0.00 ABC 0.00 0.00 0.00 0.00 0.00 ~ 0.21 0.00 0.00 CTA 0.19 0.00 0.00 0.00 0.00 0.00 0.00 0.00 XYZ 0.00 0.00 0.22 0.00 0.00 0.00 0.00 0.00 DDA 0.00 0.15 0.00 0.00 0.00 0.00 0.00 0.00
8767 INDUSTRY 0.00 0.00 0.04 0.00 0.07 0.00 0.04 0.00 OOA 0.00 0.00 0.05 0.00 0.06 0.00 0.00 0.00 sss 0.00 ND ND NO ND NO NO ND FPC 0.00 0.00 0.00 0.00 0.00 0.00 0.06 0.00 GGA ND ND 0.00 0.00 0.00 0.00 0.00 0.00
DC10 INDUSTRY 0.04 0.09 0.03 0.08 0.04 0.08 0.06 0.08 DDA 0.04 0.08 0.02 0.04 0.03 0.06 0.04 0.12 CTA 0.00 0.14 0.00 0.19 0.00 0.00 0.00 0.09 FPC ND ND ND ND ND ND ND ND DEF 0.00 0.00 0.07 0.00 0.05 0.05 0.00 0.00 ppp 0.00 0.00 1.42 0.00 0.00 0.00 ND ND RAB 0.04 0.07 0.00 0.09 0.03 0.08 0.05 0.03 TMR 0.00 0.00 0.00 0.16 0.00 0.00 0.14 0.00 XYZ 0.00 0.00 0.00 0.00 0.00 0.00 0.00 0.00
Feb-90 Mar-90 Apr-90 May-90 Jun-90 Jul-90 Aug-90 Sep-90 A300 INDUSTRY 0.08 0.06 0.00 0.13 0.00 0.00 0.00 0.00 ABC 0.00 0.18 0.00 ND 0.00 0.00 0.00 0.00 CTA 0.00 0.00 0.00 0.00 0.00 0.00 ND ND XYZ 0.24 0.00 0.00 0.00 0.00 0.00 0.00 0.00 DDA 0.00 0.00 0.00 0.16 0.00 0.00 0.00 0.00
8767 INDUSTRY 0.00 0.00 0.00 0.04 0.00 0.00 0.04 0.00 DDA 0.00 0.00 0.00 0.00 0.00 0.00 0.03 0.00 sss ND ND ND ND ND ND ND ND FPC 0.00 0.00 0.00 0.06 0.00 0.00 0.00 0.00 GGA 0.00 0.00 0.00 0.00 0.00 0.00 0.00 0.00
DC10 INDUSTRY 0.03 0.06 0.06 0.02 0.07 0.04 0.05 0.05 DDA 0.05 0.04 0.02 0.04 0.05 0.06 0.02 0.02 CTA 0.00 0.00 0.25 0.00 0.06 0.00 NO NO FPC ND ND ND ND ND ND ND ND DEF 0.00 0.00 0.00 0.00 0.00 0.00 0.06 0.05 ppp ND ND ND ND ND ND ND ND RAB 0.00 0.04 0.03 0.00 0.07 0.02 0.04 0.05 TMR 0.00 0.18 0.00 0.00 0.00 0.00 0.00 0.00 XYZ 0.00 0.00 0.00 0.00 0.00 0.00 0.00 0.00
A-8

CF6 MONTHLY PERFORMANCE IN-FLIGHT SHUTDOWNS (CONTINUED)
Oct-90 Nov-90 Dec-90 Jan-91 A300 INDUSTRY 0.00 0.00 0.00 0.12 ABC 0.00 0.00 0.00 0.17 CTA 0.00 0.00 0.00 0.00 XYZ 0.00 0.00 NO NO DDA 0.00 0.00 NO 0.08
8767 INDUSTRY 0.04 0.00 0.00 0.00 DDA 0.03 0.00 NO 0.00 sss NO NO NO NO FPC 0.00 0.00 NO 0.00 GGA 0.00 NO 0.00 NO
DC10 INDUSTRY 0.07 0.06 0.07 0.02 DDA 0.04 0.06 NO 0.00 CTA 0.00 0.00 0.00 0.00 FPC NO NO NO NO DEF 0.00 0.00 0.09 0.06 ppp NO NO NO NO RAB 0.11 NO 0.07 0.03 TMR 0.00 0.00 0.00 0.00 XYZ NO NO NO NO
A-9

CF6 MONTHLY PERFORMANCE ENGINE REMOVALS
Feb-88 Mar-88 Apr-88 May-88 Jun-88 Jul-88 Aug-88 Sep-88 A300 INDUSTRY 0.46 0.59 0.52 0.54 0.38 0.52 0.81 0.51 ABC 0.35 0.34 0.17 0.17 0.53 0.70 0.18 0.19 CTA 0.19 0.37 0.36 1.01 0.36 0.00 0.18 0.60 XYZ 0.39 0.55 0.51 0.25 0.16 0.48 0.51 0.54 DDA NO NO 0.00 0.00 0.00 0.30 0.00 0.00
8767 INDUSTRY 0.36 0.34 0.15 0.21 0.20 0.25 0.16 0.21 DDA 0.39 0.33 0.10 0.18 0.12 0.23 0.11 0.18 sss 0.00 0.00 0.00 0.00 0.00 0.00 NO 0.00 FPC 0.16 0.21 0.13 0.13 0.18 0.18 0.12 0.12 GGA NO NO NO NO NO NO NO NO
DC10 INDUSTRY 0.24 0.21 0.22 0.26 0.27 0.26 0.31 0.34 DDA 0.09 0.20 0.17 0.18 0.20 0.18 0.16 0.23 CTA 0.29 0.20 0.07 0.19 0.36 0.28 0.60 0.20 FPC 0.13 0.12 0.27 0.34 0.24 0.23 0.48 1.56 DEF 0.28 0.28 0.17 0.55 0.54 0.94 0.32 0.42 ppp NO NO NO NO ND NO NO ND RAB 0.24 0.13 0.20 0.25 0.17 0.20 0.26 0.36 TMR 0.00 0.32 0.00 ND 0.51 0.00 0.15 0.00 XYZ 1. 71 0.65 1.24 0.00 0.00 0.00 0.95 0.00
Oct-88 Nov-88 Dec-88 Jan-89 Feb-89 Mar-89 Apr-89 May-89 A300 INDUSTRY 0.29 0.53 0.49 0.41 0.64 0.71 0.28 0.35 ABC 0.39 0.59 0.57 0.00 1.10 0.20 0.21 0.75 CTA 0.00 0.58 0.18 0.19 0.19 0.35 0.18 0.00 XYZ 0.00 0.12 0.22 0.21 0.55 1. 71 0.00 0.76 DDA 0.54 0.48 0.56 0.73 0.29 0.65 0.20 0.08
8767 INDUSTRY 0.36 0.17 0.24 0.23 0.21 0.18 0.40 0.19 DDA 0.11 0.15 0.20 0.11 0.16 0.14 0.29 0.09 sss 0.29 0.00 0.00 0.24 0.27 0.00 0.00 0.00 FPC NO 0.12 0.17 0.29 0.13 ND 0.48 0.23 GGA ND ND ND ND ND ND ND NO
DC10 INDUSTRY 0.60 0.25 0.23 0.23 0.27 0.29 0.26 0.25 DDA 0.19 0.25 0.15 0.27 0.34 0.24 0.22 0.31 CTA 0.24 0.40 0.20 0.14 0.44 0.49 0.24 0.05 FPC NO 0.37 0.00 NO NO ND NO ND DEF 0.44 0.00 0.42 0.00 0.35 0.57 0.18 0.09 PPP NO NO NO ND NO ND NO 0.00 RAB 0.14 0.15 0.21 0.16 0.07 0.18 0.20 0.13 TMR 0.00 0.45 0.00 0.29 0.00 0.00 0.68 0.81 XYZ 0.00 0.00 0.51 0.00 0.00 0.00 0.00 1.24
A-1 0

CF6 MONTHLY PERFORMANCE ENGINE REMOVALS (CONTINUED)
Jun-89 Jul-89 Aug-89 Sep-89 Oct-89 Nov-89 Dec-89 Jan-90 A300 INDUSTRY 0.43 0.30 0.44 0.39 0.30 0.51 0.36 0.43 ABC 0.35 0.53 0.18 0.17 0.37 0.21 0.38 0.18 CTA 0.19 0.00 0.17 0.19 0.20 0.00 0.37 0.53 XYZ 1.43 0.00 0.43 0.19 0.33 0.54 0.17 0.37 DDA 0.24 0.22 0.43 0.44 0.08 0.55 0.22 0.30
8767 INDUSTRY 0.14 0.32 0.40 0.28 0.25 0.19 0.18 0.16 DDA 0.09 0.23 0.37 0.28 0.13 0.11 0.13 0.09 sss 0.00 ND ND ND ND ND ND ND FPC 0.13 0.27 0.35 0.13 0.35 0.24 0.18 0.17 GGA ND ND 0.00 0.27 0.00 0.00 0.00 0.00
DC10 INDUSTRY 0.28 0.40 0.23 0.23 0.25 0.22 0.17 0.24 DDA 0.36 0.22 0.21 0.20 0.25 0.17 0.16 0.27 CTA 0.31 0.14 0.14 0.29 0.16 0.06 0.14 0.09 FPC ND ND ND ND ND ND ND ND DEF 0.00 0.18 0.07 0.00 0.05 0.05 0.12 0.00 PPP 0.00 1.00 0.00 0.00 0.00 0.00 ND ND RAB 0.15 0.59 0.20 0.15 0.25 0.15 0.12 0.20 TMR 0.35 0.43 0.34 0.38 0.12 0.92 0.14 0.59 XYZ 0.00 0.00 0.00 0.00 0.00 0.88 0.00 0.00
Feb-90 Mar-90 Apr-90 May-90 Jun-90 Jul-90 Aug-90 Sep-90 A300 INDUSTRY 0.58 0.49 0.62 0.55 0.44 0.49 0.43 0.26 ABC 0.57 0.55 0.62 ND 0.37 0.37 0.90 0.38 CTA 0.48 0.36 0.25 0.37 0.35 0.53 ND ND XYZ 0.97 0.81 0.71 0.00 0.37 1.00 0.17 0.18 DDA 0.18 0.16 0.50 0.63 0.32 0.00 0.15 0.08
8767 INDUSTRY 0.31 0.32 0.37 0.32 0.36 0.41 0.34 0.23 DDA 0.27 0.29 0.34 0.31 0.29 0.35 0.34 0.21 sss ND ND ND ND ND ND ND ND FPC 0.13 0.12 0.30 0.18 0.35 0.33 0.28 0.17 GGA 0.28 0.25 0.00 0.00 0.00 0.21 0.00 0.00
DC10 INDUSTRY 0.25 0.25 0.29 0.28 0.29 0.23 0.32 0.25 DDA 0.26 0.23 0.20 0.28 0.27 0.22 0.36 0.17 CTA 0.24 0.39 0.60 0.20 0.42 0.10 ND ND FPC ND ND ND ND ND ND ND ND DEF 0.06 0.12 0.13 0.12 0.07 0.13 0.31 0.18 PPP ND ND ND ND ND ND ND ND RAB 0.17 0.19 0.25 0.24 0.31 0.20 0.25 0.26 TMR 0.38 0.14 0.29 0.54 0.00 0.24 0.20 0.60 XYZ 0.00 0.00 0.00 0.00 0.00 0.00 1.40 0.00
A-11

CF6 MONTHLY PERFORMANCE ENGINE REMOVALS (CONTINUED)
Oct-90 Nov-90 Dec-90 Jan-91 A300 INDUSTRY 0.52 0.54 0.24 0.44 ABC 0.19 1.18 0.36 0.17 CTA 0.50 0.48 0.00 0.34 XYZ 0.16 0.00 ND ND DDA 0.56 0.25 ND 0.40
8767 INDUSTRY 0.19 0.23 0.00 0.16 DDA 0.11 0.19 ND 0.10 sss ND ND ND ND FPC 0.22 0.11 ND 0.11 GGA 0.00 ND 0.00 ND
DC10 INDUSTRY 0.33 0.24 0.29 0.25 DDA 0.40 0.18 ND 0.19 CTA 0.13 0.24 0.29 0.13 FPC ND ND ND ND DEF 0.11 0.16 0.37 0.42 ppp ND ND ND ND RAB 0.31 ND 0.24 0.24 TMR 0.00 2.49 0.00 0.09 XYZ ND ND ND ND
A-12

PT6 MONTHLY PERFORMANCE IN FLIGHT SHUTDOWNS
Feb-88 Mar-88 Apr-88 May-88 Jun-88 Jul-88 Aug-88 Sep-88 BE 1900 INDUSTRY 0.00 0.00 0.08 0.16 0.08 0.00 0.00 0.00 GAP 0.00 0.00 0.00 0.00 0.00 0.00 0.00 0.00 TOM 0.00 0.00 0.16 0.32 0.16 NO NO NO TIM 0.00 0.00 0.00 0.00 0.00 0.00 0.00 0.00 YHS 0.00 NO NO 0.00 0.00 0.00 0.00 0.00 GLW 0.00 0.00 0.00 0.00 0.00 0.00 0.00 0.00 CJU NO 0.00 0.00 0.00 0.00 0.00 0.00 0.00 OTR NO NO 0.00 NO NO 0.00 NO 0.00 NPA NO NO 0.00 0.00 0.00 0.00 0.00 0.00 POB NO NO NO NO 0.00 NO 0.00 0.00 EKV NO NO NO NO NO 0.00 0.00 0.00 OSA NO NO NO NO NO NO NO NO CEL NO NO NO NO NO NO NO NO TAM NO NO NO NO NO NO NO NO TMR NO NO NO NO ND NO NO NO AIT NO NO NO ND ND NO NO NO NET NO NO NO NO NO NO NO NO SAB NO NO NO NO ND NO NO NO BAD NO NO NO ND NO NO NO NO NAT NO NO NO NO NO NO NO NO SUB NO NO NO NO NO NO NO NO
BE 99 INDUSTRY 0.14 0.16 0.10 0.00 0.00 0.22 0.21 0.16 AIT 0.67 0.00 0.00 0.00 0.00 0.00 0.00 0.64 ARA 0.00 2.45 0.00 0.00 0.00 0.00 0.00 0.00 BID 0.00 0.00 0.00 0.00 0.00 1.12 0.00 0.00 ZMT 0.00 NO 0.00 0.00 0.00 0.00 0.00 0.00 CAL 0.00 0.00 0.00 0.00 0.00 0.48 0.00 0.00 TIM 0.00 0.00 1.15 0.00 0.00 0.00 0.00 0.00 ARE 0.00 0.00 0.00 0.00 0.00 0.00 0.00 0.00 GEP 0.00 0.00 NO 0.00 0.00 0.00 0.00 0.00 SUB 0.00 NO 0.00 0.00 0.00 0.00 0.00 0.00 YHS 0.00 NO NO 0.00 0.00 0.43 0.82 0.42 BDM 0.00 0.00 0.00 0.00 ND NO NO NO EMT 0.00 0.00 0.00 0.00 0.00 0.00 NO 0.00 CBP 0.00 0.00 0.00 NO NO NO NO NO ARO NO 0.00 0.00 0.00 0.00 0.00 0.00 0.00 OSA NO 0.00 0.00 0.00 NO 0.00 0.00 0.00 OTR NO NO 0.00 NO NO 0.00 NO 0.00 SIB NO NO NO ND 0.00 0.00 0.00 0.00 TEM NO NO NO NO NO NO NO NO jjj NO NO NO ND NO NO NO NO TUM NO NO NO NO NO NO NO NO CUL NO NO NO NO NO NO NO NO NET NO NO NO NO NO NO NO NO NAT NO NO NO NO NO NO NO NO ESU NO NO NO NO ND NO NO NO BAD NO NO NO ND NO NO NO NO ISA NO NO NO NO ND NO NO NO
A-13

PT6 MONTHLY PERFORMANCE IN-FLIGHT SHUTDOWNS (CONTINUED)
DHC6 INDUSTRY 0.00 0.29 0.19 0.00 0.10 0.08 0.00 0.00 ARU 0.00 NO NO NO NO NO NO NO SLP 0.00 0.44 0.00 0.00 0.00 0.00 0.00 0.00 CPU 0.00 NO 0.00 0.00 0.00 0.00 0.00 NO BOD 0.00 0.00 0.00 0.00 0.00 0.00 0.00 0.00 CBA 0.00 NO 0.00 0.00 0.00 0.26 0.00 0.00 LMT 0.00 0.00 0.00 0.00 0.00 0.00 0.00 0.00 SOB 0.00 0.00 NO NO NO NO NO NO PMT 0.00 0.00 0.00 0.00 0.00 0.00 NO NO FES 0.00 0.00 0.00 0.00 0.00 0.00 0.00 0.00 lET 0.00 0.00 0.00 0.00 0.00 0.00 0.00 0.00 NUT 0.00 0.00 NO NO 0.00 0.00 NO NO WGR 0.00 0.00 0.47 0.00 0.00 0.00 0.00 0.00 ASI 0.00 0.00 0.00 0.00 0.00 0.00 0.00 0.00 GUP 0.00 0.00 0.00 0.00 0.00 0.00 0.00 0.00 AET 0.00 NO 3.13 0.00 0.00 0.00 0.00 0.00 KNY 0.00 0.00 0.00 0.00 0.27 0.00 0.00 0.00 GOP 0.00 0.00 0.00 0.00 0.00 0.00 0.00 0.00 OMT 0.00 0.00 0.00 NO 0.00 0.00 0.00 0.00 NIT NO NO 0.00 0.00 0.00 NO NO NO FIS NO NO NO NO 0.00 0.00 0.00 0.00 BMT NO NO NO NO NO 0.00 0.00 0.00 GIP NO NO NO NO NO NO NO NO FAS NO NO NO NO NO NO NO NO CBE NO NO NO NO NO NO NO NO
DHC7 INDUSTRY 0.19 0.15 0.12 0.06 0.06 0.16 0.18 0.22 MAB 0.00 0.44 0.00 0.00 0.00 0.23 0.25 0.53 RCW 0.00 0.00 0.00 0.00 0.00 0.00 0.18 0.00 CIL 0.23 0.00 0.12 NO NO NO NO NO GUP 0.00 0.00 0.00 0.00 0.00 0.00 0.00 NO AET 2.31 NO 0.00 0.00 0.00 0.00 0.00 0.00 GOP 0.00 0.00 0.00 0.00 0.00 0.70 0.00 0.00 PVK 0.00 0.00 0.00 0.00 0.85 0.00 0.00 0.00 URW NO 0.17 0.17 0.17 0.00 0.00 0.00 0.17 FUS NO NO NO 0.00 0.00 0.10 0.11 0.11 ARI NO NO NO NO NO NO NO NO BAD NO NO NO NO NO NO NO NO
EMB110 INDUSTRY 0.08 0.08 0.08 0.18 0.08 0.19 0.08 0.15 MAB 0.00 0.00 0.00 0.00 0.00 0.00 0.00 0.00 SEB 0.00 0.00 NO NO NO NO NO NO BED 0.00 NO 0.00 0.00 0.00 0.00 NO 0.00 TUC 0.00 0.00 0.00 0.19 0.10 0.33 0.11 0.12 CAL 0.00 0.00 0.00 0.00 0.00 0.00 0.00 0.00 GEP 0.00 0.00 NO 0.00 0.00 0.00 0.00 0.00 axe 0.00 0.22 0.23 0.22 0.00 0.00 0.00 0.00 ASO 0.00 0.00 0.00 0.00 0.00 0.00 0.00 0.00 NOT 0.61 0.00 0.00 0.00 NO 0.00 NO NO
A-14

PT6 MONTHLY PERFORMANCE IN-FLIGHT SHUTDOWNS (CONTINUED)
RMT 0.00 0.00 0.00 0.00 0.00 0.00 0.00 0.60 VER ND ND NO 0.00 0.00 0.00 0.00 0.00 CBI ND ND NO ND ND NO NO NO
SH SD330 INDUSTRY 0.08 0.09 0.18 0.00 0.23 0.17 0.30 0.16 ARO ND 0.00 0.00 0.00 0.00 0.00 0.00 0.00 URW 0.00 0.00 0.00 0.00 0.36 0.00 0.00 0.40 IMX 0.00 0.00 0.00 0.00 0.00 0.31 0.00 0.00 BOD 0.00 0.00 0.75 0.00 0.00 0.79 0.00 0.00 YTZ 0.00 0.00 ND ND 0.00 ND ND 0.00 USE 0.00 3.50 0.00 0.00 0.00 0.00 0.00 NO CJU 0.00 0.00 0.00 0.00 0.00 0.00 0.00 0.00 MAB 0.00 0.00 0.00 0.00 0.38 0.37 0.39 0.00 COL 0.00 0.00 0.00 0.00 0.55 0.00 0.00 0.69 EKV 0.00 0.00 0.00 0.00 NO ND 0.67 0.00 LOZ 0.10 0.09 0.09 0.00 0.18 0.00 ND NO TUC 0.00 0.00 1.12 0.00 0.00 0.00 0.46 0.00 ISA NO 0.00 0.00 NO 0.00 NO 0.55 NO POB NO 0.00 ND 0.00 0.63 NO 0.00 0.00 BUD ND NO NO ND NO NO NO NO
Oct-88 Nov-88 Dec-88 Jan-89 Feb-89 Mar-89 Apr-89 May-89 BE 1900 INDUSTRY 0.00 0.16 0.10 0.08 0.00 0.00 0.00 0.15 GAP 0.00 0.22 0.20 0.00 0.00 0.00 0.00 0.00 TOM ND NO NO ND ND ND NO ND TIM 0.00 0.00 0.00 0.00 0.00 0.00 0.00 0.00 YHS 0.00 0.48 0.00 0.50 0.00 0.00 0.00 NO GLW 0.00 0.00 NO 0.00 0.00 0.00 0.00 0.00 CJU NO 0.00 0.00 0.00 0.00 NO 0.00 0.00 OTR 0.00 0.00 ND ND 0.00 ND 0.00 0.25 NPA 0.00 0.00 0.00 0.00 0.00 0.00 0.00 0.00 POB 0.00 1.43 0.00 0.00 0.00 0.00 0.00 0.00 EKV 0.00 0.00 0.00 0.00 0.00 0.00 0.00 ND OSA 0.00 0.00 0.00 0.00 0.00 0.00 0.00 0.00 CEL 0.00 0.00 0.00 0.00 0.00 0.00 0.00 0.00 TAM ND ND ND ND ND NO NO NO TMR NO NO ND 0.00 ND 0.00 ND ND AIT ND NO NO NO NO NO NO 83.33 NET ND NO ND ND ND ND NO NO SAB NO NO ND ND ND ND ND ND BAD ND NO NO ND NO NO NO NO NAT ND ND ND ND ND ND NO ND SUB ND NO ND ND ND ND NO ND
BE 99 INDUSTRY 0.10 0.27 0.14 0.00 0.24 0.00 0.14 0.00 AIT 0.00 0.00 0.00 0.00 NO 0.00 0.00 0.00 ARA 0.00 NO ND ND ND ND NO ND BID 0.00 1 .11 0.00 0.00 0.00 NO NO 0.00
A-15
PT6 MONTHLY PERFORMANCE IN-FLIGHT SHUTDOWNS (CONTINUED)
ZMT 0.00 0.00 0.00 0.00 0.00 0.00 0.00 0.00 CAL 0.56 0.00 0.00 0.00 0.00 0.00 0.00 NO TIM 0.00 0.00 0.00 0.00 0.00 0.00 0.00 0.00 ARE 0.00 0.26 0.25 0.00 0.00 NO 0.00 NO GEP 0.00 0.00 0.00 0.00 0.00 0.00 0.00 0.00 SUB 0.00 1.79 0.00 0.00 0.00 0.00 0.00 0.00 YHS 0.00 0.00 0.00 0.00 0.00 0.00 0.53 NO BDM NO NO NO NO ND NO NO NO EMT 0.00 0.00 0.00 0.00 0.00 NO NO NO CBP NO NO NO NO NO NO NO NO ARO 0.00 NO 0.00 0.00 0.00 0.00 NO ND OSA 0.00 0.00 0.00 0.00 0.00 0.00 0.00 0.00 OTR 0.00 0.00 NO NO 1.36 NO 0.00 0.00 SIB 0.00 NO 0.00 0.00 0.00 0.00 0.00 0.00 TEM NO NO NO 0.00 NO 0.00 0.00 0.00 JJJ NO NO NO NO NO 0.00 0.00 NO TUM NO NO NO NO NO NO NO 0.00 CUL NO NO NO NO NO NO NO NO NET NO NO NO NO NO NO NO NO NAT NO NO ND NO NO NO NO NO ESU NO NO NO NO ND NO NO NO BAD NO ND NO NO NO NO NO NO ISA NO NO NO NO NO NO NO ND
DHC6 INDUSTRY 0.00 0.00 0.14 0.12 0.12 0.00 0.00 0.10 ARU NO NO NO NO NO NO NO NO SLP 0.00 0.00 0.00 0.00 0.00 0.00 0.00 0.00 CPU 0.00 0.00 0.00 0.00 0.00 0.00 0.00 0.00 BOD 0.00 0.00 NO 0.00 0.00 0.00 0.00 0.00 CBA 0.00 0.00 0.00 0.00 0.00 0.00 0.00 0.00 LMT 0.00 0.00 0.00 0.00 NO 0.00 0.00 0.00 SOB NO NO NO NO NO NO NO NO PMT NO NO ND NO NO NO ND ND FES 0.00 0.00 0.00 0.00 0.00 0.00 0.00 0.00 lET 0.00 0.00 0.00 0.00 0.00 0.00 0.00 0.00 NUT NO NO NO NO NO NO NO ND WGR 0.00 0.00 0.00 0.00 0.00 0.00 0.00 0.00 ASI 0.00 0.00 0.00 0.00 0.00 0.00 0.00 0.00 GUP NO NO NO NO NO NO NO NO AET 0.00 0.00 0.00 0.00 0.00 0.00 0.00 NO KNY 0.00 0.00 0.00 0.00 0.31 0.00 0.00 0.00 GOP NO NO 0.87 0.00 0.00 0.00 0.00 NO OMT 0.00 0.00 ND NO NO NO NO NO NIT NO NO NO 3.97 0.00 0.00 0.00 0.00 FIS 0.00 0.00 0.00 0.00 0.00 NO 0.00 NO BMT 0.00 0.00 0.00 0.00 0.00 0.00 0.00 1.83 GIP 0.00 NO 0.00 0.00 0.00 0.00 0.00 0.00 FAS NO NO NO 0.00 0.00 0.00 0.00 0.00 CBE NO NO NO NO NO NO NO NO
A-16

PT6 MONTHLY PERFORMANCE IN-FLIGHT SHUTDOWNS (CONTINUED)
DHC7 INDUSTRY 0.16 0.26 0.00 0.21 0.12 0.17 0.25 0.00 MAB 0.24 0.24 0.00 0.00 0.00 0.00 0.22 0.00 RCW 0.00 0.21 0.00 0.19 0.24 0.00 0.69 0.00 CIL ND ND ND ND ND ND ND ND GUP 0.00 0.00 ND 0.21 0.00 0.59 0.00 0.00 AET 0.00 0.00 0.00 0.00 0.00 0.00 0.00 ND GOP ND ND 0.00 0.00 0.00 0.00 0.00 ND PVK 1.52 0.00 0.00 0.00 0.00 0.00 0.00 0.00 URW 0.00 0.23 0.00 0.00 0.00 ND 0.00 0.00 FUS 0.10 0.21 0.00 0.21 0.00 0.00 0.00 ND ARI ND ND ND ND ND 0.00 0.54 0.00 BAD ND ND ND ND ND ND ND ND
EMB110 INDUSTRY 0.15 0.27 0.08 0.15 0.10 0.00 0.00 0.14 MAB 0.00 0.00 0.00 0.17 0.00 0.00 0.00 0.00 SEB ND ND ND ND ND ND ND ND BED 0.00 0.00 0.00 0.91 0.50 0.00 0.00 0.00 TUC 0.12 0.36 0.12 0.00 0.00 0.00 0.00 0.19 CAL 0.00 0.00 0.00 0.00 ND ND ND ND GEP 0.00 0.00 ND 0.00 0.00 0.00 0.00 0.00 axe 0.22 0.23 0.00 0.00 0.00 0.00 0.00 0.00 ASO 0.00 0.00 0.00 0.00 ND ND ND ND NOT ND ND ND ND ND ND ND ND RMT 0.00 0.00 0.00 0.00 0.00 0.00 0.00 0.00 VER 0.00 0.00 0.00 0.00 ND ND ND ND CBI ND ND ND ND ND ND ND ND
SH SD330 INDUSTRY 0.06 0.00 0.18 0.00 0.08 0.00 0.00 0.24 ARO 0.00 ND 0.00 0.00 0.00 0.00 ND ND URW 0.00 0.00 0.00 0.00 0.00 ND 0.00 0.00 IMX 0.00 0.00 0.00 0.00 0.00 0.00 0.00 0.38 BOD 0.72 0.00 ND 0.00 0.00 0.00 0.00 0.00 YTZ ND ND ND 0.00 0.00 0.00 0.00 ND USE 0.00 0.00 2.54 0.00 0.00 ND ND ND CJU ND 0.00 0.00 0.00 0.00 ND 0.00 0.00 MAB 0.00 0.00 0.00 0.00 0.00 0.00 ND ND COL 0.00 0.00 0.00 0.00 0.00 0.00 0.00 0.00 EKV 0.00 0.00 0.00 0.00 0.00 0.00 0.00 ND LOZ 0.00 0.00 0.11 0.00 0.00 0.00 0.00 0.19 TUC 0.00 0.00 0.00 0.00 0.00 0.00 0.00 0.00 ISA 0.00 ND 0.26 0.00 0.28 0.00 ND ND PCB 0.00 0.00 0.00 0.00 ND ND ND ND BUD ND ND ND ND ND ND ND ND
A-17
PT6 MONTHLY PERFORMANCE IN-FLIGHT SHUTDOWNS (CONTINUED)
Jun-89 Jul-89 Aug-89 Sep-89 Oct-89 Nov-89 Dec-89 Jan-90 BE 1900 INDUSTRY 0.23 0.20 0.00 0.10 0.08 0.12 0.14 0.06 GAP 0.00 0.00 0.00 0.00 0.00 0.00 0.00 0.23 TOM ND ND ND ND ND ND ND ND TIM 0.00 0.00 0.00 0.00 0.00 0.00 0.00 ND YHS 0.00 ND 0.00 0.00 0.00 ND 0.00 0.00 GLW 0.00 0.00 0.00 0.00 0.00 0.00 0.00 0.00 CJU 0.26 0.00 0.00 0.00 0.00 0.00 ND 0.00 OTR 0.25 0.00 0.00 0.54 0.00 0.28 0.28 0.00 NPA 0.54 0.29 0.00 0.00 0.00 0.00 0.34 0.00 PQB 0.49 1.42 0.00 0.00 0.86 0.00 0.00 0.00 EKV 0.00 0.00 0.00 0.00 0.00 0.18 0.18 0.00 OSA 0.00 0.00 0.00 ND 0.00 0.00 ND 0.00 CEL 0.00 0.00 0.00 0.00 0.00 0.00 ND ND TAM ND ND ND ND ND ND ND 0.00 TMR ND 0.00 ND ND ND ND ND 0.00 AIT 0.00 0.00 0.00 0.00 0.00 ND 0.00 0.00 NET ND ND 0.00 0.00 0.00 0.00 0.00 0.00 SAB ND ND 0.00 0.00 0.00 0.00 0.00 0.00 BAD ND ND ND ND ND ND ND ND NAT ND ND ND ND ND ND ND 0.00 SUB ND ND ND ND ND ND ND ND
BE 99 INDUSTRY 0.14 0.00 0.22 0.16 0.00 0.00 0.00 0.16 AIT 0.00 0.00 0.00 ND ND ND ND ND ARA ND ND ND ND ND ND ND ND BID 0.00 0.00 0.00 ND ND ND ND ND ZMT ND ND ND ND ND ND ND ND CAL ND ND ND ND ND ND ND ND TIM 0.00 0.00 0.00 0.00 0.00 0.00 0.00 0.00 ARE ND ND ND ND ND ND ND ND GEP 0.00 0.00 0.00 0.00 0.00 0.00 0.00 ND SUB 0.00 0.00 0.00 0.00 0.00 ND 0.00 1.24 YHS 0.00 ND 0.00 1.41 0.00 ND ND ND BDM ND ND ND ND ND ND ND ND EMT ND ND ND ND ND ND ND ND CBP ND ND ND ND ND ND ND ND ARO 0.00 0.00 ND 0.00 0.00 ND ND 0.00 OSA 0.00 0.00 0.00 ND 0.00 0.00 ND 0.00 OTR 0.21 0.00 0.00 0.00 0.00 0.00 0.00 0.00 SIB 0.00 0.00 2.06 0.00 0.00 0.00 0.00 0.00 TEM 0.00 0.00 0.00 ND 0.00 0.00 0.00 ND JJJ ND ND ND ND ND ND ND ND TUM 0.00 0.00 0.00 0.00 0.00 0.00 0.00 0.00 CUL ND ND 0.00 0.00 0.00 0.00 0.00 0.00 NET ND ND 0.00 0.00 0.00 0.00 0.00 0.00 NAT ND ND ND 0.00 0.00 0.00 0.00 0.00 ESU ND ND ND ND ND ND ND 0.00 BAD ND ND ND ND ND ND ND ND ISA ND ND ND ND ND ND ND ND
A-18

PT6 MONTHLY PERFORMANCE IN-FLIGHT SHUTDOWNS (CONTINUED)
DHC6 INDUSTRY 0.17 0.14 0.10 0.10 0.00 0.00 0.12 0.00 ARU NO NO NO NO NO NO NO NO SLP 0.00 0.00 0.00 0.40 0.00 0.00 0.00 0.00 CPU 0.00 0.00 0.00 0.00 0.00 0.00 0.00 0.00 BOD 0.00 0.00 0.00 0.00 0.00 0.00 0.00 0.00 CBA 0.00 0.00 0.00 0.00 0.00 0.00 0.00 0.00 LMT 0.00 0.00 0.00 0.00 0.00 0.00 0.00 0.00 SOB NO NO NO NO NO NO NO NO PMT NO NO NO NO NO NO NO NO FES 0.00 0.00 0.00 0.00 0.00 0.00 0.00 0.00 lET 0.00 NO 0.00 0.00 0.00 0.00 0.00 0.00 NUT NO NO NO NO NO NO NO NO WGR 0.00 0.32 0.00 0.00 0.00 0.00 0.00 0.00 ASI 0.00 0.00 0.00 0.00 0.00 0.00 0.00 0.00 GUP NO NO NO NO NO NO NO NO AET NO NO 0.00 0.00 0.00 0.00 0.00 0.00 KNY 0.40 NO 0.00 0.00 0.00 0.00 0.00 0.00 GOP 0.00 0.00 NO 0.00 0.00 0.00 1.14 0.00 QMT NO NO NO NO NO NO NO NO NIT 0.00 0.00 0.00 NO 0.00 NO 0.00 NO FIS 0.00 0.00 0.00 0.00 0.00 NO 0.00 0.00 BMT 0.00 0.00 1.34 0.00 0.00 0.00 0.00 0.00 GIP 0.00 0.00 0.00 0.00 0.00 0.00 NO NO FAS 0.00 0.00 0.00 NO 0.00 NO 0.00 0.00 CBE NO NO NO NO NO NO NO 0.00
DHC7 INDUSTRY 0.00 0.00 0.25 0.00 0.32 0.00 0.12 0.12 MAB NO NO NO NO NO NO 0.00 0.00 RCW 0.00 0.00 0.45 0.00 0.48 0.00 0.00 0.00 CIL NO NO NO NO NO NO NO NO GUP 0.00 0.00 0.00 0.00 0.00 0.00 0.00 0.28 AET NO NO 0.00 0.00 0.00 0.00 0.00 0.00 GOP NO NO NO NO NO NO NO NO PVK 0.00 0.00 0.00 0.00 0.00 0.00 0.00 0.00 URW 0.00 0.00 0.23 0.00 0.00 0.00 0.00 0.27 FUS 0.00 0.00 0.18 0.00 0.40 0.00 0.00 0.00 ARI 0.00 0.00 0.00 0.00 0.00 0.00 0.70 0.00 BAD NO NO NO NO NO NO NO NO
EMB110 INDUSTRY 0.00 0.00 0.14 0.00 0.16 0.00 0.00 0.21 MAB NO NO NO NO NO NO 0.00 0.00 SEB NO NO NO NO NO NO NO NO BED 0.00 0.00 0.00 0.00 0.00 0.00 0.00 NO TUC 0.00 0.00 0.10 0.00 0.13 0.00 0.00 0.14 CAL NO NO NO NO NO NO NO NO GEP 0.00 0.00 0.00 0.00 0.00 0.00 0.00 NO axe 0.00 0.00 0.00 NO 0.00 0.00 0.00 0.00 ASO NO NO NO NO NO NO NO NO NOT NO NO NO NO NO NO NO NO
A-19

PT6 MONTHLY PERFORMANCE IN-FLIGHT SHUTDOWNS (CONTINUED)
RMT 0.00 0.00 ND NO NO NO ND NO VER NO ND NO ND ND NO NO NO CBI ND ND ND NO ND ND ND NO
SH SD330 INDUSTRY 0.06 0.18 0.21 0.08 0.06 0.08 0.18 0.00 ARO 0.00 0.00 ND ND ND ND NO ND URW ND NO NO ND NO NO NO NO IMX 0.00 0.00 0.00 0.00 0.00 0.00 0.53 0.00 BOD 0.00 0.00 0.00 0.00 0.00 0.00 0.00 0.00 YTZ 0.00 0.00 0.00 ND 0.00 NO 0.00 0.00 USE 0.00 ND ND 0.00 0.00 0.00 NO ND CJU 0.76 0.77 0.00 0.00 0.00 0.00 NO 0.00 MAB ND ND ND ND ND ND ND ND COL 0.00 0.00 0.00 0.00 0.00 0.00 0.00 0.00 EKV 0.00 0.00 0.29 0.00 0.00 0.00 0.00 0.00 LOZ 0.00 0.09 0.26 0.09 0.00 0.10 0.10 0.00 TUC 0.00 0.00 0.00 0.00 0.64 0.00 0.00 0.00 ISA 0.00 ND NO ND NO ND ND NO POB NO ND ND ND ND ND ND NO BUD NO NO ND ND ND ND NO NO
Feb-90 Mar-90 Apr-90 May-90 Jun-90 Jul-90 Aug-90 Sep-90 BE 1900 INDUSTRY 0.10 0.09 0.12 0.00 0.04 0.07 0.00 0.18 GAP 0.25 0.00 0.00 0.00 0.00 0.00 0.00 0.00 TOM ND ND NO NO ND ND NO NO TIM 0.00 NO 0.30 0.00 0.00 0.00 0.00 0.00 YHS 0.00 0.00 0.00 0.00 0.12 0.00 0.00 NO GLW 0.00 0.00 NO NO NO NO NO NO CJU 0.36 0.31 0.59 NO 0.00 0.00 0.00 0.22 OTR 0.00 0.00 ND 0.00 0.00 NO 0.00 1.34 NPA 0.00 0.00 0.00 0.00 ND 0.00 0.00 ND POB 0.00 ND 0.00 0.00 0.00 0.31 0.00 0.00 EKV 0.00 0.16 0.00 0.00 0.00 0.22 0.00 0.24 OSA 0.00 0.00 NO 0.00 0.00 0.00 0.00 0.00 CEL ND ND ND ND ND ND ND ND TAM ND ND ND ND ND ND ND ND TMR ND ND ND ND 0.00 0.00 0.00 0.00 AIT 0.00 0.00 0.00 0.00 0.00 0.00 0.00 0.00 NET NO 0.00 0.00 0.00 0.00 0.00 0.00 NO SAB 0.00 0.00 0.00 0.00 0.00 0.00 0.00 0.00 BAD ND ND 0.00 0.00 0.00 0.00 0.00 0.00 NAT 0.00 0.00 0.00 0.00 0.00 0.00 0.00 0.00 SUB ND ND ND ND NO ND NO 0.00
BE 99 INDUSTRY 0.20 0.00 0.00 0.18 0.20 0.00 0.16 0.20 AIT ND ND ND ND ND NO NO ND ARA NO NO ND NO ND NO ND NO BID NO NO NO ND NO ND NO NO
A-20

PT6 MONTHLY PERFORMANCE IN-FLIGHT SHUTDOWNS (CONTINUED)
ZMT NO NO NO NO NO NO NO ND CAL NO NO NO NO NO NO NO NO TIM 0.00 NO 0.00 0.00 0.00 0.00 0.00 0.00 ARE NO NO NO NO NO NO NO NO GEP 0.00 0.00 0.00 NO 0.00 0.00 0.00 0.00 SUB 0.00 0.00 0.00 0.00 0.00 0.00 0.00 0.00 YHS NO NO NO NO NO NO NO NO BDM NO NO NO NO NO NO NO NO EMT NO NO NO NO NO NO NO NO CBP NO NO NO NO NO NO NO NO ARO 0.00 0.00 0.00 0.00 NO 0.00 0.00 0.00 OSA 0.00 0.00 NO 0.00 0.00 0.00 0.00 0.00 OTR 0.00 0.00 NO 0.19 0.00 NO 0.00 0.00 SIB 0.00 0.00 NO NO NO NO NO NO TEM NO 0.00 0.00 NO NO NO NO 0.00 JJJ NO NO NO NO NO NO NO NO TUM 0.00 0.00 0.00 0.00 2.11 0.00 0.00 2.14 CUL 0.00 0.00 0.00 0.00 0.00 NO 0.00 0.00 NET NO 0.00 0.00 0.00 0.00 0.00 0.00 NO NAT 0.00 0.00 0.00 0.00 0.00 0.00 0.00 0.00 ESU 3.68 NO 0.00 0.00 0.00 0.00 NO NO BAD NO NO NO NO NO NO 0.44 0.00 ISA NO NO NO NO NO NO 0.00 NO
DHC6 INDUSTRY 0.14 0.10 0.00 0.00 0.00 0.17 0.00 0.14 ARU NO NO NO NO NO NO NO NO SLP 0.00 0.00 0.00 0.00 0.00 NO 0.00 0.00 CPU 0.00 0.00 0.00 0.00 0.00 0.00 0.00 0.00 BOD 0.00 1.00 0.00 0.00 0.00 0.00 0.00 0.00 CBA 0.00 0.00 NO 0.00 0.00 0.25 0.00 NO LMT 5.00 0.00 0.00 0.00 0.00 0.00 0.00 0.00 SOB NO NO NO NO NO NO NO NO PMT NO NO NO NO NO NO NO NO FES 0.00 0.00 0.00 0.00 NO NO NO NO lET NO 0.00 0.00 0.00 NO 0.00 0.00 0.00 NUT NO NO NO NO NO NO NO NO WGR 0.00 0.00 0.00 0.00 0.00 0.00 0.00 0.26 ASI 0.00 0.00 0.00 0.00 0.00 0.00 0.00 0.00 GUP NO NO NO NO NO NO NO NO AET 0.00 0.00 0.00 0.00 0.00 3.68 0.00 NO KNY 0.00 0.00 0.00 NO 0.00 0.00 0.00 0.00 GOP 0.00 0.00 0.00 0.00 0.00 0.00 0.00 0.00 QMT NO NO NO NO NO NO NO NO NIT NO 0.00 0.00 0.00 0.00 0.00 0.00 0.00 FIS 0.00 NO NO 0.00 NO NO NO NO BMT 0.00 0.00 0.00 0.00 0.00 NO 0.00 0.00 GIP 0.00 0.00 0.00 NO 0.00 0.00 NO NO FAS 0.00 NO NO 0.00 0.00 0.00 0.00 NO CBE 0.00 0.00 NO 0.00 0.00 0.00 0.00 0.00
A-21

PT6 MONTHLY PERFORMANCE IN-FLIGHT SHUTDOWNS (CONTINUED)
DHC7 INDUSTRY 0.08 0.00 0.08 0.00 0.08 0.08 0.00 0.15 MAB 0.00 0.00 0.00 0.00 0.00 0.59 0.00 0.00 RCW 0.00 0.00 0.00 0.00 0.00 0.00 0.00 0.73 CIL NO NO NO NO NO NO NO NO GUP 0.30 0.00 NO NO NO NO NO NO AET 0.00 0.00 0.00 0.00 0.00 0.00 0.00 NO GOP NO NO NO NO NO NO NO NO PVK 0.00 0.00 0.00 0.00 0.00 NO 0.00 0.00 URW 0.00 0.00 0.00 0.00 0.00 NO 0.00 NO FUS 0.00 0.00 0.13 0.00 0.00 0.00 0.00 0.00 ARt 0.00 0.00 0.00 0.00 0.34 0.00 0.00 0.00 BAD NO NO 0.00 0.00 0.00 0.00 0.00 0.00
EMB110 INDUSTRY 0.14 0.00 0.20 0.37 0.30 0.12 0.22 0.24 MAB 0.00 0.00 0.18 0.36 0.00 0.18 0.17 0.37 SEB NO NO NO NO NO NO NO NO BED NO NO NO NO NO 0.00 NO NO TUC 0.16 0.00 0.00 0.00 0.15 0.00 0.17 0.00 CAL NO NO NO NO NO NO NO NO GEP 0.00 0.00 0.00 NO 0.00 0.00 0.00 0.00 axe 0.00 0.00 0.26 0.00 0.58 0.00 0.00 0.00 ASO NO NO NO NO NO NO NO NO NOT NO NO NO NO NO NO NO NO RMT NO NO NO NO NO NO NO NO VER NO NO NO NO NO NO NO NO CBI NO NO NO NO 0.00 0.00 0.00 0.00
SH 50330 INDUSTRY 0.15 0.00 0.17 0.00 0.13 0.00 0.00 0.22 ARO NO NO NO NO NO NO NO NO URW NO NO NO NO NO NO NO NO IMX 0.21 0.00 0.00 0.00 0.37 0.00 0.00 0.00 BOD 0.00 0.00 0.00 0.00 0.00 0.00 0.00 0.97 YTZ NO 0.00 NO NO NO NO 0.00 NO USE NO NO NO NO NO 0.00 0.00 NO CJU 0.00 0.00 0.00 0.00 0.00 0.00 0.00 0.00 MAB NO NO NO NO NO NO NO NO COL 0.00 0.00 0.00 0.00 0.00 0.00 0.00 0.00 EKV 0.00 0.00 0.00 0.00 0.00 0.00 0.00 0.00 LOZ 0.11 0.00 0.28 0.00 0.00 0.00 0.00 0.27 TUC 0.00 0.00 0.00 NO 0.00 0.00 0.00 0.00 ISA NO NO NO NO NO NO 0.00 0.00 POB NO NO NO NO NO NO NO NO BUD NO NO NO NO NO NO NO NO
A-22

PT6 MONTHLY PERFORMANCE IN-FLIGHT SHUTDOWNS (CONTINUED)
Oct-90 Nov-90 Dec-90 Jan-91 BE 1900 INDUSTRY 0.09 0.15 0.13 0.04 GAP 0.00 0.00 0.00 0.00 TOM ND ND ND ND TIM 0.00 0.00 0.00 0.00 YHS 0.00 0.00 0.00 0.00 GLW ND ND ND ND CJU 0.00 0.00 0.60 0.00 OTR ND 0.74 0.00 0.00 NPA 0.00 0.00 0.00 0.00 POB 0.00 0.31 0.24 0.00 EKV 0.43 0.00 0.00 0.00 OSA 2.02 0.00 ND ND CEL ND ND ND ND TAM ND ND ND ND TMR 0.00 ND ND 0.00 AIT 0.00 0.00 0.00 0.00 NET 0.00 0.00 0.00 0.00 SAB 0.00 0.00 0.00 0.00 BAD 0.00 0.00 0.00 0.00 NAT 0.00 0.82 0.00 0.82 SUB 0.00 4.20 0.00 0.00
BE 99 INDUSTRY 0.00 0.00 0.00 0.00 AIT ND ND ND ND ARA ND ND ND ND BID ND ND ND ND ZMT ND ND ND ND CAL ND ND ND ND TIM 0.00 0.00 0.00 0.00 ARE ND ND ND ND GEP ND 0.00 0.00 0.00 SUB 0.00 0.00 0.00 0.00 YHS ND ND ND ND BDM ND ND ND ND EMT ND ND ND ND CBP ND ND ND ND ARO 0.00 0.00 0.00 ND OSA ND 0.00 ND ND OTR ND 0.00 0.00 0.00 SIB ND ND ND ND TEM ND 0.00 0.00 0.00 JJJ ND ND ND ND TUM 0.00 0.00 0.00 0.00 CUL 0.00 ND ND ND NET 0.00 0.00 0.00 0.00 NAT 0.00 0.00 0.00 0.00 ESU 0.00 0.00 0.00 0.00 BAD 0.00 0.00 0.00 0.00 ISA ND 0.00 ND ND
A-23

PT6 MONTHLY PERFORMANCE IN-FLIGHT SHUTDOWNS (CONTINUED)
DHC6 INDUSTRY 0.10 0.22 0.16 0.16 ARU ND ND ND ND SLP 0.00 0.00 0.00 0.00 CPU 0.00 0.00 0.00 0.00 BOD ND 0.00 0.00 0.00 CBA 0.00 0.00 ND 0.00 LMT 0.00 0.00 0.00 0.00 SOB ND ND ND ND PMT ND ND ND ND FES ND ND ND ND lET 0.00 0.00 0.00 0.00 NUT ND ND ND ND WGR 0.00 0.27 0.26 0.32 ASI 0.00 0.00 0.00 0.00 GUP ND ND ND ND AET 0.00 0.00 0.00 0.00 KNY 0.19 0.26 0.00 0.00 GOP 0.00 ND ND ND OMT ND ND ND ND NIT 0.00 0.00 0.00 0.00 FIS 0.00 ND 0.00 ND BMT 0.00 0.00 0.00 0.00 GIP ND ND ND ND FAS 0.00 ND ND ND CBE 0.00 0.00 0.00 0.00
DHC7 INDUSTRY 0.20 0.08 0.10 0.00 MAB 0.54 0.00 0.00 0.00 RCW 0.34 0.00 0.33 0.00 CIL ND ND ND ND GUP ND ND ND ND AET 0.00 0.00 0.00 0.00 GOP ND ND ND ND PVK 0.00 0.00 0.00 0.00 URW ND 0.00 0.00 0.00 FUS 0.10 0.13 0.00 0.00 ARI 0.00 0.00 0.00 0.00 BAD 0.00 0.00 0.00 0.00
EMB110 INDUSTRY 0.14 0.18 0.20 0.00 MAB 0.00 0.18 0.20 0.00 SEB ND ND ND ND BED ND ND ND ND TUC 0.24 0.00 0.00 0.00 CAL ND ND ND ND GEP ND 0.00 0.00 0.00 axe 0.00 0.00 0.00 0.00 ASO ND ND ND ND
NOT ND ND ND ND
A-24

PT6 MONTHLY PERFORMANCE IN-FLIGHT SHUTDOWNS (CONTINUED)
RMT ND ND ND ND VER ND ND ND ND CBI 0.00 0.00 0.00 0.00
SH SD330 INDUSTRY 0.00 0.16 0.14 0.18 ARO ND ND ND ND URW ND ND ND ND IMX 0.00 0.00 0.18 0.13 BOD ND 0.00 0.00 0.00 YTZ ND ND ND ND USE 0.00 0.00 3.09 0.00 CJU 0.00 0.00 0.00 0.00 MAB ND ND ND ND COL 0.00 ND ND ND EKV 0.00 0.00 0.00 0.30 LOZ 0.00 0.18 0.00 0.09 TUC 0.00 0.00 0.00 0.00 ISA ND 0.25 ND ND POB ND ND ND ND BUD ND ND ND 0.00
A-25

PT6 MONTHLY PERFORMANCE ENGINE REMOVALS
Feb-88 Mar-88 Apr-88 May-88 Jun-88 Jul-88 Aug-88 Sep-88 BE 1900 INDUSTRY 0.00 0.10 0.00 0.00 0.08 0.13 0.00 0.14 GAP 0.00 0.00 0.00 0.00 0.00 0.23 0.00 0.00 TOM 0.00 0.16 0.00 0.00 0.16 NO NO NO TIM 0.00 0.00 0.00 0.00 0.00 0.00 0.00 0.00 YHS 0.00 NO NO 0.00 0.00 0.00 0.00 0.00 GLW 0.00 0.00 0.00 0.00 0.00 0.00 0.00 NO CJU NO 0.00 0.00 0.00 0.00 0.25 0.00 0.00 OTR NO NO 0.00 NO NO 0.00 NO 0.43 NPA NO NO 0.00 0.00 0.00 0.00 0.00 0.00 POB NO NO NO NO 0.00 NO 0.00 0.00 EKV NO NO NO NO NO 0.00 0.00 0.00 OSA NO NO NO NO NO NO NO NO CEL NO NO NO NO NO NO NO NO TAM NO NO NO NO NO NO NO NO TMR NO NO NO NO NO NO NO NO AIT NO NO NO NO NO NO NO NO NET NO NO NO NO NO NO NO NO SAB NO NO NO NO NO NO NO NO BAD NO NO NO NO NO NO NO NO NAT NO NO NO NO NO NO NO NO SUB NO NO NO NO NO NO ND ND
BE 99 INDUSTRY 0.14 0.38 0.30 0.00 0.14 0.16 0.21 0.28 AIT 0.00 0.00 0.65 0.00 0.00 0.00 0.00 0.64 ARA 0.00 0.00 0.00 0.00 0.00 0.00 0.00 0.00 BID 0.00 0.00 1.28 0.00 0.00 1.12 0.00 0.99 ZMT 0.00 ND 0.00 0.00 0.00 0.00 0.00 0.00 CAL 0.00 0.00 0.00 0.00 0.00 0.00 0.00 0.00 TIM 0.00 0.00 1.15 0.00 0.00 0.00 0.00 0.00 ARE 0.00 0.00 0.00 0.00 0.00 0.00 0.00 0.00 GEP 0.00 0.00 ND 0.00 0.00 0.00 0.00 0.00 SUB 0.00 ND 0.00 0.00 0.00 0.00 0.00 0.00 YHS 0.00 ND ND 0.00 0.00 0.43 0.82 0.42 BDM 0.00 0.00 0.00 0.00 ND ND ND ND EMT 1.27 0.00 0.00 0.00 0.00 0.00 ND 0.00 CBP 0.00 1.78 0.83 ND ND NO ND ND ARO NO 1.07 0.00 0.00 0.00 0.00 0.00 0.00 OSA ND 0.00 0.00 0.00 ND 0.00 0.00 0.00 OTR ND ND 0.00 ND ND 0.00 ND 0.00 SIB NO ND ND ND 0.90 0.00 0.00 1.07 TEM ND ND ND ND NO ND ND NO JJJ ND ND NO ND NO ND ND NO TUM ND ND NO ND NO ND ND NO CUL ND ND NO NO ND ND ND NO
NET ND ND NO NO ND ND ND ND NAT ND NO ND ND ND NO NO ND ESU ND ND ND ND ND ND ND NO BAD NO ND ND ND ND ND ND NO ISA ND NO NO ND ND NO ND ND
A-26

PT6 MONTHLY PERFORMANCE ENGINE REMOVALS (CONTINUED)
DHC6 INDUSTRY 0.12 0.21 0.25 0.24 0.16 0.14 0.10 0.19 ARU 0.00 ND ND ND ND ND NO ND SLP 0.60 0.44 0.00 0.49 0.00 0.00 0.00 0.00 CPU 0.00 ND 0.00 0.00 0.00 0.00 0.00 NO BOD 0.00 0.00 0.00 0.00 0.00 0.00 0.00 0.00 CBA 0.00 NO 0.00 0.00 0.00 0.26 0.00 0.00 LMT 0.00 0.00 0.00 0.00 0.00 0.00 2.35 0.00 SOB 0.00 0.00 NO NO ND ND ND ND PMT 0.00 0.00 0.00 0.00 0.00 0.00 ND ND FES 0.00 0.00 0.00 0.00 0.00 0.00 0.00 0.00 lET 0.00 0.00 0.00 0.00 0.00 0.00 0.00 0.00 NUT 0.00 0.00 NO ND 0.00 0.00 ND ND WGR 0.00 0.00 1.41 0.42 0.00 0.00 0.00 0.00 ASI 0.00 0.00 0.00 0.00 0.00 0.00 0.00 0.00 GUP 0.00 0.00 0.00 0.00 0.00 0.00 0.00 ND AET 0.00 ND 0.00 0.00 0.00 0.00 0.00 0.00 KNY 0.00 0.00 0.00 0.00 0.00 0.00 0.00 0.00 GOP 0.00 0.63 0.00 0.65 1.30 0.60 0.00 1.26 OMT 0.00 0.00 0.00 ND 0.00 0.00 0.00 0.00 NIT ND NO 0.00 0.00 0.00 ND ND ND FIS ND NO ND ND 0.00 0.00 0.00 0.00 BMT NO ND NO ND ND 0.00 0.00 0.00 GIP NO NO ND ND ND ND ND ND FAS NO ND ND ND NO ND NO ND CBE ND NO NO ND ND ND ND NO
DHC7 INDUSTRY 0.47 0.46 0.28 0.54 0.40 0.68 0.26 0.52 MAB 0.55 0.87 0.44 1.35 0.24 0.68 0.51 1.06 RCW 0.97 0.75 0.39 0.59 0.80 0.77 0.55 0.58 CIL 0.23 0.00 0.12 ND NO NO NO NO GUP 0.00 0.00 0.00 0.00 0.00 0.00 0.00 ND AET 0.00 NO 0.00 1.27 1.13 0.00 0.00 2.06 GOP 0.00 0.00 0.00 0.81 0.68 2.11 0.00 0.00 PVK 0.00 0.00 0.00 0.00 0.00 0.85 0.00 0.00 URW NO 0.51 0.17 0.17 0.18 0.63 0.17 0.17 FUS ND NO NO 0.12 0.12 0.31 0.00 0.22 ARI NO ND ND ND ND ND ND NO BAD ND NO NO ND ND ND NO NO
EMB110 INDUSTRY 0.19 0.08 0.43 0.37 0.32 0.08 0.31 0.21 MAB 0.31 0.00 0.99 0.46 0.49 0.17 0.50 0.53 SEB 0.00 0.00 NO ND NO ND NO NO BED 0.00 NO 0.00 0.00 0.00 0.00 ND 0.00 TUC 0.00 0.00 0.00 0.00 0.00 0.00 0.11 0.00 CAL 0.00 0.00 0.00 0.00 0.00 0.00 0.00 0.00 GEP 0.00 0.00 NO 0.00 0.00 0.00 0.00 0.00 axe 0.00 0.00 0.46 0.67 0.22 0.00 0.22 0.00 ASO 0.00 0.00 0.00 0.00 0.00 0.00 0.00 0.00 NOT 0.61 0.51 0.00 0.00 ND 0.00 ND NO
A-27

PT6 MONTHLY PERFORMANCE ENGINE REMOVALS (CONTINUED)
RMT 0.00 0.00 0.00 0.00 0.00 0.00 0.00 0.00 VER NO NO NO 1.98 1.82 0.00 0.00 0.00 CBI NO NO NO NO NO NO NO NO
SH 50330 INDUSTRY 0.12 0.28 0.37 0.43 0.23 0.44 0.46 0.16 ARO NO 0.00 1.65 0.00 0.00 1.50 4.70 0.00 URW NO 0.63 0.37 0.00 0.00 0.71 0.00 0.40 IMX 0.33 0.00 0.79 0.00 0.00 0.31 0.00 0.00 BOD 0.00 0.00 0.75 0.00 0.00 0.79 0.00 0.00 YTZ 0.00 0.00 NO NO 0.00 NO NO 0.00 USE 0.00 0.00 0.00 3.52 0.00 0.00 0.00 NO CJU 0.00 0.75 0.34 0.41 0.00 0.41 0.00 0.00 MAB 0.00 0.30 0.35 0.36 0.00 0.37 0.77 0.41 COL 0.00 0.00 0.00 0.54 0.00 0.00 0.57 0.00 EKV 0.00 0.00 0.00 0.72 NO NO 0.00 0.00 LOZ 0.61 0.27 0.18 0.44 0.54 0.09 NO NO TUC 0.00 0.00 0.00 0.00 0.00 0.57 0.00 0.00 ISA NO 0.00 0.00 NO 0.00 ND 0.55 ND PQB ND 0.00 ND 0.00 0.00 NO 0.00 0.00 BUD ND ND NO NO NO ND ND NO
Oct-88 Nov-88 Dec-88 Jan-89 Feb-89 Mar-89 Apr-89 May-89 BE 1900 INDUSTRY 0.00 0.12 0.10 0.14 0.12 0.00 0.06 0.15 GAP 0.00 0.00 0.00 0.00 0.00 0.00 0.00 0.00 TOM ND ND NO NO ND ND ND ND TIM 0.00 0.00 0.00 1.36 0.00 0.00 1.20 0.00 YHS 0.00 0.48 0.00 0.50 0.00 0.00 0.00 ND GLW 0.00 0.00 NO 0.00 0.57 0.00 0.00 0.00 CJU ND 0.00 0.00 0.00 0.00 ND 0.00 0.00 OTR 0.00 0.00 ND ND 0.00 ND 0.00 0.25 NPA 0.00 0.00 0.00 0.00 0.00 0.00 0.00 0.00 POB 0.00 1.43 0.00 0.00 0.00 0.00 0.00 0.00 EKV 0.00 0.00 0.19 0.00 0.00 0.00 0.00 ND OSA 0.00 0.00 0.00 0.00 0.00 0.00 0.00 0.00 CEL 0.00 0.00 0.00 0.00 0.00 0.00 0.00 0.00 TAM ND ND ND ND NO ND ND NO TMR NO ND ND 0.00 NO 0.00 ND ND AIT NO NO ND ND NO ND ND 83.33 NET NO NO ND ND NO NO ND NO SAB NO NO ND ND NO ND ND ND BAD ND NO NO ND NO ND ND ND NAT ND NO ND ND NO ND ND ND SUB ND ND ND ND NO ND ND ND
BE 99 INDUSTRY 0.16 0.34 0.14 0.27 0.00 0.32 0.51 0.18 AIT 0.00 0.00 0.00 0.00 NO 0.76 0.00 0.00 ARA 0.00 ND NO NO ND ND ND ND BID 1.02 1.11 0.00 1.60 0.00 ND ND 0.00
A-28

PT6 MONTHLY PERFORMANCE ENGINE REMOVALS (CONTINUED)
ZMT 0.00 0.00 0.00 0.00 0.00 0.00 0.00 0.00 CAL 0.00 0.00 0.00 0.00 0.00 0.00 0.00 ND TIM 0.60 0.00 0.71 0.00 0.00 0.00 0.00 0.00 ARE 0.00 0.26 0.00 0.00 0.00 ND 0.00 ND GEP 0.00 0.00 0.00 0.00 0.00 0.00 0.00 0.00 SUB 0.00 3.57 0.00 0.00 0.00 0.00 0.00 0.00 YHS 0.00 0.00 0.00 0.00 0.00 0.00 1.05 ND BDM ND ND ND ND ND ND ND ND EMT 0.00 0.00 0.00 0.96 0.00 ND ND ND CBP ND ND ND ND ND ND ND ND ARO 0.00 ND 0.00 0.00 0.00 1.29 ND ND OSA 0.00 0.00 0.00 0.00 0.00 0.00 0.00 0.00 OTR 0.00 0.00 ND ND 0.00 ND 0.00 0.00 SIB 0.00 ND 0.00 0.00 0.00 0.00 2.11 0.91 TEM ND ND ND 0.00 ND 0.00 0.00 0.00 JJJ ND ND ND ND ND 0.00 0.83 ND TUM ND ND ND ND ND ND ND 0.00 CUL ND ND ND ND ND ND ND ND NET ND ND ND ND ND ND ND ND NAT ND ND ND ND ND ND ND ND ESU ND ND ND ND ND ND ND ND BAD ND ND ND ND ND ND ND ND ISA ND ND ND ND ND ND ND ND
DHC6 INDUSTRY 0.36 0.14 0.14 0.22 0.00 0.18 0.00 0.25 ARU ND ND ND ND ND ND ND ND SLP 0.00 0.00 0.00 0.00 0.00 0.00 0.00 0.41 CPU 0.00 0.00 0.00 0.00 0.00 0.00 0.00 0.00 BOD 0.00 0.00 ND 0.00 0.00 0.00 0.00 0.00 CBA 0.63 0.00 0.00 0.00 0.00 0.00 0.00 0.29 LMT 0.00 0.00 0.00 0.00 ND 0.00 0.00 0.00 SOB ND ND ND ND ND ND ND ND PMT ND ND ND ND ND ND ND ND FES 0.00 0.00 0.00 0.00 0.00 0.00 0.00 0.00 JET 0.00 0.00 0.00 0.00 0.00 0.00 0.00 0.00 NUT ND ND ND ND ND ND ND ND WGR 0.37 0.00 0.00 0.38 0.00 0.32 0.00 0.35 ASI 0.00 0.00 0.00 0.00 0.00 0.00 0.00 0.00 GUP ND ND ND ND ND ND ND ND AET 3.36 0.00 0.00 0.00 0.00 0.00 0.00 ND KNY 0.00 0.34 0.00 0.00 0.00 0.00 0.00 0.00 GOP ND ND 0.87 0.00 0.00 0.00 0.00 ND OMT 0.00 0.00 ND ND ND ND ND ND NIT ND ND ND 3.97 0.00 0.00 0.00 0.00 FIS 0.00 0.00 0.00 0.00 0.00 ND 0.00 ND BMT 0.00 0.00 0.00 0.00 0.00 0.00 0.00 0.00 GIP 0.00 ND 0.00 0.00 0.00 0.00 0.00 0.00 FAS ND ND ND 0.00 0.00 2.04 0.00 0.00 CBE ND ND ND ND ND ND ND ND
A-29

PT6 MONTHLY PERFORMANCE ENGINE REMOVALS (CONTINUED)
DHC7 INDUSTRY 0.52 0.60 0.57 0.37 0.36 0.58 0.53 0.36 MAB 0.95 0.73 0.53 0.25 0.00 0.21 0.65 0.42 RCW 0.59 1.06 0.84 0.58 1.19 1.07 1.15 0.64 CIL NO NO NO NO NO NO NO NO GUP 0.00 0.00 NO 0.00 0.24 0.79 0.00 0.00 AET 0.90 0.00 0.00 0.00 0.00 0.00 0.00 NO GOP NO NO 6.76 0.00 0.00 0.00 0.00 NO PVK 0.00 0.00 0.00 0.00 0.00 0.00 0.00 0.00 URW 0.17 0.46 0.00 0.25 0.26 NO 0.24 0.00 FUS 0.30 0.31 0.32 0.32 0.00 0.20 0.34 NO ARI NO NO NO NO NO 0.00 0.00 0.00 BAD NO NO NO NO NO NO NO NO
EMB1 10 INDUSTRY 0.32 0.27 0.00 0.15 0.10 0.51 0.38 0.20 MAB 0.84 0.00 0.00 0.35 0.19 0.83 0.35 0.33 SEB NO NO NO NO NO NO NO NO BED 0.00 0.00 0.00 0.00 0.00 0.00 2.37 0.79 TUC 0.00 0.24 0.00 0.00 0.00 0.20 0.11 0.00 CAL 0.00 0.00 0.00 0.00 NO NO NO NO GEP 0.00 0.00 NO 0.00 0.00 0.00 0.00 0.00 axe 0.00 0.46 0.00 0.00 0.00 0.44 0.00 0.00 ASO 0.00 0.00 0.00 0.00 NO NO NO NO NOT NO NO NO NO NO NO NO NO RMT 0.00 0.00 0.00 0.00 0.00 0.00 0.00 0.00 VER 0.00 0.00 0.00 0.00 NO NO NO NO CBI NO NO NO NO NO NO NO NO
SH 50330 INDUSTRY 0.25 0.24 0.18 0.21 0.17 0.12 0.13 0.36 ARO 0.00 NO 0.00 0.00 0.00 0.00 NO NO URW 0.48 0.00 0.00 0.00 0.00 NO 0.00 0.00 IMX 0.73 0.45 0.00 0.00 0.00 0.41 0.57 0.00 BOD 0.72 0.00 NO 0.00 0.00 0.00 0.00 0.00 YTZ NO NO NO 0.00 0.00 0.00 0.00 NO USE 0.00 0.00 0.00 0.00 3.03 NO NO NO CJU NO 0.74 0.35 0.00 0.00 NO 0.00 0.00 MAB 0.37 0.00 0.00 0.77 1.60 0.00 NO NO COL 0.00 0.00 0.00 0.00 0.00 0.00 0.00 0.66 EKV 0.00 0.00 0.00 0.00 0.00 0.41 0.00 NO LOZ 0.00 0.00 0.11 0.26 0.13 0.00 0.09 0.38 TUC 0.00 0.63 0.00 0.00 0.00 0.00 0.00 0.00 ISA 0.23 NO 0.26 0.29 0.00 0.00 NO NO PQB 0.00 0.00 0.00 0.00 NO NO NO NO BUD NO NO NO NO NO NO NO NO
A-30

PT6 MONTHLY PERFORMANCE ENGINE REMOVALS (CONTINUED)
Jun-89 Jul-89 Aug-89 Sep-89 Oct-89 Nov-89 Dec-89 Jan-90 BE 1900 INDUSTRY 0.23 0.16 0.16 0.10 0.14 0.16 0.18 0.09 GAP 0.00 0.00 0.00 0.00 0.00 0.00 0.00 0.23 TOM NO NO NO NO NO ND NO NO TIM 0.00 0.00 0.00 0.56 0.00 0.00 0.00 NO YHS 0.00 NO 0.00 0.00 0.00 NO 0.00 0.00 GLW 0.51 0.00 0.90 0.00 0.35 0.25 0.00 0.00 CJU 0.00 0.26 0.00 0.00 0.00 0.28 NO 0.00 OTR 0.00 0.00 0.00 0.27 0.00 0.00 0.28 0.00 NPA 0.54 0.29 0.00 0.00 0.00 0.00 0.68 0.00 POB 0.49 0.47 0.00 0.00 0.86 0.00 0.00 0.41 EKV 0.00 0.00 0.00 0.00 0.00 0.00 0.18 0.00 OSA 0.00 0.00 0.00 NO 0.00 0.00 NO 0.00 CEL 0.00 0.00 0.00 0.00 0.00 0.00 NO NO TAM NO NO NO ND NO NO NO 0.00 TMR NO 0.00 NO NO NO NO NO 0.00 AIT 0.00 0.00 0.00 0.00 0.00 NO 0.00 0.00 NET ND NO 0.00 0.00 0.00 0.00 0.00 0.00 SAB ND NO 0.00 0.00 0.00 0.88 0.00 0.00 BAD NO NO NO ND ND ND NO NO NAT NO NO NO NO NO NO NO 0.00 SUB ND NO NO NO NO NO NO NO
BE 99 INDUSTRY 0.14 0.14 0.12 0.36 0.14 0.00 0.00 0.00 AIT 0.00 0.00 0.00 NO NO NO NO NO ARA NO NO NO NO NO NO NO ND BID 0.00 0.00 0.00 NO NO NO NO NO ZMT NO NO ND ND ND NO NO NO CAL NO NO NO ND NO NO NO NO TIM 0.00 0.00 0.00 0.00 0.00 0.00 0.00 0.00 ARE ND NO NO NO NO NO NO NO GEP 0.00 0.00 0.00 0.00 0.00 0.00 0.00 NO SUB 0.00 0.00 0.00 0.00 0.00 NO 0.00 0.00 YHS 0.00 NO 0.00 1.41 0.00 NO NO NO BDM NO NO NO ND ND NO NO NO EMT ND NO NO ND ND NO NO NO CBP NO NO NO NO NO NO NO NO ARO 0.00 0.00 NO 1.22 0.00 NO NO 0.00 OSA 0.00 0.00 0.00 ND 0.00 0.00 NO 0.00 OTR 0.21 0.00 0.00 0.00 0.00 0.00 0.00 0.00 SIB 0.00 0.92 1.03 1.04 1.21 0.00 0.00 0.00 TEM 0.00 0.00 0.00 NO 0.00 0.00 0.00 NO JJJ NO NO NO ND ND NO NO NO TUM 0.00 0.00 0.00 0.00 0.00 0.00 0.00 0.00 CUL ND NO 0.00 0.00 0.00 0.00 0.00 0.00 NET NO NO 0.00 0.00 0.00 0.00 0.00 0.00 NAT NO NO NO 0.00 0.00 0.00 0.00 0.00 ESU ND NO NO NO NO NO NO 0.00 BAD NO NO NO NO NO ND NO ND ISA NO NO NO ND ND NO NO NO
A-31

PT6 MONTHLY PERFORMANCE ENGINE REMOVALS {CONTINUED}
DHC6 INDUSTRY 0.10 0.22 0.10 0.25 0.25 0.00 0.00 0.00 ARU ND ND ND ND ND ND ND ND SLP 0.48 0.41 0.00 0.81 0.40 0.00 0.00 0.00 CPU 0.00 0.00 0.00 0.00 0.00 0.00 0.00 0.00 BOD 0.00 0.00 0.00 0.00 0.00 0.00 0.00 0.00 CBA 0.00 0.00 0.00 0.00 0.30 0.00 0.00 0.00 LMT 0.00 0.00 0.00 0.00 0.00 0.00 0.00 0.00 SOB ND ND ND ND ND ND ND ND PMT ND ND ND ND ND ND ND ND FES 0.00 0.00 0.00 0.00 0.00 0.00 0.00 0.00 lET 0.00 NO 0.00 0.00 0.00 0.00 0.00 0.00 NUT ND ND ND ND ND ND ND ND WGR 0.00 0.32 0.00 0.00 0.00 0.00 0.00 0.00 ASI 0.00 0.00 0.00 0.00 0.00 0.00 0.00 0.00 GUP ND ND ND ND NO NO NO NO AET ND ND 5.95 0.00 7.96 0.00 0.00 0.00 KNY 0.00 ND 0.00 0.00 0.00 0.00 0.00 0.00 GOP 0.00 0.00 ND 1.02 0.00 0.00 0.00 0.00 OMT ND ND ND ND ND ND ND ND NIT 0.00 0.00 0.00 ND 0.00 ND 0.00 ND FIS 0.00 0.00 0.00 0.00 0.00 ND 0.00 o.bo BMT 0.00 0.00 0.00 0.00 0.00 0.00 0.00 0.00 GIP 0.00 0.00 0.00 0.00 0.00 0.00 ND ND FAS 0.00 0.00 0.00 ND 0.00 ND 0.00 0.00 CBE ND ND ND ND ND ND ND 0.00
DHC7 INDUSTRY 0.45 0.43 0.46 0.62 0.37 0.24 0.55 0.34 MAB ND ND ND ND NO ND 0.67 0.30 RCW 0.44 0.00 0.67 1.91 0.72 0.49 2.54 0.73 CIL ND ND ND ND ND ND ND ND GUP 0.58 0.65 0.24 0.00 0.66 0.31 0.00 0.28 AET NO NO 0.00 0.00 0.00 0.00 0.00 0.00 GOP ND ND NO ND ND ND ND NO PVK 0.00 0.00 0.00 0.00 0.00 0.00 0.00 0.00 URW 0.67 0.44 0.93 0.50 0.22 0.00 0.00 0.00 FUS 0.10 0.37 0.18 0.20 0.10 0.10 0.00 0.22 ARI 0.45 0.00 0.00 0.00 0.00 0.00 0.00 0.00 BAD ND NO NO NO ND NO ND NO
EMB110 INDUSTRY 0.20 0.21 0.22 0.37 0.00 0.18 0.21 0.00 MAB ND ND ND ND ND ND 0.00 0.00 SEB NO NO ND ND ND ND ND ND BED 1.70 1.86 1.74 0.00 0.00 0.00 0.00 ND TUC 0.00 0.00 0.00 0.25 0.00 0.15 0.32 0.00 CAL ND NO ND ND ND NO NO NO GEP 0.00 0.00 0.00 0.00 0.00 0.00 0.00 NO axe 0.00 0.00 0.00 ND 0.00 0.00 0.00 0.00 ASO ND ND ND NO ND ND NO NO NOT ND ND ND ND ND ND NO NO
A-32

PT6 MONTHLY PERFORMANCE ENGINE REMOVALS (CONTINUED)
RMT 0.00 0.00 ND ND ND ND ND NO VER ND ND ND ND ND ND ND ND CBI ND ND ND ND ND ND ND ND
SH SD330 INDUSTRY 0.19 0.23 0.17 0.26 0.06 0.19 0.28 0.20 ARO 0.00 0.00 ND ND ND ND ND ND URW ND ND ND ND ND ND ND ND IMX 0.00 0.33 0.29 0.00 0.30 0.00 0.00 0.71 BOD 0.00 0.00 0.00 0.00 0.00 0.00 0.00 0.00 YTZ 0.00 0.00 0.00 ND 0.00 ND 0.23 0.00 USE 0.00 ND ND 0.00 0.00 2.03 ND NO CJU 0.00 0.00 0.00 0.75 0.00 0.00 ND 0.00 MAB ND ND NO ND ND ND NO ND COL 1.38 1.35 0.00 0.72 0.00 0.00 0.00 0.00 EKV 0.00 0.00 0.29 0.00 0.00 0.00 0.00 0.00 LOZ 0.19 0.09 0.09 0.19 0.00 0.19 0.29 0.09 TUC 0.00 0.00 0.00 0.00 0.00 0.00 1.03 0.00 ISA 0.00 ND ND ND ND ND ND ND POB ND ND ND ND ND ND ND ND BUD ND ND NO ND ND ND ND ND
Feb-90 Mar-90 Apr-90 May-90 Jun-90 Jul-90 Aug-90 Sep-90 BE 1900 INDUSTRY 0.21 0.13 0.18 0.23 0.28 0.18 0.24 0.18 GAP 0.25 0.00 0.00 0.00 0.00 0.00 0.00 0.00 TOM ND ND ND ND ND ND ND NO TIM 0.00 ND 0.30 0.00 0.00 0.00 0.00 0.00 YHS 0.00 0.00 0.00 0.13 0.12 0.00 0.00 ND GLW 0.27 0.48 ND ND ND ND ND ND CJU 0.00 0.31 0.59 ND 0.00 0.00 0.21 0.45 OTR 0.00 0.00 ND 0.78 0.53 ND 0.00 0.67 NPA 0.66 0.00 0.57 0.27 ND 0.56 0.55 ND PQB 0.00 NO 0.00 0.00 0.32 0.31 0.00 0.00 EKV 0.18 0.00 0.00 0.00 0.19 0.43 0.42 0.00 OSA 0.00 0.00 ND 0.00 0.00 0.00 0.00 0.00 CEL ND ND ND ND ND ND NO ND TAM ND ND ND ND ND ND ND NO TMR ND ND NO ND 0.00 0.00 0.00 0.00 AIT 0.00 0.00 0.00 0.00 0.00 0.00 0.00 0.00 NET ND 0.00 0.00 0.00 0.00 0.00 0.00 NO SAB 0.00 0.00 0.00 0.00 0.00 0.00 0.25 0.00 BAD ND ND 0.00 1.27 1.01 0.19 0.48 0.19 NAT 0.00 0.00 0.00 0.00 0.00 0.00 0.00 0.00 SUB ND NO ND ND ND ND ND 0.00
BE 99 INDUSTRY 0.00 0.00 0.00 0.42 0.34 0.00 0.16 0.00 AIT ND ND ND ND ND ND ND ND ARA ND ND NO ND ND ND NO NO BID ND NO ND ND ND ND ND NO
A-33
PT6 MONTHLY PERFORMANCE ENGINE REMOVALS (CONTINUED)
ZMT NO NO NO NO NO NO NO NO CAL NO NO NO NO NO NO NO NO TIM 0.00 NO 0.00 0.00 0.00 0.00 0.00 NO ARE NO NO NO NO NO NO NO NO GEP 0.00 0.00 0.00 NO 0.00 0.00 0.00 0.00 SUB 0.00 0.00 0.00 0.00 0.00 0.00 0.00 0.00 YHS NO NO NO NO NO NO NO NO BDM NO NO NO NO NO NO NO NO EMT NO NO NO NO NO NO NO NO CBP NO NO NO NO NO NO NO NO ARO 0.00 0.00 0.00 0.00 NO 0.00 1.73 0.00 OSA 0.00 0.00 NO 0.00 0.00 0.00 0.00 0.00 OTR 0.00 0.00 NO 0.57 0.48 NO 0.00 0.00 SIB 0.00 NO NO NO NO NO NO NO TEM NO 0.00 0.00 NO NO NO NO 0.00 JJJ NO NO NO NO NO NO NO NO TUM 0.00 0.00 0.00 0.00 0.00 0.00 0.00 0.00 CUL 0.00 0.00 0.00 0.00 0.00 NO 0.00 0.00 NET NO 0.00 0.00 0.00 0.00 0.00 0.00 NO NAT 0.00 0.00 0.00 0.00 0.00 0.00 0.00 0.00 ESU 0.00 NO 0.00 0.00 0.00 0.00 NO NO BAD NO NO NO NO NO NO 0.00 0.00 ISA NO NO NO NO NO NO 0.00 NO
DHCG INDUSTRY 0.14 0.10 0.24 0.24 0.00 0.17 0.21 0.31 ARU NO NO NO NO NO NO NO NO SLP 0.00 0.00 0.48 0.40 0.00 NO 0.95 1.09 CPU 0.00 0.00 0.00 0.00 0.00 0.00 0.00 0.00 BOD 0.00 1.00 0.00 0.00 0.00 1.44 0.00 1.57 CBA 0.00 0.00 NO 0.00 0.00 0.25 0.25 NO LMT 5.00 0.00 0.00 0.00 0.00 0.00 0.00 0.00 SOB NO NO NO NO NO NO NO NO PMT NO NO NO NO NO NO NO NO FES 0.00 0.00 0.00 0.00 NO NO NO NO lET NO 0.00. 0.00 0.00 NO 0.00 0.00 0.00 NUT NO NO NO NO NO NO NO NO WGR 0.00 0.00 0.00 0.27 0.00 0.00 0.00 0.00 ASI 0.00 0.00 0.00 0.00 0.00 0.00 0.00 0.00 GUP NO NO NO NO NO NO NO NO AET 0.00 0.00 4.63 0.00 0.00 0.00 0.00 NO KNY 0.00 0.00 0.00 NO 0.00 0.00 0.00 0.00 GOP 0.00 0.00 0.00 0.00 0.00 0.00 0.00 0.00 QMT NO NO NO NO NO NO NO NO NIT NO 0.00 0.00 0.00 0.00 0.00 0.00 0.00 FIS 0.00 NO NO 0.00 NO NO NO NO BMT 0.00 0.00 0.00 0.00 0.00 NO 0.00 0.00 GIP 0.00 0.00 0.00 NO 0.00 0.00 NO NO FAS 0.00 NO NO 0.00 0.00 0.00 0.00 NO CBE 0.00 0.00 NO 0.00 0.00 0.00 0.00 0.00
A-34

PT6 MONTHLY PERFORMANCE ENGINE REMOVALS (CONTINUED)
DHC7 INDUSTRY 0.43 0.27 0.30 0.06 0.41 0.53 0.37 0.32 MAB 0.00 1.20 0.58 0.00 1.19 0.59 0.00 0.00 RCW 0.55 0.30 0.89 0.30 0.62 1.16 1.14 0.00 CIL NO NO NO NO NO NO NO NO GUP 0.59 0.26 NO NO NO NO NO NO AET 0.00 0.00 0.00 0.00 0.00 0.00 0.00 NO GOP NO NO NO NO NO NO NO NO PVK 0.00 0.00 0.00 0.00 0.00 NO 0.00 0.00 URW 0.84 0.26 0.00 0.00 0.00 NO 0.00 NO FUS 0.13 0.00 0.13 0.00 0.00 0.00 0.22 0.33 ARI 0.00 0.00 0.00 0.00 0.31 0.33 0.00 0.00 BAD NO NO 0.00 0.00 0.91 0.78 0.49 0.48
EMB110 INDUSTRY 0.00 0.28 0.00 0.65 0.30 0.30 0.46 0.24 MAB 0.00 0.36 0.00 0.54 0.18 0.18 0.70 0.37 SEB NO NO NO ND NO NO NO NO BED ND NO NO NO NO 0.00 NO NO TUC 0.00 0.14 0.00 0.00 0.15 0.32 0.17 0.00 CAL NO NO NO ND NO NO NO NO GEP 0.00 0.00 0.00 NO 0.00 0.00 0.00 0.00 axe 0.00 0.00 0.00 0.30 0.29 0.00 0.00 0.00 ASO ND ND NO ND NO NO NO NO NOT NO ND NO NO NO ND NO ND RMT NO NO NO ND ND NO ND ND VER NO NO NO ND NO NO NO NO CBI NO NO NO NO 0.00 0.00 0.00 0.00
SH SD330 INDUSTRY 0.27 0.20 0.27 0.15 0.32 0.00 0.19 0.22 ARO NO NO NO NO ND NO NO NO URW NO NO NO NO NO NO NO NO IMX 0.26 0.22 0.58 0.16 0.19 0.00 0.00 0.00 BOD 0.00 0.00 0.00 0.00 1.04 0.00 0.00 0.00 YTZ NO 0.38 ND NO NO NO 0.00 NO USE NO NO NO NO NO 0.00 0.00 NO CJU 0.00 0.00 0.00 ND 0.00 0.00 0.00 0.00 MAB NO ND NO NO NO NO ND NO COL 0.00 0.00 0.00 0.00 0.00 0.00 0.00 0.00 EKV 0.51 0.23 0.00 0.00 0.00 0.00 0.00 0.00 LOZ 0.11 0.09 0.19 0.09 0.29 0.00 0.34 0.18 TUC 0.00 0.00 0.00 NO 0.00 0.00 0.90 0.00 ISA NO NO NO NO ND ND 0.00 2.83 POB NO NO NO NO NO NO NO NO BUD ND NO NO NO NO NO ND NO
A-35
PT6 MONTHLY PERFORMANCE ENGINE REMOVALS (CONTINUED)
Oct-90 Nov-90 Dec-90 Jan-91 BE 1900 INDUSTRY 0.07 0.32 0.13 0.04 GAP 0.00 0.00 0.00 0.00 TOM ND ND ND ND TIM 0.00 0.00 0.00 0.00 YHS 0.00 0.00 0.00 0.00 GLW ND ND ND ND CJU 0.00 0.00 0.60 0.00 OTR ND 1.86 0.82 0.00 NPA 0.36 0.00 0.45 0.00 PQB 0.00 0.31 0.24 0.00 EKV 0.00 0.00 0.00 0.00 OSA 0.00 2.58 ND ND CEL ND ND ND ND TAM ND ND ND ND TMR 0.00 ND ND 0.00 AIT 0.00 0.00 0.00 0.00 NET 0.00 0.00 0.00 0.00 SAB 0.00 0.00 0.00 0.00 BAD 0.20 0.93 0.00 0.19 NAT 0.00 0.00 0.00 0.00 SUB 0.00 4.20 0.00 0.00
BE 99 INDUSTRY 0.00 0.26 0.00 0.00 AIT ND ND ND ND ARA ND ND ND ND BID ND ND ND ND ZMT ND ND ND ND CAL ND ND ND ND TIM 0.00 0.00 0.00 0.00 ARE ND ND ND ND GEP ND 0.00 0.00 0.00 SUB 0.00 0.00 0.00 0.00 YHS ND ND ND ND BDM ND ND ND ND EMT ND ND ND ND CBP ND ND ND ND ARO 0.00 0.00 0.00 ND OSA ND 0.00 ND ND OTR ND 0.64 0.00 0.00 SIB ND ND ND ND TEM ND 1.00 0.00 0.00 JJJ ND ND ND ND TUM 0.00 0.00 0.00 0.00 CUL 0.00 ND ND ND NET 0.00 0.00 0.00 0.00 NAT 0.00 0.00 0.00 0.00 ESU 0.00 0.00 0.00 0.00 BAD 0.00 0.00 0.00 0.00 ISA ND 0.00 ND ND
A-36
PT6 MONTHLY PERFORMANCE ENGINE REMOVALS (CONTINUED)
DHC6 INDUSTRY 0.18 0.30 0.00 0.26 ARU NO NO NO NO SLP 1.06 1.18 0.00 0.00 CPU 0.00 0.00 0.00 0.00 BOD NO 0.00 0.00 0.00 CBA 0.00 0.00 NO 0.00 LMT 0.00 0.00 0.00 0.00 SOB NO NO NO NO PMT NO NO NO NO FES NO NO NO NO lET 0.00 0.00 0.00 0.00 NUT NO NO NO NO WGR 0.00 0.27 0.00 0.64 ASI 0.00 0.00 0.00 0.00 GUP NO NO NO NO AET 0.00 0.00 0.00 0.00 KNY 0.00 0.00 0.00 0.00 GOP 0.00 NO NO NO QMT NO NO NO NO NIT 0.00 0.00 0.00 0.00 FIS 0.00 NO 0.00 NO BMT 0.00 0.00 0.00 0.00 GIP NO NO NO NO FAS 0.00 NO NO NO CBE 0.00 0.00 0.00 0.00
DHC7 INDUSTRY 0.46 0.43 0.53 0.20 MAB 0.00 0.00 0.85 0.00 RCW 1.35 0.97 0.66 0.37 CIL NO NO NO NO GUP NO NO NO NO AET 0.00 0.00 0.00 0.00 GOP NO NO NO NO PVK 0.00 0.00 0.00 0.00 URW NO 0.26 0.26 0.24 FUS 0.10 0.00 0.00 0.00 ARI 0.34 0.68 0.33 0.00 BAD 0.63 0.70 0.93 0.00
EMB110 INDUSTRY 0.14 0.00 0.20 0.00 MAB 0.17 0.00 0.20 0.00 SEB NO NO NO NO BED NO NO NO NO TUC 0.00 0.00 0.00 0.00 CAL NO NO NO NO GEP NO 0.00 0.00 0.00 axe 0.00 0.00 0.00 0.00 ASO NO NO NO NO NOT NO NO NO NO
A-37
PT6 MONTHlY PERFORMANCE ENGINE REMOVALS (CONTINUED)
RMT NO NO NO NO VER NO NO NO NO CBI 0.00 0.00 0.00 0.00
SH 50330 INDUSTRY 0.22 0.23 0.30 0.45 ARO NO NO NO NO URW NO NO NO NO IMX 0.00 0.00 0.00 0.13 BOD NO 0.00 0.00 0.56 YTZ NO NO NO NO USE 0.00 3.11 0.00 0.00 CJU 0.00 0.00 0.00 0.00 MAB NO NO NO NO COL 0.00 NO NO NO EKV 0.00 0.00 0.35 0.30 LOZ 0.35 0.36 0.39 0.54 TUC 0.00 0.00 0.00 0.00 ISA NO 0.00 NO NO POB NO NO NO NO BUD NO NO NO 0.00
A-38

APPENDIX B - AIRLINE MACRO SCANS

AVERAGE NUMBER
AIRLINE AIRCRAFT
ABC 34 ~ 21 BKB 40 DEF 21 LWZ 17 JKL 6 DAR 4 CTA 8 AAA 1 n.T 2 DDA 2 RAB 31 NNN 3
AVERAGE NUMBER
AIRLINE AIRCRAFT
RAB 19 LWZ 11
AVERAGE NUMBER
AIRLINE AIRCRAFT
BKB a> NZT 1
AVERAGE NUMBER
AIRLINE AIRCRAFT
ABC 12 DDA ~ XYZ 14 CTA 13
APPENDIX B AIRLINE MACRO SCANS
&747/JT9D AIRLINE MACRO SCAN
NUMBER %IN-FLIGHT MONTHS SHU'IDOWNS RANK
DATA EXCEEDANCES SHUTDOWNS
36 54 2 17 53 3 32 00 1 IB 22 10 36 23 9 ~ 40 5 34 53 4 34 32 7 14 36 6 24 29 8 36 a> 11 35 11 12 16 13 13
&767/JT9D AIRLINE MACRO SCAN
NUMBER %IN-FLIGHT MONTHS SHU'IDOWNS RANK
DATA EXCEEDANCES SHUTDOWNS
36 9 2 35 11 1
DC-10/JT9D AIRLINE MACRO SCAN
NUMBER %IN-FLIGHT MONTHS SHU'IDOWNS RANK
DATA EXCEEDANCES SHUTDOWNS
32 3 1 32 0 2
A-300/CF6 AIRLINE MACRO SCAN
NUMBER %IN-FLIGHT MONTHS SHU'IDOWNS RANK
DATA EXCEEDANCES SHUTDOWNS
36 17 1 33 15 2 34 12 3 34 9 4
B-1
%ENGINE RANK REMOVALS ENGINE
EXCEEDANCES REMOVALS
31 7 24 11 47 4 61 2 29 8 73 1 24 12 53 3 21 13 29 9 :.rl 6 :.rl 5 25 10
%ENGINE RANK REMOVALS ENGINE
EXCEEDANCES REMOVALS
26 1 6 2
%ENGINE RANK REMOVALS ENGINE
EXCEEDANCES REMOVALS
0 2 3 1
%ENGINE RANK REMOVALS ENGINE
EXCEEDANCES REMOVALS
46 1 21 3 29 2 18 4

B-767/CF6 AIRLINE MACRO SCAN
AVERAGE NUMBER %IN-PLIGHT %ENGINE RANK NUMBER .MONTHS SHIJ1DOWNS RANK REMOVALS ENGINE
AIRLINE AIRCRAFT DATA EXCEEDANCES SHUTDOWNS EXCEEDANCES REMOVALS
FPC 3) 33 12 1 24 1 sss 6 16 6 2 13 3 DDA 45 35 3 3 9 2 GGA 7 16 0 4 0 4
DC-10/CF6 AIRLINE MACRO SCAN
AVERAGE NUMBER %IN-FLIGHT %ENGINE RANK NUMBER .MONTHS SHIJ1DOWNS RANK REMOVALS ENGINE
AIRLINE AIRCRAFT DATA EXCEEDANCES SHIJ1DOWNS EXCEEDANCES REMOVALS
DEF 24 36 39 1 33 4 DDA 59 35 31 3 31 5 TMR 6 35 20 5 51 1 RAB 55 35 :r7 2 17 7 CTA 15 34 24 4 41 3 PPP 1 7 14 6 14 8 XYZ 2 32 3 7 25 6 FPC 4 10 0 8 50 2
BE-1900/PT6 AIRLINE MACRO SCAN
AVERAGE NUMBER %IN-PLIGHT %ENGINE RANK NUMBER MONTHS SHUTDOWNS RANK REMOVALS ENGINE
AIRLINE AIRCRAFT DATA EXCEEDANCES SHUTDOWNS EXCEEDANCES REMOVALS
OI'R w 25 28 2 36 3 PBQ 7 3) 23 3 'Z1 6 EKV 14 3) 20 4 13 9 CJU 11 31 l9 6 23 7 NPA 9 32 9 w 31 4 TOM 16 5 00 1 40 2 SUB 1 5 20 5 20 8 GAP 11 36 11 8 8 12 YHS 13 3) w 9 7 13 NAT 3 13 15 7 0 16 AIT 1 20 5 11 5 14 OSA 2 23 4 12 4 15 TIM 2 34 3 13 12 w BAD 14 w 0 14 80 1 GUP w 25 0 15 28 5 SAB w 18 0 16 11 11 CEL 1 14 0 17 0 17 TAM 6 1 0 18 0 18 TMR 2 w 0 l9 0 l9 NET 5 16 0 20 0 20
8-2
BE-99/P'f6 AIRLINE .MACRO SCAN
AVERAGE NUMBER %IN-FLIGHT %ENGINE RANK NUMBER MONTHS SHUIDOWNS RANX REMOVALS ENGINE
AIRLINE AIRCRAFT DATA EXCEEDANCES SmrrDOWNS EXCEEDANCES REMOVALS
YHS 4 17 29 1 29 5 OI'R 6 25 12 4 16 8 AIT 7 18 11 6 17 6 JJJ 3 17 12 5 35 4 SIB 3 12 5 12 38 3 SUB 3 34 6 11 3 12 TIM 2 35 3 13 9 10 BAD 8 6 17 2 0 1.3 CAL 2 15 13 3 0 14 ARA 1 9 11 7 0 15 TUM 2 21 w 8 0 16 ESU 6 10 w 9 0 17 ARE 7 14 7 10 0 18 CBP 4 3 0 14 61 1 BID 3 2 0 15 50 2 EMT 5 12 0 16 17 7 ARO 3 Zl 0 17 15 9 TEM 5 16 0 18 6 11 ZMT 3 15 0 19 0 19 GEP 1 32 0 :;!) 0 20 BDM 1 4 0 21 0 21 OSA 2 28 0 Z! 0 22 CUL 1 14 0 23 0 23 NET 4 16 0 24 0 24 NAT 5 17 0 25 0 25 ISA 2 2 0 26 0 26
8-3

DHC6/PT6 AIRLINE MACRO SCAN
AVERAGE NUMBER %IN·FLIGBT %ENGINE RANK NUMBER MONTHS SBUTDOWNS R.ANK REMOVALS ENGINE
AIRLINE AIRCRAFT DATA EXCEEDANCES SHUTDOWNS EXCEEDANCES REMOVALS
WGR 7 36 17 1 25 2 KNY 13 34 15 2 3 10 SLP 7 28 7 3 50 1 GOP 5 29 7 4 24 3 CBA 11 33 6 6 1B 4 AET 1 31 6 7 13 5 NIT 1 24 4 8 4 9 BOD 2 34 3 9 9 6 LMT 2 35 3 10 6 7 BMT 2 30 7 5 0 11 FAS 2 17 0 11 6 8 CPU 1 34 0 12 0 12 ASI 1 36 0 13 0 13 lET 3 33 0 14 0 14 FES 4 28 0 15 0 15 FIS 1 21 0 16 0 16 GIP 2 18 0 17 0 17 CBE 2 12 0 18 0 lB QMT 2 9 0 19 0 l9 GUP 3 8 0 3) 0 20 PMT 1 6 0 21 0 21 NUT 4 4 0 22 0 22 SOB 3 2 0 23 0 23 ARU 2 1 0 24 0 24
DHC-7/PT6 AIRLINE MACRO SCAN
AVERAGE NUMBER %IN·FLIGBT %ENGINE RANK NUMBER MONTHS SBUTDOWNS R.ANK REMOVALS ENGINE
AIRLINE AIRCRAFT DATA EXCEEDANCES SHUTDOWNS EXCEEDANCES REMOVALS
RCW 8 36 22 3 92 1 MAB 4 30 23 2 '51 3 GLW 5 24 17 4 21 5 URW 5 31 13 6 19 6 FUS 12 32 13 5 3 9 ARI 3 23 13 7 9 8 GOP 2 13 8 8 31 4 AET 3 31 3 9 13 7 PVK 1 35 6 10 3 10 CIL 10 3 01 1 0 11 BAD 5 10 0 11 70 2
B-4

EMB-110/PTS AIRLINE MACRO SCAN
AVERAGE NUMBER %IN-FLIGHT %ENGINE RANK NUMBER MONTHS SHU'IDOWNS RANK REMOVALS ENGINE
AIRLINE AIRCRAFT DATA EXCEEDANCES Smri'DOWNS EXCEEDANCES REMOVALS
TUC 25 36 25 1 6 6 MAB 14 ~ 17 3 '57 1 QXC 12 35 17 4 9 5 NOT 9 5 ID 2 40 2 BED 5 22 9 5 23 3 RMT 2 lB 6 6 0 7 VER 5 9 0 7 22 4 GEP 1 31 0 8 0 8 CAL 2 12 0 9 0 9 ASO 2 12 0 10 0 10 em 1 8 0 11 0 11 SEB 4 2 0 12 0 12
SH SD-330/PT6 AIRLINE MACRO SCAN
AVERAGE NUMBER %IN-FLIGHT %ENGINE RANK NUMBER MONTHS SHU'IDOWNS RANK REMOVALS ENGINE
AIRLINE AIRCRAFT DATA EXCEEDANCES SmrrDOWNS EXCEEDANCES REMOVALS
LOZ 31 34 24 2 38 2 IMX 8 36 17 4 36 3 EKV 10 33 9 9 18 7 BOD 4 34 12 7 15 10 ISA 8 13 31 1 31 5
MAB 6 14 21 3 43 1 USE 6 22 14 5 18 8 URW 7 15 13 6 33 4 TUC 5 35 9 10 11 12 CCL 6 33 6 11 18 9 CJU 6 33 6 12 12 11 PBQ 3 9 11 8 0 14 ARO 2 14 0 13 21 6 YTZ 9 16 0 14 6 13 BUD 1 1 0 15 0 15
8-5
APPENDIX C - UI-JVTM ULTRASONIC IMAGING SYSTEM SPECIFICATIONS

Ultra Image IV Portable Imaging System
Specifications: Ultrasonic Imaging Modules:
Ultrasonic Programmable Receiver (UPR): Single-channel digital ultrasonic signal acquisition with 4 independent signal gates for amplitude, time and A-scan signal capture.
Remote Pulser Preamp: 20 dB or 40 dB software selectable gain. 0-500 volt spike pulser
Single Channel Software Package:
B & C Scan Imaging Package:
Analysis Software:
Computer:
Monitor:
Floppy Drives:
Hard disk Drive:
Dimensions:
Basic operating software for the RPP-1 and UPR.
B and C scan imaging for one to eight ultrasonic channels. Imaging software contains the Scan SETUP and Scan modules required to perform 2-D scanning operations.
Planar, 3-D displays, and Histogram for time of flight and Amplitude data.
80386-DX Processor with Math Coprocessor and 4MB RAM
9.0" built in VGA Color CRT
1. 44MB, 3. 5"
80MB 3. 5" IDE
17.S"W x 6.8"H x 17.l"D, weighing approximately 32 lbs. Fully Assembled
C-1

APPENDIX D - NDI PROCEDURE DESCRIPilON

APPENDIX D
NDI Procedure Descriptions
Ultrasonic Imaging Inspection of Jr9D Outer Diffuser Casing Stiffener Rail by Computer Controlled Motorized Scanner:
l. Objective
Use of ultrasonic imaging methods to inspect JT9D outer diffuser casing stiffener rail by computer controlled motorized scanner.
2 Reference:
2.1 DOT/FAA/Cf-91/10 Turbine Aircraft Engine Operational Trending and JTSD Static Component Reliability Study, March 1992, p. C-1.
3. Equipment and Materials
3.1 UI-JVTM - Ultrasonic Imaging System
3.2 Transducer - 5 MHz. Angle Beam, 52 Degrees, 3 /8" Diameter
3.3 Transducer Cable - 25 feet
3.4 Power Cable
3.5 Couplant - Aluminum Tap Oil
3.6 Scanner- UII/SAIC computer controlled motorized scanner
3.7 Disk- 3.5", DS liD. 1351PI. 1.44 :MB
3.8 Notebook
4. Safety Precaution
All personnel perfonning the inspection shall wear safety goggles.
5 Equipment setup - UI-fVTh'l
5.1 Tum power on- Manual selection will appear on UI-IVTM
5.2 Select Scan File - Jr9D data
5.3 Update Test Descriptions
5.4 Select setup
5.5 Select Robot. Ratio, X: 320, Y: 3400
5.6 Select Teach, Place: for C - Scan,
5.6.1 Inde.x: Y-Resolution 1mrn. Length: 20mrn
5.6.2 Scan: X-Resolution lmrn, Length: 200mrn
5. 7 Select Edit
5.7.1 Save File
5.8 Select Copy. plot, me output name
5.9 Select Scan - When the screen shows designated scanning areas, the system is ready to record data.
6 Scanner Setup - Computer controlled motorized scanner
D-1

6.1 Load the program disk in the motion controller processor. manual selections will appear on screen.
6.2 Use JOG command and arrow keys to move the transduct:r to any designated location as home position.
6.3 Enter scanning parameters, such as scanner speed and acceleration, length of scanning direction, increment directions, etc.
6.4 Press SCAN to start scan: the transducer will move from home position to scan along the Xdirection with increment in the ¥-direction. When the entire area is scanned, the scanner will return to the home position and stop automatically.
7. Press Eon UI-IV1M system to save data.
a Take notes on test as appropriate. At this point. scanning is complete.
9. Evaluation of results
If any defects are detected, areas of distinctive signal amplitude change will show on the image. If there is no defect in the inspected area, the image Will show a uniform color over the entire inspected area.
0-2 *u.S. GOVERNMENT PRINTING OFFICE: I993 • 504-078/80118