0.>¢ - NASA Thecomplexradiation environment in low-Earth orbits has received considerable attention...
26
\ N95- 25914 A Study of the Radiation Environment On Board the Space Shuttle Flight STS-57 0.>¢ • + G.D. Badhwar, W. Atwell', E.V. Benton, A.L. Frank +and R.P. Keegan ÷ NASA Johnson Space Center, Houston, Texas 77058 Rockwell, Space Systems Division, Houston, Texas 77058 Department of Physics, University of San Francisco, San Francisco, CA 94117-1080 and V.E. Dudkin, O.N. Karpov, Yu. V. Potapov, A.B. Akopova Research Center for Spacecraft Radiation Safety Shchukinskaya Str. 40, Moscow 123182, Russia and N.V. Magradze, L.V. Melkumyan, and'Sh. B. Rshtuni Yerevan Physics Institute, Yerevan 375036, Armenia (48) https://ntrs.nasa.gov/search.jsp?R=19950019494 2018-09-09T06:38:06+00:00Z
Transcript of 0.>¢ - NASA Thecomplexradiation environment in low-Earth orbits has received considerable attention...

\
N95- 25914
A Study of the Radiation Environment On Board the Space Shuttle Flight STS-57
0.>¢
• +
G.D. Badhwar, W. Atwell', E.V. Benton, A.L. Frank +and R.P. Keegan ÷
NASA Johnson Space Center, Houston, Texas 77058
Rockwell, Space Systems Division, Houston, Texas 77058
Department of Physics, University of San Francisco, San Francisco, CA 94117-1080
and
V.E. Dudkin, O.N. Karpov, Yu. V. Potapov, A.B. Akopova
Research Center for Spacecraft Radiation Safety
Shchukinskaya Str. 40, Moscow 123182, Russia
and
N.V. Magradze, L.V. Melkumyan, and'Sh. B. Rshtuni
Yerevan Physics Institute, Yerevan 375036, Armenia
(48)
https://ntrs.nasa.gov/search.jsp?R=19950019494 2018-09-09T06:38:06+00:00Z

rk -.-_

L Abstract
A joint NASA-Russian study of the radiation environment inside a SPACEHAB 2 locker
on Space Shuttle flight STS-57 was conducted. The Shuttle flew in a nearly circular orbit
of 28.5 ° inclination and 462 km altitude. The locker carried a charged particle
spectrometer, a tissue equivalent proportional counter (TEPC), and two area passive
detectors consisting of combined NASA plastic nuclear track detectors (PNTDs) and
thermoluminescent detectors (TLDs), and Russian nuclear emulsions, PNTDs and TLDs.
All the detector systems were shielded by the same Shuttle mass distribution. This makes
possible a direct comparison of the various dose measurement techniques. In addition,
measurements of the neutron energy spectrum were made using the proton recoil
technique.
The results show good agreement between the integral LET spectrum of the combined
galactic and trapped particles using the tissue equivalent proportional counter and track
detectors between about 15 keV/gm and 200 keV/gm. The LET spectrum determined
from nuclear emulsions was systematically lower by about 50%, possibly due to emulsion
fading. The results show that the TEPC measured an absorbed close 20% higher than
TLDs, clue primarily to an increased TEPC response to neutrons and a low sensitivity of
TLDs to high LET particles under normal processing techniques. There is a significant
flux of high energy neutrons that is currently not taken into consideration in dose
equivalent calculations. The results of the analysis of the spectrometer data will be
reported separately.

Introduction
Thecomplexradiation environment in low-Earth orbits has received considerable attention
for the past three decades. Detailed knowledge of this environment under varied
spacecraft shielding geometry is necessary for minimizing risk due to radiation exposure.
The radiation exposure received by crew members in space flights has primarily been
studied using passive thermoluminescent detectors (TLDs). Although some measurements
of the linear energy transfer spectrum have been made using plastic nuclear track detectors
(PNTDs) and nuclear emulsions, they have rarely been used in assessing crew exposures.
Active ionization chambers have flown on the Skylab mission (Parnell et al., 1986) and are
currently used on the Mir orbital station. Although ionization chambers provide dose rate
data, they do not provide the LET spectrum which is the key to obtaining effective dose
equivalent. High energy (_> 0.5 MeV) neutron measurements have received virtually no
attention in the US space program. Active tissue equivalent proportional counters have
been flown on a limited number of Shuttle flights. The Radiation Monitor Equipment
(RME) is a three channel detector that provides absorbed dose, and a rough estimate of
dose equivalent as a function of mission elapsed time (Golightly et al., 1994). Badhwar et
al. (1992, 1994a) have flown, first, a 15-channel and more recently, a 512-channeI tissue
equivalent counter in a number of Shuttle flights. Nguyen et al. "(1989) flew a dose and
dose-equivalent meter on the Mir station, and now a new instrument that provides the
LET spectrum is onboard the Mir station. These measurements indicate that estimates of
radiation exposure using passive TLDs are low compared to those measured using active

detectors. The PNTDs do not respond to radiation below about 5 keWgtm, a region that
can contribute nearly 60-70% of the absorbed dose. These detectors are not fully efficient
till about 10-15 keV/_tm. The nuclear track detectors, because of their simplicity, have
been routinely flown on virtually all Shuttle flights. However, a direct comparison of these
measurements with active detectors has not been possible, because invariably the active
and passive detectors were flown under different Shuttle mass shielding. This current
experiment was designed to remedy these problems.
This paper describes the results of absorbed dose, dose equivalent, LET spectrum, and
neutron energy spectrum inside a Shuttle locker.
Experimental Details
The flight experiment consisted of four separate detector systems: (i) a charged particle
directional spectrometer (CPDS), (ii) a tissue equivalent proportional counter (TEPC),
(iii) two area passive detectors with combined NASA and Russian complements. All four
of these detectors were housed inside a SPACEHAB 2 locker. The SPACEHAB 2 itself
was in the payload bay of the Space Shuttle. Thus all of the detectors saw nearly identical
mass shielding distribution.
Figure 1 is a schematic of the particle spectrometer. It consists of two 1 mm thick lithium
drifted silicon detectors, A1 and A2, that define the basic telescope geometry. At the top

of each of these detectors are 16 x 16 strip detectors to determine the x,y coordinates of
those panicles that formed the coincidence A1A2. Each of these silicon position-sensitive
detectors (PSDs) is 300 Bm thick. This basic telescope was followed by six 5 mm thick
lithium drilled silicon detectors, B 1 to B6, followed by a 1 mm thick A3, PSD 3, and 1 cm
thick sapphire Cerenkov detector viewed head-on by a photomultiplier tube. The area-
solid product of the A1A2 coincidence is 6.2 cm2 sr for an isotropic incidence flux. For
A1A2 coincidences, the voltage output of every detector is pulse-height analyzed using
4096 channel analog-to-digital converters.
V
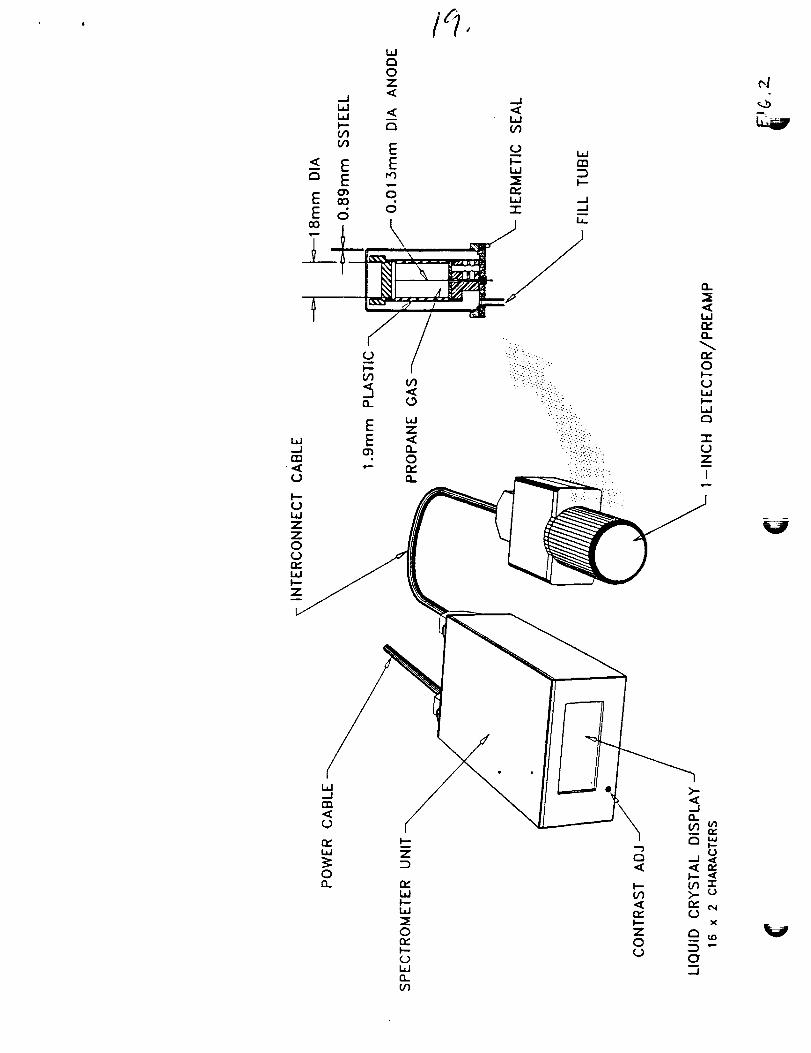
The tissue equivalent proportional counter (Figure 2) consists of a cylindrical detector
1.78 cm long and 1.78 cm in diameter simulating a - 2 Bm-diameter site that is bounded
by tissue-equivalent plastic. The detector uses low pressure gas and operates around -750
volts. The detector signal is processed by a very low-noise preamplifier and two amplifiers
that differ in gain by a factor of 50. The pulse height of the voltage output from each
amplifier is analyzed in a 256-channel analog-to-digital converter. The root mean square
of the electronic system noise is approximately 130 electrons at room temperature. The
lower level discriminator is set around 0.2 keV/Bm. The instrument covers a lineal energy
range, y, from about 0.2 to 1250 keV/Bm The energy resolution of the electronics is 0.1
keV/p.m below 20 keV/gm and 5 keV/Bm above 20 keV/g'm Tile full lineal energy
spectrum is recorded every minute. In addition, absorbed dose is computed by the
instrument and recorded either every 2 or 20 s depending upon the dose rate.

6
The proportional counter was calibrated in terms of lineal energy by exposing it to fission
neutrons and _3_Cs sources. The detector calibration was verified post flight by using 80
and 170 MeV protons at the University ofLoma Linda, California, proton accelerator.
The NASA portions of the area passive detectors contained TLD-700, CR-39, TLD-600
with CR-39 and Gd foils to measure thermal and epi-thermal neutrons. The Russian
portions contained TLD-600, CR-39, and Soviet Bya- and BR-type nuclear photo-
emulsions.
v
The STS-57 flight was launched in to 28.5 ° x 462 km nearly circular orbit on June 21,
1993 for a period of 9.986 days. The TEPC and CPDS were turned on after attaining orbit
and turned off prior to re-entry.
Data Analysis
The methods of analysis of data from these detectors is unique to each detector system.
These methods are discussed separately in previous publications. The analysis &the
spectrometer data followed the procedure described in Badhwar et al. (1994b), is not yet
completed, and will be reported separately. Figure 3 shows the'A1 counting rate and
A1A2 coincidence rate as a function of mission elapsed time_ The large spikes are the
Shuttle passes through the South Atlantic Anomaly (SAA). A1 and A2 are thin planar
detectors and count particles coming from any direction. The coincidence rate A1A2

7
restricts the opening to particles within a cone of 45 ° full angle. Because of the anisotropic
nature of trapped particle flux and the viewing angle, the A1A2 count rate shows a
different time profile than the omni-directional detector AI. Particles that form the A1A2
coincidence provide a measure of the average energy loss per particle. This can be
determined separately for trapped and galactic particle portions of the Shuttle orbit. Thus
individual AI or A2 count rate can appropriately be scaled to dose rates in silicon.
V
Figure 3 plots the TEPC measured dose rate as a function of the mission elapsed time.
This information has been used to separate the data into categories of trapped (SAA) and
galactic cosmic rays (GCR). The method of analysing TEPC data has been described in
detail (Badhwar et al., i994a).
The analysis of the NASA TLDs and CR-39 followed well established techniques that are
described in a number of publications from Benton et al. (1983a, b, 1988, 1991) and Csige
et ai. (1991). The techniques for determining the LET spectrum from nuclear emulsions
are described by Akopova et al., (1985, 1987, 1990). The differentail fast-neutron energy
spectrum was measured using the recoil proton energy spectrum generated as a result of
the elastic scattring of neutrons from unbounded hydrogen in the emulsions.
Measurements were made only of proton tracks whose enas wdre located within the
volume of the emulsion. Due to a significant visual inefiiceincy of the short path-length
recoil protons (F__< 1 MeV) and proton contaminatiion from l_q'(n,p) reaction with
emulsion nitrogen, neutron fluxes with E_ < 1 MeV were not measured. More detailed
V

8
description of this technique can be found in Dudkin et al. (1990). We refer the reader to
these publications for more details.
Results
Dose Measurements
The dose rate measured using the tissue equivalent proportional counter was 1109.7
gGy/day, with GCK particles contributing 71.3 p.Gy/day and trapped particles contributing
1038.4 I.tGy/day. The TLDs mounted on the front surface of the APD box measured
929+28 and 936_+_28 gGy and those mounted on the back surface measured 920+_28 and
909_+_27 gGy. The average dose rate using TLDs was 925.3 _tGy/day. The close rate
measured by TEPC is 20% higher than this rate. The reason for this difference is that the
TEPC responds to neutrons whereas the TLDs do not under normal processing. Also,
TLDs are less sensitive to high LET particles.
Neutron Spect.rBm
The fast-neutron spectrum was calculated using the measured recoil proton energy
spectrum generated as a result of the elastic (n,p) scattering of neutrons from the
hydrogen in the emulsion. Figure 4 shows the derived spectrum in - 1-15 MeV range.
Integrating this spectrum gives an absorbed dose rate of 20 gGy/day and dose equivalent

9
rateof 174laSv/day.This dose equivalent is a factor of nearly 3 higher that in STS-55 (6
BGy/day and 53 laSv/day) derived using the same technique (Dudkin et al., 1994) and
factor 4 to 8 higher than in high inclination COSMOS flights that missed the SAA (Dudkin
et al., 1990). The STS-57 flight was in a higher 462 km altitude orbit compared to STS-
55 (28.5* x 290 kin). These results suggest that a large fraction of the neutrons are
produced in the Shuttle shielding by the interactions of trapped protons and GCR. This is
quite consistent with observations ofKeith et al. (1992) that indicated that at Dloc 2
location in the Shuttle mid-deck nearly 80% of the neutrons below 15 MeV were due to
secondaries and 20% were due to atmospheric albedo. Based on a number of thermal and
epi-thermal neutron measurements ( < 1 MeV) under the same shielding, Benton et al.
(1988) have estimated their dose equivalent contribution of less than 1 MeV neutrons to
be about 22 BSv/day. Thus we have about a 200 BSv/day contribution to dose equivalent
from thermal to about 15 MeV. Model calculations (Armstrong and Colbum, 1992, Keith
et al., 1992) suggest that this energy region provides only about one-half of the total dose
equivalent. Thus the dose equivalent contributions from neutrons could approach nearly
400 pSv/day on this flight, which is higher than the dose contributed by the GCR particles.
It is important to note that the depth-dose equivalent of neutrons in body tissue is
markedly different than that of protons. At organ levels then, neutrons could provide a
much higher dose equivalent than GCR particles at the STS-57 ior higher) altitudes.
Linear Energy. Transfer Spectra
V

10
Figure 5 is the integral LET spectrum of the combined trapp/_d and galactic particles. The
spectrum measured by the CR-39 PNTDs, incorporating a technique that enhances the
efficiency of very high LET events, is shown for comparison. THE PNTD measurements
fall somewhat above TEPC at high LETs (by approximately a factor of 2), then gradually
merge with TEPC data at about 15-50 keV/pm and fall below at low LETs. This
difference may be due in part to the short range secondaries produced in the two
detectors. The lining of the TEPC sensitive volume is tissue-equivalent, while the CP,-39
PNTD is OTCm2H_8. The CR.-39 therfore has a higher density of heavier nuclei and lower
density of hydrogen, as compared to TEPC liner. Secondary particle spectra produced by
primaries interacting with nuclei in the two media will therfore be different. A greater
fluence of high LET secondaries would be expected in the CR-39 while a greater fluence
of light, proton recoil (low LET) secondaries would be expected in the TEPC, in
qualitative agreement. In addition, the CP,-39 loses efficiency below - 15 keWgm which
explains the fall-offbelow TEPC measurements in the low LET region. The solid circles
are data obtained using the nuclear emulsion technique. The shape of this spectrum above
10 keV/lam is nearly the same as the TEPC spectrum, but it is systematically lower in
flux by about a factor of 2.3. The charged particle flux at this altitude is dominated by the
anisotropic trapped particles. The area-solid angle product however has been calculated
using the assumption of an isotropic flux. This can lead to a sysiematic increase in the
calculated flux. Nuclear emulsions from this flight could not be immediately returned to
Moscow. The delay could have lead to fading and hence a lower efficiency. A combination
of these two effects is the probable cause of the lower flux. The average quality factors

11
usingthe ICRP-60 definition, were 1.86 for the whole flight, 3.08 for galactic cosmic rays
and 1.78 for trapped particles. Thus GCR particles contribute 220 laSv/day, which is
nearly equal to the contribution from neutrons with energies between thermal and ~ 15
MeV.
Thus, under moderate shielding thicknesses the neutron contribution to dose and dose
equivalent cannot be ignored. This is roughly 20% of the charged particle skin dose
equivalent and about twice what was observed using Bonner spheres and gold activation
foil techniques in earlier Shuttle flights, including the highest altitude flight to date, the
STS-31 Hubble mission (Keith et al., 1992). However, for these measurements the Bonner
spheres were mounted in one of the least shielded locations (Dloc 2) in the mid-deck. Skin
doses recieved by astronauts are more typical of a higher shielding than this location.
Clearly, additional neutron measurements are essential to quantify the neutron dose
contribution for long duration flights.
Figure 6 and 7 show the integral LET spectra of trapped and GCR particles separately.
The solid lines are model calculations based on the AP-$ Min (Sawyer and Vette, 1976)
and the GCR model of Badhwar and O'Neill (1994). It was shown earlier that the
absorbed dose calculated using the AP-8 Min model is a f_/ctor bf 1.8 higher than the
measured absorbed dose. Thus the AP-8 model calculated spectrum was normalized by
this factor. There is reasonable agreement in the shape of the measured and model spectra
in the intermediate LET range about 15 to 100 keWo.m, however, this is not the case at

12
both low and high LET ends. The particle spectrometer has confirmed the presence of less
than 6 MeV secondary electrons. These electrons would be seen by the proportional
counter but not by the CR-39 or nuclear emulsion. These electrons are not taken in to
account in the model either. The GCR radiation transport calculations were done using the
recently modified HZETRN code (Cucinotta, 1993,1994). There is very good agreement
between the model calculations and observations, except at very high LETs.

Conclusions
13
A joint NASA-Russian experiment was flown on the SPACEHAB 2 mission in 28.5 ° x
462 km orbit. This altitude is very close to that of the planned International Space Station
Alpha, which will be in a 51.8 ° inclination orbit and will thus see more galactic cosmic
radiation flux than in this flight. The results have shown that: (i) there is good agreement
between the TEPC and PNTD measured LET spectra from about 15 keWl.tm to 200
keV/l_m, (ii) the shape of the nuclear emulsion deduced spectrum is the same as that
determined from these two techniques, (iii) the total absorbed dose measured using TEPC
is 20% higher than the total dose measured using TLDs, (iv) there is a substantial flux of
high energy neutrons that contribute at least as much dose equivalent as the galactic
particles, and more likely nearly twice as much, and (v) these neutrons are essentially all
secondaries generated by the interactions of trapped and galactic particles with spacecrafc
shielding. This implies that there is a significant secondary proton component also. This
neutron contribution must be taken into account for crew risk assessment, particularly for
long duration missions at higher than 400 km altitudes.
V
Acknowledgments
This experiment was started with remarkable support and encouragement of Mr. Timothy
White, Assistant to the Director of Space and Life Sciences, Johnson Space Center,
Houston, Texas and built and flight certified in near record time of one year. Mr. Dennis

7
14
Grounds and Dr. Dane Russo provided excellent support and encouragement. Mr. Terry
Byers and Ken Kaufman provided excellent flight integration support. We appreciate the
excellent programming support of Mr. Omar Baltaji and Fadi Riman, and mechanical
engineering support of Mr. Robert Dunn, all of Lockheed. Dr. Thomas Conroy, Battelle
Pacific Northwest Laboratory, Richland, WA, provided electronic engineering support.
Frank Gibbons and Terry Byers were instrumental and getting the position sensitive
detectors to work. We are grateful for the hard work of all these individuals. We are also
grateful to Luis Frigo and EI-Sayed Awad for important contributions with regard to the
PNTD data. The University of San Francisco portion of the work was supported by
NASA grants Nos. NAGg-235 and NAGW-4154.

15
References
Akopova, A.B., Dudkin V.E., Kovalev E.E., Magradze N.V., and Potapov Yu. V. (1987)
Linear energy transfer spectra of cosmic radiation aboard Cosmos-1129 artificial; satellite.
Radiat. Prot. Dosim. 18, 153-156.
Akopova, A.B., Magrade N.V., Dudkin V.E., Kovalev E.E., Potapov Yu. V., Benton
E.V., Frank A.L., Benton E.R., Parnell T.A. and Watts LW. Jr. (1990) Linear energy
transfer (LET) spectra of cosmic radiation in low Earth orbit. Nucl. Tracks Radiat. Meas.
17, 93-97.
Akopova, A.B., Vikhrov A.I., Dudkin V.E., Magradze N.V., Moiseenko A.A., Muradyan
A.H., Ovnanyan K.M and Potapov Yu. V. (1985) Measuring the linear energy transfer
spectra of cosmic radiation aboard the Cosmos-1129 satellite. Kosm. IssledX_II, 479-481.
Armstrong, T.W., and Colbom B.L. (1992) Predictions of induced radioactivity for
spacecraft in low Earth orbit, Nucl. Tracks Radiat. Meas., 20, 101-130.
Badhwar, G.D., Koru'adi A., Hardy A., and Braby L.A (1992) Active dosimetric
measurements on Shuttie flights, Nucl. Tracks Radiat. Meas. 20, 13-20.
Badhwar, G.D., Cucinotta F.A., Braby L.A., and Konradi A., Measurements on the
Shuttle of the LET spectra of galactic cosmic radiation and comparison with radiation
transport model, Radia. Res. 139, 344-351.
Badhwar, G.D., Patel J.U., Cucinotta F.A., and Wilson .I.W. (1994) Measurements of the
secondary particle energy spectra in the space Shuttle, Radiat. Meas. (to be published).
Badhwar, G.D., and O'Neill P.M. (1993), Time lag of twenty two year solar modulation.
In Proceedings of the 23rdlnternational Cosmic Ray Conference, 3, 535-539, Calgary.
Benton, E.V. (1983) Dosimetric radiation measurements in space. NucL Tracks Radiat.
Meas. 7, 1-11.
Benton, E.V. and Henke R.P. (1983) Radiation exposures during space flight and their
measurements. Adv. Space Res. 3, 171-185.
Benton, E.V. and Parnell, T.A. (1988) Space radiation dosimetry on U.S. and Soviet
Manned missions, in NATO ASI Series A, Life Sciences, 154, Terrestrail Space
Radiation and its Biological Effects, P.D. McCormack, C.E. Swenburg and H. Bucker,
eds. Plenum Press (1988), pp729-794.
V
V
V

18
Benton, E.V., Frank, A.L., Benton, E.R., Csige, I., Parnell, T.A., and Watts, J.W. Jr.
(1991), Radiation exposure ofLDEF: Intial results, Proceedings of LDEF: 69 Months in
Space, Kissimmee, Florida, June 2-8, 1991.
Csige, I., Benton, E.V., Frank, A.L., Figo, L.A., Benton, E.R., Pameel, T.A., and Watts,
J.W. Jr. (1991), Charged particle LET spectra measurements aboard LDEF, Proceedings
of LDEF: 69Months in Space, Kissimmee, Florida, June 3-8, 1991
Cucinotta, F.A (1993) Calculations of cosmic ray helium transport in shielding materials,
TP 3354, NASA, Washington, DC, also private communication September 1994.
Dudkin, VE., Potapov Yu. V., Akova A.B., Melkumyan L.V., E.V. Benton, and Frank
A.L. (1990) Differential neutron energy spectra measured on spacecraft in low earth orbit.
Nucl. Tracks Radiat. Meas. 17, 8%91.
Dudkin, V.E., Karpov O.N., Potapov Yu. V., Akopova A.B., Magradze N.V.,
Melkumyan L.V., and Rshtuni Sh. B. (1994) Study of the radiation environment on board
STS-55 and STS-57 by passive detectors method, In Proceedings of 12th International
Conference on Nuclear Tracks in Solids, Dubna, Russia, August 24-28.
Golightly, M.L, Hardy K., and Quam W. (1994) Radiation dosimetry measurements
during U.S. Space Shuttle missions with the RME-III, Radiat. Meas. 23, 25-42.
Keith, J.E., Badhwar G.D., and Lingstrom D.J (1992)Neutron spectrum and dose-
equivalent in shuttle flights during solar maximum, Nucl. Tracks Radiat. Meas. 20, 41-48.
Nguyen, V.D., Bouisset P., Parmentier N., et al. (1989) Real time quality factor and dose
equivalent meter "CIRCE" and its use on board the Soviet orbital station MIR. In Humans
in Earth Orbit and Planetary Exploration Missions, lnt. Acad. Astronaut. 8th Syrup.
Tashkent, Uzbekistan, U. S. S.R
Parnell, T.A., Watts J.W. Jr., Fishman G.J., Benton E.V., Frank A.L., and Greogory J.C.
(1986) The measured radiation environment within Spacelab 1 and 2 and comparisons
with predictions, Adv. Space Res., 6, 125-137.
Sawyer, D.M. and Vette J.I. (1976) AP-8 trapped proton environment for solar maximum
and minimum. Report NSSDC/WDC-A-R&S 76-06, NASA, Gbddard Space Flight
Center, Greenbelt, Maryland

17
Figure Captions
Figure 1: A schematic diagram of the charged particle telescope
Figure 2: A schematic diagram of the tissue equivalent proportional counter
Figure 3: Plots of the TEPC measured close rate, A1 single and A1A2 coincidence rate as
a function of the mission elapsed time.
Figure 4: Plot of the neutron energy spectrum measured using proton recoil technique.
Figure 5: Plot of the integral linear energy transfer spectrum using TEPC, CR-39, and
nuclear emulsions.
Figure 6: Plot of the trapped particle integral LET spectrum and comparison with model
calculations.
Figure 7: Plot of the GCR integral LET spectrum and comparison with model calculations.
V
V

AIA2
PSD 1 [25x25xO.OO3mm]
A1 [¢_25xlmm]
PSD 2 [25x25xO.OO3mm]
A2 [¢ 25x 1 ram]
B1 [¢_25x5mm]
B2 [¢_25x5mm]
B3 [¢_25x5mm]
B4 [¢_25xSmm]
B5 [e25x5mm]
B6 [_25x5mm]
A3 [_25x 1 mm]
PSD 3 [25x25xO.OO3mm]
CERENKOV
C DET
g
-J _I
E E F-
t- Go • _ -J._. O ZIZ ._
E _
\,, J
i "-":_::_::._::7_
",7':'.'. i,J
E "' '..:::.:h.?:. a
',' E "_ ..::.-:.:::,<:.:,:.:-_:,-r
m • o ,:-.:.:-:::.-:.: z'_ "- "" ':::_::':'::"::_"- T
a. _ ?:,-: .--
0
Z
n._J
L_J:E0n.
C_LdQ_(/)
r_
h-Or)
n.
Z0(.)
W
(1'1 "r
(.,)X
CI-J

-,_.j -II
J
q
J
I
_.-..ii =i@
E
---iI
7.i.i.1i
oc_
emu esoaL.(elnu!w)selo!Imd
0001. Xq pep!^!Pemu LV_.(elnu!w)SelO!1_ecl
OL Aq pep!^!p etch 8V LV

,!=,,,
,._ 106>
CqE0
e'-0l_
,.11..I= 105
W
104
STS-57
1.0 5.0
!
2.0
I
10
En, Neutron Energy, MeV r_j

J
..,11.
o,rot,
o3.
| I I It1111
Integral Flux, Number (cm 2 sr day) 1
l--im
m
(I)
(D
(-
I I IIIIHI
o,,,.,.,.t ,..,,,,.1 , ,.,.,,,I ,,,,.,.,I . ,,.,,,,I ,. _,.i..I I I lll).lJ[__l I IIHlll l [ I111
mQ

V
Integral Flux, Number (cm2 sr day) 1
I--iiill
:3
m
(tJE:(I)
"I::3
o o q, o o
V_--r!
0_

Integral Flux, Number (cm 2 sr day) 1
r- __" ! .."
m , ___
3
._.I
_-n
"M
= =

r
_ • _ _i I •
_r