0 March 1987 REGULATORY GUIDE - ulpeis.anl.gov · 0 U.S. NUCLEAR REGULATORY COMMISSION ... This...
39
0 U.S. NUCLEAR REGULATORY COMMISSION March 1987 )0C REGULATORY GUIDE r' OFFICE OF NUCLEAR REGULATORY RESEARCH REGULATORY GUIDE 3.59 (Task WM 407-4) METHODS FOR ESTIMATING RADIOACTIVE AND TOXIC AIRBORNE SOURCE TERMS FOR URANIUM MILLING OPERATIONS USNRC REGULATORY GUIDES Regulatory Guides are issued to describe and make available to the public methods acceptable to the NRC staff of Implementing specific parts of the Commission's regulations, to delineate tech niques used by the staff In evaluating specific problems or postu lated accidents or to provide guidance to applicants. Regulatory Guides are not substitutes for regulations, and compliance with them is not required. Methods and solutions different from those set out in the guides will be acceptable if they provide a basis for the findings requisite to the issuance or continuance of a permit or license by the Commission. -This guide was issued after consideration of comments received from the public. Comments and suggestions for improvements in these guides are encouraged at all times, and guides will be revised, as appropriate, to accommodate comments and to reflect new informa tion or experience. Written comments may be submitted to the Rules and Procedures Branch, DRR ADM, U.S. Nuclear Regulatory Commission, Washington, DC 20555. The guides are issued in the following ten broad divisions: 1. Power Reactors 6. Products 2. Research and Test Reactors 7. Transportation 3. Fuels and Materials Facilities 8. Occupational Health 4. Environmental and Siting 9. Antitrust and Financial Review 5. Materials and Plant Protection 10. General Copies of issued guides may be purchased from the Government Printing Office at the current GPO price. Information on current GPO prices may be obtained by contacting the Superintendent of Documents, U.S. Government Printing Office, Post Office Box 37082, Washington, DC 20013-7082, telephone (202)275-2060 or (202)275-2171. Issued guides may also be purchased from the National Technical Information Service on a standing order basis. Details on this service may be obtained by writing NTIS, 5285 Port Royal Road, Springfield, VA 22161. 11-1 , ****41
Transcript of 0 March 1987 REGULATORY GUIDE - ulpeis.anl.gov · 0 U.S. NUCLEAR REGULATORY COMMISSION ... This...
0 U.S. NUCLEAR REGULATORY COMMISSION March 1987
)0C REGULATORY GUIDE r' OFFICE OF NUCLEAR REGULATORY RESEARCH
REGULATORY GUIDE 3.59 (Task WM 407-4)
METHODS FOR ESTIMATING RADIOACTIVE AND TOXIC AIRBORNE SOURCE TERMS FOR URANIUM MILLING OPERATIONS
USNRC REGULATORY GUIDES
Regulatory Guides are issued to describe and make available to the public methods acceptable to the NRC staff of Implementing specific parts of the Commission's regulations, to delineate techniques used by the staff In evaluating specific problems or postulated accidents or to provide guidance to applicants. Regulatory Guides are not substitutes for regulations, and compliance with them is not required. Methods and solutions different from those set out in the guides will be acceptable if they provide a basis for the findings requisite to the issuance or continuance of a permit or license by the Commission.
-This guide was issued after consideration of comments received from the public. Comments and suggestions for improvements in these guides are encouraged at all times, and guides will be revised, as appropriate, to accommodate comments and to reflect new information or experience.
Written comments may be submitted to the Rules and Procedures Branch, DRR ADM, U.S. Nuclear Regulatory Commission, Washington, DC 20555.
The guides are issued in the following ten broad divisions:
1. Power Reactors 6. Products 2. Research and Test Reactors 7. Transportation 3. Fuels and Materials Facilities 8. Occupational Health 4. Environmental and Siting 9. Antitrust and Financial Review 5. Materials and Plant Protection 10. General
Copies of issued guides may be purchased from the Government Printing Office at the current GPO price. Information on current GPO prices may be obtained by contacting the Superintendent of Documents, U.S. Government Printing Office, Post Office Box 37082, Washington, DC 20013-7082, telephone (202)275-2060 or (202)275-2171.
Issued guides may also be purchased from the National Technical Information Service on a standing order basis. Details on this service may be obtained by writing NTIS, 5285 Port Royal Road, Springfield, VA 22161.
11-1 , ****41
TABLE OF CONTENTS
SSection Page
A. INTRODUCTION ...................................................... 3.59-1
B. DISCUSSION ........................................................ 3.59-2
1. Need for Source Terms ......................................... 3.59-2 2. Identification and Description of Release Points .............. 3.59-4
2.1 Ore Storage .............................................. 3.59-4 2.2 Ore Crushing and Grinding ................................ 3.59-4 2.3 Ore Processing ........................................... 3.59-6 2.4 Yellowcake Production, Drying, and Packaging ............. 3.59-6 2.5 Tailings Impoundment ..................................... 3.59-6 2.6 Heap Leaching ............................................ 3.59-6 2.7 Ore Leaching in Situ ..................................... 3.59-7
3. Use of This Guide ............................................. 3.59-7
C. REGULATORY POSITION ............................................... 3.59-8
1. Radioactive Particle Emission Source Terms .................... 3.59-8
1.1 Process Emissions ........................................ 3.59-8 1.2 Windblown Emissions ...................................... 3.59-11 1.3 Parameter Selection ...................................... 3.59-14
2. Radon Emission Source Term .................................... 3.59-14
2.1 Run-of-Mine Ore Storage .................................. 3.59-15 2.2 Hopper, Feeder, Crushing, and Grinding ................... 3.59-15 2.3 Leaching and Extraction .................................. 3.59-15 2.4 Yellowcake Drying and Packaging .......................... 3.59-15 2.5 Tailings Disposal ........................................ 3.59-15 2.6 Radon Release During in Situ Operations .................. 3.59-16
3. Nonradioactive Emission Source Terms .......................... 3.59-20
3.1 Nonradioactive Particulate Emission Source Terms ......... 3.59-21 3.2 Windblown Emissions ...................................... 3.59-21 3.3 Nonradioactive Gas Emission Source Terms ................ 3.59-22
D. IMPLEMENTATION .................................................... 3.59-24
APPENDIX A Principal Primary Parameters Needed to Estimate Source Terms for Uranium Mill Operations ......................... 3.59-25
APPENDIX B Emission Factors ..................................... 3.59-29 APPENDIX C Particulate Emission Reduction Factors for Ore Processing 3.59-30 APPENDIX D Emission Factors from Fuel Combustion Without Emission
Control ................................................... 3.59-31
iii
TABLE OF CONTENTS (Continued)
Section
REFERENCES ............................................................
BIBLIOGRAPHY ..........................................................
VALUE/IMPACT STATEMENT ................................................
LIST OF FIGURES
Figure
1 Decay Scheme for Uranium-238 ......................................
2 Block Flow Diagram for Uranium Milling Processes ..................
LIST OF TABLES
Table
Parameters for Calculating Annual Dusting Rate for Exposed Tailings Sands ....................................................
Parameters for Calculating Example Tailings Emission Factor .......
Parameters for Determining Radon Release from in Situ Mining ......
Nonradioactive Emissions Generated by Uranium Milling .............
Chemical Airborne Release Factors for Acid Leach Mill .............
3.59-11
3.59-12
3.59-17
3.59-20
3.59-23
iv
Page
3.59-32
3.59-34
3.59-36
3.59-3
3.59-5
1
2
3
4
5
A. INTRODUCTION
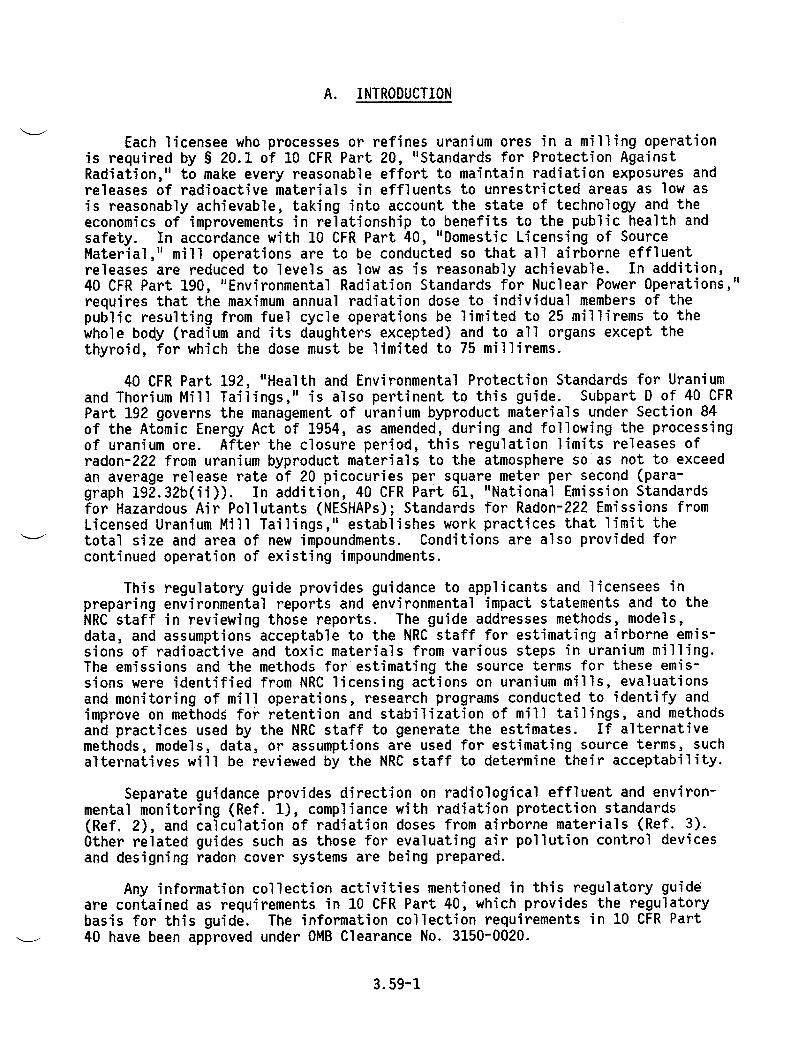
Each licensee who processes or refines uranium ores in a milling operation is required by § 20.1 of 10 CFR Part 20, "Standards for Protection Against Radiation," to make every reasonable effort to maintain radiation exposures and releases of radioactive materials in effluents to unrestricted areas as low as is reasonably achievable, taking into account the state of technology and the economics of improvements in relationship to benefits to the public health and safety. In accordance with 10 CFR Part 40, "Domestic Licensing of Source Material," mill operations are to be conducted so that all airborne effluent releases are reduced to levels as low as is reasonably achievable. In addition, 40 CFR Part 190, "Environmental Radiation Standards for Nuclear Power Operations," requires that the maximum annual radiation dose to individual members of the public resulting from fuel cycle operations be limited to 25 millirems to the whole body (radium and its daughters excepted) and to all organs except the thyroid, for which the dose must be limited to 75 millirems.
40 CFR Part 192, "Health and Environmental Protection Standards for Uranium and Thorium Mill Tailings," is also pertinent to this guide. Subpart D of 40 CFR Part 192 governs the management of uranium byproduct materials under Section 84 of the Atomic Energy Act of 1954, as amended, during and following the processing of uranium ore. After the closure period, this regulation limits releases of radon-222 from uranium byproduct materials to the atmosphere so as not to exceed an average release rate of 20 picocuries per square meter per second (paragraph 192.32b(ii)). In addition, 40 CFR Part 61, "National Emission Standards for Hazardous Air Pollutants (NESHAPs); Standards for Radon-222 Emissions from Licensed Uranium Mill Tailings," establishes work practices that limit the total size and area of new impoundments. Conditions are also provided for continued operation of existing impoundments.
This regulatory guide provides guidance to applicants and licensees in preparing environmental reports and environmental impact statements and to the NRC staff in reviewing those reports. The guide addresses methods, models, data, and assumptions acceptable to the NRC staff for estimating airborne emissions of radioactive and toxic materials from various steps in uranium milling. The emissions and the methods for estimating the source terms for these emissions were identified from NRC licensing actions on uranium mills, evaluations and monitoring of mill operations, research programs conducted to identify and improve on methods for retention and stabilization of mill tailings, and methods and practices used by the NRC staff to generate the estimates. If alternative methods, models, data, or assumptions are used for estimating source terms, such alternatives will be reviewed by the NRC staff to determine their acceptability.
Separate guidance provides direction on radiological effluent and environmental monitoring (Ref. 1), compliance with radiation protection standards (Ref. 2), and calculation of radiation doses from airborne materials (Ref. 3). Other related guides such as those for evaluating air pollution control devices and designing radon cover systems are being prepared.
Any information collection activities mentioned in this regulatory guide are contained as requirements in 10 CFR Part 40, which provides the regulatory basis for this guide. The information collection requirements in 10 CFR Part 40 have been approved under OMB Clearance No. 3150-0020.
3.59-1
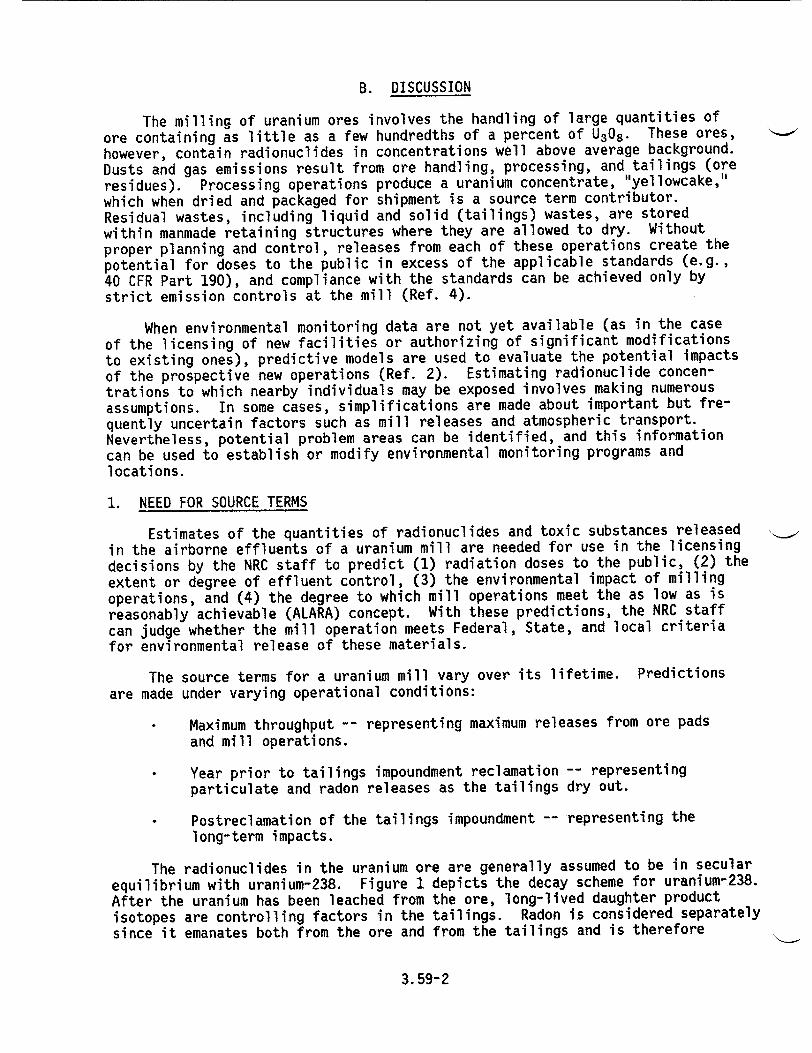
B. DISCUSSION
The milling of uranium ores involves the handling of large quantities of ore containing as little as a few hundredths of a percent of U308 . These ores, however, contain radionuclides in concentrations well above average background. Dusts and gas emissions result from ore handling, processing, and tailings (ore residues). Processing operations produce a uranium concentrate, "yellowcake," which when dried and packaged for shipment is a source term contributor. Residual wastes, including liquid and solid (tailings) wastes, are stored within manmade retaining structures where they are allowed to dry. Without proper planning and control, releases from each of these operations create the potential for doses to the public in excess of the applicable standards (e.g., 40 CFR Part 190), and compliance with the standards can be achieved only by strict emission controls at the mill (Ref. 4).
When environmental monitoring data are not yet available (as in the case of the licensing of new facilities or authorizing of significant modifications to existing ones), predictive models are used to evaluate the potential impacts of the prospective new operations (Ref. 2). Estimating radionuclide concentrations to which nearby individuals may be exposed involves making numerous assumptions. In some cases, simplifications are made about important but frequently uncertain factors such as mill releases and atmospheric transport. Nevertheless, potential problem areas can be identified, and this information can be used to establish or modify environmental monitoring programs and locations.
1. NEED FOR SOURCE TERMS
Estimates of the quantities of radionuclides and toxic substances released in the airborne effluents of a uranium mill are needed for use in the licensing decisions by the NRC staff to predict (1) radiation doses to the public, (2) the extent or degree of effluent control, (3) the environmental impact of milling operations, and (4) the degree to which mill operations meet the as low as is reasonably achievable (ALARA) concept. With these predictions, the NRC staff can judge whether the mill operation meets Federal, State, and local criteria for environmental release of these materials.
The source terms for a uranium mill vary over its lifetime. Predictions are made under varying operational conditions:
Maximum throughput -- representing maximum releases from ore pads and mill operations.
Year prior to tailings impoundment reclamation -- representing particulate and radon releases as the tailings dry out.
Postreclamation of the tailings impoundment -- representing the long-term impacts.
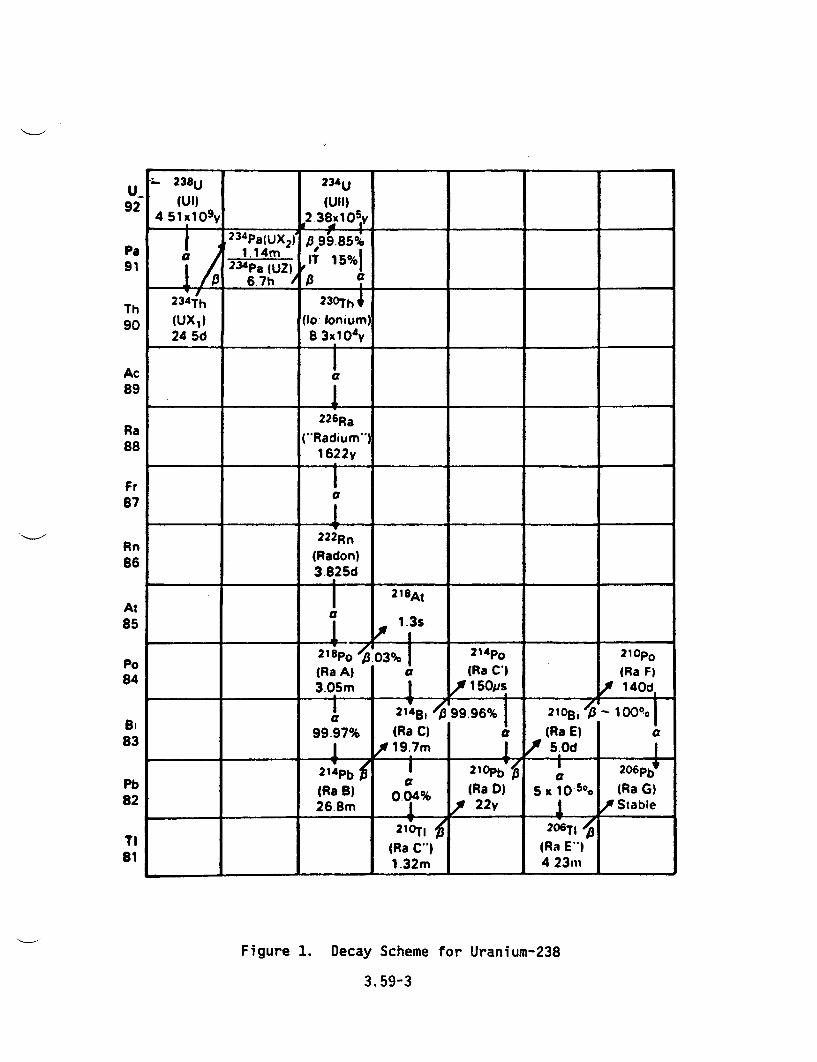
The radionuclides in the uranium ore are generally assumed to be in secular equilibrium with uranium-238. Figure 1 depicts the decay scheme for uranium-238. After the uranium has been leached from the ore, long-lived daughter product isotopes are controlling factors in the tailings. Radon is considered separately since it emanates both from the ore and from the tailings and is therefore
3.59-2
-238 U 234U UUI
92 (Ulf (Uli) 4 510•09Y t2-380lO,
i~/ "234Pa(UX2) •, 99.85% Pa 1.14m 2 10 %I
91 2 'Pa46UZ) IT a I 1A 6.7h ý13
Th 2 2hTh
90 (UX 1 ) (DO Ionium 24 5d 8 3x0 4y
Ac a 89__
2 2 6 Ra Ra C"Radium" 881622y
Fr 87 a
Rn 2 2 2 Rn 86 (Radon)
3.825d 2 18At
At a 85 1.3s.
21Bp o03 214P 21°Ph
P84 (Ra A) a (Ra C*) (Ra F)
3.05m I I I5ops 140d 2 14B, f399.96% 210 8, 1'OO O
83 99-97% (Ra C) a (Ra E) a 19.7m SOd
i 21op2 , 1 3 O; 206pb Pb (Ra B) 0.04% (Ra D) 5 K 10.5% (Ra G) 82 26.8m 22y Stable
TI 210TI (
81 (Ra C") (Ra E" 81 1.32m 4 23m
Figure 1. Decay Scheme for Uranium-238
3.59-3
released to the environment independently from other radioisotopes of the uranium decay chain. Thus, since models used in predicting radiological and environmental impact include the impacts of the short-lived decay products from longer-lived radionuclides, source term estimates for natural uranium, uranium-238, thorium-230, radium-226, lead-210, and radon-222 provide a sufficient base. Since the uranium-235 in natural uranium represents only about 0.7 percent of natural uranium, radionuclides from its decay chain contribute only a small fraction of the total radioactivity for natural uranium and thus are not included in the source term estimates.
Uranium ores usually contain small amounts of toxic elements such as arsenic, barium, cadmium, chromium, lead, mercury, selenium, and silver. The release of these elements is also included in source term estimates.
2. IDENTIFICATION AND DESCRIPTION OF RELEASE POINTS
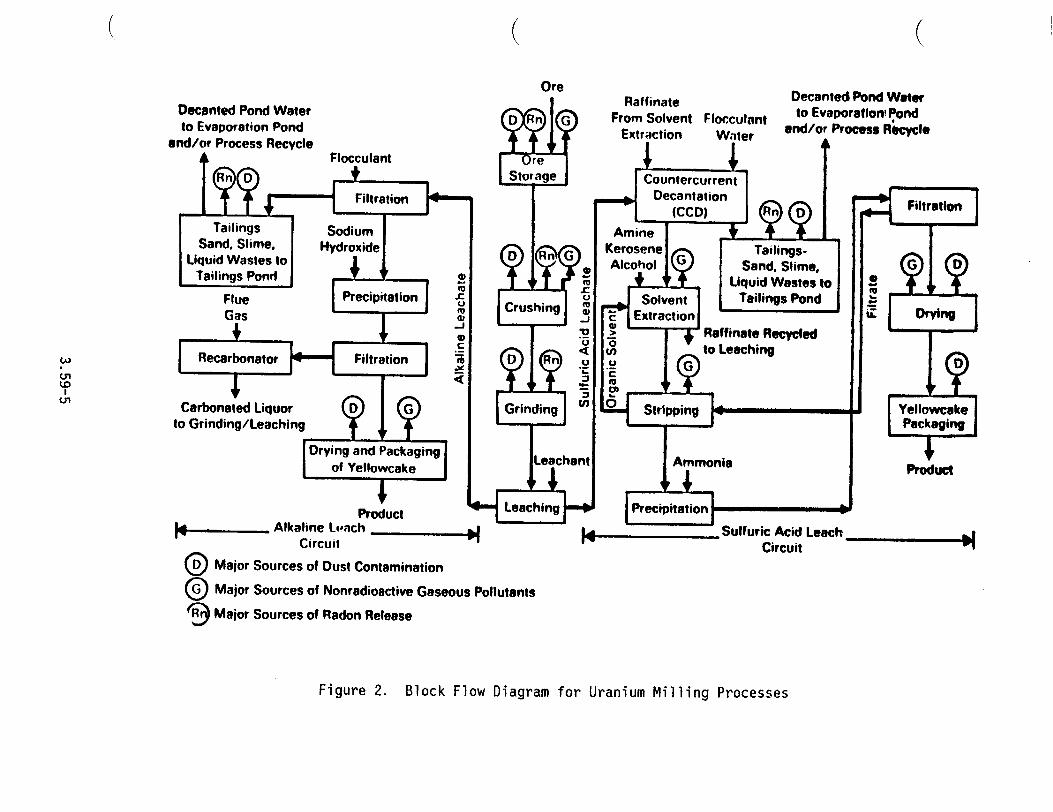
Radioactive and nonradioactive dusts and gases are released from several steps in uranium mill processes. Figure 2 shows the major processing steps and the airborne release sources for a typical uranium mill. These steps and sources are described in the following sections. Methods for estimating quantities released are discussed in the regulatory position of this guide.
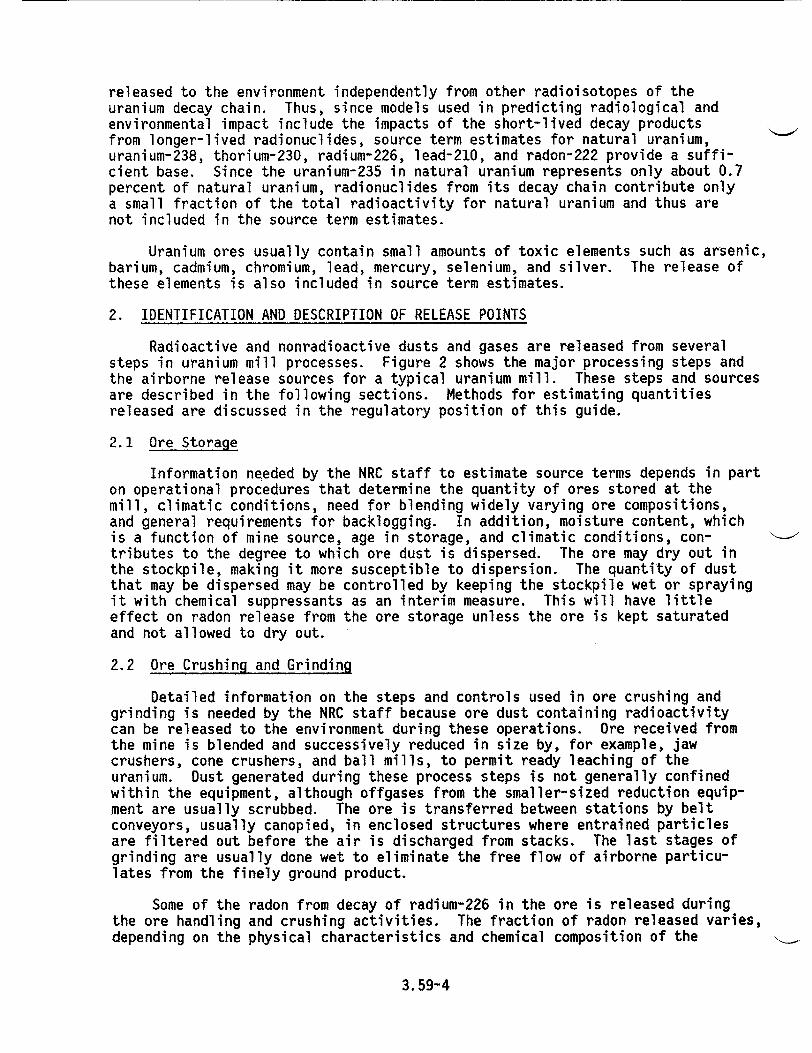
2.1 Ore Storage
Information needed by the NRC staff to estimate source terms depends in part on operational procedures that determine the quantity of ores stored at the mill, climatic conditions, need for blending widely varying ore compositions, and general requirements for backlogging. In addition, moisture content, which is a function of mine source, age in storage, and climatic conditions, contributes to the degree to which ore dust is dispersed. The ore may dry out in the stockpile, making it more susceptible to dispersion. The quantity of dust that may be dispersed may be controlled by keeping the stockpile wet or spraying it with chemical suppressants as an interim measure. This will have little effect on radon release from the ore storage unless the ore is kept saturated and not allowed to dry out.
2.2 Ore Crushing and Grinding
Detailed information on the steps and controls used in ore crushing and grinding is needed by the NRC staff because ore dust containing radioactivity can be released to the environment during these operations. Ore received from the mine is blended and successively reduced in size by, for example, jaw crushers, cone crushers, and ball mills, to permit ready leaching of the uranium. Dust generated during these process steps is not generally confined within the equipment, although offgases from the smaller-sized reduction equipment are usually scrubbed. The ore is transferred between stations by belt conveyors, usually canopied, in enclosed structures where entrained particles are filtered out before the air is discharged from stacks. The last stages of grinding are usually done wet to eliminate the free flow of airborne particulates from the finely ground product.
Some of the radon from decay of radium-226 in the ore is released during the ore handling and crushing activities. The fraction of radon released varies, depending on the physical characteristics and chemical composition of the
3.59-4
Ore Raffinate Decanted Pond Water Decanted Pond Water From Solvent Floeculant to Evaporation, Pond to Evaporation Pond Extraction Water and/or Process Rfch"l
and/or Process Recycle Flocclantre
Sto age Countercurrent Filtration Decantation Fili
TT(CCD) Fi t TalnsSodium Ami ne
SadSime. 'yd ,nd S iHydroxide Kerosene Tailings.
Liqidas ton , Alcohol Sand, Slime,
Liquid Wastes to Flue Precipitation C rSolvent Tailings Pond
Crasin Extraction
0
Recarbonator Filtration 0 Rn u G
Carbonated Liquor D Grinding Stripping to Grinding/Leaching
P Drying and Packaging Leachant
of Yellowcake 1 Amoi Pr
Product ' Leaching Precipitation Alkaline Leanch 4 I. Sulfuric Acid Leach
Circuit Circuit G Major Sources of Dust Contamination
Major Sources of Nonradioactive Gaseous Pollutants
- Major Sources of Radon Release
Figure 2. Block Flow Diagram for Uranium Milling Processes
/
ore. Although radon-222 (the primary radon isotope released from uranium ores) is chemically inert and has a short half-life (3.8 days), its decay products reach secular equilibrium quickly and are dispersed and are therefore subject to being breathed in by man and animals.
2.3 Ore Processing
For ore processing operations conducted in solutions or slurries, particulate emissions are negligible and therefore present little hazard. However, nonradioactive gaseous effluents consisting of carbon dioxide, sulfur dioxide, water vapor, and sulfuric acid mist from the leaching step, some of which are toxic, could be released. Organic chemical vapors consisting of kerosene with small amounts of amine and alcohol are released from the open solvent extraction settling chambers. Ion exchange processes are enclosed and chemical vapor releases are negligible.
2.4 Yellowcake Production, Drying, and Packaging
The potential for particulate releases during uranium concentrate (yellowcake) production depends on the degree to which the product is dried or calcined and on the effectiveness of offgas filtration. Particulate releases from the drying, calcination, and packaging steps are dependent on the control used to prevent release of excessive amounts of uranium in the offgases. Offgases are scrubbed or filtered prior to release via a stack.
Since the ore processing steps reject nearly all the radium to the tailings, very little radon is released during the production of yellowcake. However, yellowcake drying and packaging present a potential for particulate release and are therefore of concern in terms of this guide.
2.5 Tailings Impoundment
The processing of ore in uranium mills generates radioactive and nonradioactive waste generally referred to as tailings, which consist of the majority of the ore solids, process additives, and water. The industry uses different methods for storage of these tailings. The tailings together with the earthen dams or cells that contain these wastes are referred to as impoundments, and the impounded liquids are called tailings ponds. Depending on the procedure for disposing of the tailings in the impoundments, the significant airborne releases consist of the coarse sand solids, the finer slime solids, and the radon gas. Fugitive dust can be reduced by frequent wetting, application of chemical suppressants, or other physical strategies. Radon releases are more difficult to control because of the nature of radon gas. Interim reclamation, increased water cover, and below-grade design are some of the means by which radon release can be attenuated.
2.6 Heap Leaching
Heap leaching involves leaching low-grade ore (<0.04% U308) either by gravitational flow of the leachant through an open pile or by flooding a confined ore pile (Ref. 4). The leachate is treated on site by ion exchange or solvent extraction, and a crude yellowcake that may be shipped to a nearby mill for refinement is precipitated. When the ore dumps are reasonably near a mill, acid solutions from the mill may be used for the heap leaching and returned to the mill circuit for processing (Ref. 5).
3.59-6
Heap leaching has little impact on airborne environmental impacts. Radon-222 and its decay products are released and dispersed. The leached ore may be mixed with mill tailings. If the tailings are maintained as an isolated leached ore pile, control of fugitive dust is required.
2.7 Ore Leaching in Situ
Low-grade. ores can be leached in situ by using a network of wells to inject a leach solution into the ore formation, mobilizing the uranium through formation of a soluble complex uranium salt, and removing the pregnant solution from the ore body through production wells. The uranium that has been made soluble is recovered by uranium mill processing operations producing yellowcake.
Radioactive airborne releases from in situ leaching are primarily limited to radon emanations from the solution resulting from the leaching of the ore. Some releases may occur from yellowcake dryers and packaging if such operations are present on site. Airborne releases from the chemical processing steps are comparable to those encountered during conventional mill operations.
Solid wastes that require controlled disposal are generated; however, the volume produced is much less than that created by conventional uranium mining and milling. Dried evaporative ponds can contain residual radionuclides and toxic minerals leached along with the uranium. If disposed to the tailings pond at a conventional mill, the waste solutions will be only a minor increment to the tailings impoundment system.
3. USE OF THIS GUIDE
Present NRC staff practice for estimating radioactive airborne release rates (source terms) from uranium milling facilities involves the characterization of such releases by radionuclide, particle size, and density (Ref. 4). These data, when combined with a meteorological dispersion model representing the annual average meteorological conditions of the mill site, provide a basis by which the NRC staff can estimate concentrations, which in turn are used to calculate radiation doses as described in Reference 3.
The primary calculational tool used by the NRC staff in evaluating the radiological impact of uranium milling operations is the MILDOS code (Ref. 6). As used by the NRC staff, the MILDOS code has only five primary radionuclides in the uranium-238 decay chain that are treated explicitly as source terms. These radionuclides are uranium-238, thorium-230, radium-226, lead-210, and radon-222. Release rates are required for these radionuclides for each potential release source. The code accounts for releases and ingrowth of other radionuclides, assuming secular equilibrium. For radon-222 decay products, which grow in during transport of radon-222 from the site, the code calculates the resulting ingrowth. These radon-222 daughters include polonium-218, lead-214, bismuth-214, lead-210, and polonium-210.
This guide provides technical guidance concerning methods, models, data, and assumptions acceptable to the NRC staff for estimating airborne emissions of radioactive and toxic materials from various steps in uranium milling. If alternative methods, models, data, or assumptions are used in estimating source terms, such alternatives will be reviewed by the NRC staff to determine their acceptability.
3.59-7
C. REGULATORY POSITION
Methods described below for estimating radioactive and nonradioactive source terms from uranium milling operations and tailings disposal reflect the approaches used by the NRC staff. Certain bases and assumptions used in making acceptable calculations are identified and explained. Nonradioactive particulate emission source terms may be estimated in the same way as radioactive particulate emissions, with an estimate of the toxic element composition of the ore (or tailings). Estimates of nonradioactive gas emissions from process operations are based on raw material and fuel uses. Principal parameters needed to estimate source terms are listed in Appendix A to this guide.
1. RADIOACTIVE PARTICLE EMISSION SOURCE TERMS
The major particle emission sources at a uranium mill include ore handling, ore storage, crushing and grinding, yellowcake production (especially drying and packaging), and tailings piles. Much of the data useful in calculating source terms is enumerated in Appendix A to Reference 3 and in Appendices A, B, and C to Regulatory Guide 3.8, "Preparation of Environmental Reports for Uranium Mills." Information from the applicant needed by the NRC staff to estimate source terms is listed in Appendix A to this guide. The general method for calculating source terms is to multiply together the normalized emission rate, contaminant content, emission control factor, and processing rate for each process being evaluated. The following discussion shows typical equations and example calculations used by the NRC staff for process and windblown emissions typical of uranium mills.
1.1 Process Emissions
Processes releasing particles include ore handling, grinding and crushing, conveying, and yellowcake drying and packaging.
The basic equation is:
S = MCEN(1 - R) (1)
where
S is the source term, quantity/time, e.g., kg 2 38U/hr; Ci 238 U/yr;
M is the process rate, mass/time, e.g., metric ton ore/d;
C is the contaminate concentration, percent, pCi/g uranium, or ppm of toxic elements in ore;
E is the emission factor for process, dust released per metric ton of ore dumped to the grizzly;
N is the unitless activity enrichment ratio; and
R is the unitless emission control factor.
The unitless activity enrichment ratio, N, expresses the extent to which the contaminant concentration is higher in the suspended airborne particles that are larger than 20 pm in diameter than in the bulk material. The NRC staff uses
3.59-8
N = 2.5, conservatively based on measured values (Refs. 7 and 8) in which the content of uranium-238 and its progeny in fines* was found to be up to 2.5 times higher than the content in the bulk ore. The emission factor, E, is tabulated for various common operations in Appendix B to this guide. The unitless reduction factor, R, is tabulated in Appendix C for various control measures. Examples of calculating particle source terms follow.
1.1.1 Example Calculation: Crushing
The source terms for radionuclides in the chain for uranium-238 decay are the same as that for uranium-238 since they are in secular equilibrium. The following parameters are supplied by the applicant:
M = 145,000 MT processed/yr
C = 420 pCi 2 3 8U/g bulk ore
N = 2.5 times greater 2 3 8U content in dust than in bulk ore
The emission control device is a baghouse with an expected efficiency of about 80 percent for the dust produced by the operation. The applicant has determined that the moisture content of the stored ore at the time of crushing is 7 wt-%. Because tertiary crushing is not used, the estimated uncontrolled emission factor, E, from Appendix B is 0.16 lb/ton. The estimated uranium-238 source term, using Equatioh (1), is:
S = 145,000 MT/yr x 420 pCi/g x 0.16 lb/ton x 2.5 x (1 - 0.80) x 1.1025 ton/MT x 454 g/lb x l0-12 Ci/pCi
= 2.4 x 10⁻³ Ci/yr
1.1.2 Example Calculation: Truck Unloading to Ore Pad
The ore processing rate, M, is 193,000 MT/yr. The bulk ore content, C, of uranium-238 and progeny in secular equilibrium is 435 pCi/g. The ore is enddumped from a truck. No control measures are used. Thus, the emission factor, E, is 0.04 lb/yd3 , based on Appendix B. The bulk density of the ore is 1.5 ton/yd3 . The dust/ore specific activity ratio, N, is 2.5, and the source term for uranium-238 and progeny, using Equation (1), is:
S = 193,000 MT/yr x 435 pCi/g x 0.04 lb/yd3 x 1 yd3/1.5 ton x 1.1025 ton/MT x 454 g/lb x 2.5 x 10⁻¹² Ci/pCi
= 2.8 x 10⁻³ Ci/yr
1.1.3 Example Calculation: Fine Ore Storage
In this case, the fine ore is conveyed to and from the fine ore storage area for a total of four conveyor transfers. Ore is handled at a rate of 135,000 MT/yr, and the bulk uranium-238 and progeny content is 350 pCi/g. The 2.5 dust/ore activity ratio is applied. The operation occurs in an enclosed structure with a reduction factor of 75 percent based on engineering judgment (Appendix C). The emission factor for each transfer is 0.023 lb/ton (Appendix B). The combined emission factor for the fine ore storage conveying is:
*<100 pm in diameter.
3.59-9
E = 4 transfers x 0.023 lb/ton per transfer = 0.092 lb/ton
The uranium-238 and progeny source term is then:
S = 135,000 MT/yr x 350 pCi/g x 0.092 lb/ton x 1.1025 ton/MT x 454 g/lb x 10-12 Ci/pCi x (1 - 0.75) x 1
= 5.4 x 10⁻² Ci/yr
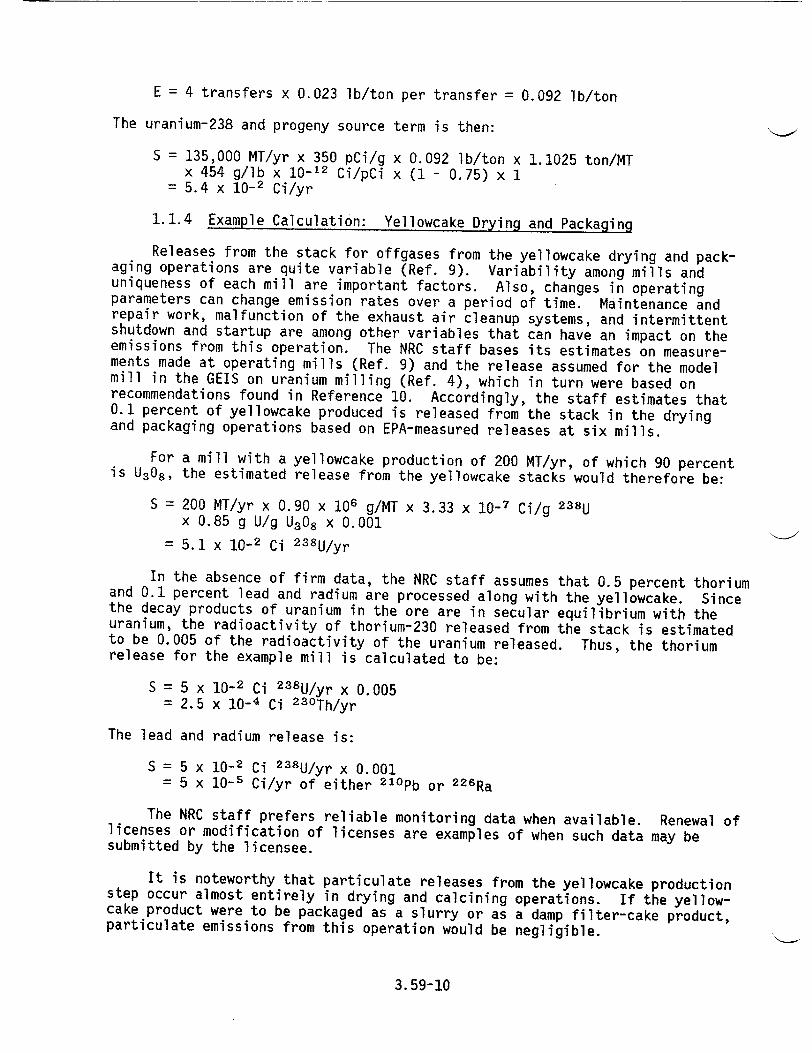
1.1.4 Example Calculation: Yellowcake Drying and Packaging
Releases from the stack for offgases from the yellowcake drying and packaging operations are quite variable (Ref. 9). Variability among mills and uniqueness of each mill are important factors. Also, changes in operating parameters can change emission rates over a period of time. Maintenance and repair work, malfunction of the exhaust air cleanup systems, and intermittent shutdown and startup are among other variables that can have an impact on the emissions from this operation. The NRC staff bases its estimates on measurements made at operating mills (Ref. 9) and the release assumed for the model mill in the GEIS on uranium milling (Ref. 4), which in turn were based on recommendations found in Reference 10. Accordingly, the staff estimates that 0.1 percent of yellowcake produced is released from the stack in the drying and packaging operations based on EPA-measured releases at six mills.
For a mill with a yellowcake production of 200 MT/yr, of which 90 percent is U3 08 , the estimated release from the yellowcake stacks would therefore be:
S = 200 MT/yr x 0.90 x 10⁶ g/MT x 3.33 x 10⁻⁷ Ci/g 2 38 U x 0.85 g U/g U3 08 x 0.001
= 5.1 x 10⁻² Ci 2 3 8U/yr
In the absence of firm data, the NRC staff assumes that 0.5 percent thorium and 0.1 percent lead and radium are processed along with the yellowcake. Since the decay products of uranium in the ore are in secular equilibrium with the uranium, the radioactivity of thorium-230 released from the stack is estimated to be 0.005 of the radioactivity of the uranium released. Thus, the thorium release for the example mill is calculated to be:
S = 5 x 10⁻² Ci 2 3 8U/yr x 0.005
= 2.5 x 10⁻⁴ Ci 2 3 °Th/yr
The lead and radium release is:
S = 5 x 10⁻² Ci 2 3 8 U/yr x 0.001 = 5 x 10⁻⁵ Ci/yr of either 2 1°Pb or 226Ra
The NRC staff prefers reliable monitoring data when available. Renewal of licenses or modification of licenses are examples of when such data may be submitted by the licensee.
It is noteworthy that particulate releases from the yellowcake production step occur almost entirely in drying and calcining operations. If the yellowcake product were to be packaged as a slurry or as a damp filter-cake product, particulate emissions from this operation would be negligible.
3.59-10
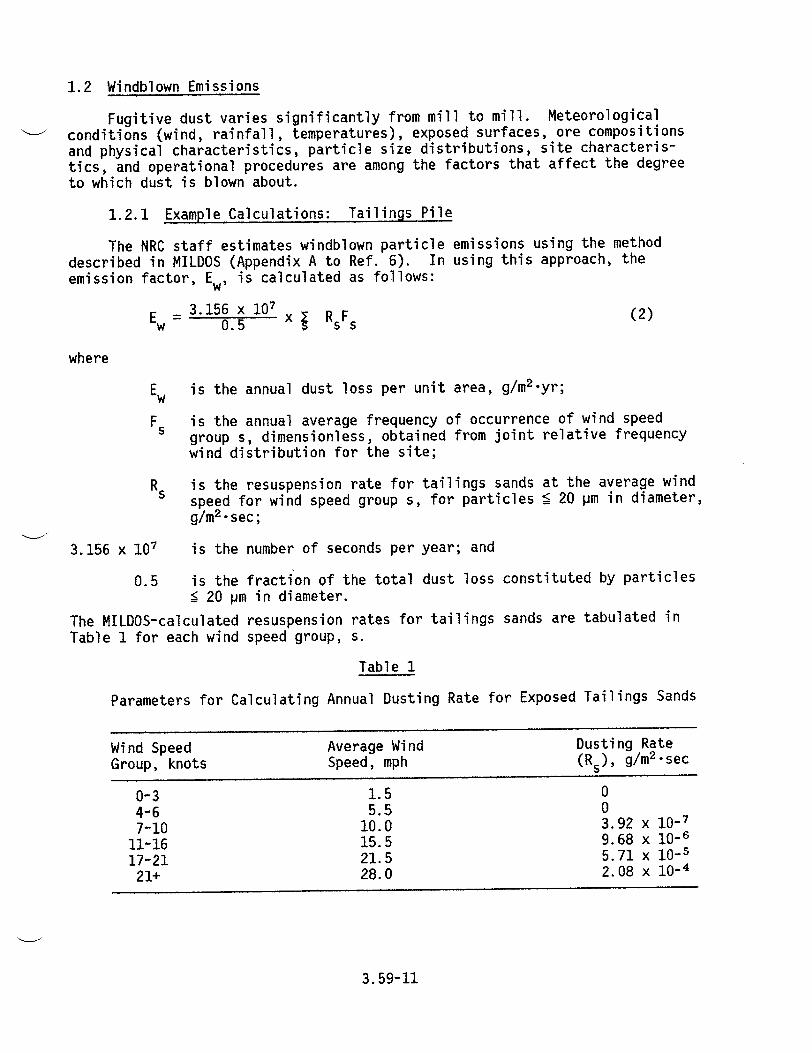
1.2 Windblown Emissions
Fugitive dust varies significantly from mill to mill. Meteorological - conditions (wind, rainfall, temperatures), exposed surfaces, ore compositions
and physical characteristics, particle size distributions, site characteristics, and operational procedures are among the factors that affect the degree to which dust is blown about.
1.2.1 Example Calculations: Tailings Pile
The NRC staff estimates windblown particle emissions using the method described in MILDOS (Appendix A to Ref. 6). In using this approach, the emission factor, Ew, is calculated as follows:
Ew 3.156 x 10 (2)
= 0.5 x s RsF(
where
Ew is the annual dust loss per unit area, g/m 2 -yr;
F is the annual average frequency of occurrence of wind speed group s, dimensionless, obtained from joint relative frequency wind distribution for the site;
R s is the resuspension rate for tailings sands at the average wind speed for wind speed group s, for particles ! 20 pm in diameter, g/m 2.sec;
3.156 x 10⁷ is the number of seconds per year; and
0.5 is the fraction of the total dust loss constituted by particles • 20 pm in diameter.
The MILDOS-calculated resuspension rates for tailings sands are tabulated in Table 1 for each wind speed group, s.
Table 1
Parameters for Calculating Annual Dusting Rate for Exposed Tailings Sands
Wind Speed Average Wind Dusting Rate Group, knots Speed, mph (Rs), g/m 2 "sec
0-3 1.5 0 4-6 5.5 0 7-10 10.0 3.92 x 10⁻⁷
11-16 15.5 9.68 x 10⁻⁶ 17-21 21.5 5.71 x 10⁻⁵
21+ 28.0 2.08 x 10⁻⁴
3.59-11
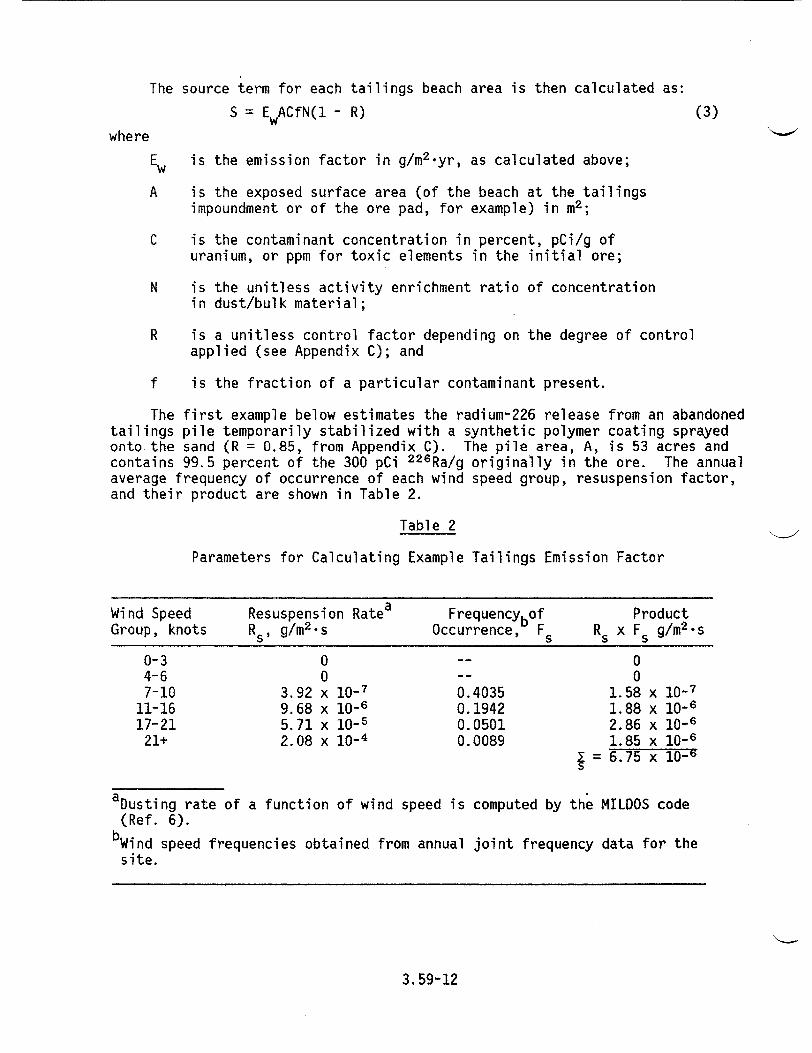
The source term for each tailings beach area is then calculated as:
S = E w ACfN(1 - R)
where
(3)
E w is the emission factor in g/m2 .yr, as calculated above;
A is the exposed surface area (of the beach at the tailings impoundment or of the ore pad, for example) in mi2 ;
C is the contaminant concentration in percent, pCi/g of uranium, or ppm for toxic elements in the initial ore;
N is the unitless activity enrichment ratio of concentration in dust/bulk material;
R is a unitless control factor depending on the degree of control applied (see Appendix C); and
f is the fraction of a particular contaminant present.
The first example below estimates the radium-226 release from an abandoned tailings pile temporarily stabilized with a synthetic polymer coating sprayed onto the sand (R = 0.85, from Appendix C). The pile area, A, is 53 acres and contains 99.5 percent of the 300 pCi 2 2 6 Ra/g originally in the ore. The annual average frequency of occurrence of each wind speed group, resuspension factor, and their product are shown in Table 2.
Table 2
Parameters for Calculating Example Tailings Emission Factor
Wind Speed Resuspension Ratea FrequencYbof Product Group, knots Rs, g/m 2 -s Occurrence, Fs Rs x F g/m 2 -s
0 0
3.92 x I0-7 9.68 x 10⁻⁶ 5.71 x I0-5 2.08 x I0-4
0.4035 0.1942 0.0501 0.0089
0 0
1.58 x I0-7 1.88 x 10⁻⁶ 2.86 x 10⁻⁶ 1.85 x 10-6
= 6.75 x 10⁻⁹
aDusting rate of a function of wind speed is computed by the MILDOS code (Ref. 6).
bWind speed frequencies obtained from annual joint frequency data for the
site.
3.59-12
0-3 4-6 7-10
11-16 17-21
21+
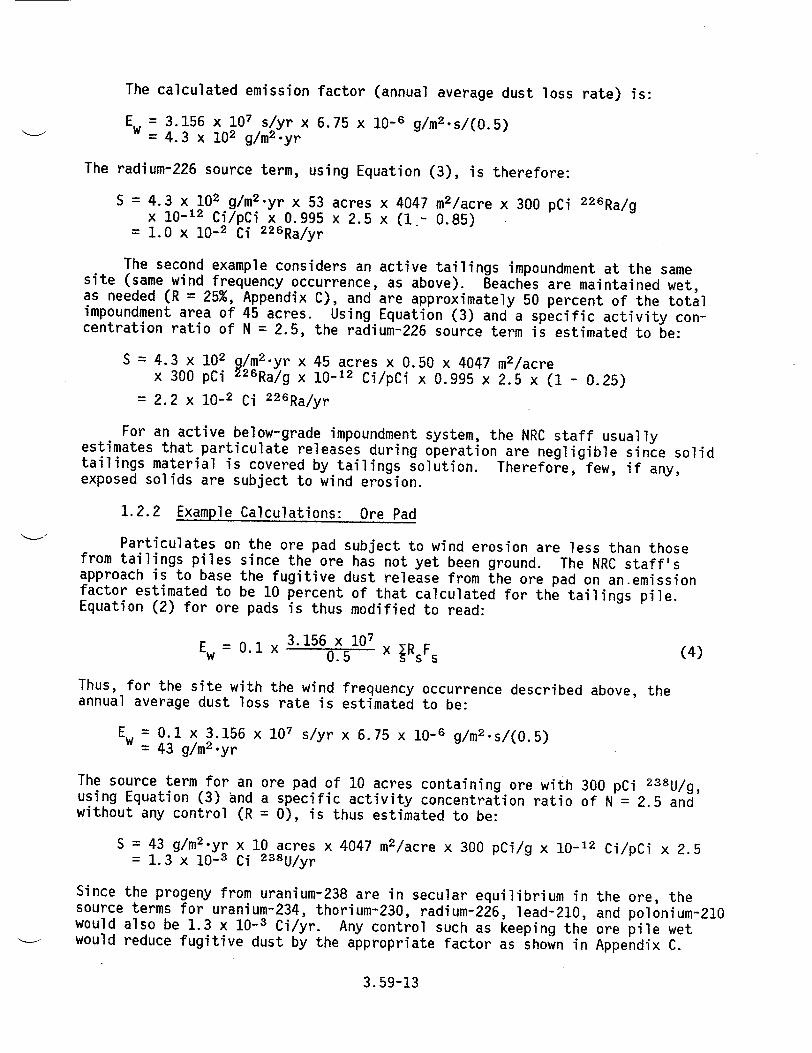
The calculated emission factor (annual average dust loss rate) is:
Ew = 3.156 x 10⁷ s/yr x 6.75 x 10⁻⁶ g/m 2 .s/(0.5) = 4.3 x 10² g/m 2 -yr
The radium-226 source term, using Equation (3), is therefore:
S = 4.3 x 10² g/m 2 .yr x 53 acres x 4047 m2 /acre x 300 pCi 2 2 6 Ra/g x 10-12 Ci/pCi x 0.995 x 2.5 x (1_- 0.85)
= 1.0 x 10⁻² Ci 2 2 6 Ra/yr
The second example considers an active tailings impoundment at the same site (same wind frequency occurrence, as above). Beaches are maintained wet, as needed (R = 25%, Appendix C), and are approximately 50 percent of the total impoundment area of 45 acres. Using Equation (3) and a specific activity concentration ratio of N = 2.5, the radium-226 source term is estimated to be:
S = 4.3 x 10² g/m 2 -yr x 45 acres x 0.50 x 4047 m2 /acre x 300 pCi 26Ra/g x 10-12 Ci/pCi x 0.995 x 2.5 x (1 - 0.25)
= 2.2 x 10⁻² Ci 2 2 6 Ra/yr
For an active below-grade impoundment system, the NRC staff usually estimates that particulate releases during operation are negligible since solid tailings material is covered by tailings solution. Therefore, few, if any, exposed solids are subject to wind erosion.
1.2.2 Example Calculations: Ore Pad
Particulates on the ore pad subject to wind erosion are less than those from tailings piles since the ore has not yet been ground. The NRC staff's approach is to base the fugitive dust release from the ore pad on an.emission factor estimated to be 10 percent of that calculated for the tailings pile. Equation (2) for ore pads is thus modified to read:
Ew= 0.1 x 3.156 x 107 (4) = ~0.5 x Rs(4
Thus, for the site with the wind frequency occurrence described above, the annual average dust loss rate is estimated to be:
Ew = 0.1 x 3.156 x 107 s/yr x 6.75 x 10⁻⁶ g/m 2 -s/(0.5) = 43 g/m 2 .yr
The source term for an ore pad of 10 acres containing ore with 300 pCi 2 3 8 U/g, using Equation (3) and a specific activity concentration ratio of N = 2.5 and without any control (R = 0), is thus estimated to be:
S = 43 g/m 2 .yr x 10 acres x 4047 m2 /acre x 300 pCi/g x 10-12 Ci/pCi x 2.5 = 1.3 x 10⁻³ Ci 2 3 8 U/yr
Since the progeny from uranium-238 are in secular equilibrium in the ore, the source terms for uranium-234, thorium-230, radium-226, lead-210, and polonium-210 would also be 1.3 x 10⁻³ Ci/yr. Any control such as keeping the ore pile wet would reduce fugitive dust by the appropriate factor as shown in Appendix C.
3.59-13
1.3 Parameter Selection
Production rate, pile areas, description of operation, and contaminant specie contents are reasonably well-identified parameters used in particle source term measurements. Emission factors and emission control reduction factors are less certain parameters. The NRC staff realizes that many of these factors are difficult to measure, e.g., the tailings resuspension factor and the control factor for chemical dust suppressants. Factors measured by the applicant or by others in the regulatory and emission control fields may be used. Examples of such measured values include the efficiency of emission control devices installed in stacks and the historical emission measurements at an applicant's yellowcake dryer stack. The NRC staff prefers to use reliably measured values for these parameters. Design parameters are generally chosen only when other data are unavailable. An adjustment should be made for expected performance, and minimum performance should be noted. The following information sources are used in source term estimates:
1. Applicant's measurements,
2. Default values listed in this regulatory guide,
3. Other measurements or estimates shown by the applicant to be acceptable,
4. Manufacturers' specifications, and
5. Best engineering judgment.
Section 9 of the GEIS for uranium mills (Ref. 4) indicates that tailings surface control and an efficient yellowcake dust collection system are the major factors necessary to maintain acceptable airborne emissions.
Alternative methods for treating mill tailings in ways to reduce the potential of fugitive dust are discussed in Sections 8 and 9 of Reference 4. Various strategies can be used for controlling dust, including vegetative cover; gravel, crushed rock, or riprap cover; manmade covers and sealants; and combinations of the above. Some of these are also useful in reducing radon emissions, as discussed below. Progressive reclamation, i.e., the practice of drying up and covering tailings piles in sections as they are filled, is an effective method for reducing airborne particulates from the tailings and is used by several mills in the United States.
2. RADON EMISSION SOURCE TERM
Processing of uranium ore and subsequent tailings disposal presents pathways for release of radon to the environment. The major pathways for radon release occur from ore storage, ore crushing and grinding, and the mill tailings disposal site. The amount of radon released through each of the pathways depends on the ore type, ore storage procedures, crushing or grinding operations, and tailings disposal practices. The factors affecting radon common to all the source pathways are (1) radium content of ore, (2) emanating power (coefficient) of ore or tailings, (3) radon diffusion coefficient in ore stockpiled, ground ore, and tailings, and (4) physical characteristics, including configuration of ore
3.59-14
storage and tailings pile. The following sections describe methods used to estimate the release of radon from ore storage, crushing and grinding, leaching and extraction, and the tailings impoundment. Example calculations illustrate the calculation procedures.
2.1 Run-of-Mine Ore Storage
Ore received at the mill is stockpiled on ore storage pads in sufficient quantity to provide for a continuous supply to the mill. Radon release from the ore storage area depends on (1) the characteristics of ore, (2) the area and thickness of the ore pads, and (3) the storage time. The quality of the ore received varies with respect to ore concentration, grade, and size. Selection of ores from the stockpile is generally made to allow for a reasonably consistent composition as feed to the mill chemical processes.
2.1.1 Estimation Using Flux Factor
In the majority of cases, the NRC staff estimates radon release by using a specific radon flux factor of 1 pCi 2 2 2 Rn/m 2 -s per pCi/g of 2 26 Ra. Only the area of the ore stockpile and the average radium content need be known to make the calculation of yearly release. An example calculation for an ore pad covering 3 hectares (7.5 acres) and containing an average radium-226 concentration of 300 pCi/g is:
(1 pCi 2 2 2 Rn/m 2 -s)/(pCi/g 2 2 6 Ra) x 300 pCi 2 2 6 Ra/g x 3 ha x 104 m2 /ha x 3.156 x 10 s/yr x 10-12 Ci/pCi
= 285 Ci 2 2 2 Rn/yr
2.2 Hopper, Feeder, Crushing, and Grinding
Blended run-of-mine ore from the storage pile is fed to the crushing and grinding circuits. Because of the short residence time in the crushing and grinding circuits, only a small amount of radon will be released. It is estimated that less than 10 percent of the radon in the ore will be released during crushing and grinding (Ref. 7). The radon released during the ore crushing and grinding is estimated as follows:
135,000 MT/yr x 350 pCi/g x 106 g/MT x 10-12 Ci/pCi x 10% = 4.73 Ci/yr
2.3 Leaching and Extraction
Leaching and extraction are wet processes and again require short residence times; therefore, radon-222 release is estimated not to be significant.
2.4 Yellowcake Drying and Packaging
No significant radon release occurs since only NO.1 percent of the original radium-226 in the ore is found in the yellowcake.
2.5 Tailings Disposal
The major waste discharged from a mill is the tailings slurry, which contains the barren ore plus process solutions. The tailings liquid contains residual acid or residual alkaline (depending on the leaching agent) and dissolved solids
3. 59-15
from the leaching steps. Some of the liquid (.1/3) may be returned to the mill for reuse. The tailings consist of sand, slimes, and a mixture of sand and slimes, which are the sources of radon. Estimates of radon release are based on about 99.9 percent of the radium-226 remaining with the tailings unless measurements that indicate lesser amounts of radium are available.
Radon will be released from the exposed tailings. During the active period of the tailings pile, the impoundment is assumed to have areas of saturated tailings (slimes) mostly covered with raffinate solution and areas of relatively dry tailings (beach sands). The factors affecting the release of radon from the tailings pile are basically the same as those for the ore storage pads, including (1) emanating power, (2) diffusion coefficient, (3) moisture, (4) density, and (5) tailings thickness. The basic difference, however, is that during the active life of the tailings pile there are two areas on the tailings piles: the drier beach area and the saturated slimes area, which is generally covered with the raffinate pond. The tailings in the beach areas generally contain less radium than the tailings in the slimes areas (Ref. 4). The relative amounts of slimes and sands or mixtures on the surface of a tailings pile depend not only on the quantity of sands and slimes but also on the procedure used to distribute the tailings on the pile. The beach areas have tailings with a higher radon diffusion coefficient resulting from the larger particle sizes and lower moisture contents. The slimes areas have tailings with finer particle sizes and higher moisture content, which reduce the radon coefficient.
2.5.1 Estimation Using Flux Factor
The condition (slimes/sands distribution, moisture content, fraction covered by solution raffinate, etc.) of the tailings impoundment is variable and complex and difficult to accurately predict. In general, the NRC staff uses the specific flux factor of 1 pCi 2 22 Rn/m 2 -s per pCi Y26Ra/g to estimate the radon release from the tailings. Thus, for a hypothetical tailings pile containing an average of 300 pCi 2 2 6 Ra/g and covering 50 hectares (124 acres), the annual radon-222 release is:
(1 pCi 2 2 2 Rn/m2.s)/(pCi 2 2 6 Ra/g) x 300 pCi 2 2 6 Ra/g x 50 ha x 104 m2 /ha x 3.165 x 10⁷ s/yr x 10-12 Ci/pCi
= 4750 Ci/yr
2.6 Radon Release During in Situ Operations
The major source of radon release during in situ mining operations is the lixiviant which, when exposed to the atmosphere, will release radon. The release will occur when the lixiviant arrives at the process recovery surge tanks, ion exchange tanks, or columns or evaporation ponds.
Aquifer restoration, which includes ground-water sweeping and clean water circulation, is also a source of radon that must be considered.
The key parameters used to determine the average annual radon release are listed in Table 3.
3.59-16
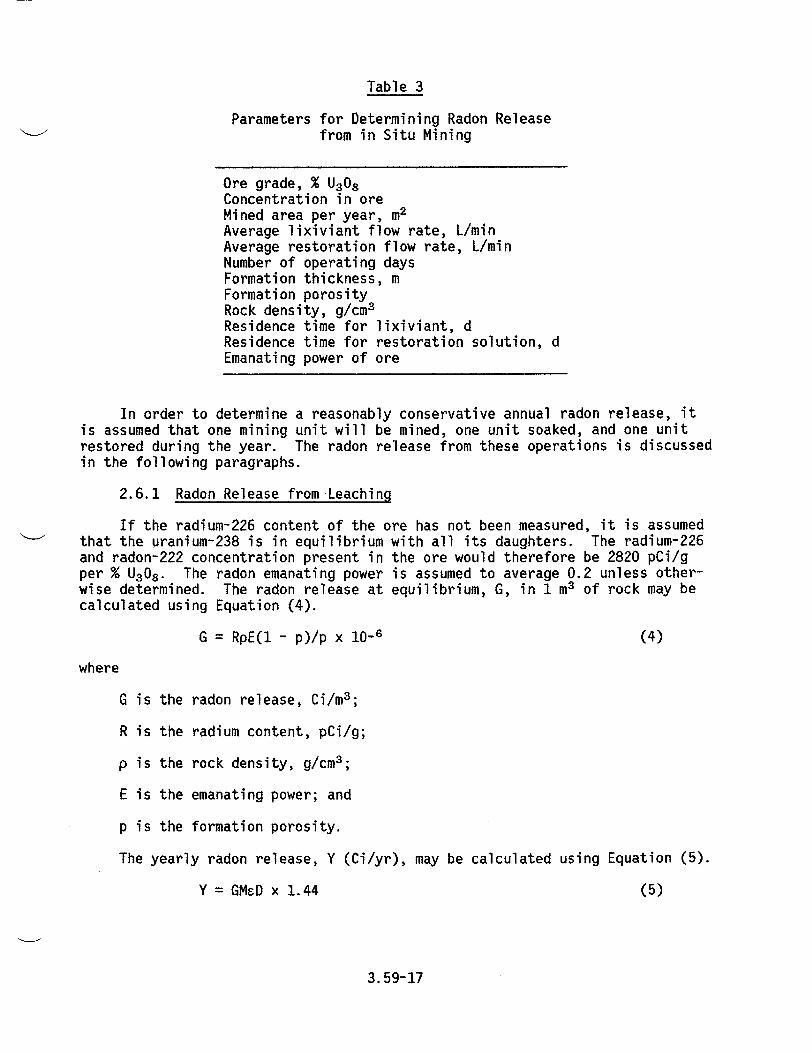
Table 3
Parameters for Determining Radon Release from in Situ Mining
Ore grade, % U3 08 Concentration in ore Mined area per year, m2
Average lixiviant flow rate, L/min Average restoration flow rate, L/min Number of operating days Formation thickness, m Formation porosity Rock density, g/cm3
Residence time for lixiviant, d Residence time for restoration solution, d Emanating power of ore
In order to determine a reasonably conservative annual radon release, it is assumed that one mining unit will be mined, one unit soaked, and one unit restored during the year. The radon release from these operations is discussed in the following paragraphs.
2.6.1 Radon Release from Leaching
If the radium-226 content of the ore has not been measured, it is assumed that the uranium-238 is in equilibrium with all its daughters. The radium-226 and radon-222 concentration present in the ore would therefore be 2820 pCi/g per % U3 08 . The radon emanating power is assumed to average 0.2 unless otherwise determined. The radon release at equilibrium, G, in 1 m3 of rock may be calculated using Equation (4).
G = RpE(1 - p)/p x 10-6 (4)
where
G is the radon release, Ci/m 3 ;
R is the radium content, pCi/g;
p is the rock density, g/cm3 ;
E is the emanating power; and
p is the formation porosity.
The yearly radon release, Y (Ci/yr), may be calculated using Equation (5).
Y = GM&D x 1.44 (5)
3.59-17
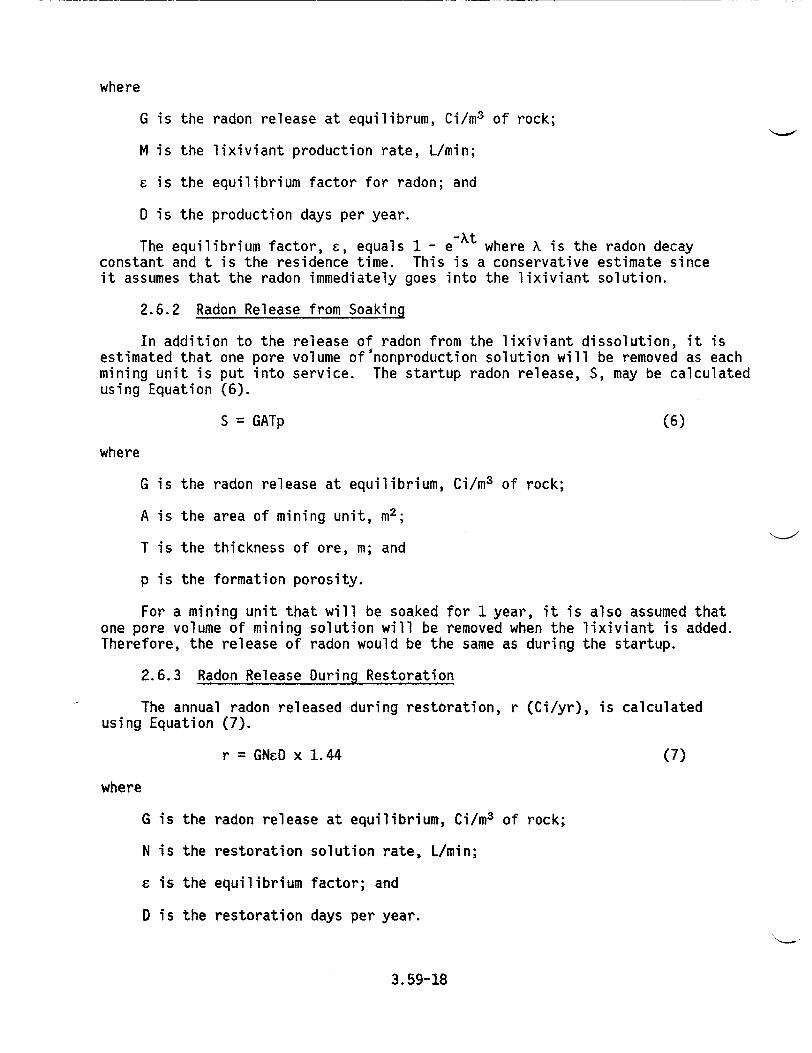
where
G is the radon release at equilibrum, Ci/m 3 of rock;
M is the lixiviant production rate, L/min;
& is the equilibrium factor for radon; and
D is the production days per year.
The equilibrium factor, &, equals 1 - e-xt where X is the radon decay constant and t is the residence time. This is a conservative estimate since it assumes that the radon immediately goes into the lixiviant solution.
2.6.2 Radon Release from Soaking
In addition to the release of radon from the lixiviant dissolution, it is estimated that one pore volume of'nonproduction solution will be removed as each mining unit is put into service. The startup radon release, S, may be calculated using Equation (6).
S = GATp (6)
where
G is the radon release at equilibrium, Ci/m 3 of rock;
A is the area of mining unit, mi2 ;
T is the thickness of ore, m; and
p is the formation porosity.
For a mining unit that will be soaked for 1 year, it is also assumed that one pore volume of mining solution will be removed when the lixiviant is added. Therefore, the release of radon would be the same as during the startup.
2.6.3 Radon Release During Restoration
The annual radon released during restoration, r (Ci/yr), is calculated using Equation (7).
r = GN&D x 1.44 (7)
where
G is the radon release at equilibrium, Ci/m 3 of rock;
N is the restoration solution rate, L/min;
s is the equilibrium factor; and
D is the restoration days per year.
3.59-18
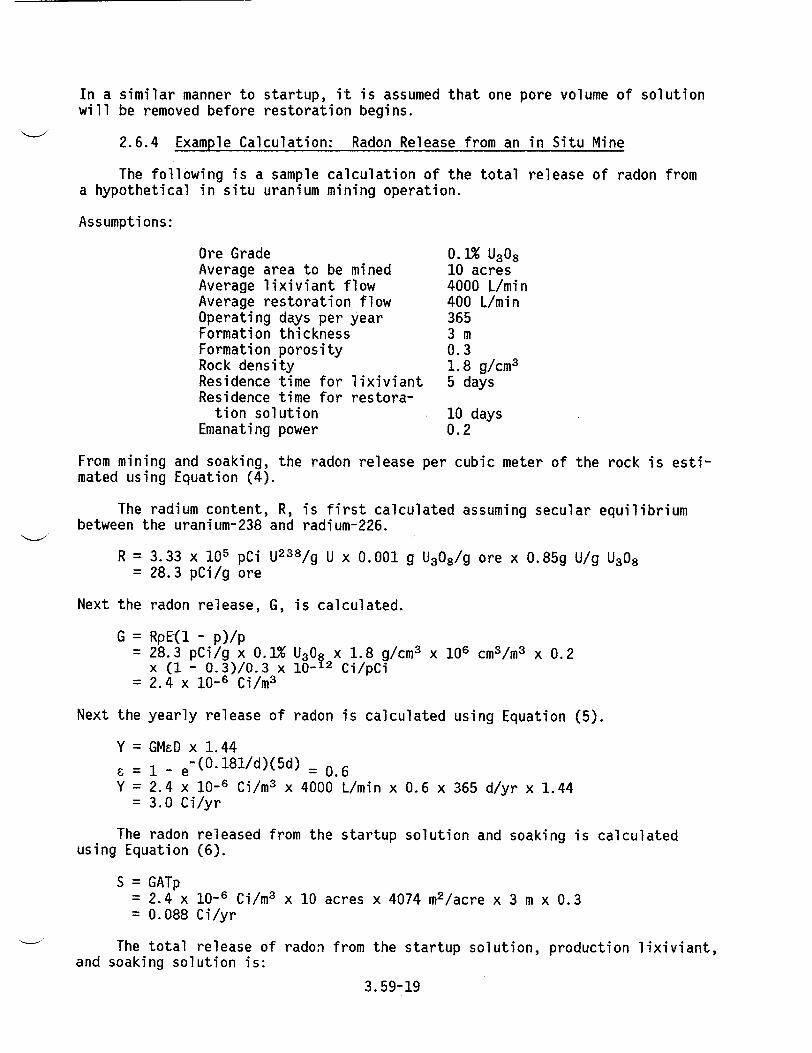
In a similar manner to startup, it is assumed that one pore volume of solution will be removed before restoration begins.
2.6.4 Example Calculation: Radon Release from an in Situ Mine
The following is a sample calculation of the total release of radon from a hypothetical in situ uranium mining operation.
Assumptions:
Ore Grade 0.1% U3 08 Average area to be mined 10 acres Average lixiviant flow 4000 L/min Average restoration flow 400 L/min Operating days per year 365 Formation thickness 3 m Formation porosity 0.3 Rock density 1.8 g/cm3
Residence time for lixiviant 5 days Residence time for restora
tion solution 10 days Emanating power 0.2
From mining and soaking, the radon release per cubic meter of the rock is estimated using Equation (4).
The radium content, R, is first calculated assuming secular equilibrium between the uranium-238 and radium-226.
R = 3.33 x 10⁵ pCi U2 38 /g U x 0.001 g U308/g ore x 0.85g U/g U3 08 = 28.3 pCi/g ore
Next the radon release, G, is calculated.
G = RpE(1 - p)/p = 28.3 pCi/g x 0.1% U3 0 x1.8 g/cm3 x 106 cm3 /m3 x 0.2
x (1 - 0.3)/0.3 x 10-12 Ci/pCi = 2.4 x 10⁻⁶ Ci/m 3
Next the yearly release of radon is calculated using Equation (5).
Y = GMeD x 1.44
S= I - e"(O' 18 1 /d)(5d) - 0.6 Y = 2.4 x 10⁻⁶ Ci/m 3 x 4000 L/min x 0.6 x 365 d/yr x 1.44
= 3.0 Ci/yr
The radon released from the startup solution and soaking is calculated using Equation (6).
S = GATp = 2.4 x 10⁻⁶ Ci/m 3 x 10 acres x 4074 m2 /acre x 3 m x 0.3 = 0.088 Ci/yr
The total release of radon from the startup solution, production lixiviant, and soaking solution is:
3.59-19
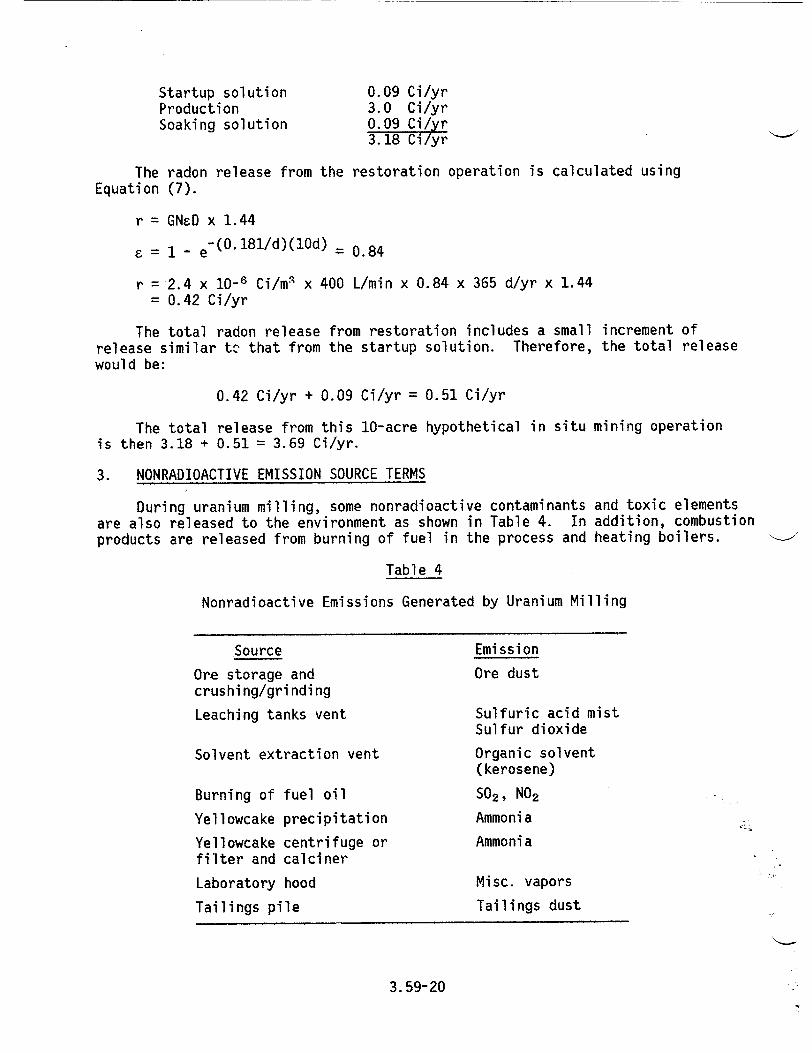
Startup solution Production Soaking solution
0. 09 Ci/yr 3.0 Ci/yr 0.09 Ci/yr 3.18 Ci /yr
The radon release from the restoration operation is calculated using Equation (7).
r = GN&D x 1.44
S= 1 - e-(O '181/d)(lOd) = 0.84
r =2.4 x 10⁻⁶ Ci/ml x 400 L/min x 0.84 x 365 d/yr x 1.44 = 0.42 Ci/yr
The total radon release from restoration includes a small release similar to that from the startup solution. Therefore, would be:
increment of the total release
0.42 Ci/yr + 0.09 Ci/yr = 0.51 Ci/yr
The total release from this 10-acre hypothetical in situ mining operation is then 3.18 + 0.51 = 3.69 Ci/yr.
3. NONRADIOACTIVE EMISSION SOURCE TERMS
During uranium milling, some nonradioactive contaminants and toxic elements are also released to the environment as shown in Table 4. In addition, combustion products are released from burning of fuel in the process and heating boilers.
Table 4
Nonradioactive Emissions Generated by Uranium Milling
Source Ore storage and crushing/grinding Leaching tanks vent
Solvent extraction vent
Burning of fuel oil
Yellowcake precipitation
Yellowcake centrifuge or filter and calciner
Laboratory hood
Tailings pile
Emission
Ore dust
Sulfuric acid mist Sulfur dioxide
Organic solvent (kerosene)
S02 , NO2
Ammonia
Ammonia
Misc. vapors
Tailings dust
3.59-20
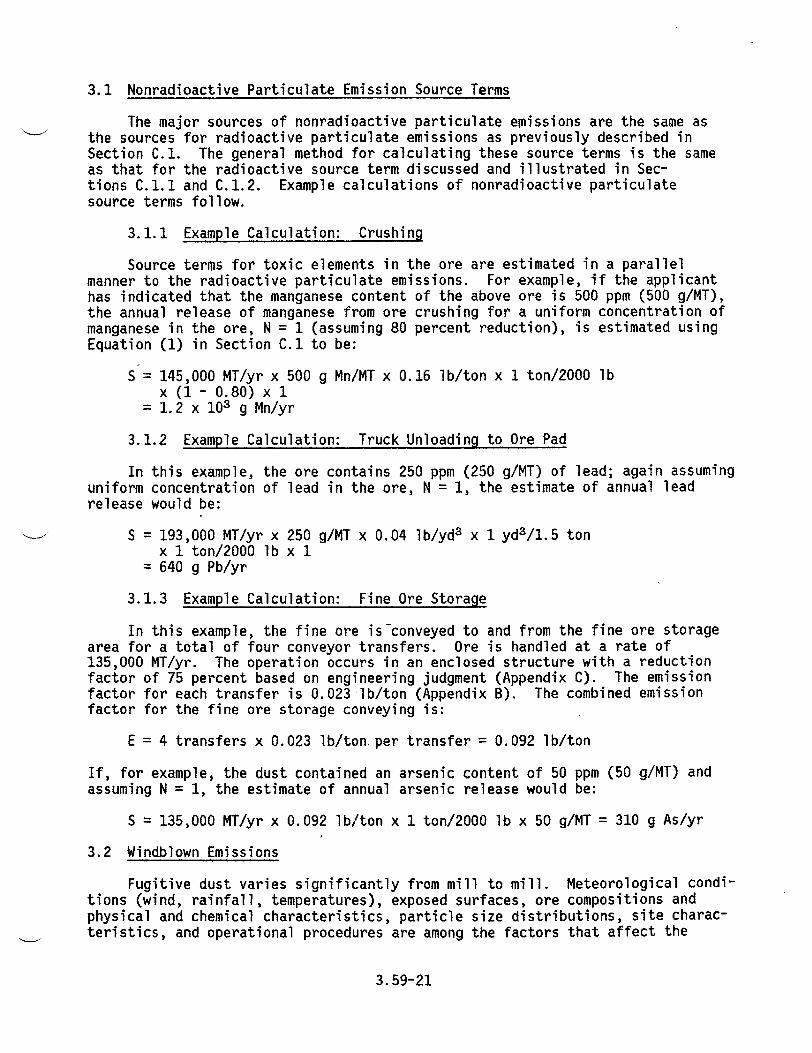
3.1 Nonradioactive Particulate Emission Source Terms
The major sources of nonradioactive particulate emissions are the same as the sources for radioactive particulate emissions as previously described in Section C.1. The general method for calculating these source terms is the same as that for the radioactive source term discussed and illustrated in Sections C.1.1 and C.1.2. Example calculations of nonradioactive particulate source terms follow.
3.1.1 Example Calculation: Crushing
Source terms for toxic elements in the ore are estimated in a parallel manner to the radioactive particulate emissions. For example, if the applicant has indicated that the manganese content of the above ore is 500 ppm (500 g/MT), the annual release of manganese from ore crushing for a uniform concentration of manganese in the ore, N = 1 (assuming 80 percent reduction), is estimated using Equation (1) in Section C.1 to be:
S 145,000 MT/yr x 500 g Mn/MT x 0.16 lb/ton x 1 ton/2000 lb x (1 - 0.80) x 1
= 1.2 x 10³ g Mn/yr
3.1.2 Example Calculation: Truck Unloading to Ore Pad
In this example, the ore contains 250 ppm (250 g/MT) of lead; again assuming uniform concentration of lead in the ore, N = 1, the estimate of annual lead release would be:
S = 193,000 MT/yr x 250 g/MT x 0.04 lb/yd3 x 1 yd3 /1.5 ton x 1 ton/2000 lb x 1
= 640 g Pb/yr
3.1.3 Example Calculation: Fine Ore Storage
In this example, the fine ore is conveyed to and from the fine ore storage area for a total of four conveyor transfers. Ore is handled at a rate of 135,000 MT/yr. The operation occurs in an enclosed structure with a reduction factor of 75 percent based on engineering judgment (Appendix C). The emission factor for each transfer is 0.023 lb/ton (Appendix B). The combined emission factor for the fine ore storage conveying is:
E = 4 transfers x 0.023 lb/ton per transfer = 0.092 lb/ton
If, for example, the dust contained an arsenic content of 50 ppm (50 g/MT) and assuming N = 1, the estimate of annual arsenic release would be:
S = 135,000 MT/yr x 0.092 lb/ton x 1 ton/2000 lb x 50 g/MT = 310 g As/yr
3.2 Windblown Emissions
Fugitive dust varies significantly from mill to mill. Meteorological conditions (wind, rainfall, temperatures), exposed surfaces, ore compositions and physical and chemical characteristics, particle size distributions, site characteristics, and operational procedures are among the factors that affect the
3.59-21
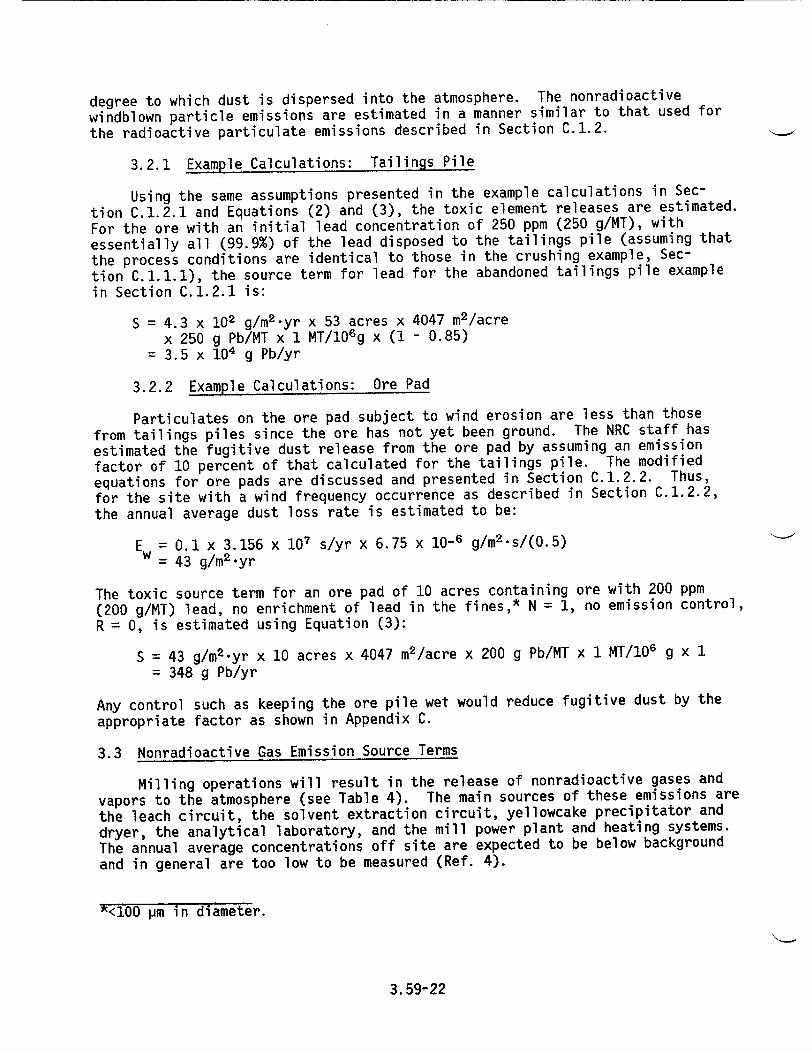
degree to which dust is dispersed into the atmosphere. The nonradioactive
windblown particle emissions are estimated in a manner similar to that used for
the radioactive particulate emissions described in Section C.1.2.
3.2.1 Example Calculations: Tailings Pile
Using the same assumptions presented in the example calculations in Sec
tion C.1.2.1 and Equations (2) and (3), the toxic element releases are estimated.
For the ore with an initial lead concentration of 250 ppm (250 g/MT), with
essentially all (99.9%) of the lead disposed to the tailings pile (assuming that
the process conditions are identical to those in the crushing example, Sec
tion C.1.1.1), the source term for lead for the abandoned tailings pile example
in Section C.1.2.1 is:
S = 4.3 x 10² g/m 2 -yr x 53 acres x 4047 m2 /acre x 250 g Pb/MT x 1 MT/10 6 g x (1 - 0.85)
= 3.5 x 101 g Pb/yr
3.2.2 Example Calculations: Ore Pad
Particulates on the ore pad subject to wind erosion are less than those
from tailings piles since the ore has not yet been ground. The NRC staff has
estimated the fugitive dust release from the ore pad by assuming an emission
factor of 10 percent of that calculated for the tailings pile. The modified
equations for ore pads are discussed and presented in Section C.1.2.2. Thus,
for the site with a wind frequency occurrence as described in Section C.1.2.2,
the annual average dust loss rate is estimated to be:
Ew = 0.1 x 3.156 x i07 s/yr x 6.75 x 10⁻⁶ g/m 2 -s/(0.5) = 43 g/m 2 .yr
The toxic source term for an ore pad of 10 acres containing ore with 200 ppm
(200 g/MT) lead, no enrichment of lead in the fines,* N = 1, no emission control,
R = 0, is estimated using Equation (3):
S = 43 g/m 2 .yr x 10 acres x 4047 m2 /acre x 200 g Pb/MT x 1 MT/IO6 g x 1 = 348 g Pb/yr
Any control such as keeping the ore pile wet would reduce fugitive dust by the
appropriate factor as shown in Appendix C.
3.3 Nonradioactive Gas Emission Source Terms
Milling operations will result in the release of nonradioactive gases and
vapors to the atmosphere (see Table 4). The main sources of these emissions are
the leach circuit, the solvent extraction circuit, yellowcake precipitator and
dryer, the analytical laboratory, and the mill power plant and heating systems.
The annual average concentrations off site are expected to be below background and in general are too low to be measured (Ref. 4).
*<100 pm in diameter.
3.59-22
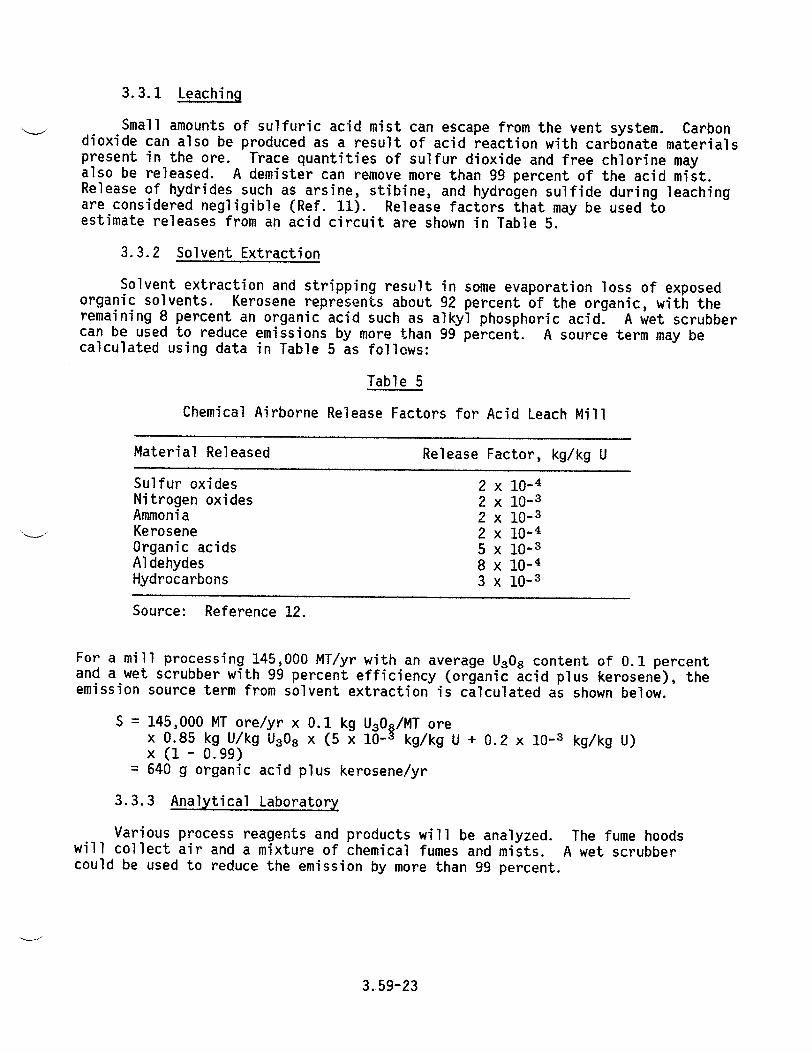
3.3.1 Leaching
Small amounts of sulfuric acid mist can escape from the vent system. Carbon dioxide can also be produced as a result of acid reaction with carbonate materials present in the ore. Trace quantities of sulfur dioxide and free chlorine may also be released. A demister can remove more than 99 percent of the acid mist. Release of hydrides such as arsine, stibine, and hydrogen sulfide during leaching are considered negligible (Ref. 11). Release factors that may be used to estimate releases from an acid circuit are shown in Table 5.
3.3.2 Solvent Extraction
Solvent extraction and stripping result in some evaporation loss of exposed organic solvents. Kerosene represents about 92 percent of the organic, with the remaining 8 percent an organic acid such as alkyl phosphoric acid. A wet scrubber can be used to reduce emissions by more than 99 percent. A source term may be calculated using data in Table 5 as follows:
Table 5
Chemical Airborne Release Factors for Acid Leach Mill
Material Released Release Factor, kg/kg U
Sulfur oxides 2 x 10⁻⁴ Nitrogen oxides 2 x 10⁻³ Ammonia 2 x 10⁻³ Kerosene 2 x 10⁻⁴ Organic acids 5 x 10-s Aldehydes 8 x 10⁻⁴ Hydrocarbons 3 x 10⁻³
Source: Reference 12.
For a mill processing 145,000 MT/yr with an average U3 08 content of 0.1 percent and a wet scrubber with 99 percent efficiency (organic acid plus kerosene), the emission source term from solvent extraction is calculated as shown below.
S = 145,000 MT ore/yr x 0.1 kg U30 /MT ore x 0.85 kg U/kg U308 x (5 x 10-1 kg/kg U + 0.2 x 10⁻³ kg/kg U) x (1 - 0.99)
= 640 g organic acid plus kerosene/yr
3.3.3 Analytical Laboratory
Various process reagents and products will be analyzed. The fume hoods will collect air and a mixture of chemical fumes and mists. A wet scrubber could be used to reduce the emission by more than 99 percent.
3.59-23
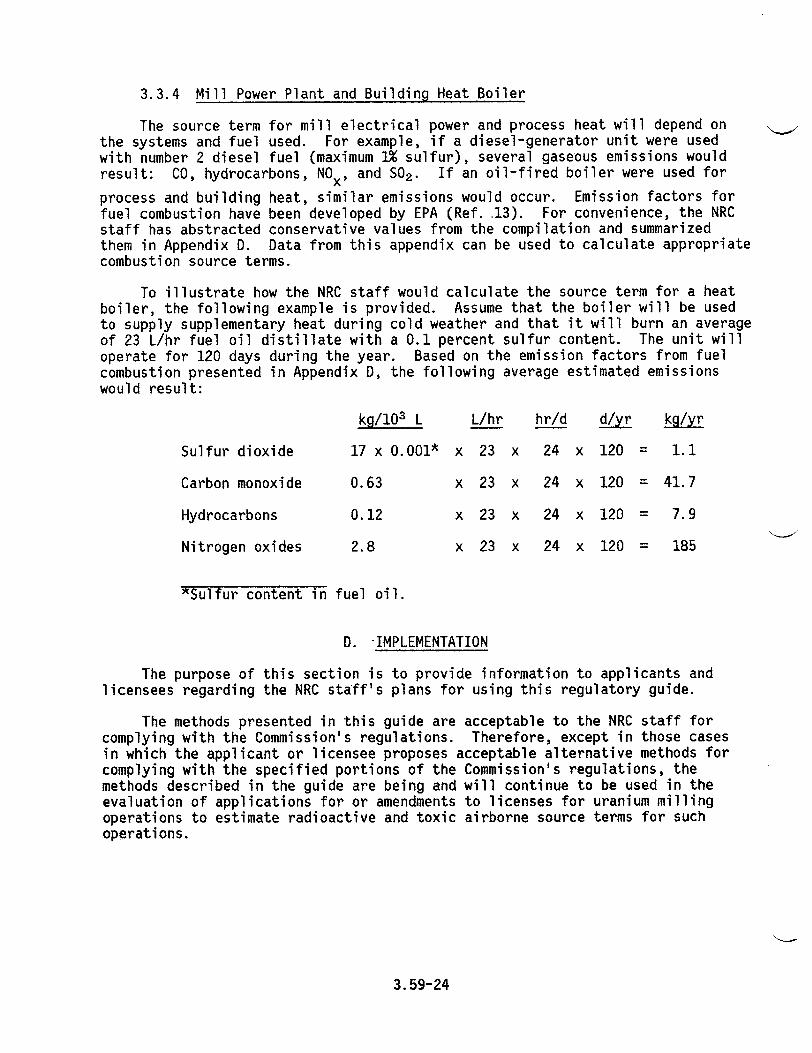
3.3.4 Mill Power Plant and Building Heat Boiler
The source term for mill electrical power and process heat will depend on the systems and fuel used. For example, if a diesel-generator unit were used with number 2 diesel fuel (maximum 1% sulfur), several gaseous emissions would result: CO, hydrocarbons, NOx, and S0 2. If an oil-fired boiler were used for
process and building heat, similar emissions would occur. Emission factors for fuel combustion have been developed by EPA (Ref. .13). For convenience, the NRC staff has abstracted conservative values from the compilation and summarized them in Appendix D. Data from this appendix can be used to calculate appropriate combustion source terms.
To illustrate how the NRC staff would calculate the source term for a heat boiler, the following example is provided. Assume that the boiler will be used to supply supplementary heat during cold weather and that it will burn an average of 23 L/hr fuel oil distillate with a 0.1 percent sulfur content. The unit will operate for 120 days during the year. Based on the emission factors from fuel combustion presented in Appendix D, the following average estimated emissions would result:
kg/103 L L/hr hr/d d/yr kg/yr
Sulfur dioxide 17 x 0.001* x 23 x 24 x 120 = 1.1
Carbon monoxide 0.63 x 23 x 24 x 120 = 41.7
Hydrocarbons 0.12 x 23 x 24 x 120 = 7.9
Nitrogen oxides 2.8 x 23 x 24 x 120 = 185
*Sulfur content in fuel oil.
D. IMPLEMENTATION
The purpose of this section is to provide information to applicants and licensees regarding the NRC staff's plans for using this regulatory guide.
The methods presented in this guide are acceptable to the NRC staff for complying with the Commission's regulations. Therefore, except in those cases in which the applicant or licensee proposes acceptable alternative methods for complying with the specified portions of the Commission's regulations, the methods described in the guide are being and will continue to be used in the evaluation of applications for or amendments to licenses for uranium milling operations to estimate radioactive and toxic airborne source terms for such operations.
3.59-24
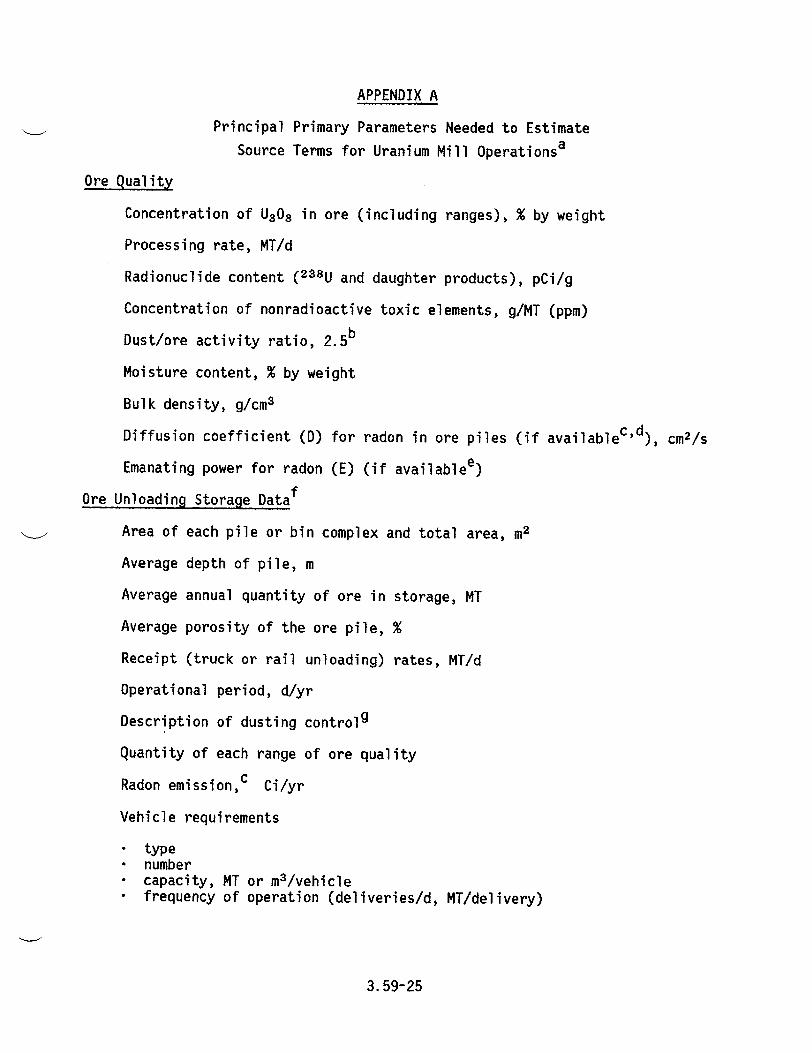
APPENDIX A
Principal Primary Parameters Needed to Estimate Source Terms for Uranium Mill Operationsa
Ore Quality
Concentration of U3 08 in ore (including ranges), % by weight
Processing rate, MT/d
Radionuclide content (2 3 8U and daughter products), pCi/g
Concentration of nonradioactive toxic elements, g/MT (ppm)
Dust/ore activity ratio, 2 . 5 b
Moisture content, % by weight
Bulk density, g/cm3
Diffusion coefficient (D) for radon in ore piles (if availablec'd), cm2 /s
Emanating power for radon (E) (if availablee)
Ore Unloading Stov'age Dataf
Area of each pile or bin complex and total area, m2
Average depth of pile, m
Average annual quantity of ore in storage, MT
Average porosity of the ore pile, %
Receipt (truck or rail unloading) rates, MT/d
Operational period, d/yr
Description of dusting controlg
Quantity of each range of ore quality
Radon emission,c Ci/yr
Vehicle requirements
"- type "• number "* capacity, MT or m3 /vehicle "• frequency of operation (deliveries/d, MT/delivery)
3.59-25
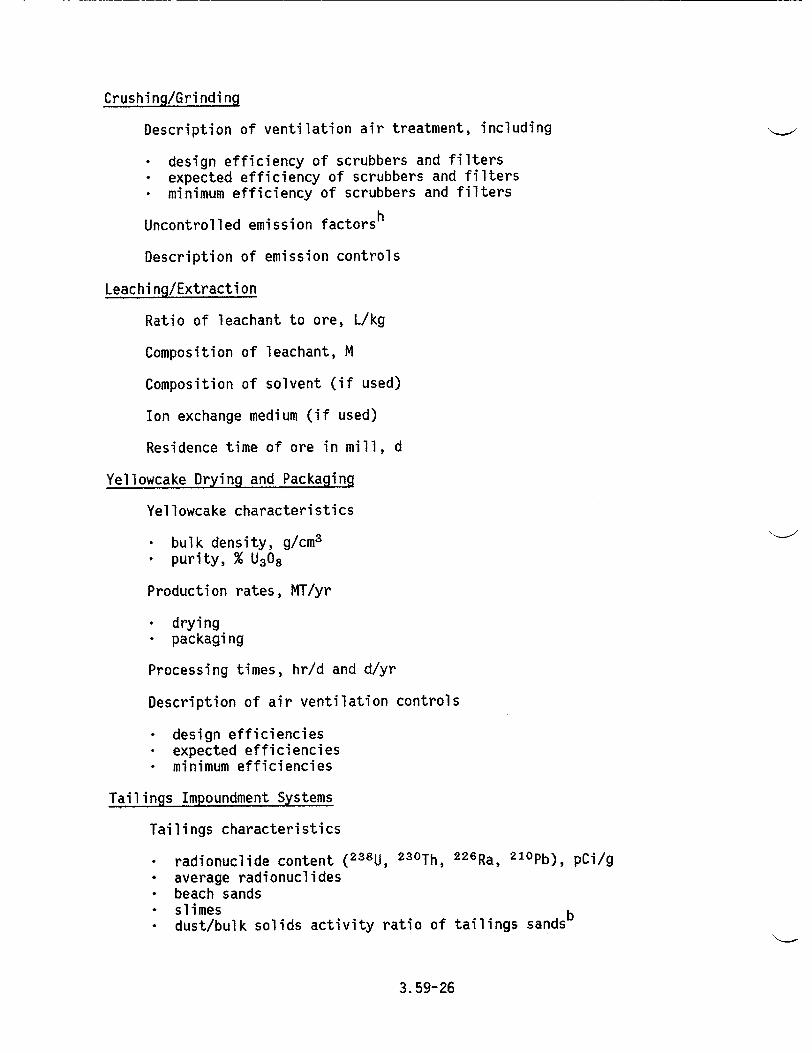
Crushing/Grinding
Description of ventilation air treatment, including
* design efficiency of scrubbers and filters • expected efficiency of scrubbers and filters • minimum efficiency of scrubbers and filters
Uncontrolled emission factorsh
Description of emission controls
Leaching/Extraction
Ratio of leachant to ore, L/kg
Composition of leachant, M
Composition of solvent (if used)
Ion exchange medium (if used)
Residence time of ore in mill, d
Yellowcake Drying and Packaging
Yellowcake characteristics
"* bulk density, g/cm3
"* purity, % U308
Production rates, MT/yr
* drying • packaging
Processing times, hr/d and d/yr
Description of air ventilation controls
"* design efficiencies "* expected efficiencies "* minimum efficiencies
Tailings Impoundment Systems
Tailings characteristics
• radionuclide content ( 2 38 U, 2 30 Th, 22 6 Ra, 2 10 Pb), pCi/g * average radionuclides * beach sands • slimes b * dust/bulk solids activity ratio of tailings sands
3.59-26
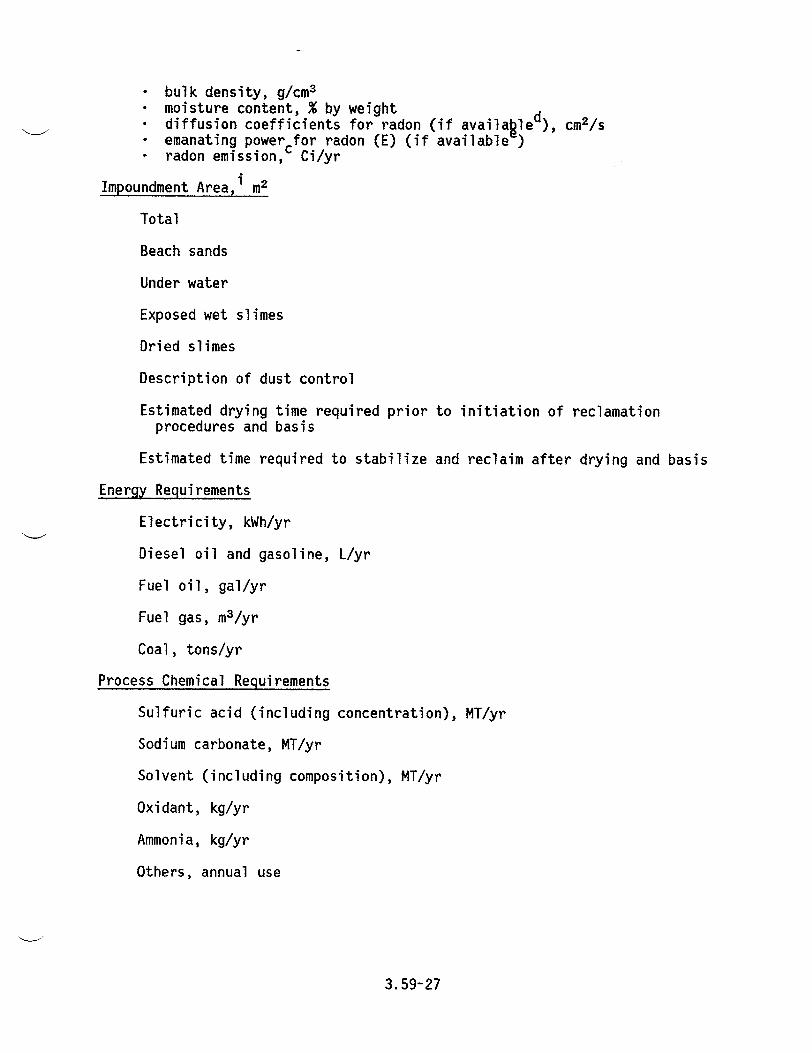
* bulk density, g/cm3
* moisture content, % by weight d 2/s * diffusion coefficients for radon (if availabled), cm * emanating powercfor radon (E) (if available ) - radon emission, Ci/yr
Impoundment Area,i m2
Total
Beach sands
Under water
Exposed wet slimes
Dried slimes
Description of dust control
Estimated drying time required prior to initiation of reclamation procedures and basis
Estimated time required to stabilize and reclaim after drying and basis
Energy Requirements
Electricity, kWh/yr
Diesel oil and gasoline, L/yr
Fuel oil, gal/yr
Fuel gas, m3/yr
Coal, tons/yr
Process Chemical Requirements
Sulfuric acid (including concentration), MT/yr
Sodium carbonate, MT/yr
Solvent (including composition), MT/yr
Oxidant, kg/yr
Ammonia, kg/yr
Others, annual use
3.59-27
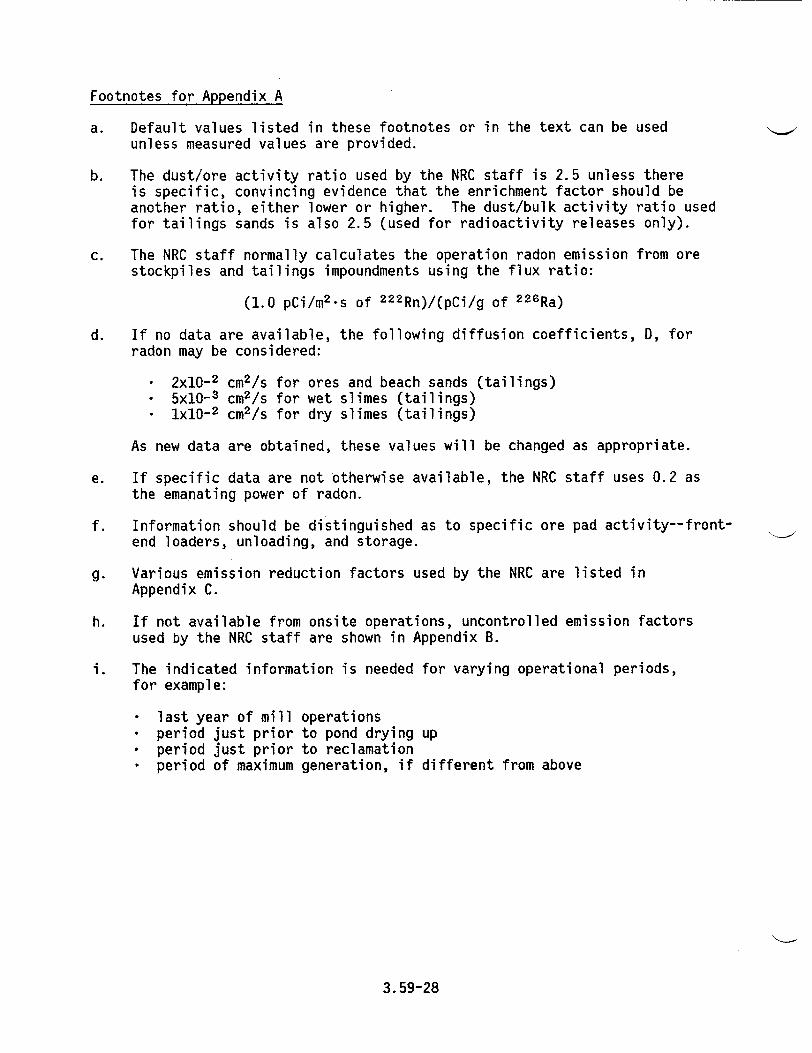
Footnotes for Appendix A
a. Default values listed in these footnotes or in the text can be used unless measured values are provided.
b. The dust/ore activity ratio used by the NRC staff is 2.5 unless there is specific, convincing evidence that the enrichment factor should be another ratio, either lower or higher. The dust/bulk activity ratio used for tailings sands is also 2.5 (used for radioactivity releases only).
c. The NRC staff normally calculates the operation radon emission from ore stockpiles and tailings impoundments using the flux ratio:
(1.0 pCi/m 2 -s of 2 2 2 Rn)/(pCi/g of 2 26 Ra)
d. If no data are available, the following diffusion coefficients, D, for radon may be considered:
2x10- 2 cm2/s for ores and beach sands (tailings) • 5x10- 3 cm2 /s for wet slimes (tailings) * lx1O- 2 cm2 /s for dry slimes (tailings)
As new data are obtained, these values will be changed as appropriate.
e. If specific data are not otherwise available, the NRC staff uses 0.2 as the emanating power of radon.
f. Information should be distinguished as to specific ore pad activity--frontend loaders, unloading, and storage.
g. Various emission reduction factors used by the NRC are listed in Appendix C.
h. If not available from onsite operations, uncontrolled emission factors used by the NRC staff are shown in Appendix B.
i. The indicated information is needed for varying operational periods, for example:
"* last year of mill operations "• period just prior to pond drying up "* period just prior to reclamation "• period of maximum generation, if different from above
3.59-28
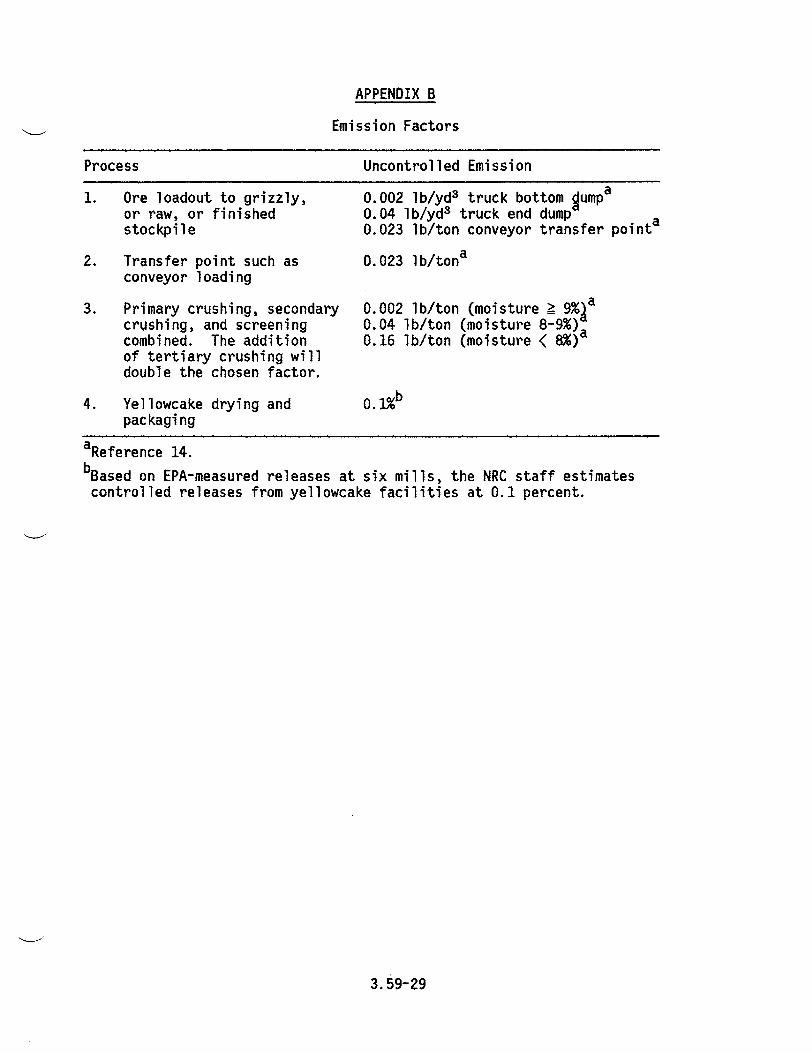
APPENDIX B
Emission Factors
Uncontrolled Emission
1. Ore loadout to grizzly, or raw, or finished stockpile
2. Transfer point such as conveyor loading
3. Primary crushing, secondary crushing, and screening combined. The addition of tertiary crushing will double the chosen factor.
4. Yellowcake drying and packaging
0.002 lb/yd3 truck bottom gumpa
0.04 lb/yd3 truck end dump 0.023 lb/ton conveyor transfer pointa
0.023 lb/tona
0.002 lb/ton (moisture 2 9% a
0.04 lb/ton (moisture 8-9%)a 0.16 lb/ton (moisture < 8%)a
0.1,%b
aReference 14. bBased on EPA-measured releases at six mills, the NRC staff estimates
controlled releases from yellowcake facilities at 0.1 percent.
3.59-29
Process
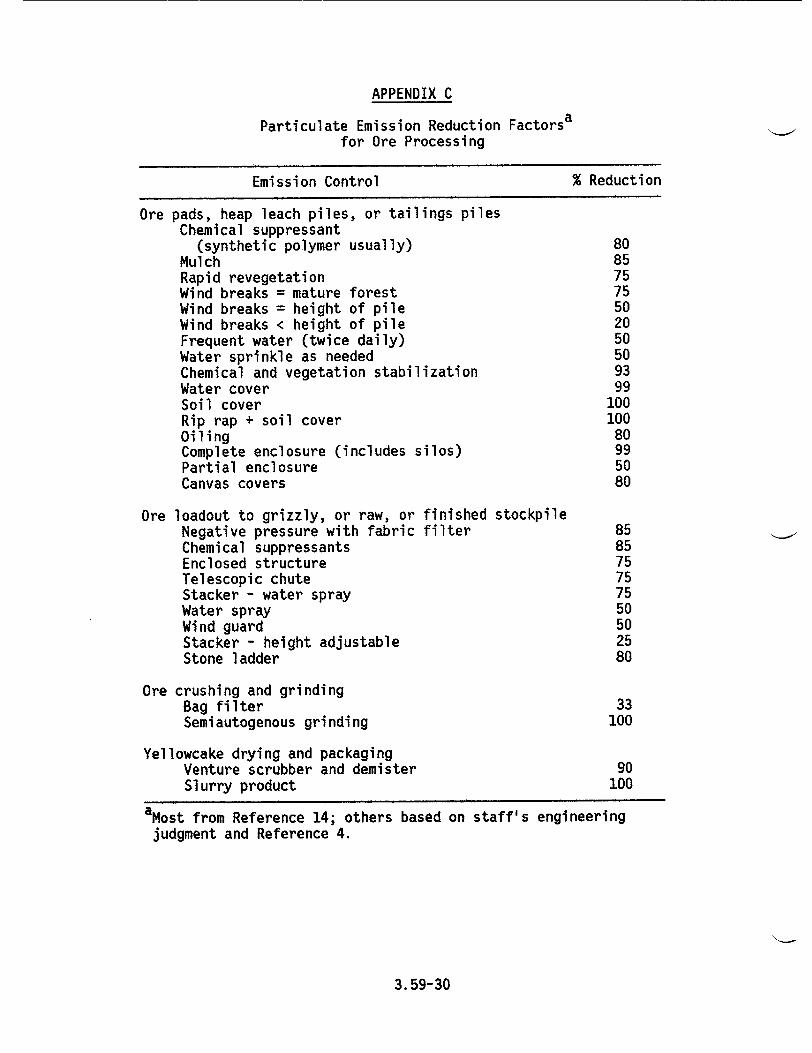
APPENDIX C
Particulate Emission Reduction Factorsa for Ore Processing
Emission Control
Ore pads, heap leach piles, or tailings piles Chemical suppressant
(synthetic polymer usually) Mulch Rapid revegetation Wind breaks = mature forest Wind breaks = height of pile Wind breaks < height of pile Frequent water (twice daily) Water sprinkle as needed Chemical and vegetation stabilization Water cover Soil cover Rip rap + soil cover Oiling Complete enclosure (includes silos) Partial enclosure Canvas covers
Ore loadout to grizzly, or raw, or finished Negative pressure with fabric filter Chemical suppressants Enclosed structure Telescopic chute Stacker - water spray Water spray Wind guard Stacker - height adjustable Stone ladder
stockpile
Ore crushing and grinding Bag filter Semiautogenous grinding
Yellowcake drying and packaging Venture scrubber and demister Slurry product
% Reduction
80 85 75 75 50 20 50 50 93 99 100 100 80 99 50 80
85 85 75 75 75 50 50 25 80
33 100
90 100
3.59-30
aMost from Reference 14; others based on staff's engineering
judgment and Reference 4.
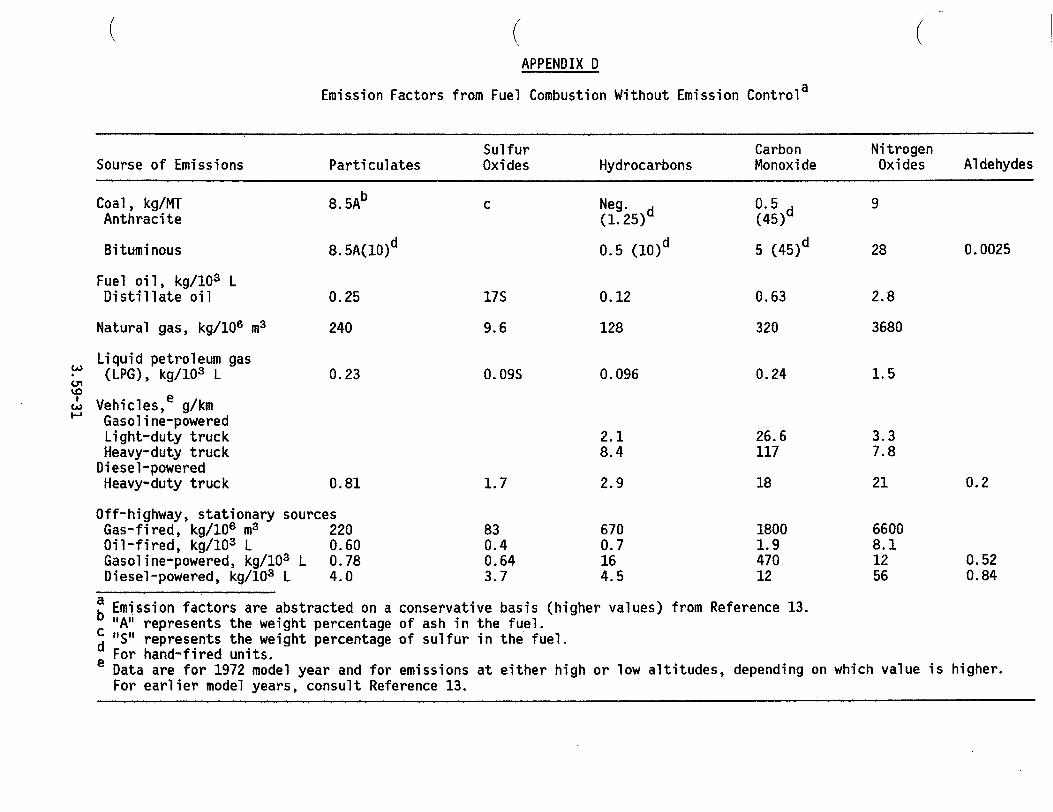
(APPENDIX D
Emission Factors from Fuel Combustion Without Emission Controla
Sulfur Carbon Nitrogen Sourse of Emissions Particulates Oxides Hydrocarbons Monoxide Oxides Aldehydes
Coal, kg/MT 8 .5Ab c Neg. d 0.5 d
Anthracite (1.25) (45)
Bituminous 8.5A(l0)d 0.5 ( 10 )d 5 ( 4 5 )d 28 0.0025
Fuel oil, kg/103 L Distillate oil 0.25 17S 0.12 0.63 2.8
Natural gas, kg/lO6 m3 240 9.6 128 320 3680
Liquid petroleum gas S(LPG), kg/103 L 0.23 0.09S 0.096 0.24 1.5 Ue
Vehicles, g/km Gasoline-powered Light-duty truck 2.1 26.6 3.3 Heavy-duty truck 8.4 117 7.8
Diesel-powered Heavy-duty truck 0.81 1.7 2.9 18 21 0.2
Off-highway, stationary sources Gas-fired, kg/106 m3 220 83 670 1800 6600 Oil-fired, kg/1O3 L 0.60 0.4 0.7 1.9 8.1 Gasoline-powered, kg/103 L 0.78 0.64 16 470 12 0.52 Diesel-powered, kg/lO3 L 4.0 3.7 4.5 12 56 0.84
a Emission factors are abstracted on a conservative basis (higher values) from Reference 13. "b "A" represents the weight percentage of ash in the fuel. c "S" represents the weight percentage of sulfur in the fuel. d For hand-fired units. e Data are for 1972 model year and for emissions at either high or low altitudes, depending on which value is higher.
For earlier model years, consult Reference 13.
REFERENCES
1. U.S. Nuclear Regulatory Commission (USNRC), Regulatory Guide 4.14, "Radiological Effluent and Environmental Monitoring at Uranium Mills," Washington, DC, 1980.
2. USNRC, "Compliance Determination Procedures for Environmental Radiation Protection Standards for Uranium Recovery Facilities - 40 CFR Part 190," NUREG-0859, Washington, DC, 1982.
3. USNRC, Regulatory Guide 3.51, "Calculational Models for Estimating Radiation Doses to Man from Airborne Radioactive Materials Resulting from Uranium Milling Operations," Washington, DC, 1982.
4. USNRC, "Final Generic Environmental Impact Statement on Uranium Milling," NUREG-0706, Vols. 1-3, Washington, DC, 1980.
5. R. C. Merritt, The Extractive Metallurgy of Uranium, Colorado School of Mines Research Institute, Golden, CO, 1971.
6. USNRC, "MILDOS - A Computer Program for Calculating Environmental Radiation Doses from Uranium Recovery Operations," NUREG/CR-2011, PNL-3767, prepared by R. L. Strenge and T. J. Bander, Pacific Northwest Laboratory, Richland, WA, for the USNRC, Washington, DC, 1981.
7. M. G. Sears et al., "Correlation of Radioactive Waste Treatment Costs and the Environmental Impact of Waste Effluents in the Nuclear Fuel Cycle for Use in Establishing "As Low As Practicable" Guides - Milling of Uranium Ores," ORNL-TM-4903, Vol. 1, Oak Ridge National Laboratory, Oak Ridge, TN, 1975.
8. L. C. Schwendiman et al., "A Field and Modeling Study of Windblown Particles from a Uranium Mill Tailings Pile," NUREG/CR-1407, PNL-3345, prepared by Pacific Northwest Laboratory, Richland, WA, for the USNRC, Washington, DC, 1980.
9. C. W. Fort, Jr., R. L. Douglas, and W. E. Moore, "Radioactive Emissions from Yellowcake Processing Stacks at Uranium Mills," Technical Note ORP LV-80-3, Environmental Protection Agency, Las Vegas, NV, 1980.
10. M. H. Momeni et al., "Radioisotopic Composition of Yellowcake. An Estimation of Stack Release Rates," NUREG/CR-1216, ANL/ES-84, prepared by Argonne National Laboratory, Argonne, IL, for the USNRC, Washington, DC, 1979.
11. USNRC, "Nuclear Fuel Cycle Risk Assessment: Descriptions of Representative Non-Reactor Facilities," coordinated by K. G. Schneider, Pacific Northwest Laboratory, Richland, WA, 1982.
12. K. G. Schneider and T. G. Kabele, "Descriptions of Reference LWR Facilities for Analysis of Nuclear Fuel Cycles," Pacific Northwest Laboratory, Richland, WA, 1979.
3.59-32
13. U.S. Environmental Protection Agency, "Compilation of Air Pollution Factors," and Supplements, Third Edition, PB-275-525, Office of Air and Waste Management, Office of Air Quality Planning and Standards, Research Triangle Park, NC, 1977.
14. I. Tistinic, "Fugitive Dust Emissions," interoffice communication of the Colorado Department of Health, APCD, 1981.
3.59-33
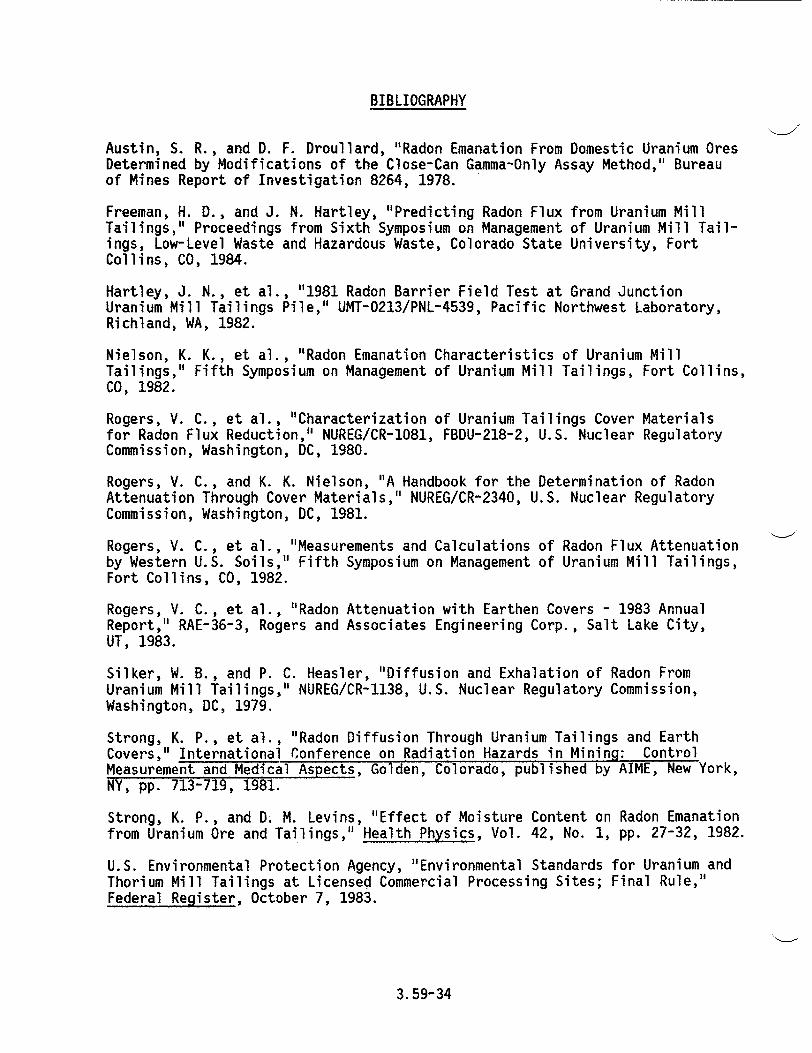
BIBLIOGRAPHY
Austin, S. R., and D. F. Droullard, "Radon Emanation From Domestic Uranium Ores Determined by Modifications of the Close-Can Gamma-Only Assay Method," Bureau of Mines Report of Investigation 8264, 1978.
Freeman, H. D., and J. N. Hartley, "Predicting Radon Flux from Uranium Mill Tailings," Proceedings from Sixth Symposium on Management of Uranium Mill Tailings, Low-Level Waste and Hazardous Waste, Colorado State University, Fort Collins, CO, 1984.
Hartley, J. N., et al., "1981 Radon Barrier Field Test at Grand Junction Uranium Mill Tailings Pile," UMT-0213/PNL-4539, Pacific Northwest Laboratory, Richland, WA, 1982.
Nielson, K. K., et al., "Radon Emanation Characteristics of Uranium Mill Tailings," Fifth Symposium on Management of Uranium Mill Tailings, Fort Collins, CO, 1982.
Rogers, V. C., et al., "Characterization of Uranium Tailings Cover Materials for Radon Flux Reduction," NUREG/CR-1081, FBDU-218-2, U.S. Nuclear Regulatory Commission, Washington, DC, 1980.
Rogers, V. C., and K. K. Nielson, "A Handbook for the Determination of Radon Attenuation Through Cover Materials," NUREG/CR-2340, U.S. Nuclear Regulatory Commission, Washington, DC, 1981.
Rogers, V. C., et al., "Measurements and Calculations of Radon Flux Attenuation by Western U.S. Soils," Fifth Symposium on Management of Uranium Mill Tailings, Fort Collins, CO, 1982.
Rogers, V. C., et al., "Radon Attenuation with Earthen Covers - 1983 Annual Report," RAE-36-3, Rogers and Associates Engineering Corp., Salt Lake City, UT, 1983.
Silker, W. B., and P. C. Heasler, "Diffusion and Exhalation of Radon From Uranium Mill Tailings," NUREG/CR-1138, U.S. Nuclear Regulatory Commission, Washington, DC, 1979.
Strong, K. P., et al., "Radon Diffusion Through Uranium Tailings and Earth Covers," International Conference on Radiation Hazards in Mining: Control Measurement and Medical Aspects, Golden, Colorado, published by AIME, New York, NY, pp. 713-719, 1981.
Strong, K. P., and D. M. Levins, "Effect of Moisture Content on Radon Emanation from Uranium Ore and Tailings," Health Physics, Vol. 42, No. 1, pp. 27-32, 1982.
U.S. Environmental Protection Agency, "Environmental Standards for Uranium and Thorium Mill Tailings at Licensed Commercial Processing Sites; Final Rule," Federal Register, October 7, 1983.
3.59-34
U.S. Nuclear Regulatory Commission, "The Uranium Dispersion and Dosimetry (UDAD) Code," NUREG/CR-0553, ANL/ES-72, prepared.by M. H. Momeni, Y. Yuan, and A. J. Zielen, Argonne National Laboratory, Argonne, IL, for the USNRC, Washington, DC, 1979.
3.59-35
VALUE/IMPACT STATEMENT
A draft value/impact statement was published with the draft version of this guide, task WM 407-4, when the draft guide was published for public comment in April 1986. No changes were necessary, so a separate value/impact statement for the final guide has not been prepared. A copy of the draft value/impact statement is available for inspection and copying for a fee at the Commission's Public Document Room at 1717 H Street NW., Washington, DC, under Task WM 407-4.
UNITED STATES NUCLEAR REGULATORY COMMISSION
WASHINGTON, D.C. 20555
OFFICIAL BUSINESS PENALTY FOR PRIVATE USE, $300
FIRST CLASS MAIL POSTAGE & FEES PAID
USNRC
PERMIT No. 0-47
3.59-36