Bridgewater State University Virtual Commons - Bridgewater ...
date post
20-Dec-2015Category
view
219download
1
1 Bridgewater 1 Global Investment Management
BRIDGEWATER ASSOCIATES
Alpha Wars: Survival of the Fittest
October 2005
One Glendinning PlaceWestport, CT 06880
(203) 226-3030www.bwater.com
Bob PrinceCo-Chief Investment Officer
2 Bridgewater 2 Global Investment Management
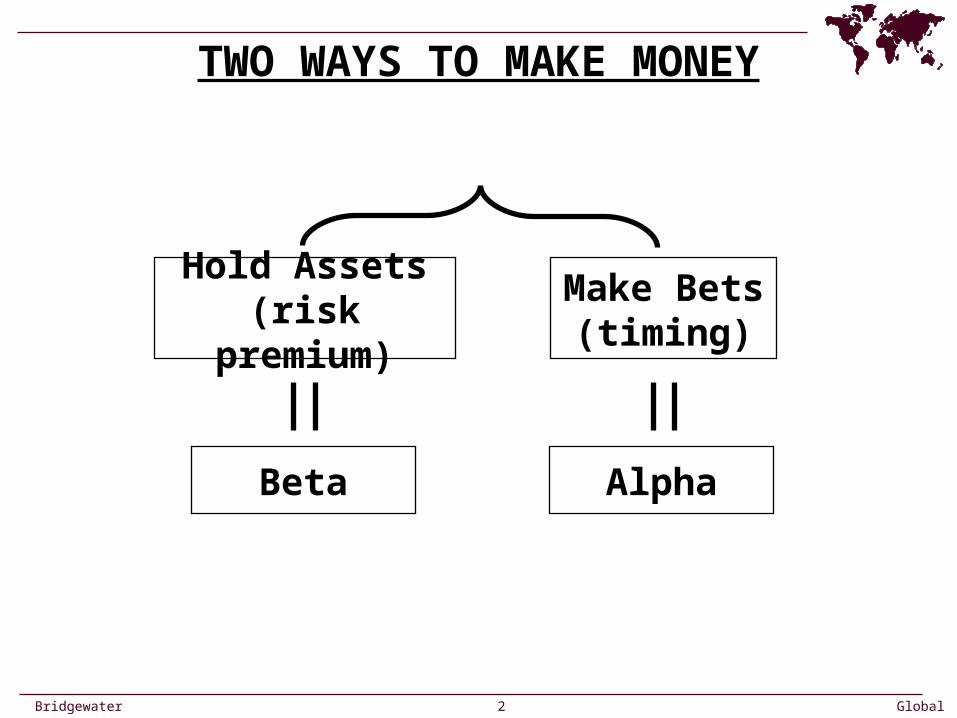
TWO WAYS TO MAKE MONEY
AlphaBeta
Hold Assets(risk premium)
Make Bets (timing)
3 Bridgewater 3 Global Investment Management
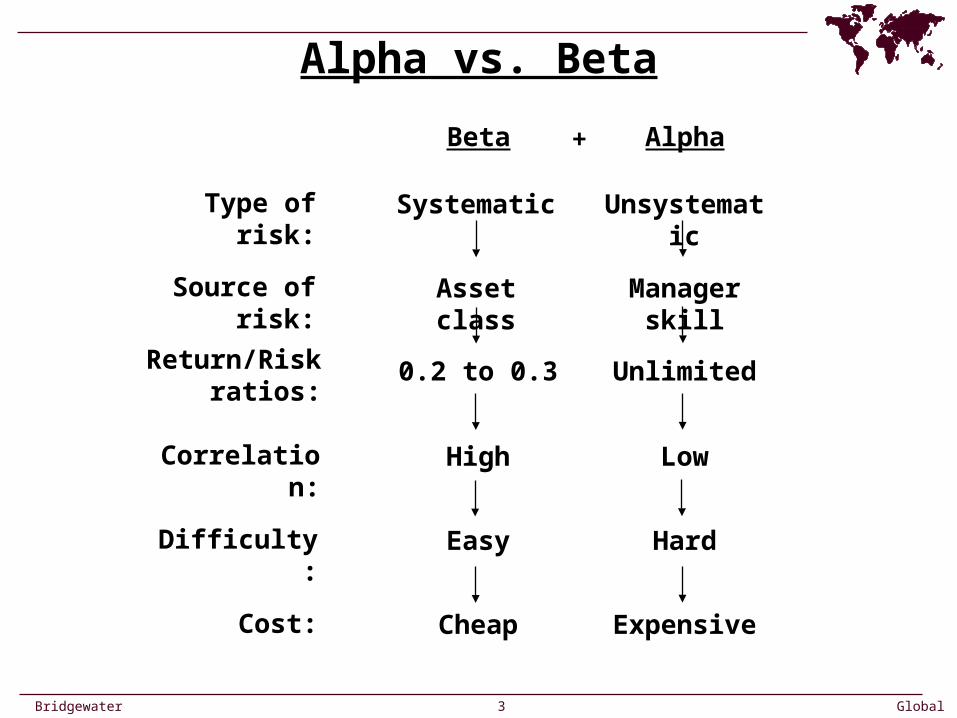
Beta +
Type of risk:
Alpha
Source of risk:
Correlation:
Return/Risk ratios:
Difficulty:
Cost:
Systematic Unsystematic
Asset class Manager skill
0.2 to 0.3
High
Unlimited
Low
ExpensiveCheap
HardEasy
Alpha vs. Beta
4 Bridgewater 4 Global Investment Management
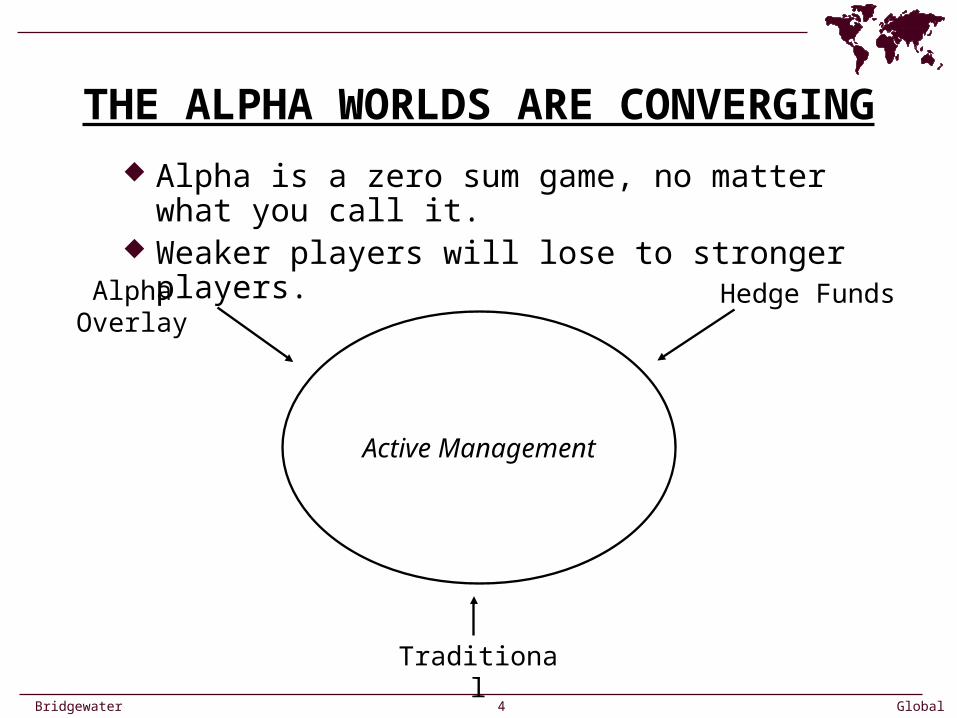
THE ALPHA WORLDS ARE CONVERGING
Alpha is a zero sum game, no matter what you call it. Weaker players will lose to stronger players.
Active Management
Alpha Overlay
Traditional
Hedge Funds
5 Bridgewater 5 Global Investment Management
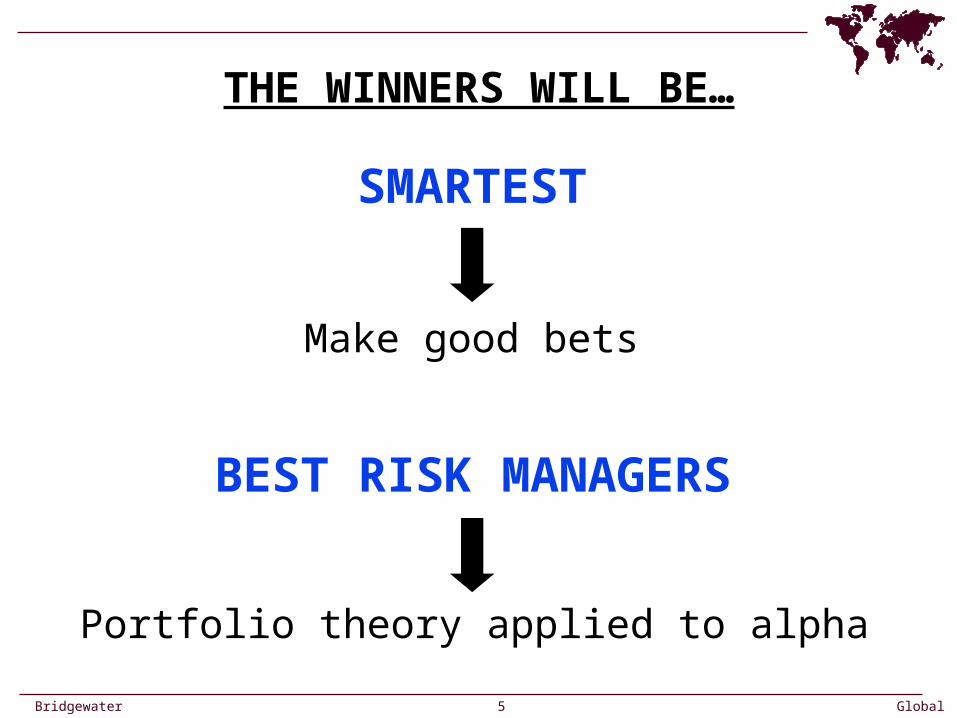
THE WINNERS WILL BE…
SMARTEST
BEST RISK MANAGERS
Make good bets
Portfolio theory applied to alpha
6 Bridgewater 6 Global Investment Management
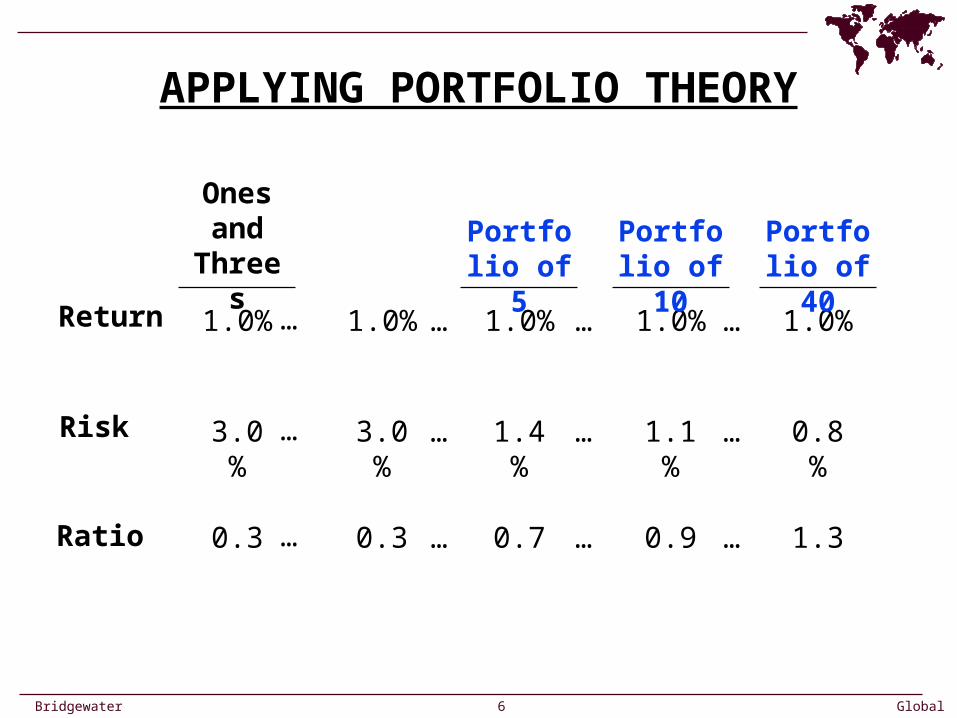
APPLYING PORTFOLIO THEORY
Return
Risk
Ratio
1.0%
3.0%
0.3
Portfolio of 5
Ones and
Threes
…
…
…
1.0%
3.0%
0.3
…
…
…
1.0%
1.4%
0.7
…
…
…
1.0%
1.1%
0.9
…
…
…
1.0%
0.8%
1.3
Portfolio of 10
Portfolio of 40
7 Bridgewater 7 Global Investment Management
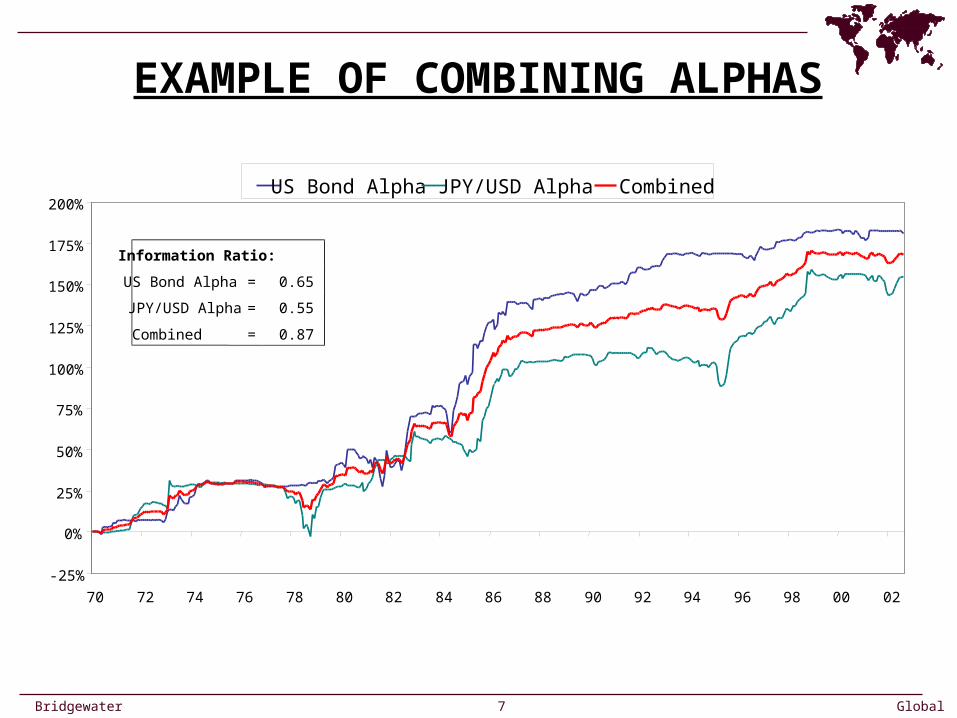
EXAMPLE OF COMBINING ALPHAS
-25%
0%
25%
50%
75%
100%
125%
150%
175%
200%
70 72 74 76 78 80 82 84 86 88 90 92 94 96 98 00 02
US Bond Alpha JPY/USD Alpha Combined
Information Ratio:
US Bond Alpha = 0.65
JPY/USD Alpha = 0.55
Combined = 0.87
8 Bridgewater 8 Global Investment Management
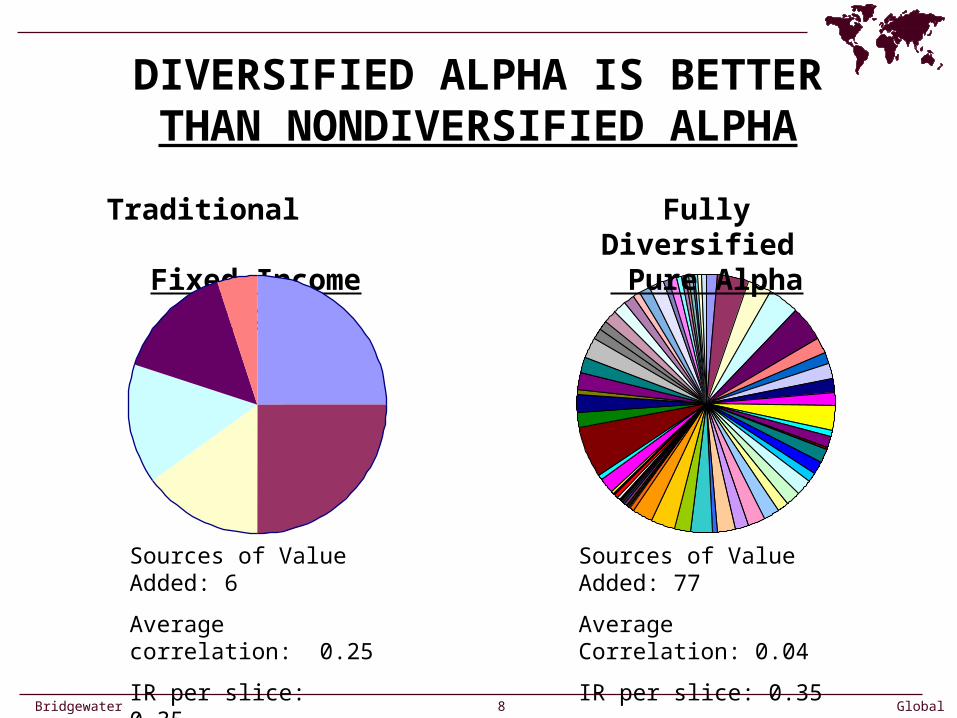
DIVERSIFIED ALPHA IS BETTERTHAN NONDIVERSIFIED ALPHA
Traditional Fixed Income Mandate
Fully Diversified Pure Alpha
Sources of Value Added: 77
Average Correlation: 0.04
IR per slice: 0.35
Implied IR: 1.40
Sources of Value Added: 6
Average correlation: 0.25
IR per slice: 0.35
Implied IR: 0.56
9 Bridgewater 9 Global Investment Management
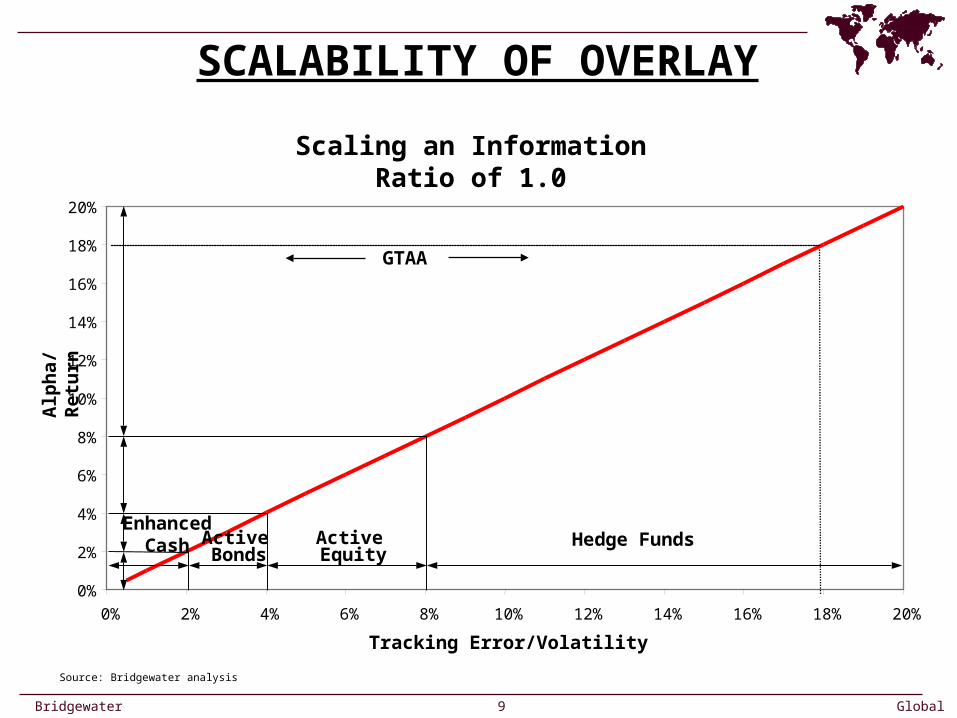
Scaling an Information Ratio of 1.0
0%
2%
4%
6%
8%
10%
12%
14%
16%
18%
20%
0% 2% 4% 6% 8% 10% 12% 14% 16% 18% 20%
Tracking Error/Volatility
Alp
ha/
Ret
urn
Active EquityBonds
Enhanced Cash Hedge Funds
Source: Bridgewater analysis
GTAA
SCALABILITY OF OVERLAY
Active
10 Bridgewater 10 Global Investment Management
OPTIMAL ALPHA REQUIRES
Positive Expected Return
No systematic risk
High sample size
Risk targeting ability
Integration with benchmarks
11 Bridgewater 11 Global Investment Management
Hedge Funds: Alpha or Beta?
12 Bridgewater 12 Global Investment Management
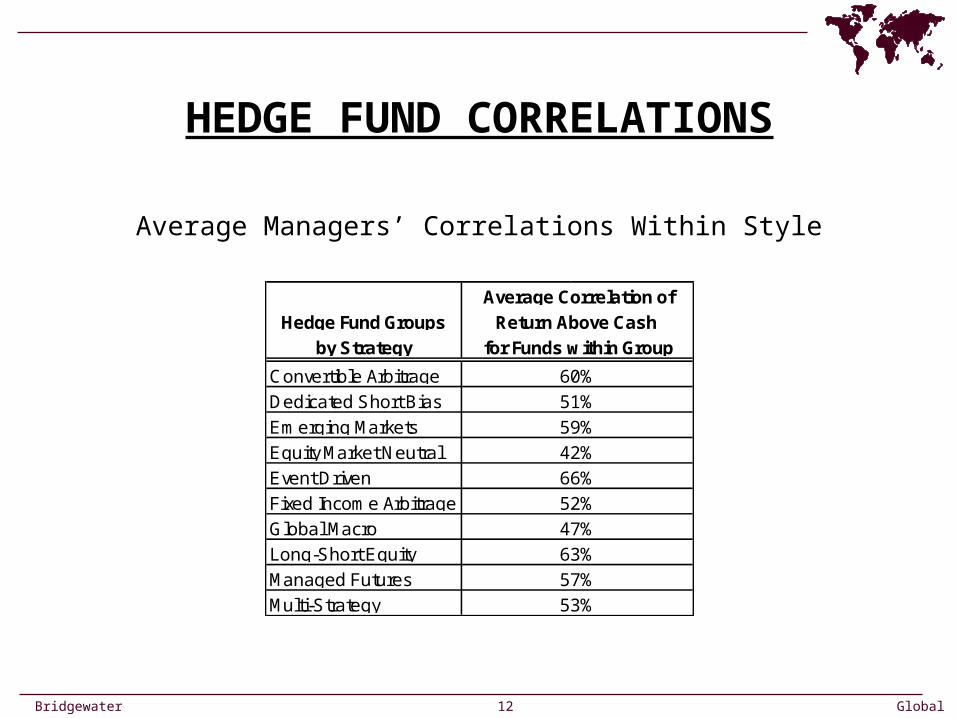
HEDGE FUND CORRELATIONS
Long-Short Equity
Managed Futures
Multi-Strategy
63%
57%
53%
Convertible Arbitrage
Dedicated Short Bias
Emerging Markets
Equity Market Neutral
Event Driven
Fixed Income Arbitrage
Global Macro
42%
66%
52%
47%
60%
51%
59%
Hedge Fund Groups
by Strategy
Average Correlation of
Return Above Cash
for Funds within Group
Average Managers’ Correlations Within Style
13 Bridgewater 13 Global Investment Management
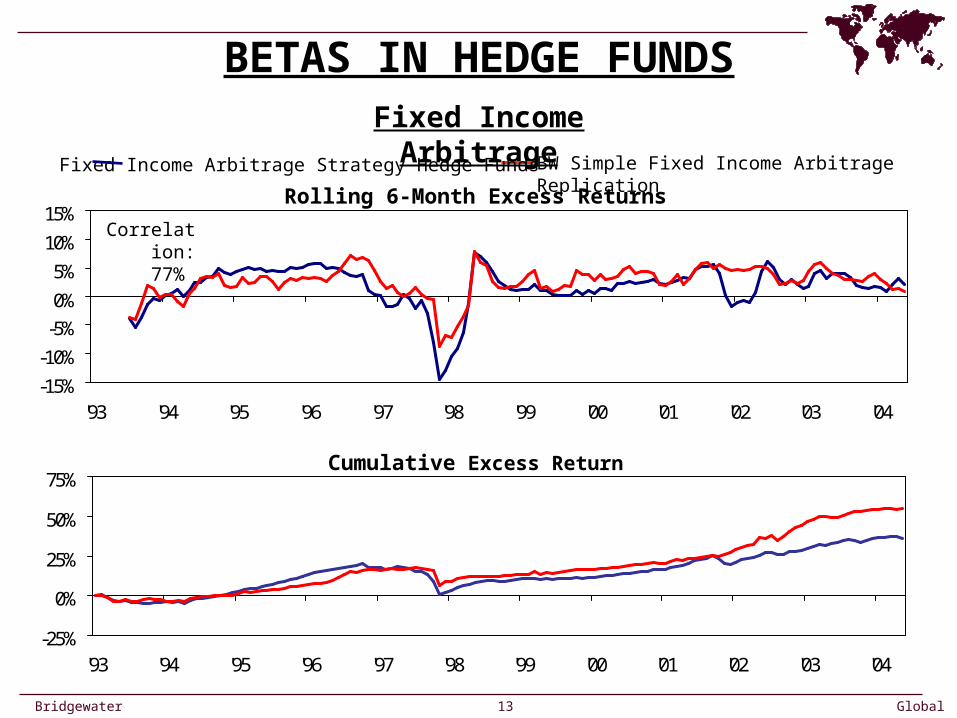
BETAS IN HEDGE FUNDSFixed Income Arbitrage
-15%
-10%
-5%
0%
5%
10%
15%
'93 '94 '95 '96 '97 '98 '99 '00 '01 '02 '03 '04
-25%
0%
25%
50%
75%
'93 '94 '95 '96 '97 '98 '99 '00 '01 '02 '03 '04
Rolling 6-Month Excess Returns
Cumulative Excess Return
Correlation: 77%
Fixed Income Arbitrage Strategy Hedge Funds BW Simple Fixed Income Arbitrage Replication
14 Bridgewater 14 Global Investment Management
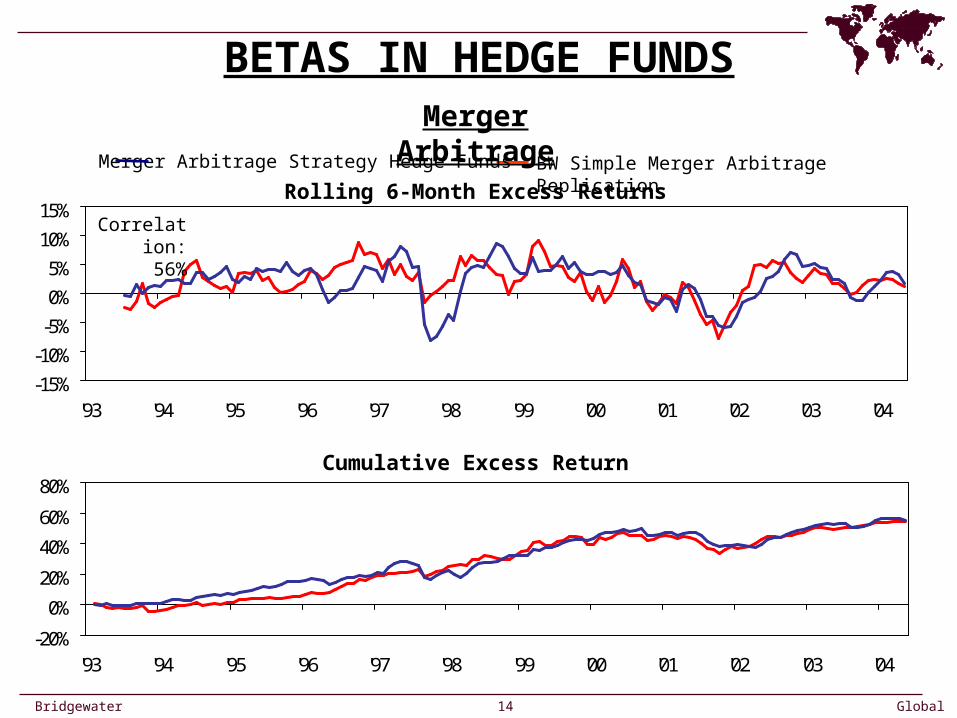
BETAS IN HEDGE FUNDSMerger Arbitrage
-15%
-10%
-5%
0%
5%
10%
15%
'93 '94 '95 '96 '97 '98 '99 '00 '01 '02 '03 '04
-20%
0%
20%
40%
60%
80%
'93 '94 '95 '96 '97 '98 '99 '00 '01 '02 '03 '04
Rolling 6-Month Excess Returns
Cumulative Excess Return
Correlation:56%
Merger Arbitrage Strategy Hedge Funds BW Simple Merger Arbitrage Replication
15 Bridgewater 15 Global Investment Management
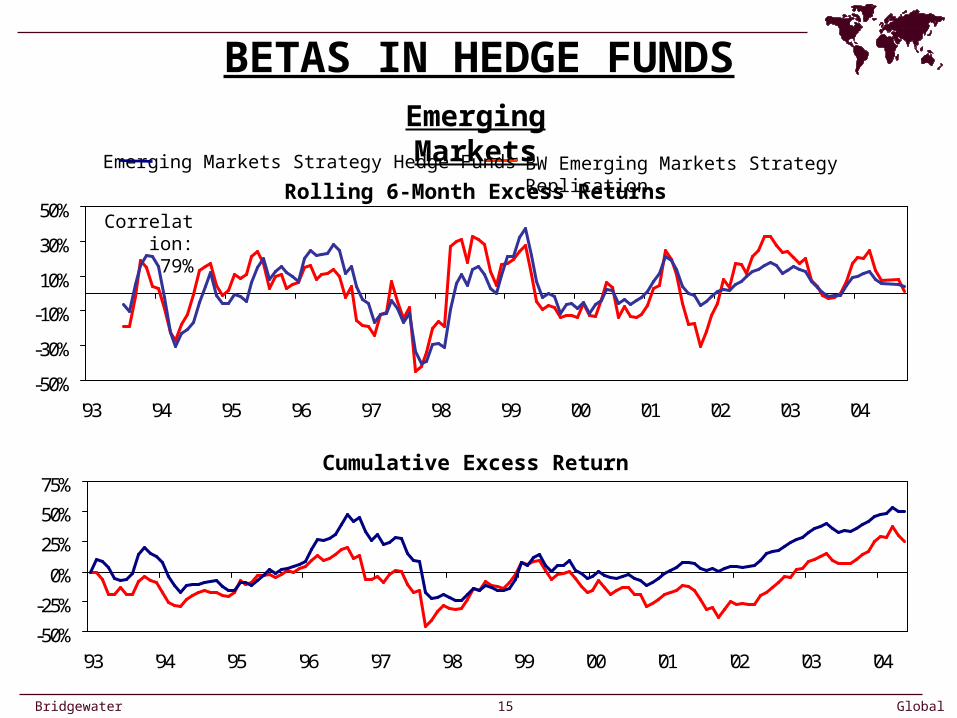
BETAS IN HEDGE FUNDSEmerging Markets
-50%
-30%
-10%
10%
30%
50%
'93 '94 '95 '96 '97 '98 '99 '00 '01 '02 '03 '04
-50%
-25%
0%
25%
50%
75%
'93 '94 '95 '96 '97 '98 '99 '00 '01 '02 '03 '04
Rolling 6-Month Excess Returns
Cumulative Excess Return
Correlation:79%
Emerging Markets Strategy Hedge Funds BW Emerging Markets Strategy Replication
16 Bridgewater 16 Global Investment Management
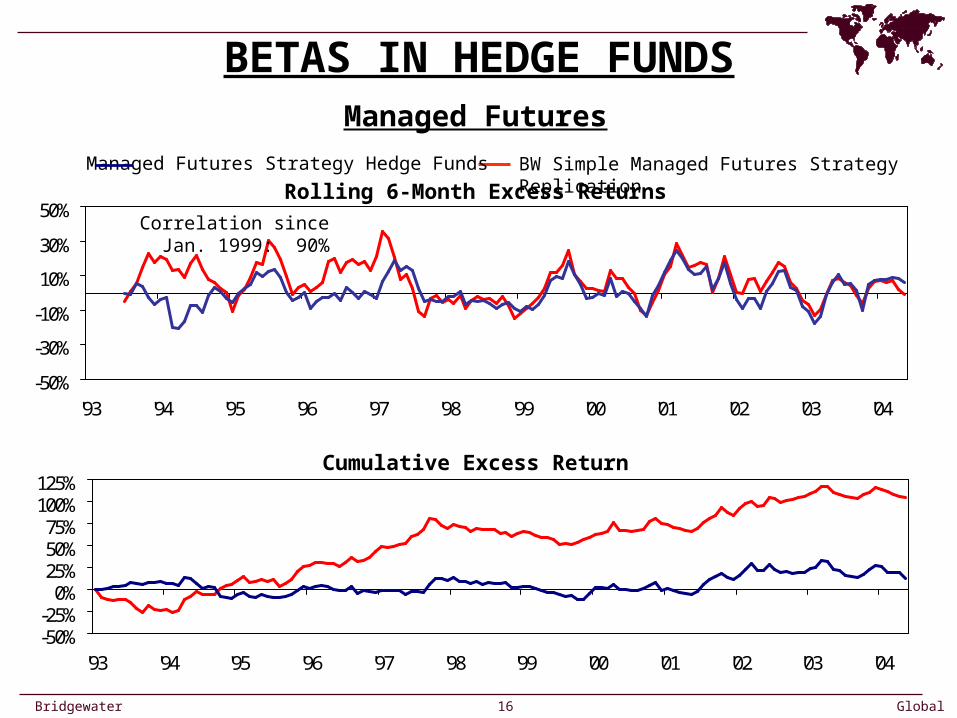
BETAS IN HEDGE FUNDS
-50%
-30%
-10%
10%
30%
50%
'93 '94 '95 '96 '97 '98 '99 '00 '01 '02 '03 '04
-50%-25%
0%25%50%75%
100%125%
'93 '94 '95 '96 '97 '98 '99 '00 '01 '02 '03 '04
Rolling 6-Month Excess Returns
Cumulative Excess Return
Managed Futures
Correlation since Jan. 1999: 90%
Managed Futures Strategy Hedge Funds BW Simple Managed Futures Strategy Replication
17 Bridgewater 17 Global Investment Management
APPLYING HEDGE FUNDS
Are you getting alpha or beta?
Diversify.
Allocate based on alpha/beta targets.
Overlay HF alpha onto optimal beta.

18 Bridgewater 18 Global Investment Management
MONEY MIGRATION
% of Total AUM (Scaled to 5% TE)
0%
10%
20%
30%
40%
50%
60%
70%
80%
90%
100%
1991 1992 1993 1994 1995 1996 1997 1998 1999 2000 2001 2002 2003 2004 2005
Alpha Overlay Traditional
19 Bridgewater 19 Global Investment Management
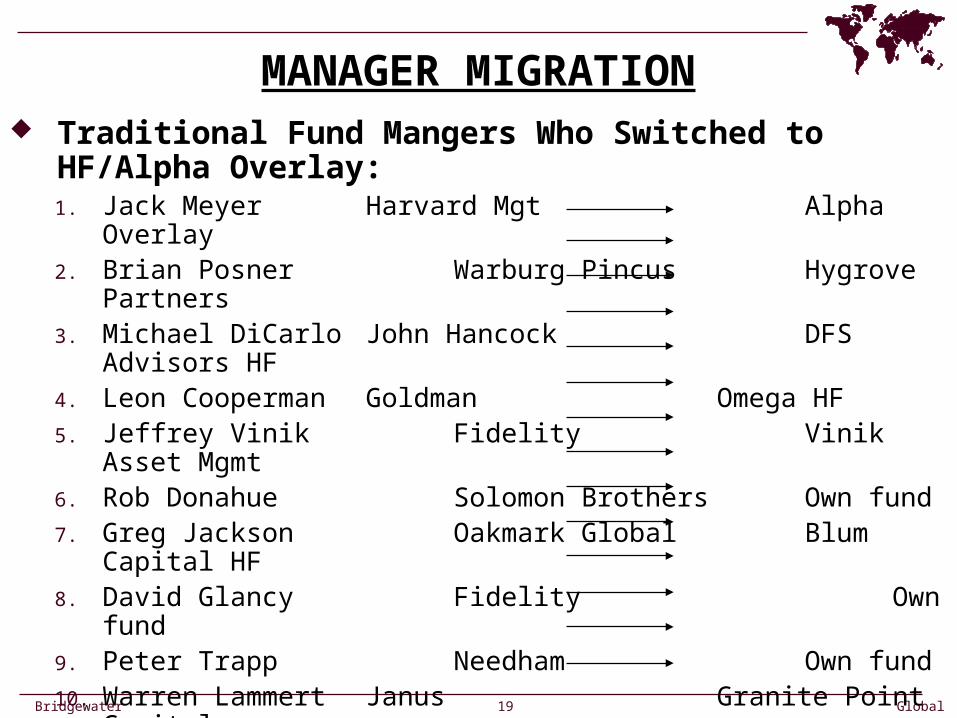
MANAGER MIGRATION Traditional Fund Mangers Who Switched to HF/Alpha Overlay:
1. Jack Meyer Harvard Mgt Alpha Overlay2. Brian Posner Warburg Pincus Hygrove Partners3. Michael DiCarlo John Hancock DFS Advisors HF4. Leon Cooperman Goldman Omega HF5. Jeffrey Vinik Fidelity Vinik Asset Mgmt6. Rob Donahue Solomon Brothers Own fund7. Greg Jackson Oakmark Global Blum Capital HF8. David Glancy Fidelity Own fund9. Peter Trapp Needham Own fund10. Warren Lammert Janus Granite Point Capital11. Nicholas Tiller Fidelity Hedge fund12. Chirstopher Zepf Fidelity Hedge fund13. Dan Szemis Merrill Lynch Hedge fund14. Gary Schlarbaum Morgan Stanley Schlarbaum Capital
20 Bridgewater 20 Global Investment Management
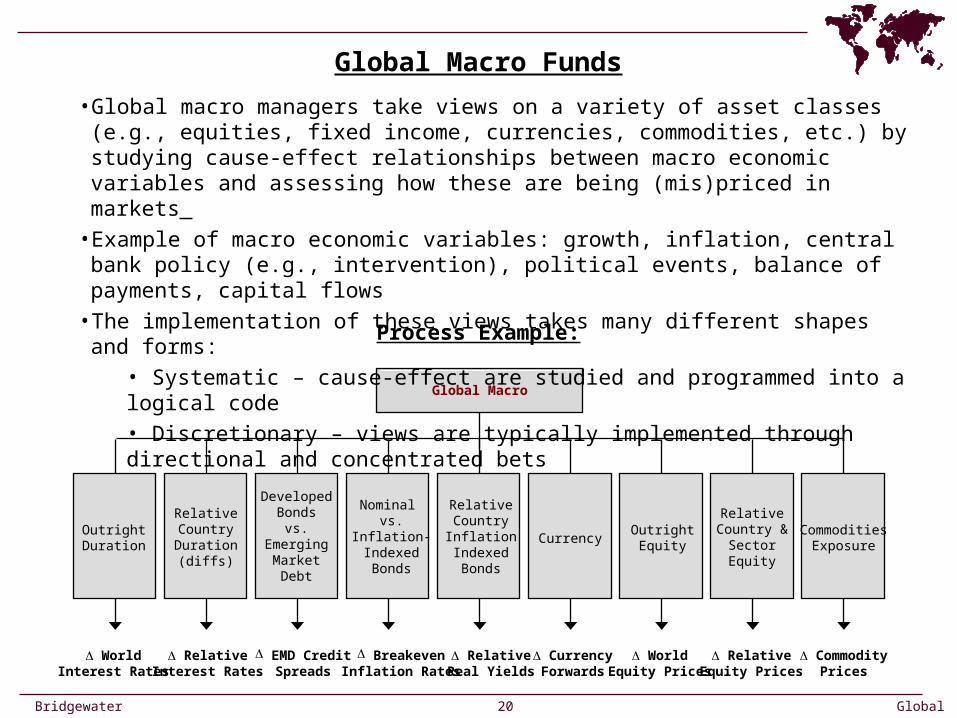
Global Macro Funds
Global Macro
WorldInterest Rates
OutrightDuration
RelativeInterest Rates
RelativeCountryDuration
(diffs)
WorldEquity Prices
OutrightEquity
CurrencyForwards
Currency
RelativeReal Yields
RelativeCountryInflationIndexedBonds
RelativeEquity Prices
RelativeCountry &
SectorEquity
CommoditiesExposure
CommodityPrices
Nominal vs.
Inflation-IndexedBonds
BreakevenInflation Rates
EMD CreditSpreads
DevelopedBonds
vs.Emerging
MarketDebt
Process Example:
• Global macro managers take views on a variety of asset classes (e.g., equities, fixed income, currencies, commodities, etc.) by studying cause-effect relationships between macro economic variables and assessing how these are being (mis)priced in markets
• Example of macro economic variables: growth, inflation, central bank policy (e.g., intervention), political events, balance of payments, capital flows
• The implementation of these views takes many different shapes and forms:
• Systematic – cause-effect are studied and programmed into a logical code
• Discretionary – views are typically implemented through directional and concentrated bets
21 Bridgewater 21 Global Investment Management
Fixed Income Arbitrage
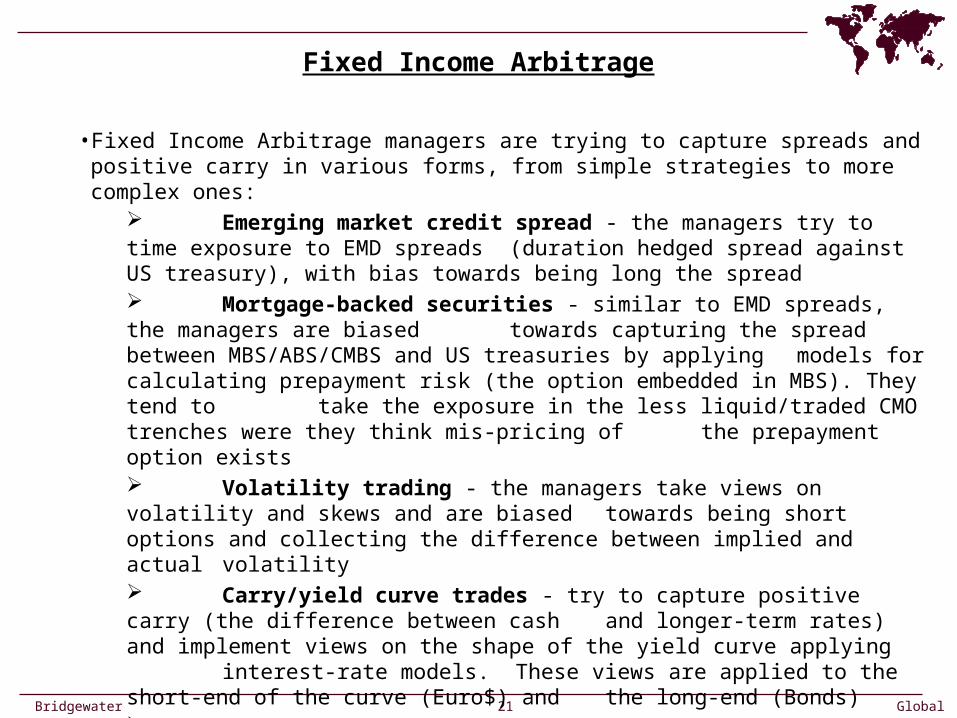
• Fixed Income Arbitrage managers are trying to capture spreads and positive carry in various forms, from simple strategies to more complex ones:
Emerging market credit spread - the managers try to time exposure to EMD spreads (duration hedged spread against US treasury), with bias towards being long the spread Mortgage-backed securities - similar to EMD spreads, the managers are biased
towards capturing the spread between MBS/ABS/CMBS and US treasuries by applying models for calculating prepayment risk (the option embedded in MBS). They tend to take the exposure in the less liquid/traded CMO trenches were they think mis-pricing of the prepayment option exists Volatility trading - the managers take views on volatility and skews and are biased towards being short options and collecting the difference between implied and actual volatility Carry/yield curve trades - try to capture positive carry (the difference between cash and longer-term rates) and implement views on the shape of the yield curve applying interest-rate models. These views are applied to the short-end of the curve (Euro$) and the long-end (Bonds) Currency - managers take some active views on currencies, primarily based on
interest rate diffs between countries