0 Add Math Project Work
29
PROJECT WORK FOR ADDITIONAL MATHEMATHICS 2010 CURRICULUM DEVELOPMENT DIVISION MINISTRY OF EDUCATION MALAYSIA PROJECT WORK 4 STATISTICS NAME : MUHAMMAD DARWISY AL-HAFIZ BIN MOHD IBRAHIM CLASS : 5 SCIENCE 1 IC NUMBER : 930225-01-6291 SUBJECT TEACHER : PUAN JUAHRIAH BTE ALI SEKOLAH MENENGAH KEBANGSAAN TAMAN DAYA 2
Transcript of 0 Add Math Project Work

8/9/2019 0 Add Math Project Work
http://slidepdf.com/reader/full/0-add-math-project-work 1/28
PROJECT WORK FOR ADDITIONALMATHEMATHICS 2010
CURRICULUM DEVELOPMENT DIVISIONMINISTRY OF EDUCATION MALAYSIA
PROJECT WORK 4STATISTICS
NAME :MUHAMMAD DARWISY AL-HAFIZ BIN MOHD IBRAHIM
CLASS :5 SCIENCE 1
IC NUMBER :930225-01-6291
SUBJECT TEACHER :PUAN JUAHRIAH BTE ALI
SEKOLAH MENENGAH KEBANGSAAN
TAMAN DAYA 2
8/9/2019 0 Add Math Project Work
http://slidepdf.com/reader/full/0-add-math-project-work 2/28
INTRODUCTION
We students taking Additional Mathematics are required to carry out a
project work while we are in Form 5.This year the Curriculum
Development Division, Ministry of Education has prepared four tasks for
us.We are to choose and complete only ONE task based on our area of
interest.This project can be done in groups or individually, and I gladly
choose to do this individually.Upon completion of the Additional
Mathematics Project Work,we are to gain valuable experiences and able to :
• Apply and adapt a variety of problem solvingstrategies to solve routine and non-routine problems
• Experience classroom environments which arechallenging, interesting and meaningful and henceimprove their thinking skills
• Experience classroom environments whereknowledge and skills are applied in meaningful ways insolving real-life problems.
• Experience classroom environments where expressingones mathematical thinking,reasoning andcommunication are highly encouraged and expected
• Experience classroom environments that stimulatesand enhances effective learning.
• Acquire effective mathematical communication
8/9/2019 0 Add Math Project Work
http://slidepdf.com/reader/full/0-add-math-project-work 3/28
through oral and writing,and to use the language of
mathematics to express mathematical ideas correctly
and precisely
• Enhance acquisition of mathematical knowledge andskills through problem-solving in ways that increaseinterest and confidence
• Prepare ourselves for the demand of our futureundertakings and in workplace
• Realise that mathematics is an important andpowerful tool in solving real-life problems and hencedevelop positive attitude towards mathematics
• Train ourselves not only to be independent learners
but also to collaborate, to cooperate, and to shareknowledge in an engaging and healthy environment
• Use technology especially the ICT appropriately andeffectively
• Train ourselves to appreciate the intrinsic values of mathematics and to become more creative andinnovative
• Realize the importance and the beauty of mathematics
APPRECIATION
Alhamdullilah,thank you to Allah for giving the will to me to complete this
Additional Mathematics project.Secondly, I would like to thank the principle of
Sekolah Menengah Kebangsaan Taman Daya 2 , Puan Jamiaah Bte Kechut for
giving me the permission to do my this Additional Mathematics Project Work. I
also like to thank my Additional Mathematics teacher, Puan Juahriah Bte Ali for
the guide and giving useful and important information for me to complete this
project work. Besides that, I would like to thank my parents for their support and
encouragement. Lastly, a special thanks to all my friends for their help and
cooperation in searching for information and completing this project work.
8/9/2019 0 Add Math Project Work
http://slidepdf.com/reader/full/0-add-math-project-work 4/28
A BRIEF HISTORY OFSTATISTICSBy the 18th century, the term "statistics" designated the
systematic collection of demographic and economic data by states. In the early
19th century, the meaning of "statistics" broadened, then including the discipline
concerned with the
collection, summary, and analysis of data. Today statistics is widely employed in
government, business, and all the sciences. Electronic computers have expedited
statistical computation, and have allowed statisticians to develop "computer-
intensive" methods.
The term "mathematical statistics" designates the mathematical theories of probability
and statistical inference, which are used in statistical practice. The relation between
statistics and probability theory developed rather late, however. In the 19th century,
statistics increasingly used probability theory, whose initial results were found inthe17th and 18th centuries, particularly in the analysis of games of chance (gambling).
By 1800, astronomy used probability models and statistical theories, particularly the
method of least squares, which was invented by Legendre and Gauss. Early
probability theory and statistics was systematized and extended by Laplace; following
Laplace, probability and statistics have been in continual development. In the 19th
century, social scientists used statistical reasoning and probability models to advancethe new sciences of experimental psychology and sociology; physical scientists used
statistical reasoning and probability models to advance the new sciences of
thermodynamics and statistical mechanics. The development of statistical reasoning
was closely associated with the development of inductive logic and the scientific
method.

8/9/2019 0 Add Math Project Work
http://slidepdf.com/reader/full/0-add-math-project-work 5/28
Statistics is not a field of mathematics but an autonomous mathematical science, like
computer science or operations research. Unlike mathematics, statistics had its origins
in public administration and maintains a special concern with demography and
economics. Being concerned with the scientific method and inductive logic, statistical
theory has close association with the philosophy of science; with its emphasis on
learning from data and making best predictions, statistics has great overlap with the
decision science and microeconomics. With its concerns with data, statistics has
overlap with information science and computer science.
STATISTICS TODAY
During the 20th century, the creation of precise instruments for agricultural
research, public health concerns (epidemiology, biostatistics, etc.), industrial
quality control, and economic and social purposes (unemploymentrate,econometry, etc.) necessitated substantial advances in statistical practices.
Today the use of statistics has broadened far beyond its origins. Individuals
and organizations use statistics to understand data and make informed
decisions throughout the natural and social sciences, medicine, business, and
other areas.
Statistics is generally regarded not as a subfield of mathematics but rather as
a distinct, albeit allied, field. Many universities maintain separate
mathematics and statistics departments. Statistics is also taught in
departments as diverse as psychology, education, and public health.
8/9/2019 0 Add Math Project Work
http://slidepdf.com/reader/full/0-add-math-project-work 6/28
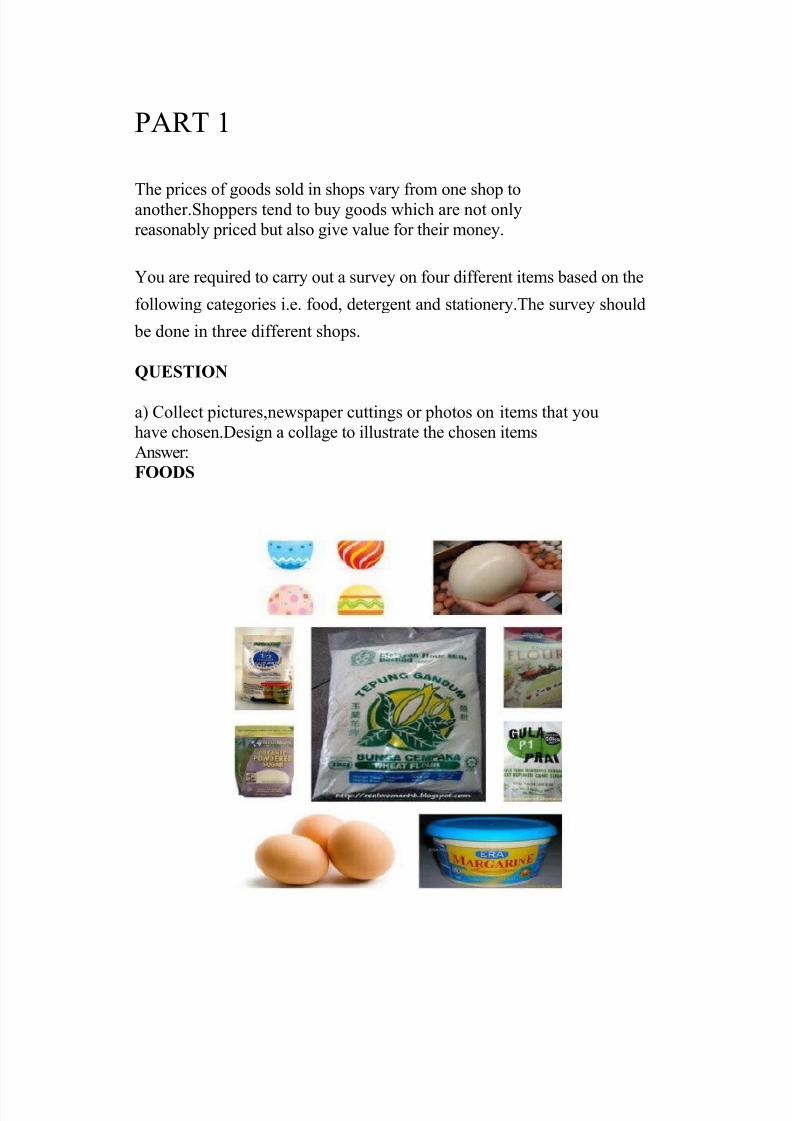
PART 1
The prices of goods sold in shops vary from one shop toanother.Shoppers tend to buy goods which are not onlyreasonably priced but also give value for their money.
You are required to carry out a survey on four different items based on the
following categories i.e. food, detergent and stationery.The survey should
be done in three different shops.
QUESTION
a) Collect pictures,newspaper cuttings or photos on items that youhave chosen.Design a collage to illustrate the chosen itemsAnswer:FOODS
8/9/2019 0 Add Math Project Work
http://slidepdf.com/reader/full/0-add-math-project-work 7/28
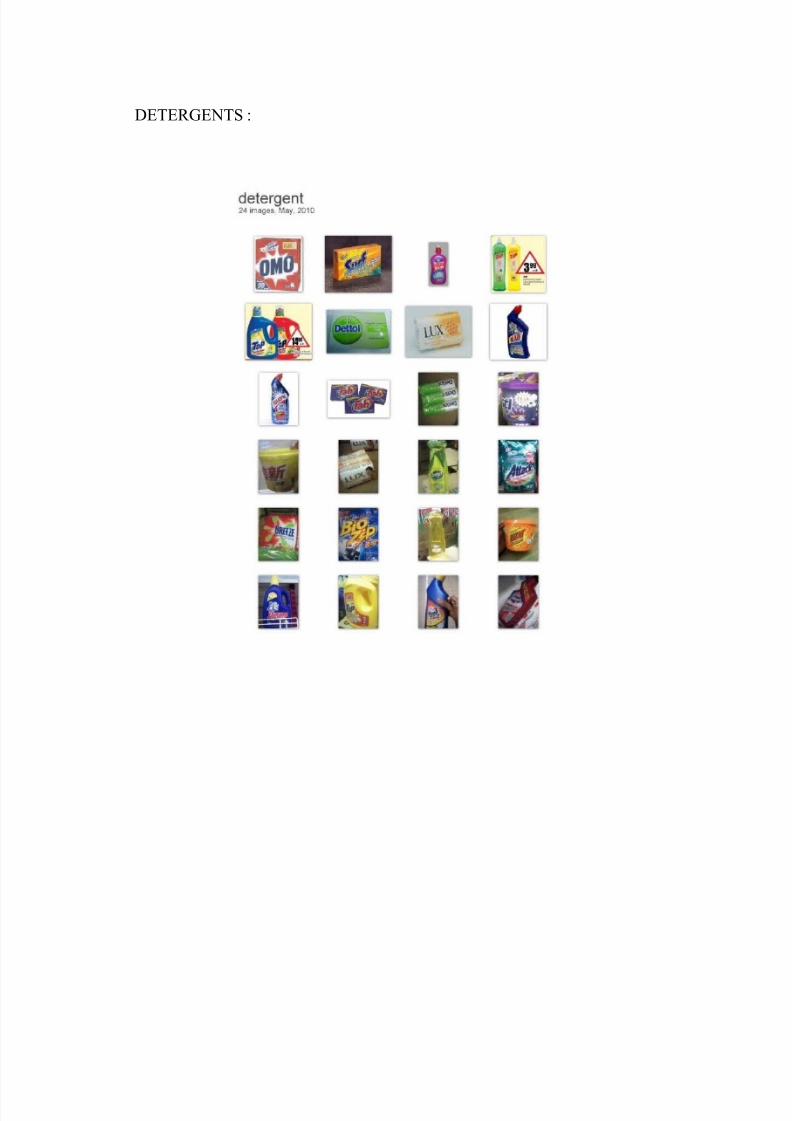
DETERGENTS :

8/9/2019 0 Add Math Project Work
http://slidepdf.com/reader/full/0-add-math-project-work 8/28
STATIONARY :

8/9/2019 0 Add Math Project Work
http://slidepdf.com/reader/full/0-add-math-project-work 9/28
(b) Record the items and their prices systematically as in Table 1.Since
items maybe differently packed,be sure to use consistent measurements for
each item selected so that comparison can be done easily and accurately.
Answer:
(b) Record the items and their prices systematically as in Table1.Since items maybe differently packed,be sure to use consistentmeasurements for each item selected so that comparison can bedone easily and accurately.
Answer:
PRICE(RM)CATEGORY ITEM KOOP KOOP KOOP
SARJANA IUI PUMFOOD 1.SELF-RAISING FLOUR
(1000 g) 4.00 3.70 3.602.SUGAR (1000g) 2.00 1.90 1.803.BUTTER (250g) 4.70 4.50 4.304.EGGS (GRADE A)
1DOZEN 5.90 5.50 5.00TOTAL PRICE 16.60 15.60 14.70
DETERGENT 1.SOAP (3 BARS) 3.20 3.00 2.802.LIQUID DISHWASHER
(1000ml) 4.29 3.90 3.203.CLOTHES DETERGENT
(3KG) 18.90 17.00 16.504.TOILET CLEANER
(500ml) 5.50 5.50 5.50TOTAL PRICE 31.89 29.40 28.00
STATIONERY 1.SHARPENER 1.50 1.30 1.002.PENCIL (2B) 1 DOZEN 5.00 4.80 4.50
3.PEN 1.30 1.20 1.004.ERASER 1.30 1.20 1.10
TOTAL PRICE 9.10 8.50 7.60GRAND TOTAL 57.59 53.50 50.30

8/9/2019 0 Add Math Project Work
http://slidepdf.com/reader/full/0-add-math-project-work 10/28
c) Create at least two suitable graphical representations (theuse of ICT is encouraged) to compare and contrast the price of the items chosen.
Answer:
1)FOODS

8/9/2019 0 Add Math Project Work
http://slidepdf.com/reader/full/0-add-math-project-work 11/28
(d) Based on the graphical representation that you haveconstructed in Part 1(c), interpret,discuss and drawconclusions.Comments on your findings.
Answer:
Based on the graphical representation that I have constructedin Part 1(c), it is shown that there are large and smalldifferences among the pries of items in each category betweenthe shops.In the food category, the smallest price differenceare of those sugar, while the highest is the price of eggs.Besides food, detergent also shows a large pricedifference between its items.Among them is the price of liquiddishwasher and clothes detergent.On the other hand,
stationery items doesn;t have any obvious price difference.Thegraph also show that most of the items that are high pricedcomes from the KOOP SARJANA, while the lowest price itemscome frm the KIOSK PUM.the graph 1(d) will show theconclusion of the difference among the shops based upon theshops grand total.
8/9/2019 0 Add Math Project Work
http://slidepdf.com/reader/full/0-add-math-project-work 12/28
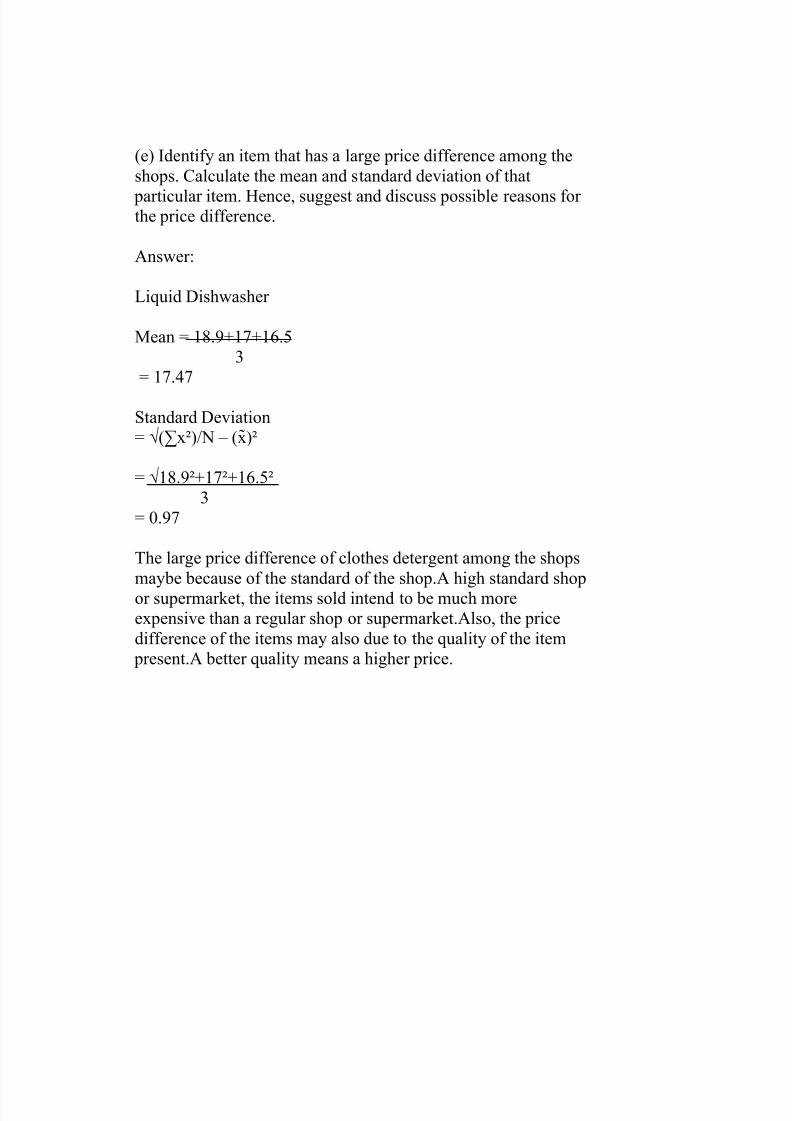
(e) Identify an item that has a large price difference among theshops. Calculate the mean and standard deviation of that
particular item. Hence, suggest and discuss possible reasons for the price difference.
Answer:
Liquid Dishwasher
Mean = 18.9+17+16.53
= 17.47
Standard Deviation= √(∑x²)/N – (x̃)²
= √18.9²+17²+16.5²3
= 0.97
The large price difference of clothes detergent among the shopsmaybe because of the standard of the shop.A high standard shopor supermarket, the items sold intend to be much moreexpensive than a regular shop or supermarket.Also, the pricedifference of the items may also due to the quality of the item present.A better quality means a higher price.
8/9/2019 0 Add Math Project Work
http://slidepdf.com/reader/full/0-add-math-project-work 13/28
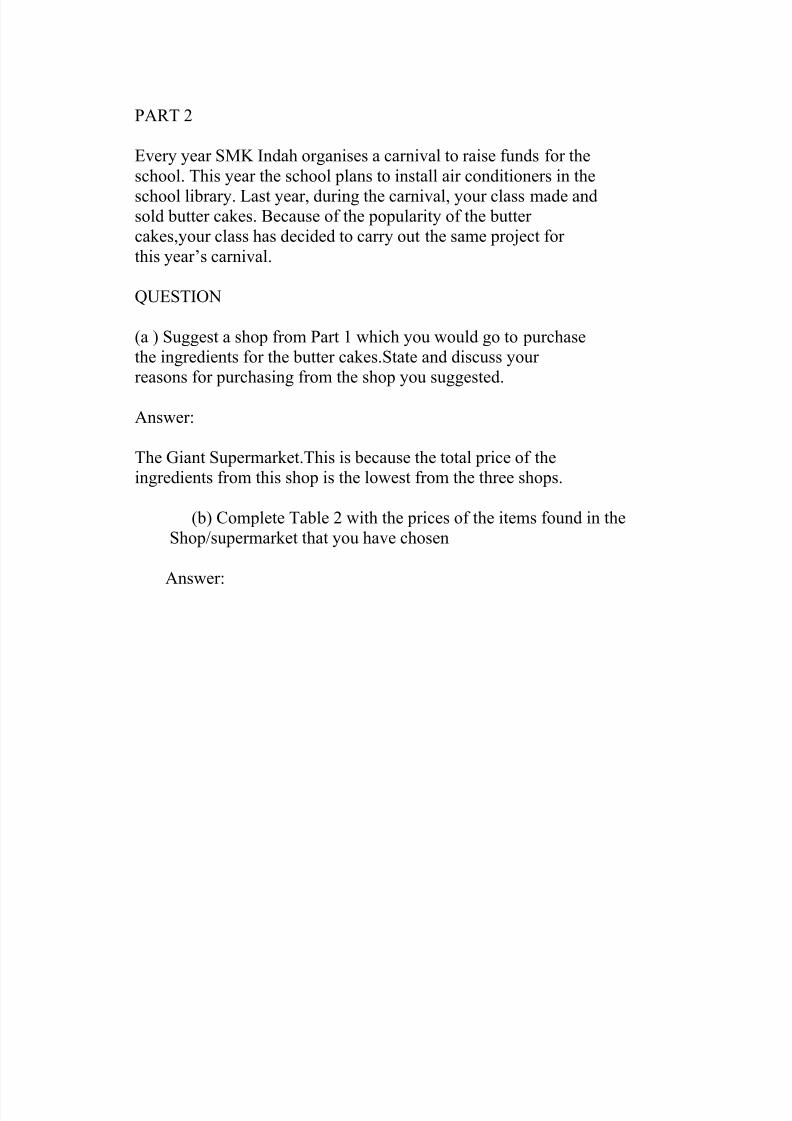
PART 2
Every year SMK Indah organises a carnival to raise funds for theschool. This year the school plans to install air conditioners in the
school library. Last year, during the carnival, your class made andsold butter cakes. Because of the popularity of the butter cakes,your class has decided to carry out the same project for this year’s carnival.
QUESTION
(a ) Suggest a shop from Part 1 which you would go to purchasethe ingredients for the butter cakes.State and discuss your reasons for purchasing from the shop you suggested.
Answer:
The Giant Supermarket.This is because the total price of theingredients from this shop is the lowest from the three shops.
(b) Complete Table 2 with the prices of the items found in theShop/supermarket that you have chosen
Answer:
8/9/2019 0 Add Math Project Work
http://slidepdf.com/reader/full/0-add-math-project-work 14/28
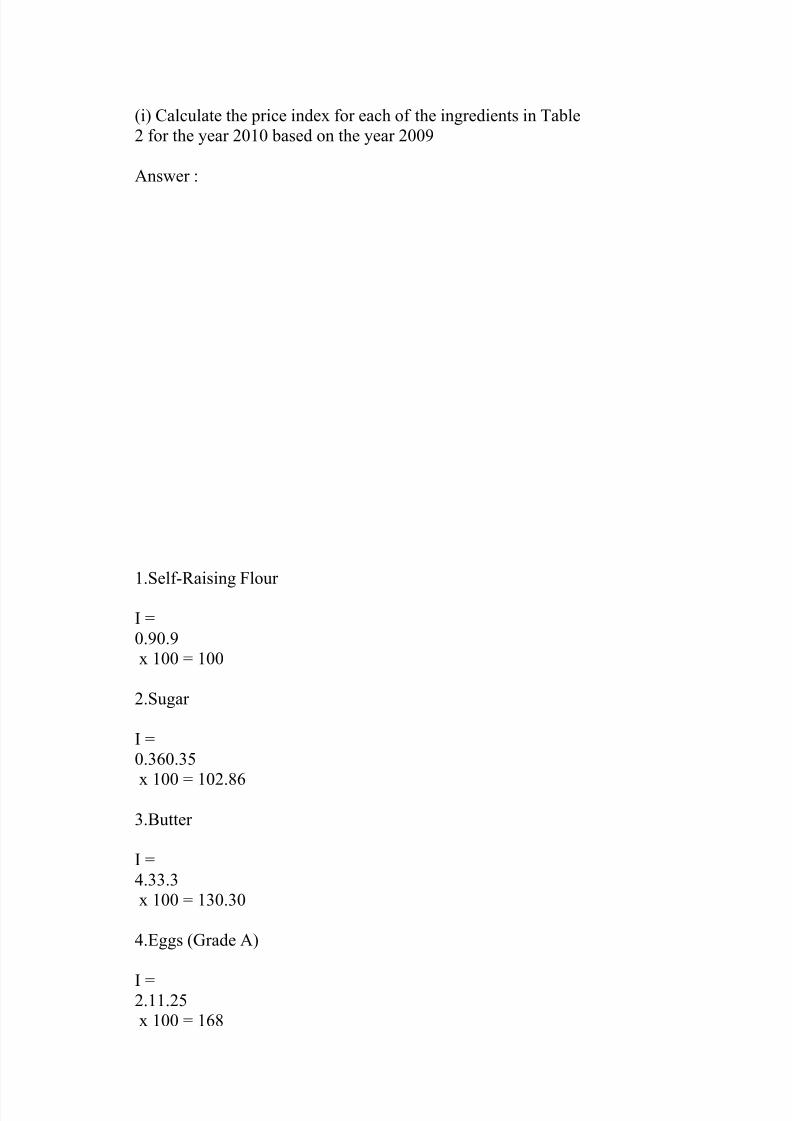
(i) Calculate the price index for each of the ingredients in Table2 for the year 2010 based on the year 2009
Answer :
1.Self-Raising Flour
I =0.90.9x 100 = 100
2.Sugar
I =0.360.35
x 100 = 102.863.Butter
I =4.33.3x 100 = 130.30
4.Eggs (Grade A)
I =2.11.25x 100 = 168
8/9/2019 0 Add Math Project Work
http://slidepdf.com/reader/full/0-add-math-project-work 15/28
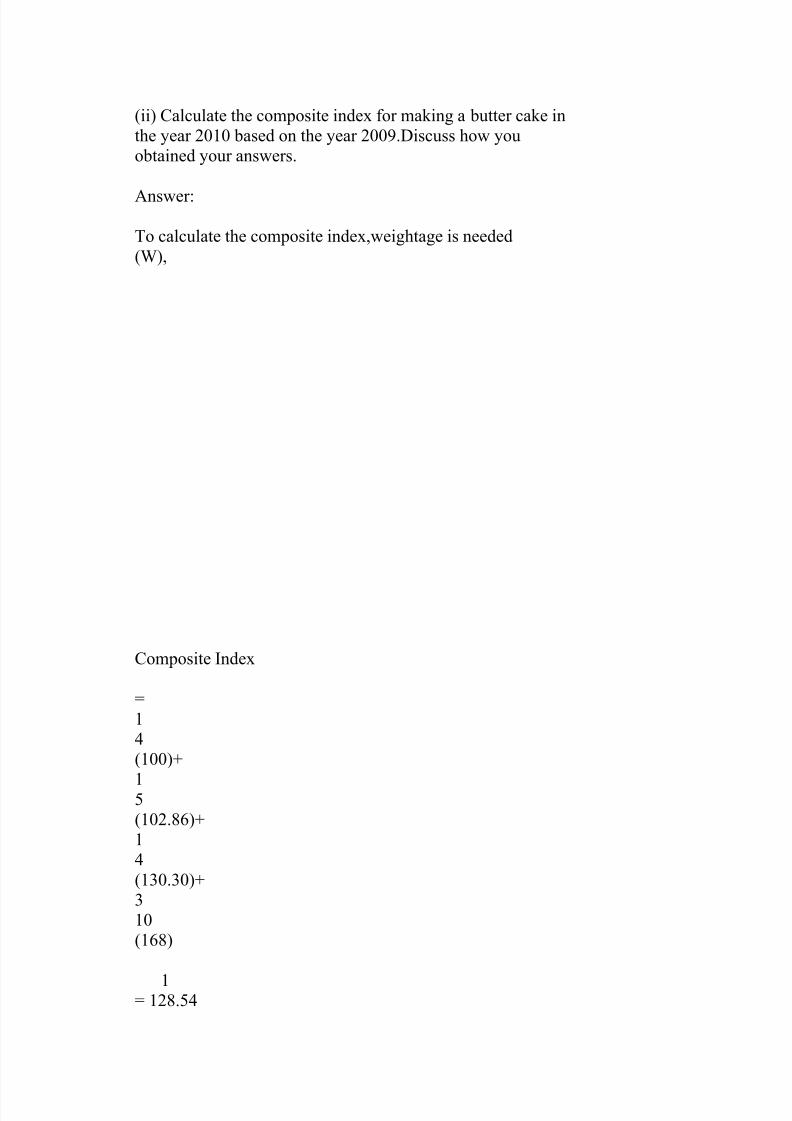
(ii) Calculate the composite index for making a butter cake inthe year 2010 based on the year 2009.Discuss how youobtained your answers.
Answer:
To calculate the composite index,weightage is needed(W),
Composite Index
=14(100)+
15(102.86)+14(130.30)+310(168)
1= 128.54
8/9/2019 0 Add Math Project Work
http://slidepdf.com/reader/full/0-add-math-project-work 16/28
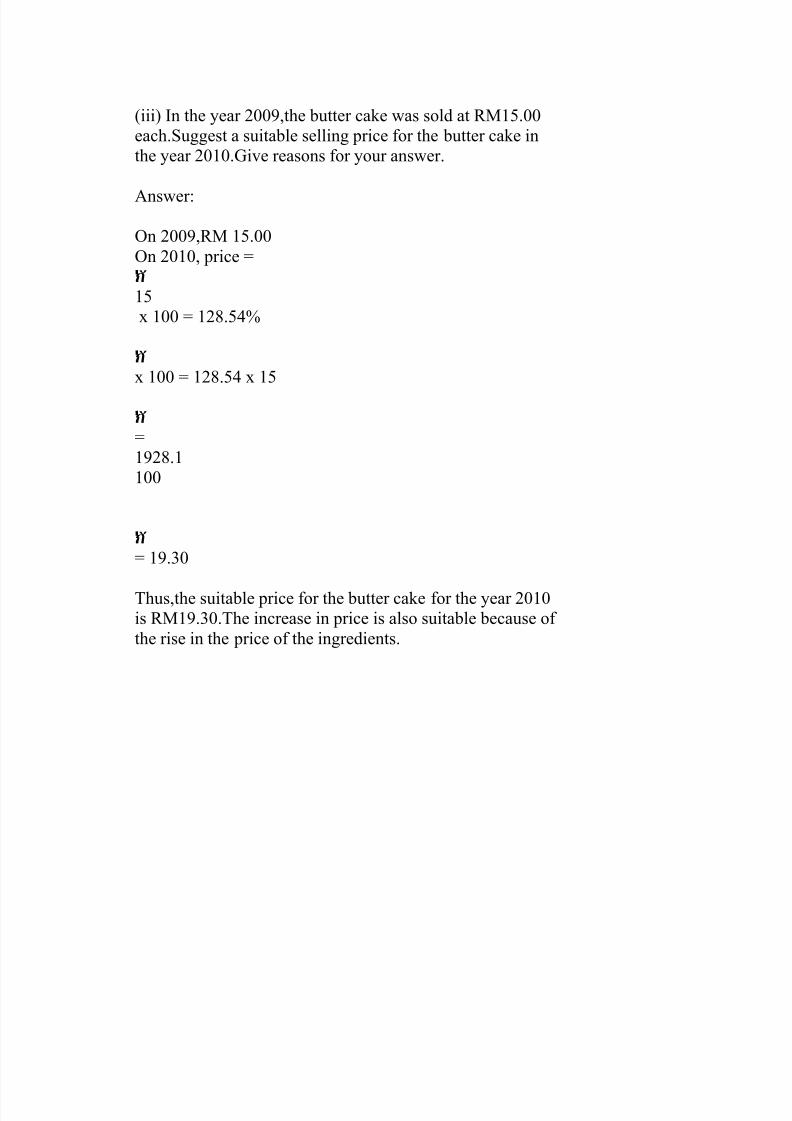
(iii) In the year 2009,the butter cake was sold at RM15.00each.Suggest a suitable selling price for the butter cake inthe year 2010.Give reasons for your answer.
Answer:
On 2009,RM 15.00On 2010, price =
15x 100 = 128.54%
x 100 = 128.54 x 15
=1928.1100
= 19.30
Thus,the suitable price for the butter cake for the year 2010is RM19.30.The increase in price is also suitable because of the rise in the price of the ingredients.

8/9/2019 0 Add Math Project Work
http://slidepdf.com/reader/full/0-add-math-project-work 17/28
(c)(i) Find out from reliable source how to determinesuitableCapacity of air conditioner to be installed based on
thevolume/size of a room.
Answer:
For common usage, air conditioner is rated according tohorse power (1HP), which is approximately 700W to 1000Wof electrical power. It is suitable for a room size 1000ft³which is around 27m³ of volume.
(ii) Work in group to estimate the volume of your schoolLibrary.Explain how you arrive at your answer.Hence,determine the number of air conditioners with theappropriate capacity required for your library.
Answer:
By using a measuring tape,the dimension for the library is:
Height = 3.6mWidth = 9.17mLength = 20.12m
Volume of the room = 3.6 x 9.17 x 20.12=664.20m³
1 unit of air conditioner is for 27m³For 664.20m³ =664.20
27 = 24.6
That means our school library needs 25 unit of air conditioner
8/9/2019 0 Add Math Project Work
http://slidepdf.com/reader/full/0-add-math-project-work 18/28
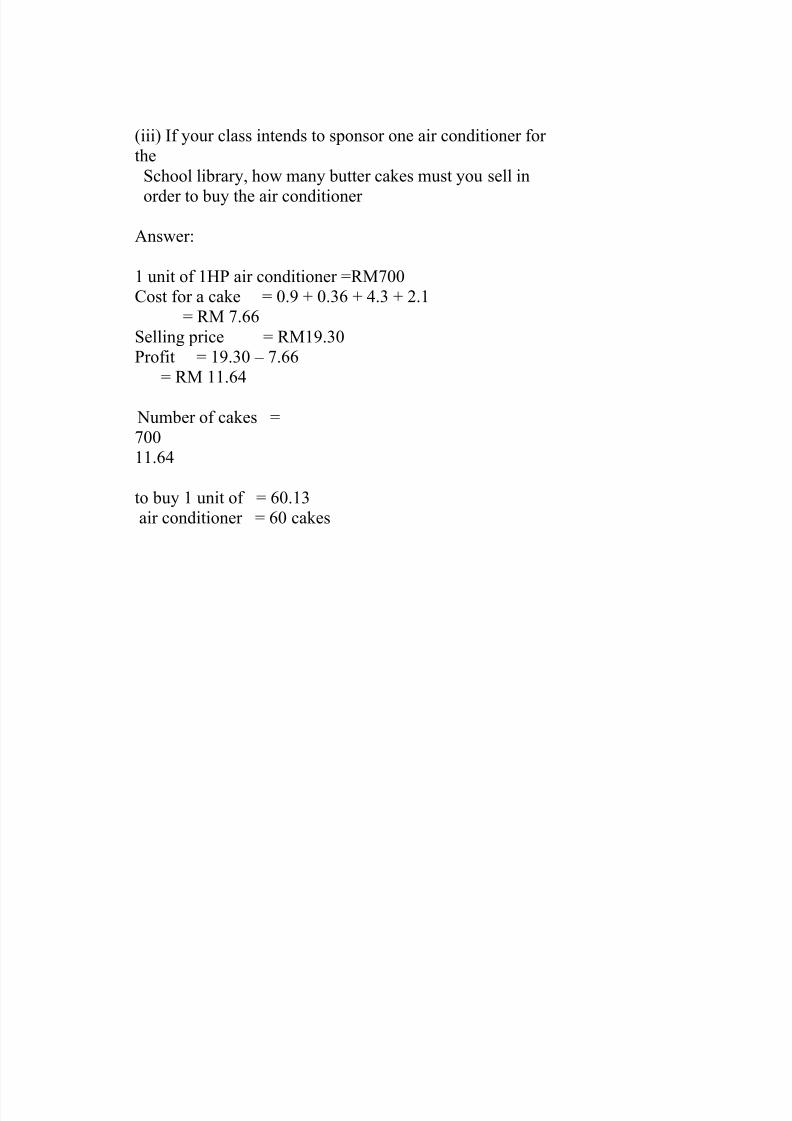
(iii) If your class intends to sponsor one air conditioner for theSchool library, how many butter cakes must you sell in
order to buy the air conditioner
Answer:
1 unit of 1HP air conditioner =RM700Cost for a cake = 0.9 + 0.36 + 4.3 + 2.1
= RM 7.66Selling price = RM19.30Profit = 19.30 – 7.66
= RM 11.64
Number of cakes =70011.64 to buy 1 unit of = 60.13air conditioner = 60 cakes
8/9/2019 0 Add Math Project Work
http://slidepdf.com/reader/full/0-add-math-project-work 19/28
PART 3
As a committee member for the carnival, you are required to prepare
an estimated budget to organize this year’s carnival. The committeehas to take into the consideration the increase in expenditure fromthe previous year due to inflation. The price of food, transportationand tents has increased by 15%. The cost of games, prizes anddecorations remains the same, whereas the cost of miscellaneousitems has increase by 30%.
QUESTION
(a) Complete Table 3 based on the information given above
Answer:

8/9/2019 0 Add Math Project Work
http://slidepdf.com/reader/full/0-add-math-project-work 20/28
(b) Calculate the composite index for the estimated budget of thecarnival in the year 2010 based on the year 2009. Comment onyour answer.
Answer:
Composite Index
I =∑�
∑
=115 12 +100 5 +115 3 +100 2 +100 6 +115 8 +130(4)
12+5+3+2+6+8+4
=446540
=111.625
The total price for the year 2010 increase by 11.625%.This is
becausesome price in the year 2009 increased in the year 2010.
8/9/2019 0 Add Math Project Work
http://slidepdf.com/reader/full/0-add-math-project-work 21/28
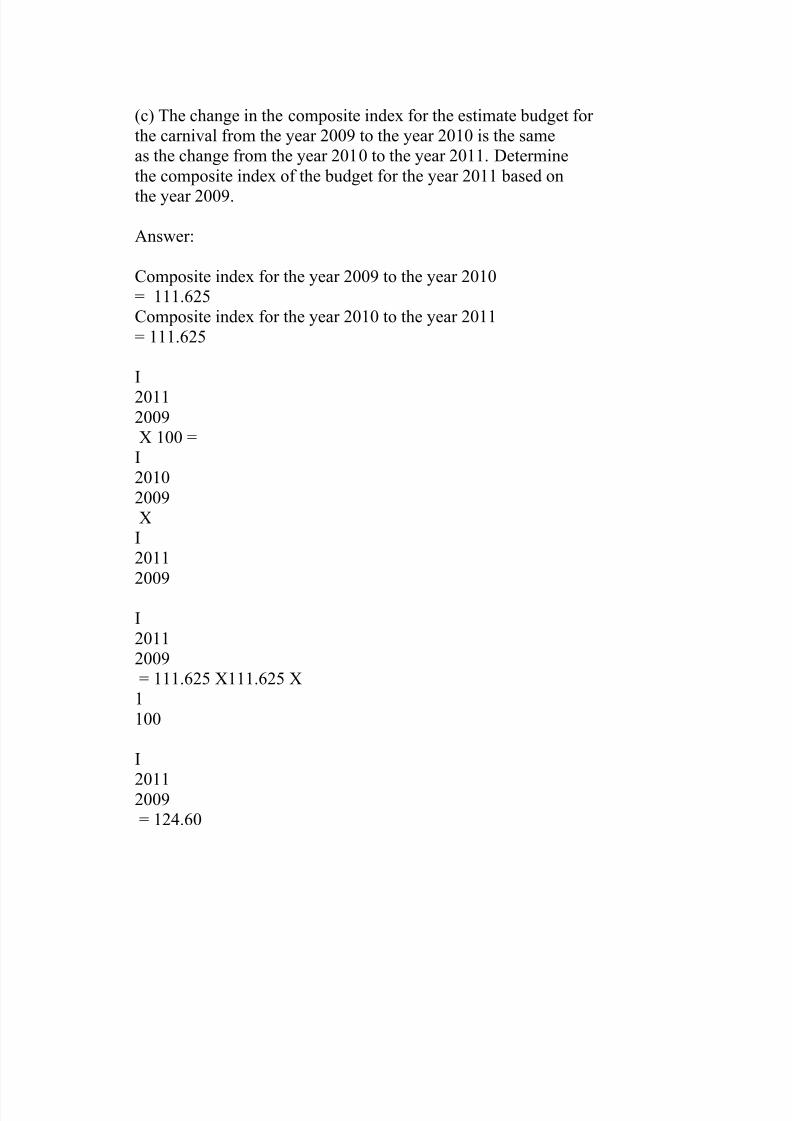
(c) The change in the composite index for the estimate budget for the carnival from the year 2009 to the year 2010 is the sameas the change from the year 2010 to the year 2011. Determinethe composite index of the budget for the year 2011 based on
the year 2009.
Answer:
Composite index for the year 2009 to the year 2010= 111.625Composite index for the year 2010 to the year 2011= 111.625
I
20112009X 100 =I20102009XI20112009 I20112009= 111.625 X111.625 X1100 I
20112009= 124.60
8/9/2019 0 Add Math Project Work
http://slidepdf.com/reader/full/0-add-math-project-work 22/28
FURTHER EXPLORATION
Index numbers are being used in many different daily situations,
for example air pollution index, stock market index, gold indexand property index.
Obtain information from the internet or other reliable sourceson the importance of two different types of index number of your choice. Elaborate the use and the importance of theseindex numbers in daily life.

8/9/2019 0 Add Math Project Work
http://slidepdf.com/reader/full/0-add-math-project-work 23/28
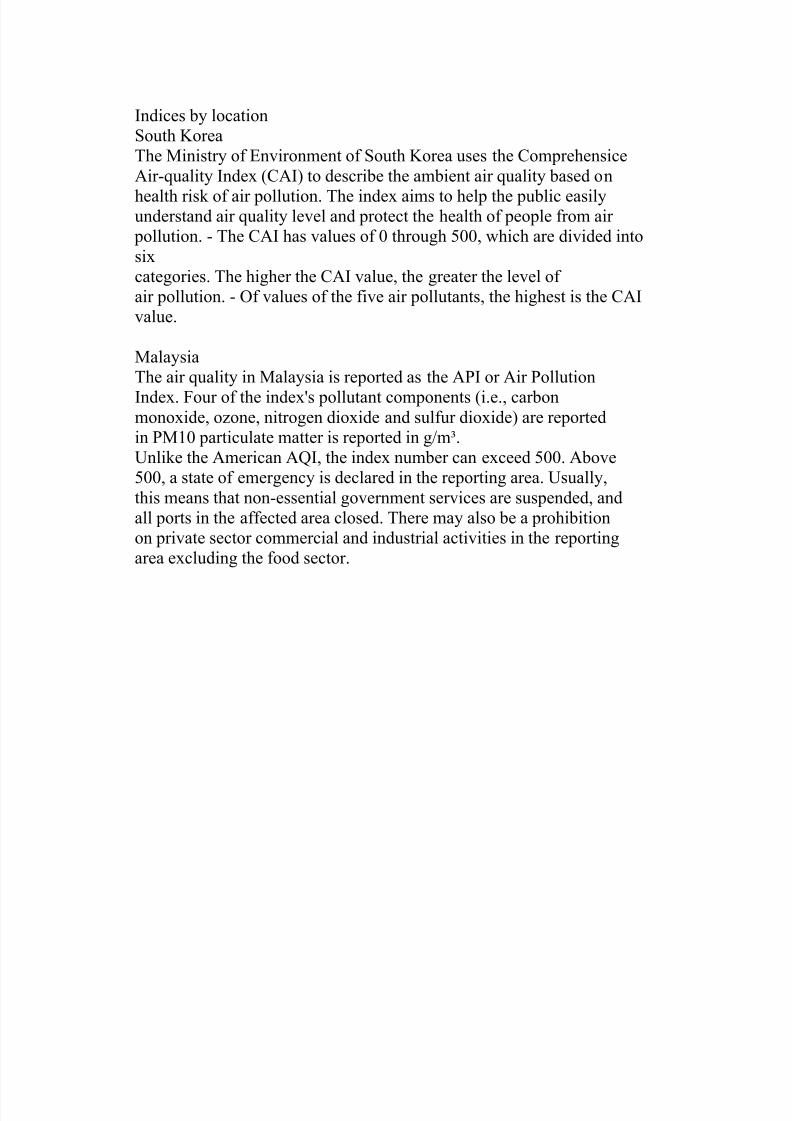
AIR POLLUTION INDEX
Air pollution is the introduction of chemicals, particulate matter,or biological materials that cause harm or discomfort to humans or
other living organisms, or damages the natural environment intothe atmosphere.The atmosphere is a complex dynamic natural gaseous system that isessential to support life on planet Earth. Stratospheric ozonedepletion due to air pollution has long been recognized as a threat tohuman health as well as to the Earth's ecosystems.The Air Quality Index (AQI) (also known as the Air PollutionIndex (API) or Pollutant Standard Index (PSI) is a number used bygovernment agencies to characterize the quality of the air at a givenlocation. As the AQI increases, an increasingly large percentage of
the population is likely to experience increasingly severe adversehealth effects. To compute the AQI requires an air pollutantconcentration from a monitor or model. The function used to convertfrom air pollutant concentration to AQI varies by pollutant, and isdifferent in different countries. Air quality index values are dividedinto ranges, and each range is assigned a descriptor and a color code.Standardized public health advisories are associated with each AQIrange. An agency might also encourage members of the public to take public transportation or work from home when AQI levels are high.Limitations of the AQIMost air contaminants do not have an associated AQI. Many countriesmonitor ground-level ozone, particulates, sulphur dioxide, carbonmonoxide and nitrogen dioxide and calculate air quality indices for these pollutants.Causes of Poor Air QualityThe AQI can worsen (go up) due to lack of dilution of air emissions by fresh air. Stagnant air, often caused byan anticyclone or temperature inversion, or other lack of winds lets air pollution remain in a local area.
8/9/2019 0 Add Math Project Work
http://slidepdf.com/reader/full/0-add-math-project-work 24/28

8/9/2019 0 Add Math Project Work
http://slidepdf.com/reader/full/0-add-math-project-work 25/28
STOCK MARKET INDEX
A comparison of tree major U.S. stock indices: the NASDAQComposite, Dow Jones Industrial Average, andS&P 500. All three
have the same height at March 2007. Notice the large dot com spikeon the NASDAQ, a result of the large number of tech. companies onthat index.
A stock market index is a method of measuring a section of the stock market. Many indices are cited by news or financial services firms and areused as benchmarks, to measure the performance of portfolios such asmutual funds.Types of indices
Stock market indices may be classed in many ways. A 'world' or 'global'stock market index includes (typically large) companies without regardfor where they are domiciled or traded. Two examples are MSCI Worldand S&P Global 100.
A national index represents the performance of the stock market of a givennation²and by proxy, reflects investor sentiment on the state of itseconomy. The most regularly quoted market indices are national indicescomposed of the stocks of large companies listed on a nation's largeststock exchanges, such as the American S&P 500, the Japanese Nikkei 225, andthe British FTSE 100.
The concept may be extended well beyond an exchange. The Dow JonesTotal Stock Market Index, as its name implies, represents the stocks of nearly every publicly traded company in the United States, including allU.S. stocks traded on the New York Stock Exchange (but not ADRs) andmost traded on the NASDAQ and American Stock Exchange. RussellInvestment Group added to the family of indices by launching the Russell
Global Index.
8/9/2019 0 Add Math Project Work
http://slidepdf.com/reader/full/0-add-math-project-work 26/28
More specialised indices exist tracking the performance of specific sectorsof the market. The Morgan Stanley Biotech Index, for example, consists of 36
American firms in the biotechnology industry. Other indices may track companies of a certain size, a certain type of management, or even morespecialized criteria one index published by Linux Weekly News tracksstocksof companies that sell products and services based on the Linux operatingenvironment.
Index versions
Some indices, such as the S&P 500, have multiple versions.[1] These
versionscan differ based on how the index components are weighted and on howdividends are accounted for. For example, there are three versions of theS&P500 index: price return, which only considers the price of the components,total return, which accounts for dividend reinvestment, and net totalreturn,which accounts for dividend reinvestment after the deduction of awithholding tax. As another example, the Wilshire 4500 and Wilshire5000indices have five versions each: full capitalization total return, fullcapitalization price, float-adjusted total return, float-adjusted price, andequalweight. The difference between the full capitalization, float-adjusted, andequal weight versions is in how index components are weighted.
8/9/2019 0 Add Math Project Work
http://slidepdf.com/reader/full/0-add-math-project-work 27/28
USES AND IMPORTANCE OF AIR POLLUTIONINDEX AND STOCK MARKET INDEX
As everyone can see,the air pollution index is use by the government to
measure the quality of air index and to detect any pollutants in our country’sair.This is to ensure the air is clean and safe for us ti inhale.Besides that,anearly warning can be given to us if the air pollution is too high for us togetout of our homes.This warning is given based upon readings andunterpretations of the air index.
As for the stock market index, it is mainly for the business entrepreneurs.This type of index is used to determine the outcome of a stock market and
also the conclusion of a stock market. The stock market index is important because a country’s economical state sometimes depend on it.
CONCLUSION
After doing research,answering questions,drawing graphs and some problemsolving, I saw that the usage of statistics is important in daily life.It is not justwidely used in markets but also in interpreting the condition of thesurrounding like the air or the water.Especially in conducting an air- pollutionsurvey.In conclusion,statistics is a daily life nessecities.Without it,surveys
can’t be conducted,the stock market can’t be interpret and many more.So,weshould be thankful of the people who contribute in the idea of statistics.

8/9/2019 0 Add Math Project Work
http://slidepdf.com/reader/full/0-add-math-project-work 28/28
REFLECTION
Adter spending countless hours,days and night to finish this project and
also sacrificing my time video games and mangas in this mid year holiday,there are several things that I can say...
Additional Mathematics...From the day I born...From the day I was able to holding pencil...From the day I start learning...And...From the day I heard your name...
I always thought that you will be my greatest obstacle and rival inexcellingin my life...But after countless of hours...Countless of days...Countless of nights...
After sacrificing my precious time just for you...Sacrificing my Computer Games...Sacrificing my Video Games...Sacrificing my Facebook...Sacrificing my Internet...Sacrifing my Anime...Sacrificing my Manga...I realized something really important in you...
I really love you...You are my real friend...You my partner...
You are my soulmate...I LOVE U ADDITIONAL MATHEMATICS...