
0 287 JLGGC
24
Supplementary Notes Note S1 Neonatal grafts consist mainly of mature cortical neurons Very few proliferating or apoptotic cells were found within the graft, and no markers of endodermal, mesodermal, epidermal or ES cell lineages could be detected, suggesting that no teratoma formation had occurred (Suppl. Figure 9e,f and Suppl. Table 3). Among the grafted neurons, we found expression of the same cortical neuron markers as in vitro, although some were downregulated, as observed for the same markers in adult cortical neurons (Suppl. Figure 10, and data not shown and 22 ). When examining the morphology of single GFP+ neurons surrounding the graft, the vast majority (89+/-3,13%) of them were unipolar with a PMI pyramidal index comparable to genuine pyramidal cortical neurons (Figure 5d). In addition we found no or marginal expression of markers of non-pyramidal neurons among the GFP+ grafted neurons (Suppl. Table 3). Altogether these data indicate that most of the grafted cells correspond to fully differentiated cortical pyramidal neurons. Note S2 In utero grafting experiments ES cells were differentiated into neural progenitors and neurons for 14 days in DDM-cyclo conditions, then grafted in utero into the lateral ventricles of E13.5 mouse embryos, and the GFP+ neurons were examined postnatally. In most animals where GFP+ neurons could be detected, they integrated preferentially into telencephalic structures and the cerebral cortex (Suppl. Table 5, Suppl. Figure 11), as previously described for genuine cortical progenitors 29,30 . When integrated into the cortex, the grafted neurons displayed the major landmarks of genuine cortical neurons, including radial orientation, pyramidal morphology, and appropriate expression of layer-specific markers (Suppl. Figure 11a-c). Thus ES-derived neural cells behave like genuine cortical cells when grafted in utero. SUPPLEMENTARY INFORMATION doi: 10.1038/nature07287 www.nature.com/nature 1
Transcript of 0 287 JLGGC
Supplementary Notes
Note S1 Neonatal grafts consist mainly of mature cortical neurons
Very few proliferating or apoptotic cells were found within the graft, and no markers of
endodermal, mesodermal, epidermal or ES cell lineages could be detected, suggesting that no
teratoma formation had occurred (Suppl. Figure 9e,f and Suppl. Table 3). Among the grafted
neurons, we found expression of the same cortical neuron markers as in vitro, although some
were downregulated, as observed for the same markers in adult cortical neurons (Suppl.
Figure 10, and data not shown and 22). When examining the morphology of single GFP+
neurons surrounding the graft, the vast majority (89+/-3,13%) of them were unipolar with a
PMI pyramidal index comparable to genuine pyramidal cortical neurons (Figure 5d). In
addition we found no or marginal expression of markers of non-pyramidal neurons among the
GFP+ grafted neurons (Suppl. Table 3). Altogether these data indicate that most of the grafted
cells correspond to fully differentiated cortical pyramidal neurons.
Note S2 In utero grafting experiments
ES cells were differentiated into neural progenitors and neurons for 14 days in DDM-cyclo
conditions, then grafted in utero into the lateral ventricles of E13.5 mouse embryos, and the
GFP+ neurons were examined postnatally. In most animals where GFP+ neurons could be
detected, they integrated preferentially into telencephalic structures and the cerebral cortex
(Suppl. Table 5, Suppl. Figure 11), as previously described for genuine cortical progenitors
29,30. When integrated into the cortex, the grafted neurons displayed the major landmarks of
genuine cortical neurons, including radial orientation, pyramidal morphology, and appropriate
expression of layer-specific markers (Suppl. Figure 11a-c). Thus ES-derived neural cells
behave like genuine cortical cells when grafted in utero.
SUPPLEMENTARY INFORMATION
doi: 10.1038/nature07287
www.nature.com/nature 1
Supplementary Methods
Methods S1 List of antibodies
Primary antibodies were mouse monoclonal anti-beta-tubulin III (Tuj1, 1/1000; Covance),
anti-microtubule associated protein 2 (MAP2, clone AP20, 1/500; Sigma), anti-reelin (clone
G10, 1/2000; a kind gift from A. Goffinet), anti-Mash1 (1/500; Pharmingen) anti-p73 (ER-
15, 1/150; Labvision/Neomarkers), anti-HNF4 (1/50, Abcam), anti-pan-cytokeratin (1/50,
Sigma) andti-BrdU (1/50 Beckton Dickinson), and anti-rhodopsin (RET-P1, 1/100; Abcam),
rabbit polyclonal anti-Pax6 (1/2500; Covance), anti-Otx1+2 (1/2000; Chemicon), anti-
Nkx2.1 (1/5000; a gift from R. Di Lauro), anti-Gsh2 (1/2000; a gift from Y. Sasai), anti-
Oct4 (1/500, Abcam), anti-caspase 3 (1/500, Promega), anti-Ki67 (1/200, Novocastra), anti-
Tbr1 (1/20000; a gift from R. Hevner and Chemicon), anti-Tbr2 (1/2500; a gift from R.
Hevner and Chemicon), anti-Nestin (long tail, 1/5000; Covance), anti-beta-tubulin III
(1/2000; Covance), anti-GFAP (1/500; Sigma), anti-calretinin (1/10000; Swant), anti-green
fluorescent protein (1/3000, Molecular Probes), anti-VGluT1 (1/2000; Synaptic Systems),
anti-VGluT2 (1/2500; Synaptic Systems), anti-VGAT (1/3000; Synaptic Systems), anti-
tyrosine hydroxylase (1/500; Chemicon), anti-choline acetyltransferase (1/500; Chemicon),
anti GABA-A alpha-6 receptor (1/1000; Chemicon), anti-FoxP2 (1/1000; Abcam), anti-
Satb2 (1/2000; a gift from V. Tarabykin), anti-ER81 (1/1000; a gift from S. Arber), anti-
Cux1 (1/1000, Santa Cruz), anti-Tle4 (1/3000, a gift from S. Stifani), anti-COUP-TFI and
anti-COUP-TFII (1/1000, a gift from M. Studer), rat monoclonal anti-CTIP2 (1/1000;
Abcam), and anti-BrdU (1/250, Abcam), goat anti-Sox5 (1/250, Santa Cruz), and anti-
PECAM (1/1000, Beckton-Dickinson), and chick anti-beta-tubulin III (1/300, Chemicon).
The RAT-401 antibody (anti-Nestin; 1/5) developed by S. Hockfield, the 74-5A5 antibody
(anti-Nkx2.2; 1/20) developed by T.M. Jessell, the anti-Math1 (1/10) developed by J.
Johnson, the Otx-5F5 (anti-Otx1; 1/10) developed by S.K. McConnell, the 4G11 antibody
doi: 10.1038/nature07287 SUPPLEMENTARY INFORMATION
www.nature.com/nature 2
(anti-Engrailed-1; 1/50) developed by T.M. Jessell and S. Morton and the MF-20 (anti-
myosin; 1/20) developed by D.A. Fischman were obtained from the Developmental Studies
Hybridoma Bank developed under the auspices of the NICHD and maintained by The
University of Iowa, Department of Biological Sciences, Iowa City, IA 52242.
Secondary antibodies were donkey anti-mouse,anti-rabbit, anti-rat, anti-goat or anti-chick
coupled to Cyanin 3 or Cyanin 5 (1/1000, Jackson Immunoresearch) or to AlexaFluor 488
(1/1000, Molecular Probes).
Methods S2 RTPCR
For total RNA preparation, cells were trypsinized, dissociated, centrifuged and rinsed once in
PBS before being flash-frozen in liquid nitrogen. RNA preparation was made using RNeasy
RNA preparation minikit (Qiagen). Reverse transcription was done using Superscript II kit
and protocol (Invitrogen). PCR primers used are summarized in Supplementary Table 1. RT-
PCR were performed at least three times for each gene at each time-point studied.
Methods S3 Electrophysiology
Electrophysiological recordings were performed at room temperature (20-25°C) in an
external solution (ACSF) containing 120mM NaCl, 26mM NaHCO3, 11mM D-glucose,
2mM KCl, 2mM CaCl2, 1.2mM MgSO4 and 1.2mM KH2PO4 with an osmolarity of 290
mOsm. The recording chamber was constantly superfused at a flow rate of 1 ml/min. The
recording patch pipettes were made of borosilicate GC100TF-10 capillary tubing (Clark
Electrical Instruments, Reading, UK) pulled on a P-2000 micropipette puller (Sutter
Instrument Co, Novato, CA, USA) and presented resistances of 4 -6 MΩ when filled with
doi: 10.1038/nature07287 SUPPLEMENTARY INFORMATION
www.nature.com/nature 3
the patch pipette solution containing either 150mM KCl, 10mM 4-(2-hydroxyethyl)-1-
piperazineethanesulfonic acid (HEPES), 4.6mM MgCl2, 4mM Na2ATP (adenosine
triphosphate) and 0.4mM Na3GTP (guanosine triphosphate) or 110mM CsF, 0.1 mM
ethylene glycol bis(beta-aminoethyl ether)-N,N,N',N'-tetraacetic acid (EGTA), 0.035mM
CaCl2, 1mM MgCl2, 10mM D-glucose and 10mM HEPES, this latter solution being used for
the recording of spontaneous inhibitory postsynaptic currents (sIPSC). Both pipette solutions
were adjusted to pH 7.3 and 300-330mOsm/l. Whole-cell patch clamp recordings were
carried out with an EPC10 amplifier (HEKA, Elektronik, Lambrecht/Pfalz, Germany) in
voltage clamp mode. Signals were filtered at 4kHz using the built-in filter of EPC10 and
digitally sampled at 20kHz except spontaneous postsynaptic currents signals that were
filtered at 2.5kHz and digitally sampled at 5kHz. Voltage protocol generation, data
acquisition and analysis were made with Pulse 8.65 (HEKA, Elektronik, Lambrecht/Pfalz,
Germany). The presence of spontaneous excitatory postsynaptic currents (sEPSCs) was
assessed by clamping neurons to -60 mV in the presence of 100 µM picrotoxin. The
presence of inhibitory postsynaptic currents (sIPSCs) was assessed by clamping neurons to –
20mV in the presence of 1µM TTX, 5µM 2,3-dioxo-6-nitro-1,2,3,4-
tetrahydrobenzo[f]quinoxaline-7-sulfonamide disodium salt (NBQX) and 50µM D-(-)-2-
amino-5-phosphonopentanoic acid (APV). To further check the nature of spontaneous
postsynaptic currents, NBQX (5µM) and APV (50µM) were used to block AMPA and
NMDA receptors respectively and picrotoxin (100µM) was used to block GABAA receptors.
Fifteen neurons were recorded for each type of PSC and for each condition (DDM or
DDM+cyclo).
Methods S4 Grafting in neonatal mice
doi: 10.1038/nature07287 SUPPLEMENTARY INFORMATION
www.nature.com/nature 4
Cells were trypsinized and thoroughly dissociated with a Pasteur pipette then centrifuged at
1200 rpm for 3 minutes. Supernatant was carefully discarded and the pellet was resuspended
in ice cold PBS at a final density of 50x103 with a 200µl tip and placed on ice.P0-P1 mouse
pups were anesthesized on ice. A small incision was performed through the skin and the skull
1mm rostrally and laterally to the bregma, just above the motor area. A small cortical lesion
was made with the tip of a 25-gauge needle and 1µl of the cell suspension was injected with a
Hamilton syringe in the rostral side of the lesion. After 4 weeks, the recipient animals were
anesthesized and brains were vibrosectioned and processed for immunofluorescence as
described above.
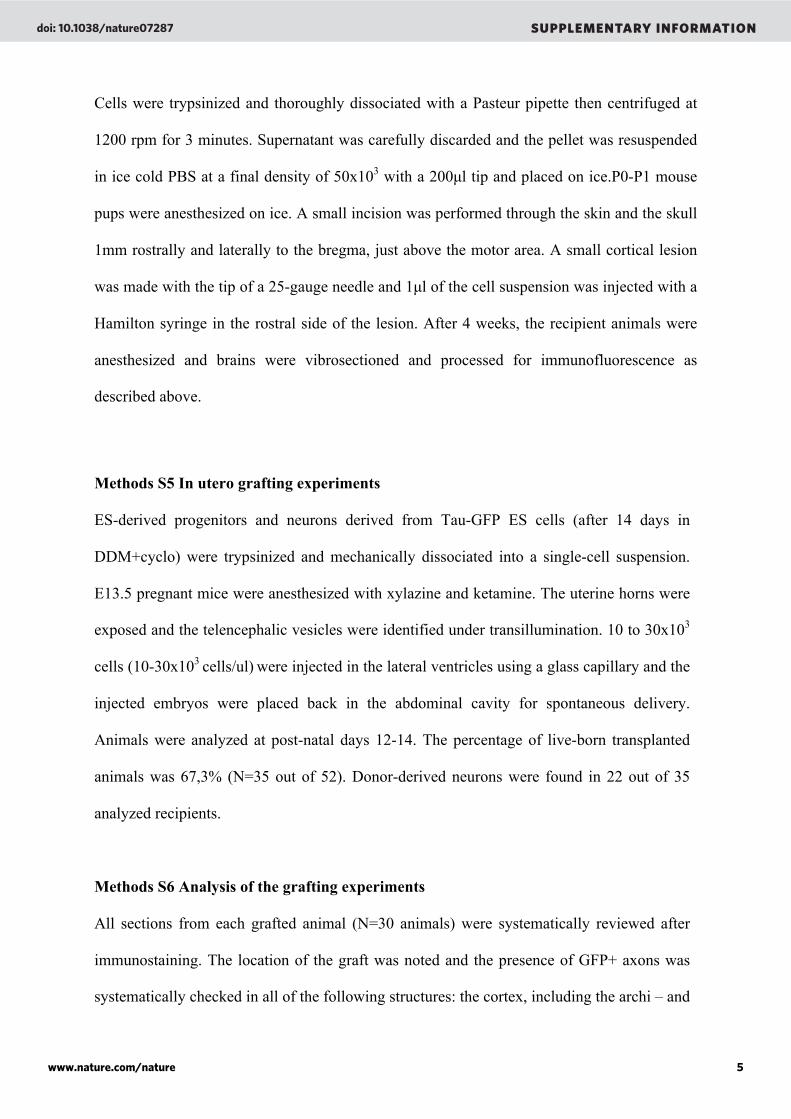
Methods S5 In utero grafting experiments
ES-derived progenitors and neurons derived from Tau-GFP ES cells (after 14 days in
DDM+cyclo) were trypsinized and mechanically dissociated into a single-cell suspension.
E13.5 pregnant mice were anesthesized with xylazine and ketamine. The uterine horns were
exposed and the telencephalic vesicles were identified under transillumination. 10 to 30x103
cells (10-30x103 cells/ul) were injected in the lateral ventricles using a glass capillary and the
injected embryos were placed back in the abdominal cavity for spontaneous delivery.
Animals were analyzed at post-natal days 12-14. The percentage of live-born transplanted
animals was 67,3% (N=35 out of 52). Donor-derived neurons were found in 22 out of 35
analyzed recipients.
Methods S6 Analysis of the grafting experiments
All sections from each grafted animal (N=30 animals) were systematically reviewed after
immunostaining. The location of the graft was noted and the presence of GFP+ axons was
systematically checked in all of the following structures: the cortex, including the archi – and
doi: 10.1038/nature07287 SUPPLEMENTARY INFORMATION
www.nature.com/nature 5
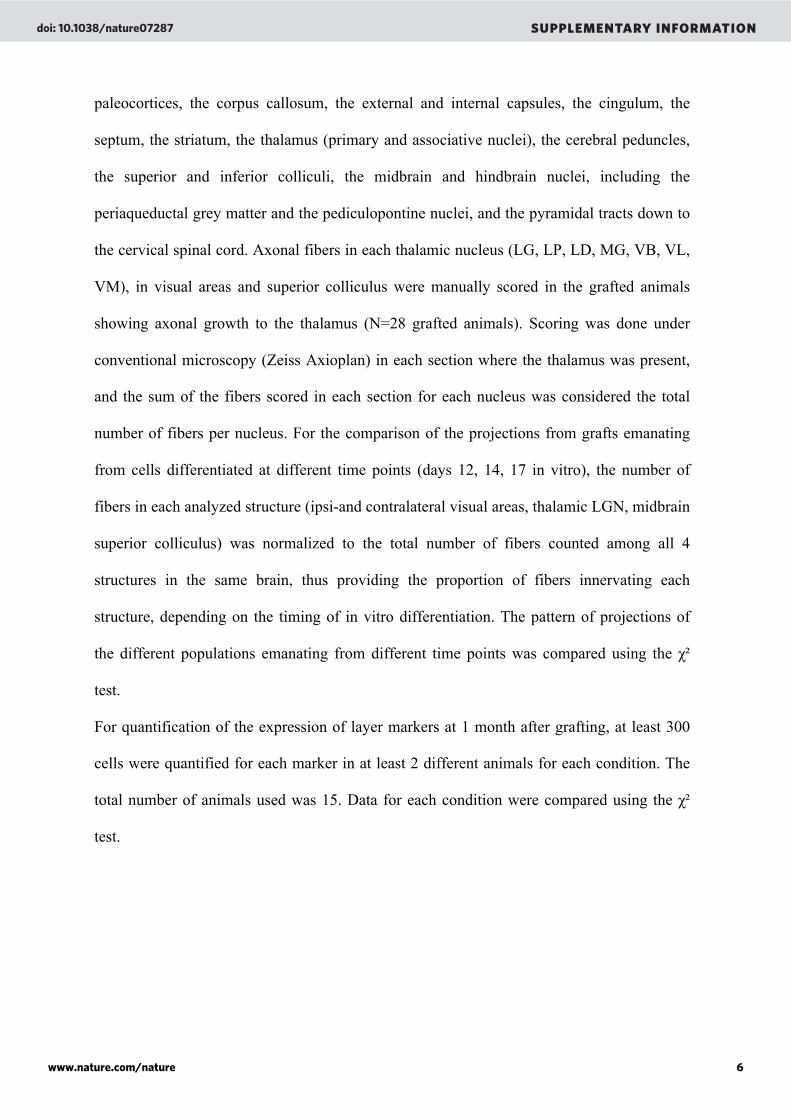
paleocortices, the corpus callosum, the external and internal capsules, the cingulum, the
septum, the striatum, the thalamus (primary and associative nuclei), the cerebral peduncles,
the superior and inferior colliculi, the midbrain and hindbrain nuclei, including the
periaqueductal grey matter and the pediculopontine nuclei, and the pyramidal tracts down to
the cervical spinal cord. Axonal fibers in each thalamic nucleus (LG, LP, LD, MG, VB, VL,
VM), in visual areas and superior colliculus were manually scored in the grafted animals
showing axonal growth to the thalamus (N=28 grafted animals). Scoring was done under
conventional microscopy (Zeiss Axioplan) in each section where the thalamus was present,
and the sum of the fibers scored in each section for each nucleus was considered the total
number of fibers per nucleus. For the comparison of the projections from grafts emanating
from cells differentiated at different time points (days 12, 14, 17 in vitro), the number of
fibers in each analyzed structure (ipsi-and contralateral visual areas, thalamic LGN, midbrain
superior colliculus) was normalized to the total number of fibers counted among all 4
structures in the same brain, thus providing the proportion of fibers innervating each
structure, depending on the timing of in vitro differentiation. The pattern of projections of
the different populations emanating from different time points was compared using the χ²
test.
For quantification of the expression of layer markers at 1 month after grafting, at least 300
cells were quantified for each marker in at least 2 different animals for each condition. The
total number of animals used was 15. Data for each condition were compared using the χ²
test.
doi: 10.1038/nature07287 SUPPLEMENTARY INFORMATION
www.nature.com/nature 6
Supplementary Figures
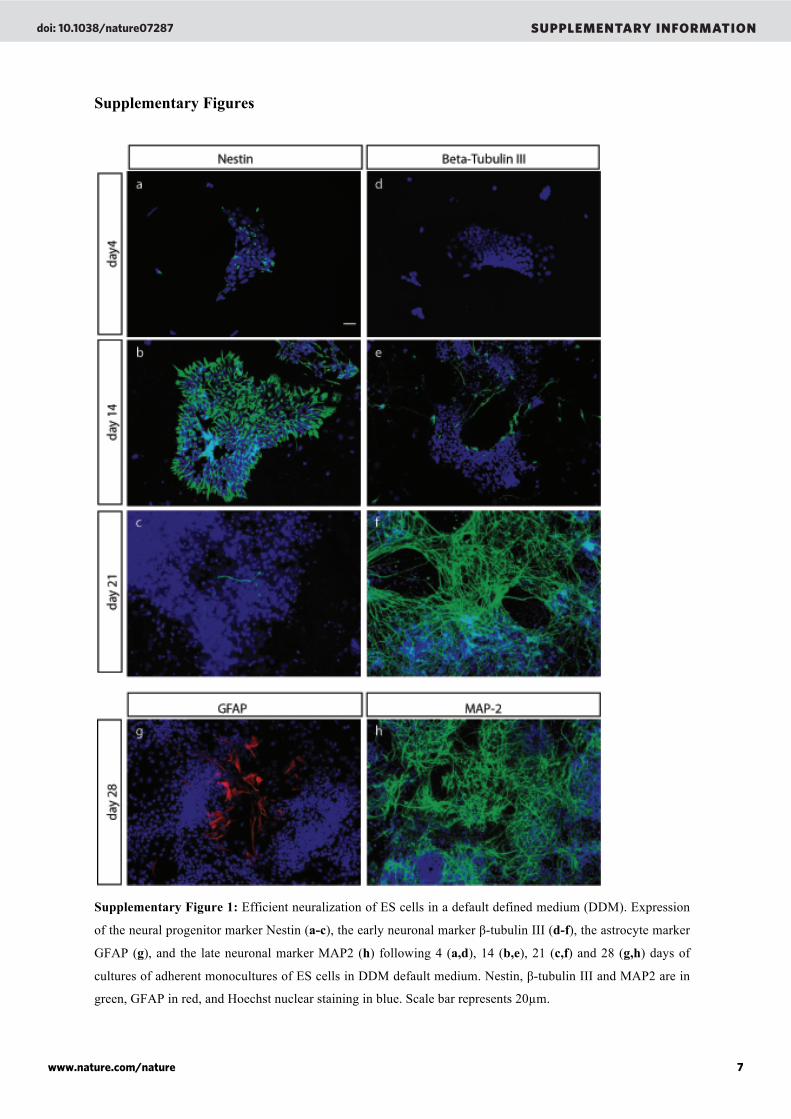
Supplementary Figure 1: Efficient neuralization of ES cells in a default defined medium (DDM). Expression
of the neural progenitor marker Nestin (a-c), the early neuronal marker β-tubulin III (d-f), the astrocyte marker
GFAP (g), and the late neuronal marker MAP2 (h) following 4 (a,d), 14 (b,e), 21 (c,f) and 28 (g,h) days of
cultures of adherent monocultures of ES cells in DDM default medium. Nestin, β-tubulin III and MAP2 are in
green, GFAP in red, and Hoechst nuclear staining in blue. Scale bar represents 20µm.
doi: 10.1038/nature07287 SUPPLEMENTARY INFORMATION
www.nature.com/nature 7
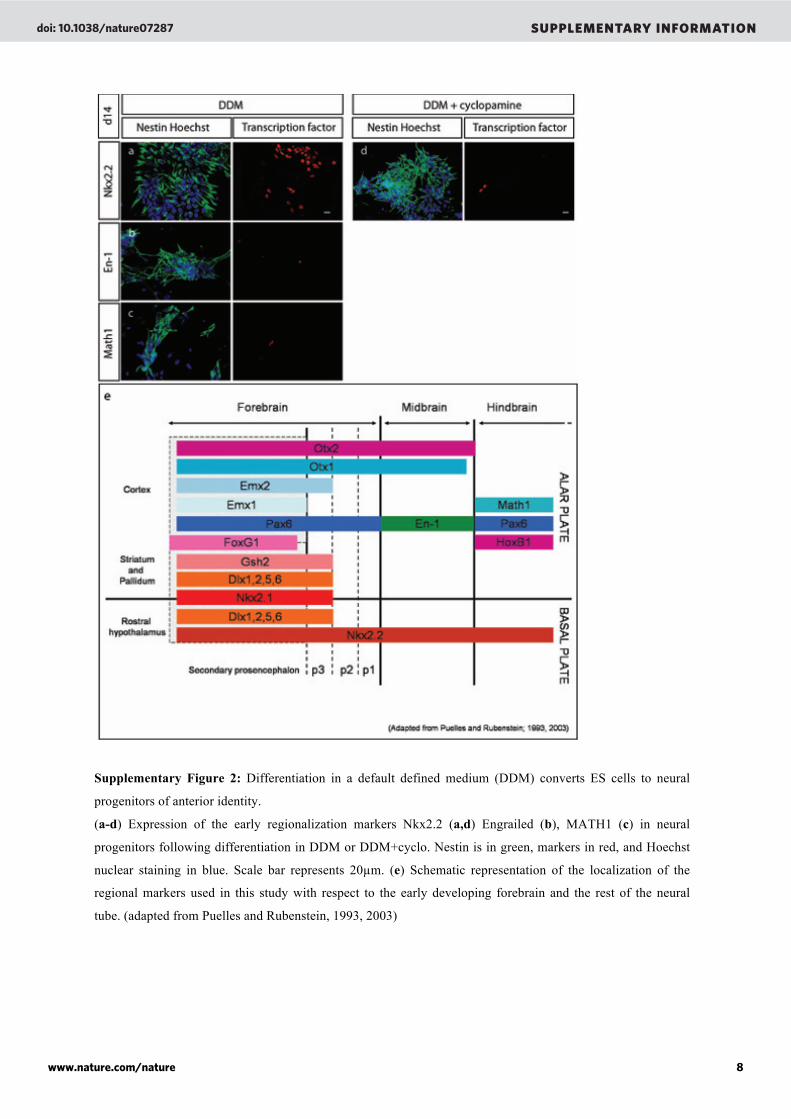
Supplementary Figure 2: Differentiation in a default defined medium (DDM) converts ES cells to neural
progenitors of anterior identity.
(a-d) Expression of the early regionalization markers Nkx2.2 (a,d) Engrailed (b), MATH1 (c) in neural
progenitors following differentiation in DDM or DDM+cyclo. Nestin is in green, markers in red, and Hoechst
nuclear staining in blue. Scale bar represents 20µm. (e) Schematic representation of the localization of the
regional markers used in this study with respect to the early developing forebrain and the rest of the neural
tube. (adapted from Puelles and Rubenstein, 1993, 2003)
doi: 10.1038/nature07287 SUPPLEMENTARY INFORMATION
www.nature.com/nature 8
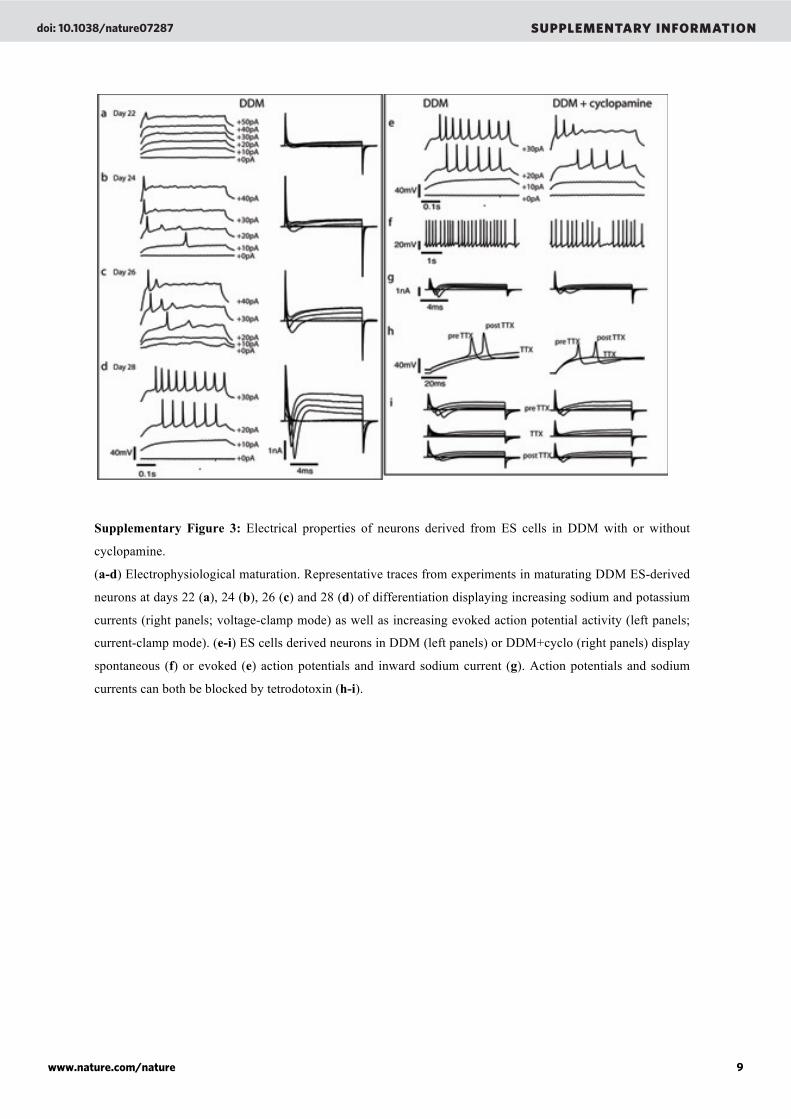
Supplementary Figure 3: Electrical properties of neurons derived from ES cells in DDM with or without
cyclopamine.
(a-d) Electrophysiological maturation. Representative traces from experiments in maturating DDM ES-derived
neurons at days 22 (a), 24 (b), 26 (c) and 28 (d) of differentiation displaying increasing sodium and potassium
currents (right panels; voltage-clamp mode) as well as increasing evoked action potential activity (left panels;
current-clamp mode). (e-i) ES cells derived neurons in DDM (left panels) or DDM+cyclo (right panels) display
spontaneous (f) or evoked (e) action potentials and inward sodium current (g). Action potentials and sodium
currents can both be blocked by tetrodotoxin (h-i).
doi: 10.1038/nature07287 SUPPLEMENTARY INFORMATION
www.nature.com/nature 9
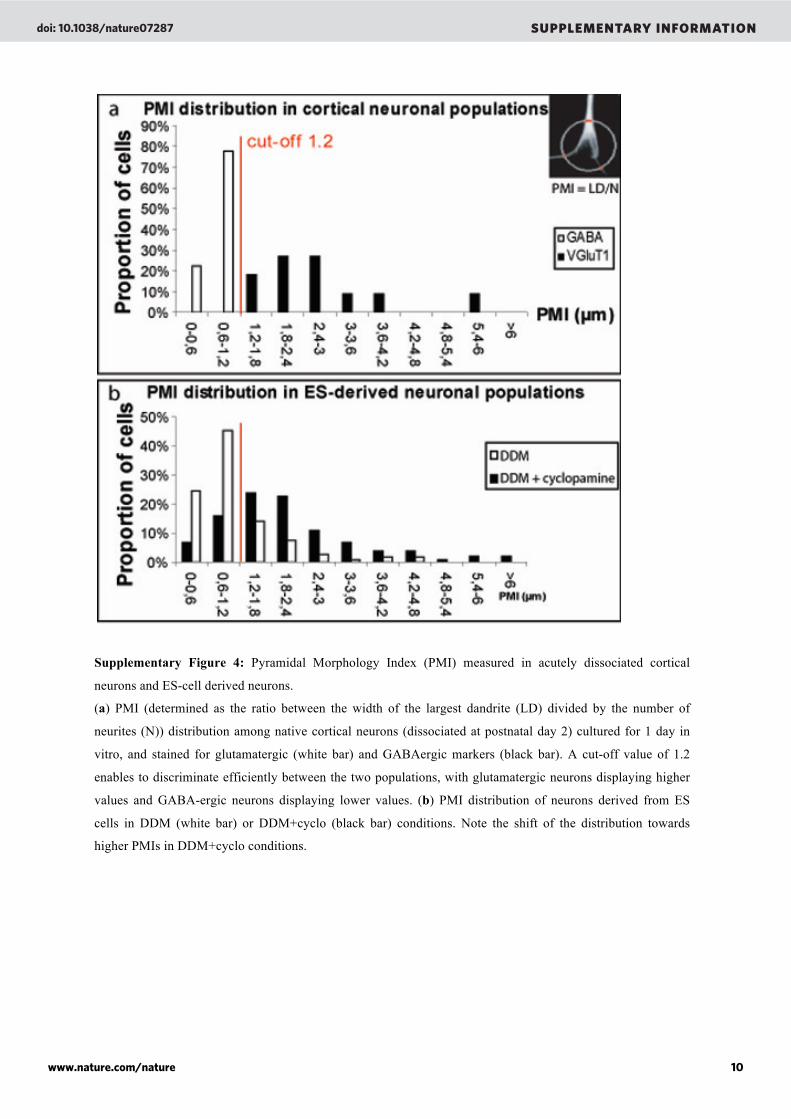
Supplementary Figure 4: Pyramidal Morphology Index (PMI) measured in acutely dissociated cortical
neurons and ES-cell derived neurons.
(a) PMI (determined as the ratio between the width of the largest dandrite (LD) divided by the number of
neurites (N)) distribution among native cortical neurons (dissociated at postnatal day 2) cultured for 1 day in
vitro, and stained for glutamatergic (white bar) and GABAergic markers (black bar). A cut-off value of 1.2
enables to discriminate efficiently between the two populations, with glutamatergic neurons displaying higher
values and GABA-ergic neurons displaying lower values. (b) PMI distribution of neurons derived from ES
cells in DDM (white bar) or DDM+cyclo (black bar) conditions. Note the shift of the distribution towards
higher PMIs in DDM+cyclo conditions.
doi: 10.1038/nature07287 SUPPLEMENTARY INFORMATION
www.nature.com/nature 10
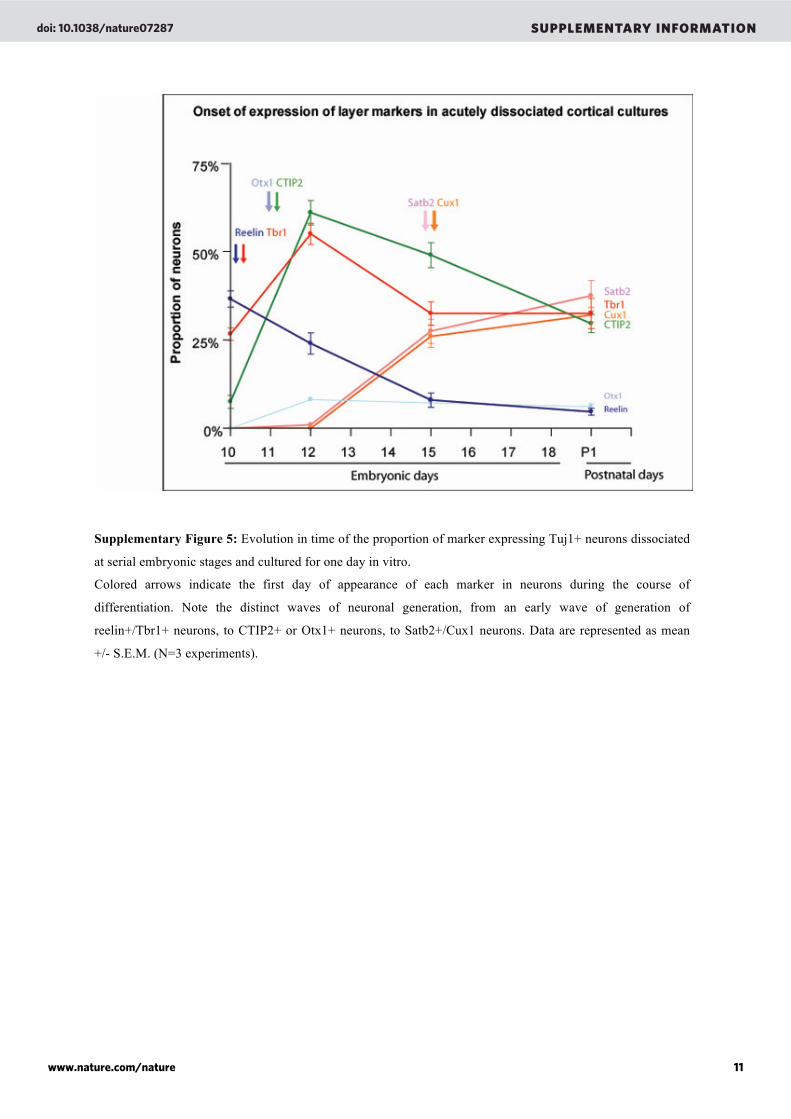
Supplementary Figure 5: Evolution in time of the proportion of marker expressing Tuj1+ neurons dissociated
at serial embryonic stages and cultured for one day in vitro.
Colored arrows indicate the first day of appearance of each marker in neurons during the course of
differentiation. Note the distinct waves of neuronal generation, from an early wave of generation of
reelin+/Tbr1+ neurons, to CTIP2+ or Otx1+ neurons, to Satb2+/Cux1 neurons. Data are represented as mean
+/- S.E.M. (N=3 experiments).
doi: 10.1038/nature07287 SUPPLEMENTARY INFORMATION
www.nature.com/nature 11
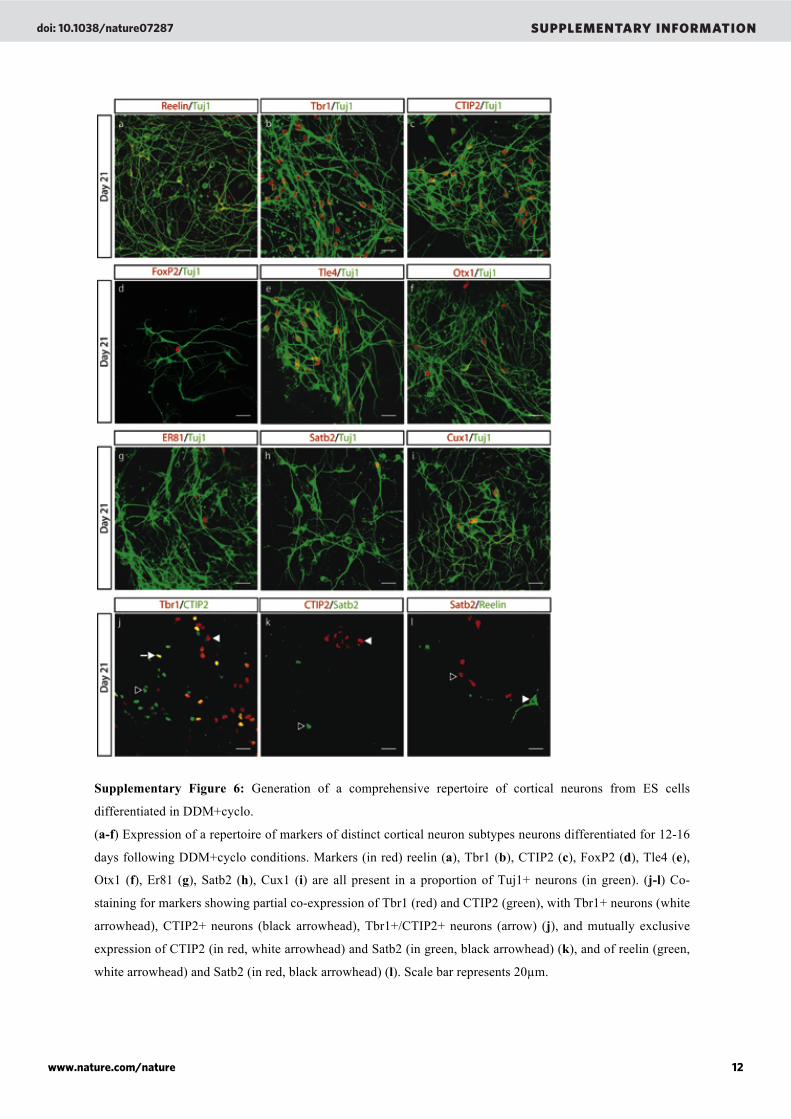
Supplementary Figure 6: Generation of a comprehensive repertoire of cortical neurons from ES cells
differentiated in DDM+cyclo.
(a-f) Expression of a repertoire of markers of distinct cortical neuron subtypes neurons differentiated for 12-16
days following DDM+cyclo conditions. Markers (in red) reelin (a), Tbr1 (b), CTIP2 (c), FoxP2 (d), Tle4 (e),
Otx1 (f), Er81 (g), Satb2 (h), Cux1 (i) are all present in a proportion of Tuj1+ neurons (in green). (j-l) Co-
staining for markers showing partial co-expression of Tbr1 (red) and CTIP2 (green), with Tbr1+ neurons (white
arrowhead), CTIP2+ neurons (black arrowhead), Tbr1+/CTIP2+ neurons (arrow) (j), and mutually exclusive
expression of CTIP2 (in red, white arrowhead) and Satb2 (in green, black arrowhead) (k), and of reelin (green,
white arrowhead) and Satb2 (in red, black arrowhead) (l). Scale bar represents 20µm.
doi: 10.1038/nature07287 SUPPLEMENTARY INFORMATION
www.nature.com/nature 12
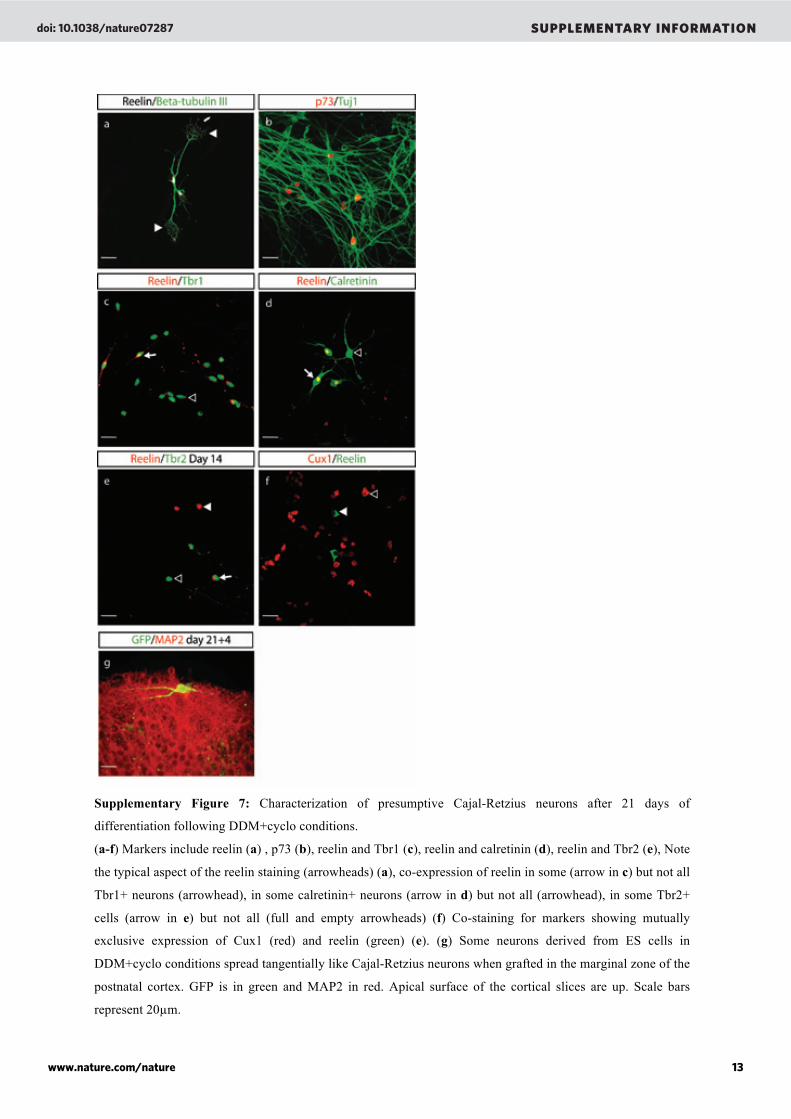
Supplementary Figure 7: Characterization of presumptive Cajal-Retzius neurons after 21 days of
differentiation following DDM+cyclo conditions.
(a-f) Markers include reelin (a) , p73 (b), reelin and Tbr1 (c), reelin and calretinin (d), reelin and Tbr2 (e), Note
the typical aspect of the reelin staining (arrowheads) (a), co-expression of reelin in some (arrow in c) but not all
Tbr1+ neurons (arrowhead), in some calretinin+ neurons (arrow in d) but not all (arrowhead), in some Tbr2+
cells (arrow in e) but not all (full and empty arrowheads) (f) Co-staining for markers showing mutually
exclusive expression of Cux1 (red) and reelin (green) (e). (g) Some neurons derived from ES cells in
DDM+cyclo conditions spread tangentially like Cajal-Retzius neurons when grafted in the marginal zone of the
postnatal cortex. GFP is in green and MAP2 in red. Apical surface of the cortical slices are up. Scale bars
represent 20µm.
doi: 10.1038/nature07287 SUPPLEMENTARY INFORMATION
www.nature.com/nature 13
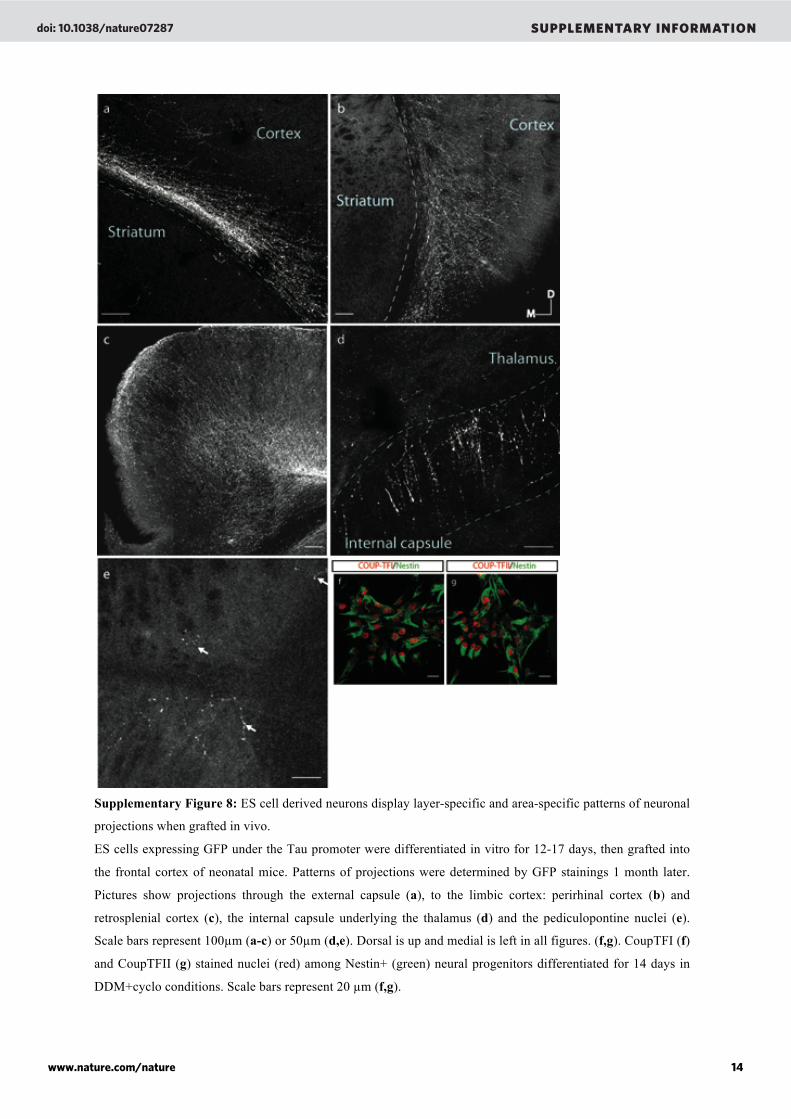
Supplementary Figure 8: ES cell derived neurons display layer-specific and area-specific patterns of neuronal
projections when grafted in vivo.
ES cells expressing GFP under the Tau promoter were differentiated in vitro for 12-17 days, then grafted into
the frontal cortex of neonatal mice. Patterns of projections were determined by GFP stainings 1 month later.
Pictures show projections through the external capsule (a), to the limbic cortex: perirhinal cortex (b) and
retrosplenial cortex (c), the internal capsule underlying the thalamus (d) and the pediculopontine nuclei (e).
Scale bars represent 100µm (a-c) or 50µm (d,e). Dorsal is up and medial is left in all figures. (f,g). CoupTFI (f)
and CoupTFII (g) stained nuclei (red) among Nestin+ (green) neural progenitors differentiated for 14 days in
DDM+cyclo conditions. Scale bars represent 20 µm (f,g).
doi: 10.1038/nature07287 SUPPLEMENTARY INFORMATION
www.nature.com/nature 14
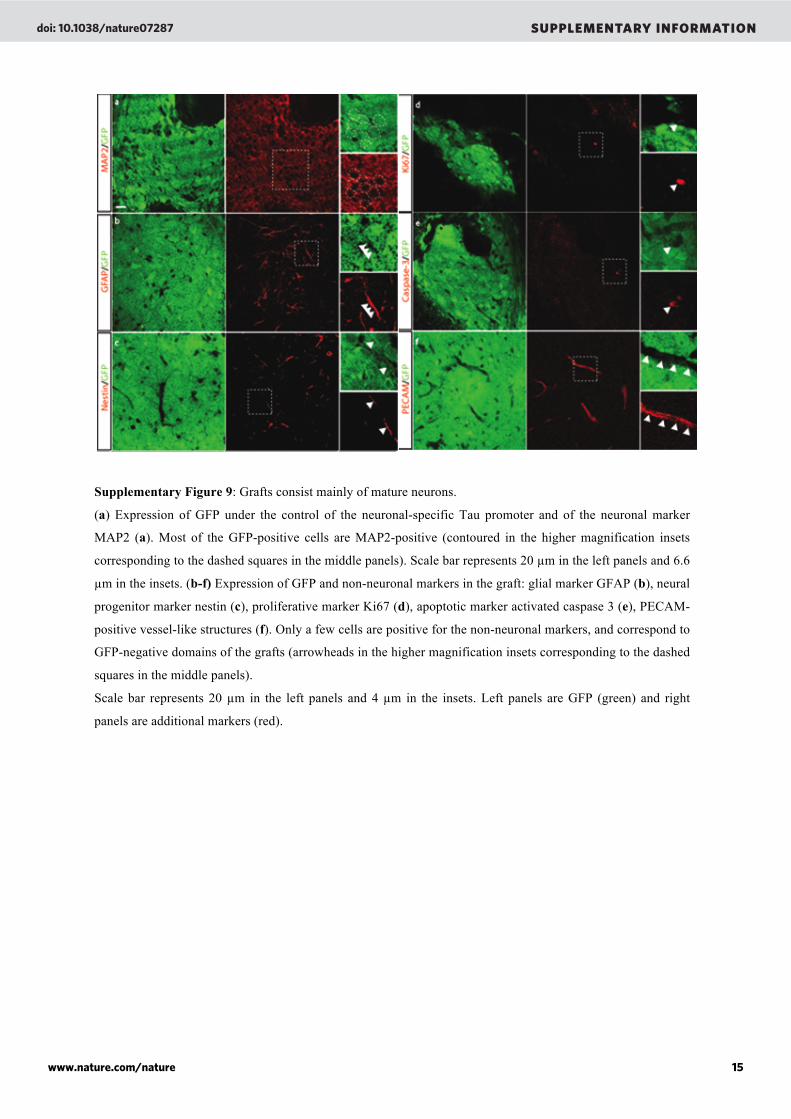
Supplementary Figure 9: Grafts consist mainly of mature neurons.
(a) Expression of GFP under the control of the neuronal-specific Tau promoter and of the neuronal marker
MAP2 (a). Most of the GFP-positive cells are MAP2-positive (contoured in the higher magnification insets
corresponding to the dashed squares in the middle panels). Scale bar represents 20 µm in the left panels and 6.6
µm in the insets. (b-f) Expression of GFP and non-neuronal markers in the graft: glial marker GFAP (b), neural
progenitor marker nestin (c), proliferative marker Ki67 (d), apoptotic marker activated caspase 3 (e), PECAM-
positive vessel-like structures (f). Only a few cells are positive for the non-neuronal markers, and correspond to
GFP-negative domains of the grafts (arrowheads in the higher magnification insets corresponding to the dashed
squares in the middle panels).
Scale bar represents 20 µm in the left panels and 4 µm in the insets. Left panels are GFP (green) and right
panels are additional markers (red).
doi: 10.1038/nature07287 SUPPLEMENTARY INFORMATION
www.nature.com/nature 15
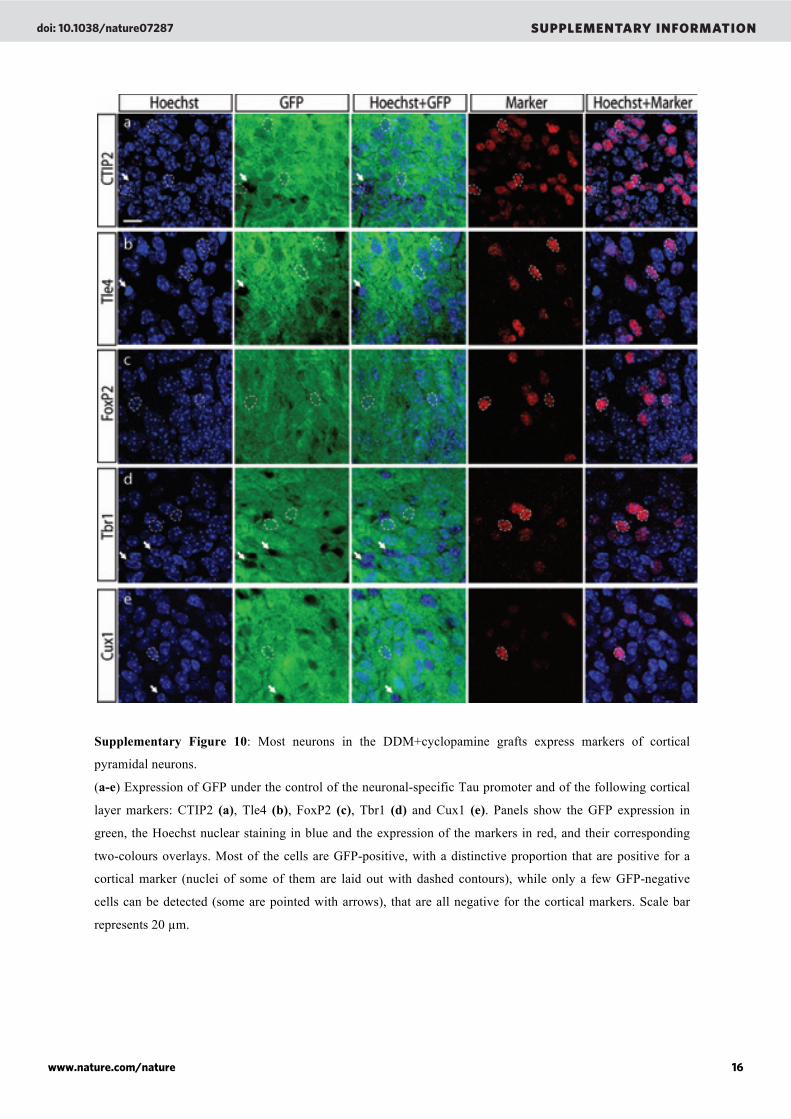
Supplementary Figure 10: Most neurons in the DDM+cyclopamine grafts express markers of cortical
pyramidal neurons.
(a-e) Expression of GFP under the control of the neuronal-specific Tau promoter and of the following cortical
layer markers: CTIP2 (a), Tle4 (b), FoxP2 (c), Tbr1 (d) and Cux1 (e). Panels show the GFP expression in
green, the Hoechst nuclear staining in blue and the expression of the markers in red, and their corresponding
two-colours overlays. Most of the cells are GFP-positive, with a distinctive proportion that are positive for a
cortical marker (nuclei of some of them are laid out with dashed contours), while only a few GFP-negative
cells can be detected (some are pointed with arrows), that are all negative for the cortical markers. Scale bar
represents 20 µm.
doi: 10.1038/nature07287 SUPPLEMENTARY INFORMATION
www.nature.com/nature 16
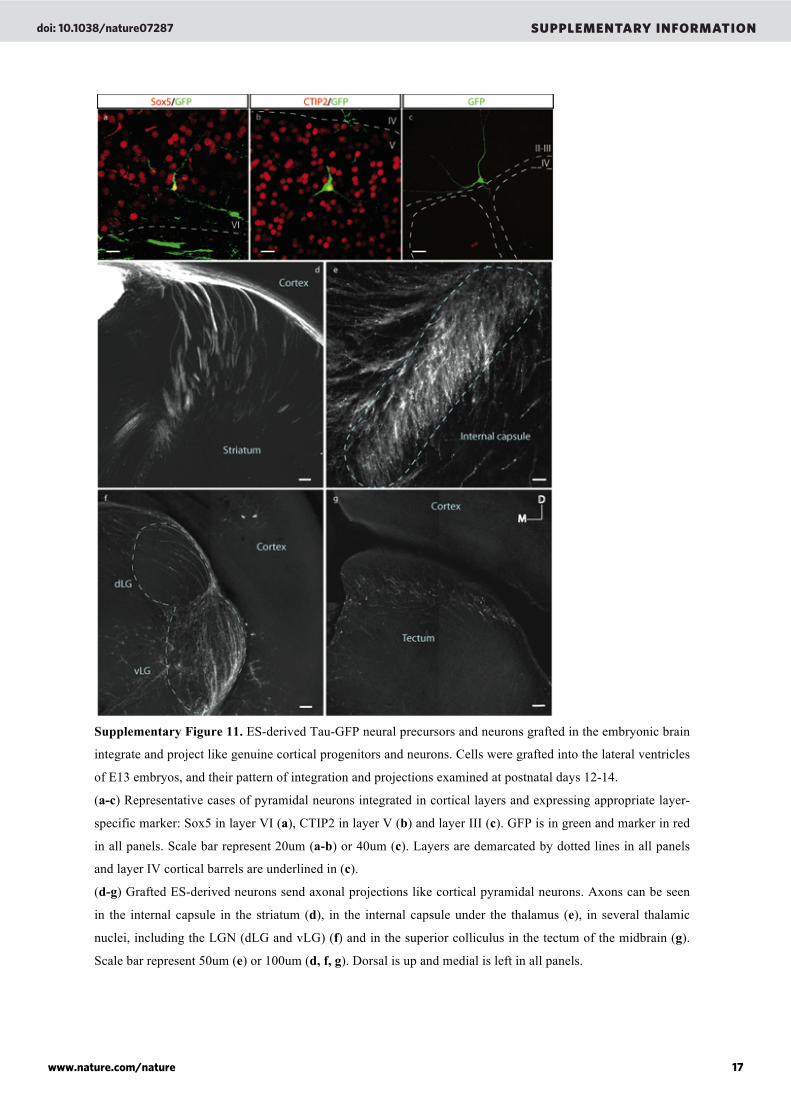
Supplementary Figure 11. ES-derived Tau-GFP neural precursors and neurons grafted in the embryonic brain
integrate and project like genuine cortical progenitors and neurons. Cells were grafted into the lateral ventricles
of E13 embryos, and their pattern of integration and projections examined at postnatal days 12-14.
(a-c) Representative cases of pyramidal neurons integrated in cortical layers and expressing appropriate layer-
specific marker: Sox5 in layer VI (a), CTIP2 in layer V (b) and layer III (c). GFP is in green and marker in red
in all panels. Scale bar represent 20um (a-b) or 40um (c). Layers are demarcated by dotted lines in all panels
and layer IV cortical barrels are underlined in (c).
(d-g) Grafted ES-derived neurons send axonal projections like cortical pyramidal neurons. Axons can be seen
in the internal capsule in the striatum (d), in the internal capsule under the thalamus (e), in several thalamic
nuclei, including the LGN (dLG and vLG) (f) and in the superior colliculus in the tectum of the midbrain (g).
Scale bar represent 50um (e) or 100um (d, f, g). Dorsal is up and medial is left in all panels.
doi: 10.1038/nature07287 SUPPLEMENTARY INFORMATION
www.nature.com/nature 17
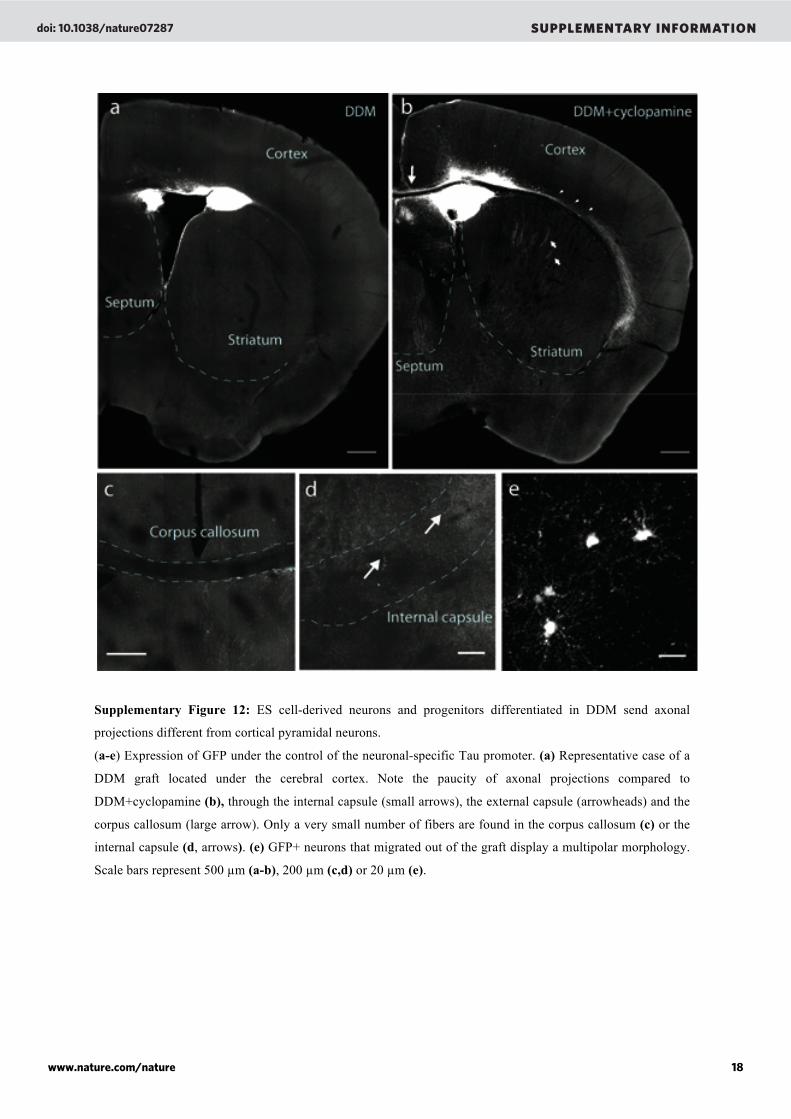
Supplementary Figure 12: ES cell-derived neurons and progenitors differentiated in DDM send axonal
projections different from cortical pyramidal neurons.
(a-e) Expression of GFP under the control of the neuronal-specific Tau promoter. (a) Representative case of a
DDM graft located under the cerebral cortex. Note the paucity of axonal projections compared to
DDM+cyclopamine (b), through the internal capsule (small arrows), the external capsule (arrowheads) and the
corpus callosum (large arrow). Only a very small number of fibers are found in the corpus callosum (c) or the
internal capsule (d, arrows). (e) GFP+ neurons that migrated out of the graft display a multipolar morphology.
Scale bars represent 500 µm (a-b), 200 µm (c,d) or 20 µm (e).
doi: 10.1038/nature07287 SUPPLEMENTARY INFORMATION
www.nature.com/nature 18
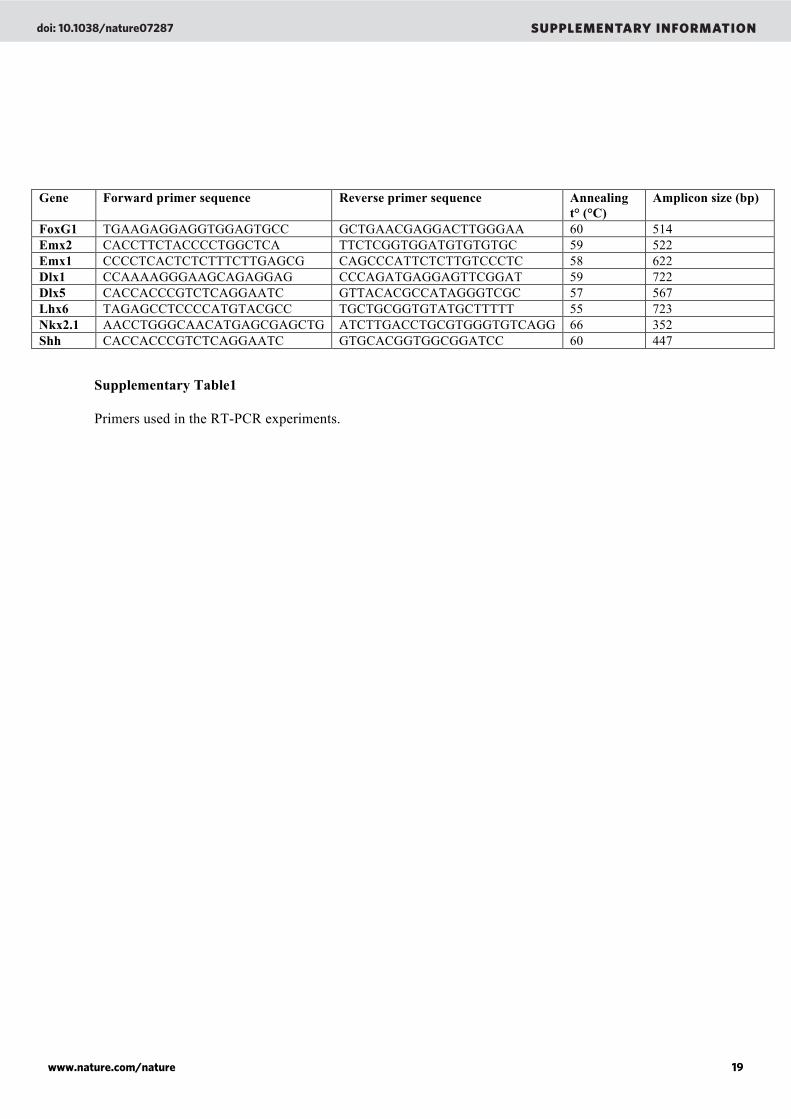
Supplementary Table1
Primers used in the RT-PCR experiments.
Gene Forward primer sequence Reverse primer sequence Annealing t° (°C)
Amplicon size (bp)
FoxG1 TGAAGAGGAGGTGGAGTGCC GCTGAACGAGGACTTGGGAA 60 514 Emx2 CACCTTCTACCCCTGGCTCA TTCTCGGTGGATGTGTGTGC 59 522 Emx1 CCCCTCACTCTCTTTCTTGAGCG CAGCCCATTCTCTTGTCCCTC 58 622 Dlx1 CCAAAAGGGAAGCAGAGGAG CCCAGATGAGGAGTTCGGAT 59 722 Dlx5 CACCACCCGTCTCAGGAATC GTTACACGCCATAGGGTCGC 57 567 Lhx6 TAGAGCCTCCCCATGTACGCC TGCTGCGGTGTATGCTTTTT 55 723 Nkx2.1 AACCTGGGCAACATGAGCGAGCTG ATCTTGACCTGCGTGGGTGTCAGG 66 352 Shh CACCACCCGTCTCAGGAATC GTGCACGGTGGCGGATCC 60 447
doi: 10.1038/nature07287 SUPPLEMENTARY INFORMATION
www.nature.com/nature 19
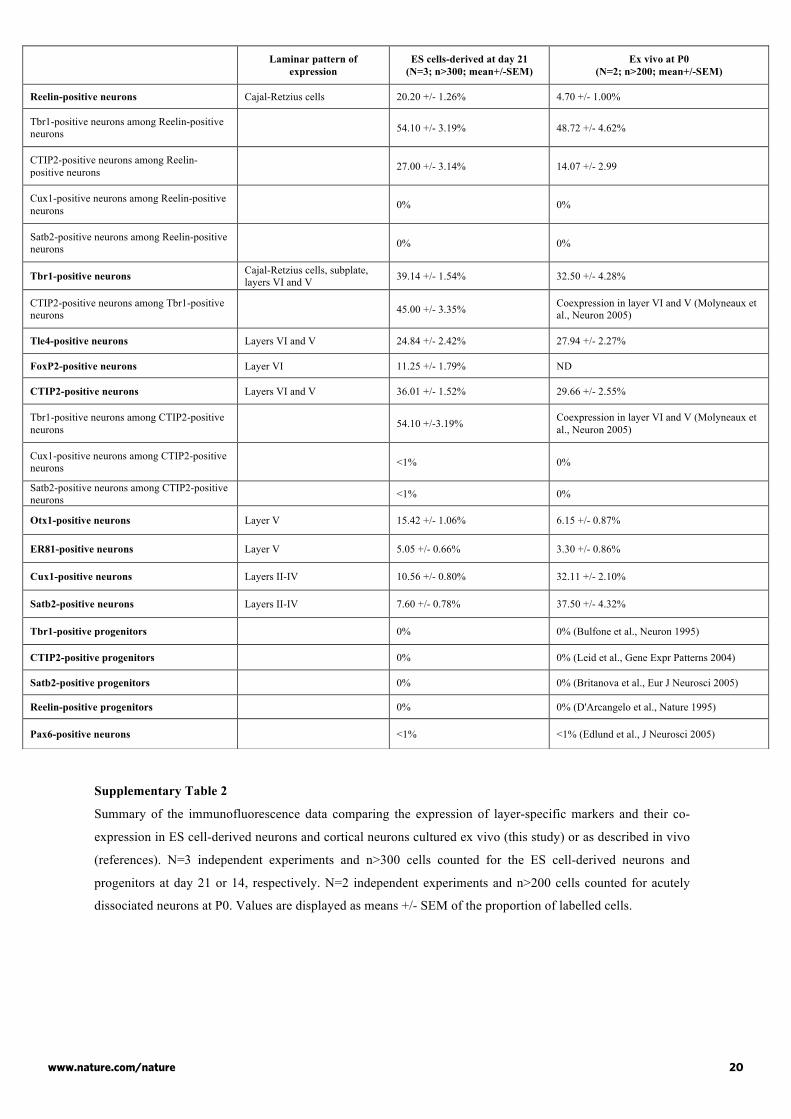
Supplementary Table 2
Summary of the immunofluorescence data comparing the expression of layer-specific markers and their co-
expression in ES cell-derived neurons and cortical neurons cultured ex vivo (this study) or as described in vivo
(references). N=3 independent experiments and n>300 cells counted for the ES cell-derived neurons and
progenitors at day 21 or 14, respectively. N=2 independent experiments and n>200 cells counted for acutely
dissociated neurons at P0. Values are displayed as means +/- SEM of the proportion of labelled cells.
Laminar pattern of expression
ES cells-derived at day 21 (N=3; n>300; mean+/-SEM)
Ex vivo at P0 (N=2; n>200; mean+/-SEM)
Reelin-positive neurons Cajal-Retzius cells 20.20 +/- 1.26% 4.70 +/- 1.00%
Tbr1-positive neurons among Reelin-positive neurons 54.10 +/- 3.19% 48.72 +/- 4.62%
CTIP2-positive neurons among Reelin-positive neurons 27.00 +/- 3.14% 14.07 +/- 2.99
Cux1-positive neurons among Reelin-positive neurons 0% 0%
Satb2-positive neurons among Reelin-positive neurons 0% 0%
Tbr1-positive neurons Cajal-Retzius cells, subplate, layers VI and V 39.14 +/- 1.54% 32.50 +/- 4.28%
CTIP2-positive neurons among Tbr1-positive neurons 45.00 +/- 3.35% Coexpression in layer VI and V (Molyneaux et
al., Neuron 2005)
Tle4-positive neurons Layers VI and V 24.84 +/- 2.42% 27.94 +/- 2.27%
FoxP2-positive neurons Layer VI 11.25 +/- 1.79% ND
CTIP2-positive neurons Layers VI and V 36.01 +/- 1.52% 29.66 +/- 2.55%
Tbr1-positive neurons among CTIP2-positive neurons 54.10 +/-3.19% Coexpression in layer VI and V (Molyneaux et
al., Neuron 2005)
Cux1-positive neurons among CTIP2-positive neurons <1% 0%
Satb2-positive neurons among CTIP2-positive neurons <1% 0%
Otx1-positive neurons Layer V 15.42 +/- 1.06% 6.15 +/- 0.87%
ER81-positive neurons Layer V 5.05 +/- 0.66% 3.30 +/- 0.86%
Cux1-positive neurons Layers II-IV 10.56 +/- 0.80% 32.11 +/- 2.10%
Satb2-positive neurons Layers II-IV 7.60 +/- 0.78% 37.50 +/- 4.32%
Tbr1-positive progenitors 0% 0% (Bulfone et al., Neuron 1995)
CTIP2-positive progenitors 0% 0% (Leid et al., Gene Expr Patterns 2004)
Satb2-positive progenitors 0% 0% (Britanova et al., Eur J Neurosci 2005)
Reelin-positive progenitors 0% 0% (D'Arcangelo et al., Nature 1995)
Pax6-positive neurons <1% <1% (Edlund et al., J Neurosci 2005)
www.nature.com/nature 20
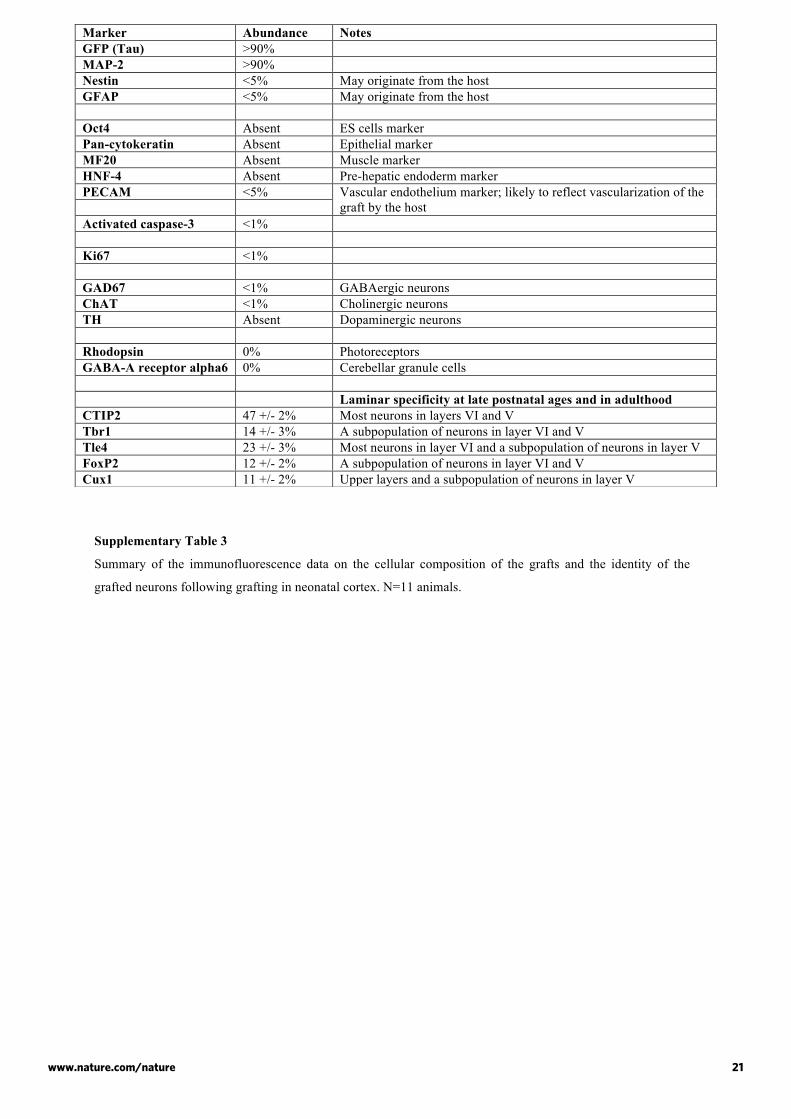
Supplementary Table 3
Summary of the immunofluorescence data on the cellular composition of the grafts and the identity of the
grafted neurons following grafting in neonatal cortex. N=11 animals.
Marker Abundance Notes GFP (Tau) >90% MAP-2 >90% Nestin <5% May originate from the host GFAP <5% May originate from the host Oct4 Absent ES cells marker Pan-cytokeratin Absent Epithelial marker MF20 Absent Muscle marker HNF-4 Absent Pre-hepatic endoderm marker PECAM <5%
Vascular endothelium marker; likely to reflect vascularization of the graft by the host
Activated caspase-3 <1% Ki67 <1% GAD67 <1% GABAergic neurons ChAT <1% Cholinergic neurons TH Absent Dopaminergic neurons Rhodopsin 0% Photoreceptors GABA-A receptor alpha6 0% Cerebellar granule cells Laminar specificity at late postnatal ages and in adulthood CTIP2 47 +/- 2% Most neurons in layers VI and V Tbr1 14 +/- 3% A subpopulation of neurons in layer VI and V Tle4 23 +/- 3% Most neurons in layer VI and a subpopulation of neurons in layer V FoxP2 12 +/- 2% A subpopulation of neurons in layer VI and V Cux1 11 +/- 2% Upper layers and a subpopulation of neurons in layer V
www.nature.com/nature 21
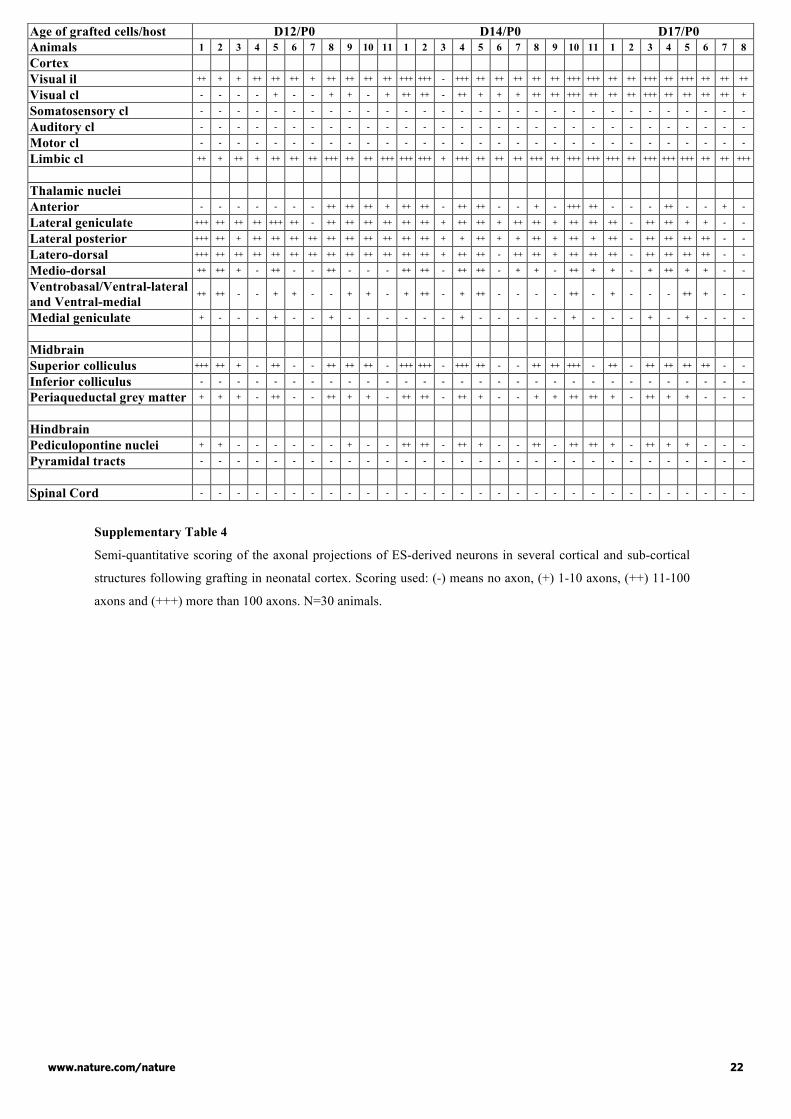
Supplementary Table 4
Semi-quantitative scoring of the axonal projections of ES-derived neurons in several cortical and sub-cortical
structures following grafting in neonatal cortex. Scoring used: (-) means no axon, (+) 1-10 axons, (++) 11-100
axons and (+++) more than 100 axons. N=30 animals.
Age of grafted cells/host D12/P0 D14/P0 D17/P0 Animals 1 2 3 4 5 6 7 8 9 10 11 1 2 3 4 5 6 7 8 9 10 11 1 2 3 4 5 6 7 8 Cortex Visual il ++ + + ++ ++ ++ + ++ ++ ++ ++ +++ +++ - +++ ++ ++ ++ ++ ++ +++ +++ ++ ++ +++ ++ +++ ++ ++ ++
Visual cl - - - - + - - + + - + ++ ++ - ++ + + + ++ ++ +++ ++ ++ ++ +++ ++ ++ ++ ++ +
Somatosensory cl - - - - - - - - - - - - - - - - - - - - - - - - - - - - - -
Auditory cl - - - - - - - - - - - - - - - - - - - - - - - - - - - - - -
Motor cl - - - - - - - - - - - - - - - - - - - - - - - - - - - - - -
Limbic cl ++ + ++ + ++ ++ ++ +++ ++ ++ +++ +++ +++ + +++ ++ ++ ++ +++ ++ +++ +++ +++ ++ +++ +++ +++ ++ ++ +++
Thalamic nuclei
Anterior - - - - - - - ++ ++ ++ + ++ ++ - ++ ++ - - + - +++ ++ - - - ++ - - + -
Lateral geniculate +++ ++ ++ ++ +++ ++ - ++ ++ ++ ++ ++ ++ + ++ ++ + ++ ++ + ++ ++ ++ - ++ ++ + + - -
Lateral posterior +++ ++ + ++ ++ ++ ++ ++ ++ ++ ++ ++ ++ + + ++ + + ++ + ++ + ++ - ++ ++ ++ ++ - -
Latero-dorsal +++ ++ ++ ++ ++ ++ ++ ++ ++ ++ ++ ++ ++ + ++ ++ - ++ ++ + ++ ++ ++ - ++ ++ ++ ++ - -
Medio-dorsal ++ ++ + - ++ - - ++ - - - ++ ++ - ++ ++ - + + - ++ + + - + ++ + + - -
Ventrobasal/Ventral-lateral and Ventral-medial
++ ++ - - + + - - + + - + ++ - + ++ - - - - ++ - + - - - ++ + - -
Medial geniculate + - - - + - - + - - - - - - + - - - - - + - - - + - + - - -
Midbrain
Superior colliculus +++ ++ + - ++ - - ++ ++ ++ - +++ +++ - +++ ++ - - ++ ++ +++ - ++ - ++ ++ ++ ++ - -
Inferior colliculus - - - - - - - - - - - - - - - - - - - - - - - - - - - - - -
Periaqueductal grey matter + + + - ++ - - ++ + + - ++ ++ - ++ + - - + + ++ ++ + - ++ + + - - -
Hindbrain
Pediculopontine nuclei + + - - - - - - + - - ++ ++ - ++ + - - ++ - ++ ++ + - ++ + + - - -
Pyramidal tracts - - - - - - - - - - - - - - - - - - - - - - - - - - - - - -
Spinal Cord - - - - - - - - - - - - - - - - - - - - - - - - - - - - - -
www.nature.com/nature 22
Cortex Septum Striatum Thalamus Hypothalamus Midbrain 1-1 + - - - - - 1-7 - - - + - - 2-2 + + + - - - 2-4 - + - + + - 2-6 - + - + + - 2-8 - + + - + - 2-2b - ++ - - - + 2-4b - + ++ - - + 2-5b ++ - + + + - 2-6b ++ + + - - - 2-7b - + - - + - 2-10b - + - - + - 2-11b + - - ++ - ++ 3-1 ++ + + - - - 3-3 + + + + + - 3-4 ++ - - - + + 3-5 + - - ++ ++ + 3-6 - + + ++ + - 3-7 + + - - + - 3-8 + + - - ++ - 3-9 + + + + + + 3-10 + - + + + +
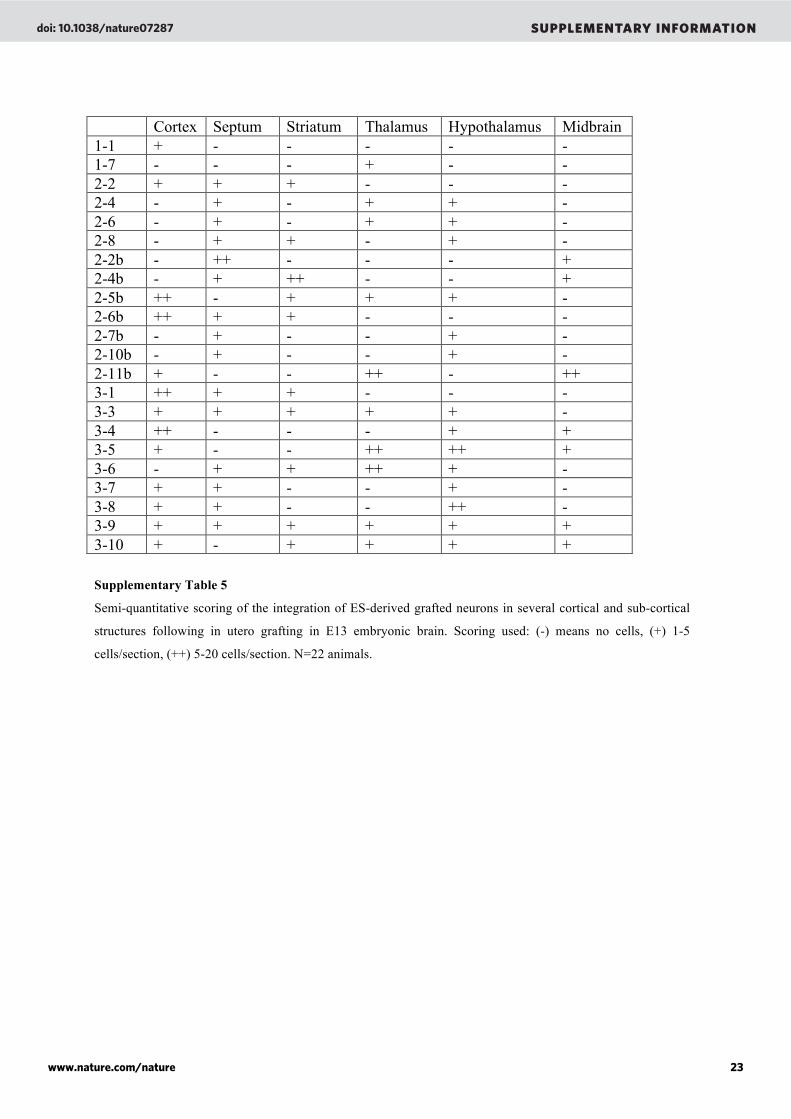
Supplementary Table 5
Semi-quantitative scoring of the integration of ES-derived grafted neurons in several cortical and sub-cortical
structures following in utero grafting in E13 embryonic brain. Scoring used: (-) means no cells, (+) 1-5
cells/section, (++) 5-20 cells/section. N=22 animals.
www.nature.com/nature 23
doi: 10.1038/nature07287 SUPPLEMENTARY INFORMATION
D14 DDM+Cyclopamine D14 DDM 1 2 3 4 5 6 7 8 9 10 11 1 2 3 4 5 6
Internal capsule +++ +++ ++ +++ +++ ++ ++ +++ +++ +++ +++ + + + + + +
Corpus callsoum ++ ++ + ++ + + + ++ ++ +++ ++ - + + - + +
Cortex Visual cl ++ ++ - ++ + + + ++ ++ +++ ++ - - - - - - Thalamus
nuclei
Anterior ++ ++ - ++ ++ - - + - +++ ++ + ++ ++ + + ++ Lateral
geniculate ++ ++ + ++ ++ + ++ ++ + ++ ++ - + - - + +
Midbrain Superior colliculus +++ +++ - +++ ++ - - ++ ++ +++ ++ - + - - + +
Periaqueductal gray matter ++ ++ - ++ + - - + + ++ ++ ++ ++ ++ ++ ++ ++
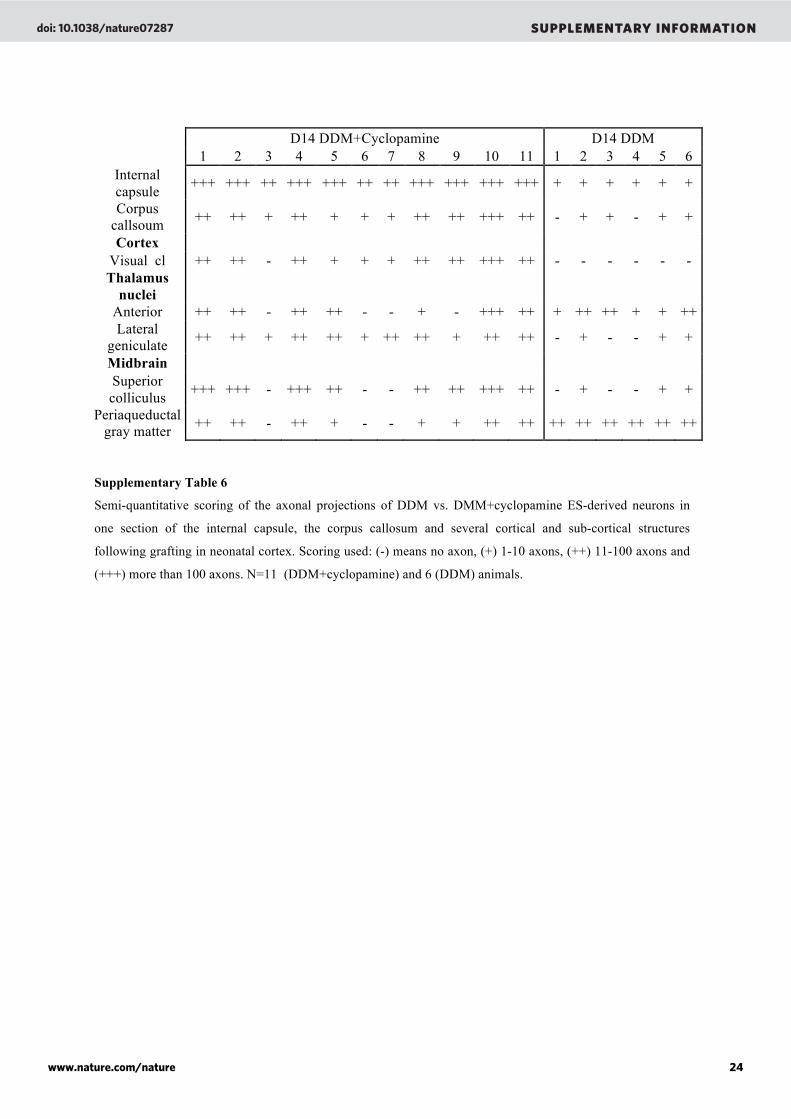
Supplementary Table 6
Semi-quantitative scoring of the axonal projections of DDM vs. DMM+cyclopamine ES-derived neurons in
one section of the internal capsule, the corpus callosum and several cortical and sub-cortical structures
following grafting in neonatal cortex. Scoring used: (-) means no axon, (+) 1-10 axons, (++) 11-100 axons and
(+++) more than 100 axons. N=11 (DDM+cyclopamine) and 6 (DDM) animals.
doi: 10.1038/nature07287 SUPPLEMENTARY INFORMATION
www.nature.com/nature 24