-WHBM08- Inventory & Cost of Goods Sold
64
© The McGraw-Hill Companies, Inc., 2002 McGraw-Hill/Irwin Slide 8-1 INVENTORIES AND THE COST OF GOODS SOLD Chapter 8
-
Upload
muhammad-salman-rasheed -
Category
Documents
-
view
218 -
download
0
Transcript of -WHBM08- Inventory & Cost of Goods Sold

7/30/2019 -WHBM08- Inventory & Cost of Goods Sold
http://slidepdf.com/reader/full/-whbm08-inventory-cost-of-goods-sold 1/64
© The McGraw-Hill Companies, Inc., 2002 McGraw-Hill/Irwin
Slide
8-1
INVENTORIES AND THECOST OF GOODS SOLD
Chapter
8
7/30/2019 -WHBM08- Inventory & Cost of Goods Sold
http://slidepdf.com/reader/full/-whbm08-inventory-cost-of-goods-sold 2/64
© The McGraw-Hill Companies, Inc., 2002 McGraw-Hill/Irwin
Slide
8-2
Inventory
Goods ownedand held for sale
to customers
Currentasset
Inventory Defined

7/30/2019 -WHBM08- Inventory & Cost of Goods Sold
http://slidepdf.com/reader/full/-whbm08-inventory-cost-of-goods-sold 3/64
© The McGraw-Hill Companies, Inc., 2002 McGraw-Hill/Irwin
Slide
8-3
INCOME STATEMENT
Revenue
Cost of goods sold
Gross profit
Expenses
Net income
As purchase costs(or manufacturing
costs) are incurred
as goodsare sold
BALANCE SHEET
Current assets:
Inventory
$ $
$
The Flow of Inventory Costs
7/30/2019 -WHBM08- Inventory & Cost of Goods Sold
http://slidepdf.com/reader/full/-whbm08-inventory-cost-of-goods-sold 4/64
© The McGraw-Hill Companies, Inc., 2002 McGraw-Hill/Irwin
Slide
8-4
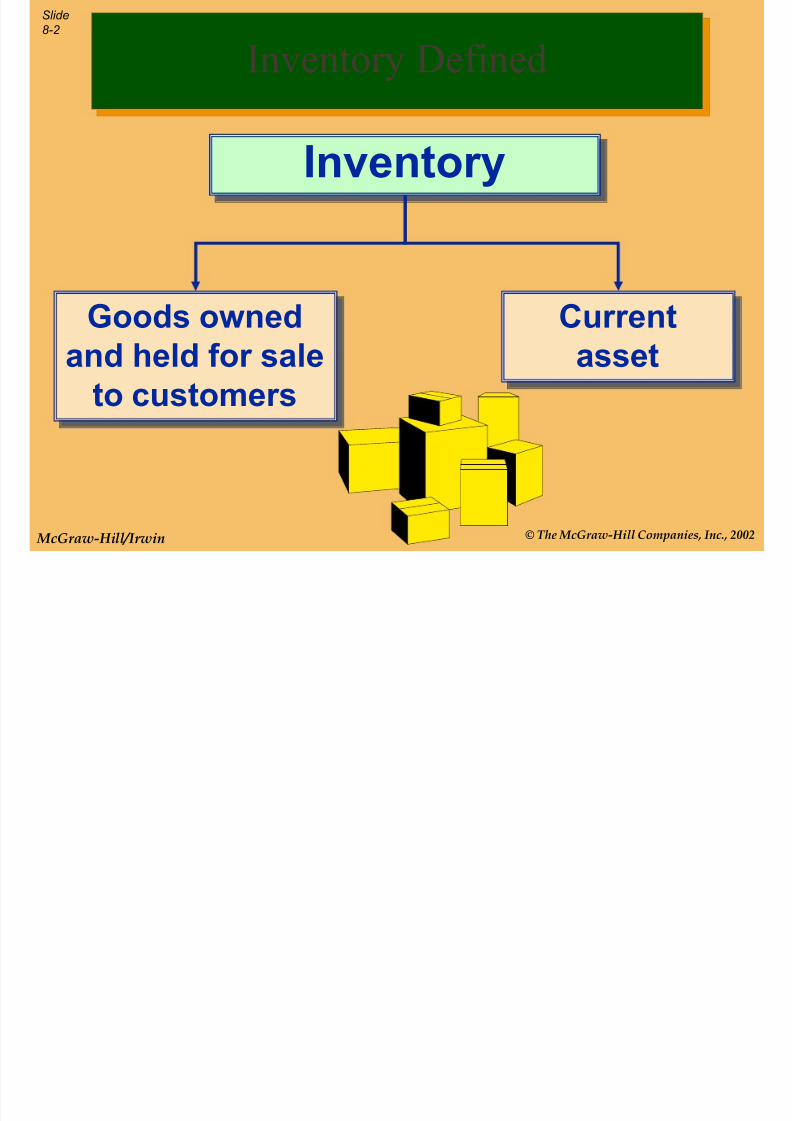
GENERAL JOURNAL
Date Account Titles and Explanation Debit Credit
Entry on Purchase Date
Inventory $$$$
Accounts Payable $$$$
Entry on Sale Date
Cost of Goods Sold $$$$
Inventory $$$$
In a perpetual inventory system, inventory entriesparallel the flow of costs.
The Flow of Inventory Costs
7/30/2019 -WHBM08- Inventory & Cost of Goods Sold
http://slidepdf.com/reader/full/-whbm08-inventory-cost-of-goods-sold 5/64
© The McGraw-Hill Companies, Inc., 2002 McGraw-Hill/Irwin
Slide
8-5
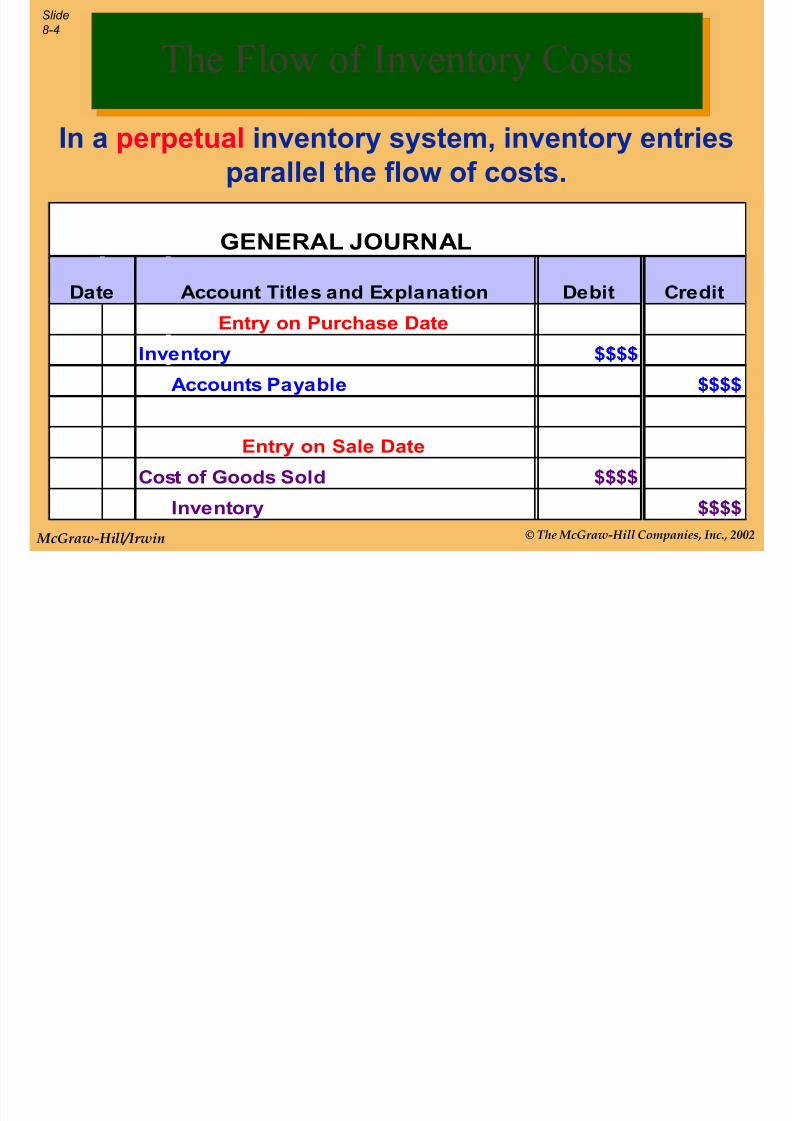
GENERAL JOURNAL
Date Account Titles and Explanation Debit Credit
Entry on Sale Date
Cost of Goods Sold $$$$
Inventory $$$$
When identical units of inventory havedifferent unit costs, a question naturally
arises as to which of these costs should be
used in recording a sale of inventory.
Which Unit Did We Sell?

7/30/2019 -WHBM08- Inventory & Cost of Goods Sold
http://slidepdf.com/reader/full/-whbm08-inventory-cost-of-goods-sold 6/64
© The McGraw-Hill Companies, Inc., 2002 McGraw-Hill/Irwin
Slide
8-6
A separate subsidiary account is maintainedfor each item in inventory.
How can we determine the unit cost for the Sept. 10 sale?
Item LL002 Primary supplier Electronic City
Descripti
on Laser Light Seconda
ry supplier Electric CompanyLocation Storeroo
m 2 Inventory level: Min: 25 Max: 200
Purchased Sold Balance
Date Units
Unit
Cost Total Units
Unit
Cost
Cost of
Goods
Sold Units
Unit
Cost Total
Sept. 5 100 30$ 3,000$ 100 30$ 3,000$
Sept. 9 75 50 3,750 100 30 3,000
75 50 3,750
Sept. 10 10 ? ? ? ? ?
? ? ?
Inventory Subsidiary Ledger
7/30/2019 -WHBM08- Inventory & Cost of Goods Sold
http://slidepdf.com/reader/full/-whbm08-inventory-cost-of-goods-sold 7/64© The McGraw-Hill Companies, Inc., 2002 McGraw-Hill/Irwin
Slide
8-7
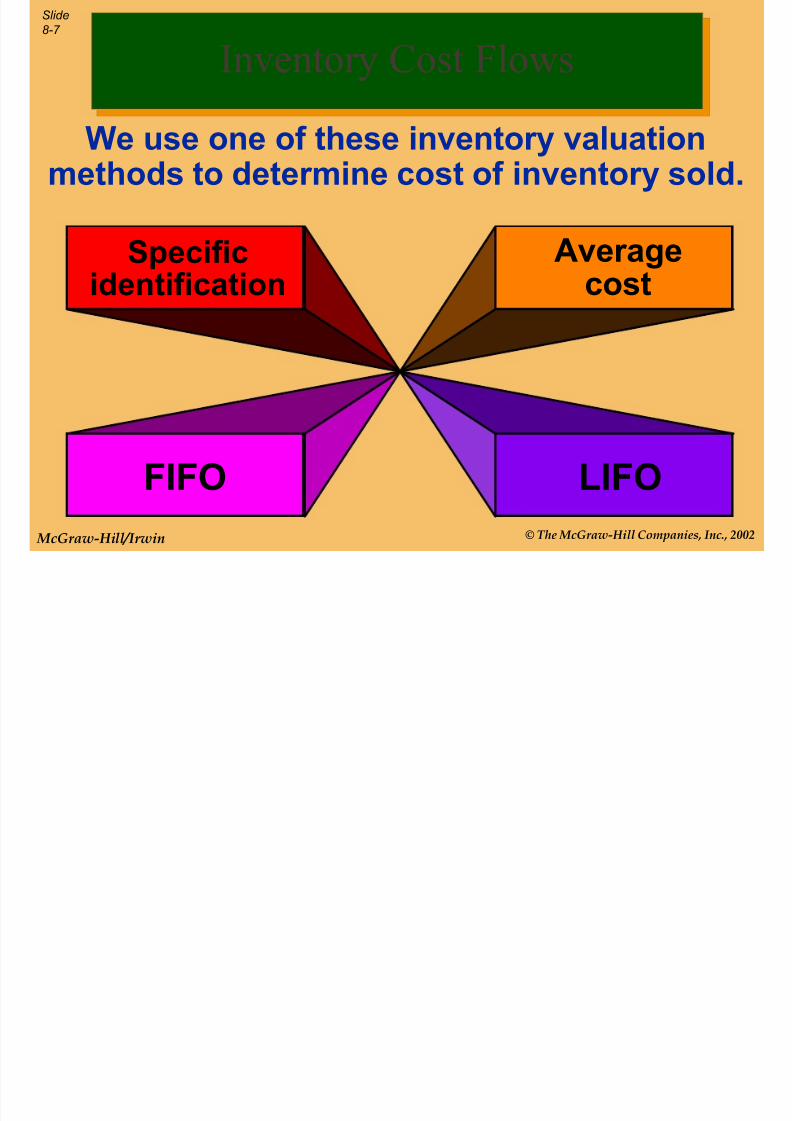
Specificidentification
LIFO
Averagecost
FIFO
We use one of these inventory valuationmethods to determine cost of inventory sold.
Inventory Cost Flows
7/30/2019 -WHBM08- Inventory & Cost of Goods Sold
http://slidepdf.com/reader/full/-whbm08-inventory-cost-of-goods-sold 8/64© The McGraw-Hill Companies, Inc., 2002 McGraw-Hill/Irwin
Slide
8-8
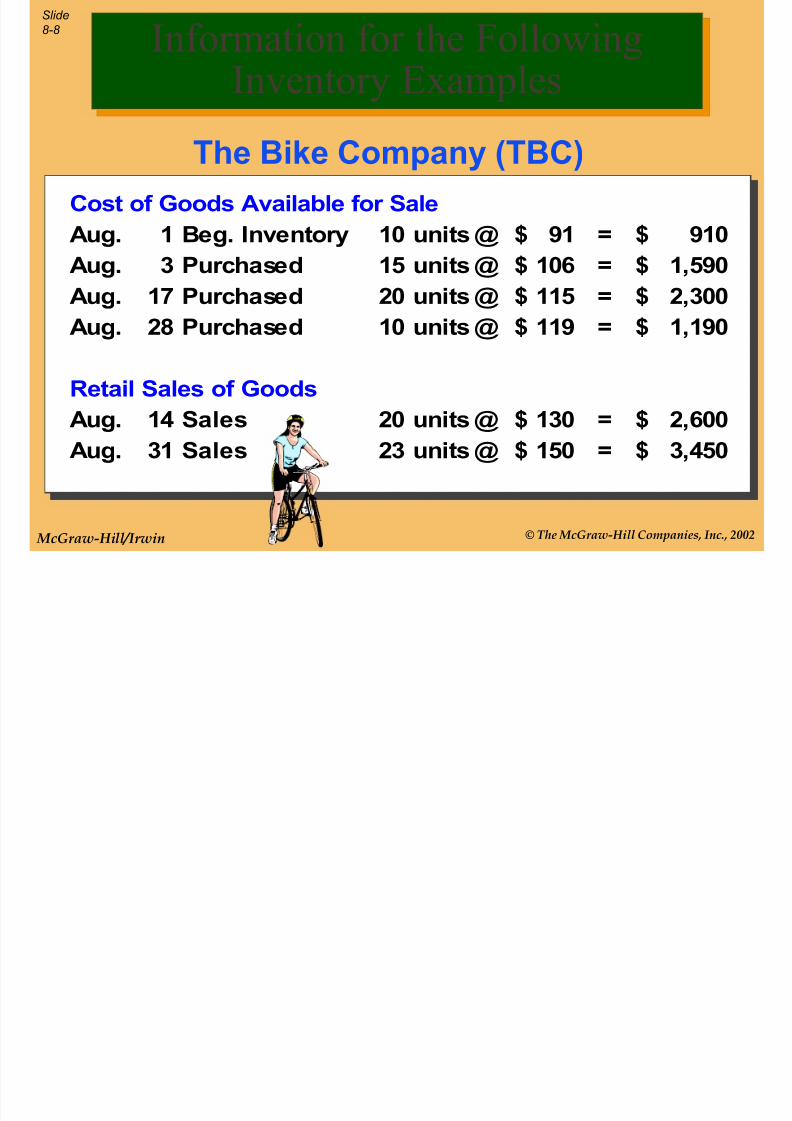
Cost of Goods Available for Sale
Aug. 1 Beg. Inventory 10 units @ 91$ = 910$
Aug. 3 Purchased 15 units @ 106$ = 1,590$
Aug. 17 Purchased 20 units @ 115$ = 2,300$
Aug. 28 Purchased 10 units @ 119$ = 1,190$
Retail Sales of GoodsAug. 14 Sales 20 units @ 130$ = 2,600$
Aug. 31 Sales 23 units @ 150$ = 3,450$
The Bike Company (TBC)
Information for the FollowingInventory Examples
7/30/2019 -WHBM08- Inventory & Cost of Goods Sold
http://slidepdf.com/reader/full/-whbm08-inventory-cost-of-goods-sold 9/64© The McGraw-Hill Companies, Inc., 2002 McGraw-Hill/Irwin
Slide
8-9
Specific Identification
When a unit
is sold, thespecific cost of
the unit sold is
added to costof goods sold.

7/30/2019 -WHBM08- Inventory & Cost of Goods Sold
http://slidepdf.com/reader/full/-whbm08-inventory-cost-of-goods-sold 10/64© The McGraw-Hill Companies, Inc., 2002 McGraw-Hill/Irwin
Slide
8-10
Date Purchases Cost of Goods Sold
Inventory
Balance
Aug. 1 10 @ 91$ = 910$ 910$
Aug. 3 15 @ 106$ = 1,590$ 2,500$
On August 14, TBC sold 20 bikes for $130 each.
Nine bikes originally cost $91 and 11 bikesoriginally cost $106.
Continue
Specific Identification – Example

7/30/2019 -WHBM08- Inventory & Cost of Goods Sold
http://slidepdf.com/reader/full/-whbm08-inventory-cost-of-goods-sold 11/64© The McGraw-Hill Companies, Inc., 2002 McGraw-Hill/Irwin
Slide
8-11
The Cost of Goods Sold for the August 14 sale is$1,985, leaving $515 and 5 units in inventory.
Continue
Date Purchases Cost of Goods Sold
Inventory
Balance
Aug. 1 10 @ 91$ = 910$ 910$
Aug. 3 15 @ 106$ = 1,590$ 2,500$Aug. 14 9 @ 91$ = 819$
11 @ 106$ = 1,166$ 515$
Let’s look at the entries for
the Aug. 14 sale.
Specific Identification – Example
7/30/2019 -WHBM08- Inventory & Cost of Goods Sold
http://slidepdf.com/reader/full/-whbm08-inventory-cost-of-goods-sold 12/64© The McGraw-Hill Companies, Inc., 2002 McGraw-Hill/Irwin
Slide
8-12
Continue
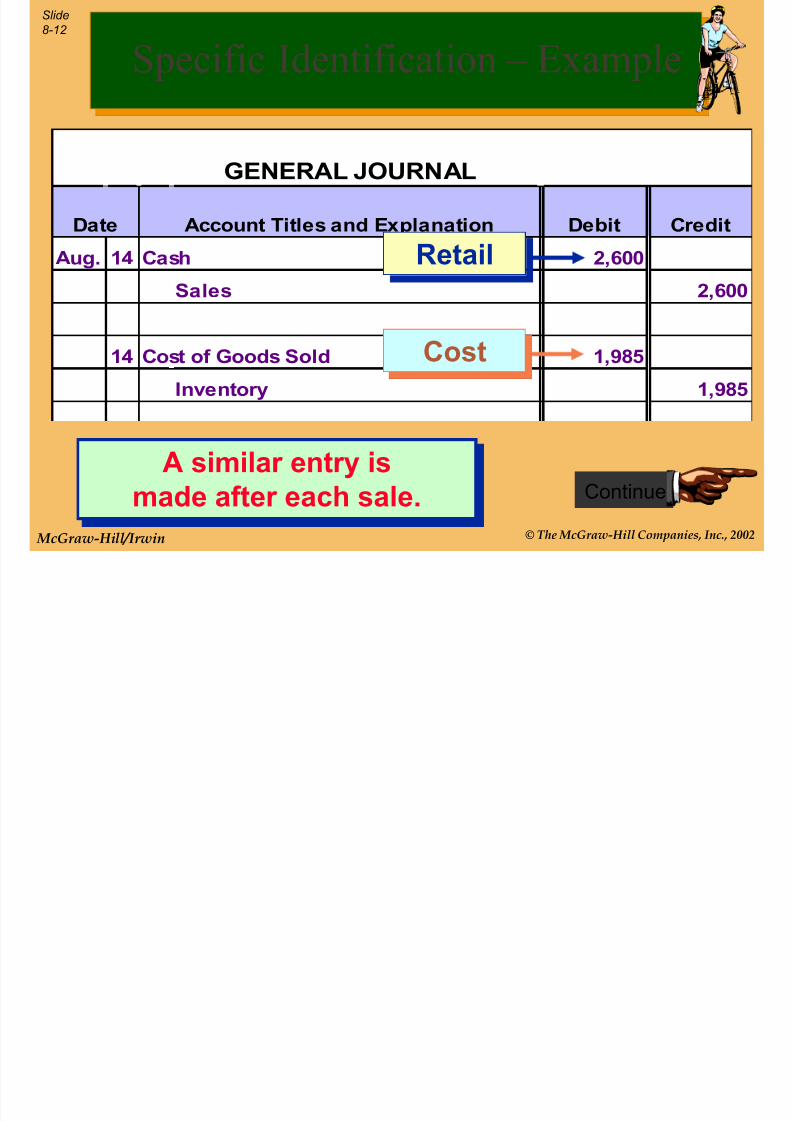
GENERAL JOURNAL
Date Account Titles and Explanation Debit Credit
Aug. 14 Cash 2,600
Sales 2,600
14 Cost of Goods Sold 1,985
Inventory 1,985
Retail
Cost
A similar entry ismade after each sale.
Specific Identification – Example

7/30/2019 -WHBM08- Inventory & Cost of Goods Sold
http://slidepdf.com/reader/full/-whbm08-inventory-cost-of-goods-sold 13/64© The McGraw-Hill Companies, Inc., 2002 McGraw-Hill/Irwin
Slide
8-13
Additional purchases were made on August 17 and 28.
Costs associated with sales on August 31 were as follows: 1 @ $91,3 @ $106, 15 @ $115, & 4 @ $119.
Date Purchases Cost of Goods Sold
Inventory
Balance
Aug. 1 10 @ 91$ = 910$ 910$
Aug. 3 15 @ 106$ = 1,590$ 2,500$Aug. 14 9 @ 91$ = 819$
11 @ 106$ = 1,166$ 515$
Aug. 17 20 @ 115$ = 2,300$ 2,815$
Aug. 28 10 @ 119$ = 1,190$ 4,005$
Date Purchases Cost of Goods Sold
Inventory
Balance
Aug. 1 10 @ 91$ = 910$ 910$
Aug. 3 15 @ 106$ = 1,590$ 2,500$Aug. 14 9 @ 91$ = 819$
11 @ 106$ = 1,166$ 515$
Aug. 17 20 @ 115$ = 2,300$ 2,815$
Aug. 28 10 @ 119$ = 1,190$ 4,005$
Aug. 31 1 @ 91$ = 91$
3 @ 106$ = 318$
15 @ 115$ = 1,725$
4 @ 119$ = 476$ 1,395$
Continue
Specific Identification – Example
Cost of Goods
Sold for August 31 =
$2,610

7/30/2019 -WHBM08- Inventory & Cost of Goods Sold
http://slidepdf.com/reader/full/-whbm08-inventory-cost-of-goods-sold 14/64© The McGraw-Hill Companies, Inc., 2002 McGraw-Hill/Irwin
Slide
8-14
Balance Sheet
Inventory = $1,395
Income Statement
COGS = $4,595
1 @ 106$ = 106$
5 @ 115$ = 575
6 @ 119$ = 714
End. Inv. 1,395$
Specific Identification – Example
Cost of Goods SoldInventoryBalance
910$
2,500$
9 @ 91$ = 819$
11 @ 106$ = 1,166$ 515$2,815$
4,005$
1 @ 91$ = 91$
3 @ 106$ = 318$
15 @ 115$ = 1,725$
4 @ 119$ = 476$ 1,395$

7/30/2019 -WHBM08- Inventory & Cost of Goods Sold
http://slidepdf.com/reader/full/-whbm08-inventory-cost-of-goods-sold 15/64
© The McGraw-Hill Companies, Inc., 2002 McGraw-Hill/Irwin
Slide
8-15
Since specificidentification is so
easy, can’t we use itall the time?
Not really. Specificidentification is hard to use
when we sell a lot of
inventory that has lots of different costs.

7/30/2019 -WHBM08- Inventory & Cost of Goods Sold
http://slidepdf.com/reader/full/-whbm08-inventory-cost-of-goods-sold 16/64
© The McGraw-Hill Companies, Inc., 2002 McGraw-Hill/Irwin
Slide
8-16
Cost of Goods Available for
Sale
Units on handon the date of
sale
÷
Average-Cost Method
When a unit is sold,
the average cost of each unit
in inventory is assigned tocost
of goods sold.
7/30/2019 -WHBM08- Inventory & Cost of Goods Sold
http://slidepdf.com/reader/full/-whbm08-inventory-cost-of-goods-sold 17/64
© The McGraw-Hill Companies, Inc., 2002 McGraw-Hill/Irwin
Slide
8-17
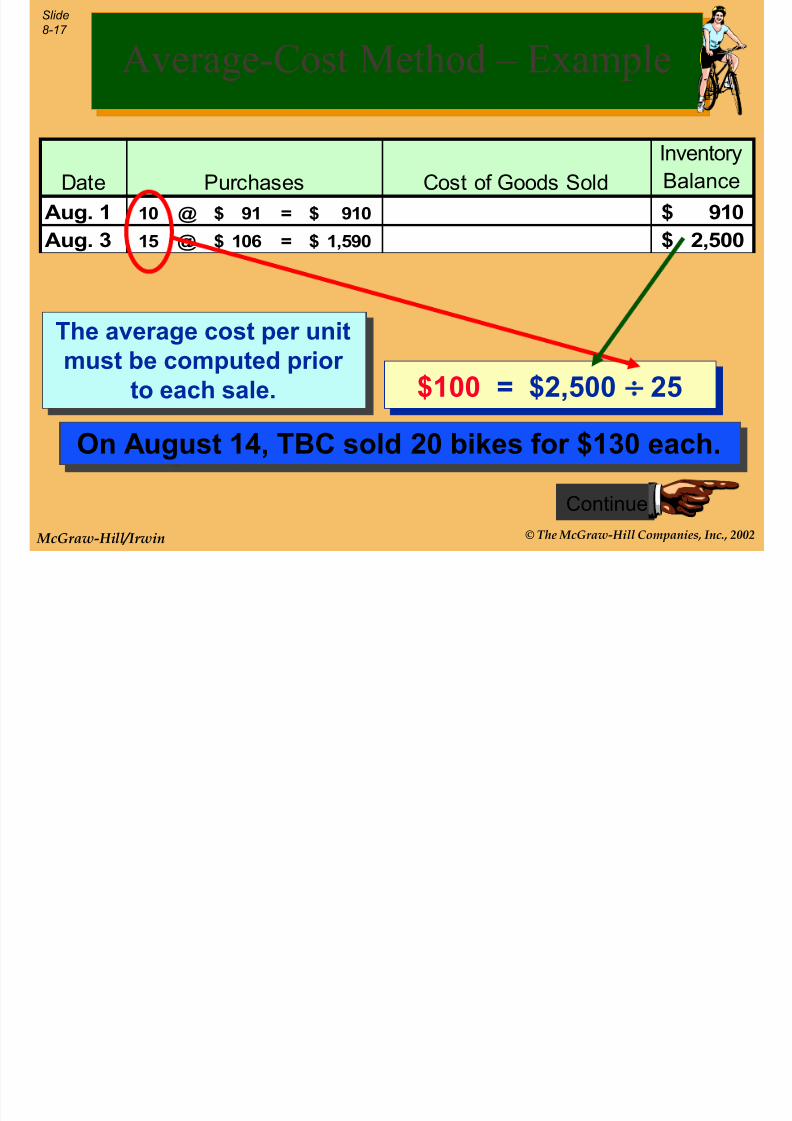
On August 14, TBC sold 20 bikes for $130 each.
Continue
Date Purchases Cost of Goods Sold
Inventory
Balance
Aug. 1 10 @ 91$ = 910$ 910$
Aug. 3 15 @ 106$ = 1,590$ 2,500$
The average cost per unitmust be computed prior
to each sale.
Average-Cost Method – Example
$100 = $2,500 25

7/30/2019 -WHBM08- Inventory & Cost of Goods Sold
http://slidepdf.com/reader/full/-whbm08-inventory-cost-of-goods-sold 18/64
© The McGraw-Hill Companies, Inc., 2002 McGraw-Hill/Irwin
Slide
8-18
Date Purchases Cost of Goods Sold
Inventory
Balance
Aug. 1 10 @ 91$ = 910$ 910$
Aug. 3 15 @ 106$ = 1,590$ 2,500$
Aug. 14 20 @ 100$ = 2,000$ 500$
Continue
The average cost per unit is $100.
Let’s look at the entries
for the Aug. 14 sale.
Average-Cost Method – Example
$100 = $2,500 25
Slid

7/30/2019 -WHBM08- Inventory & Cost of Goods Sold
http://slidepdf.com/reader/full/-whbm08-inventory-cost-of-goods-sold 19/64
© The McGraw-Hill Companies, Inc., 2002 McGraw-Hill/Irwin
Slide
8-19
GENERAL JOURNAL
Date Account Titles and Explanation Debit Credit
Aug. 14 Cash 2,600Sales 2,600
14 Cost of Goods Sold 2,000
Inventory 2,000
Continue
Retail
Cost
A similar entry ismade after each sale.
Average-Cost Method – Example
Slid
7/30/2019 -WHBM08- Inventory & Cost of Goods Sold
http://slidepdf.com/reader/full/-whbm08-inventory-cost-of-goods-sold 20/64
© The McGraw-Hill Companies, Inc., 2002 McGraw-Hill/Irwin
Slide
8-20
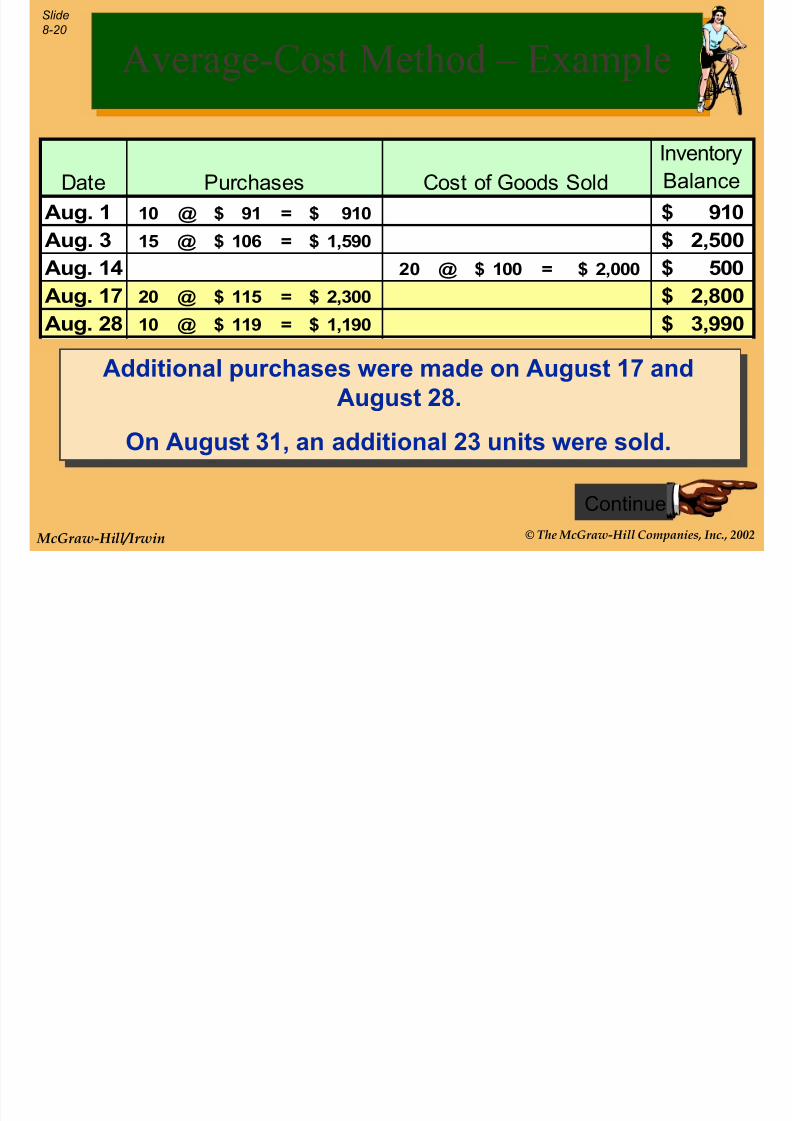
Additional purchases were made on August 17 and
August 28.
On August 31, an additional 23 units were sold.
Continue
Date Purchases Cost of Goods Sold
Inventory
Balance
Aug. 1 10 @ 91$ = 910$ 910$
Aug. 3 15 @ 106$ = 1,590$ 2,500$
Aug. 14 20 @ 100$ = 2,000$ 500$
Aug. 17 20 @ 115$ = 2,300$ 2,800$
Aug. 28 10 @ 119$ = 1,190$ 3,990$
Average-Cost Method – Example
Slid

7/30/2019 -WHBM08- Inventory & Cost of Goods Sold
http://slidepdf.com/reader/full/-whbm08-inventory-cost-of-goods-sold 21/64
© The McGraw-Hill Companies, Inc., 2002 McGraw-Hill/Irwin
Slide
8-21
$114 = $3,990 35
Date Purchases Cost of Goods Sold
Inventory
Balance
Aug. 1 10 @ 91$ = 910$ 910$
Aug. 3 15 @ 106$ = 1,590$ 2,500$
Aug. 14 20 @ 100$ = 2,000$ 500$
Aug. 17 20 @ 115$ = 2,300$ 2,800$
Aug. 28 10 @ 119$ = 1,190$ 3,990$
Total Purchases 55
Less: Sales to Date -20Units on Hand 35
Average-Cost Method – Example
Slide
7/30/2019 -WHBM08- Inventory & Cost of Goods Sold
http://slidepdf.com/reader/full/-whbm08-inventory-cost-of-goods-sold 22/64
© The McGraw-Hill Companies, Inc., 2002 McGraw-Hill/Irwin
Slide
8-22
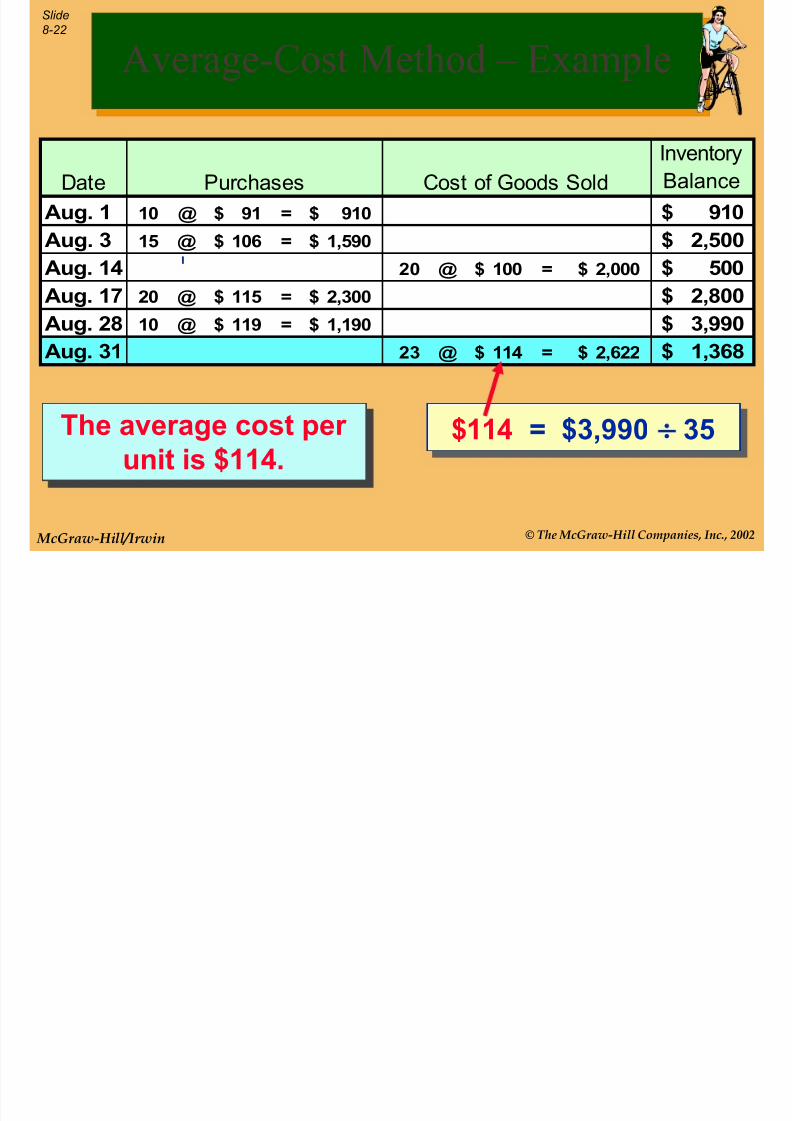
$114 = $3,990 35
Date Purchases Cost of Goods Sold
Inventory
Balance
Aug. 1 10 @ 91$ = 910$ 910$
Aug. 3 15 @ 106$ = 1,590$ 2,500$
Aug. 14 20 @ 100$ = 2,000$ 500$
Aug. 17 20 @ 115$ = 2,300$ 2,800$
Aug. 28 10 @ 119$ = 1,190$ 3,990$
Aug. 31 23 @ 114$ = 2,622$ 1,368$
The average cost per unit is $114.
Average-Cost Method – Example

7/30/2019 -WHBM08- Inventory & Cost of Goods Sold
http://slidepdf.com/reader/full/-whbm08-inventory-cost-of-goods-sold 23/64
Slide

7/30/2019 -WHBM08- Inventory & Cost of Goods Sold
http://slidepdf.com/reader/full/-whbm08-inventory-cost-of-goods-sold 24/64
© The McGraw-Hill Companies, Inc., 2002 McGraw-Hill/Irwin
Slide
8-24
Costs of Goods Sold
EndingInventory
OldestCosts
RecentCosts
First-In, First-Out Method (FIFO)
Slide
7/30/2019 -WHBM08- Inventory & Cost of Goods Sold
http://slidepdf.com/reader/full/-whbm08-inventory-cost-of-goods-sold 25/64
© The McGraw-Hill Companies, Inc., 2002 McGraw-Hill/Irwin
Slide
8-25
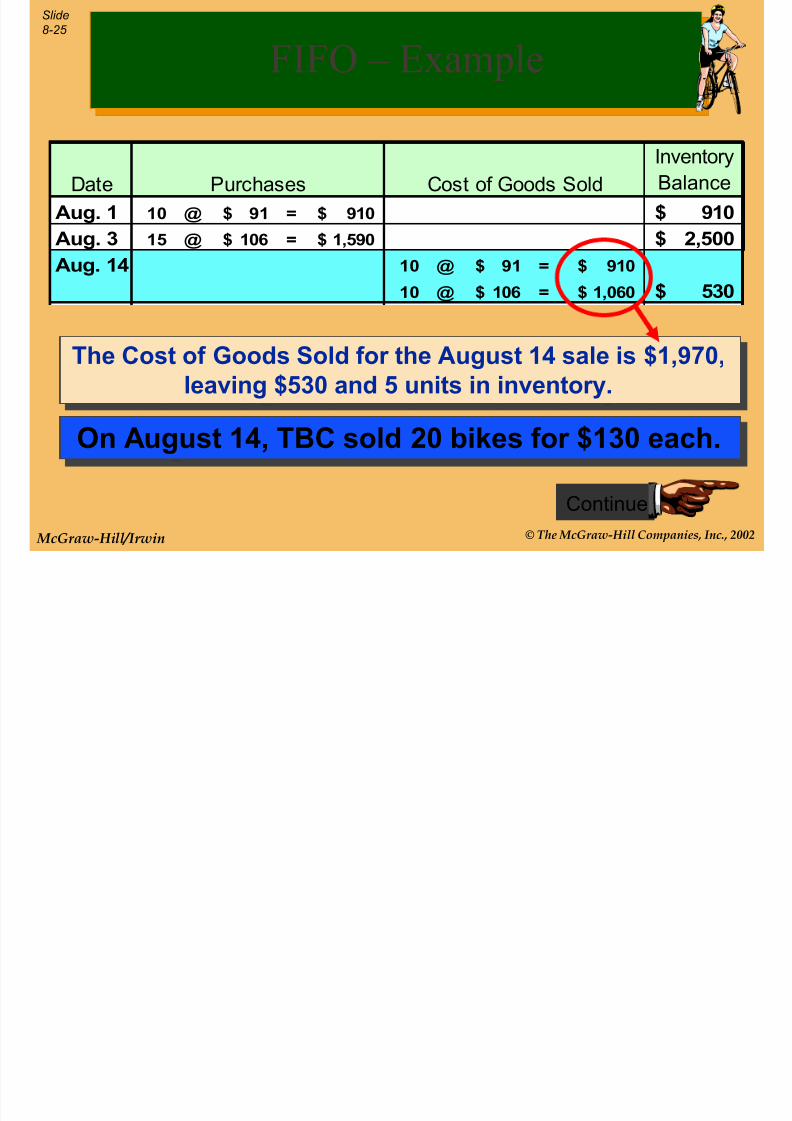
On August 14, TBC sold 20 bikes for $130 each.
Continue
Date Purchases Cost of Goods Sold
Inventory
Balance
Aug. 1 10 @ 91$ = 910$ 910$
Aug. 3 15 @ 106$ = 1,590$ 2,500$
The Cost of Goods Sold for the August 14 sale is $1,970,
leaving $530 and 5 units in inventory.
Date Purchases Cost of Goods Sold
Inventory
Balance
Aug. 1 10 @ 91$ = 910$ 910$
Aug. 3 15 @ 106$ = 1,590$ 2,500$
Aug. 14 10 @ 91$ = 910$
10 @ 106$ = 1,060$ 530$
FIFO – Example
Slide
7/30/2019 -WHBM08- Inventory & Cost of Goods Sold
http://slidepdf.com/reader/full/-whbm08-inventory-cost-of-goods-sold 26/64
© The McGraw-Hill Companies, Inc., 2002 McGraw-Hill/Irwin
Slide
8-26
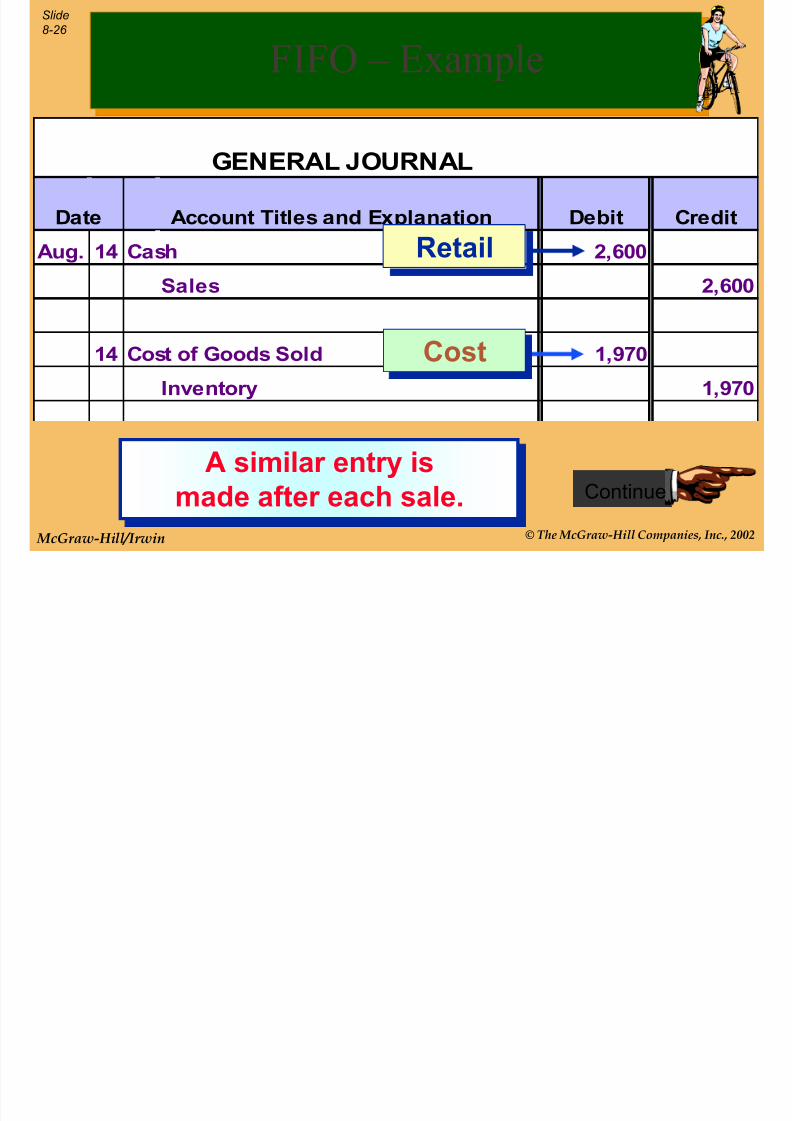
GENERAL JOURNAL
Date Account Titles and Explanation Debit Credit
Aug. 14 Cash 2,600Sales 2,600
14 Cost of Goods Sold 1,970
Inventory 1,970
Retail
Cost
Continue
A similar entry ismade after each sale.
FIFO – Example
Slide

7/30/2019 -WHBM08- Inventory & Cost of Goods Sold
http://slidepdf.com/reader/full/-whbm08-inventory-cost-of-goods-sold 27/64
© The McGraw-Hill Companies, Inc., 2002 McGraw-Hill/Irwin
Slide
8-27
Additional purchases were made on Aug. 17 and Aug. 28.
On August 31, an additional 23 units were sold.
Continue
Date Purchases Cost of Goods Sold
Inventory
Balance
Aug. 1 10 @ 91$ = 910$ 910$
Aug. 3 15 @ 106$ = 1,590$ 2,500$
Aug. 14 10 @ 91$ = 910$
10 @ 106$ = 1,060$ 530$
Aug. 17 20 @ 115$ = 2,300$ 2,830$
Aug. 28 10 @ 119$ = 1,190$ 4,020$
FIFO – Example
Date Purchases Cost of Goods Sold
Inventory
Balance
Aug. 1 10 @ 91$ = 910$ 910$
Aug. 3 15 @ 106$ = 1,590$ 2,500$
Aug. 14 10 @ 91$ = 910$
10 @ 106$ = 1,060$ 530$
Aug. 17 20 @ 115$ = 2,300$ 2,830$
Aug. 28 10 @ 119$ = 1,190$ 4,020$
Aug. 31 5 @ 106$ = 530$
18 @ 115$ = 2,070$ 1,420$
Cost of Goods Sold for August 31 = $2,600
Slide

7/30/2019 -WHBM08- Inventory & Cost of Goods Sold
http://slidepdf.com/reader/full/-whbm08-inventory-cost-of-goods-sold 28/64
© The McGraw-Hill Companies, Inc., 2002 McGraw-Hill/Irwin
Slide
8-28
Balance Sheet
Inventory = $1,420
Cost of Goods SoldInventoryBalance
910$
2,500$
10 @ 91$ = 910$
10 @ 106$ = 1,060$ 530$
2,830$
4,020$
5 @ 106$ = 530$
18 @ 115$ = 2,070$ 1,420$
Income Statement
COGS = $4,570
2 @ 115$ = 230$
10 @ 119$ = 1,190
End. Inv. 1,420$
FIFO – Example
Slide

7/30/2019 -WHBM08- Inventory & Cost of Goods Sold
http://slidepdf.com/reader/full/-whbm08-inventory-cost-of-goods-sold 29/64
© The McGraw-Hill Companies, Inc., 2002 McGraw-Hill/Irwin
Slide
8-29
Costs of Goods Sold
EndingInventory
RecentCosts
OldestCosts
Last-In, First-Out Method (LIFO)
Slide
7/30/2019 -WHBM08- Inventory & Cost of Goods Sold
http://slidepdf.com/reader/full/-whbm08-inventory-cost-of-goods-sold 30/64
© The McGraw-Hill Companies, Inc., 2002 McGraw-Hill/Irwin
Slide
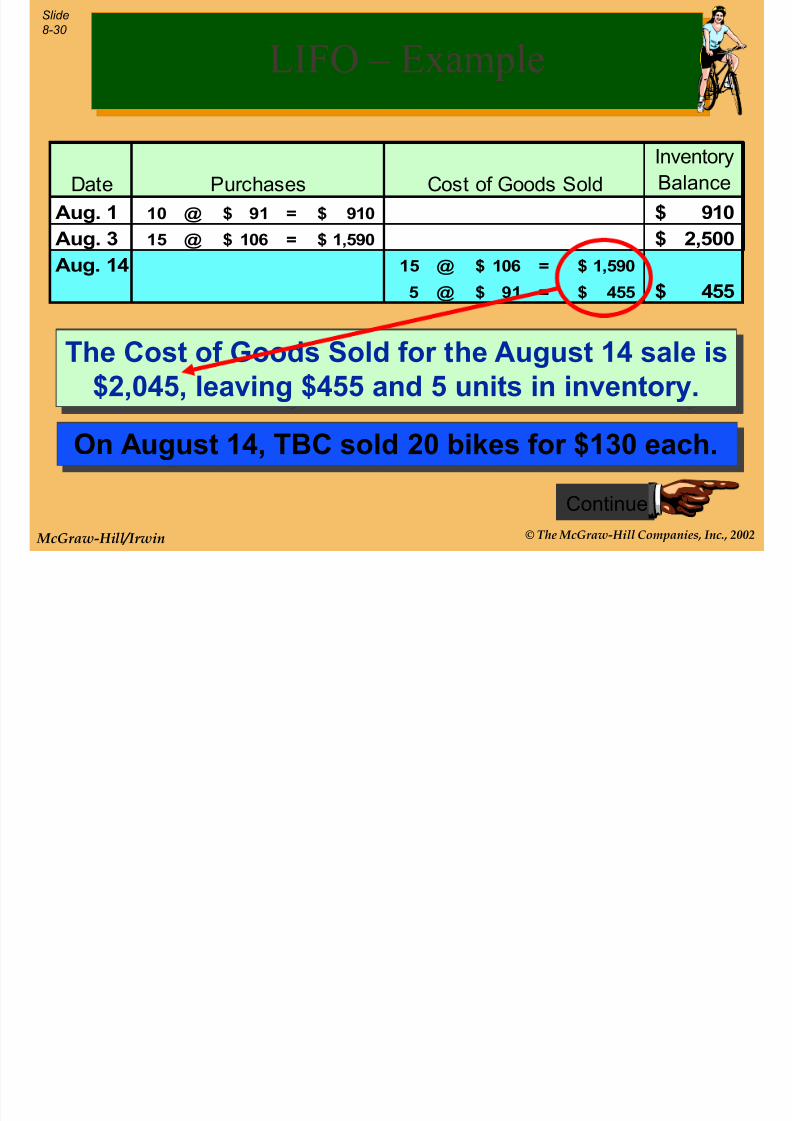
8-30
On August 14, TBC sold 20 bikes for $130 each.
Continue
Date Purchases Cost of Goods Sold
Inventory
Balance
Aug. 1 10 @ 91$ = 910$ 910$
Aug. 3 15 @ 106$ = 1,590$ 2,500$
LIFO – Example
Date Purchases Cost of Goods Sold
Inventory
Balance
Aug. 1 10 @ 91$ = 910$ 910$
Aug. 3 15 @ 106$ = 1,590$ 2,500$
Aug. 14 15 @ 106$ = 1,590$
5 @ 91$ = 455$ 455$
The Cost of Goods Sold for the August 14 sale is
$2,045, leaving $455 and 5 units in inventory.
Slide

7/30/2019 -WHBM08- Inventory & Cost of Goods Sold
http://slidepdf.com/reader/full/-whbm08-inventory-cost-of-goods-sold 31/64
© The McGraw-Hill Companies, Inc., 2002 McGraw-Hill/Irwin
Slide
8-31
GENERAL JOURNAL
Date Account Titles and Explanation Debit Credit
Aug. 14 Cash 2,600Sales 2,600
14 Cost of Goods Sold 2,045
Inventory 2,045
Continue
Retail
Cost
A similar entry ismade after each sale.
LIFO – Example
Slide

7/30/2019 -WHBM08- Inventory & Cost of Goods Sold
http://slidepdf.com/reader/full/-whbm08-inventory-cost-of-goods-sold 32/64
© The McGraw-Hill Companies, Inc., 2002 McGraw-Hill/Irwin
8-32
Continue
Date Purchases Cost of Goods Sold
Inventory
Balance
Aug. 1 10 @ 91$ = 910$ 910$
Aug. 3 15 @ 106$ = 1,590$ 2,500$
Aug. 14 15 @ 106$ = 1,590$
5 @ 91$ = 455$ 455$
Aug. 17 20 @ 115$ = 2,300$ 2,755$
Aug. 28 10 @ 119$ = 1,190$ 3,945$
LIFO – Example
Date Purchases Cost of Goods Sold
Inventory
Balance
Aug. 1 10 @ 91$ = 910$ 910$
Aug. 3 15 @ 106$ = 1,590$ 2,500$
Aug. 14 15 @ 106$ = 1,590$
5 @ 91$ = 455$ 455$
Aug. 17 20 @ 115$ = 2,300$ 2,755$
Aug. 28 10 @ 119$ = 1,190$ 3,945$
Aug. 31 10 @ 119$ = 1,190$
13 @ 115$ = 1,495$ 1,260$
Additional purchases were made on Aug. 17 and Aug. 28.
On Aug. 31, an additional 23 units were sold.Cost of Goods Sold for August 31 = $2,685
Slide

7/30/2019 -WHBM08- Inventory & Cost of Goods Sold
http://slidepdf.com/reader/full/-whbm08-inventory-cost-of-goods-sold 33/64
© The McGraw-Hill Companies, Inc., 2002 McGraw-Hill/Irwin
8-33
Cost of Goods SoldInventoryBalance
910$
2,500$
15 @ 106$ = 1,590$
5 @ 91$ = 455$ 455$
2,755$
3,945$
10 @ 119$ = 1,190$
13 @ 115$ = 1,495$ 1,260$
Balance Sheet
Inventory = $1,260
Income Statement
COGS = $4,730
LIFO – Example
5 @ 91$ = 455$
7 @ 115$ = 805
End. Inv. 1,260$
Slide
Inventory Valuation Methods: A Summary

7/30/2019 -WHBM08- Inventory & Cost of Goods Sold
http://slidepdf.com/reader/full/-whbm08-inventory-cost-of-goods-sold 34/64
© The McGraw-Hill Companies, Inc., 2002 McGraw-Hill/Irwin
8-34 Costs Allocated to:
Valuation
Method
Cost of Goods
Sold Inventory Comments
Specific Actual cost of Actual cost of units Parallels physical flow
identification the units sold remaining Logical method when units
are uniqueMay be misleading for
identical units
Average cost Number of units
sold times the
Number of units on
hand times the
Assigns all units the same
average unit cost
average unit cost average unit cost Current costs are averaged
in with older costs
First-in, First-out(FIFO)
Cost of earliestpurchases on
Cost of mostrecently
Cost of goods sold is basedon older costs
hand prior to the
sale
purchased units Inventory valued at current
costs
May overstate income during
periods of rising prices; may
increase income taxes due
Last-in, First-out
(LIFO)
Cost of most
recently
Cost of earliest
purchases
Cost of goods sold shown at
recent prices
purchased units (assumed still in
inventory)
Inventory shown at old (and
perhaps out of date) costs
Most conservative method
during periods of rising
prices; often results in lower income taxes
Slide

7/30/2019 -WHBM08- Inventory & Cost of Goods Sold
http://slidepdf.com/reader/full/-whbm08-inventory-cost-of-goods-sold 35/64
© The McGraw-Hill Companies, Inc., 2002 McGraw-Hill/Irwin
8-35
Once a company hasadopted a particular
accounting method, itshould follow that
method consistently,
rather than switchmethods from oneyear to the next.
The Principle of Consistency
Slide

7/30/2019 -WHBM08- Inventory & Cost of Goods Sold
http://slidepdf.com/reader/full/-whbm08-inventory-cost-of-goods-sold 36/64
© The McGraw-Hill Companies, Inc., 2002 McGraw-Hill/Irwin
8-36
This inventory arrived just in time for us to use
in the manufacturing
process.
Just-In-Time (JIT) InventorySystems
Slide
7/30/2019 -WHBM08- Inventory & Cost of Goods Sold
http://slidepdf.com/reader/full/-whbm08-inventory-cost-of-goods-sold 37/64
© The McGraw-Hill Companies, Inc., 2002 McGraw-Hill/Irwin
8-37
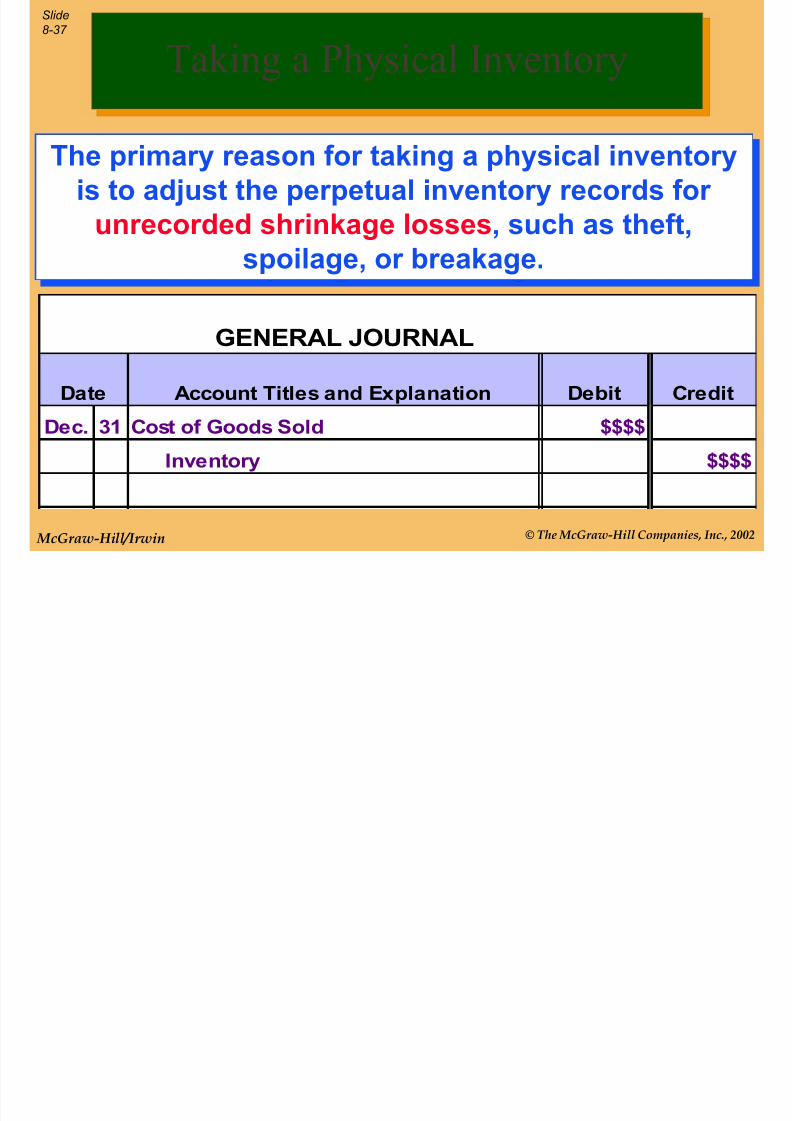
GENERAL JOURNAL
Date Account Titles and Explanation Debit Credit
Dec. 31 Cost of Goods Sold $$$$
Inventory $$$$
The primary reason for taking a physical inventoryis to adjust the perpetual inventory records for
unrecorded shrinkage losses, such as theft,
spoilage, or breakage.
Taking a Physical Inventory
Slide
C d O h i

7/30/2019 -WHBM08- Inventory & Cost of Goods Sold
http://slidepdf.com/reader/full/-whbm08-inventory-cost-of-goods-sold 38/64
© The McGraw-Hill Companies, Inc., 2002 McGraw-Hill/Irwin
8-38
Reduces the valueof the inventory.
Adjust inventoryvalue to the lower
of historical cost or current
replacement cost(market).
Obsolescence
Lower of Costor Market
(LCM)
LCM and Other Write-Downsof Inventory
Slide
7/30/2019 -WHBM08- Inventory & Cost of Goods Sold
http://slidepdf.com/reader/full/-whbm08-inventory-cost-of-goods-sold 39/64
© The McGraw-Hill Companies, Inc., 2002 McGraw-Hill/Irwin
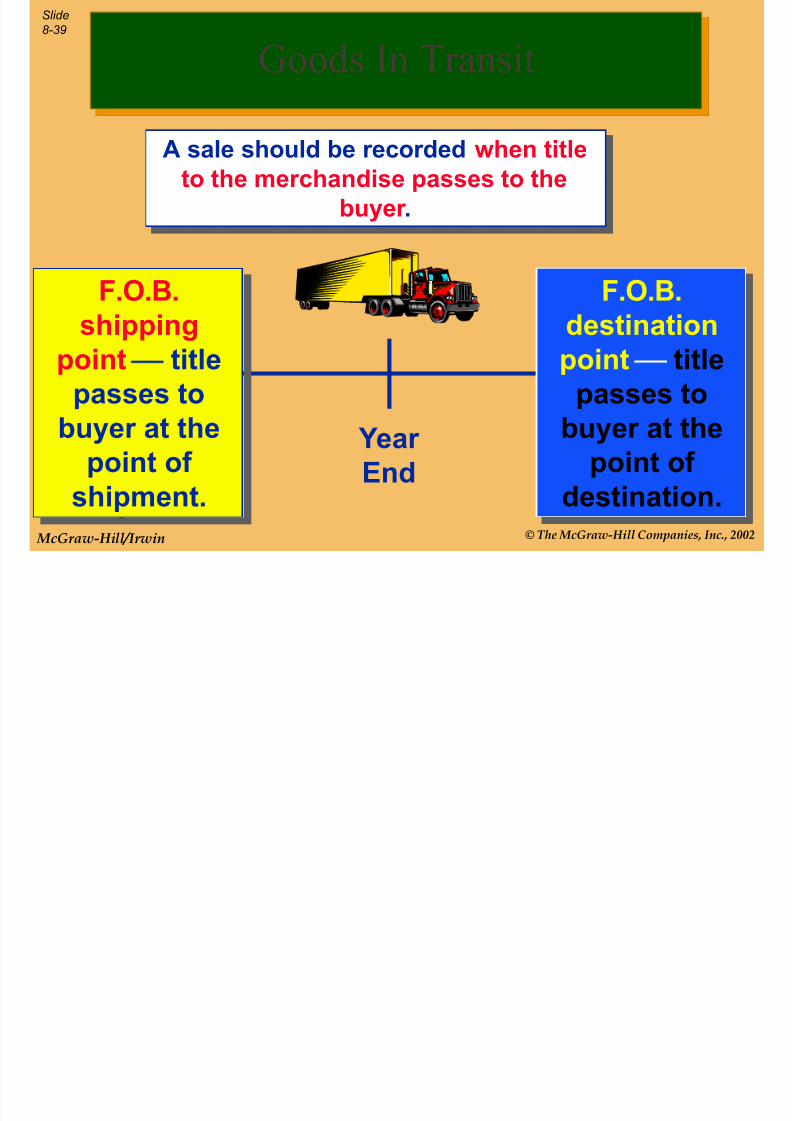
8-39
Year End
A sale should be recorded when titleto the merchandise passes to the
buyer .
F.O.B.shipping
point title
passes tobuyer at the
point of shipment.
F.O.B.destinationpoint title
passes tobuyer at the
point of destination.
Goods In Transit
Slide
8 40

7/30/2019 -WHBM08- Inventory & Cost of Goods Sold
http://slidepdf.com/reader/full/-whbm08-inventory-cost-of-goods-sold 40/64
© The McGraw-Hill Companies, Inc., 2002 McGraw-Hill/Irwin
8-40
GENERAL JOURNAL
Date Account Titles and Explanation Debit Credit
Entry on Purchase Date
Purchases $$$$
Accounts Payable $$$$
In a periodic inventory system, inventory entriesare as follows.
Note that an entry is not made to inventory.
Periodic Inventory Systems
Slide
8 41

7/30/2019 -WHBM08- Inventory & Cost of Goods Sold
http://slidepdf.com/reader/full/-whbm08-inventory-cost-of-goods-sold 41/64
© The McGraw-Hill Companies, Inc., 2002 McGraw-Hill/Irwin
8-41
GENERAL JOURNAL
Date Account Titles and Explanation Debit Credit
Entry on Sale Date
No entry to inventory.
Accounts Receivable $$$$
Sales $$$$
In a periodic inventory system, inventory entriesare as follows.
Periodic Inventory Systems
Slide
8 42

7/30/2019 -WHBM08- Inventory & Cost of Goods Sold
http://slidepdf.com/reader/full/-whbm08-inventory-cost-of-goods-sold 42/64
© The McGraw-Hill Companies, Inc., 2002 McGraw-Hill/Irwin
8-42
The inventory onhand and the
cost of goodssold for the year
are notdetermined untilyear-end.
Periodic Inventory Systems
Slide
8 43

7/30/2019 -WHBM08- Inventory & Cost of Goods Sold
http://slidepdf.com/reader/full/-whbm08-inventory-cost-of-goods-sold 43/64
© The McGraw-Hill Companies, Inc., 2002 McGraw-Hill/Irwin
8-43
Specificidentification
LIFO
Averagecost
FIFO
We use one of these inventory valuationmethods in a periodic inventory system.
Periodic Inventory Systems
Slide
8 44
I f ti f th F ll i

7/30/2019 -WHBM08- Inventory & Cost of Goods Sold
http://slidepdf.com/reader/full/-whbm08-inventory-cost-of-goods-sold 44/64
© The McGraw-Hill Companies, Inc., 2002 McGraw-Hill/Irwin
8-44
Computers, Inc.Mouse Pad Inventory
Date Units $/Unit Total
Beginning
Inventory 1,000 5.25$ 5,250.00$
Purchases:
Jan. 3 300 5.30 1,590.00
June 20 150 5.60 840.00
Sept. 15 200 5.80 1,160.00
Nov. 29 150 5.90 885.00
Goods
Available
for Sale 1,800 9,725.00$
Ending
Inventory 1,200 ?
Cost of
Goods Sold 600 ?
Information for the FollowingInventory Examples
Slide
8 45
7/30/2019 -WHBM08- Inventory & Cost of Goods Sold
http://slidepdf.com/reader/full/-whbm08-inventory-cost-of-goods-sold 45/64
© The McGraw-Hill Companies, Inc., 2002 McGraw-Hill/Irwin
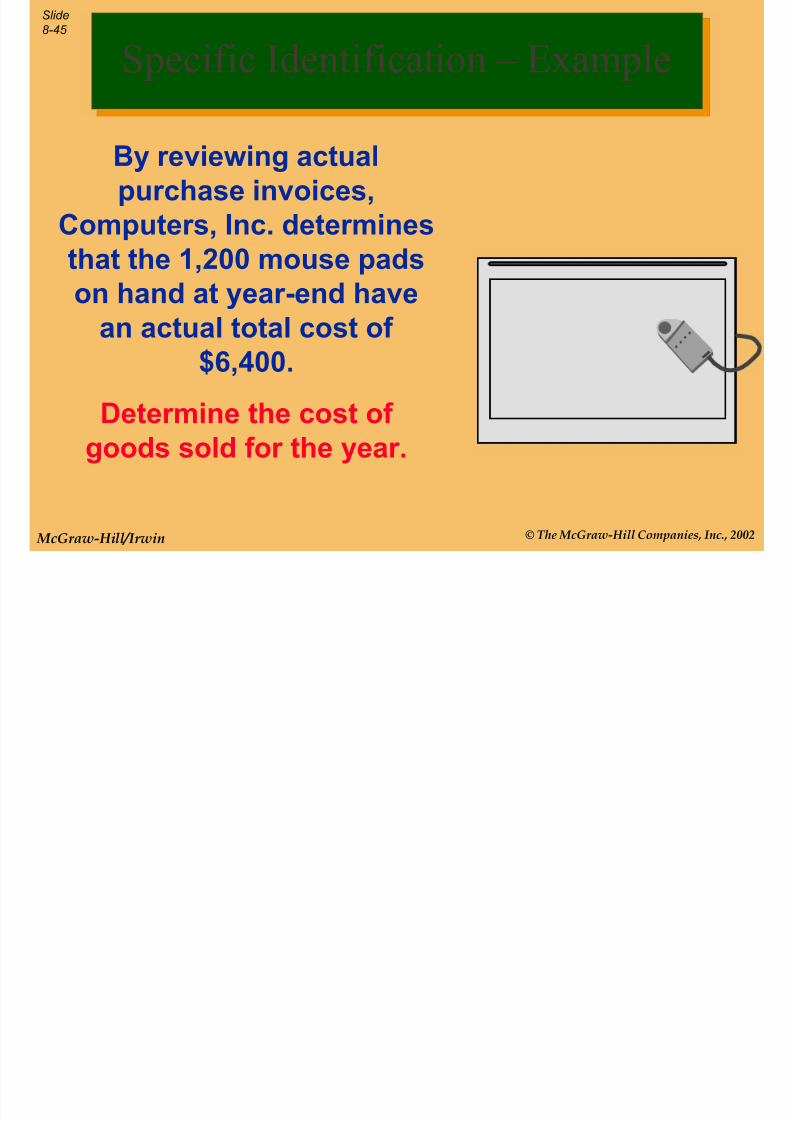
8-45
By reviewing actualpurchase invoices,
Computers, Inc. determines
that the 1,200 mouse padson hand at year-end have
an actual total cost of $6,400.
Determine the cost of goods sold for the year.
Specific Identification – Example
Slide
8 46

7/30/2019 -WHBM08- Inventory & Cost of Goods Sold
http://slidepdf.com/reader/full/-whbm08-inventory-cost-of-goods-sold 46/64
© The McGraw-Hill Companies, Inc., 2002 McGraw-Hill/Irwin
8-46
Computers, Inc.Mouse Pad Inventory
Date Units $/Unit Total
Beginning
Inventory 1,000 5.25$ 5,250.00$
Purchases:
Jan. 3 300 5.30 1,590.00
June 20 150 5.60 840.00
Sept. 15 200 5.80 1,160.00
Nov. 29 150 5.90 885.00
Goods
Available
for Sale 1,800 9,725.00$
Ending
Inventory 1,200 6,400.00$
Cost of
Goods Sold 600 3,325.00$
Cost of Goods Sold
$9,725 - $6,400 = $3,325
Specific Identification – Example
Slide
8-47
7/30/2019 -WHBM08- Inventory & Cost of Goods Sold
http://slidepdf.com/reader/full/-whbm08-inventory-cost-of-goods-sold 47/64
© The McGraw-Hill Companies, Inc., 2002 McGraw-Hill/Irwin
8-47
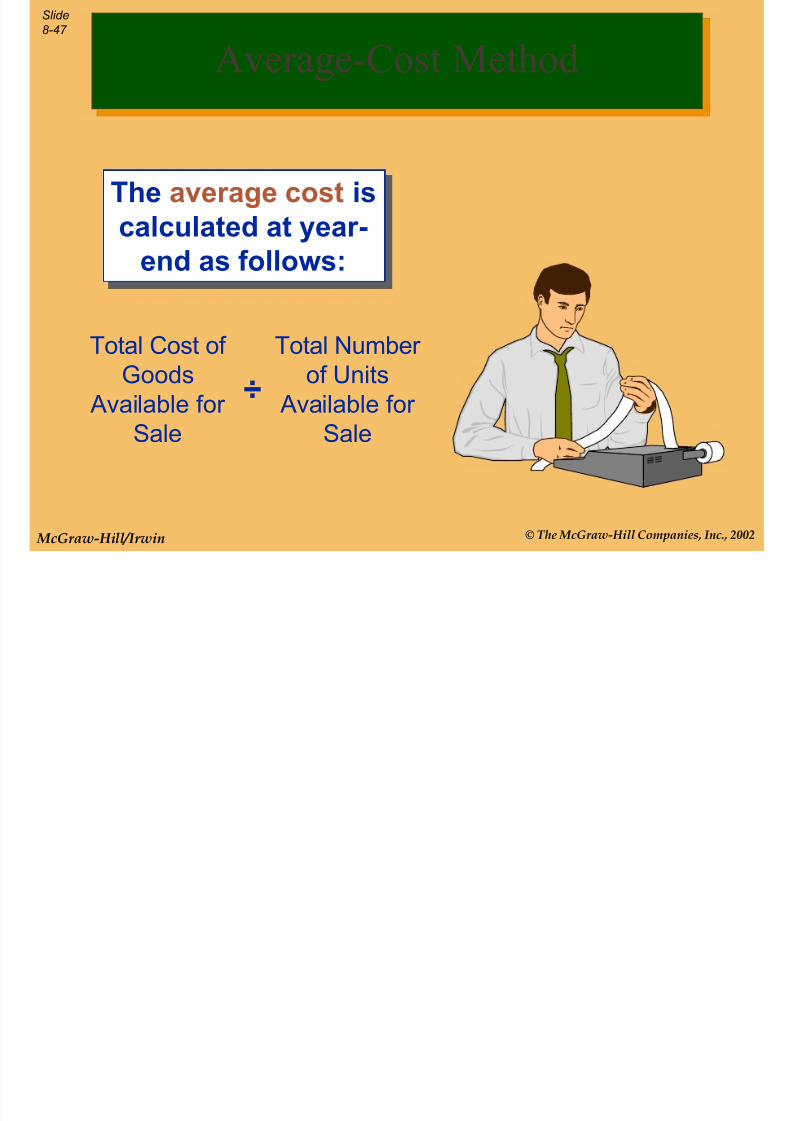
Total Cost of
Goods
Available for
Sale
Total Number
of Units
Available for
Sale÷
The average cost iscalculated at year-
end as follows:
Average-Cost Method
Slide
8-48

7/30/2019 -WHBM08- Inventory & Cost of Goods Sold
http://slidepdf.com/reader/full/-whbm08-inventory-cost-of-goods-sold 48/64
© The McGraw-Hill Companies, Inc., 2002 McGraw-Hill/Irwin
8-48
Computers, Inc.Mouse Pad Inventory
Date Units $/Unit Total
Beginning
Inventory 1,000 5.25$ 5,250.00$
Purchases:
Jan. 3 300 5.30 1,590.00 June 20 150 5.60 840.00
Sept. 15 200 5.80 1,160.00
Nov. 29 150 5.90 885.00
Goods
Available
for Sale 1,800 9,725.00$
Ending
Inventory 1,200 ?
Cost of
Goods Sold 600 ?
Avg. Cost $9,725 1,800 =$5.40278
Average-Cost Method – Example
Computers, Inc.Mouse Pad Inventory
Date Units $/Unit Total
Beginning
Inventory 1,000 5.25$ 5,250.00$
Purchases:
Jan. 3 300 5.30 1,590.00 June 20 150 5.60 840.00
Sept. 15 200 5.80 1,160.00
Nov. 29 150 5.90 885.00
Goods
Available
for Sale 1,800 9,725.00$
Ending
Inventory 1,200 6,483.00$
Cost of
Goods Sold 600 3,242.00$
Ending InventoryAvg. Cost $5.40278 1,200 =
$6,483
Cost of Goods SoldAvg. Cost $5.40278 600 =
$3,242
Slide
8-49

7/30/2019 -WHBM08- Inventory & Cost of Goods Sold
http://slidepdf.com/reader/full/-whbm08-inventory-cost-of-goods-sold 49/64
© The McGraw-Hill Companies, Inc., 2002 McGraw-Hill/Irwin
8 49
Costs of Goods Sold
EndingInventory
OldestCosts
RecentCosts
First-In, First-Out Method (FIFO)
Slide
8-50

7/30/2019 -WHBM08- Inventory & Cost of Goods Sold
http://slidepdf.com/reader/full/-whbm08-inventory-cost-of-goods-sold 50/64
© The McGraw-Hill Companies, Inc., 2002 McGraw-Hill/Irwin
8 50
Remember: Startwith the 11/29
purchase and thenadd other purchasesuntil you reach the
number of units inending inventory.
FIFO – Example
Computers, Inc.Mouse Pad Inventory
Date Units $/Unit Total
Beginning
Inventory 1,000 5.25$ 5,250.00$
Purchases:
Jan. 3 300 5.30 1,590.00 June 20 150 5.60 840.00
Sept. 15 200 5.80 1,160.00
Nov. 29 150 5.90 885.00
Goods
Available
for Sale 1,800 9,725.00$
Ending
Inventory 1,200 ?
Cost of
Goods Sold 600 ?
Slide
8-51

7/30/2019 -WHBM08- Inventory & Cost of Goods Sold
http://slidepdf.com/reader/full/-whbm08-inventory-cost-of-goods-sold 51/64
© The McGraw-Hill Companies, Inc., 2002 McGraw-Hill/Irwin
8 51
Date Beg. Inv. Purchases End. Inv.Cost of
Goods Sold
Nov. 29 150@$5.90 150@$5.90
Units 150
Now, let’s complete the
table.
FIFO – Example
Date Beg. Inv. Purchases End. Inv.Cost of
Goods Sold
1,000@$5.25 600@$5.25
400@$5.25
Jan. 3 300@$5.30 300@$5.30
June 20 150@$5.60 150@$5.60
Sept. 15 200@$5.80 200@$5.80
Nov. 29 150@$5.90 150@$5.90
Units 1,200 600
Now, we have allocatedthe cost to all 1,200 units
in ending inventory.
Date Beg. Inv. Purchases End. Inv.Cost of
Goods Sold
1,000@$5.25 600@$5.25
400@$5.25
Jan. 3 300@$5.30 300@$5.30
June 20 150@$5.60 150@$5.60
Sept. 15 200@$5.80 200@$5.80
Nov. 29 150@$5.90 150@$5.90
Units 1,200 600
Costs $6,575 $3,150
Cost of Goods Available for Sale $9,725
Slide
8-52

7/30/2019 -WHBM08- Inventory & Cost of Goods Sold
http://slidepdf.com/reader/full/-whbm08-inventory-cost-of-goods-sold 52/64
© The McGraw-Hill Companies, Inc., 2002 McGraw-Hill/Irwin
8 52
Completing the tablesummarizes the
computations justmade.
FIFO – Example
Computers, Inc.Mouse Pad Inventory
Date Units $/Unit Total
Beginning
Inventory 1,000 5.25$ 5,250.00$
Purchases:
Jan. 3 300 5.30 1,590.00 June 20 150 5.60 840.00
Sept. 15 200 5.80 1,160.00
Nov. 29 150 5.90 885.00
Goods
Available
for Sale 1,800 9,725.00$
Ending
Inventory 1,200 6,575.00$
Cost of
Goods Sold 600 3,150.00$
Slide
8-53

7/30/2019 -WHBM08- Inventory & Cost of Goods Sold
http://slidepdf.com/reader/full/-whbm08-inventory-cost-of-goods-sold 53/64
© The McGraw-Hill Companies, Inc., 2002 McGraw-Hill/Irwin
Costs of Goods Sold
EndingInventory
RecentCosts
OldestCosts
Last-In, First-Out Method (LIFO)
Slide
8-54
7/30/2019 -WHBM08- Inventory & Cost of Goods Sold
http://slidepdf.com/reader/full/-whbm08-inventory-cost-of-goods-sold 54/64
© The McGraw-Hill Companies, Inc., 2002 McGraw-Hill/Irwin
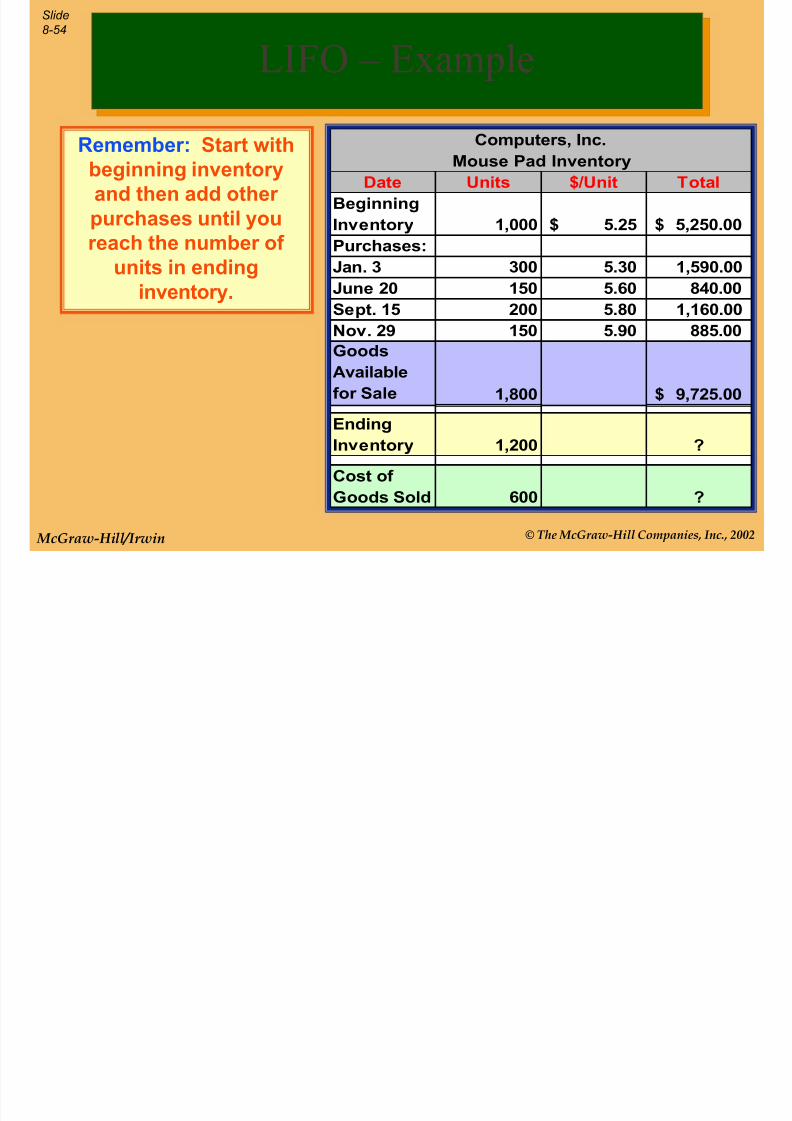
Remember: Start withbeginning inventoryand then add other purchases until youreach the number of
units in endinginventory.
LIFO – Example
Computers, Inc.Mouse Pad Inventory
Date Units $/Unit Total
Beginning
Inventory 1,000 5.25$ 5,250.00$
Purchases:
Jan. 3 300 5.30 1,590.00 June 20 150 5.60 840.00
Sept. 15 200 5.80 1,160.00
Nov. 29 150 5.90 885.00
Goods
Available
for Sale 1,800 9,725.00$
Ending
Inventory 1,200 ?
Cost of
Goods Sold 600 ?
Slide
8-55
7/30/2019 -WHBM08- Inventory & Cost of Goods Sold
http://slidepdf.com/reader/full/-whbm08-inventory-cost-of-goods-sold 55/64
© The McGraw-Hill Companies, Inc., 2002 McGraw-Hill/Irwin
Date Beg. Inv. Purchases End. Inv.Cost of
Goods Sold
1,000@$5.25 1,000@$5.25
Units 1,000
LIFO – Example
Date Beg. Inv. Purchases End. Inv.Cost of
Goods Sold
1,000@$5.25 1,000@$5.25
Jan. 3 300@$5.30 200@$5.30
100@$5.30
Units 1,200 100
Now, we have allocatedthe cost to all 1,200 units
in ending inventory.
Next, let’s
complete thetable.
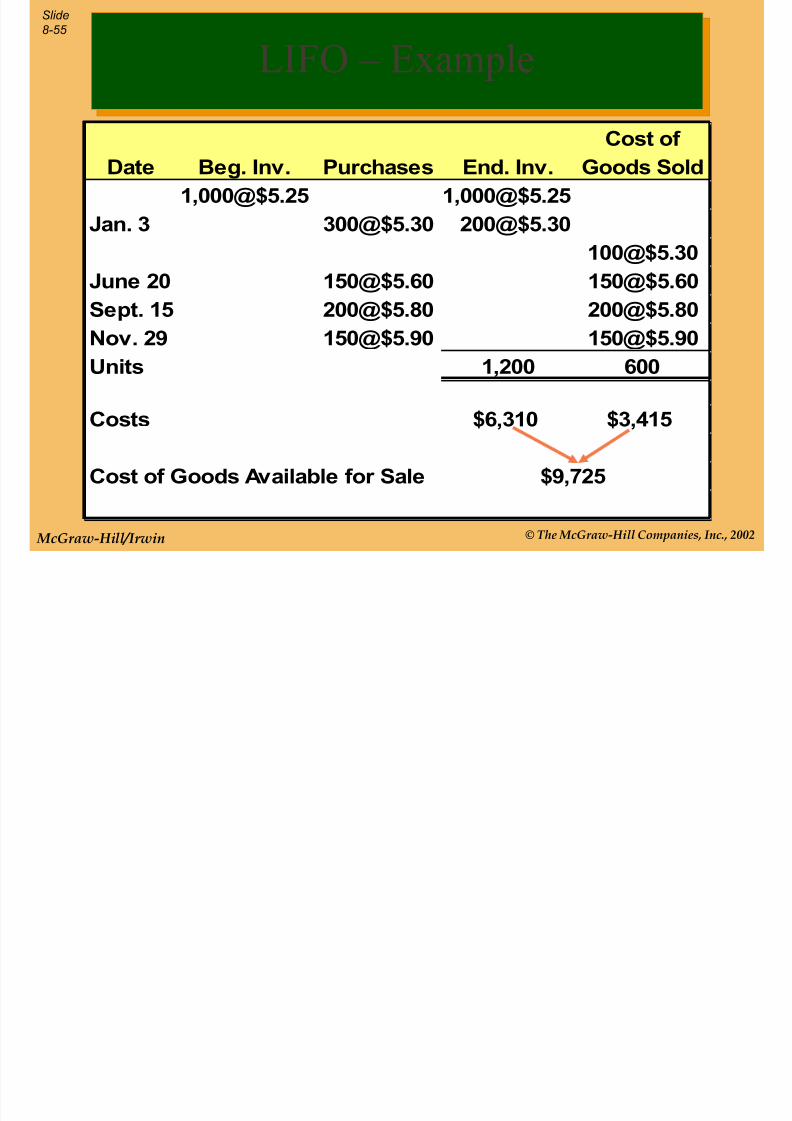
Date Beg. Inv. Purchases End. Inv.Cost of
Goods Sold
1,000@$5.25 1,000@$5.25
Jan. 3 300@$5.30 200@$5.30
100@$5.30
June 20 150@$5.60 150@$5.60
Sept. 15 200@$5.80 200@$5.80
Nov. 29 150@$5.90 150@$5.90
Units 1,200 600
Costs $6,310 $3,415
Cost of Goods Available for Sale $9,725
Slide
8-56
7/30/2019 -WHBM08- Inventory & Cost of Goods Sold
http://slidepdf.com/reader/full/-whbm08-inventory-cost-of-goods-sold 56/64
© The McGraw-Hill Companies, Inc., 2002 McGraw-Hill/Irwin
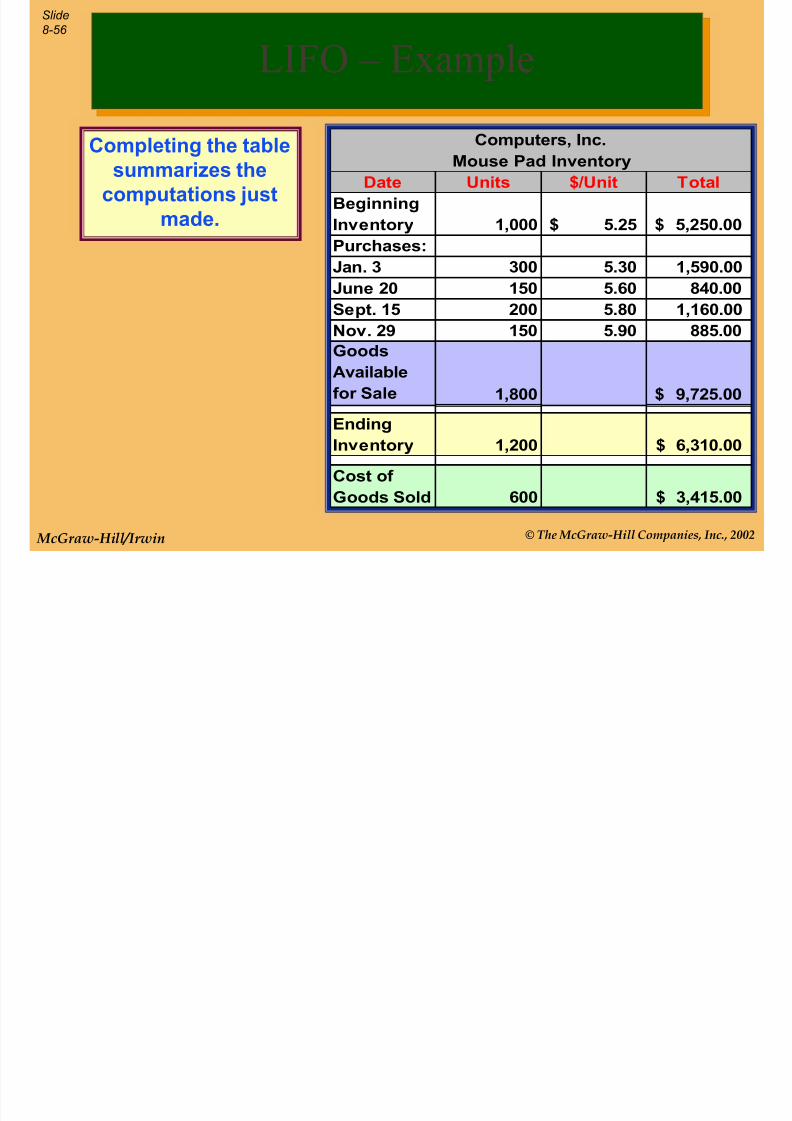
Completing the tablesummarizes the
computations justmade.
LIFO – Example
Computers, Inc.Mouse Pad Inventory
Date Units $/Unit Total
Beginning
Inventory 1,000 5.25$ 5,250.00$
Purchases:
Jan. 3 300 5.30 1,590.00 June 20 150 5.60 840.00
Sept. 15 200 5.80 1,160.00
Nov. 29 150 5.90 885.00
Goods
Available
for Sale 1,800 9,725.00$
Ending
Inventory 1,200 6,310.00$
Cost of
Goods Sold 600 3,415.00$
Slide
8-57
Importance of an Accurate

7/30/2019 -WHBM08- Inventory & Cost of Goods Sold
http://slidepdf.com/reader/full/-whbm08-inventory-cost-of-goods-sold 57/64
© The McGraw-Hill Companies, Inc., 2002 McGraw-Hill/Irwin
Errors in Measuring InventoryBeginning Inventory Ending Inventory
Effect on Income Statement Overstated Understated Overstated Understated
Goods Available for Sale + - 0 0
Cost of Goods Sold+ - - +Gross Profit - + + -
Net Income - + + -
Effect on Balance Sheet
Ending Inventory 0 0 + -
Retained Earnings - + + -
An error in ending inventory in a year will result in thesame error in the beginning inventory of the next year.
Importance of an AccurateValuation of Inventory
Slide
8-58
7/30/2019 -WHBM08- Inventory & Cost of Goods Sold
http://slidepdf.com/reader/full/-whbm08-inventory-cost-of-goods-sold 58/64
© The McGraw-Hill Companies, Inc., 2002 McGraw-Hill/Irwin
Slide
8-59

7/30/2019 -WHBM08- Inventory & Cost of Goods Sold
http://slidepdf.com/reader/full/-whbm08-inventory-cost-of-goods-sold 59/64
© The McGraw-Hill Companies, Inc., 2002 McGraw-Hill/Irwin
Determine cost of goods
available for sale.
Estimate cost of goods sold
by multiplying the net salesby the cost ratio.
Deduct cost of goods sold
from cost of goods available
for sale to determine ending
inventory.
The Gross Profit Method
Slide
8-60
7/30/2019 -WHBM08- Inventory & Cost of Goods Sold
http://slidepdf.com/reader/full/-whbm08-inventory-cost-of-goods-sold 60/64
© The McGraw-Hill Companies, Inc., 2002 McGraw-Hill/Irwin
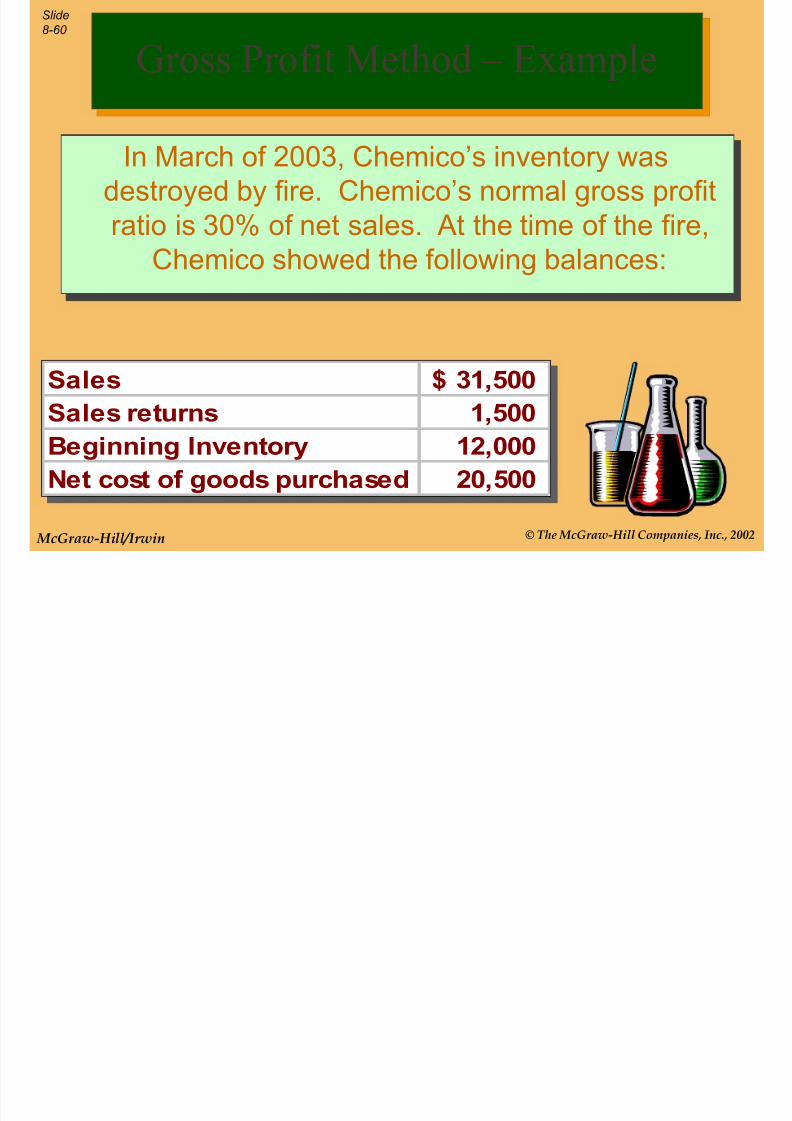
In March of 2003, Chemico’s inventory was
destroyed by fire. Chemico’s normal gross profit
ratio is 30% of net sales. At the time of the fire,
Chemico showed the following balances:
Sales 31,500$
Sales returns 1,500
Beginning Inventory 12,000
Net cost of goods purchased 20,500
Gross Profit Method – Example
Slide
8-61

7/30/2019 -WHBM08- Inventory & Cost of Goods Sold
http://slidepdf.com/reader/full/-whbm08-inventory-cost-of-goods-sold 61/64
© The McGraw-Hill Companies, Inc., 2002 McGraw-Hill/Irwin
Gross Profit Method – Example
Computing Inventory using the Gross Profit Method
Goods Available for Sale:
Beginning Inventory 12,000$
Net cost of goods purchased 20,500 Goods available for sale 32,500$
Less estimated cost of goods sold:
Sales 31,500$
Less sales returns (1,500)
Net sales 30,000$
Estimated cost of goods sold (21,000)
Estimated March inventory loss 11,500$
× 70%
Slide
8-62

7/30/2019 -WHBM08- Inventory & Cost of Goods Sold
http://slidepdf.com/reader/full/-whbm08-inventory-cost-of-goods-sold 62/64
© The McGraw-Hill Companies, Inc., 2002 McGraw-Hill/Irwin
Measures how quickly a companysells its merchandise inventory.
A ratio that is low compared to competitorssuggests inefficient use of assets.
MerchandiseTurnover = Cost of goods sold
Average inventory
Average Inventory = (Beg. Inv. + End. Inv.) ÷ 2
Inventory Turnover Rate
Slide
8-63 Accounting Methods Can Affect

7/30/2019 -WHBM08- Inventory & Cost of Goods Sold
http://slidepdf.com/reader/full/-whbm08-inventory-cost-of-goods-sold 63/64
© The McGraw-Hill Companies, Inc., 2002 McGraw-Hill/Irwin
Remember that identicalcompanies that use differentinventory methods (e.g., FIFO
and LIFO) will have differentinventory turnover ratios.
Accounting Methods Can AffectAnalytical Ratios
Slide
8-64

7/30/2019 -WHBM08- Inventory & Cost of Goods Sold
http://slidepdf.com/reader/full/-whbm08-inventory-cost-of-goods-sold 64/64
Careful! If youdrop the inventory
we will have another write down.
End of Chapter 8
![[PPT]Chapter 6 - Homepage | Wiley · Web viewPerpetual vs. Periodic Inventory Accounting Perpetual Updates inventory and cost of goods sold after every purchase and sales transaction](https://static.fdocuments.us/doc/165x107/5b35ba0b7f8b9a330e8d7727/pptchapter-6-homepage-wiley-web-viewperpetual-vs-periodic-inventory-accounting.jpg)