· Web viewCreate a Word (or equivalent) file that documents your completion of this project...
38
Project 2 – AWS Port Scanning and Packet Capture Create a Word (or equivalent) file that documents your completion of this project with the question and your answer. Where you see red text, make sure you take a screenshot and/or answer the question to document your progress. Feel free to add text or comments to your submission if you feel it needs clarity. Make sure the document is professional, clear, and self-explanatory. You can use the built-in screenshot tool within OSX/Windows or add software that gives you the ability to use arrows, boxes, etc. for more clarity. If I cannot read your answers due to size, quality, pixilation, or lack of explanation of what I’m looking at, I’ll assume it’s wrong. Commands are illustrated with a $ symbol indicating that they are run as a non-privileged user. Brackets “[“ and “]” are used as a placeholder and require you to enter unique information relevant to individual students. If you get stuck and need help, try using the man command to pull up the manual for a tool in question (E.g. $ man cat). If you’re still stuck, use Google. Note, the tasks towards the end are weighted heavier than the tasks in the beginning of the project. E.g. missing the last answer will bring your score down MORE than 7.14%. The tasks designed in this document are meant little to no cost. Some of the tasks may incur a charge depending on use and length of time before removing services. AWS provides a free tier and student credit, however it’s your responsibility to manage your own AWS account. It is recommended to setup a billing alarm to notify you of charges when estimated usage goes above a threshold.
Transcript of · Web viewCreate a Word (or equivalent) file that documents your completion of this project...

Project 2 – AWS Port Scanning and Packet CaptureCreate a Word (or equivalent) file that documents your completion of this project with the question and your answer. Where you see red text, make sure you take a screenshot and/or answer the question to document your progress. Feel free to add text or comments to your submission if you feel it needs clarity. Make sure the document is professional, clear, and self-explanatory. You can use the built-in screenshot tool within OSX/Windows or add software that gives you the ability to use arrows, boxes, etc. for more clarity. If I cannot read your answers due to size, quality, pixilation, or lack of explanation of what I’m looking at, I’ll assume it’s wrong.
Commands are illustrated with a $ symbol indicating that they are run as a non-privileged user.
Brackets “[“ and “]” are used as a placeholder and require you to enter unique information relevant to individual students.
If you get stuck and need help, try using the man command to pull up the manual for a tool in question (E.g. $ man cat). If you’re still stuck, use Google.
Note, the tasks towards the end are weighted heavier than the tasks in the beginning of the project. E.g. missing the last answer will bring your score down MORE than 7.14%.
The tasks designed in this document are meant little to no cost. Some of the tasks may incur a charge depending on use and length of time before removing services. AWS provides a free tier and student credit, however it’s your responsibility to manage your own AWS account. It is recommended to setup a billing alarm to notify you of charges when estimated usage goes above a threshold.

InstructionsLog into your AWS account at: console.aws.amazon.com
Go to the Oregon Region (us-west-2)
First, setup AWS CloudTrail to monitor the AWS account for changes. CloudTrail is essentially syslog for AWS. This will help keep track of who did what and when for change management, digital forensics and incident response. Without proper logging, we have little evidence in the event of an incident.
NOTE: CloudTrail should be enabled across all regions in case someone accesses a region you are not using.
Go to Services > CloudTrail
Click on “Trails” in the left navbar, then the “Create Trail” button.

Create a Trail Name: CSUN-[first_name]Apply trail to all regionsManagement events = allS3 > Select all S3 buckets in your account for Read/Write data eventsCreate a new S3 bucket to store events (CSUN-[first_name]-CloudTrail-Logs)
NOTE: S3 buckets have strict naming requirements. The example provided will not work. Look at the AWS documentation and fix the issues with the suggested S3 bucket name: https://docs.aws.amazon.com/awscloudtrail/latest/userguide/cloudtrail-s3-bucket-naming-requirements.html?icmpid=docs_cloudtrail_console
1. What was the issue with the suggested naming convention? _________________________

2. Take a screenshot showing your CloudTrail Trails and associated S3 bucket where logs will be sent using a valid bucket name.
Go to Services > S3
Look for your newly created S3 Bucket.
Double Click on the bucket and browse around.
Dig into the structure of the S3 log bucket and us-west-2 Oregon region:

After a few clicks into the directory structure, you can see it’s organized by:
Bucket Name / AWSLogs / Account# / CloudTrail / Region / YYYY / MM / DD / Log File
For a later step, take note of your S3 Bucket Name ___________ and Account# ____________________
The log files have the following naming convention:
Account#_CloudTrail_Region_YYYYMMDD[followed by what seems to be random characters].json.gz
Thus, it doesn’t look like it will be easy to parse through large timeframes of data looking for what we want. E.g. if we want to look at the past month of logs for who deleted our Lightsail instance, it may take a lot of digging with inefficient efforts. Commercial log management/SIEM tools (e.g. Splunk or SumoLogic) generally have log shippers and parsers to help deal with the normalization of log file such as ClouTrrail.

Looking at the .jason.gz file closer, it also seems like the file has server-side encryption of AES-256 applied to it. If we download the file and look at the structure of the .json file, we’ll see the following structure:
{ "Records": [{ "eventVersion": "1.01", "userIdentity": { "type": "IAMUser", "principalId": "AIDAJDPLRKLG7UEXAMPLE", "arn": "arn:aws:iam::123456789012:user/Alice", "accountId": "123456789012", "accessKeyId": "AKIAIOSFODNN7EXAMPLE", "userName": "Alice", "sessionContext": { "attributes": { "mfaAuthenticated": "false", "creationDate": "2014-03-18T14:29:23Z" } } }, "eventTime": "2014-03-18T14:30:07Z", "eventSource": "cloudtrail.amazonaws.com", "eventName": "StartLogging", "awsRegion": "us-west-2", "sourceIPAddress": "72.21.198.64", "userAgent": "signin.amazonaws.com", "requestParameters": { "name": "Default" }, "responseElements": null, "requestID": "cdc73f9d-aea9-11e3-9d5a-835b769c0d9c", "eventID": "3074414d-c626-42aa-984b-68ff152d6ab7" }, ... additional entries ... ]
One of the easiest ways to find data from the CloudTrail logs without shipping the logs to a Log Management system (e.g. Splunk) or spending $30,000 is to use AWS Athena to setup a database table that can query records from the S3 bucket. AWS Athena costs a couple fractions of a penny for the average query, so unless you’re running frequent long queries, it won’t break the bank. Athena pricing: https://aws.amazon.com/athena/pricing/
Go to Services > Athena

Create a new query that will make a table for us to parse. Copy and paste the following code. You’ll need to make one change at the bottom (in this example: Line 50) to include your unique S3 bucket name and account# (aka ARN) that was documented earlier:
CREATE EXTERNAL TABLE cloudtrail_logs ( eventversion STRING, userIdentity STRUCT< type:STRING, principalid:STRING, arn:STRING, accountid:STRING, invokedby:STRING, accesskeyid:STRING, userName:String, sessioncontext:STRUCT<attributes:STRUCT< mfaauthenticated:STRING, creationdate:STRING>,sessionIssuer:STRUCT<

type:STRING, principalId:STRING, arn:STRING, accountId:STRING, userName:STRING>>>, eventTime STRING, eventSource STRING, eventName STRING, awsRegion STRING, sourceIpAddress STRING, userAgent STRING, errorCode STRING, errorMessage STRING, requestId STRING, eventId STRING, resources ARRAY<STRUCT< ARN:STRING, accountId:STRING, type:STRING>>, eventType STRING, apiVersion STRING, readOnly BOOLEAN, recipientAccountId STRING, sharedEventID STRING, vpcEndpointId STRING) ROW FORMAT SERDE 'com.amazon.emr.hive.serde.CloudTrailSerde' STORED AS INPUTFORMAT'com.amazon.emr.cloudtrail.CloudTrailInputFormat' OUTPUTFORMAT'org.apache.hadoop.hive.ql.io.HiveIgnoreKeyTextOutputFormat' LOCATION 's3://[bucket-name]/AWSLogs/[account#]'

When done with your slight modifications, press the “Run Query” button to create the database table:
After running the CREATE query, you’ll see a new table on the left side of the page. You can run a simple query such as SELECT * FROM cloudtrail_logs limit 10; to see the 10 most recent events with all columns (* is used for a wildcard):

It worked, but we can run other cleaner custom SQL queries to show columns for usernames, the source IP address, and time of login for tracking user activity in our AWS account. Expanding the cloudtrail_logs table on the left will show all the columns available to us. We’ll use the useridentity’s username, sourceipaddress, and eventtime columns FROM the cloudtrail_logs table to get the information we want:
SELECT useridentity.username, sourceipaddress, eventtimeFROM cloudtrail_logs

3. Take a screenshot showing your user’s logins, source IPs (blur out IP if you’d like for privacy), and time/date for each event as illustrated above.
It may be useful to get more information about what the users are doing when they login and navigate the AWS environment. Run the query again, but this time add a column to your query showing the name of the event. You may need to look at the columns in the cloudtrail_logs table to find the right field to add to your query. Experiment with adding columns to see what would be valuable to you.
4. Take a screenshot showing the results of the query with the username, source IP address, time of the event, and the name of the event. Include a screenshot or copy/paste the code used in the query. The result of your query should look like the image below:

NOTE: While it’s always recommended to keep CloudTrail on for security best practices, the Athena table and CloudTrail Trails can be deleted now as they won’t be needed for this rest of the lab. At the end of this document, there’s a clean-up section detailing how to remove services added in prior tasks.
Setup two (2) Lightsail instances mimicking two (2) public facing servers. One (1) will be a simulated attacker and the other will be a simulated web server for legitimate company.
Click on Services > Lightsail
Create a new instance.

Select:
Linux/Unix OS OS Only Ubuntu 16.04 LTS

5. Create two (2) instancesa. Name your instance CSUN-[your-first-name]-attacker and take a
screenshot to add to your documentation. b. Name your instance CSUN-[your-first-name]-victim and take a screenshot
to add to your documentation.
You may have to wait up to 60 seconds for the instance to be provisioned.
Click the console icon on your newly created instance to launch a SSH console over web browser.

You’ll notice your username is ubuntu and your hostname is ip-[private-ip-given-by-aws].
Change your hostname to csun-[your-first-name]-attacker and csun-[your-first-name]-victim
$ sudo hostname csun-[your-first-name]-attacker
$ sudo hostname csun-[your-first-name]-victim
Close the browser console window and re-open it to see the changes.
6. Take a screenshot showing the new hostname.
Update the repository by issuing:
$ sudo apt-get update -y
Update the packages by typing:
$ sudo apt-get upgrade -y

If you get a prompt like this, select: keep the local version currently installed
Document your instance’s public & private IP address
Public IP:
7. Highlight the public IP address and take a screenshot.
Private IP:
$ ifconfig
8. Highlight the private IP address and take a screenshot.

9. You should have the documented systems’ names and their respective IP addresses to avoid confusion going forward. Add the following to your documentation:
Your Lab Setup:
csun-[your-first-name]-attacker
- Public IP: x.x.x.x- Private IP: x.x.x.x
csun-[your-first-name]-victim
- Public IP: x.x.x.x- Private IP: x.x.x.x
For illustration, Instructor Lab Setup:
csun-mike-attacker
- Public IP: 54.212.125.37- Private IP: 172.26.15.102
csun-mike-victim
- Public IP: 54.191.162.116- Private IP: 172.26.12.58

You could “live off the land” and write your own port scanner in bash or Python, however as you can see by the bash example below, it’s a lot of work and has limited in functionality:
$ sudo echo >/dev/tcp/54.191.162.116/80 >/dev/null 2>&1 && echo "80 open"
Let’s take the more efficient route and Install an open source port scanning tool called NMAP on the ATTACKER instance:
$ sudo apt-get install nmap -y
TCPDump is a packet sniffer and is already installed on the newest version of Ubuntu 16.04, thus we do not need to install it via apt-get package manager.
It’s critical to understand and verify what your tools are doing before using them in a production environment. Sometimes attackers put Trojans inside free tools and often commercial tools market a feature that may not work the way it was advertised. From the attacker instance, run a NMAP scan against TCP port 80 and 443 on the victim instance while running TCPDump.
$ sudo tcpdump &-s0 -i eth0 -w csun-mike.pcap &
TCPDump Options Used:
-s = Set the snap-length to unlimited (0) to capture all the data.-i = capture traffic on a specified interface.-w = write the sniffed data to a file.& = Put the job in the background. Without this, we’d need to use TCPDump or NMAP, but couldn’t use both at the same time.
Type the following to see the jobs running in the background:
$ jobs
Now, run a full TCP connect scan against the victim’s public IP address:
$ sudo nmap -sT -p80,443 [victim public IP]
Options Used:-sT = Defines the scan type as a “Full TCP Connect Scan”.-p = Sets the port number(s). By default, NMAP will scan the top 1,000 most common ports.
Note: the host appears to be offline, but it could just have a firewall blocking ICMP.

10. Take a screenshot showing the NMAP scan of your victim instance that appears to be offline.
Let’s look at the results using the TCPDump .pcap file we created. Remember, the TCPDump tool is still running in the background. Use the fg command to bring the job to the foreground.
$ fg
Now you will have the TCPDump job in the foreground and can press CTRL+C on your keyboard to stop the capture. In my illustration lab, we received 634 packets in the csun-mike.pcap file. You will probably have a different number depending on how long the capture runs for. It’s interesting to see how many packets are captured when little is happening on the two (2) systems. As a bonus, can you determine why you capture so many packets? What’s the largest percentage of packets received?
Read the .pcap file by using TCPDump and a display filter for packets to/from the target host:
$ tcpdump -r [filename.pcap] host [target public IP address]
Options Used:-r = Read a .pcap file.
11. Take a screenshot showing the ICMP Echo Request from your attacker system to the victim system.
Run NMAP again using the -Pn switch to disable ICMP checking along with TCPdump to capture the scan traffic. This time, instead of capturing all traffic and filtering it down when reviewing the file, set a capture filter to only capture traffic to/from the victim’s public IP address.
$ sudo tcpdump -s0 -I eth0 -r csun-[first_name]2.pcap host [victim public IP]
$ sudo nmap -sT -Pn -p 80,443 [victim public IP]
Options Used:-sT = Defines the scan type as “Full TCP Connect Scan” (SYN > SYN-ACK > ACK).-Pn = ICMP is disabled on the instance’s firewall. NMAP will first PING the target, if it doesn’t get an

ICMP Echo Reply, it makes an assumption that the host is probably offline. -Pn will tell NMAP to scan the ports even if it doesn’t get an ICMP Echo Reply from the target. -p = defines ports 80 and 443, separated by a comma.
A full TCP Connect Scan will illustrate the following behavior if a port is open:
A full TCP Connect Scan will illustrate the following behavior if a port is closed:
There are certain indications that a port may be filtered by a firewall. If NMAP believes the responses look like they are from a firewall and not the end system or no response is received, it will display the port status as FILTERED.

Open the second .pcap file in TCPDump to see the packets to/from the ATTACKER instance.
$ tcpdump -r csun-[first_name]2.pcap
Notice that there are no ICMP packets sent/received this time due to the -Pn option in NMAP. Also, a SYN packet was sent to the VICTIM instance using HTTP and HTTPS. If we wanted to see the port number instead of protocol, we could have used the -nn option in TCPDump for numeric IP hosts and numeric port numbers instead of DNS hostname and protocol name. The victim responded only once to the ATTACKER with a [R.] flag, which stands for RESET-ACK.
12. Which port did the VICTIM respond on? _________________13. Which port did the VICTIM not respond on? ______________
ON THE VICTIM INSTANCE:
Make sure your VICTIM instance is updated with an apt-get update and apt-get upgrade command like what was done on the ATTACKER instance.
Install Apache webserver with the following command:
$ sudo apt-get apache2 -y
Check the status of the server:
$ service apache2 status
We can see the service is running after being installed based on the “active (running)” notation.
14. Use the CURL client command to loopback and visit the web page being hosted by the VICTIM instance from the victim instance. Take a screenshot show that it works.

$ curl 127.0.0.1
Look at the /var/log/apache2/access.log file with your choice of tail, less, more, or cat. You should see the HTTP GET request from the CURL tool in your logs.
15. Take a screenshot showing the GET request in your log file showing CURL was used.
ON THE ATACKER INSTANCE:
Run the NMAP scan again to see if the results have changed.
16. Which port is now open? ______________
ON THE VICTIM INSTANCE:
Look at the /var/log/apache2/access.log file with your choice of tail, less, more, or cat.
17. Do you see an entry from the NMAP scan in your logs? _______________
Look in the /usr/share/nmap/scripts directory http scripts to be used in NMAP. Use the * as a wildcard:
$ ls /usr/share/nmap/scripts/http*
Filter the results further by piping the results to grep and searching for “title”

Run NMAP again using the --script= option to include the http-title.nse script.
18. Take a screenshot showing the http-title script and the title of the default website in Apache as shown in the results above.
ON THE VICTIM INSTANCE:
Look at the /var/log/apache2/access.log file with your choice of tail, less, more, or cat. You should see the HTTP GET request from NMAP.
19. Take a screenshot showing the new user-agent performing a GET request of your website as show in the results above.
Concerned that someone from the ATTACKER’s public IP address is port scanning your VICTIM’s web server, the decision has been made to block some of the scans targeting the VICTIM instance using iptables host firewall.
Looking at the default iptables policies, you can see the three firewall chains have an ACCEP all policy:
Since we are concerned about an external host sending malicious traffic IN, we will add a rule to the INPUT policy. If we wanted to block the VICTIM host from reaching OUT to a malicious IP, we could add a rule to the OUTPUT chain.
Add a rule to the INPUT chain that drops any packets from the public IP address of the ATTACKER trying to connect to TCP port 80 of the VICTIM instance.

$ iptables -A INPUT -p tcp -s [ATTACKER public IP address] –destination-port 80 -j DROP
Options Used:-A = append to the end of a chain-p = protocol-s = source IP address--destination-port = sets the destination port-j = defines what to happen if a packet matches the rule
ON THE ATTACKER INSTANCE:
Scan the VICTIM machine again using NMAP on TCP port 80 and 443 using the -Pn and -sT switches.
Being blocked on port 80 and future web attacks, the ATTACKER decides to further the scanning looking at the top 250 ports using --top-ports=250 option.
The ATTACKER wants to know more about the new service found (SSH). Look for the switch/option to determine the service/version info of the SSH port in the NMAP manual or help page.
20. Take a screenshot of the command used and version results for SSH in the scan results similar to the output below.

ON THE VICTIM INSTANCE:
View the /var/log/syslog file to see if you can detect the port scan on port 22.
21. Were you able to detect the port scan in the syslogs? _____________________
Add an iptables rule to the INPUT chain for the TCP protocol 22 from the source IP address of the ATTACKER’s public IP and set the action of the rule to LOG.
-A = ?__________-p = ?__________-s = ?__________-j = ?__________
22. Take a screenshot showing the INPUT chain’s rules. It should look like this:
Keep a real-time view of the /var/log/syslog file open on the VICTIM instance:
$ tail -f /var/log/syslog
ON THE ATTACKER INSTANCE:
Run a NMAP scan against the VICTIM again.
ON THE VICTIM INSTANCE:
23. Take a screenshot showing the TCP Connect Scan from the ATTACKER instance against the VICTIM instance on port 22. Use the grep tool to only show the real-time view of syslog that involve SSH. See sample output below.

There were reports that the ATTACKER was coming from the same public IP address used by other valid users and they can no longer get to your website.
Install the whois tool from the apt-get package manager.
Then run a whois query against arin.net to check ownership of the public IP address.
$ whois -h whois.arin.net [public ip of attacker]

24. Take a screenshot showing the OrgName of your public IP address and who owns it.
Since the IP address is owned by a trusted source and denying service to valid users, remove the iptables firewall rule used to block the ATTACKER and valid users from getting to the website.
Looking at the iptables CHAINS, we can see in this lab setup, rule 1 of the INPUT chain is blocking http traffic from the ATTACKER’s public IP address.
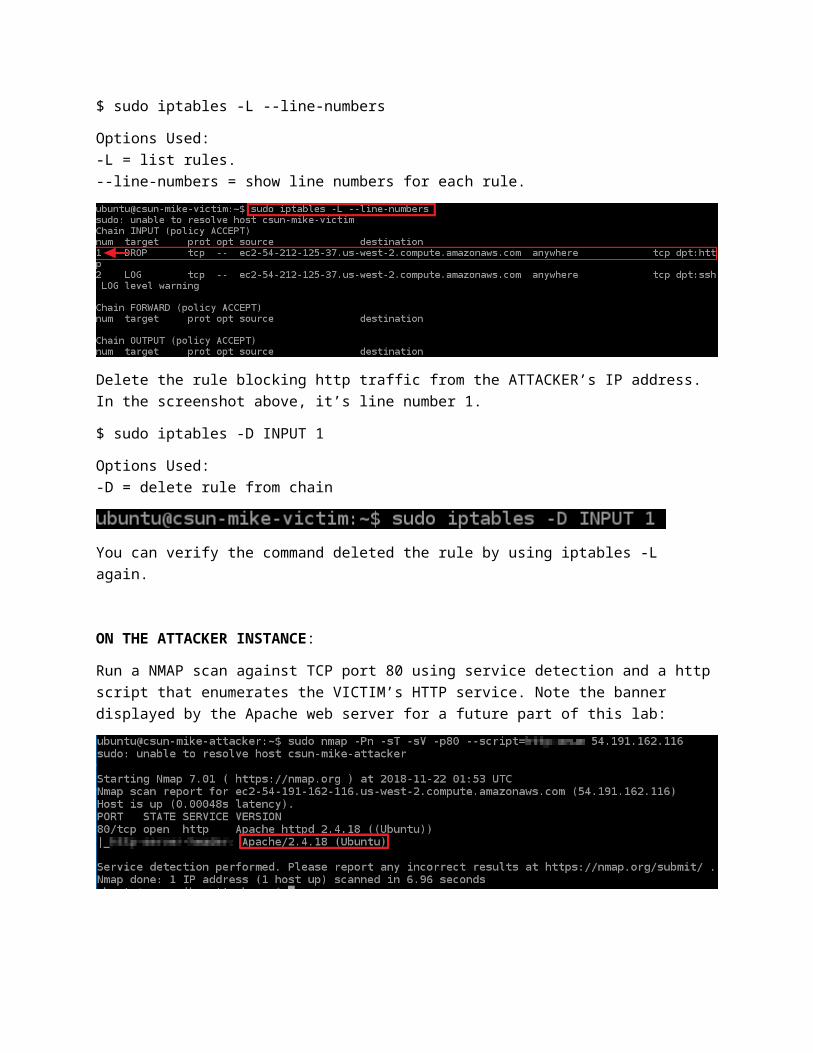
$ sudo iptables -L --line-numbers

Options Used:-L = list rules. --line-numbers = show line numbers for each rule.
Delete the rule blocking http traffic from the ATTACKER’s IP address. In the screenshot above, it’s line number 1.
$ sudo iptables -D INPUT 1
Options Used:-D = delete rule from chain
You can verify the command deleted the rule by using iptables -L again.
ON THE ATTACKER INSTANCE:
Run a NMAP scan against TCP port 80 using service detection and a http script that enumerates the VICTIM’s HTTP service. Note the banner displayed by the Apache web server for a future part of this lab:
25. Take a screenshot showing the script used and the results showing the version of Apache running as illustrated in the screenshot above.
It’s a dead giveaway to the ATTACKER showing the type and version of web server listening on port 80.
Open a web browser and search for the version of Apache and the word “exploit”. See if there are any publicly known vulnerabilities and/or exploits.

ON THE VICTIM INSTANCE:
Disguise the Apache banner so that the ATTACKER doesn’t have the web server type and version number that can be used for exploit development.
Install the Apache mod_security module:
$ sudo apt-get install libapache2-mod-security2 -y
Open the Apache configuration file:
$ sudo nano /etc/apache2/apache2.conf
Add the following lines to the bottom of the apache2.conf configuration file:
ServerTokens FullSecServerSignature “Microsoft IIS 7.0 – [first_name]”
Restart the Apache web server:
$ sudo service apache2 restart

Because the hostname isn’t valid for a website, you may get errors starting the Apache web server. You may have to add an entry (127.0.0.1 csun-[first_name]-victim) to the /etc/hostname file AND/OR reboot the VICTIM instance to get Apache2 to start properly. Check the status of Apache2 by typing:
$ service apache2 status
$ sudo service apache2 restart
$ service apache2 status
Reboot the VICTIM instance if Apache fails to start.
ON THE ATTACKER INSTANCE:
26. Either use Telnet against the VICTIM’s public IP address on TCP port 80 to perform a banner grab or use NMAP with the version detection option. Take a screenshot showing the command used and the changed banner containing your name.
Telnet clients can also be used by attackers to perform banner grabbing by having the client connect to a different port number (TCP port 23 is used by default).
$ telnet [public ip address of VICTIM] 80


Clean-Up Tasks:
- Delete Lightsail instances (2)- Delete CloudTrail Trails (1)- Delete S3 Buckets (1)- Delete the cloudtrail_logs table in Athena (1)
Delete the Lightsail instance(s):
Services > Lightsail
Click the dots on the top right of the Lightsail instance to see the dropdown menu and click “Delete”
Delete CloudTrail Tails:
Services > CloutTrail > Trails > CSUN-[first_name]
Logging (toggle off) of click the trashcan:
Delete S3 Bucket:
Services > S3
Click the checkbox to the left of the S3 bucket used for your CloudTrail logs.
Press the Delete button at the top.
You’ll need to type the name of the S3 bucket as a failsafe confirmation you really want to delete the bucket.
Delete the Athena table(s):
Services > Athena
Click the three dots next to the table name cloudtrail_logs.
Select Delete table