Sales Compensation Practices in Tech ...
25
www.wilsongroup.com Sales Compensation Practices in Tech Companies – Survey Report December 2019 Susan Malanowski
Transcript of Sales Compensation Practices in Tech ...

www.wilsongroup.com
Sales Compensation Practices in Tech Companies – Survey Report
December 2019Susan Malanowski

Table of Contents
2
Contents Page
Executive Summary 3Survey Results 5

Executive Summary
3
Thirteen technology companies participated in this report of sales compensation practices in tech companies. § Most of the organizations are privately held§ Headquarter locations consisted of 6 in Massachusetts, 4 Washington, 1 Rhode Island and 1 outside
of the US§ Most companies are in the $50M to $200M revenue range
The data was submitted in October 2019 and results published December 2019
Responses were gathered to 25 questions via Survey Monkey. A summary of the topics examined are as follows:
§ Change in Revenue/Headcount – approximately 60% are expecting that their revenue will increase between 4% and 20%, and 46% are increasing the number of salespeople in the salesforce
§ Salary/Merit Increases – 69% indicate that merit budgets are between 2.5% and 3.5%; increases are made through changes to On-Target Earnings (31%) or adjustments to Base Salary (8%)
§ Sales Quota Methodology – adjusted value is the most prevalent quota methodology which uses an historic allocation modified by market opportunity, competition and related factors
§ Sales Quota Effectiveness – most (64%) indicate that the degree of their quota effectiveness is average
§ Percent of Salesforce Achieving/Exceeding Quota – half (50%) indicate that 30% to 50% of their sales forces achieved or exceeded results
§ Gross-ups or Add-ons to Individual Sales Quotas – 36% indicated that they increased sales quotas by 6% to 10% above their company budgeted amounts before assigning to individual sellers
§ Sales Crediting – there is minimal sharing of sales credits and 50% or more of respondents allowed for sales crediting to exceed 100%, with some defined conditions

Executive Summary
4
Summary of Topics Examined (continued from page 3):§ Effectiveness of Sales Incentive Design –
• 45% feel their sales compensation plans motivate their sellers to some extent; • 83% feel their most productive sellers are earning the most to a moderate extent; • 18% feel the plans are motivating to a great extent; and• 17% feel their plan effectiveness is above average, while no one indicates their plans are far
above average)§ Effectiveness of Sales Communications – 67% percent feel their company’s salesforce understands
their plans to a great extent § Changes to Plan Design - 73% plan to make minimal or no changes to their plans. At the end of this
survey report is a list of what respondents indicate has caused the planned changes.
Overall, there were many responses indicating a positive impact from the current plan design. Wilson Group works with companies to identify areas for higher levels of positive impact from the plans. We bring you the latest thinking and insights on what makes sales compensation plans work, facilitate resolution of key issues impacting plan success, when best to apply certain elements and features, and how to manage these programs so they create their intended value. Collaborating with our clients, we blend our expertise with the people who know the company in development of customized sales compensation plans. Our services include:
§ Market compensation assessment to ensure competitiveness § Sales plan performance analysis § Plan design and financial modeling § Sales recognition program design, such as SPIFFS and President Club § Implementation and communication including sales plan documents, illustrations and tools

Survey ResultsParticipant Profile
5
>3,000 1,000 to3,000
500 -1,000 200- 500 100- 200 <100
Responses 25% 8% 17% 25% 8% 17%
0%
5%
10%
15%
20%
25%
30%
What is the total number of employees (global) that work for your organization
(full-time equivalents)? n=12
Responses
§ Based on company headcount, responses are from a variety of company sizes from very small to large. The most prevalent is 200 to 1,000 employees (42% combined).

Survey ResultsParticipant Profile
6
>$1B $500M - $1B $200M -$500M
$50M -$200M
$10M -$50M <$10M
Responses 23% 8% 8% 46% 0% 15%
0%5%
10%15%20%25%30%35%40%45%50%
What was your organization's total annual revenue last fiscal year? n = 13
§ Most of the responding organizations are in the revenue ranges of $50M to $200M and greater than $1B.

Survey ResultsParticipant Profile
7
>500 200- 500 100- 200 50 - 100 25 - 50 <25Responses 23% 8% 8% 23% 15% 23%
0%
5%
10%
15%
20%
25%
What is the total number of sales employees (global, sales incentive
eligible) that work for your organization (full-time equivalents)? n=13
§ Companies with a salesforce greater than 500 employees, between 50 and 100 employees and less than 25 employees were the top three most prevalent responders.

Survey ResultsChange in Revenue/Headcount
8
Greaterthan20%
12% to20%
8% to11%
4% to7%
0% to3%
-3% to0%
-7% to -4%
-12% to-8%
Lessthan -12%
Responses 0% 31% 23% 8% 23% 8% 8% 0% 0%
0%
5%
10%
15%
20%
25%
30%
35%
What is your expected change in revenue for this fiscal year? n= 13
§ Approximately 60% of respondents are expecting that their revenue will increase between 4% to 20%, while 40% expect either flat revenue results or decreases in revenue of up to -7%.

Survey ResultsSalesforce Headcount Change
9
Increase in the salesforceheadcount
No change in salesforceheadcount
Decrease in the salesforce headcount
Responses 46% 31% 23%
0%5%
10%15%20%25%30%35%40%45%50%
What has been the net change in salesforce headcount this fiscal year? n=13
§ To meet growth expectations, 46% are increasing the number of people in the salesforce, 31% of companies are maintaining the same headcount and 23% are decreasing their salesforce.

Survey ResultsSalary/Merit Increases
10
None Less than2%
Between2% and
2.5%
Between2.5% and
3.0%
Between3.0% and
3.5%>3.5%
Responses 23% 0% 15% 38% 31% 0%
0%10%20%30%40%50%
What is your organization's salary/merit increase budget for your US sales force?
n=13
§ Most responses (69%) indicate merit budgets are between 2.5% and 3.5%. Several are budgeting between 2% and 2.5%, with merit the same for sellers as all other employees.
§ Historically regular increases have not been as prevalent for the salesforce, and 23% of the responses continue to follow this practice.
§ In our experience, most merit increases are based on individual sales performance usually for factors not included in the incentive plan. These factors include getting sales reports in on time, providing data on current activities and accounts, participating in sales initiatives and promotions and doing the prospecting, qualifying and account management that do not always directly lead to sales.
Survey ResultsSalary Increases Due to Pay Equity
11
Adjustments to basesalary only
Adjustments to on-target earnings (total
target cashcompensation)
No changes oradjustments Not Applicable Other (please specify)
Series1 8% 31% 54% 15% 0%
0%10%20%30%40%50%60%
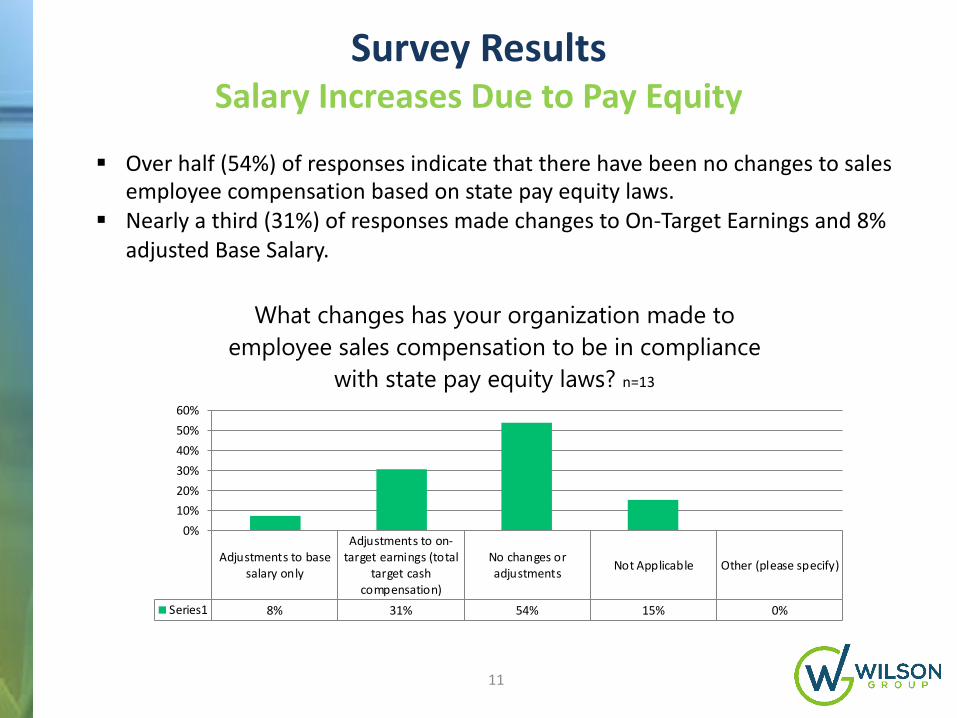
What changes has your organization made to employee sales compensation to be in compliance
with state pay equity laws? n=13
§ Over half (54%) of responses indicate that there have been no changes to sales employee compensation based on state pay equity laws.
§ Nearly a third (31%) of responses made changes to On-Target Earnings and 8% adjusted Base Salary.

Survey ResultsSales Quota Methodology/Effectiveness
12
Other: For Sales Account Executives and Sales Engineers, quotas are based on a factor times their salary. The factor is based on the comp plan and/or the salary.
Bottom-up/Top-down
Method(Understand
account…
AccountPlanning (Based
on accountopportunitythat is within…
HistoricAllocation
(Growth targetabove last
year's…
Adjusted Value(Historic
allocationmodified by
market…
Fixed Allocation(All reps carry
the samequota)
Other (pleasespecify)
Responses 25% 8% 17% 33% 25% 8%
0%5%
10%15%20%25%30%35%
What methodology does your organization use when setting sales quotas? (Check all that apply)
n=12
§ There are a wide variety of methods used to set sales quotas. The most prevalent is adjusted value which uses an historic allocation modified by market opportunity, competition and related factors.
§ The bottom up/top down method blends company expectations and the seller’s assessment of opportunity within accounts or a territory.

Survey ResultsSales Quota Methodology/Effectiveness
13
Far aboveaverage Above average Average Below average Far below
averageResponses 0% 18% 64% 18% 0%
0%
10%
20%
30%
40%
50%
60%
70%
How would you rate the effectiveness of your organization’s quota setting
process? n=11
§ Trust and the belief in how reasonable quotas are to achieve both significantly impact actual results. Sales quotas should be both challenging and achievable.
§ Most responded that effectiveness is average, with equal amounts above and below average.

Survey ResultsSalesforce Achieving/Exceeding Quota
14
Lessthan10%
10%to
15%
15%to
20%
20%to
25%
25%to
30%
30%to
35%
35%to
40%
30%to
40%
40%to
45%
45%to
50%
50%to
55%
55%to
60%
60%to
65%
65%to
70%
70%to
75%
>80%
Responses 0% 10% 10% 0% 0% 10% 0% 10% 10% 20% 0% 0% 10% 0% 10% 10%
0%5%
10%15%20%25%
What percent of your organization's salesforce achieved or exceeded quota in the
last fiscal year? n=10
§ A key indicator of whether quota is set right or not is the distribution of performance across various quota achievement levels. In general, the average number of sellers achieving quota is approximately 60%. This is generally a good standard for setting expectations.
§ Less than a third (30%) of respondents have 60% or better achievement levels § Half (50%) indicate that 30% to 50% of their sales forces achieved or exceeded results§ While 20% indicate that only 10% to 20% of their sales forces achieve or exceed quota§ This question had the lowest number of responses, which could imply this data is not well
known in all companies.
Survey ResultsGross-up to Individual Sales Quotas
15
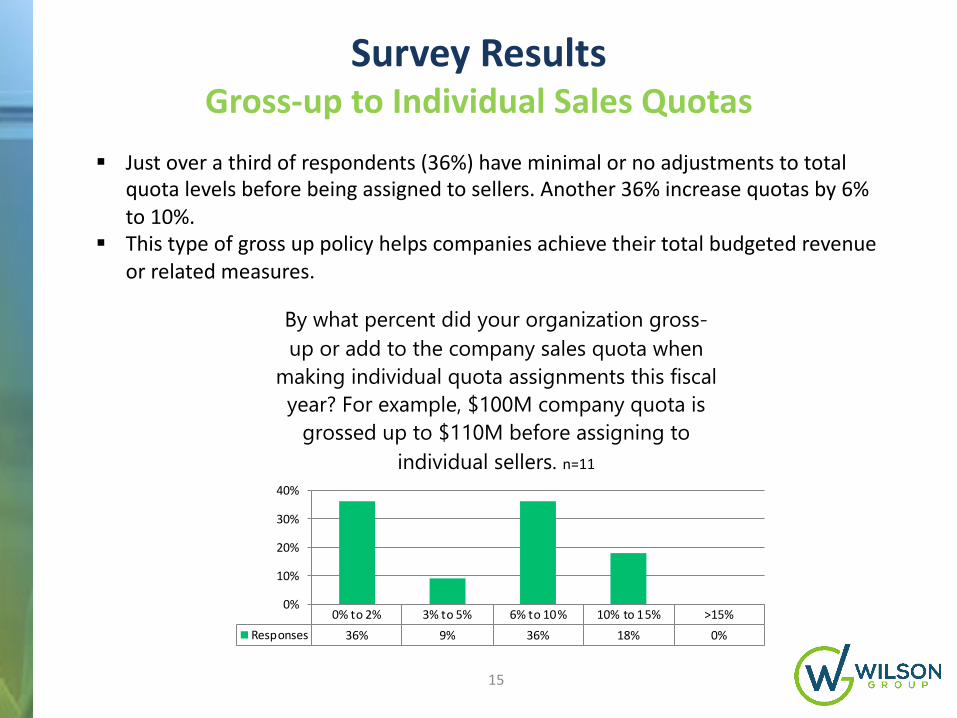
0% to 2% 3% to 5% 6% to 10% 10% to 15% >15%Responses 36% 9% 36% 18% 0%
0%
10%
20%
30%
40%
By what percent did your organization gross-up or add to the company sales quota when
making individual quota assignments this fiscal year? For example, $100M company quota is
grossed up to $110M before assigning to individual sellers. n=11
§ Just over a third of respondents (36%) have minimal or no adjustments to total quota levels before being assigned to sellers. Another 36% increase quotas by 6% to 10%.
§ This type of gross up policy helps companies achieve their total budgeted revenue or related measures.

Survey ResultsSales Crediting
16
1 2 3 4 5 6Responses 36% 45% 9% 9% 0% 0%
0%
10%
20%
30%
40%
50%
Typically how many sales incentive eligible employees receive credit
for making a sale (exclude management levels)? For example, answer is 2 if a sales engineer and account executive both are
involved and get credit. n=11
§ These responses indicate there is minimal sharing of sales credits, limited to up to two people involved in a sale.

Survey ResultsSales Crediting
17
Other: Each receives 100% of the credit. Shared credit is only given if the deal is split among the same role (example, 2 sales executives share the deal, or 2 sales engineers share the deal).
All receive partialcredit for the sale,
total cannotexceed 100%
Credit for the saleis divided among
sales professionalsand can exceed
100%
Primary salesprofessional
receives 100% ofcredit
Other (pleasespecify)
Responses 0% 50% 38% 13%
0%10%20%30%40%50%60%
If more than one sales professional is involved in the sale, how do you allocate sales credit to calculate commission? n=8
§ Fifty percent (50%) or more of respondents could allow for sales crediting to exceed 100%, with some defined conditions.

Survey ResultsSales Incentive Effectiveness
18
Far aboveaverage
Aboveaverage Average Below
averageFar belowaverage
Responses 0% 17% 83% 0% 0%
0%
20%
40%
60%
80%
100%
How would you rate the overall effectiveness of your current sales
compensation plan? n=12
§ Eighty three percent (83%) feel that their company’s sales compensation plans are generally effective; while 17% feel that their plan effectiveness is above average.
§ In our experience a plan is effective if it is (1) reinforcing the intended behaviors as defined by the sales strategy, (2) paying the best performers the most and poor performers the least, (3) payouts are aligned with the company’s costs/affordable, (4) attracts and retains employees and (5) the plan results supports 50% to 60% of the salesforce achieving quota.

Survey ResultsSales Incentive Effectiveness
19
To a greatextent
To a moderateextent
To someextent
To a littleextent
To a very littleextent
Responses 67% 17% 8% 8% 8%
0%
10%
20%
30%
40%
50%
60%
70%
To what extent do you feel your sales professionals understand their sales plans
and how they work? n=12
§ An important element of successful sales compensation plans is sellers understanding their plans.
§ Sixty seven percent (67%) responding feel their company’s salesforce understands their plans to a great extent.

Survey ResultsSales Incentive Effectiveness
20
To a greatextent
To a moderateextent
To someextent
To a littleextent
To a very littleextent
Responses 18% 36% 45% 0% 0%
0%5%
10%15%20%25%30%35%40%45%50%
To what extent is the current sales compensation plan motivating to your
sales people? N=11
§ At least to some extent, respondents feel that sales compensation plans motivate their sellers.
§ Eighteen percent of respondents (18%) feel that the plans were motivating to a great extent.

Survey ResultsSales Incentive Pay for Performance
21
To a greatextent
To a moderateextent
To someextent
To a littleextent
To a very littleextent
Responses 27% 83% 0% 0% 0%
0%10%20%30%40%50%60%70%80%90%
To what extent are the most productive sales people earning the most money?
n=11
§ Eighty three percent (83%) of respondents feel that to a moderate extent, their most productive sellers are earning the most money, 27% feel that to a great extent.

Survey ResultsChanges to Sales Incentives
22
No change to theplans
Minimal change tothe plans
Moderate changesto the plans
Major changes tothe plan
Responses 9% 73% 9% 9%
0%10%20%30%40%50%60%70%80%
What kind of updates or changes did you make in your last fiscal year sales
compensation plan? n=11
§ In our experience, most companies evaluate the effectiveness of their sales compensation plans annually. When the sales strategy changes, it can result in major changes to the plan.
§ Seventy three percent (73%) plan to make minimal or no changes to their plans. This is likely to improve plan effectiveness while maintaining a consistent sales strategy.

Survey ResultsChanges to Sales Incentives
23
§ Briefly list what caused changes in your plans, e.g., new products, sales strategy change, reorganization of the sales force, etc.
• Minor percentage adjustments; added an additional category of prospect called "Dormant Client"
• More rules around the T&C's to ensure better compliance and fairness around the plan
• New business unit’s desire to push the sales teams to focus on selling the new products
• Moving to SaaS model in many product lines• Sales strategy change and a reorganization• Increase in quota size• Changed target quotas. Changed scope of sales role to full cycle from receiving
pre-qualified leads from an SDR. Adapted commissions paid to be graduated from 50% award at 50% achievement to 150% reward for exceeding quotas at highest level.
• Changed from all sales reps reporting to HQ Sales GM to groups reporting to Regional Sales Director. New products targeted in strategic bonus goals.

Survey ResultsParticipating Companies
24
Agero Administrative Service CorpAiphone Corporation
Carousel Industries of N.A.Dassault Systemes
dataxuLighthouse
LiquidPlannerNuance Communications
Pegasystems Reflexis Systems Inc
SmarshSummit Healthcare Services
Winshuttle

This document is not intended to be taken as advice regarding any individual situation and should not be relied upon as such. Wilson Group shall have no obligation to update this publicationand shall have no liability to you or any other party arising out of this publication or any matter contained herein. Any statements concerning actuarial, tax, accounting or legal matters are basedsolely on our experience as consultants and are not to be relied upon as actuarial, accounting, tax or legal advice, for which you should consult your own professional advisors. Any modelinganalytics or projections are subject to inherent uncertainty and the analysis could be materially affective if any underlying assumptions, conditions, information or factors are inaccurate orincomplete or should change.
www.wilsongroup.com