! Return)and)Risk)Exposure)in)Pairs)Trading)
166
Copenhagen Business School MSc Advanced Economics and Finance (Cand. Oecon) Return and Risk Exposure in Pairs Trading C Evidence from the German Equity Market Abstract: We construct monetary neutral daily rebalanced pairs trading portfolios and test their profitability in the period 200392012. Our strategy yields abnormal risk9adjusted returns exceeding the market index. We also find further opportunities to improve the strategy by adopting risk management tools. Furthermore, we find evidence that pairs trading is a liquidity providing strategy and performs well in a volatile market environment. Keywords: Statistical arbitrage, pairs trading, market efficiency, market neutral, volatility, liquidity Author: Fabian Berg Author: Jørgen Bråten Nordby Handed in: August 2013 Number of pages (characters): 96 (217 575) Advisor: Lasse H. Pedersen, Professor at the Department of Finance, Centre of Financial Frictions (FRIC), Copenhagen Business School The John A. Paulson Professor of Finance and Alternative Investments at NYU Stern School of Business
Transcript of ! Return)and)Risk)Exposure)in)Pairs)Trading)

Copenhagen)Business)School)
MSc)Advanced)Economics)and)Finance)(Cand.)Oecon))
!
!
Return)and)Risk)Exposure)in)Pairs)Trading)
C)Evidence)from)the)German)Equity)Market)
!
!
Abstract:))
We#construct#monetary#neutral#daily#rebalanced#pairs#trading#portfolios#and#test#their#
profitability#in#the#period#200392012.#Our#strategy#yields#abnormal#risk9adjusted#returns#
exceeding#the#market#index.#We#also#find#further#opportunities#to#improve#the#strategy#by#
adopting#risk#management#tools.#Furthermore,#we#find#evidence#that#pairs#trading#is#a#liquidity#
providing#strategy#and#performs#well#in#a#volatile#market#environment.##
#
Keywords:))
Statistical#arbitrage,#pairs#trading,#market#efficiency,#market#neutral,#volatility,#liquidity#
!
)
)
Author:)Fabian)Berg) ) ) Author:)Jørgen)Bråten)Nordby)
)
)
Handed)in:)August)2013)
Number)of)pages)(characters):)96)(217)575))
)
)
Advisor:!Lasse)H.)Pedersen,##Professor#at#the#Department#of#Finance,#Centre#of#Financial#Frictions#(FRIC),#Copenhagen#Business#School#
The#John#A.#Paulson#Professor#of#Finance#and#Alternative#Investments#at#NYU#Stern#School#of#Business)

Executive)Summary)
!
This!thesis!finds!evidence!of!abnormal!returns!in!pairs!trading.!We!obtain!a!Sharpe!ratio!of!
0.47!compared!to!the!market’s!0.38!during!the!period!of!2003A2012.!In!addition,!we!find!a!
potential!improvement!to!the!strategy!by!adoption!of!risk!management!tools.!Our!returns!can!
be!partly!explained!by!lagged!relationships!between!our!returns!and!exposure!to!volatility!
and!liquidity!risk,!but!the!effects!are!too!small!to!offer!predictive!value!or!be!considered!main!
drivers!of!return!within!pairs!trading.!!
!
The!first!part!of!the!thesis!provides!a!thorough!discussion!of!the!theoretical!foundation!and!
most!relevant!risk!factors!for!pairs!trading.!Furthermore,!it!provides!an!explanation!of!how!a!
pairs!trading!strategy!is!typically!constructed!and!implemented!by!an!investment!
professional.!The!empirical!part!of!the!thesis!tests!the!profitability!of!a!daily!rebalanced!
monetary!neutral!pairs!trading!strategy!in!the!German!equity!market!between!2003A2012.!
Similar!to!recent!literature!!(Do!and!Faff!2012),!our!portfolios!do!not!yield!abnormal!returns!
for!a!6!months!trading!period.!We!also!construct!a!portfolio!with!a!12!months!trading!period!
to!give!pairs!longer!time!to!converge!and!take!into!account!the!worsened!arbitrage!risk!
proposed!by!Do!and!Faff!(2010).!Our!best!pairs!portfolio,!with!a!12!months!trading!period,!
yields!abnormal!riskAadjusted!returns!that!are!substantially!higher!than!the!market!index,!
even!after!conservative!estimates!of!transaction!costs!are!taken!into!account.!We!further!
suggest!that!the!profit!can!be!improved!by!implementing!risk!management!tools,!and!even!
though!our!approach!is!slightly!unrealistic,!it!shows!that!successful!implementation!can!
improve!the!performance!of!the!portfolio.!The!constructed!portfolio!has!a!significant!positive!
market!exposure,!and!this!is!in!conflict!with!the!common!perception!of!pairs!trading!as!a!
market!neutral!strategy.!The!remainder!of!the!thesis!tries!to!make!implications!about!the!
drivers!of!return.!Our!regressions!identify!volatility!and!funding!liquidity!risk!as!nonA
negligible!drivers!of!return!within!pairs!trading.!However,!the!dependency!on!these!variables!
seems!to!be!lagged!rather!than!dependent!on!values!in!the!current!market!environment.!The!
explanatory!power!is!too!small!to!consider!either!liquidity!or!volatility!main!drivers!of!return,!
so!just!as!previous!literature!we!are!unable!to!fully!explain!the!returns!from!pairs!trading.!!
!
!

) 2)
)Table)of)contents)
1.) INTRODUCTION!.................................................................................................................................................!4)2.) MARKET!NEUTRAL!STRATEGIES!AND!STATISTICAL!ARBITRAGE!....................................................!6)2.1.) WHAT)IS)MARKET)NEUTRALITY?).....................................................................................................................................)6)2.1.1.) Monetary#neutral#........................................................................................................................................................#7)2.1.2.) Beta#neutral#...................................................................................................................................................................#8)2.1.3.) Sector#neutral#...............................................................................................................................................................#9)
2.2.) MARKET)EFFICIENCY)AND)PROFITCMAKING)FOR)A)MARKET)NEUTRAL)STRATEGY).................................................)9)2.3.) LEVERAGE)IN)MARKET)NEUTRAL)STRATEGIES)..........................................................................................................)13)2.4.) THE)EQUITY)MARKET)NEUTRAL)STRATEGY)AS)A)HEDGE)IN)THE)INVESTMENT)PORTFOLIO)..............................)14)2.5.) PORTFOLIO)REBALANCING).............................................................................................................................................)14)2.6.) STATISTICAL)ARBITRAGE)...............................................................................................................................................)15)
3.) AN!INTRODUCTION!TO!PAIRS!TRADING!................................................................................................!17)3.1.) WHAT)IS)PAIRS)TRADING?)..............................................................................................................................................)18)3.2.) THE)ORIGIN)OF)PAIRS)TRADING)...................................................................................................................................)19)3.3.) PREVIOUS)LITERATURE)...................................................................................................................................................)19)3.3.1.) Most#Influential#academic#papers#....................................................................................................................#20)3.3.2.) Empirical#Findings#..................................................................................................................................................#21)
4.) SOURCES!OF!RISK!AND!RETURN!IN!PAIRS!TRADING!.........................................................................!23)4.1.) SOURCES)OF)RISK).............................................................................................................................................................)24)4.1.1.) Arbitrage#Risk#............................................................................................................................................................#24)4.1.2.) Liquidity#risk#..............................................................................................................................................................#26)4.1.3.) Short#squeeze#.............................................................................................................................................................#28)4.1.4.) Model#risk#....................................................................................................................................................................#29)
4.2.) SOURCES)OF)RETURN).......................................................................................................................................................)30)5.) CONSTRUCTING!A!PAIRS!TRADING!PORTFOLIO!.................................................................................!31)5.1.) SCREENING)OUR)DATA/STOCKS)....................................................................................................................................)32)5.1.1.) Market#capitalization#............................................................................................................................................#32)5.1.2.) Liquidity#in#prices#....................................................................................................................................................#33)5.1.3.) Short#sale#restrictions#and#short#sale#constraints#.....................................................................................#34)5.1.4.) Corporate#actions#....................................................................................................................................................#35)
5.2.) PAIR)FORMATION)............................................................................................................................................................)35)5.2.1.) Normalization#of#prices#.........................................................................................................................................#35)5.2.2.) The#formation#period#.............................................................................................................................................#38)5.2.3.) Identification#and#ranking#of#pairs#..................................................................................................................#39)
6.) TRADING!...........................................................................................................................................................!43)6.1.) INCSAMPLE)VERSUS)OUTCOFCSAMPLE)TRADING)..........................................................................................................)44)6.2.) TRADING)PERIODS)...........................................................................................................................................................)45)6.3.) POSITION)SIZING)..............................................................................................................................................................)46)6.4.) TRADING)RULES)...............................................................................................................................................................)47)6.5.) RETURN)CALCULATION)...................................................................................................................................................)49)
7.) EMPIRICAL!RESULTS!.....................................................................................................................................!50)7.1.) DATA)..................................................................................................................................................................................)51)7.2.) PRECTRANSACTION)COSTS)RETURNS)............................................................................................................................)52)7.3.) POSTCTRANSACTION)COSTS)RETURNS)..........................................................................................................................)58)

) 3)
7.4.) PAIRS)RANKED)81C100)..................................................................................................................................................)61)7.5.) INTRACINDUSTRY)PAIRS).................................................................................................................................................)63)7.6.) PAIRS)TRADING)IN)DIFFERENT)MARKET)ENVIRONMENTS)........................................................................................)65)7.7.) MANAGING)RISK)...............................................................................................................................................................)67)7.7.1.) Stop#loss#........................................................................................................................................................................#67)7.7.2.) Drawdown#control#..................................................................................................................................................#70)7.7.3.) Our#pairs#trading#portfolio#as#a#hedging#component#..............................................................................#72)
7.8.) REGRESSION)ANALYSIS)...................................................................................................................................................)74)7.8.1.) Explanatory#Variables#and#Hypotheses#.........................................................................................................#74)7.8.2.) Regression#results#....................................................................................................................................................#82)
8.) DISCUSSION!......................................................................................................................................................!94)9.) CONCLUSION!....................................................................................................................................................!98)REFERENCES!..........................................................................................................................................................!100)APPENDIX!...............................................................................................................................................................!103))) )

) 4)
1. Introduction,Pairs)trading)is)a)wellCknown)trading)strategy)popularly)used)by)hedge)funds)and)proprietary)trading)desks,)and)it)has)proven)to)be)both)profitable)and)have)a)low)market)exposure.!Few)investment)strategies)are)able)to)beat)the)market)on)average,)but)pairs)trading)seems)to)be)one.)With)the)intense)competition)between)sophisticated)investors,)it)is)difficult)to)understand)how)such)a)simple)strategy)can)beat)the)market)over)longer)periods)of)time.)The)inability)of)rational)investors)to)arbitrage)away)the)abnormal)profit)from)this)strategy)seems)odd,)and)makes)pairs)trading)an)interesting)strategy)to)study)further.!Our)main)focus)is)to)investigate)if)pairs)trading)generates)abnormal)returns)in)the)period)from)2003)to)2012,)and)we)construct)a)pairs)trading)portfolio)with)stocks)listed)on)the)Frankfurt)Stock)Exchange.)Our)data)sample)includes)data)from)the)Euro)crisis,)which)has)(to)our)knowledge))not)yet)been)analyzed)in)academic)literature,)and)this)is)of)particular)interest,)since)past)research)finds)that)pairs)trading)has)performed)especially)well)during)financial)decline.)Furthermore,)we)examine)how)the)profitability)of)pairs)trading)changes)with)the)market)environment,)and)try)to)identify)the)main)drivers)of)the)returns.)The)questions)concerning)the)performance)of)pairs)trading)are)our)main)motivation)to)dig)even)further)into)the)subject)and)the)focus)of)our)thesis)is)summarized)by)the)following)research)question:)))”Does#pairs#trading#yield#abnormal#returns#and#what#are#the#main#drivers#of#profitability#within#
pairs#trading?”#
#
The)thesis)provides)a)thorough)discussion)of)the)underlying)concepts)and)assumptions)in)pairs)trading,)and)makes)the)reader)more)familiar)with)concepts)such)as)market)neutral)hedge)funds,)statistical)arbitrage)and)market)efficiency.)Moreover,)we)show)how)a)pairs)trading)portfolio)is)typically)constructed,)and)go)through)each)step)of)the)implementation)process)for)our)traded)portfolio.)We)construct)portfolios)with)different)pairCidentifying)techniques)and)the)best)performing)strategy)is)based)on)a)combination)of)the)sum)of)squared)differences)(SSD))and)zero)crossings)(ZC),)first)suggested)by)Do)and)Faff)(2010).)Our)portfolio)differs)from)those)discussed)in)previous)literature,)because)we)impose)a)strict)rebalancing)regime)on)the)portfolio,)and)it)is)definitely)a)plausible)explanation)for)why)some)of)our)results)differ)from)previous)research.)For)our)estimates)of)transaction)costs)and)chosen)trading)rules)

) 5)
we)find)excess)postCtransaction)costs)returns)between)2.20)%)and)5.66)%)per)annum,)dependent)on)the)length)of)the)trading)period)and)how)we)identify)our)pairs.)Both)the)annual)excess)return)and)Sharpe)ratio)is)improved)by)extending)the)trading)period)compared)to)previous)literature,)so)our)best)portfolio)has)a)trading)period)of)12)months.)The)best)portfolio)has)a)significantly)higher)Sharpe)ratio)than)the)market,)even)after)transaction)costs)is)taken)into)account.)The)pairs)in)our)base)portfolios)are)based)purely)on)statistical)relationships,)but)we)also)test)if)restricting)stocks)in)a)pair)to)the)same)industry)can)improve)the)profitability)of)the)investment)strategy.)Contrary,)to)previous)literature)(Gatev,)Goetzmann,)and)Rouwenhorst)2006;)Do)and)Faff)2010))we)find)no)evidence)that)homogeneity)among)pairs)is)performance)enhancing.)We)also)look)at)how)a)potential)adaption)of)risk)management)tools)could)be)done,)and)under)slightly)unrealistic)circumstances)we)find)a)small)improvement)in)the)riskCadjusted)returns)after)the)implementation)of)stop)loss.)Additionally,)we)look)at)a)combination)of)the)pairs)trading)and)the)market)index,)to)see)if)the)proposed)low)correlation)between)the)two)strategies)could)increase)the)performance)of)the)strategy)through)benefits)of)diversification.)Our)results)imply)that)investor)will)rather)hold)the)individual)pairs)trading)portfolio)than)a)combination)with)the)market)index.)))Moreover,)we)regress)our)returns)on)proposed)return)factors)to)try)to)identify)the)sources)of)return)for)our)traded)portfolio.)Our)analysis)shows)that)pairs)trading)profits)are)strongly)negatively)correlated)to)momentum,)which)is)largely)explained)by)the)trading)pattern)of)our)strategy.)Volatility)is)also)correlated)with)our)returns,)and)we)explain)the)relation)with)an)increased)crossing)frequency)between)the)paired)stocks)in)a)volatile)environment.)We)also)find)a)statistically)significant)relation)between)our)profits)and)funding)liquidity)in)the)market,)and)the)negative)coefficient)is)consistent)with)compensation)for)exposure)to)liquidity)risk)introduced)by)Acharya)and)Pedersen)(2005).)We)are)not)able)to)specifically)address)the)relationship)between)our)returns)and)the)three)sources)of)premium)discussed)by)Acharya)and)Pedersen,)but)consider)all)of)them)to)be)plausible)explanations)for)the)generation)of)excess)returns)in)pairs)trading.)Current)observations)of)volatility)and)liquidity)both)appear)insignificant)when)we)take)into)account)past)values)of)the)variables,)but)then)the)lagged)values)are)significant.)Therefore)the)relationships)seem)to)be)lagged)rather)than)dependent)on)the)values)in)the)current)market)environment.)In)addition,)we)find)a)similar)result)between)our)returns)and)the)implied)volatility)as)the)one)discovered)by)Nagel)(2012),)which)indicates)

) 6)
predictive)power)for)implied)volatility)on)returns)of)liquidity)providing)strategies.)The)explanatory)power)in)our)regressions,)still)imply)that)our)identified)relationships)only)explain)a)limited)part)of)the)pairs)trading)returns,)thus)there)seems)to)be)yet)to)be)discovered)factors)that)generate)return)for)the)pairs)trading)strategy.)The)thesis)is)structured)as)follows:)(2))Market)neutral)strategies)and)statistical)arbitrage,)(3))An)introduction)to)pairs)trading,)(4))Sources)of)risk)and)return)in)pairs)trading)(5))Constructing)a)pairs)trading)portfolio,)(6))Trading)the)portfolio,)(7))Empirical)results,)(8))Discussion)and)(9))Conclusion.))
2. Market,Neutral,Strategies,and,Statistical,Arbitrage,
The)hedge)fund)industry)is)mostly)known)for)highly)complex)and)nonCtransparent)trading)strategies)that)are)difficult)to)understand)for)less)sophisticated)investors.)Hedge)funds)can)provide)value)to)investors)by)exploiting)investment)opportunities)that)are)unavailable)to)most)individual)and)institutional)investors.)The)main)part)of)this)thesis,)will)try)to)shed)light)on)a)very)narrow)part)of)the)hedge)fund)universe,)which)is)a)market)neutral)strategy)called)pairs)trading.)Before)we)dive)further)into)pairs)trading,)we)will)give)a)brief)introduction)to)market)neutral)strategies)and)statistical)arbitrage,)as)these)concepts)are)the)cornerstones)pairs)trading)is)built)on.)))Figure!1!
)))
)Figure)1.)We)consider)statistical)arbitrage)a)subCstrategy)of)equity)market)neutral)strategies)and)pairs)trading)to)be)one)of)several)strategies)within)the)broader)statistical)arbitrage)category.)))
2.1. What,is,market,neutrality?,
The)most)common)perception)of)a)market)neutral)portfolio,)in)the)world)of)financial)securities,)is)an)investment)portfolio)that)is)independent)of)market)fluctuations.)The)common)interpretation)of)market)independency)is)that)the)portfolio)is)uncorrelated)with)the)relevant)stock)index.)We)stick)to)this)definition)in)our)thesis,)but)will)provide)a)thorough)discussion)of)market)efficiency)and)the)market)neutrality)concept.)The)intention)is)to)help)the)reader)better)

) 7)
understand)the)implications)of)market)efficiency)and)how)it)relates)to)a)pairs)trading)portfolio.)))It)is)important)to)emphasize)that)even)if)a)portfolio)is)uncorrelated)with)the)market)index)it)might)have)significant)exposure)to)specific)industries.)In)other)words,)a)market)neutral)portfolio)is)not)automatically)immune)to)everything)that)happens)in)the)market.)It)is)reasonable)to)assume)that)it)is)uncorrelated)to)the)stock)index,)but)market)neutrality)does)not)by)any)means)imply)that)the)portfolio)is)risk)free,)just)that)the)portfolio)is)not)subject)to)market)risk.)The)capital)asset)pricing)model’s)(CAPM))main)assumption)is)that)market)risk)is)the)only)factor)for)which)the)investor)is)compensated,)thus)a)beta)neutral)portfolio)is)considered)risk)free)from)the)perspective)of)the)CAPM.)Therefore,)according)to)CAPM)a)beta)neutral)portfolio)should)not)be)able)to)earn)more)than)the)risk)free)return.)However,)subsequent)financial)research)has)made)it)reasonable)to)assume)that)investors)can)earn)returns)by)being)exposed)to)additional)risk)factors.)Identifying)these)risk)factors)are)however)quite)difficult,)but)compensation)for)exposure)to)liquidity)risk)(Acharya)and)Pedersen)2005;)Nagel)2012))and)arbitrage)risk)(Shleifer)and)Vishny)1997;)De)Long)et)al.)1990;)Abreu)and)Brunnermeier)2002))has)been)widely)discussed)in)financial)literature,)and)empirical)evidence)are)strongly)supportive)of)a)premium)for)bearing)these)risks.)Section)4)of)the)thesis)will)further)discuss)risk)factors)in)market)neutral)investment)strategies,)and)how)the)manager)can)earn)excess)returns)by)being)exposed)to)different)factors)of)risks.)For)now)we)should)just)take)with)us)that)a)market)neutral)portfolio)should)be)immune)to)general)market)fluctuations,)but)is)not)risk)free.)))Ehrman)(2006,)29C32))presents)several)concepts)of)market)neutrality)and)we)will)elaborate)on)those)relevant)for)the)remainder)of)the)thesis.)These)concepts)of)market)neutrality)is)especially)relevant)for)position)sizing,)as)we)must)make)a)decision)on)how)to)weight)the)two)stocks)in)a)pair)when)we)perform)pairs)trading.)))
2.1.1. Monetary,neutral,
Monetary)neutral,)or)in)our)case)a)Euro)neutral)portfolio,)has)an)equal)monetary)amount)in)the)long)and)short)positions,)hence)a)zero)net)monetary)exposure)to)the)market.))

) 8)
)€!"#$ = €!!!"#)
)The)Euro)neutral)manager)expects)stocks)he)goes)long)to)outperform)the)stocks)he)goes)short,)thus)he)tries)to)profit)from)the)relative)performance)between)the)stocks)in)his)portfolio.)The)dollar)neutral)portfolio)is)selfCfinancing,)because)the)same)monetary)amount)is)invested)in)long)and)short)position)each)time)an)investment)is)made1.)What)is)also)worth)mentioning)is)that)a)dollar)neutral)portfolio)might)have)a)very)different)risk)profile)on)the)long)and)short)positions)and)thus)might)operate)with)a)beta)that)deviates)significantly)from)zero.)Therefore)a)dollar)neutral)portfolio)is)not)necessarily)independent)of)the)market.)!
2.1.2. Beta,neutral,
A)beta)neutral)portfolio)weights)the)positions)in)each)stock)to)make)the)net)beta)of)the)long)and)short)positions)in)the)portfolio)is)zero.)))
!!"#$ = !!!!"#!)The)idea)behind)the)weighting)scheme)is)to)have)the)same)market)risk)on)the)long)and)short)components)of)the)portfolio.)If)you)invest)long)in)a)stock)with)a)beta)of)1)and)short)a)stock)with)a)beta)of)1.5,)you)end)up)taking)a)€)1.5)position)in)the)long)stock)and)€)C1)position)in)the)shorted)stock,)because)the)short)position)is)more)risky)than)the)long)position.)This)makes)the)pair)beta)neutral,)but)it)should)be)quite)obvious)that)a)beta)neutral)portfolio)is)not)necessarily)monetary)neutral.)Beta)weighting)of)the)long)and)short)positions)creates)a)strictly)market)independent)portfolio,)but)requires)frequent)adjustments)to)be)kept)market)neutral.)Even)though)monetary)neutral)is)the)most)commonly)used)method,)beta)neutrality)is)the)theoretically)correct)method)to)create)a)portfolio)that)is)independent)of)the)market)(Ehrman)2006,)29C32).))!
))))))))))))))))))))))))))))))))))))))))))))))))))))))))1)This)is)true)under)the)assumption)of)no)rebalancing,)as)any)rebalancing)will)lead)to)cash)flows)that)violate)the)selfCfinancing)condition.)2)The)main)strategies)reported)by)Malkiel)and)Saha)(2005))include)Convertible)bond)arbitrage,)Dedicated)short)bias,)Emerging)markets,)

) 9)
2.1.3. Sector,neutral,
The)manager)might)also)want)to)protect)his)portfolio)against)industry)specific)shocks,)and)can)construct)the)portfolio)so)that)it)becomes)immune)to)fluctuations)both)in)the)general)market)and)specific)industries.)For)instance,)a)trader)that)invests)in)technology)stocks,)might)prefer)to)be)unaffected)by)the)development)of)the)technology)industry.)He)can)obtain)this)by)combining)long)and)short)positions)to)create)a)neutral)portfolio)that)is)unaffected)by)changes)in)that)particular)industry.)The)investor)can)become)sector)neutral)in)terms)of)either)monetary)or)market)beta)exposure.))
2.2. Market,efficiency,and,profitBmaking,for,a,market,neutral,strategy,
So)why)does)a)fund)manager)want)to)be)independent)of)the)market?)The)main)advantage)of)market)neutrality)is)that)the)manager)is)able)to)make)relative)bets)instead)of)directional)bets.))To)become)market)neutral)the)fund)manager)must)use)a)combination)of)long)and)short)positions,)which)makes)returns)a)result)of)the)relative)performance)of)the)long)positions)versus)the)short)positions,)different)from)a)traditional)long)portfolio)that)derive)its)returns)from)absolute)performance)(Ehrman)2006,)89C90).)Jacobs)and)Levy)(2005))underline)that)an)equity)market)neutral)strategy)lets)the)investment)manager)fully)focus)on)security)selection)and)isolates)the)stock)picking)abilities)of)the)manager.)Moreover,)the)market)neutral)strategy)will)let)the)investor)exploit)the)universe)of)securities)even)better)than)the)traditional)long)strategy.)The)market)neutral)manager)can)act)on)all)his)views,)both)the)positive)and)negative,)as)well)as)profit)from)perceived)relative)mispricing)between)securities)or)sectors.)))From)the)above)paragraph)it)should)be)clear)that)the)market)neutral)strategy)tries)to)profit)from)market)inefficiencies)or)statistical)anomalies.)So)the)obvious)question)is)if)the)market)is)efficient)or)not?)Furthermore,)if)it)is)possible)to)consistently)identify)overC)and)undervalued)securities)and)earn)abnormal)returns?)The)“efficient)market”)is)a)term)first)introduced)by)Eugene)Fama)(1970).)He)defined)an)efficient)market)as)a)market)where)prices)fully)reflect)information,)and)in)the)same)paper)he)discusses)the)different)degrees)of)market)efficiency.)In)a)weakly)efficient)market,)prices)reflect)all)past)information,)thus)a)trading)strategy)based)on)historical)information,)should)not)be)able)to)earn)abnormal)returns.)A)stronger)degree)of)market)efficiency)is)semiCstrong)market)efficiency,)which)indicates)that)prices)reflect)all)

) 10)
public)information)and)is)continuously)updated)as)information)becomes)public.)Finally,)in)a)strongly)efficient)market)even)private)information)is)incorporated)in)prices.)As)the)careful)reader)has)probably)recognized,)even)weak)market)efficiency)would)dismiss)any)possibilities)of)abnormal)riskCadjusted)profits)from)technical)analysis,)and)a)semiCstrong)efficient)market)excludes)the)possibility)of)abnormal)riskCadjusted)profits)from)fundamental)analysis.)In)other)words,)semiCstrong)efficiency)rules)out)any)legal)possibilities)of)earning)consistent)abnormal)profits)in)the)financial)markets,)which)means)that)insider)trading)is)the)only)way)to)earn)abnormal)returns.)Therefore)we)will)concentrate)our)arguments)on)why)the)market)might)not)be)fully)efficient)and)why)even)the)weakest)form)of)market)efficiency)might)not)hold)at)all)times.)))An)important)point)in)the)discussion)on)market)efficiency)is)the)choice)of)equilibrium)model.)Fama)(1998))claims)that)the)only)way)to)prove)that)the)market)is)inefficient)is)to)be)able)to)statistically)reject)the)hypothesis)of)market)efficiency)independent)of)equilibrium)model.)So)far)market)efficiency)has)(to)our)knowledge))only)been)rejected)for)one)equilibrium)model,)CAPM,)and)according)to)Fama)it)is)just)as)likely)that)we)operate)with)the)wrong)equilibrium)model)and)that)there)are)yet)to)be)discovered)factors)that)drive)returns.)Even)though)there)is)no)formal)research)(as)far)as)we)know))that)gives)a)definitive)measure)of)the)efficiency)of)the)market,)the)lack)of)persistence)in)returns)for)both)hedge)fund)and)mutual)fund)managers)indicates)that)the)market)is)quite)efficient.)))Grossman)and)Stiglitz)(1980))introduce)an)interesting)contribution)to)the)discussion)on)market)efficiency.)They)present)a)model)with)an)equilibrium)degree)of)disequilibrium,)and)argue)how)cost)of)information)makes)a)fullCinformation)equilibrium)impossible.)The)model)is)based)on)heterogeneous)information)among)investors)and)the)assumption)that)investors)have)to)pay)to)retrieve)information.)They)argue)that)a)completely)efficient)market)cannot)exist)under)circumstances)when)information)is)costly)to)obtain,)because)investors)demand)compensation)to)search)for)information,)and)no)investor)is)incentivized)to)gather)information)in)a)perfectly)efficient)market.)According)to)arguments)by)Fama)(1965))deviations)from)fundamental)prices)can)appear,)but)should)be)corrected)by)arbitrageurs)almost)instantaneously.)Thus,)deviations)from)the)Law)of)One)price)(LoOP))should)be)minor)and)only)exist)for)a)very)short)period)of)time.)Black)(1986))has)an)opposing)view,)he)discusses)the)

) 11)
concept)of)noise)traders)and)describes)how)the)actions)of)noise)traders)can)drive)prices)away)from)fundamentals.)Another)example)of)a)violation)of)market)efficiency,)in)the)context)of)the)capital)asset)pricing)model,)is)evidence)from)research)by)Fama)and)French)(1992).)They)construct)a)portfolio)that)invests)long)in)stocks)with)a)small)market)cap)and)short)stocks)with)a)large)market)cap,)and)this)portfolio)is)able)to)explain)average)returns)in)the)period)from)1963C1990.))This)has)later)been)known)as)the)small)minus)big)factor)(SMB))and)has)been)one)of)very)few)factors)that)have)shown)explanatory)power)of)market)returns)for)longer)periods)of)time.)The)HML)factor)is)another)statistical)anomaly)that)has)shown)the)ability)to)explain)average)stock)returns,)and)is)defined)as)a)portfolio)long)stocks)with)high)book)value/market)value)(B/M))ratio)and)short)stocks)with)a)low)ratio.)What)are)considered)high)or)low)ratios)is)at)the)individual)managers)discretion,)but)the)industry)average)is)typically)used)as)the)separation)point.)The)rationale)is)that)a)firm)with)a)higher)B/M)relative)to)its)peers)is)cheap)compared)to)a)firm)with)a)low)B/M,)which)is)considered)expensive.)The)problem)with)the)SMB,)HML)and)other)strategies)that)seems)to)generate)returns)over)a)longer)period)of)time)is)that)there)are)few)explanations)or)theoretical)arguments)that)can)rationalize)the)results.)When)we)do)not)have)a)rationale)to)support)the)results,)they)come)up)more)as)statistical)anomalies)than)explanations)of)inefficiencies)in)the)market.)A)statistical)anomaly)that)actually)has)been)accompanied)by)a)reasonable)explanation)is)the)momentum)effect.)Jegadeesh)and)Titman)(1993))find)that)buying)recent)winners)and)selling)recent)losers)results)in)returns)that)significantly)outperform)the)market.)The)evidence)implies)that)it)is)not)due)to)systematic)risk,)but)the)existence)of)a)momentum)effect)caused)by)a)delayed)reaction)to)firm)specific)news.)Pedersen)(Not)yet)published))tells)a)slightly)different)story,)and)explains)that)trends)start)when)people)underreacts)to)news)and)as)prices)reach)fundamentals)more)traders)continues)to)invest)in)the)trade,)leading)to)a)delayed)overreaction,)before)it)reverses)back)to)the)fundamental)value.)))De)Bondt)and)Thaler)(1985))find)evidence)of)an)overreaction)to)market)news,)consistent)with)temporary)deviations)from)market)efficiency.)They)find)that)previous)losers)the)last)3C5)years)outperform)previous)winners)during)the)next)3C5)year)period.)This)is)often)termed)the)reversal)or)value)effect)and)is)an)example)of)the)reversion)to)the)fundamental)value)that)follows)an)overreaction.)In)recent)times,)Asness,)Moskowitz)and)Pedersen)(2013))show)that)a)portfolio)with)50/50)combination)of)momentum)and)value)delivers)excess)returns)and)

) 12)
outperforms)the)two)individual)strategies)in)both)the)American)and)European)market)during)the)period)1975C2008.)They)argue)that)the)combined)strategy)benefits)from)the)negative)correlation)between)the)two)individual)strategies,)since)momentum)is)positively,)while)value)is)negatively)correlated)to)liquidity)risk.)Frazzini)and)Pedersen)(Forthcoming))furthermore)demonstrate)that)a)portfolio,)which)shorts)high)beta)stocks)and)makes)a)leveraged)investment)in)low)beta)stocks,)effectively)creating)a)market)neutral)portfolio,)is)able)to)earn)abnormal)riskCadjusted)returns.)They)claim)that)it)is)due)to)some)investors’)natural)preference)of)high)beta)stocks,)because)they)are)unable)leverage)or)have)conservative)restrictions)on)the)use)of)leverage.)Pension)funds)or)mutual)fund)managers,)unable)to)leverage,)invest)in)high)beta)assets)to)be)able)to)meet)their)required)return)on)capital.)The)result)is)excess)demand)for)high)beta)stocks,)which)become)relatively)expensive)compared)to)low)beta)stocks,)and)this)is)an)opportunity)that)can)be)exploited)by)arbitrageurs.)Despite)these)examples)that)the)market)behaves)with)some)degree)of)inefficiency)on)occasion,)the)majority)of)the)strategies)or)rules)that)provide)excess)returns)seem)to)only)work)for)a)limited)period)of)time.)Malkiel)(2003))points)out)that)strategies,)which)yield)abnormal)returns)seem)to)stop)working)after)they)get)attention)in)financial)literature.)He)further)argues)that)the)IT)bubble)of)the)late)1990’s)is)an)example)of)a)time)when)the)prices)was)incorrect,)but)he)emphasizes)that)there)were)no)arbitrage)opportunities,)because)nobody)could)possibly)know)what)the)future)of)the)internet)would)be.)Thus)the)market)was)not)inefficient,)because)prices)actually)reflected)the)available)information)at)that)time.)His)conclusion)is)that)whatever)irrationalities)and)mispricing)exist)in)the)market,)they)are)only)in)existence)for)a)short)amount)of)time,)so)any)methods)or)strategies)that)obtain)excess)returns)are)unlikely)to)persist.)The)difficulty)of)consistently)beating)the)market)gathers)further)support)from)Malkiel)and)Saha)(2005).)They)show)that)once)you)adjust)for)reporting)biases)convertible)bond)arbitrage)is)the)only)main)hedge)fund)strategy2)that)generates)a)higher)Sharpe)ratio)than)the)S&P)500)in)the)period)between)1995C2003.)They)find)huge)cross)sectional)variations)and)the)difference)between)the)best)and)the)worst)performing)funds)within)a)certain)investment)strategy)is)substantial.)They)only)find)limited)evidence)of)persistence)for)the)managers)that)perform)above)median)in)a)given)year,)which)is)supportive)of)relatively)high)market)efficiency.)A)final)point)is)that)some)strategies)are)either)very)transaction)costs)intensive)or)require)significant)investments)in)infrastructure)or)))))))))))))))))))))))))))))))))))))))))))))))))))))))))2)The)main)strategies)reported)by)Malkiel)and)Saha)(2005))include)Convertible)bond)arbitrage,)Dedicated)short)bias,)Emerging)markets,)Equity)market)neutral,)Event)driven,)FixedCincome)arbitrage,)Fund)of)funds,)Global)macro,)LongCshort)equity)hedge,)Managed)futures)and)other)strategies.)

) 13)
equipment,)hence)to)discover)the)true)profitability)of)a)strategy)it)should)be)evaluated)after)taken)all)these)costs)into)account.))This)thesis)is)by)no)means)an)attempt)to)summarize)the)full)discussion)on)market)efficiency,)but)we)believe)it)is)of)great)benefit)to)the)reader)that)we)address)some)of)the)findings)in)the)literature)on)market)efficiency.)The)above)examples)underline)the)difficulty)of)outperforming)the)market)over)time.)At)the)same)time,)there)are)several)examples)of)strategies)that)have)seemed)to)crack)the)code)at)least)for)a)limited)period,)and)it)seems)like)there)is)occasional)existence)of)what)appears)to)be)market)inefficiencies.)To)conclude)this)section,)we)emphasize)the)findings)of)Malkiel)and)Saha)(2005).)They)find)evidence)of)very)diverging)results)for)investment)managers)using)similar)strategies,)so)it)is)not)enough)to)simply)choose)the)right)strategy,)but)execution)is)also)instrumental)to)beat)the)market.))
2.3. Leverage,in,Market,Neutral,strategies,
Leverage)plays)an)important)role)in)profit)making)for)investors)that)use)a)market)neutral)strategy.)Hedge)funds)use)leverage)by)financing)long)positions)with)proceeds)from)short)positions,)to)increase)the)absolute)returns)of)the)portfolio.)Additional)leverage)is)usually)financed)by)the)hedge)fund’s)prime)broker,)and)historically)the)ability)to)use)considerable)amounts)of)leverage)has)helped)hedge)funds)make)sizeable)returns,)which)other)investment)classes)struggle)to)compete)with.)We)will)provide)a)short)example)to)explain)how)hedge)funds)can)obtain)leverage)by)using)proceeds)from)short)positions.)If)a)market)neutral)hedge)fund)has)$100)million)to)invest,)they)can)take)a)position)of)$90)million)long)and)$90)million)short)simultaneously.)How)can)they)do)this)with)only)$100)million)in)total)funds?)When)they)sell)a)position)short)they)instantly)receive)the)proceeds)from)the)short)sale,)which)allows)them)to)have)approximately)$180million)in)active)long)and)short)positions.)The)proceeds)from)the)short)investment)are)held)by)the)prime)broker)as)collateral,)and)our)original)$90)million)covers)the)long)position.)If)the)investor)wants)to)further)increase)the)magnitude)of)his)positions)he)can)take)on)additional)leverage)by)i.e.)borrow)from)his)prime)broker,)but)we)ignore)that)for)now.)So)what)happens)to)the)remaining)$10)million)that)was)not)invested?))They)are)kept)by)the)broker)to)cover)potential)losses)in)the)short)position.)The)case)of)Long)Term)Capital)Management)(LTCM))is)a)good)example)of)how)important)it)is)to)control)

) 14)
leverage)and)have)a)sufficiently)large)liquidity)buffer)in)your)portfolio.)Even)if)you)are)right)in)the)end,)as)first)expressed)by)John)Maynard)Keynes:)“The)market)can)stay)irrational)longer)than)you)can)stay)solvent”.)Therefore)it)is)important)to)keep)a)liquidity)buffer)in)a)portfolio,)to)make)sure)that)you)are)not)forced)out)of)your)positions,)and)unable)to)profit)on)your)trades.)The)fact)that)hedge)funds)have)the)opportunity)to)leverage)makes)us)more)interested)in)measures)of)riskCadjusted)returns,)as)these)are)independent)of)leverage.)The)Sharpe)ratio)is)a)common)measure)of)riskCadjusted)return,)and)it)normalizes)the)excess)return)by)the)standard)deviation)of)the)return.)A)hedge)fund)can)always)reduce)or)apply)leverage)to)adjust)the)risk)of)the)portfolio,)and)thus)modify)the)expected)return.))
2.4. The,Equity,Market,Neutral,strategy,as,a,hedge,in,the,investment,portfolio,
An)investment)strategy)is)often)discussed)in)isolation,)but)by)combining)different)strategies)with)a)low)or)negative)correlation,)the)investor)can)achieve)additional)benefits)of)diversification.)The)work)of)Fung)and)Hsieh)(1999))show)that)returns)from)hedge)funds)have)a)very)low)correlation)to)the)return)of)mutual)funds)and)market)indices.)They)also)argue)that)a)hedge)fund)strategy)should)not)be)thought)of)in)isolation,)but)rather)as)a)part)of)a)larger)investment)portfolio.)With)that)in)mind)we)can)easily)argue)that)investments)in)different)hedge)fund)strategies)is)an)additional)tool)of)diversification)for)the)multiple)asset)class)investor.)Furthermore,)a)market)neutral)strategy)should)be)a)good)diversifying)component)in)an)investment)portfolio,)as)it)has)a)low)correlation)to)marketCtiming)hedge)fund)strategies)(Fung)and)Hsieh)1999).)To)elaborate,)marketCtiming)strategies)include)strategies)with)directional)bets)i.e.)Global)Macro)or)Managed)Futures)strategies,)so)they)are)different)from)nonCdirectional)strategies)like)equity)market)neutral.)This)makes)market)neutral)investments)not)only)a)good)diversifier)with)nonChedge)fund)investments,)but)also)with)other)hedge)fund)strategies.)))
2.5. Portfolio,rebalancing,
Several)hedge)fund)strategies)require)dynamic)adjustments)of)the)portfolio)components.)An)example)is)convertible)bond)arbitrage.)In)convertible)bond)arbitrage)the)investor)tries)to)exploit)the)theoretical)discount)on)convertible)bonds)compared)to)its)theoretical)value.)The)

) 15)
convertible)bond)is)a)combination)of)a)corporate)bond)and)an)equity)option,)so)the)arbitrageur)can)replicate)the)convertible)bond)with)positions)in)a)corporate)bond)and)the)equity)of)the)company.)It)is)crucial)that)the)replicating)portfolio)is)frequently)updated)so)it)perfectly)mirrors)the)value)of)the)convertible)bond.)This)might)feel)a)little)offCtopic,)but)the)point)is)that)more)sophisticated)investment)strategies)often)require)dynamic)adjustments,)and)portfolio)rebalancing)plays)an)important)role)in)equity)market)neutral)strategies.)Ideally)the)hedge)fund)manager)should)rebalance)his)portfolio)frequently)to)make)sure)he)stays)close)to)market)neutral)at)all)times.)Based)on)earlier)discussion,)this)can)for)instance)be)neutral)in)terms)of)monetary)exposure)or)market)risk.)A)potential)consequence)of)lack)of)rebalancing)is)that)the)portfolio)is)subject)to)a)significant)market)exposure)the)manager)initially)wanted)to)avoid.)After)the)portfolio)is)traded)for)a)day,)prices)change)and)so)does)the)exposure)of)the)portfolio.)If)the)portfolio)is)left)alone)it)can)develop)a)meaningful)exposure,)and)the)characteristics)of)the)portfolio)can)end)up)quite)different)from)the)initial)market)neutral.)The)problem)is)that)frequent)rebalancing)of)the)portfolio)results)in)high)transaction)costs,)so)there)is)a)tradeCoff)between)these)costs)and)a)wellCbalanced)portfolio.)The)choice)of)rebalancing)frequency)is)dependent)on)both)the)trading)horizon)and)the)type)of)investment)strategy,)and)a)traditional)market)neutral)portfolio)is)usually)rebalanced)weekly,)monthly)or)quarterly)dependent)on)the)risk)profile)and)investment)horizon)(Credit)Suisse)Asset)Management,)LLC)2009).)It)also)worth)mentioning)that)the)bidCask)spread)has)decreased)substantially)in)recent)years,)so)the)cost)of)rebalancing)is)significantly)lower)now)than)it)was)10)or)20)years)ago)(Do)and)Faff)2012).)))
2.6. Statistical,Arbitrage,
The)previous)subsection)discussed)potential)market)inefficiencies,)and)the)pure)essence)of)statistical)arbitrage)is)to)earn)a)profit)by)exploiting)market)inefficiencies)found)in)historical)data.)So)an)investor)engaging)in)statistical)arbitrage)is)by)definition)convinced)that)the)market)cannot)be)completely)efficient.)!)The)most)common)understanding)of)arbitrage)is)a)case)where)you)can)earn)a)certain)profit)by)going)long)one)stock)and)short)another,)typically)due)to)different)prices)for)the)same)asset)

) 16)
across)markets.)A)more)formal)definition)of)arbitrage)is)a)portfolio)with)0)or)negative)cost)and)positive)value)or)with)a)negative)cost)and)zero)or)positive)value.)This)is)formally)expressed)as:))
!"#$% ≤ 0!!"#!!"#$%% > 0!!"!
!"#$% < 0!!"#!!"#$%% ≥ 0))Two)of)the)best)examples)of)these)kind)of)arbitrage)opportunities)are)Shell/Royal)Dutch)and)3com/Palm,)but)such)opportunities)are)very)rare,)and)too)few)to)offer)frequent)profits)for)investors.)Royal)Dutch)and)Shell)had)a)dual)listed)company)structure)until)2005,)so)theoretically)the)stock)prices)of)the)two)companies)should)have)moved)in)lock)step,)as)they)were)entitled)to)the)same)cash)flows.)Contrary)to)expectations)the)prices)experienced)spreads)significantly)different)from)zero)in)the)period)between)1976)and)1986)(Rosenthal)and)Young)1990))and)offered)opportunities)to)profit)from)the)price)difference)in)the)two)companies.)3com)and)Palm)is)another)example.)3com)owned)95%)of)Palm,)but)had)negative)stub)value)for)a)longer)period)in)2000.)A)negative)stub)value)implied)that)the)assets)owned)by)3com)had)a)negative)value)after)3Com’s)stake)in)Palm)was)subtracted.)This)is)also)a)clear)arbitrage)opportunity,)according)to)financial)theory,)since)the)actual)value)of)Palm’s)remaining)assets)without)a)doubt)was)nonCnegative.)In)both)the)aboveCmentioned)cases)investors)can)invest)long)in)the)underpriced)security)and)short)the)overpriced)security)to)earn)an)arbitrage)profit.)Profiting)from)an)arbitrage)opportunity)is)though)not)as)easy)as)it)seems.)To)extract)the)profit)from)the)mispricing)the)investor)must)be)able)to)hold)his)positions)through)further)mispricing)until)prices)eventually)diverge.)Several)of)the)investors)in)Shell/Royal)Dutch)had)leveraged)positions)and)as)prices)continued)to)diverge)they)where)unable)to)cover)the)margin)calls.)Even)though)they)where)right)to)identify)the)arbitrage)opportunity)they)were)unable)to)structure)the)trade)right,)and)ended)up)with)substantial)losses.)It)should)also)be)mentioned)that)in)the)case)of)3com/Palm)the)arbitrage)opportunity)could)not)be)exploited,)as)the)Palm)stock)was)impossible)to)short)(Lamont)and)Thaler)2003).)))In)contrast)to)the)common)perception)of)arbitrage,)statistical)arbitrage)is)related)to)mispricing)based)on)deviations)from)the)expected)and)not)the)actual)value.)In)this)case,)there)is)no)guarantee)that)a)price)will)ever)equal)its)expected)value,)but)the)mispricing)is)true)in)

) 17)
expectation.)Additionally,)the)calculations)of)the)expected)value)will)often)differ)between)managers)dependent)on)the)number)of)observations)and)time)horizon.)Bondarenko)(2003))defines)a)statistical)arbitrage)opportunity)as)a)zero)cost)strategy)with)a)positive)expected)payoff.)The)idea)behind)statistical)arbitrage)is)that)price)relationships)will)converge)to)their)expected)values)on)average,)so)even)if)the)strategy)occasionally)yields)negative)returns)it)will)offer)positive)average)returns)in)the)long)run.)The)challenge)for)the)investment)manager)is)to)sustain)margin)calls)in)the)years)with)negative)returns,)so)the)broker)does)not)liquidate)the)positions)when)the)trade)is)valued)at)its)lowest.)A)statistical)arbitrage)manager)exploits)deviations)from)the)expected)value)of)a)price)relationship)between)two)or)more)securities)and)makes)a)profit)if)the)price)relationship)returns)to)its)expected)value.)Avellaneda)and)Lee)(2010))mention)three)common)features)of)statistical)arbitrage)as)an)investment)strategy:)1))trading)signals)are)systematic)2))the)portfolio)has)a)beta)of)zero)and)3))statistical)techniques)are)used)as)a)tool)to)generate)returns.)Statistical)arbitrage)often)involves)a)large)amount)of)trades)so)the)performance)of)the)portfolio)is)less)dependent)on)the)performance)of)a)single)trade.)The)trading)opportunities)are)identified)using)historical)price)data)and)strategies)are)often)very)data)intensive)and)performed)by)advanced)computer)systems.)Moreover,)statistical)arbitrage)portfolios)are)usually)very)wellCdiversified,)and)a)typically)consists)of)a)large)number)of)stocks.)Since)these)strategies)are)model)driven,)the)manager)can)include)a)large)number)of)stocks,)whereas)a)fundamental)investor)will)be)restricted)by)the)time)used)to)analyze)each)individual)stock)or)industry.)In)the)upcoming)section)on)pairs)trading,)we)will)see)that)a)pairs)trading)strategy)has)a)lower)number)of)stocks,)which)is)atypical)for)a)statistical)arbitrage)portfolio.)The)low)number)of)stocks)in)a)portfolio)has)a)very)simple)explanation.)CoCmovement)between)stocks)is)rare,)and)an)increase)in)the)number)of)stocks)will)damage)the)quality)of)the)pairs,)so)the)lower)number)of)stocks)in)the)portfolio)is)just)due)to)low)availability)of)qualified)pairs.))
3. An,introduction,to,pairs,trading,Now)that)we)have)introduced)some)of)the)more)fundamental)concepts)pairs)trading)is)based)on,)we)are)ready)to)proceed)to)the)main)part)of)the)thesis.)We)consider)pairs)trading)an)interesting)case)for)further)investigation,)as)it)is)a)simple)investment)strategy)that)has)yielded)

) 18)
excess)returns)over)longer)periods)of)time)and)performed)especially)well)during)periods)of)market)turbulence)(Gatev,)Goetzmann,)and)Rouwenhorst)2006;)Do)and)Faff)2010).))
3.1. What,is,pairs,trading?,
The)authors)of)this)thesis)consider)pairs)trading)to)be)just)one)of)many)strategies)that)fit)under)the)broader)category)of)statistical)arbitrage.)The)essence)of)pairs)trading)is)to)identify)stocks)that)have)historically)moved)together,)and)create)pairs)of)these)securities)with)the)belief)that)they)will)continue)to)move)together)in)the)future.)Under)the)discussion)of)statistical)arbitrage)we)mentioned)that)arbitrageurs)try)to)exploit)deviations)from)expected)values,)and)this)is)exactly)what)the)pairs)trader)does.)In)the)case)of)pairs)trading)the)expected)value)is)the)average)historical)spread)between)the)returns)of)the)two)securities)in)a)pair,)so)for)high)quality)pairs)the)expected)value)of)the)spread)is)going)to)be)close)to)zero.)The)pairsCtrading)manager)expects)the)historical)relation)to)continue)to)hold)in)the)future)and)will)initiate)a)trade)when)the)prices)between)two)paired)securities)diverge)beyond)a)predetermined)threshold.)He)tries)to)exploit)a)deviation)from)the)expected)value)by)taking)a)long)position)in)the)relatively)cheap)stock)and)sell)short)in)the)relatively)expensive)stock,)and)if)the)prices)of)the)two)stocks)converge)back)to)the)expected)relationship)the)manager)exit)the)positions.)This)is)a)simplified)explanation)of)the)pairs)trading)process,)and)a)more)thorough)and)informative)explanation)will)be)provided)in)the)section)where)we)explain)how)to)construct)a)pairs)trading)portfolio.))It)is)difficult)to)understand)how)such)a)simple)strategy)can)be)profitable,)and)this)makes)pairs)trading)a)challenging)and)interesting)subject)to)study.)Pairs)are)often)constructed)with)stocks)from)the)same)or)related)industries,)but)they)can)also)be)constructed)across)industries.)Constructing)pairs)with)stocks)from)different)industries)makes)it)even)more)difficult)to)explain)why)stocks)follow)each)other)closely,)but)greatly)increases)the)universe)of)stocks)from)which)the)investor)can)construct)pairs.)It)is,)however,)not)uncommon)for)pairs)traders)to)exclude)identified)pairs)that)appears)to)be)directly)counterintuitive)when)they)form)pairs)across)industries)(Ehrman)2006,)147).)Possible)explanations)for)the)coCmovement)in)stocks)might)be)that)they)have)equal)exposure)to)the)same)risk)factors.)Different)attempts)to)understand)the)returns)from)pairs)trading)argue)about)market)inefficiency)or)compensation)

) 19)
for)exposure)to)other)risk)factors)than)the)market)beta.)So)far)none)of)these)attempts)has)been)able)to)fully)explain)how)the)strategy)can)earn)abnormal)returns,)and)the)absence)of)a)satisfactory)understanding)of)the)sources)of)returns)makes)this)an)interesting)subject)for)further)research.))
3.2. The,Origin,of,Pairs,Trading,
The)idea)of)looking)at)pairs)of)stocks,)instead)of)a)single)stock)in)isolation,)can)be)traced)back)to)as)far)as)the)early)1900’s)and)the)trader)Jesse)Livermore,)who)by)many)is)claimed)to)be)one)of)the)best)traders)of)all)times.)He)analyzed)two)stocks)in)the)same)industry)at)the)same)time)to)confirm)his)fundamental)analysis.)His)rationale)was)that)stocks)in)the)same)industry)should)move)in)tandem,)and)by)following)two)stocks)instead)of)one)he)would)better)understand)the)changes)in)the)price)of)the)stocks.)Livermore)then)looked)at)the)development)between)two)stocks)to)trade)on)what)he)considered)irregularities)(Smitten)2004).)Hence)the)initial)idea,)which)pairs)trading)was)based)on)is)related)to)coCmovement)between)stocks)from)the)same)industry.)Even)though)we)can)trace)elements)of)pairs)trading)back)to)Jesse)Livermore,)what)we)today)consider)pairs)trading)did)not)appear)until)the)mid)1980’s.)Nunzio)Tartaglia)and)his)quant)group)at)Morgan)Stanley)were)the)first)to)initiate)in)pairs)trading,)and)during)their)first)years)of)operations)the)firm)earned)impressive)profits.)The)group)was)nevertheless)disbanded)in)1989)after)suffering)losses)the)preceding)couple)of)years,)but)the)early)performance)of)the)quant)group)at)Morgan)Stanley)had)caught)the)interest)of)the)public.)After)the)success)of)Tartaglia’s)group,)pairs)trading)has)become)a)popular)investment)strategy,)particularly)at)proprietary)trading)desks)and)hedge)funds)(Gatev,)Goetzmann,)and)Rouwenhorst)2006).)))
3.3. Previous,literature,
Previous)literature)on)pairs)trading)has)mostly)been)concerned)with)the)US)equity)market,)and)far)as)the)authors)of)this)thesis)know,)earlier)research)only)covers)the)time)period)from)1962C2009.)Thus)there)is)limited)literature)on)pairs)trading)beyond)US)data)and)no)academic)research)on)how)the)investment)strategy)performs)during)the)last)couple)of)years,)after)the)outbreak)of)the)Euro)crisis.)The)performance)of)pairs)trading)during)the)Euro)crisis)is)of)particular)interest)since)pairs)trading)is)known)to)work)well)in)periods)with)poor)market)

) 20)
returns.)In)this)section)we)will)present)some)of)the)most)important)academic)papers)and)empirical)findings,)as)these)are)the)main)inspiration)for)our)research)and)the)methods)we)use)in)the)construction)of)our)portfolio.))
3.3.1. Most,Influential,academic,papers,
The)pairs)trading)approach)in)this)thesis)is)to)a)large)extent)inspired)by)the)pair)identifying)metrics)and)methods)used)in)the)most)influential)papers)about)pairs)trading.)Some)of)the)terms)and)methodology)in)this)section)might)be)new)to)the)reader,)but)those)relevant)for)the)remainder)of)the)thesis)will)be)further)explained)when)we)construct)our)own)pairs)trading)portfolio.)))The)first)paper)to)discuss)pairs)trading,)Gatev,)Goetzmann)and)Rouwenhorst)(2006),)investigate)the)performance)of)the)strategy)between)1962)and)2002.)They)choose)a)formation)period)of)12)months)to)identify)coCmovement)in)returns)between)different)stocks.)The)authors)look)at)the)total)return)series)of)different)stocks)and)rank)potential)pairs)by)the)sum)of)squared)differences)(SSD),)which)is)a)measure)of)how)close)the)different)securities)move.)Pairs)are)ranked)from)the)lowest)to)highest)in)terms)of)the)SSD)measure.)Furthermore,)they)construct)portfolios)consisting)of)pairs)ranked)top)5,)top)20,)101C120)and)one)portfolio)with)all)their)pairs)in)their)sample)to)separate)the)performance)by)pairs)with)different)rankings.)The)entry)threshold)is)set)based)on)the)standard)deviation)of)the)spread)between)securities)in)a)pair)during)the)formation)period.)If)prices)diverge)more)than)two)times)the)standard)deviation)from)the)formation)period,)they)open)a)trade)and)hold)it)until)prices)converge.)If)an)open)pair)does)not)converge)before)the)end)of)the)trading)period,)they)exit)the)position)at)the)last)day)of)the)trading)period.)The)profit)is)of)course)dependent)on)the)level)of)the)spread)at)entry)versus)the)level)of)the)spread)when)they)exit)the)trade.)Trades)are)constructed)to)be)selfCfinancing,)which)means)that)$)1)is)invested)long)in)the)relatively)cheap)stock)and)$1)is)invested)short)in)the)relatively)expensive)stock.)They)use)a)six)months)trading)period,)and)start)trading)a)new)portfolio)every)month.)This)means)that)they)have)six)different)portfolios)active)at)all)times.)Gatev,)Goetzmann)and)Rouwenhorst)also)separate)between)unrestricted)and)restricted)pairs,)where)unrestricted)pairs)are)chosen)solely)by)their)mathematical)relationships.)The)restricted)pairs)on)the)other)hand,)are)restricted)to)only)contain)stocks)

) 21)
from)the)same)industry)and)are)chosen)from)the)four)Standard)&)Poor’s)industry)classifications)Transportation,)Utilities,)Financial)services)and)Industrials.)))Another)influential)paper)within)pairs)trading)is)Do)and)Faff)(2010),)and)they)analyze)pairs)trading)returns)in)a)more)recent)time)period,)2003C2009.)Do)and)Faff)also)use)the)SSD)metric)to)sort)out)potential)pairs,)but)suggest)additional)measures)to)identify)better)pairs.)One)of)them)is)zero)crossings)(ZC),)defined)as)the)number)of)times)the)two)cumulative)return)series)in)a)pair)crosses)each)other.)They)discover)that)the)most)profitable)trades)exhibit)a)high)number)of)zero)crossings)in)the)formation)period,)which)is)supportive)of)their)hypothesis)that)ZC)could)be)a)good)measure)to)identify)profitable)pairs.)Moreover,)they)construct)portfolios)by)combining)the)SSD)and)ZC)approach,)where)they)first)sort)out)the)pairs)by)SSD)and)then)rank)these)pairs)according)to)ZC.))
3.3.2. Empirical,Findings,
Gatev,)Goetzmann)and)Rouwenhorst)(2006))find)annualized)excess)returns)of)up)to)11%,)and)evidence)of)abnormal)returns)even)after)accounting)for)transaction)costs.)Furthermore,)by)looking)at)the)length)of)the)holding)period)of)a)position,)estimated)to)be)close)to)4)months,)they)claim)that)pairs)trading)should)be)considered)a)medium)term)investment)strategy.)They)emphasize)the)importance)of)diversification)and)find)that)minimum)realized)returns)actually)increases,)while)maximum)return)remains)quite)stable)when)they)increase)their)portfolios)from)top)5)to)top)20)pairs.)This)indicates)the)existence)of)a)very)favorable)diversification)effect)when)the)number)of)pairs)in)the)portfolio)is)increased.)Moreover,)the)standard)deviation)of)the)portfolio)decreases)as)they)increase)the)number)of)pairs,)once)again)consistent)with)a)favorable)diversification)effect.)They)try)to)regress)their)returns)on)common)risk)factors,)and)find)no)clear)evidence)of)a)factor)exposure)that)can)fully)explain)the)excessive)returns.)In)their)top)20)pairs,)momentum)is)negative)and)the)only)significant)variable,)but)the)regression)does)not)offer)enough)explanatory)power)to)explain)the)average)returns.)By)including)all)pairs)they)find)that)coefficients)of)reversal)and)momentum)have)significant)and)expected)signs,)but)also)seem)too)small)to)fully)explain)the)returns)of)pairs)trading.)Instead)they)suggest)that)there)is)a)latent)risk)component)that)can)explain)the)profit)of)pairs)trading,)but)they)do)not)offer)any)explanations)of)what)this)factor)might)be.)Nevertheless,)they)suggest)

) 22)
that)the)abnormal)returns)are)compensation)for)enforcing)the)Law)of)One)Price)(LoOP).)The)paper)also)discovers)a)declining)profitability)in)pairs)trading)after)1988)compared)to)earlier)periods.)They)claim)that)it)is)due)to)increased)competition)between)arbitrageurs)who)drive)away)the)potential)profits)of)pairs)trading.)This)is)in)accordance)with)the)view)that)opportunities)to)earn)abnormal)returns)disappear)as)they)get)attention,)and)are)exploited)by)more)investors)(Malkiel)2003).)Gatev,)Goetzmann)and)Rouwenhorst)(2006))state)that)their)findings)of)abnormal)returns)in)the)US)equity)market)is)in)conflict)with)market)efficiency,)but)they)further)argue)that)risk)factors)with)the)potential)to)explain)returns)are)difficult)to)find)and)that)the)market)might)be)efficient)when)the)latent)risk)factor)is)taken)into)account.))Do)and)Faff)(2010))provide)further)evidence)of)the)decreasing)trend)in)the)profitability)of)pairs)trading,)but)conclude)that)profitability)can)be)improved)by)creating)more)homogenous)pairs)and)taking)the)frequency)of)price)crossings)into)account.)Homogenous)pairs)are)defined)as)stocks)within)the)same)industry)classification,)and)they)hypothesize)that)a)narrower)classification)might)increase)the)profitability)of)pairs)trading.)In)contrast)to)Gatev,)Goetzmann)and)Rouwenhorst)(2006),)they)claim)that)the)decreasing)trend)in)the)profitability)of)pairs)trading)cannot)be)due)to)more)intense)competition)between)pairs)traders.)They)find)a)much)larger)proportion)of)nonCconverging)trades)in)the)period)1989C2002)compared)to)1962C1988,)and)this)is)inconsistent)with)the)explanation)that)the)profitability)of)pairs)trading)has)declined)because)arbitrageurs)are)too)quick)to)correct)deviations)from)the)LoOP.)Do)and)Faff)(2010))explain)the)worsened)performance)of)pairs)trading)in)recent)periods)with)a)lower)proportion)of)convergence)for)open)pairs)and)that)pairs)use)longer)time)to)converge)on)average.)A)more)efficient)market)would)have)implied)a)larger)proportion)of)nonCtraded)pairs)instead)of)a)tendency)not)to)converge,)thus)the)argument)made)by)Gatev,)Goetzmann)and)Rouwenhorst)cannot)be)true,)if)the)proposed)statistical)relationship)is)correct.)The)proportion)of)pairs)that)does)not)converge)increased)from)26%)to)40%)from)the)period)1962C1988)to)2003C2009.)In)addition,)the)fraction)of)pairs)that)trade)multiple)times)during)the)trading)period)decreased)from)42%)to)24%)between)the)same)periods.)Do)and)Faff)(2010))explain)their)findings)as)evidence)of)a)worsening)arbitrage)risk)during)the)period.)We)will)elaborate)on)arbitrage)risk)in)the)section)about)sources)of)risk)in)pairs)trading.))

) 23)
Engelberg,)Gao)and)Jagannathan)(2008))also)discuss)the)rationale)behind)potential)profits)in)pairs)trading)and)study)how)idiosyncratic)news,)common)news)and)liquidity)are)affecting)the)pairs’)performance.)They)claim)that)news,)which)temporarily)decreases)the)liquidity)in)one)of)the)stocks)in)a)pair,)increases)the)probability)of)convergence)in)the)pair.)They)argue)that)news)may)lead)to)a)faster)reaction)in)one)of)the)stocks,)depending)on)the)difference)in)the)liquidity)level)of)the)two)securities.)This)theory)is)supportive)of)liquidity)supply)as)one)of)the)main)drivers)of)profitability)within)pairs)trading,)but)while)Engelberg,)Gao)and)Jagannathan)(2008))focuses)on)the)liquidity)of)single)stocks,)our)empirical)research)will)focus)more)on)the)role)of)the)overall)market)and)funding)liquidity.)They)also)find)that)idiosyncratic)news)that)fundamentally)changes)the)underlying)operations)of)one)of)the)stocks)in)a)pair)can)lead)to)a)permanent)divergence)for)the)stocks)in)a)pair.)Andrade,)Di)Pietro)and)Seasholes)(2005))offer)additional)support)for)liquidity)as)an)important)driver)of)profitability.)They)look)at)the)relationship)between)uninformed)demand)shocks)and)pairs)trading)returns.)The)data)is)collected)from)the)Taiwanese)stock)exchange,)and)they)try)to)estimate)the)uninformed)demand)in)the)market)by)using)aggregate)net)shares)held)long)on)margin)as)a)proxy)for)uninformed)demand.)The)authors)find)evidence)that)a)stock’s)expected)return)increases)with)the)volatility)of)changes)in)uninformed)long)margin)holdings.)They)find)a)relationship)between)the)level)of)uninformed)trades)and)pairs)trading)returns,)and)suggest)that)pairs)trading)return)is)compensation)for)providing)liquidity)to)the)excess)demand)from)uninformed)investors.)According)to)the)authors)the)market)with)uninformed)investors)is)a)market)with)limited)risk)bearing)capacity)and)will)therefore)compensate)provision)of)liquidity.)All)these)papers)are)an)inspiration)for)future)research)within)pairs)trading,)as)there)are)still)unanswered)questions)related)to)the)drivers)of)profitability)for)this)investment)strategy.))
4. Sources,of,risk,and,return,in,pairs,trading,A)substantial)part)of)the)pairs)trading)analysis)is)related)to)the)different)risks)the)strategy)faces.)Even)if)a)strategy)seems)to)yield)promising)returns,)the)manager)must)be)aware)of)the)sensitivity)the)portfolio)has)to)unexpected)events)or)unforeseen)changes)in)the)macro)environment.)This)is)even)more)important)for)a)leveraged)strategy,)and)the)proportion)of)leverage)in)the)portfolio)financing)should)be)a)factor)of)the)portfolio’s)sensitivity)to)different)

) 24)
risk)factors.)Furthermore,)the)accumulation)of)returns)can)be)a)direct)consequence)of)the)factor)exposure)the)portfolio)is)subject)to,)as)exposure)to)some)risk)factors)should)be)compensated.)Therefore)what)might)seems)be)abnormal)returns)might)actually)be)exposure)to)additional)risk)that)also)can)affect)the)performance)of)the)portfolio.))
4.1. Sources,of,risk,
An)investment)strategy)is)subject)to)several)types)of)risk.)It)is)therefore)crucial)for)the)investor)to)be)conscious)about)the)risk)exposure)of)the)portfolio,)so)it)is)properly)managed.)In)the)upcoming)section)we)dig)further)into)types)of)risk)we)consider)especially)relevant)for)pairs)trading.)We)separate)between)risks)the)investor)will)be)compensated)for)and)risks)that)threaten)the)performance)of)the)portfolio)but)offer)no)compensation)to)the)investor.)Arbitrage)risk)and)liquidity)risk)are)factors)of)the)former)category,)and)we)anticipate)these)to)be)two)important)factors)of)both)risk)and)return)within)pairs)trading.)We)also)elaborate)on)the)occurrence)of)short)squeezes)and)model)risk,)which)are)not)necessarily)sources)of)return,)but)still)substantial)sources)of)risk)for)statistical)arbitrage)strategies.)We)do)not)include)market)risk)since)the)portfolio)is)intended)to)be)market)neutral,)but)admit)that)a)pairs)trading)portfolio)are)likely)to)have)some)exposure)to)the)market.))
4.1.1. Arbitrage,Risk,
Arbitrage)risk)is)very)relevant)for)pairs)trading,)as)the)essence)of)pairs)trading)is)to)exploit)statistical)anomalies)or)arbitrage)opportunities.)The)term)arbitrage)risk)is)a)broader)term)that)contains)fundamental)risk)(Shleifer)and)Vishny)1997),)noise)trader)risk)(DeLong)et)al.)1990))and)synchronization)risk)(Abreu)and)Brunnermeier)2002).)Fundamental)risk,)in)the)context)of)pairs)trading,)is)the)risk)that)idiosyncratic)shocks)will)lead)to)a)permanent)change)in)the)relationship)of)the)two)stocks)in)a)pair.)A)company)can)for)instance)divest)part)of)its)business,)change)its)core)focus,)be)taken)over)by)another)company)or)be)subject)to)drastic)changes)in)its)business)environment.)A)good)example)from)our)own)dataset)is)IKB)Deutsche)Industrie)Bank)in)August)2007.)IKB)suffered)huge)losses)and)was)put)under)administration)by)the)German)government.)This)led)to)a)loss)of)182%)for)a)single)pair)in)one)of)our)portfolios,)and)caused)the)worst)loss)suffered)by)a)single)pair)throughout)our)whole)trading)period)(Figure)2).)))

) 25)
Figure!2!
)According)to)Shleifer)and)Vishny,)it)is)very)difficult)for)arbitrageurs)to)diversify)away)such)risks.)For)pairs)trading)in)particular)it)can)be)difficult)to)find)a)sufficient)number)of)pairs)with)satisfactory)quality)to)make)a)large)and)diversified)portfolio.)Mitchell,)Pulvino)and)Stafford)(2002))also)address)fundamental)risk)and)show)that)not)even)negative)stub)values)are)risk)free)arbitrage)opportunities,)as)the)opportunity)can)fail)to)materialize)if)the)parent)company)or)the)subsidiary)defaults,)is)acquired)or)delisted.)For)the)pairs)trading)portfolio,)a)large)corporate)event)represents)a)significant)threat)as)it)can)change)the)nature)of)a)company)and)break)the)link)between)the)two)cumulative)stock)returns)in)a)pair.)This)will)result)in)permanent)divergence)in)the)normalized)prices)and)hurt)the)profitability)of)the)portfolio.))Noise)trader)risk)(De)Long)et)al.)1990),)in)the)case)of)pairs)trading,)concerns)the)possibility)of)further)divergence)due)to)the)presence)of)noise)traders.)The)behavior)of)noise)traders)is)impossible)to)predict,)and)their)actions)can)drive)prices)far)away)from)the)fundamental)value.)The)existence)of)noise)traders)is)supported)by)the)simple)idea)that)there)is)never)complete)consensus)about)the)value)of)an)asset.)Most)of)the)time)there)are)both)buyers)and)sellers,)thus)one)of)the)parties)must)be)wrong)about)the)value.)Even)if)the)arbitrageur)is)eventually)right,)noise)traders)can)force)prices)in)an)unfavorable)direction)and)force)the)arbitrageur)to)liquidate)his)positions.)Shleifer)and)Vishny)(1997))explain)that)the)presence)of)noise)traders)not)only)drive)prices)away)from)fundamentals,)but)also)delays)the)convergence)back)to)the)expected)value.)They)further)show)that)even)if)arbitrageurs)do)not)face)longCterm)fundamental)risk,)shortCterm)deviations)can)force)them)to)liquidate)positions,)even)when)
0)
0.5)
1)
1.5)
2)
2.5)
Pair!divergence!in!the!trading!period!
IKB) Krones)

) 26)
trades)get)more)profitable)in)expectation.)A)saying)from)Joseph)P.)Kennedy,)a)famous)investor)from)the)1920’s,)illustrates)how)noise)traders)can)play)a)role)in)the)market:)“You)know)it’s)time)to)sell)stocks)when)the)shoeshine)boy)tries)to)give)you)stock)tips”.)The)morale)of)this)saying)is)that)when)the)stock)market)has)attracted)enough)people)completely)clueless)about)financial)markets,)it)is)impossible)to)predict)the)direction)of)the)market)and)better)to)just)stay)away.)There)are)several)examples)throughout)history)where)its)seems)like)the)price)of)assets)have)been)driven)far)away)from)their)fundamental)values,)most)recently)with)mortgage)backed)securities.)))The)last)risk)type)of)arbitrage)risk)is)synchronization)risk)(Abreu)and)Brunnermeier)2002),)which)is)the)risk)that)arbitrageurs)delay)the)correction)of)the)mispricing)to)minimize)their)holding)costs.)A)small)number)of)arbitrageurs)are)unable)to)force)prices)back)to)fundamentals)by)themselves,)so)they)are)dependent)on)other)market)participants)to)help)correct)the)prices.)Thus)the)arbitrageur)risks)that)it)takes)time)before)the)mispricing)is)corrected)and)in)the)meantime)the)price)can)experience)even)further)divergence)before)it)is)possible)to)profit)from)the)arbitrage)opportunity.)Therefore,)a)pair)trade)is)risky)since)all)our)trades)are)liquidated)at)the)end)of)the)trading)period,)even)if)we)expect)prices)to)converge)at)some)point)in)the)future.)As)previously)mentioned,)Do)and)Faff)(2010))find)evidence)that)it)takes)longer)time)for)pairs)to)converge)during)the)period)2003C2009)than)earlier)periods,)and)this)is)consistent)with)the)idea)that)arbitrageurs)hesitate)to)correct)mispricing.)Additionally,)the)mispricing)must)be)significant)so)the)expected)profits)are)attractive)enough)for)the)arbitrageurs)to)incur)the)aboveCmentioned)risks.)))
4.1.2. Liquidity,risk,
Before)stocks)are)considered)eligible)for)pairs)trading)they)are)usually)screened)with)respect)to)liquidity)by)looking)at)daily)price)changes)and)trading)volume.)However,)we)cannot)be)certain)that)stocks)will)maintain)a)sufficient)level)of)liquidity)in)the)trading)period.)If)stocks)suddenly)experience)a)decline)in)liquidity,)we)risk)large)transaction)costs)when)we)enter)or)exit)the)positions)in)illiquid)stocks.)According)to)Brunnermeier)and)Pedersen)(2009),)market)liquidity)and)funding)liquidity)are)connected)and)mutually)reinforcing,)which)leads)to)liquidity)spirals.)These)liquidity)spirals)can)have)an)ambiguous)effect)on)the)pair)portfolio,)

) 27)
and)can)result)in)either)a)profit)or)a)loss)for)the)investor.)A)low)funding)liquidity)would)make)investors)more)reluctant)to)take)on)positions,)which)will)lead)to)lower)market)liquidity.)A)consequence)of)the)lower)market)liquidity)is)that)prices)become)more)volatile)(Brunnermeier)and)Pedersen)2009),)and)a)higher)volatility)can)lead)to)an)increase)in)the)crossing)frequency)of)the)stocks)in)a)pair,)which)is)considered)an)attractive)attribute)that)might)improve)the)profitability)of)the)portfolio.)However,)severe)liquidity)crunches)and)downward)spirals)can)also)lead)to)an)extreme)deviation)in)the)spread)of)a)pair.)Consequently,)the)portfolio)can)suffer)huge)losses)if)the)spread)does)not)return)to)its)expected)value)during)the)trading)period)or)the)investor)is)forced)to)exit)his)trades)due)to)margin)calls.)If)a)pair)is)expected)to)converge)in)the)long)term,)but)experiences)divergence)in)the)shortCterm,)arbitrageurs)can)be)forced)to)exit)their)positions)when)the)trade)is)at)its)most)promising,)if)funding)liquidity)is)scarce.)During)the)subCprime)crisis)banks)responded)to)the)decline)in)market)liquidity)by)further)increasing)funding)constraints)and)position)margins,)which)lead)to)a)selfCenforcing)downward)liquidity)spiral.)Ibbotson)(1999))finds)that)security)brokers)and)speculators)have)betas)exceeding)one,)and)this)helps)to)explain)why)capital)constraints)are)more)likely)to)be)hit)and)liquidity)is)more)likely)to)dry)up)during)periods)of)market)decline.)For)portfolios)that)rebalance)frequently)a)large)liquidity)buffer)is)needed,)as)the)portfolio)must)be)updated)constantly.)Furthermore,)rebalancing)is)often)most)needed)when)liquidity)conditions)are)poor,)so)a)sufficient)liquidity)buffer)is)extremely)important,)especially)in)the)years)where)funding)liquidity)is)low.)Acharya)and)Pedersen)(2005))discover)a)premium)for)holding)stocks)that)become)illiquid)when)the)market)becomes)illiquid.)Additionally,)they)find)that)investors)are)willing)to)pay)a)premium)for)stocks)that)stay)liquid)despite)a)decline)in)market)returns.)This)is)relevant)for)pairs)trading,)because)the)pairs)trader)sells)stocks)that)perform)relatively)well)and)buy)the)stocks)that)yield)relatively)poor)returns.)Consequently,)in)periods)of)market)decline)the)pairs)trader)can)earn)a)liquidity)premium,)because)he)ends)up)selling)liquid)stocks)at)a)premium)and)buys)illiquid)stocks)at)a)discount,)when)other)investors)run)towards)liquid)assets.)The)downside)is)that)these)stocks)can)experience)further)depreciation)in)value)and)incur)high)transaction)costs.))

) 28)
4.1.3. Short,squeeze,
The)pairs)trading)manager)has)a)large)amount)of)short)positions)and)can)suffer)large)losses)if)one)of)the)short)positions)experiences)a)short)squeeze.)A)short)squeeze)occurs)when)the)supply)for)a)stock)is)limited)and)there)is)excessive)demand.)The)excessive)demand)will)push)prices)up,)and)the)probability)that)investors)with)short)positions)are)forced)to)liquidate)are)greatly)increased)as)they)get)larger)and)larger)margin)calls.)Since)a)pair)trader)is)typically)leveraged)this)is)definitely)a)possible)scenario)for)the)pairs)trader.)A)short)squeeze)typically)happens)to)small)cap)stocks,)but)one)of)the)most)famous)examples)of)a)short)squeeze)happened)to)one)of)the)world’s)largest)car)manufacturers.)As)illustrated)below)(Figure)3),)Volkswagen)almost)fiveCdoubled)its)stock)price)within)two)days)during)October)2008.)))Figure!3!
)At)the)end)of)the)October)2008,)several)hedge)funds)was)forced)to)liquidate)their)short)positions)in)the)Volkswagen)share)after)they)learned)that)Porsche,)the)car)manufacturer,)had)a)stake)of)more)than)75%)in)Volkswagen.)The)proportion)of)shares)owned)by)Porsche)accounted)for)almost)every)single)circulating)stock)in)the)market,)and)after)it)was)public)information,)Porsche)could)demand)whatever)price)they)wanted)to)sell)Volkswagen)stocks)to)the)unfortunate)hedge)funds.)The)funds)suffered)losses)amounting)to)several)billion)Euros,)and)illustrate)the)crucial)consequences)of)being)caught)in)a)short)squeeze)(Krstic)2009).))
0)
5000)
10000)
15000)
20000)
25000)
30000)
35000)
1/1/08) 2/1/08) 3/1/08) 4/1/08) 5/1/08) 6/1/08) 7/1/08) 8/1/08) 9/1/08) 10/1/08) 11/1/08) 12/1/08)
Volkswagen!Short!Squeeze!
VW)C)Total)Return)Index)

) 29)
4.1.4. Model,risk,
Model)risk)is)the)risk)that)our)model)is)not)performing)the)task)that)it)is)built)for.)In)our)case,)this)would)be)the)risk)that)the)parameters)used)and)the)model)we)built)is)not)able)to)identify)pairs)that)move)together)in)the)future.)A)typical)explanation)could)be)that)our)model)is)based)on)the)wrong)assumptions.)For)instance,)that)we)should)have)used)a)longer)formation)period,)because)12)months)is)simply)too)short)a)time)to)identify)coCmovement)between)stocks,)or)that)our)trading)period)is)so)short)that)the)pairs)do)not)get)sufficient)time)to)converge.)Another)source)of)model)risk)would)be)that)the)zero)crossing)or)the)minimum)distance)parameters)are)unable)to)identify)profitable)pairs.)We)have)no)guarantee)that)the)information)inserted)in)the)trading)model,)in)our)case)the)pair)identifying)metrics,)are)informative)factors)for)future)returns.)There)might)be)other)metrics)that)are)much)better)at)identifying)pairs,)but)are)yet)to)be)discovered.)The)pair)pictured)in)the)graph)below,)incur)a)loss,)even)though)it)looks)promising)in)the)formation)period.)The)divergence)between)the)prices)in)the)trading)period)(starting)01.01.2003))shows)that)our)ability)to)identify)pairs)that)move)together)is)by)no)means)perfect.))Figure!4!
)All)models)that)predict)future)outcomes)are)subject)to)uncertainty,)so)past)success)is)no)guarantee)for)future)success.)Our)model,)presented)in)section)5,)is)for)instance)not)able)to)foresee)bankruptcies,)takeovers)or)bailouts,)and)these)are)one)of)the)most)important)contributors)to)negative)returns)in)our)portfolio.))!
0.3)0.5)0.7)0.9)1.1)1.3)
Diverging!pair!
Deutsche)Post) TUI)

) 30)
4.2. Sources,of,return,
Pairs)trading)has)been)profitable)over)a)long)period)of)time,)but)researchers)have)so)far)been)unable)to)fully)explain)why.)One)of)the)most)common)explanations)of)why)two)stocks)move)together)is)based)on)arbitrage)pricing)theory,)and)the)idea)that)the)two)stocks)are)correlated)to)the)same)risk)factors)(Vidyamurthy)2004).)So)even)if)companies)operate)in)different)industries,)they)still)have)similar)risk)exposures)and)should)move)closely)together.)If)we)accept)the)explanation)of)the)arbitrage)pricing)theory,)how)can)the)return)of)the)stocks)with)the)same)factor)exposure)deviate?)A)natural)explanation)would)be)that)for)a)single)pair)you)still)have)firmCspecific)risk)for)each)stock)that)can)lead)to)divergence)between)the)stocks)in)a)pair.)Another)explanation)we)cannot)rule)completely)out)is)that)the)market)is)slightly)inefficient)and)pairs)trading)exploits)arbitrage)opportunities)present)in)the)market.)In)this)subsection)we)try)to)give)the)reader)an)insight)into)potential)factors)that)drive)returns)for)pairs)trading.)In)the)empirical)part)of)the)thesis)we)will)perform)regression)analyses)to)try)to)identify)sources)of)return)for)the)pairs)trading)portfolio,)but)for)now)we)will)only)explain)theoretical)reasons)for)why)pairs)trading)might)be)profitable.))Even)if)financial)theory)about)efficient)capital)markets)claims)idiosyncratic)(or)unsystematic))risk)should)not)be)compensated)by)higher)expected)returns,)it)can)help)explain)why)pairs)trading)profits)are)not)arbitraged)away)immediately.)Shleifer)and)Vishny)(1997))argue)that)arbitrageurs)bear)unsystematic)risk,)and)are)therefore)not)willing)to)arbitrage)away)the)profit)in)arbitrage)strategies)before)the)expected)return)is)high)enough)relative)to)the)actual)risk)they)face.)Furthermore,)Mitchell,)Pulvino)and)Stafford)(2002))investigate)the)mystery)of)negative)stub)values)and)state)that)investors)must)incur)large)costs)to)find)out)more)about)the)economic)uncertainty)of)the)mispricing.)Therefore,)investors)require)compensation)for)these)costs)before)they)are)willing)correct)the)prices.)In)todays)market)environment)costs)can)include)expensive)software)or)IT)equipment,)and)the)cost)of)implementation)for)these)strategies)might)be)so)large)that)only)the)largest)institutional)investors)have)the)financial)means)to)exploit)these)opportunities.)The)same)phenomenon)is)also)mentioned)by)Merton)(1987),)and)support)the)claim)that)an)arbitrage)strategy)requires)specialization,)which)causes)the)portfolio)to)be)less)diversified)and)subject)to)idiosyncratic)risk.)This)is)particularly)relevant)for)pairs)trading)as)it)can)be)very)difficult)to)find)a)sufficient)amount)of)high)quality)pairs)to)make)the)portfolio)well)diversified.)Consequently,)a)fraction)of)our)returns)can)be)

) 31)
compensation)for)incurring)idiosyncratic)risk.)Abreu)and)Brunnermeier)(2002))further)suggest)that)arbitrageurs)are)unsure)when)other)market)participants)enter)to)correct)the)arbitrage,)which)makes)them)hesitant)to)correct)mispricing.)Hence)the)uncertainty)related)to)the)behavior)of)other)arbitrageurs)impedes)the)market)forces)from)correcting)deviations)from)fundamental)values.)The)consequence)is)that)prices)diverge)more)than)we)might)expect,)according)to)the)efficient)market)hypothesis,)and)this)can)lead)to)abnormal)returns.)All)these)arguments)are)difficult)to)prove)by)regression,)but)can)be)seen)as)plausible)explanations)for)average)excess)returns)from)arbitrage)strategies)and)pairs)trading.)Acharya)and)Pedersen’s)(2005))modified)CAPM)model)take)into)account)investors’)required)compensation)for)liquidity)risk,)and)given)that)pairs)trading)is)a)liquidity)providing)strategy)it)might)be)able)to)explain)parts)of)the)return)from)pairs)trading.)Even)if)it)looks)like)pairs)trading)generates)positive)alpha))(Gatev,)Goetzmann,)and)Rouwenhorst)2006),)it)can)actually)just)be)a)consequence)of)exposure)to)liquidity)risk.)The)liquidity)risk)can)be)either)market)or)funding)liquidity,)but)also)a)result)of)shocks)in)the)liquidity)of)an)individual)stock,)as)the)effect)explained)by)Engelberg,)Gao,)and)Jagannathan)(2008).)As)earlier)mentioned,)Gatev,)Goetzmann)and)Rouwenhorst)(2006))suggest)that)excess)returns)within)pairs)trading)might)be)compensation)for)the)arbitrageur)to)enforce)the)LoOP,)and)the)existence)of)an)arbitrage)opportunity)could)be)explained)by)temporary)deviations)from)the)LoOP,)in)accordance)with)delayed)reactions)to)common)factors)or)overreaction)to)firmCspecific)news)suggested)by)Jegadeesh)and)Titman)(1995).)))
5. Constructing,a,pairs,trading,portfolio,The)implementation)of)a)pairs)trading)portfolio)requires)the)arbitrageur)to)carefully)construct)a)portfolio)with)“wellCmatched”)pairs.)In)the)pair)selection)process,)several)factors)must)be)taken)into)account,)to)make)the)trading)scheme)as)efficient)and)realistic)as)possible.)The)investor)must)screen)the)available)data)to)avoid)excessive)transaction)costs)or)a)situation)where)he)is)unable)to)trade)a)stock.)The)screening)tools)used)to)exclude)stocks)and)the)measures)to)identify)pairs)are)important)ingredients)in)the)recipe)for)a)successful)pairs)trading)strategy.)We)will)give)a)brief)overview)of)how)the)screening)and)pair)matching)

) 32)
process)are)typically)performed,)and)provide)a)detailed)description)of)the)construction)of)our)own)portfolio.))Figure!5!
!
!!
!
Figure)5.)The)above)figure)shows)the)pair)construction)process.)The)initial)sample)is)screened)before)pairs)are)formed.)Subsequently)the)pairs)trader)establish)formal)rules)before)he)performs)a)backtest)to)evaluate)the)profit)potential)of)the)portfolio))
5.1. Screening,our,data/stocks,
The)essence)of)the)pair)selection)process)is)to)identify)the)pairs)we)expect)to)be)most)profitable,)but)what)is)equally)important)is)that)the)trades)we)suggest)are)actually)possible)to)do)and)have)reasonable)transaction)costs.)To)fulfill)this)requirement)stocks)are)required)to)have)several)properties)that)make)them)eligible)for)pairs)trading,)and)the)screening)process)is)instrumental)to)make)the)paper)portfolio)as)similar)as)possible)to)an)actual)pairs)trading)portfolio.))
)
5.1.1. Market,capitalization,
The)market)capitalization)of)a)company)can)be)a)good)indicator)for)how)liquid)the)stocks)are)and)how)easy)it)is)to)trade)them.)To)minimize)our)transaction)costs)in)terms)of)the)bidCask)spread)and)market)impact,)it)is)crucial)that)the)stocks)we)trade)are)relatively)liquid.)Trading)in)illiquid)stocks)result)in)higher)bidCask)spreads,)which)will)seriously)depress)the)postCtransaction)costs)returns.)It)is)instrumental)for)the)success)of)the)strategy)that)the)investor)can)buy)or)sell)positions)at)any)point)in)time)when)markets)are)open,)so)the)investor)can)act)in)accordance)with)the)trading)signals.)Therefore)there)should)be)a)certain)required)level)of)liquidity)in)the)stocks)to)create)a)realistic)paper)portfolio.))To)improve)the)probability)that)most)of)the)stocks)in)our)sample)are)liquid)we)exclude)all)stocks)that)have)a)yearCend)market)cap)below)1)billion)Euros)in)the)formation)period.)Firms)with)market)cap)equal)to)1)billion)Euros)are)usually)considered)the)upper)half)of)small)cap)

) 33)
stocks)3,)so)it)should)remove)the)smallest)stocks)in)our)initial)sample.)There)is)also)a)correlation)between)market)capitalization)and)liquidity)in)stocks)(Ehrman)2006,)44),)so)an)exclusion)of)the)stocks)with)low)market)capitalization)will)give)us)a)more)liquid)sample)to)work)with.)In)the)portfolios)traded)each)year,)we)use)the)firms’)market)capitalization)at)the)end)of)the)previous)year)to)screen)the)stocks.)Hedge)Funds)that)engage)in)pairs)trading)or)similar)trading)strategies)want)to)minimize)the)bidCask)spread)and)market)impact.)Large)buy)or)sell)orders)in)smaller)companies)will)incur)high)transaction)costs,)so)the)exclusion)of)lower)market)cap)stocks)greatly)decreases)probability)of)high)market)impact.)In)addition,)illiquid)stocks)become)much)harder)to)sell)when)markets)decline)and)this)is)especially)valid)for)larger)positions)in)smaller)companies,)thus)by)excluding)the)smallest)companies)we)minimize)the)risk)of)taking)positions)that)will)become)impossible)to)sell)during)financial)downturns.)Do)and)Faff)(2012))demonstrate)that)pairs)trading)is)vulnerable)to)relatively)high)transaction)costs.)In)addition,)firms)with)very)low)market)capitalization)are)more)likely)to)be)difficult)to)short)sell)or)may)have)short)selling)restrictions)(D'Avolio)2002).)On)the)other)hand,)there)is)a)downside)to)a)high)market)cap)threshold,)as)it)greatly)reduces)the)number)of)stocks)we)can)use)to)construct)pairs.)A)sufficient)number)of)stocks)in)the)sample)is)important)both)to)ensure)the)quality)of)the)individual)pairs)and)to)create)a)wellCdiversified)portfolio.)))
5.1.2. Liquidity,in,prices,
Even)if)illiquid)stocks)have)the)potential)to)perform)well)preCtransaction)costs,)it)is)usually)an)unrealistic)assumption)that)we)can)trade)at)the)observed)prices)for)these)stocks.)After)we)exclude)the)stocks)with)low)market)capitalization,)we)make)further)adjustments)to)the)sample)before)we)start)trading.))
Table,1,
Return'Index'
Date' PILKINGTON' ADIDAS'
1/1/02' 634.81' 225.9'
1/2/02' 638.45' 227.25'
1/3/02' 634.81' 226.98'
1/4/02' 634.81' 225.9'
1/7/02' 634.81' 222.51'
))))))))))))))))))))))))))))))))))))))))))))))))))))))))3)Small)cap)stocks)are)those)with)a)market)capitalization)less)than)$)2)Billion.)http://www.investopedia.com/terms/m/marketcapitalization.asp)

) 34)
To)ensure)that)our)trading)is)realistic,)we)exclude)stocks)that)trade)at)the)same)price)three)trading)days)in)a)row.)In)Table)1)above,)we)see)that)Pilkington)will)be)excluded)from)the)sample)of)stocks,)as)it)does)not)meet)our)required)level)of)liquidity.)The)probability)of)closing)at)the)same)price)three)days)in)a)row)is)very)small)for)liquid)stocks,)thus)it)should)be)a)good)proxy)for)our)ability)to)trade)at)the)observed)prices.)A)potential)risk)is,)however,)that)stocks)suddenly)become)illiquid)in)the)trading)period.)Since)it)is)impossible)to)foresee)if)a)given)stock)experiences)a)severe)decline)in)liquidity)during)the)trading)period,)our)strategy)is)not)able)to)take)this)risk)into)account.)))An)alternative)and)more)common)way)to)sort)out)illiquid)stocks,)is)to)look)at)daily)trading)volume)(Ehrman)2006,)44).)This)is)the)method)used)by)Gatev,)Goetzmann)and)Rouwenhorst)(2006),)who)exclude)stocks)not)traded)during)one)or)more)trading)days.)It)can)be)argued)to)be)slightly)more)accurate,)since)actual)trading)volumes)are)observed)for)each)stock.)However,)our)screening)criterion)is)stricter,)since)trading)volumes)may)be)small,)but)higher)than)zero)for)illiquid)stocks.)If)stocks)are)screened)by)volume,)illiquid)stocks)can)be)included)in)the)sample,)but)we)require)that)there)must)be)actual)impact)on)the)price.))
5.1.3. Short,sale,restrictions,and,short,sale,constraints,
Another)important)aspect)to)take)into)account)is)restrictions)and)constraints)on)short)selling.)If)you)engage)in)pairs)trading,)you)are)by)definition)short)one)stock)if)you)are)long)another,)so)it)is)important)that)we)are)actually)able)to)short)the)desired)stock)at)any)given)time.)The)profitability)of)the)strategy)is)also)dependent)on)reasonable)short)lending)fees)and)limited)transaction)costs.)Hence)it)is)crucial)to)keep)track)of)the)short)selling)capacity)of)the)different)stocks4.)Another)risk)of)short)selling)is)that)companies)can)initiate)specific)actions)that)will)lead)to)short)selling)constraints)or)create)buying)pressure)that)will)inflate)the)stock)price.)Examples)are)typically)stock)splits)or)similar)actions)that)will)force)short)sellers)to)return)their)shares)to)the)company)to)get)new)shares)distributed.)Some)European)countries)banned)short)selling)in)August)2011)and)the)Securities)and)Exchange)Commission)did)the)same)in)United)States)in)2008)(Eichler)2011).)Naked)short)selling)was)banned)in)Germany)following)the)financial)crisis)(Crawford)2010),)but)normal)short)selling)never)was,)and)it)does)not)seem)))))))))))))))))))))))))))))))))))))))))))))))))))))))))4)Brokerage)houses)can)provide)lists)of)companies)that)are)difficult)to)short)sell)(Ehrman)2006,)44).)Such)lists)are)mostly)given)to)larger)investors)and)are)difficult)for)us)to)obtain)

) 35)
to)be)an)immediate)danger)that)it)will)happen)in)the)near)future)either.)Consequently)we)feel)confident)that)the)German)market)is)exempt)from)such)biases)or)have)any)other)constraints)regarding)short)selling)that)might)affect)our)research.)))
5.1.4. Corporate,actions,,
Corporate)actions)can)create)uncertainty)for)the)pairs)trading)portfolio,)and)represents)a)threat)to)the)arbitrage)profit.)All)stocks)that)are)unlisted,)subject)to)takeovers)or)mergerCrelated)corporate)actions)in)the)formation)period)is)automatically)excluded)by)the)threeCday)price)rule.)A)discretionary)approach)can)be)used)to)further)minimize)the)consequences)of)corporate)actions.)In)the)trading)period)the)manager)can)look)at)news)for)the)different)securities)and)find)out)if)a)given)company)is)a)potential)acquisition)target,)or)is)considering)a)delisting)or)an)equity)issue)that)will)affect)the)price)substantially.)Corporate)actions)in)the)trading)period)are)difficult)to)directly)incorporate)into)a)quantitative)financial)algorithm,)but)we)instantly)exit)all)pairs)where)one)of)the)stocks)in)pair)is)subject)to)a)corporate)action,)i.e.)a)takeover)or)a)delisting.)A)potential)risk)is)that)the)corporate)action)happens)when)the)stocks)in)a)pair)are)very)far)apart.)A)likely)scenario)is)that)rumors)of)for)instance)a)merger,)move)one)of)the)stocks)in)a)pair)long)before)the)actual)merger)happens,)so)when)we)exit)the)trade)prices)has)already)diverged)substantially)and)resulted)in)a)loss)for)the)portfolio.)This)is)connected)to)fundamental)risk)we)discussed)earlier.!!!
5.2. Pair,Formation,
After)we)have)screened)out)the)illiquid)stocks,)our)sample)should)consist)of)stocks)suitable)for)pairs)trading.)Then)we)look)at)past)data)to)find)matching)pairs)in)terms)of)stock)price)development,)so)we)can)trade)on)their)relationship.)The)problem)is)that)the)development)of)stock)prices)can)be)hard)to)compare)between)stocks,)so)we)need)to)normalize)the.))
5.2.1. Normalization,of,prices,
Nominal)stock)prices)are)different)depending)on)market)capitalization)and)how)many)stocks)firms)have)outstanding.)This)makes)it)hard)to)compare)development)in)returns.)In)addition,)stock)price)returns)do)not)reflect)the)actual)return)for)investors,)since)they)do)not)take)into)

) 36)
account)stock)splits,)dividends,)share)repurchases)or)other)corporate)actions.)Total)return)indices)are)better)to)use,)as)these)time)series)adjust)for)all)the)events)that)lead)to)a)difference)between)the)development)of)the)stock)price)and)the)actual)investor)return)for)a)given)asset.)For)instance,)a)cash)dividend)makes)the)stock)price)fall)on)the)exCdividend)date,)but)the)reduction)in)the)stock)price)just)reflects)the)cash)paid)out)to)the)shareholders)on)the)dividend)day)(ceteris)paribus),)and)is)a)return)for)the)investor.)Previous)literature)use)different)approaches)to)normalize)prices)so)that)the)price)development)of)the)individual)securities)can)be)compared.)Gatev,)Goetzmann)and)Rouwenhorst)(2006))normalize)the)value)of)the)stocks’)total)return)indices)to)one)the)first)day)of)the)formation)period)and)express)the)development)of)a)stock)as)total)return)series,)and)this)is)the)approach)used)by)most)of)the)previous)literature.)By)setting)prices)to)one)for)each)stock)at)the)same)time,)the)development)of)different)stock)returns)are)easily)compared.)))Another)approach)used)to)normalize)prices)for)the)same)purpose,)expresses)price)development)similar)to)a)normal)distribution)(Nath)2003).))
!"#$!"#$%&!!"#$%! =!! − !!(!!)
)
)In)this)case)the)normalized)price)time)series)is)the)difference)between)the)current)price! !! )and)the)average)price)of)the)whole)formation)period) ! ,)divided)by)the)standard)deviation)of)the)price)in)the)formation)period) !(!!) .)The)expected)normalized)price)is)equal)to)zero)and)when)the)price)is)far)from)zero,)it)is)interpreted)as)being)different)from)the)normal)price)level.)If)the)price)is)negative,)the)spread)is)expected)to)increase)and)if)it)is)positive,)it)is)expected)to)decrease.)The)normalized)prices)are)used)in)the)same)way)as)before)and)stocks)are)matched)into)pairs)based)on)the)coCmovement)of)the)normalized)price.)If)both)prices)are)either)positive)or)negative,)then)the)spread)between)them)is)quite)small.)On)the)other)hand,)if)the)spread)between)two)stocks)in)a)pair)differs)significantly)from)zero,)they)are)probably)not)the)best)fit)as)a)pair.)The)intuition)is)the)same)as)before.)The)manager)expects)the)price)relationship)to)mean)revert)to)“normal”)for)the)pairs)we)identify)as)good)pairs)and)earn)a)profit.)The)approach)adjusts)for)standard)deviation,)which)means)that)a)relatively)high)price)level)for)a)volatile)stock)will)be)adjusted)downwards)compared)to)a)less)volatile)stock.))

) 37)
)We)use)the)firstCmentioned)method)to)normalize)prices,)because)it)gives)a)more)intuitive)connection)between)the)price)development)and)the)generation)of)returns,)and)by)using)this)technique)we)can)easily)observe)when)our)pairs)open)and)close,)and)when)they)make)a)profit)or)a)loss.)We)gather)data)for)the)Total)Return)Index)from)Datastream,)where)all)cumulative)return)series)start)at)100)when)stocks)are)listed,)so)our)returns)are)independent)of)both)market)capitalization)and)number)of)stocks.)They)are)instead)dependent)on)when)stocks)are)listed)and)the)historical)development.)Therefore)to)make)the)cumulative)return)series)comparable,)we)set)the)closing)price)the)first)day)of)the)formation)period)to)1.)By)looking)at)the)relationship)between)the)stocks)in)the)formation)period,)we)can)identify)stocks)that)react)similarly)to)market)news)and)changes)in)the)general)economic)environment.)Our)normalized)price)time)series)can)be)interpreted)as)a)cumulative)return)on)1)Euro)as)shown)in)the)below)equation:)
!"#$%&!"#$!!"#$%!! = !!! = 1 ∗ 1+ !!!!
!!!)
!!! = 0!!!!!!!!!!!! = 1))Below)you)see)two)charts,)where)the)first)shows)the)nominal)Total)Return)Series)for)the)two)stocks,)Metro)and)Siemens,)and)the)second)shows)the)total)return)development)after)the)time)series)are)normalized.)The)convenience)of)normalizing)the)prices)before)comparing)the)two)return)series)can)be)easily)observed)from)the)two)graphs.) )!
Figure!6!
)
0)
500)
1000)
1500)
2000)
2500)
1/1/02) 2/1/02) 3/1/02) 4/1/02) 5/1/02) 6/1/02) 7/1/02) 8/1/02) 9/1/02) 10/1/02) 11/1/02) 12/1/02)
a.!Total!Return!Index!(preXnormalization)!
METRO) SIEMENS)

) 38)
)Moving)on,)we)look)at)the)spread)between)the)developments)of)the)two)stock)returns,)defined)as)the)nominal)difference)between)the)normalized)prices.)))
!"#$%&!!,! = !!! − !!! ))The)stocks)that)move)closely)together)are)hypothesized)to)be)good)pairs)in)the)trading)portfolio,)so)if)the)normalized)prices)suddenly)diverge,)we)expect)them)to)converge)back)to)the)expected)value.)The)upcoming)section)will)explain)how)we)identify)pairs)that)are)expected)to)move)together.))
5.2.2. The,formation,period,
The)time)frame)of)the)relationship)we)try)to)capture)between)two)stocks)is)limited.)We)need)to)make)a)decision)regarding)the)time)frame)of)the)formation)period,)and)this)is)an)integral)part)of)the)pair)identification)process.)Previous)literature)set)the)formation)period)to)12)months)(Gatev,)Goetzmann,)and)Rouwenhorst)2006;)Do)and)Faff)2010),)and)we)have)chosen)to)stick)to)the)same)length.)As)far)as)the)authors)of)this)thesis)know,)different)formation)periods)have)not)been)discussed)or)tested)in)academia.)Our)intuition)is)that)stocks)that)follow)each)other)closely)for)twelve)months)have)had)the)same)reaction)to)a)series)of)news)and)market)events,)and)that)there)must)be)new)substantial)events)or)firmCspecific)changes)for)the)coCmovement)to)dissolve)in)the)trading)period,)after)the)coCmovement)has)shown)itself)to)be)robust)through)12)months.)A)shorter)formation)period)increases)the)probability)that)pairs)“accidentally”)fit)well,)and)that)stocks)in)a)pair)deviate)and)never)converge)during)the)trading)period.)In)other)words,)a)shorter)formation)period)makes)it)more)likely)that)we)mistake)a)
0.3)0.4)0.5)0.6)0.7)0.8)0.9)1)
1.1)
1/1/02) 2/1/02) 3/1/02) 4/1/02) 5/1/02) 6/1/02) 7/1/02) 8/1/02) 9/1/02) 10/1/02) 11/1/02) 12/1/02)
b.!Normalized!prices!
METRO) SIEMENS)

) 39)
random)fit)for)a)longer)lasting)relationship.)A)longer)formation)period)will)increase)the)probability)that)paired)stocks)follow)each)other)for)a)long)period,)but)there)is)an)increasing)chance)that)the)information)and)observations)obtained)from)the)formation)period)becomes)outdated,)and)that)the)two)firms)sensitivity)to)different)underlying)factors)have)changed.)This)can)for)instance)be)due)to)changes)in)a)company’s)structure)after)an)acquisition)of)a)company)in)another)industry)or)a)spinCoff)of)a)smaller)part)of)the)company.))At)the)same)time)we)need)a)sufficient)amount)of)data)to)identify)a)valid)relationship,)thus)the)formation)period)must)be)of)a)certain)length.)The)oneCyear)formation)period)should)contain)enough)underlying)common)triggers)in)the)stock)prices)to)identify)stocks)that)react)similarly)to)the)majority)of)underlying)drivers)and)economic)factors,)thus)represent)a)suitable)time)frame)to)identify)quality)pairs.)The)next)section)discusses)how)we)actually)pick)the)best)pairs)for)our)portfolio.))
5.2.3. Identification,and,ranking,of,pairs,
After)we)normalize)prices)and)decide)on)the)appropriate)length)of)the)formation)period,)we)use)different)criteria)to)try)to)identify)the)best)pairs)in)our)sample)of)stocks.)The)process)of)pair)identification)is)widely)discussed)in)previous)literature,)and)next)we)will)present)some)of)the)most)successful)and)wellCknown)criteria.)These)pair)identification)tools)are)also)the)ones)we)use)to)identify)pairs)in)our)traded)paper)portfolio.))
5.2.3.1. Squared-minimum-distance-(MD)-
The)sum)of)squared)differences)(SSD))is)one)of)the)most)commonly)used)measures)to)identify)pairs))(Gatev,)Goetzmann,)and)Rouwenhorst)2006).)In)our)own)pairs)trading)portfolio)we)label)this)metric)minimum)distance)(MD).)It)is)based)on)the)daily)spread)in)the)normalized)prices)of)the)two)stocks)in)a)pair,)and)the)difference)is)squared)to)make)all)numbers)positive.)This)is)done)to)avoid)that)the)sum)of)distances)is)arbitrarily)close)to)zero,)something)we)might)risk)if)we)just)add)the)differences)together.)Furthermore,)the)positive)and)negative)changes)will)neutralize)each)other)if)the)differences)are)not)squared)and)create)a)misleading)picture)of)coCmovement.)The)spread)can)be)either)positive)or)negative,)dependent)on)which)stock)is)cheap)and)which)is)expensive.)We)calculate)the)MD)as)follows:)

) 40)
!"!,! = !!! − !!!!
!
!!!)
!)and)!)are)the)two)different)stocks)in)the)same)pair)and)!!!!!"!! )is)the)normalized)price)of)a)stock)at)time)t.)We)take)the)sum)of)the)squared)differences)during)the)whole)formation)period,)where)T)is)the)length)of)the)period.)We)sort)the)pairs)from)the)smallest)to)largest)MD,)where)the)pair)with)the)lowest)score)is)considered)the)best)pair)in)terms)of)how)close)they)move)together.)))Figure!7!
)
)The)drawback)with)this)method)is)that)it)does)not)measure)how)many)times)the)normalized)prices)cross.)The)profitability)of)pairs)trading)is)dependent)on)frequent)divergence)and)convergence)between)the)stocks)in)a)given)pair)and)shifts)between)positive)and)negative)spread)values)is)a)good)indicator)of)this)behavior.)Therefore)a)measure)that)takes)into)account)the)frequency)of)crossings)between)stocks)might)further)enhance)the)profitability)of)the)strategy.)
0.2)
0.4)
0.6)
0.8)
1)
1.2)
1/1/02) 2/1/02) 3/1/02) 4/1/02) 5/1/02) 6/1/02) 7/1/02) 8/1/02) 9/1/02) 10/1/02) 11/1/02) 12/1/02)
a.!High!minimum!distance!
ALLIANZ) DAIMLER)
0.3)0.4)0.5)0.6)0.7)0.8)0.9)1)
1.1)
1/1/02) 2/1/02) 3/1/02) 4/1/02) 5/1/02) 6/1/02) 7/1/02) 8/1/02) 9/1/02) 10/1/02) 11/1/02) 12/1/02)
b.!Low!minimum!distance!
METRO) SIEMENS)

) 41)
)
5.2.3.2. Frequency-of-crossings-(ZC)-
Do)and)Faff)(2010))was)the)first)to)point)out)that)the)profit)in)pairs)trading)was)dependent)on)frequent)crossing)between)prices,)and)formally)introduced)the)zero)crossings)(ZC))measure.)It)measures)the)frequency)of)divergence)and)convergence)between)two)securities,)a)desirable)property)for)pairs)trading.)They)argue)that)it)does)not)matter)if)two)stocks)move)close)to)each)other)if)the)prices)never)cross)and)they)are)actually)traded.)Consequently,)they)rank)pairs)by)the)number)of)times)the)normalized)prices)in)a)pair)cross)each)other)during)the)formation)period,)in)addition)to)the)MD)criterion)introduced)by)Gatev,)Goetzmann)and)Rouwenhorst)(2006).)They)find)that)the)number)of)times)the)normalized)prices)cross)can)work)as)a)good)indicator)for)the)performance)of)a)given)pair.)A)higher)frequency)of)zero)crossings)indicates)a)higher)convergence)and)divergence)frequency,)which)is)the)source)of)profits)in)pairs)trading.)Pairs)with)a)very)low)number)of)zero)crossings)will)probably)not)be)as)profitable,)because)they)do)not)seem)to)have)the)same)tendency)to)repeatedly)return)to)the)equilibrium)price)relationship.)In)addition,)prices)must)cross)for)the)investor)to)exit)a)trade.)To)lock)in)profits)the)investor)is)dependent)on)the)prices)to)cross,)if)not,)they)are)just)exited)at)the)last)trading)day)of)the)period.))Figure!8!
)
0)
0.2)
0.4)
0.6)
0.8)
1)
1.2)
1/1/02) 2/1/02) 3/1/02) 4/1/02) 5/1/02) 6/1/02) 7/1/02) 8/1/02) 9/1/02) 10/1/02) 11/1/02) 12/1/02)
a.!Low!number!of!crossings!(low!ZC)!
BAYER) E)ON)

) 42)
)We)expect)to)find)higher)volatility)in)returns)when)we)sort)pairs)by)ZC,)since)the)strategy)is)focused)on)the)variation)in)normalized)prices,)and)not)the)coCmovement)between)two)stocks.)A)high)frequency)of)zero)crossings)does,)however,)imply)a)certain)degree)of)coCmovement,)since)prices)must)move)closely)together)to)cross)frequently,)even)if)it)is)not)the)main)focus)of)the)metric.))
5.2.3.3. Homogeneity-of-firms-
Another)popularly)used)tool)is)to)restrict)the)stocks)in)a)pair)to)be)from)the)same)industry.)The)two)other)metrics)are)based)purely)on)statistical)relationships,)while)the)homogeneity)requirement)restricts)stocks)in)a)pair)to)be)from)the)same)industry.)Homogeneity)is)usually)measured)by)different)industry)classifications,)and)recent)literature)has)emphasized)that)increasing)homogeneity)of)pairs)should)enhance)the)profitability)of)the)portfolio)(Do)and)Faff)2010).)The)argument)is)that)the)two)stocks)will)have)many)of)the)same)fundamentals)and)are)more)likely)subject)to)many)of)the)same)risk)factors.)The)broad)idea)is)that)homogeneity)between)stocks)should)enhance)the)performance)of)pairs,)because)it)will)makes)it)less)likely)that)the)investor)chooses)pairs)as)a)result)of)pure)statistical)randomness.))In)this)thesis,)we)use)industry)classifications)from)Datastream)and)construct)a)portfolio)with)with)only)sameCindustry)pairs,)in)addition)to)nonCrestricted)portfolios.)Due)to)our)relatively)small)data)sample)some)of)the)industry)classes)are)combined)to)construct)broader)categories)(the)full)overview)is)shown)in)the)appendix)A.1.).)The)two)stocks)within)a)pair)are)expected)to)react)similarly)to)news)and)events)concerning)their)industry)as)well)as)general)macroeconomic)events.)Gatev,)Goetzmann)and)Rouwenhorst)(2006))find)that)utilities)and)the)financial)industry)are)the)two)industries)that)perform)the)best)when)they)trade)restricted)
0)0.2)0.4)0.6)0.8)1)
1.2)
1/1/02) 2/1/02) 3/1/02) 4/1/02) 5/1/02) 6/1/02) 7/1/02) 8/1/02) 9/1/02) 10/1/02) 11/1/02) 12/1/02)
b.!High!number!of!crossings!(high!ZC)!
METRO) SIEMENS)

) 43)
pairs.)Our)data)sample)is)not)large)enough)to)make)portfolios)consisting)of)for)instance)only)pairs)from)the)financial)industry)or)the)utility)sector,)as)this)would)seriously)compromise)the)quality)of)the)pairs.))All)the)aboveCmentioned)techniques)can)easily)be)combined)to)attempt)to)further)enhance)the)performance)of)the)trading)strategy,)and)we)analyze)the)results)for)MD)and)ZC)individually)as)well)as)a)combination)of)the)two)measures)(Total).)This)combined)ranking)is)an)approach)inspired)by)Do)&)Faff)(2010),)and)for)our)combined)approach)we)find)the)100)best)pairs)in)terms)of)MD,)and)form)a)portfolio)of)up)to)30)of)the)best)of)pairs)according)to)the)ZC)criterion.))
6. Trading,Before)a)strategy)is)implemented)the)investment)manager)usually)backtests)the)strategy)on)historical)data.)The)intention)is)to)see)if)the)strategy)was)able)to)earn)satisfactory)returns)in)the)past)as)well)as)evaluate)the)risk)profile)of)the)strategy.)Past)success)does)not)guarantee)that)it)will)be)profitable)in)the)future,)but)it)is)a)necessary)condition)to)even)consider)implementation.)It)is)furthermore)one)of)the)deciding)factors)when)a)portfolio)manager)makes)the)decision)to)invest)or)not.)This)thesis)trades)an)outCofCsample)paper)portfolio)in)the)period)2003C2012,)to)get)an)impression)of)the)profit)potential)of)our)proposed)strategy.)The)outCofCsample)results)will)also)help)us)evaluate)the)length)of)our)trading)period)(six)versus)twelve)months))and)the)quality)of)our)pair)identification)metrics.)When)we)compare)different)trading)periods)there)is)a)data)snooping)risk,)as)we)might)end)up)choosing)a)strategy)that)only)performs)well)for)our)limited)stock)sample)and)time)frame.)Therefore)one)should)always)be)careful)to)generalize)results)in)situations)like)this.)Thus)to)conclude)that)a)method)is)good)at)identifying)pairs)or)that)a)threshold)optimizes)entry)or)exit,)results)must)be)consistent)over)longer)periods)of)time,)and)preferably)be)accompanied)by)a)theoretical.)Our)time)frame)is)not)long)enough)to)make)conclusions)about)the)best)general)strategy)and)methods,)but)we)can)give)an)indication)of)what)might)work,)which)can)hopefully)work)as)inspiration)for)future)research.))

) 44)
6.1. InBsample,versus,outBofBsample,trading,
To)report)reliable)returns)for)the)strategy,)it)is)important)to)carefully)consider)what)we)know)and)do)not)know)when)we)start)trading)our)paper)portfolio.)Delistings,)acquisitions,)illiquidity,)bankruptcy)and)other)idiosyncratic)events)are)not)known)preCtrading.)We)report)both)inCsample)and)outCofCsample)trading)performance)so)we)can)evaluate)the)difference)between)the)two.)In)the)inCsample)strategy)pairs)are)identified)using)information)from)the)same)period)as)trades)are)made.)It)is)the)same)as)an)investor)that)executes)the)strategy)with)perfect)hindsight,)hence)will)be)able)to)perfectly)pick)the)best)pairs)in)terms)of)our)pair)identifying)metrics)every)single)period.)The)inCsample)approach)is)highly)unrealistic)for)a)trader,)but)we)can)use)it)to)evaluate)our)outCofCsample)trading.)The)inCsample)trading)profits)can)be)interpreted)as)an)upper)limit)for)the)profit)pool)that)is)achievable)if)we)are)able)to)construct)rules)that)almost)perfectly)identify)stocks)that)move)together.)It)should)be)emphasized)that)the)inCsample)returns)by)no)means)represent)an)obtainable)potential)profit)for)an)actual)pairs)trading)strategy.)Furthermore,)it)is)not)necessarily)the)stocks)that)move)the)closest)or)cross)the)most)times)that)will)generate)the)highest)overall)profit.)In)example,)the)closest)pairs)are)not)necessarily)the)most)profitable,)since)they)may)either)be)so)close)that)they)never)open)a)single)trade)during)the)trading)period,)or)maybe)the)spread)is)not)volatile)enough)to)actually)cover)transaction)costs)(Gatev,)Goetzmann,)and)Rouwenhorst)2006).)The)last)point)requires)further)elaboration.)Why)can’t)we)be)sure)that)profits)will)cover)transaction)costs?)Entry)thresholds)are)set)at)two)times)the)standard)deviation)of)the)spread)in)the)formation)period,)so)pairs)that)move)very)close)will)enter)trades)at)a)very)low)deviation)which)is)not)necessarily)larger)than)the)transaction)costs.)Hence)the)trade)can)never)become)profitable)with)our)chosen)entry)and)exit)rules.)))We)expect)the)outCofCsample)returns)to)be)more)volatile)and)lower)than)the)inCsample)trading)period,)because)we)do)not)expect)our)ability)to)identify)pairs)to)be)anywhere)near)perfect.)The)MD)approach)for)identifying)pairs)will)give)us)the)pairs)with)the)lowest)distance)and)least)volatile)spreads,)so)even)if)the)stocks)are)expected)to)move)together,)we)do)not)expect)them)to)move)as)close)as)they)did)during)the)formation)period.)Before)we)start)trading)we)need)to)define)the)length)of)the)trading)period,)specific)rules)to)determine)when)to)enter)and)exit)trades,)how)to)deal)with)corporate)events)such)as)deClistings)or)takeovers)and)how)to)deal)with)nonCconverging)trades)at)the)end)of)the)trading)period.))
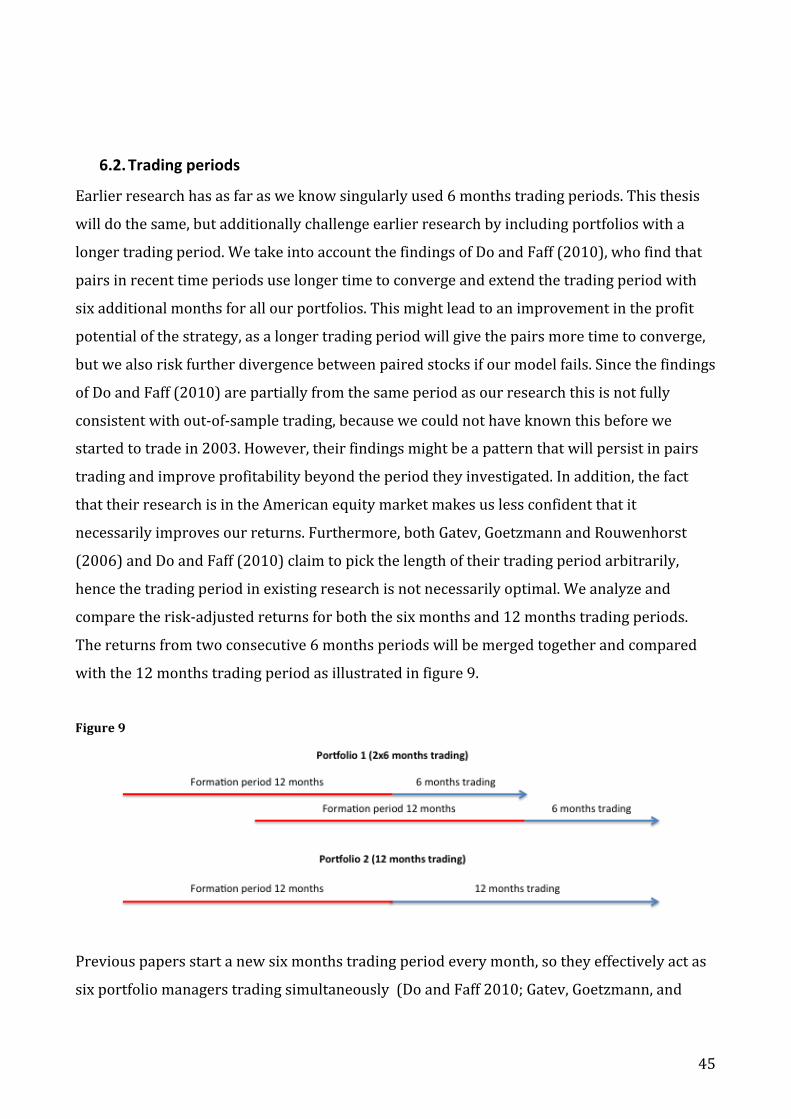
) 45)
)
6.2. Trading,periods,
Earlier)research)has)as)far)as)we)know)singularly)used)6)months)trading)periods.)This)thesis)will)do)the)same,)but)additionally)challenge)earlier)research)by)including)portfolios)with)a)longer)trading)period.)We)take)into)account)the)findings)of)Do)and)Faff)(2010),)who)find)that)pairs)in)recent)time)periods)use)longer)time)to)converge)and)extend)the)trading)period)with)six)additional)months)for)all)our)portfolios.)This)might)lead)to)an)improvement)in)the)profit)potential)of)the)strategy,)as)a)longer)trading)period)will)give)the)pairs)more)time)to)converge,)but)we)also)risk)further)divergence)between)paired)stocks)if)our)model)fails.)Since)the)findings)of)Do)and)Faff)(2010))are)partially)from)the)same)period)as)our)research)this)is)not)fully)consistent)with)outCofCsample)trading,)because)we)could)not)have)known)this)before)we)started)to)trade)in)2003.)However,)their)findings)might)be)a)pattern)that)will)persist)in)pairs)trading)and)improve)profitability)beyond)the)period)they)investigated.)In)addition,)the)fact)that)their)research)is)in)the)American)equity)market)makes)us)less)confident)that)it)necessarily)improves)our)returns.)Furthermore,)both)Gatev,)Goetzmann)and)Rouwenhorst)(2006))and)Do)and)Faff)(2010))claim)to)pick)the)length)of)their)trading)period)arbitrarily,)hence)the)trading)period)in)existing)research)is)not)necessarily)optimal.)We)analyze)and)compare)the)riskCadjusted)returns)for)both)the)six)months)and)12)months)trading)periods.)The)returns)from)two)consecutive)6)months)periods)will)be)merged)together)and)compared)with)the)12)months)trading)period)as)illustrated)in)figure)9.))Figure!9!
))
Previous)papers)start)a)new)six)months)trading)period)every)month,)so)they)effectively)act)as)six)portfolio)managers)trading)simultaneously))(Do)and)Faff)2010;)Gatev,)Goetzmann,)and)

) 46)
Rouwenhorst)2006).)This)thesis)uses)a)nonCoverlapping)approach)and)the)readers)can)consider)our)two)trading)period)approaches)as)two)independent)asset)managers.)The)first)manager)operates)with)twelve)months)trading)periods)in)the)period)01.01.2003C31.12.2012,)while)the)second)operates)with)six)months)trading)periods)during)the)same)time)interval.)To)give)a)more)detailed)explanation,)the)former)manager)starts)a)new)trading)period)every)1st)of)January,)while)the)latter)has)two)trading)periods)per)year,)one)starts)1st)of)January)and)the)other)on)the)1st)of)July.)The)returns)earned)by)Gatev,)Goetzmann)and)Rouwenhorst)(2006))are)the)average)returns)of)six)simultaneously)traded)portfolios,)while)our)returns)are)based)on)a)single)portfolio,)hence)the)overlapping)approach)they)use)is)a)much)better)diversified)than)our)approach.)))
6.3. Position,sizing,
Positions)should)be)sized)according)to)the)sources)of)risk)you)want)to)protect)your)portfolio)against.)Gatev,)Goetzmann)and)Rouwenhorst)(2006))choose)a)1Cdollar)long/short)strategy,)so)the)strategy)has)the)same)monetary)exposure)long)and)short)when)they)open)a)position,)but)they)do)not)rebalance)the)portfolio)during)the)trading)period.)The)first)day)of)our)trading)period)we)also)have)a)monetary)neutral)portfolio,)but)contrary)to)Gatev,)Goetzmann)and)Rouwenhorst)we)rebalance)the)portfolio)every)single)day)to)keep)it)neutral)during)the)trading)period.)A)longer)time)interval)between)each)rebalancing)of)the)portfolio)increases)the)risk)of)an)undesirable)exposure.))If)two)stocks)in)a)pair)move)in)different)directions)during)the)trading)period,)our)portfolio)can)end)up)with)an)exposure)that)is)far)from)market)neutral.)Rebalancing)can)be)interpreted)as)an)insurance)against)a)scenario)where)we)end)up)with)a)significant)exposure.)This)does)not)mean)that)by)rebalancing,)you)are)guaranteed)to)be)market)neutral.)Our)approach)will)be)subject)to)higher)transaction)costs,)but)guarantees)the)same)Euro)exposure)for)our)long)and)short)positions)at)all)times.)Daily)rebalancing)sounds)costly)and)inefficient)since)the)portfolio)will)be)subject)to)significantly)higher)transaction)costs.)However,)we)argue)that)daily)rebalancing)makes)it)more)likely)that)the)portfolio)is)close)to)market)neutral,)so)the)drawback)of)increased)transaction)costs)can)be)offset)by)the)benefit)of)being)less)affected)by)turbulent)periods)in)the)general)market.)Furthermore,)the)bidCask)spread)has)decreased)in)recent)years)(Do)and)Faff)2012))and)made)daily)rebalancing)a)much)cheaper)option.))
) 47)
))
6.4. Trading,rules,
We)use)the)standard)deviation)of)the)spread)from)our)formation)period)as)the)basis)for)our)entry)and)exit)rules,)and)it)is)calculated)in)the)following)way:))
!" !"#$%&!!,! = 1! − 1 !"#$%&!!,! − !"#$%&!,!
!!
!!!)
To)avoid)data)snooping)bias,)we)use)the)same)entry)threshold)as)previous)research,)which)is)two)standard)deviations)of)the)spread)in)the)formation)period.)It)also)makes)it)easier)to)compare)earlier)findings)with)our)own)results.)If)the)spread)between)the)normalized)prices)break)the)standard)deviation)threshold,)we)enter)a)pair)trade)by)short)selling)the)relatively)expensive)stock)and)buying)the)relatively)cheap)stock)in)a)pair.)It)does)not)matter)if)the)spread)is)negative)or)positive,)as)long)as)its)absolute)value)breaks)the)threshold.).)Furthermore,)we)do)not)reset)the)price)to)1)the)first)day)of)the)trading)period)and)if)a)trade)is)open)at)the)end)of)the)formation)period,)we)will)continue)to)hold)that)position)into)the)trading)period)until)it)converge.)Since)we)have)identified)our)pairs)by)using)historical)data,)we)fully)rely)on)information)from)historical)prices)to)earn)abnormal)profits,)so)if)we)make)abnormal)returns)it)can)be)interpreted)as)a)violation)of)weak)market)efficiency)introduced)by)Fama)(1970).))The)decision)to)exit)a)trade)is)quite)important,)as)it)is)a)tradeCoff)between)locking)in)a)profit)and)trying)to)squeeze)out)as)much)profit)as)possible)from)each)trade,)with)the)risk)of)the)trade)suddenly)changes)direction.)Gatev,)Goetzmann)and)Rouwenhorst)(2006))exit)a)trade)when)the)normalized)prices)cross,)and)we)choose)to)follow)the)same)approach,)which)seems)to)be)the)general)method)used)in)previous)research.)Setting)the)exit)threshold)to)where)the)spread)equals)to)zero)also)make)sense,)since)it)should)be)equally)probable)to)see)the)spread)below)as)well)as)above)zero,)if)we)have)faith)in)the)constructed)trading)model.)The)stocks)in)a)pair)are)hypothesized)to)be)subject)to)the)same)underlying)economic)factors,)therefore)it)should)be)reasonable)to)assume)that)they)also)have)similar)betas)on)average,)and)that)the)portfolio)is)close)to)market)neutral.)The)expected)value)of)the)spread)is)zero)or)close)to)zero,)since)we)

) 48)
pick)the)pairs)with)the)lowest)MD)and)expect)them)to)follow)each)other.)All)trades)held)at)the)last)day)of)the)trading)period)will)be)exited)at)the)end)of)day)closing)prices,)independent)of)the)current)standing)of)the)trades.)))Figure!10!
)The)figure)shows)the)different)trading)rules)in)terms)of)thresholds)for)when)we)open)and)close)the)pair)trades)as)well)as)when)we)are)forced)to)exit)the)pair)trade)if)it)is)open)on)the)last)trading)day)of)our)sample.)The)spread)(Spread))is)the)difference)between)the)normalized)prices)between)a)pair)of)stocks.)The)entry)threshold)(Open))are)defined)as)two)standard)deviations)of)the)spread)in)the)formation)period)for)this)
pair)and)the)exit)threshold)is)where)the)spread)is)equal)to)zero)(Close).))If)one)stock)in)a)pair)is)acquired)or)delisted,)we)close)the)pair)at)the)day)after)the)stock)is)unlisted,)since)we)want)to)avoid)that)the)spread)is)solely)dependent)on)one)stock.)If)only)one)stock)in)a)pair)is)traded,)the)pair)is)not)a)Euro)neutral)pair.)In)addition)it)will)have)significant)beta)exposure)because)the)position)is)either)net)long)or)short,)hence)the)beta)of)the)single)stock)position)will)be)the)net)beta)of)the)pair.)))It)is)not)necessarily)correct)to)assume)that)you)can)trade)on)a)stock’s)closing)price)the)same)day)you)get)the)trading)signal.)Earlier)academic)papers)on)pairs)trading)includes)oneCday)delay)between)the)day)of)the)trading)signal)and)the)exercise)of)a)trade)to)adjust)for)the)bidCask)bounce,)but)we)consider)the)inclusion)of)oneCday)delay)trading)as)equally)valuable)to)take)into)account)that)the)investor)might)not)be)able)to)react)instantly)to)the)trading)signal.)Since)closing)prices)are)used,)the)oneCday)delay)trading)charges)the)quoted)price)24)hours)after)the)trading)signal.)In)our)analysis)both)scenarios)are)included,)so)we)have)one)version)of)all)our)
!0.30%
!0.20%
!0.10%
0.00%
0.10%
0.20%
0.30%
0.40%
1/1/03% 2/1/03% 3/1/03% 4/1/03% 5/1/03% 6/1/03% 7/1/03% 8/1/03% 9/1/03% 10/1/03% 11/1/03% 12/1/03%
Trading(rules((Open,(close(and(exit(thresholds)(
Spread% Close% Open%
Open%
Close% Exit%
Open%

) 49)
portfolios)that)trade)with)oneCday)delay)and)another)that)trade)the)same)day)as)the)trading)signal.)The)probability)that)only)the)closing)price)break)the)entry)threshold)during)a)trading)day)is)considered)very)low)by)the)authors)of)this)thesis)and)we)therefore)reason)that)the)same)day)trading)is)the)most)realistic)for)an)active)investor.)Therefore)we)will)mainly)focus)on)these)results,)and)show)the)oneCday)delay)results)in)the)appendix.))
6.5. Return,calculation,
The)actual)calculation)of)the)return)is)relevant,)because)an)inappropriate)calculation)method)can)greatly)bias)our)return)estimates.)In)some)of)the)trading)periods,)not)all)pairs)are)traded)so)they)incur)a)return)of)zero.)The)question)is)if)these)trades)require)any)capital)and)should)be)included)in)the)capital)base)we)use)in)our)return)calculation.)Both)Gatev,)Goetzmann)and)Rouwenhorst)(2006))and)Do)and)Faff)(2010))use)two)different)measures)to)calculate)profits.)They)express)returns)in)terms)of)both)capital)employed)and)committed)capital.)The)first)approach)omits)nonCtraded)pairs.)In)other)words,)only)the)active)positions)are)included)in)the)return)calculation.)If)for)instance)16)out)of)20)pairs)trade)during)the)trading)period,)the)returns)are)calculated)for)the)16)trades)based)on)the)required)capital)of)these)16)positions.)A)more)conservative)estimate)calculates)the)returns)based)on)the)number)of)pairs)in)the)portfolio,)or)the)committed)capital.)The)argument)behind)the)latter)approach)is)that)even)if)you)do)not)trade)the)pair,)you)commit)capital)to)all)the)pairs)in)the)strategy,)so)you)are)able)to)trade)if)a)trading)signal)is)observed.)Both)papers)argue)that)the)latter)approach)is)the)most)conservative,)given)the)argument)that)you)commit)capital)to)all)trades.))We)calculate)our)returns)using)the)committed)capital)approach,)because)nonCtraded)pairs)are)a)seldom)occurrence)in)our)sample)and)we)also)prefer)our)return)estimates)to)be)conservative.)Thus)our)returns)are)calculated)with)the)assumption)that)we)invest)a)dollar)in)every)single)pair.)Our)transaction)costs)are)based)on)estimates)from)previous)literature.)We)subtract)20)bps)for)the)bidCask)spread)in)each)trade)(both)when)we)open,)exit)and)rebalance)a)trade).)The)transaction)cost)estimate)of)20)bps)is)taken)from)Do)and)Faff)(2012).)The)paper)investigates)the)effect)of)transaction)costs)on)pairs)trading)returns)and)provides)conservative)estimates)of)these)costs)within)this)strategy.)They)define)the)20)bps)as)the)average)market)impact)of)a)trade)and)argue)that)the)bidCask)spread)is)only)a)noisy)proxy)for)the)market)

) 50)
impact,)thus)this)estimate)should)cover)both)the)bid)ask)spread)and)the)price)impact)for)a)trade.)It)is)important)to)acknowledge)that)the)market)impact)varies)according)to)the)size)of)a)trade,)the)liquidity)of)the)stock)and)the)market)capitalization)of)the)listed)firm.)In)our)sample)we)expect)the)difference)in)market)impact)to)be)less)important,)because)we)have)screened)our)sample)to)exclude)the)smallest)companies)and)the)most)illiquid)stocks.)Frazzini,)Israel)and)Moskowitz)(working)paper))define)the)market)impact)as)the)change)in)price)before)and)after)a)trade)is)initiated,)and)find)an)average)market)impact)on)small)to)medium)cap)stocks)of)21)bps,)so)we)are)confident)that)our)estimate)should)be)a)fairly)good)approximation)of)transaction)costs.)The)estimate)will)be)termed)the)bidCask)spread)for)the)remainder)of)the)thesis,)but)it)does)not)neglect)the)extra)cost)that)the)trader)can)incur)if)a)trade)moves)the)price.)Additionally,)we)set)commission)to)zero,)as)most)large)investors)pay)approximately)zero)commission,)because)they)are)good)business)for)the)brokers)anyways.)1%)lending)fee)for)the)short)positions)is)subtracted)from)the)preCtransaction)costs)returns,)and)this)estimate)is)also)gathered)from)the)paper)by)Do)and)Faff)(2012).))
7. Empirical,results,
In)this)section)of)the)thesis)we)will)present)the)empirical)results)for)our)different)trading)strategies.)We)start)by)comparing)our)inCsample)and)outCofCsample)trading)returns)with)both)six)and)twelve)months)trading)periods.)Moreover,)we)subtract)the)relevant)transaction)costs,)and)identify)the)best)performing)pairCpicking)strategy.)We)continue)our)analysis)with)the)best)strategy)to)evaluate)its)ability)to)sort)out)profitable)pairs)and)see)if)it)is)possible)to)make)further)improvements)to)increase)the)profitability)of)the)strategy.)To)evaluate)the)ability)to)sort)out)profitable)pairs,)we)compare)our)returns)with)a)portfolio)of)pairs)that)is)ranked)substantially)lower)according)to)our)chosen)metric.)Furthermore,)we)look)at)the)changes)in)performance)when)we)restrict)all)pairs)to)be)from)the)same)industry,)as)this)has)proven)to)be)performance)enhancing)in)previous)research.)The)last)thing)we)do)is)to)look)at)how)pairs)trading)seem)to)vary)in)performance)in)a)crisis)versus)nonCcrisis)environment.)

) 51)
,
7.1. Data,
Previous)research)is)primarily)based)on)US)data,)which)is)easily)accessed)and)can)provide)samples)large)enough)to)yield)robust)results.)The)lack)of)research)on)pairs)trading)outside)the)American)equity)market)creates)a)great)opportunity)for)new)research)to)fill)a)gap)in)the)existing)literature.))We)consider)further)evidence)of)the)performance)of)pairs)trading)in)the)European)markets)an)interesting)case,)especially)in)light)of)recent)events)in)the)Euro)area.)Since)the)majority)of)the)last)recession)was)concentrated)around)the)Euro)area,)we)consider)the)German)market)of)great)interest,)as)Germany)is)the)largest)economy)in)Europe.)Frankfurt)Stock)Exchange)is)among)the)ten)biggest)stock)exchanges)in)the)world5)and)accounts)for)90%)of)the)turnover)in)the)German)market.)It)is)also)among)the)most)liquid)stock)markets)in)the)Euro)Area6,)and)it)is)the)biggest)exchange)in)the)world)where)stocks)are)quoted)in)Euros.)Moreover,)stocks)listed)on)the)Frankfurt)Stock)Exchange)were)undoubtedly)affected)by)both)the)general)market)fluctuations)and)changes)in)the)value)of)the)Euro,)during)the)Euro)crisis.)After)screening)our)data)sample,)we)have)between)80)and)120)stocks)left)for)each)trading)period.)2007,)2008)and)2009)have)fewer)stocks)than)the)other)years)in)our)sample.)This)can)be)explained)by)development)in)the)financial)markets)during)the)subCprime)crisis,)which)forced)more)companies)under)our)$1)billion)dollar)screening)threshold.)))We)have)gathered)most)of)our)time)series)from)Datastream,)more)specifically,)yearCend)market)capitalization)for)Frankfurt)listed)companies,)total)return)series)of)all)stocks)in)our)sample)and)10)year)government)bonds)to)compute)the)risk)free)rate.)Furthermore,)Bloomberg)data)is)used)for)total)return,)volatility)and)volume)measures)for)the)DAX)and)Stoxx)Europe)600)(SXXP))indices)as)well)as)US)and)European)TED)spreads.)For)volatility,)we)use)two)different)measures,)both)the)actual)and)implied)volatility)(VDAX).)Finally,)the)Fama)&)French)factors)and)momentum)return)series)are)gathered)from)the)website)of)Kenneth)French7.))
))))))))))))))))))))))))))))))))))))))))))))))))))))))))5)http://www.worldCexchanges.org/statistics/monthlyCreports)6http://deutscheCboerse.com/dbg/dispatch/en/kir/dbg_nav/about_us/20_FWB_Frankfurt_Stock_Exchange)7)http://mba.tuck.dartmouth.edu/pages/faculty/ken.french/data_library.html#Developed)

) 52)
7.2. PreBtransaction,costs,returns,
We)start)by)looking)at)the)preCtransaction)costs)returns.)For)each)strategy)we)show)the)results)for)all)subCportfolios;)top)30,)top)20,)top)10,)top)5,)top)11C20)and)top)21C30)pairs,)and)the)returns)and)Sharpe)ratios)for)each)year)is)reported)in)the)appendix)(A.3.).)Trading)returns)are)simulated)for)both)sameCday)and)1Cday)delay)trading)as)discussed)earlier.)Our)focus)will)be)on)the)sameCday)returns,)but)the)oneCday)delay)results)are)provided)in)the)appendix)(A.2.)for)average)results)and)A.3.)for)individual)years).)It)should)be)emphasized)that)the)sameCday)results)perform)better)than)the)oneCday)delay)on)average,)and)this)is)in)line)with)our)expectations,)as)the)sameCday)approach)will)let)us)act)more)accurately)on)the)trading)signals.))
Table,2,
6'months'aggregated'trading''
periods'preItransaction'costs' '' '' '' '' ''
Minumum,Distance, Top,30, Top,5, Top,10, Top,20, Top,11B20, Top,21B30, Average,
Excess'return' 5.60%' 3.59%' 6.74%' 6.39%' 6.15%' 4.02%' 5.42%'
SR' 0.79' 0.27' 0.71' 0.80' 0.61' 0.40' 0.60'
Skewness' 0.52' 0.36' 0.62' 0.70' 0.35' 0.23' 0.46'
Kurtosis' 2.95' 6.18' 4.46' 4.48' 3.17' 3.20' 4.07'
T'value'(NW)' 2.65' 0.99' 2.53' 2.75' 2.11' 1.46' 2.08'
beta' 0.05' 0.06' 0.04' 0.05' 0.07' 0.06' 0.06'
'' '' '' '' '' '' '' ''
Zero,Crossing, '' '' '' '' '' ''
Excess'return' 4.41%' 7.05%' 8.34%' 4.26%' 1.02%' 4.61%' 4.95%'
SR' 0.51' 0.45' 0.71' 0.43' 0.08' 0.38' 0.43'
Skewness' 0.21' 0.25' 0.25' 0.24' 0.33' 0.07' 0.23'
Kurtosis' 4.67' 4.17' 4.52' 4.59' 5.08' 5.88' 4.82'
T'value'(NW)' 1.64' 1.64' 2.65' 1.49' 0.26' 1.27' 1.49'
Beta' 0.09' 0.08' 0.08' 0.08' 0.09' 0.11' 0.09'
'' '' '' '' '' '' '' ''
Total,, '' '' '' '' '' '' ''
Excess'return' 6.10%' 9.05%' 7.10%' 6.00%' 4.89%' 6.42%' 6.59%'
SR' 0.77' 0.57' 0.61' 0.67' 0.44' 0.58' 0.61'
Skewness' 0.39' 0.02' 0.05' 0.43' 0.45' 0.41' 0.29'
Kurtosis' 4.40' 3.94' 3.91' 4.63' 6.73' 3.40' 4.50'
T'value'(NW)' 2.71' 2.24' 2.5' 2.53' 1.56' 2.01' 2.26'
Beta' 0.05' 0.02' 0.05' 0.05' 0.04' 0.06' 0.05'
)Excess)returns)are)calculated)by)taking)the)daily)average)return)over)the)sample)period)and)multiplying)by)260)trading)days.)The)standard)deviations)used)to)compute)the)Sharpe)Ratios)(SR))are)the)average)daily)standard)deviations)over)the)period)multiplied)by)the)square)root)of)260)trading)days.)Since)we)are)equally)long)and)short,)our)excess)returns)are)equal)to)our)nominal)returns)without)deducting)the)risk)free)rate.)The)T)values)are)calculated)by)using)the)Newey)West)(NW))standard)errors)where)we)use)30)lags)to)control)for)serial)correlation)in)the)
residuals.)The)beta)value)is)the)market)exposure)calculated)by)using)daily)observations.)

) 53)
Table)2)shows)the)average)6)months)preCtransaction)costs)returns)from)our)three)main)strategies.)Our)trading)strategy)yields)positive)excess)returns)for)all)variations)of)the)strategy,)before)transaction)costs)are)taken)into)account.)The)returns)are)interpreted)as)excess)returns,)because)our)pairs)trading)strategy)has)a)net)monetary)position)of)zero.)In)earlier)parts)of)the)thesis)we)hypothesized)that)our)portfolio)would)be)close)to)market)neutral,)and)to)investigate)if)this)is)a)reasonable)assumption)our)daily)returns)time)series)are)regressed)on)daily)returns)for)the)DAX)index.)The)betas)vary)between)0.02)C0.11,)so)market)neutrality)is)not)a)completely)accurate)assumption,)but)it)should)still)be)reasonable)to)assume)that)our)strategy)is)quite)insensitive)to)general)fluctuations)in)market)returns.)The)fact)that)our)positions)are)adjusted)to)be)Euro)neutral)makes)it)no)surprise)that)the)beta)is)slightly)different)from)zero.)It)is)our)Total)strategy,)a)combination)of)MD)and)ZC,)which)seems)to)perform)the)best)in)terms)of)average)yearly)returns)for)the)different)ranked)portfolios.)The)Total)portfolio)yields)an)average)return)of)6.59%,)which)is)1.17%Cpoints)better)than)the)MD)portfolio)and)1.64%Cpoints)better)than)the)ZC)portfolio.)However,)the)Total)version)of)the)strategy)does)not)outperform)the)two)other)strategies)for)all)portfolio)combinations.)The)top)20)and)top)11C20)ranked)pairs)are)actually)better)for)the)MD)variation)of)the)strategy.)Even)if)there)is)limited)consistency)in)our)results)it)seems)like)Total)is)the)best)performing)strategy)in)terms)of)absolute)returns.))Absolute)performance)is)not)a)good)performance)measure,)as)returns)are)hugely)dependent)on)risk,)so)what)we)actually)care)about)are)the)riskCadjusted)returns.)The)Total)and)MD)portfolios)clearly)outperform)the)ZC)portfolios,)and)have)Sharpe)Ratios)of)0.61)and)0.60,)respectively.)Returns)from)ZC)trading)have)a)higher)volatility,)which)reduces)the)Sharpe)ratio)and)depresses)the)ZC)performance)even)more)relative)to)our)MD)and)Total)portfolios.)This)makes)sense,)since)the)ZC)measure)counts)the)number)of)times)the)normalized)prices)cross)and)not)how)close)they)move.)Consequently,)Total)has)a)higher)standard)deviation)compared)to)MD,)but)lower)than)ZC,)since)Total)is)a)combination)of)MD)and)ZC.)Hence,)for)Total)to)be)a)better)measure)than)MD,)it)must)generate)higher)absolute)returns)to)outweigh)the)higher)standard)deviation)of)the)returns.)The)large)difference)in)average)absolute)return)between)Total)and)MD)almost)disappears)when)we)express)the)performance)in)terms)of)riskCadjusted)return.)On)average)our)tCvalues)are)substantially)lower)than)those)of)Gatev,)Goetzmann)and)Rouwenhorst)(2006))and)Do)and)Faff)(2010).)The)returns)are)positively)skewed)for)all)

) 54)
portfolios,)which)means)that)we)usually)pick)up)returns)(positive)or)negative))around)the)mean,)but)sometimes)experience)extremely)favorable)returns.)We)do)not)see)a)clear)indication)of)an)optimal)number)of)pairs)from)the)6)months)trading)results,)but)it)seems)like)Total)is)the)preferred)sorting)technique.))))Table)3)displays)the)results)from)our)12)months)trading)period.)We)extend)the)trading)period)by)an)additional)6)months)to)take)into)account)that)pairs)might)take)longer)time)to)converge)(Do)and)Faff)2010).))
)Table,3,
12'months'trading'
period'preItransaction'costs'
' ' ' ' ' ' 'Minumum,Distance' Top,30' Top,5' Top,10' Top,20' Top,11B20' Top,21B30' Average'
Excess'return, 6.70%, 11.30%, 7.66%, 7.32%, 6.97%, 5.48%, 7.57%,
SR' 0.82' 0.81' 0.71' 0.78' 0.60' 0.53' 0.71'
Skewness' 0.48' 0.36' 0.70' 0.68' 0.56' I0.11' 0.45'
Kurtosis' 7.21' 14.32' 17.13' 9.87' 6.71' 4.75' 10.00'
T'value'(NW)' 2.88' 3.22' 2.61' 2.94' 2.22' 1.84' 2.62'
beta' 0.07' 0.07' 0.06' 0.08' 0.09' 0.06' 0.07'
' ' ' ' ' ' ' 'Zero,Crossing'
' ' ' ' ' ' 'Excess'return, 6.40%' 11.10%' 8.97%' 8.42%' 8.69%' 2.26%' 7.64%'
SR' 0.74' 0.71' 0.76' 0.85' 0.70' 0.18' 0.66'
Skewness' 0.35' 0.53' 0.33' 0.46' 0.68' 0.26' 0.44'
Kurtosis' 3.80' 5.00' 3.80' 4.60' 6.59' 6.67' 5.08'
T'value'(NW)' 2.39' 2.57' 2.59' 2.91' 2.48' 0.59' 2.26'
Beta' 0.07' 0.05' 0.04' 0.05' 0.07' 0.12' 0.07'
' ' ' ' ' ' ' 'Total'
' ' ' ' ' ' 'Excess'return, 7.35%' 14.45%' 11.32%' 7.29%' 3.25%' 7.47%' 8.52%'
SR' 0.87' 0.87' 0.94' 0.78' 0.27' 0.61' 0.72'
Skewness' 0.55' 0.71' 0.45' 0.29' I0.10' 0.54' 0.41'
Kurtosis' 8.24' 9.11' 5.41' 4.72' 5.32' 6.29' 6.51'
T'value'(NW)' 3.07' 3.07' 3.45' 2.78' 0.95' 2.21' 2.59'
Beta' 0.06' 0.01' 0.04' 0.06' 0.08' 0.07' 0.05'
Excess)returns)are)calculated)by)taking)the)daily)average)return)over)the)sample)period)and)multiplying)by)260)trading)days.)The)standard)deviations)used)to)compute)the)Sharpe)Ratios)(SR))are)the)average)daily)standard)deviations)over)the)period)multiplied)by)the)square)root)of)260)trading)days.)Since)we)are)equally)long)and)short,)our)excess)returns)are)equal)to)our)nominal)returns)without)deducting)the)risk)free)rate.)The)T)values)are)calculated)by)using)the)Newey)West)(NW))standard)errors)where)we)use)30)lags)to)control)for)serial)correlation)in)the)
residuals.)The)beta)value)is)the)market)exposure)calculated)by)using)daily)observations.))
) 55)
The)first)thing)we)notice)is)that)the)average)excess)return)is)higher)for)all)the)three)strategies)compared)to)the)6)months)trading,)consistent)with)the)idea)that)pairs)need)more)time)to)converge.)Furthermore,)the)Sharpe)ratio)is)higher)on)average)for)the)three)strategies.)The)Sharpe)ratio)is)almost)the)same)for)MD)and)Total,)0.71)and)0.72)respectively,)so)our)results)do)not)show)the)same)enhancing)effect)of)the)combination)of)MD)and)ZC)as)that)found)by)Do)and)Faff)(2010).)It)should)however)be)mentioned)that)the)single)subCportfolio)with)the)highest)Sharpe)ratio)is)the)Total)top)10)portfolio,)and)it)is)substantially)better)than)any)of)the)subCportfolios)created)with)the)MD)or)ZC)metrics.)For)all)variations)of)the)strategy,)the)top)30,)top)20,)top)10)and)top)5)portfolios)all)yield)significant)excess)returns)at)the)5%)level)for)12)months)trading.))The)ZC)portfolio)performs)a)lot)better,)versus)the)two)other)main)strategies,)in)the)12)months)trading)compared)to)the)6)months)trading)period.)The)DAX)index)minus)the)risk)free)rate)had)an)average)Sharpe)ratio)of)0.38,)so)before)transaction)costs)our)portfolios)generate)abnormal)riskCadjusted)returns)on)average.)The)Sharpe)ratio)subtracts)the)risk)free)rate)from)returns)earned)by)a)given)strategy,)because)the)risk)free)rate)has)no)risk)and)a)fund)manager)should)not)be)accredited)for)earning)a)risk)free)return.)After)subtracting)the)risk)free)rate)the)risky)component)of)the)DAX)returns)are)isolated,)and)the)time)series)gives)a)much)better)picture)of)the)riskCreturn)trade)off.)That)is)exactly)what)we)are)interested)in)since)we)want)to)compare)the)relative)attractiveness)of)our)strategies)versus)the)DAX)index.)In)our)case)we)use)the)yield)on)10Cyear)German)government)as)the)risk)free)rate.)In)contrast)to)the)index)investment,)our)portfolio)has)a)net)monetary)exposure)of)zero,)because)we)are)equally)invested)long)and)short.)Consequently,)we)do)not)have)to)subtract)the)risk)free)rate)from)our)returns.))When)we)compare)our)trading)returns)with)the)returns)from)inCsample)trading,)reported)in)the)tables)4)and)5,)it)is)obvious)that)our)strategy)is)unable)to)perfectly)identify)the)best)pairs.)Another)interesting)observation)is)that)the)inCsample)trading)has)a)very)low)beta,)and)appears)to)be)almost)perfectly)market)neutral.)This)is)different)from)our)outCofCsample)pairs,)which)have)markedly)higher)beta)exposure.)The)6)months)trading)portfolios)are)also)better)than)the)12)months)on)average,)the)exact)opposite)of)the)result)we)find)in)the)outCofCsample)period.)))))
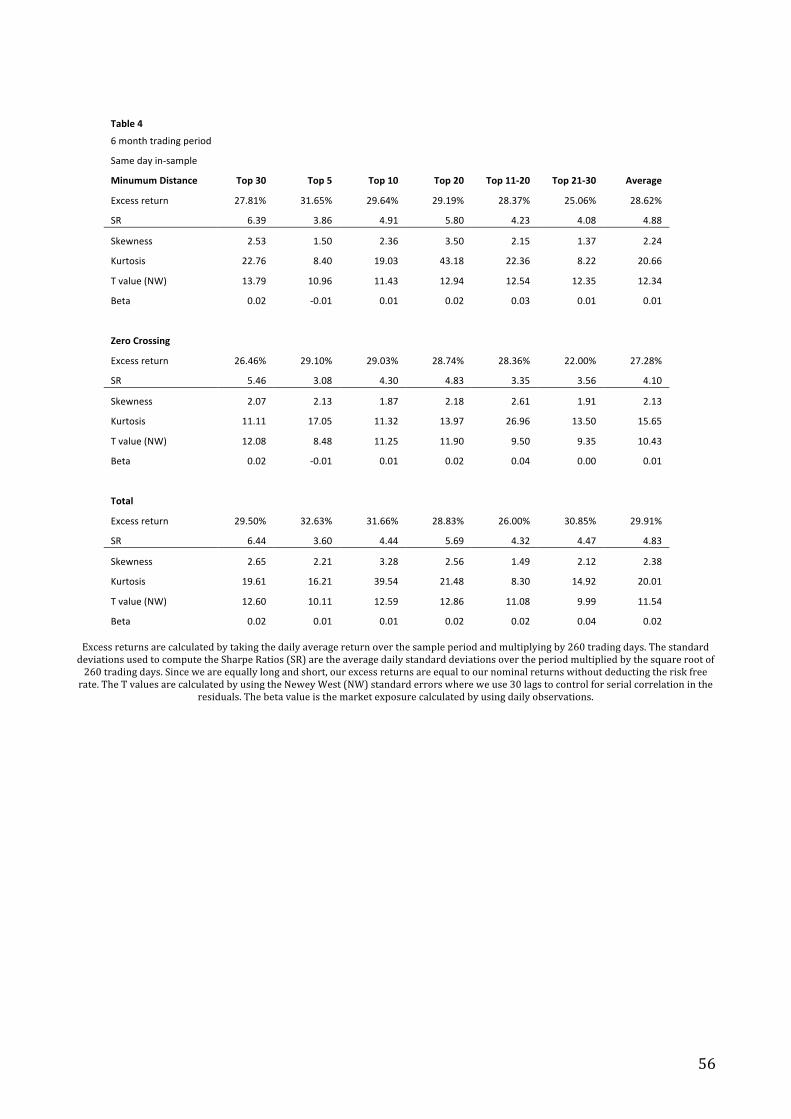
) 56)
Table,4,
6'month'trading'period' '' '' '' '' '' ''
Same'day'inIsample''
'' '' '' '' '' ''
Minumum,Distance, Top,30, Top,5, Top,10, Top,20, Top,11B20, Top,21B30, Average,
Excess'return' 27.81%' 31.65%' 29.64%' 29.19%' 28.37%' 25.06%' 28.62%'
SR' 6.39' 3.86' 4.91' 5.80' 4.23' 4.08' 4.88'
Skewness' 2.53' 1.50' 2.36' 3.50' 2.15' 1.37' 2.24'
Kurtosis' 22.76' 8.40' 19.03' 43.18' 22.36' 8.22' 20.66'
T'value'(NW)' 13.79' 10.96' 11.43' 12.94' 12.54' 12.35' 12.34'
Beta' 0.02' I0.01' 0.01' 0.02' 0.03' 0.01' 0.01'
'' '' '' '' '' '' '' ''
Zero,Crossing, ,, ,, ,, ,, ,, ,,
Excess'return' 26.46%' 29.10%' 29.03%' 28.74%' 28.36%' 22.00%' 27.28%'
SR' 5.46' 3.08' 4.30' 4.83' 3.35' 3.56' 4.10'
Skewness' 2.07' 2.13' 1.87' 2.18' 2.61' 1.91' 2.13'
Kurtosis' 11.11' 17.05' 11.32' 13.97' 26.96' 13.50' 15.65'
T'value'(NW)' 12.08' 8.48' 11.25' 11.90' 9.50' 9.35' 10.43'
Beta' 0.02' I0.01' 0.01' 0.02' 0.04' 0.00' 0.01'
'' '' '' '' '' '' '' ''
Total,, ,, ,, ,, ,, ,, ,, ,,
Excess'return' 29.50%' 32.63%' 31.66%' 28.83%' 26.00%' 30.85%' 29.91%'
SR' 6.44' 3.60' 4.44' 5.69' 4.32' 4.47' 4.83'
Skewness' 2.65' 2.21' 3.28' 2.56' 1.49' 2.12' 2.38'
Kurtosis' 19.61' 16.21' 39.54' 21.48' 8.30' 14.92' 20.01'
T'value'(NW)' 12.60' 10.11' 12.59' 12.86' 11.08' 9.99' 11.54'
Beta' 0.02' 0.01' 0.01' 0.02' 0.02' 0.04' 0.02')
Excess)returns)are)calculated)by)taking)the)daily)average)return)over)the)sample)period)and)multiplying)by)260)trading)days.)The)standard)deviations)used)to)compute)the)Sharpe)Ratios)(SR))are)the)average)daily)standard)deviations)over)the)period)multiplied)by)the)square)root)of)260)trading)days.)Since)we)are)equally)long)and)short,)our)excess)returns)are)equal)to)our)nominal)returns)without)deducting)the)risk)free)rate.)The)T)values)are)calculated)by)using)the)Newey)West)(NW))standard)errors)where)we)use)30)lags)to)control)for)serial)correlation)in)the)
residuals.)The)beta)value)is)the)market)exposure)calculated)by)using)daily)observations.)) )

) 57)
)Table,5,
12'month'trading'period' '' '' '' '' '' ''
Same'day'inIsample''
'' '' '' '' '' ''
Minumum,Distance, Top,30, Top,5, Top,10, Top,20, Top,11B20, Top,21B30, Average,
Excess'return' 26.54%' 27.72%' 26.28%' 26.65%' 27.01%' 26.32%' 26.75%'
SR' 6.19' 3.49' 4.70' 5.46' 3.84' 4.24' 4.65'
Skewness' 2.02' 1.12' 1.83' 2.63' 2.10' 1.24' 1.82'
Kurtosis' 16.72' 7.73' 16.87' 31.40' 21.25' 6.30' 16.71'
T'value'(NW)' 16.01' 10.30' 12.49' 14.50' 12.26' 13.09' 13.11'
Beta' 0.02' 0.00' 0.01' 0.02' 0.02' 0.02' 0.01'
'' '' '' '' '' '' '' ''
Zero,Crossing, ,, ,, ,, ,, ,, ,, ,,
Excess'return' 26.65%' 25.71%' 28.04%' 27.38%' 26.73%' 25.37%' 26.65%'
SR' 4.95' 2.70' 3.80' 4.34' 3.11' 3.39' 3.72'
Skewness' 1.37' 0.72' 1.03' 1.28' 2.30' 1.21' 1.32'
Kurtosis' 7.24' 7.06' 6.16' 8.22' 23.77' 7.58' 10.00'
T'value'(NW)' 12.97' 9.57' 11.85' 12.47' 9.69' 9.88' 11.07'
Beta' 0.02' I0.01' 0.03' 0.04' 0.06' I0.02' 0.02'
'' '' '' '' '' '' '' ''
Total,, ,, ,, ,, ,, ,, ,, ,,
Excess'return' 29.56%' 30.17%' 30.05%' 29.25%' 28.44%' 30.18%' 29.61%'
SR' 6.65' 3.51' 4.28' 5.68' 4.25' 4.72' 4.85'
Skewness' 1.32' 0.94' 2.81' 1.62' 0.88' 1.14' 1.45'
Kurtosis' 7.34' 7.15' 38.21' 14.09' 7.56' 6.13' 13.41'
T'value' 16.08' 11.26' 13.34' 15.16' 12.74' 12.58' 13.53'
Beta' 0.01' 0.01' 0.02' 0.01' 0.00' 0.02' 0.01')
Excess)returns)are)calculated)by)taking)the)daily)average)return)over)the)sample)period)and)multiplying)by)260)trading)days.)The)standard)deviations)used)to)compute)the)Sharpe)Ratios)(SR))are)the)average)daily)standard)deviations)over)the)period)multiplied)by)the)square)root)of)260)trading)days.)Since)we)are)equally)long)and)short,)our)excess)returns)are)equal)to)our)nominal)returns)without)deducting)the)risk)free)rate.)The)T)values)are)calculated)by)using)the)Newey)West)(NW))standard)errors)where)we)use)30)lags)to)control)for)serial)correlation)in)the)
residuals.)The)beta)value)is)the)market)exposure)calculated)by)using)daily)observations.))The)general)results)indicate)that)there)is)room)for)improvement)in)the)pair)selection)process,)as)the)inCsample)returns)are)significantly)higher)than)any)of)our)outCofCsample)returns.)The)main)point)is)not)to)argue)that)we)can)get)returns)or)Sharpe)ratios)close)to)the)inCsample)estimates,)but)the)outstanding)results)from)the)inCsample)trading)shows)that)a)strategy)able)to)identify)pairs)coCmovement)in)stocks)is)very)profitable)and)yield)positive)returns)in)every)single)time)period.)It)should)be)mentioned)that)the)inCsample)period)is)from)2002C2011,)while)the)outCofCsample)period)is)2003C2012.)However,)the)returns)from)year)to)year)show)an)impressive)consistency.))

) 58)
7.3. PostBtransaction,costs,returns,
We)have)established)that)our)strategy)yields)excess)returns)preCtransaction)costs.)The)strategy)is)very)transaction)costs)intensive,)especially)when)we)rebalance)the)portfolio)on)a)daily)basis,)so)our)postCtransaction)costs)returns)might)tell)a)different)story.)Hence)we)must)subtract)the)transaction)costs)of)the)strategy)before)we)can)say)anything)sensible)about)the)potential)profitability)and)outperformance)of)the)portfolio.))
Table,6,
6'months'aggregated'trading''
periods'postItransaction'costs'
'
'' '' ''
Minumum,Distance, Top,30, Top,5, Top,10, Top,20, Top,11B20, Top,21B30, Average,
Excess'return' 2.89%' 0.89%' 3.95%' 3.68%' 3.44%' 1.40%' 2.71%'
SRIratio' 0.41' 0.07' 0.41' 0.46' 0.34' 0.14' 0.31'
Skewness' 0.52' 0.36' 0.62' 0.69' 0.35' 0.23' 0.46'
Kurtosis' 2.94' 6.18' 4.45' 4.46' 3.17' 3.20' 4.07'
T'value'(NW)' 1.37' 0.24' 1.48' 1.59' 1.18' 0.51' 1.06'
beta' 0.05' 0.06' 0.04' 0.05' 0.07' 0.06' 0.06'
'' '' '' '' '' '' '' ''
Zero,Crossing, '' '' '' '' '' '' ''
Excess'return' 1.69%' 4.15%' 5.52%' 1.54%' I1.69%' 2.01%' 2.20%'
SRIratio' 0.20' 0.27' 0.47' 0.16' I0.14' 0.17' 0.19'
Skewness' 0.20' 0.25' 0.24' 0.24' 0.33' 0.07' 0.22'
Kurtosis' 4.67' 4.17' 4.52' 4.59' 5.08' 5.88' 4.82'
T'value'(NW)' 0.63' 0.97' 1.76' 0.54' I0.43' 0.55' 0.67'
beta' 0.09' 0.08' 0.08' 0.08' 0.09' 0.11' 0.09'
'' '' '' '' '' '' '' ''
Total,, '' '' '' '' '' '' ''
Excess'return' 3.37%' 6.14%' 4.25%' 3.28%' 2.21%' 3.76%' 3.83%'
SR' 0.43' 0.39' 0.36' 0.37' 0.20' 0.34' 0.35'
Skewness' 0.39' 0.01' 0.05' 0.43' 0.45' 0.40' 0.29'
Kurtosis' 4.39' 3.94' 3.91' 4.62' 6.72' 3.40' 4.50'
T'value'(NW)' 1.50' 1.53' 1.5' 1.38' 0.70' 1.18' 1.30'
Beta' 0.05' 0.02' 0.05' 0.05' 0.04' 0.06' 0.05'
)Excess)returns)are)calculated)by)taking)the)daily)average)return)over)the)sample)period)and)multiplying)by)260)trading)days.)The)standard)deviations)used)to)compute)the)Sharpe)Ratios)(SR))are)the)average)daily)standard)deviations)over)the)period)multiplied)by)the)square)root)of)260)trading)days.)Since)we)are)equally)long)and)short,)our)excess)returns)are)equal)to)our)nominal)returns)without)deducting)the)risk)free)rate.)The)T)values)are)calculated)by)using)the)Newey)West)(NW))standard)errors)where)we)use)30)lags)to)control)for)serial)correlation)in)the)
residuals.)The)beta)value)is)the)market)exposure)calculated)by)using)daily)observations.))By)isolating)the)rebalancing)costs)we)see)that)they)account)for)around)1.1%)out)of)the)total)of)2.9%)in)average)transaction)costs)across)our)portfolios.)In)a)crisis,)e.g.)2008,)our)transaction)
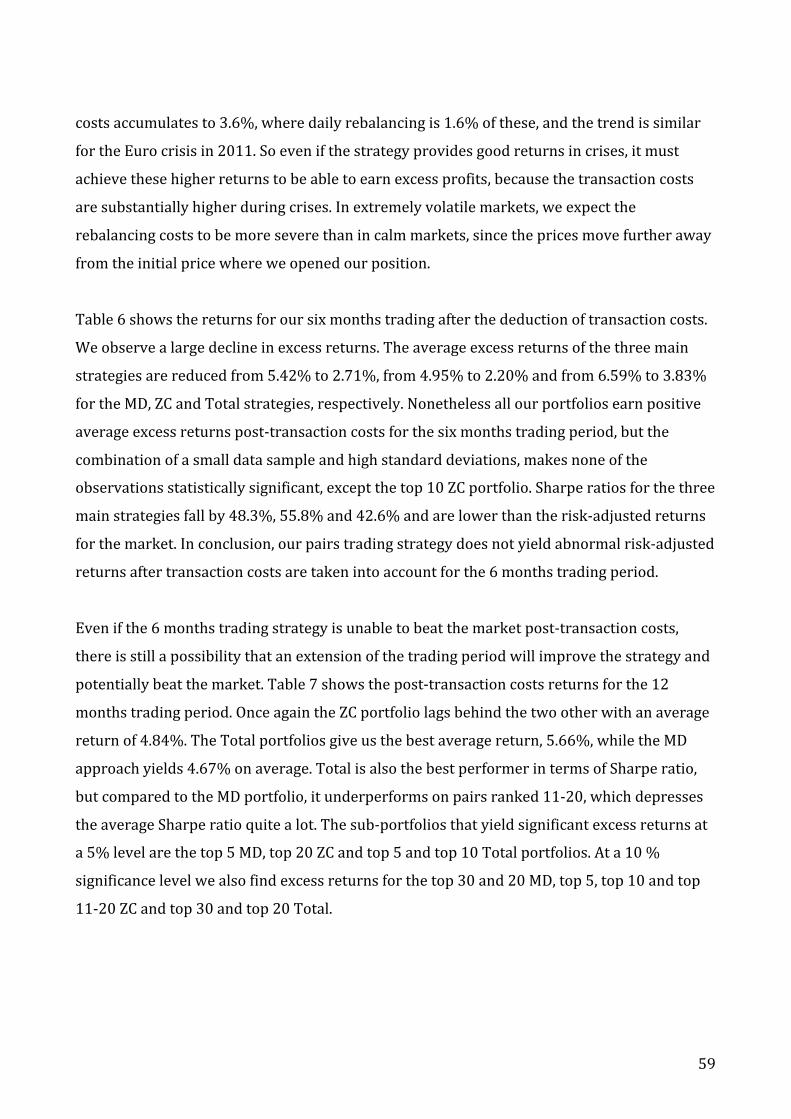
) 59)
costs)accumulates)to)3.6%,)where)daily)rebalancing)is)1.6%)of)these,)and)the)trend)is)similar)for)the)Euro)crisis)in)2011.)So)even)if)the)strategy)provides)good)returns)in)crises,)it)must)achieve)these)higher)returns)to)be)able)to)earn)excess)profits,)because)the)transaction)costs)are)substantially)higher)during)crises.)In)extremely)volatile)markets,)we)expect)the)rebalancing)costs)to)be)more)severe)than)in)calm)markets,)since)the)prices)move)further)away)from)the)initial)price)where)we)opened)our)position.)))Table)6)shows)the)returns)for)our)six)months)trading)after)the)deduction)of)transaction)costs.)We)observe)a)large)decline)in)excess)returns.)The)average)excess)returns)of)the)three)main)strategies)are)reduced)from)5.42%)to)2.71%,)from)4.95%)to)2.20%)and)from)6.59%)to)3.83%)for)the)MD,)ZC)and)Total)strategies,)respectively.)Nonetheless)all)our)portfolios)earn)positive)average)excess)returns)postCtransaction)costs)for)the)six)months)trading)period,)but)the)combination)of)a)small)data)sample)and)high)standard)deviations,)makes)none)of)the)observations)statistically)significant,)except)the)top)10)ZC)portfolio.)Sharpe)ratios)for)the)three)main)strategies)fall)by)48.3%,)55.8%)and)42.6%)and)are)lower)than)the)riskCadjusted)returns)for)the)market.)In)conclusion,)our)pairs)trading)strategy)does)not)yield)abnormal)riskCadjusted)returns)after)transaction)costs)are)taken)into)account)for)the)6)months)trading)period.))Even)if)the)6)months)trading)strategy)is)unable)to)beat)the)market)postCtransaction)costs,)there)is)still)a)possibility)that)an)extension)of)the)trading)period)will)improve)the)strategy)and)potentially)beat)the)market.)Table)7)shows)the)postCtransaction)costs)returns)for)the)12)months)trading)period.)Once)again)the)ZC)portfolio)lags)behind)the)two)other)with)an)average)return)of)4.84%.)The)Total)portfolios)give)us)the)best)average)return,)5.66%,)while)the)MD)approach)yields)4.67%)on)average.)Total)is)also)the)best)performer)in)terms)of)Sharpe)ratio,)but)compared)to)the)MD)portfolio,)it)underperforms)on)pairs)ranked)11C20,)which)depresses)the)average)Sharpe)ratio)quite)a)lot.)The)subCportfolios)that)yield)significant)excess)returns)at)a)5%)level)are)the)top)5)MD,)top)20)ZC)and)top)5)and)top)10)Total)portfolios.)At)a)10)%)significance)level)we)also)find)excess)returns)for)the)top)30)and)20)MD,)top)5,)top)10)and)top)11C20)ZC)and)top)30)and)top)20)Total.)))))

) 60)
Table,7,12'months'trading''period'postItransaction'costs'
''' '' '' '' '' ''
Minumum,Distance, Top,30, Top,5, Top,10, Top,20, Top,11B20, Top,21B30, Average,
Excess'return' 3.82%' 8.34%' 4.80%' 4.39%' 3.90%' 2.75%' 4.67%'
SR' 0.47' 0.59' 0.44' 0.47' 0.34' 0.27' 0.43'
Skewness' 0.48' 0.35' 0.69' 0.67' 0.56' I0.11' 0.44'
Kurtosis' 7.20' 14.32' 17.12' 9.87' 6.71' 4.75' 9.99'
T'value'(NW)' 1.65' 2.38' 1.63' 1.77' 1.25' 0.92' 1.60'
Beta' 0.07' 0.07' 0.06' 0.08' 0.09' 0.06' 0.07'
'' '' '' '' '' '' '' ''
Zero,Crossing, '' '' '' '' '' '' ''
Excess'return' 3.60%' 8.24%' 6.09%' 5.65%' 5.91%' I0.45%' 4.84%'
SR' 0.42' 0.53' 0.52' 0.57' 0.48' I0.04' 0.41'
Skewness' 0.35' 0.53' 0.33' 0.46' 0.68' 0.26' 0.43'
Kurtosis' 3.80' 5.00' 3.80' 4.59' 6.59' 6.67' 5.08'
T'value'(NW)' 1.35' 1.91' 1.76' 1.96' 1.69' I0.12' 1.43'
Beta' 0.07' 0.05' 0.04' 0.05' 0.07' 0.12' 0.07'
'' '' '' '' '' '' '' ''
Total,, '' '' '' '' '' '' ''
Excess'return' 4.49%' 11.53%' 8.37%' 4.47%' 0.46%' 4.66%' 5.66%'
SR' 0.53' 0.69' 0.70' 0.48' 0.04' 0.38' 0.47'
Skewness' 0.54' 0.70' 0.45' 0.29' I0.10' 0.54' 0.40'
Kurtosis' 8.23' 9.10' 5.41' 4.72' 5.32' 6.29' 6.51'
T'value'(NW)' 1.88' 2.46' 2.56' 1.70' 0.13' 1.38' 1.69'
Beta' 0.06' 0.01' 0.04' 0.06' 0.08' 0.07' 0.05')Excess)returns)are)calculated)by)taking)the)daily)average)return)over)the)sample)period)and)multiplying)by)260)trading)days.)The)standard)deviations)used)to)compute)the)Sharpe)Ratios)(SR))are)the)average)daily)standard)deviations)over)the)period)multiplied)by)the)square)root)of)260)trading)days.)Since)we)are)equally)long)and)short,)our)excess)returns)are)equal)to)our)nominal)returns)without)deducting)the)risk)free)rate.)The)T)values)are)calculated)by)using)the)Newey)West)(NW))standard)errors)where)we)use)30)lags)to)control)for)serial)correlation)in)the)
residuals.)The)beta)value)is)the)market)exposure)calculated)by)using)daily)observations.))Overall)it)seems)like)the)Total)portfolio)performs)the)best,)both)in)absolute)and)riskCadjusted)terms.)The)returns)for)each)individual)year)is)provided)in)the)appendix)(A.3.2.))and)the)top)5)and)top)10,)does)very)well)in)terms)of)excess)return)compared)to)other)subCportfolios.)The)downside)is)that)they)exhibit)a)higher)volatility)in)the)returns,)so)they)are)definitely)more)risky)than)for)instance)the)top)30)subCportfolios.)However,)by)looking)at)the)risk)adjusted)returns,)the)top)5)and)top)10)get)more)compensation)per)unit)of)risk,)hence)they)should)still)be)the)preferred)choices)for)an)investor.)The)outperformance)appears)consistent)for)our)sample,)as)these)portfolios)are)better)in)almost)every)single)year.)Still,)our)short)time)frame)makes)it)difficult)to)conclude)that)such)a)small)amount)of)pairs)in)a)portfolio)is)optimal.)In)the)

) 61)
rest)of)the)empirical)part)we)choose)to)report)the)results)for)the)Total)portfolio)with)12)months)trading,)because)it)seems)to)generate)the)best)overall)results.))!
7.4. Pairs,ranked,81B100,
We)have)some)indication)of)outperformance)by)our)portfolios)within)the)top)10)pairs,)but)want)to)further)confirm)if)our)sorting)metrics)actually)capture)the)more)profitable)pairs.)Therefore)we)compare)our)best)pairs)with)pairs)that)are)of)lower)quality,)according)to)our)Total)measure.)We)construct)a)portfolio)with)pairs)ranked)81C100,)inspired)by)Gatev,)Goetzmann)and)Rouwenhorst)(2006),)who)do)the)same)with)pairs)ranked)101C120.)The)results)include)transaction)costs)and)are)shown)in)Table)8.)))
Table,8,
12'months'trading''
postItransaction'costs' '' '' '' ''
Pairs,ranked,81B100' Top,81B100, Top,96B100, Top,91B100, Top,81B90, Average,
Excess'return' I2.29%' I4.52%' I7.15%' 2.55%' I2.85%'
SR' I0.26' I0.31' I0.60' 0.25' I0.23'
Skewness' I0.13' 0.06' 0.08' I0.07' I0.01'
Kurtosis' 6.45' 8.85' 6.98' 9.09' 7.84'
T'value'(NW)' I0.77' I1.02' I1.92' 0.75' I0.74'
Beta' 0.10' 0.13' 0.12' 0.08' 0.10'
,
Pairs,ranked,1B20' Top,20, Top,5, Top,10, Top,11B20, Average,
Excess'return' 4.47%' 11.53%' 8.37%' 0.46%' 6.21%'
SR' 0.48' 0.69' 0.70' 0.04' 0.48'
Skewness' 0.29' 0.70' 0.45' I0.10' 0.34'
Kurtosis' 4.72' 9.10' 5.41' 5.32' 6.13'
T'value'(NW)' 1.70' 2.46' 2.56' 0.13' 1.71'
Beta' 0.06' 0.01' 0.04' 0.08' 0.05'
)Excess)returns)are)calculated)by)taking)the)daily)average)return)over)the)sample)period)and)multiplying)by)260)trading)days.)The)standard)deviations)used)to)compute)the)Sharpe)Ratios)(SR))are)the)average)daily)standard)deviations)over)the)period)multiplied)by)the)square)root)of)260)trading)days.)Since)we)are)equally)long)and)short,)our)excess)returns)are)equal)to)our)nominal)returns)without)deducting)the)risk)free)rate.)The)T)values)are)calculated)by)using)the)Newey)West)(NW))standard)errors)where)we)use)30)lags)to)control)for)serial)correlation)in)the)
residuals.)The)beta)value)is)the)market)exposure)calculated)by)using)daily)observations.))We)compare)the)results)to)the)subCportfolios)within)the)Total)top)20)pairs,)so)we)can)directly)compare)the)differences)in)performance.)The)top)20)subCportfolio)outperforms)the)81C100)by)9.06%Cpoints)on)average)and)has)an)average)Sharpe)ratio)of)0.48,)compared)to)a)negative)Sharpe)ratio)of))C0.23)for)the)pairs)ranked)81C100.)To)get)a)more)granular)perspective)and)

) 62)
evaluate)the)consistency)of)the)outperformance,)we)also)report)excess)returns)and)Sharpe)ratios)for)the)individual)years)in)Table)9.)We)want)to)check)if)the)difference)in)performance)is)caused)by)a)large)difference)for)a)few)years)or)if)the)outperformance)is)more)stable.)The)average)excess)return)across)portfolios)for)the)top)20)pairs)outperforms)the)top)81C100)portfolios)eight)out)of)ten)years,)so)we)can)be)quite)confident)that)our)pairCpicking)scheme)improves)the)selection)of)pairs.)
Table,9, '' '' '' '' ,, '' '' '' '' ''Same,day,Return,
Top,,81B100,
Top,,96B100,
Top,,91B100,
Top,,81B90, Average, Top,20, Top,5, Top,10,
Top,,11B20, Average,
2003' 13.93%' I1.45%' I3.84%' 31.70%' 10.09%' 9.80%' 25.57%' 12.28%' 7.19%' 13.71%'
2004' I2.36%' 3.96%' 4.16%' I8.88%' I0.78%' 6.00%' 18.16%' 9.02%' 2.92%' 9.03%'
2005' I9.14%' I15.53%' I9.69%' I8.59%' I10.74%' I0.50%' 6.88%' I2.11%' 1.05%' 1.33%'
2006' 1.90%' I5.35%' I5.14%' 8.95%' 0.09%' I1.01%' I11.23%' I11.04%' 8.94%' I3.58%'
2007' I5.81%' 12.73%' I11.21%' I0.41%' I1.18%' I18.68%' 3.01%' 3.14%' I40.61%' I13.28%'
2008' I12.55%' I8.31%' I15.26%' I9.84%' I11.49%' 12.30%' 31.61%' 22.08%' 2.35%' 17.09%'
2009' 3.92%' 0.46%' I0.74%' 8.58%' 3.05%' 21.01%' 30.08%' 23.61%' 18.29%' 23.25%'
2010' I2.18%' 0.92%' I1.82%' I2.54%' I1.41%' 2.92%' I3.38%' 5.20%' 0.55%' 1.32%'
2011' I2.75%' I14.58%' I18.42%' 12.91%' I5.71%' 3.23%' 6.64%' 7.34%' I0.98%' 4.06%'
2012' I5.70%' I16.67%' I5.00%' I6.40%' I8.44%' 9.85%' 8.47%' 14.57%' 5.03%' 9.48%'
SR,Top,,
81B100,Top,,
96B100,Top,,
91B100,Top,,
81B90, Average, Top,20, Top,5, Top,10,Top,,
11B20, Average,
2003' 1.63' I0.09' I0.31' 3.07' 1.07' 0.92' 1.47' 1.11' 0.47' 0.99'
2004' I0.46' 0.63' 0.71' I1.15' I0.07' 1.08' 1.48' 1.11' 0.42' 1.02'
2005' I1.80' I1.60' I1.35' I1.51' I1.56' I0.07' 0.72' I0.28' 0.11' 0.12'
2006' 0.38' I0.53' I0.74' 1.19' 0.08' I0.13' I0.70' I0.84' 1.28' I0.10'
2007' I0.64' 1.01' I1.02' I0.04' I0.17' I1.71' 0.15' 0.21' I2.85' I1.05'
2008' I0.77' I0.29' I0.68' I0.56' I0.57' 0.91' 1.15' 1.27' 0.15' 0.87'
2009' 0.33' 0.02' I0.05' 0.69' 0.25' 1.90' 1.60' 1.54' 1.21' 1.56'
2010' I0.39' 0.10' I0.25' I0.32' I0.22' 0.56' I0.34' 0.72' 0.07' 0.25'
2011' I0.37' I1.12' I1.62' 1.26' I0.46' 0.36' 0.43' 0.63' I0.09' 0.33'
2012' I0.85' I1.91' I0.68' I0.75' I1.05' 1.13' 0.77' 1.65' 0.40' 0.99')
Excess)returns)are)the)sum)of)all)daily)returns)for)the)whole)year)and)the)standard)deviations)used)to)compute)the)Sharpe)Ratios)(SR))are)the)daily)standard)deviations)over)the)particular)year)multiplied)by)the)square)root)of)260)trading)days.)
)The)conclusion)is)the)same)when)we)look)at)the)riskCadjusted)returns.)The)top)20)pairs)beat)the)top)81C100)portfolio)seven)out)of)ten)years.)Additionally,)the)average)Sharpe)ratios)for)the)pairs)ranked)81C100)are)negative)60%)of)the)years)in)the)sample,)while)the)Sharpe)ratios)among)the)top)20)ranked)pairs)are)only)negative)in)three)years)during)our)trading)period.)All)in)all)we)conclude)that)our)pair)identification)metric)seems)to)do)a)pretty)good)job)at)identifying)pairs.)Our)top)5)and)top)10)pairs)yield)particularly)promising)returns,)while)pairs)ranked)96C100)and)91C100)give)the)poorest)results.))

) 63)
7.5. IntraBIndustry,Pairs,
So)far)we)have)performed)the)most)basic)form)of)pairs)trading,)and)even)if)some)of)our)returns)are)significant)at)a)5%)level,)we)want)to)investigate)if)we)can)further)enhance)the)performance)of)the)strategy)by)making)the)stocks)in)a)pair)more)homogeneous.)Therefore)we)construct)a)portfolio)of)pairs)where)paired)stocks)are)required)to)be)from)the)same)industry.)The)intraCindustry)portfolio)is)based)on)industry)classifications)from)Datastream,)and)to)make)the)pool)of)stocks)in)the)different)industries)as)large)as)possible,)some)industries)are)combined)to)larger)industry)categories)(see)appendix)A.1.).)The)intuition)is)that)pairs)from)the)same)industry)are)less)likely)to)be)a)result)of)statistical)randomness,)and)the)theoretical)backing)behind)the)coCmovement)is)more)convincing.)Table)10)shows)the)performance)of)the)sameCindustry)and)nonCrestricted)pairs.)Due)to)lack)of)availability)of)sameCindustry)pairs,)we)only)report)the)top)10)and)top)5)pairs.)Despite)the)shortage)of)potential)industry)pairs)the)quality)of)the)pairs)should)be)of)sufficient)quality,)as)the)top)10)sameCindustry)pairs)are)among)the)top)100)nonCrestricted)pairs)in)all)years,)except)for)2009.)We)do)not)find)a)performance)enhancing)effect)by)restricting)pairs)to)be)from)the)same)industry.)))
Table,10,
12'months'trading''
postItransaction'costs'
IntraBIndustry,pairs, Top,5, Top,10, Average,
Excess'return' 4.29%' 1.69%' 2.99%'
SR' 0.31' 0.15' 0.23'
Skewness' I0.02' 0.75' 0.36'
Kurtosis' 7.47' 12.63' 10.05'
T'value'(NW)' 1.27' 0.53' 0.9'
Beta' 0.11' 0.12' 0.12'
,
Different,industry,pairs' Top,5' Top,10' Average'
Excess'return, 11.53%, 8.37%, 9.95%,
SR' 0.69' 0.70' 0.70'
Skewness' 0.70' 0.45' 0.58'
Kurtosis' 9.10' 5.41' 7.25'
T'value'(NW)' 2.46' 2.56' 2.51'
Beta' 0.01' 0.04' 0.02'
)Excess)returns)are)calculated)by)taking)the)daily)average)return)over)the)sample)period)and)multiplying)by)260)trading)days.)The)standard)deviations)used)to)compute)the)Sharpe)Ratios)(SR))are)the)average)daily)standard)deviations)over)the)period)multiplied)by)the)square)root)of)260)trading)days.)Since)we)are)equally)long)and)short,)our)excess)returns)are)equal)to)our)nominal)returns)without)deducting)the)risk)free)rate.)The)T)values)are)calculated)by)using)the)Newey)West)(NW))standard)errors)where)we)use)30)lags)to)control)for)serial)correlation)in)the)
residuals.)The)beta)value)is)the)market)exposure)calculated)by)using)daily)observations.)

) 64)
It)might)be)due)to)our)broad)industry)classifications,)but)the)industry)pairs)underperform)the)nonCrestricted)pairs)by)as)much)as)6.96%Cpoints,)and)the)Sharpe)ratio)is)almost)70%)lower)than)for)the)nonCrestricted)pairs.)The)top)5)and)10)portfolios)perform)the)best,)and)by)looking)at)all)our)Total)portfolios)reported)in)Table)7,)we)observe)that)the)industry)pairs)do)not)outperform)any)of)the)nonCrestricted)portfolios)except)the)top)11C20.)In)other)words,)our)results)do)not)support)a)favorable)effect)of)restricting)paired)stocks)to)the)same)industry.)This)finding)is)contradictory)to)evidence)from)previous)literature,)but)it)should)be)emphasized)that)the)result)would)be)a)lot)stronger)if)our)sample)data)were)larger.)The)low)number)of)stocks)in)the)portfolio)might)also)affect)the)results,)but)we)choose)not)to)include)a)larger)number)of)sameCindustry)pairs,)because)it)will)compromise)the)quality)of)the)pairs.)))
Table,11,
Same'Industry'pairs'
postItransaction'costs' '' ''
NonIrestricted'pairs'
postItransaction'costs' '' ''
Annual,data,
Excess,return, Top,5, Top,10, Average,
Annual,data,
Excess,return, Top,5, Top,10, Average,
2003' 14.06%' 12.33%' 13.19%' 2003' 25.57%' 12.28%' 18.93%'
2004' 20.14%' 8.59%' 14.37%' 2004' 18.16%' 9.02%' 13.59%'
2005' 2.88%' I1.52%' 0.68%' 2005' 6.88%' I2.11%' 2.39%'
2006' 4.23%' 3.47%' 3.85%' 2006' I11.23%' I11.04%' I11.13%'
2007' 9.38%' 15.09%' 12.23%' 2007' 3.01%' 3.14%' 3.08%'
2008' 8.63%' I1.22%' 3.70%' 2008' 31.61%' 22.08%' 26.85%'
2009' 18.64%' 7.05%' 12.84%' 2009' 30.08%' 23.61%' 26.84%'
2010' I8.86%' I10.49%' I9.67%' 2010' I3.38%' 5.20%' 0.91%'
2011' I18.39%' I20.16%' I19.27%' 2011' 6.64%' 7.34%' 6.99%'
2012' 1.10%' 1.75%' 1.43%' 2012' 8.47%' 14.57%' 11.52%'
Sharpe,ratio, Top,5, Top,10, Average, Sharpe,ratio, Top,5, Top,10, Average,
2003' 1.00' 1.29' 1.14' 2003' 1.47' 1.11' 1.29'
2004' 1.80' 1.23' 1.51' 2004' 1.48' 1.11' 1.30'
2005' 0.26' I0.19' 0.04' 2005' 0.72' I0.28' 0.22'
2006' 0.38' 0.46' 0.42' 2006' I0.70' I0.84' I0.77'
2007' 0.78' 1.69' 1.24' 2007' 0.15' 0.21' 0.18'
2008' 0.35' I0.05' 0.15' 2008' 1.15' 1.27' 1.21'
2009' 1.26' 0.65' 0.95' 2009' 1.60' 1.54' 1.57'
2010' I0.65' I1.07' I0.86' 2010' I0.34' 0.72' 0.19'
2011' I1.29' I1.87' I1.58' 2011' 0.43' 0.63' 0.53'
2012' 0.10' 0.24' 0.17' 2012' 0.77' 1.65' 1.21'
)Excess)returns)are)the)sum)of)all)daily)returns)for)the)whole)year)and)the)standard)deviations)used)to)compute)the)Sharpe)Ratios)(SR))are)the)
daily)standard)deviations)over)the)particular)year)multiplied)by)the)square)root)of)260)trading)days.))

) 65)
To)be)certain)that)our)results)are)not)just)a)consequence)of)a)couple)of)extremely)poor)years)by)the)sameCindustry)pairs)or)some)incredible)years)for)our)nonCrestricted)pairs,)we)calculate)excess)returns)and)Sharpe)ratios)for)each)years,)reported)in)Table)11.)The)nonCrestricted)pairs)beat)the)sameCindustry)pairs)in)7)out)of)10)years)in)the)outCofCsample)period)for)top)5,)and)6)out)of)10)for)the)top)10.)This)supports)the)notion)that)the)underperformance)of)the)sameCindustry)pairs)are)not)due)to)substantial)losses)in)a)single)year,)but)looks)quite)consistent)over)the)period.)It)should)be)mentioned)though)that)the)negative)Sharpe)ratio)in)2011)for)the)same)industry)portfolio)is)to)a)large)extent)caused)by)an)almost)75%)decline)in)the)Commerzbank)stock.)This)event)caused)a)loss)of)96%)for)a)single)pair,)but)even)after)we)remove)the)pair)with)Commerzbank,)the)nonCrestricted)pairs)still)perform)better)than)the)industry)pairs.)Thus)we)do)not)find)any)evidence)that)the)performance)of)pairs)trading)can)be)improved)by)restricting)the)pairs)to)be)from)the)same)industry.)In)our)sample,)the)opposite)actually)seems)to)be)true.)Furthermore,)the)example)with)Commerzbank)shows)that)even)if)companies)operates)in)the)same)industry)and)their)results)are)often)driven)by)the)same)underlying)factors,)idiosyncratic)risk)still)plays)an)important)role.)))
7.6. Pairs,trading,in,different,market,environments,
Pairs)trading)has)proven)itself)to)be)a)very)profitable)strategy)in)turbulent)markets.)Gatev,)Goetzmann)and)Rouwenhorst)(2006))find)evidence)of)abnormal)returns)in)the)period)1969C1980,)a)period)the)S&P)500)index)faced)real)decline.)Do)and)Faff)(2010))add)further)evidence)to)the)impressive)performance)of)pairs)trading)during)years)of)financial)turbulence.)They)construct)a)pairs)trading)portfolio)that)generates)significant)abnormal)returns)during)two)of)the)most)recent)crises)in)2000C2002)and)July)2007)to)June)2009.)Their)results)indicate)that)even)if)most)hedge)funds)suffer)losses)in)periods)with)market)decline)and)evaporating)liquidity,)convergence)traders)can)end)up)with)good)returns)if)they)are)able)to)hold)on)to)their)positions.))!
Table)12)separates)between)performance)during)crisis)and)nonCcrisis)years.)In)2008)and)2011)the)DAX)fell)dramatically,)and)these)years)represent)the)years)where)the)subCprime)crisis)and)Euro)crisis)were)at)their)peaks.)The)DAX)index)experienced)a)decline)of)37%)and)14%)in)2008)and)2011,)respectively,)and)the)difference)from)year)high)to)year)low)where)sufficiently)
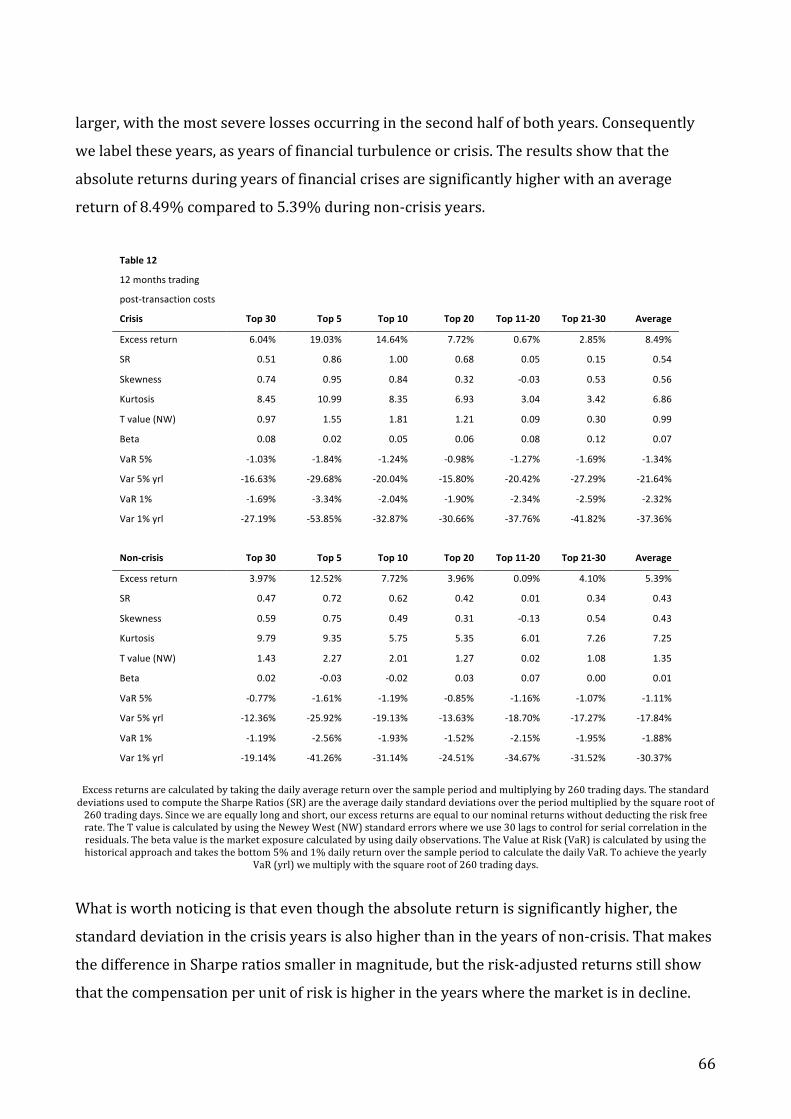
) 66)
larger,)with)the)most)severe)losses)occurring)in)the)second)half)of)both)years.)Consequently)we)label)these)years,)as)years)of)financial)turbulence)or)crisis.)The)results)show)that)the)absolute)returns)during)years)of)financial)crises)are)significantly)higher)with)an)average)return)of)8.49%)compared)to)5.39%)during)nonCcrisis)years.))
Table,12,
12'months'trading'
postItransaction'costs,
Crisis, Top,30, Top,5, Top,10, Top,20, Top,11B20, Top,21B30, Average,
Excess'return' 6.04%' 19.03%' 14.64%' 7.72%' 0.67%' 2.85%' 8.49%'
SR' 0.51' 0.86' 1.00' 0.68' 0.05' 0.15' 0.54'
Skewness' 0.74' 0.95' 0.84' 0.32' I0.03' 0.53' 0.56'
Kurtosis' 8.45' 10.99' 8.35' 6.93' 3.04' 3.42' 6.86'
T'value'(NW)' 0.97' 1.55' 1.81' 1.21' 0.09' 0.30' 0.99'
Beta' 0.08' 0.02' 0.05' 0.06' 0.08' 0.12' 0.07'
VaR'5%' I1.03%' I1.84%' I1.24%' I0.98%' I1.27%' I1.69%' I1.34%'
Var'5%'yrl' I16.63%' I29.68%' I20.04%' I15.80%' I20.42%' I27.29%' I21.64%'
VaR'1%' I1.69%' I3.34%' I2.04%' I1.90%' I2.34%' I2.59%' I2.32%'
Var'1%'yrl' I27.19%' I53.85%' I32.87%' I30.66%' I37.76%' I41.82%' I37.36%'
,
NonBcrisis, Top,30, Top,5, Top,10, Top,20, Top,11B20, Top,21B30, Average,
Excess'return' 3.97%' 12.52%' 7.72%' 3.96%' 0.09%' 4.10%' 5.39%'
SR' 0.47' 0.72' 0.62' 0.42' 0.01' 0.34' 0.43'
Skewness' 0.59' 0.75' 0.49' 0.31' I0.13' 0.54' 0.43'
Kurtosis' 9.79' 9.35' 5.75' 5.35' 6.01' 7.26' 7.25'
T'value'(NW)' 1.43' 2.27' 2.01' 1.27' 0.02' 1.08' 1.35'
Beta' 0.02' I0.03' I0.02' 0.03' 0.07' 0.00' 0.01'
VaR'5%' I0.77%' I1.61%' I1.19%' I0.85%' I1.16%' I1.07%' I1.11%'
Var'5%'yrl' I12.36%' I25.92%' I19.13%' I13.63%' I18.70%' I17.27%' I17.84%'
VaR'1%' I1.19%' I2.56%' I1.93%' I1.52%' I2.15%' I1.95%' I1.88%'
Var'1%'yrl' I19.14%' I41.26%' I31.14%' I24.51%' I34.67%' I31.52%' I30.37%'
)Excess)returns)are)calculated)by)taking)the)daily)average)return)over)the)sample)period)and)multiplying)by)260)trading)days.)The)standard)deviations)used)to)compute)the)Sharpe)Ratios)(SR))are)the)average)daily)standard)deviations)over)the)period)multiplied)by)the)square)root)of)260)trading)days.)Since)we)are)equally)long)and)short,)our)excess)returns)are)equal)to)our)nominal)returns)without)deducting)the)risk)free)rate.)The)T)value)is)calculated)by)using)the)Newey)West)(NW))standard)errors)where)we)use)30)lags)to)control)for)serial)correlation)in)the)residuals.)The)beta)value)is)the)market)exposure)calculated)by)using)daily)observations.)The)Value)at)Risk)(VaR))is)calculated)by)using)the)historical)approach)and)takes)the)bottom)5%)and)1%)daily)return)over)the)sample)period)to)calculate)the)daily)VaR.)To)achieve)the)yearly)
VaR)(yrl))we)multiply)with)the)square)root)of)260)trading)days.))What)is)worth)noticing)is)that)even)though)the)absolute)return)is)significantly)higher,)the)standard)deviation)in)the)crisis)years)is)also)higher)than)in)the)years)of)nonCcrisis.)That)makes)the)difference)in)Sharpe)ratios)smaller)in)magnitude,)but)the)riskCadjusted)returns)still)show)that)the)compensation)per)unit)of)risk)is)higher)in)the)years)where)the)market)is)in)decline.)
) 67)
However,)the)crisis)portfolio)has)a)higher)1%)VaR,)37.36%)versus)30.37%,)so)a)larger)tail)risk)seems)to)be)the)price)for)the)higher)riskCadjusted)returns.)))A)problem)with)our)data)sample)is)that)there)is)a)large)difference)in)number)of)observations)for)the)two)categories.)The)performance)in)years)of)crisis)is)only)based)on)two)years)of)data)while)we)have)8)years)of)data)for)what)we)consider)nonCcrisis)periods,)which)leads)to)lower)tCvalues)for)the)crisisCsample.)Unfortunately,)our)limited)sample)is)unable)to)find)statistically)significant)results.))
7.7. Managing,risk,
In)this)section,)we)introduce)two)different)risk)management)tools)as)an)attempt)to)reduce)the)risk)and)limit)the)downside)of)the)investment)strategy.)So)far,)we)have)tried)to)improve)the)strategy)by)optimizing)the)pair)identification)process)and)length)of)the)trading)period,)but)it)is)also)possible)to)improve)the)strategy)by)managing)the)risk)of)the)portfolio)better.)Our)chosen)pairs)earn)positive)profits)on)average,)but)the)profits)are)negatively)affected)by)occasional)divergence)between)pairs.)If)two)stocks)diverge)a)lot)it)can)cause)significant)decline)in)the)profitability)of)the)whole)portfolio,)and)the)implementation)of)risk)management)tools)can)limit)the)losses)when)our)trades)behave)differently)than)expected.)Finally,)we)look)at)the)performance)of)a)combination)of)the)market)portfolio)and)our)strategy,)to)see)if)the)increased)level)of)diversification)can)improve)our)risk)and)performance.))Furthermore,)the)market)neutral)strategy’s)low)correlation)with)directional)bet)strategies)and)the)market,)makes)it)an)ideal)hedging)component)in)a)larger)investment)portfolio.)Therefore)we)look)at)the)performance)of)a)portfolio)with)50%)invested)in)our)strategy)and)50%)in)the)market)index))
7.7.1. Stop,loss,
To)limit)the)most)extreme)losses)from)our)worst)performing)pairs,)we)try)to)implement)stop)loss.)It)is)supposed)to)protect)the)portfolio)against)losses)caused)by)extreme)divergence)between)the)two)stocks)in)a)pair.)More)specifically,)the)stop)loss)is)chosen)based)on)the)standard)deviation)of)the)average)spread)for)the)top)30)pairs)in)the)Total)portfolio.)There)is)a)

) 68)
natural)bias)in)the)standard)deviation)estimates)from)the)formation)period,)because)the)pairs)are)among)the)top)100)MD)pairs.)Therefore)we)need)to)adjust)for)the)fact)that)we)expect)the)standard)deviation)of)the)spread)to)be)higher)in)the)trading)period.)Instead)of)applying)an)arbitrary)factor)to)the)inCsample)standard)deviation,)we)look)at)the)difference)between)the)standard)deviation)of)our)pairs)inCsample)and)outCofCsample.)From)Table)13)we)observe)that)the)average)standard)deviation)is)2.2)times)larger)outCofCsample)than)inCsample.))
'
Table,13,
Pair'standard'deviation' '' ''
Average- IS' OOS' OOS/IS'
Average' 6.09%' 11.74%' '2.20''
Max' 8.17%' 26.97%' '3.72''
Min' 3.69%' 4.97%' '1.60''
)Since)we)are)concerned)about)the)most)extreme)losses,)we)focus)on)the)difference)between)the)largest)standard)deviations)in)the)period,)which)is)as)much)as)3.72)times)larger)outCofCsample.)These)estimates)are)not)available)to)a)pairs)trader,)since)they)are)gathered)by)looking)into)the)future,)but)the)emphasis)is)more)on)a)potential)improvement)effect)with)the)inclusion)of)stop)loss,)instead)of)creating)the)most)realistic)pairs)trading)portfolio.)Moreover,)we)open)pairs)at)two)times)the)standard)deviation)of)the)inCsample)spread,)so)it)should)be)reasonable)to)have)a)considerably)higher)stop)loss)threshold,)e.g.)four)standard)deviations.)The)intuition)is)that)if)the)spread)has)diverged)as)much)as)four)standard)deviations)it)is)unlikely)that)these)pairs)will)return)to)the)expected)value)within)the)scope)of)the)trading)period.)However,)four)standard)deviations)of)the)inCsample)spread)often)occurs)in)the)outCofCsample)period,)so)we)need)to)further)adjust)for)the)large)increase)in)outCofCsample)versus)inCsample)volatility.)By)using)the)difference)between)the)largest)standard)deviations)outCofCsample)and)inCsample,)3.72,)and)the)arbitrarily)chosen)four)standard)deviation)threshold,)we)end)up)with)a)threshold)that)is)(3.72*4))≈15)times)the)inCsample)standard)deviation)of)the)spread.)When)the)spread)of)a)pair)deviates)beyond)15)standard)deviations)we)automatically)close)the)position,)but)will)reCenter)the)position)when)the)spread)moves)within)the)stop)loss)threshold)again.)Our)measure)seems)like)an)extreme)threshold,)but)that)is)exactly)the)point,)to)protect)the)portfolio)against)extreme)losses.)A)potential)concern)can)be)that)the)stop)loss)never)comes)into)play,)but)our)results)show)that)this)is)not)the)case.)In)the)implementation)process)of)the)stop)loss)we)tried)out)different)thresholds,)so)our)choice)of)15)standard)deviations)was)made)after)dismissing)

) 69)
lower)thresholds)that)kicked)in)for)a)large)fraction)of)our)pairs.)Thus)the)stop)loss)is)definitely)subject)to)a)dataCmining)bias.)The)results)for)the)stop)loss)strategy)are)presented)in)Table)14.))))
Table,14,
12'months'trading''
postItransaction'costs,
Total,stop,loss, OS,30, OS,5, OS,10, OS,20, OS,11B20, OS,21B30, Average,
Excess'return' 5.02%' 10.97%' 8.11%' 5.31%' 2.40%' 4.55%' 6.06%'
SR' 0.60' 0.65' 0.68' 0.58' 0.21' 0.37' 0.51'
Skewness' 0.57' 0.69' 0.44' 0.33' 0.09' 0.53' 0.44'
Kurtosis' 8.42' 8.64' 5.38' 4.79' 4.30' 6.30' 6.30'
T'value'(NW)' 2.11' 2.32' 2.50' 2.07' 0.77' 1.36' 1.86'
Beta' 0.06' 0.02' 0.04' 0.06' 0.08' 0.07' 0.06'
VaR'5%' I0.75%' I1.58%' I1.15%' I0.85%' I1.09%' I1.10%' I1.09%'
VaR'5%'yrl' I12.12%' I25.46%' I18.55%' I13.65%' I17.63%' I17.80%' I17.54%'
VaR'1%' I1.21%' I2.43%' I1.81%' I1.44%' I2.07%' I1.94%' I1.82%'
Var'1%'yrl' I19.45%' I39.19%' I29.18%' I23.29%' I33.33%' I31.24%' I29.28%',,,Total,without,,stopBloss, OS,30, OS,5, OS,10, OS,20, OS,11B20, OS,21B30, Average,
Excess'return' 4.49%' 11.53%' 8.37%' 4.47%' 0.46%' 4.66%' 5.66%'
SR' 0.53' 0.69' 0.70' 0.48' 0.04' 0.38' 0.47'
Skewness' 0.54' 0.70' 0.45' 0.29' I0.10' 0.54' 0.40'
Kurtosis' 8.23' 9.10' 5.41' 4.72' 5.32' 6.29' 6.51'
T'value'(NW)' 1.88' 2.46' 2.56' 1.70' 0.13' 1.38' 1.69'
Beta' 0.06' 0.01' 0.04' 0.06' 0.08' 0.07' 0.05'
VaR'5%' I0.77%' I1.55%' I1.15%' I0.85%' I1.16%' I1.10%' I1.10%'
VaR'5%'yrl' I12.35%' I24.96%' I18.55%' I13.65%' I18.70%' I17.80%' I17.67%'
VaR'1%' I1.22%' I2.47%' I1.82%' I1.51%' I2.14%' I1.94%' I1.85%'
Var'1%'yrl' I19.73%' I39.80%' I29.28%' I24.28%' I34.56%' I31.24%' I29.82%')Excess)returns)are)calculated)by)taking)the)daily)average)return)over)the)sample)period)and)multiplying)by)260)trading)days.)The)standard)deviations)used)to)compute)the)Sharpe)Ratios)(SR))are)the)average)daily)standard)deviations)over)the)period)multiplied)by)the)square)root)of)260)trading)days.)Since)we)are)equally)long)and)short,)our)excess)returns)are)equal)to)our)nominal)returns)without)deducting)the)risk)free)rate.)The)T)value)is)calculated)by)using)the)Newey)West)(NW))standard)errors)where)we)use)30)lags)to)control)for)serial)correlation)in)the)residuals.)The)beta)value)is)the)market)exposure)calculated)by)using)daily)observations.)The)Value)at)Risk)(VaR))is)calculated)by)using)the)
historical)approach)and)take)the)bottom)5%)and)1%)daily)return)over)the)sample)period)to)calculate)the)daily)VaR.)To)achieve)the)yearly)VaR)(yrl))we)multiply)with)the)square)root)of)260)trading)days.)
)The)average)Sharpe)ratio)increases)from)0.47)to)0.51)when)we)include)the)stop)loss.)Moreover,)the)returns)for)the)top)5,)top)10,)top)20)and)top)30)subCportfolios)are)all)significant)at)the)5%)level)with)excess)returns)of)10.97%,)8.11%,)5.31%)and)5.02%,)respectively.)When)we)compare)the)returns)of)the)top)5)and)top)10)to)previous)results,)we)observe)that)they)actually)decrease)in)profitability)after)the)inclusion)of)stop)loss.)On)the)other)hand,)the)results)

) 70)
show)that)stop)loss)mitigate)the)losses)for)the)top)11C20)subCportfolio)compared)to)the)scenario)without)stop)loss,)and)as)a)result)improves)the)profitability)of)our)most)diversified)subCportfolio,)top)30,)as)well)as)the)average)performance.)Furthermore,)the)implementation)of)stop)loss)makes)our)Sharpe)ratios)slightly)more)consistent)across)subCportfolios.)Instead)of)looking)at)the)absolute)best)riskCadjusted)return,)which)in)this)case)is)the)top)5)without)stop)loss,)we)look)at)the)average)across)the)subCportfolios)because)we)consider)it)to)be)a)more)reliable)number)to)describe)the)general)performance)of)the)strategy.)))We)cannot)dismiss)a)potential)improvement)to)the)implementation)of)stop)loss,)since)our)stop)loss)level)is)simply)set)by)looking)at)the)outCofCsample)standard)deviations.)Our)threshold)is)probably)better)than)an)arbitrarily)chosen)threshold,)but)there)might)still)be)opportunities)to)optimize)the)threshold)to)further)enhance)returns.)We)are)also)curious)about)how)the)Value)at)Risk)(VaR))is)affected)by)the)implementation)of)risk)control,)since)all)our)portfolios)are)subject)to)tail)risk.)However,)we)do)not)consider)stop)loss)as)an)efficient)VaR)reducing)tool)since)it)only)reduces)our)positions)by)looking)at)extreme)losses)for)each)pair,)and)not)the)overall)decline)in)performance.)This)is)also)confirmed)by)the)VaR)estimates,)which)are)almost)identical)for)the)portfolios)with)and)without)stop)loss.)Instead)we)will)look)at)how)we)can)reduce)VaR)by)reducing)the)risk)of)the)portfolio)when)we)experience)losses.!!
7.7.2. Drawdown,control,
Drawdown)control)is)a)frequently)used)tool)among)mutual)fund)managers)to)reduce)the)risk)of)going)out)of)business.)In)turbulent)periods)or)when)a)fund)performs)poorly,)investors)can)choose)to)withdraw)their)capital,)and)drawdown)control)can)be)used)to)reduce)the)risk)of)the)fund)when)it)has)lost)a)certain)percentage)of)its)initial)value.)Furthermore,)investors)can)withdraw)money)even)if)the)investment)manager)expects)to)do)well,)and)this)is)particularly)a)valid)threat)for)funds)that)engage)in)arbitrageClike)trades)or)other)strategies)investors)find)difficult)to)fully)grasp.)Drawdown)control)may)reduce)the)absolute)return)of)the)portfolios,)but)can)limit)the)downside)and)make)sure)you)stay)in)business.)We)activate)our)drawdown)control)at)10%)for)the)top)5)and)top)10)and)5%)for)the)top)20)and)top)30)portfolios.)We)have)different)thresholds)since)we)expect)the)top)5)and)top)10)subCportfolios)to)be)more)volatile.)When)our)drawdown)control)is)activated)we)reduce)our)positions)by)50%)to)reduce)the)risk)

) 71)
of)the)portfolio.)If)we)regain)the)loss,)the)portfolio)will)be)scaled)up)again)to)its)normal)size.)This)should)be)a)good)way)to)reduce)the)risk)of)the)strategy,)and)limit)the)losses)in)the)periods,)where)the)portfolio)struggles)to)perform.)Contrary)to)stop)loss,)drawdown)concerns)the)portfolio)as)a)whole)and)not)individual)pairs.)The)5%)VaR)for)the)Total)portfolio)varies)between)12%C25%,)and)the)idea)is)that)the)drawdown)control)is)activated)at)a)relatively)early)stage,)because)it)is)too)late)to)reduce)the)risk)if)the)portfolio)has)already)lost)20%.)A)portfolio)loss)of)as)much)as)5%)implies)a)portfolioCwide)loss)or)extreme)loss)in)some)of)our)pairs,)and)could)mean)that)the)connection)between)the)paired)stocks)are)weakened)due)to)e.g.)macro)events)or)that)the)strategy)did)not)work)very)well)in)the)first)place.)So)even)if)5%)and)10%)are)chosen)quite)arbitrarily)it)should)be)reasonable)thresholds)to)activate)the)drawdown)control.))Table)15)indicates)that)the)implementation)of)drawdown)control)offer)little)improvement)in)performance,)and)the)increase)in)average)Sharpe)ratio)is)less)than)for)the)stop)loss.)The)average)5%)(1%))VaR)across)the)portfolios)is)16.99%)(28.49%),)while)the)VaR)when)we)do)not)implement)the)drawdown)control)is)only)slightly)higher)at)17.67%)(29.82%).)However,)we)improve)our)average)Sharpe)ratio)to)0.49,)but)the)main)purpose)of)the)drawdown)control,)to)reduce)the)risk,)does)not)appear)notably)successful.)))Past)returns)is)by)no)means)a)perfect)proxy)to)assess)the)tail)risk)of)the)portfolio,)and)during)the)subCprime)crisis)the)financial)sector)experienced)how)risk)models)based)on)historical)data)can)fail.)The)black)swan)theory)developed)by)Taleb)(2010))explains)how)financial)models)based)on)historical)data)are)unable)to)absorb)the)effect)of)random)events,)which)can)play)a)vital)role)in)the)market)environment,)and)i.e.)the)subCprime)crisis)were)caused)by)events)never)seen)before.)The)implementation)of)a)VaR)analysis)can)be)helpful)to)assess)the)tail)risk)of)the)portfolio,)but)is)subject)to)the)same)bias)as)other)measures)based)on)historical)prices.)It)is)extremely)difficult)to)find)proper)risk)measures)that)fully)map)the)risks)we)face,)but)more)often)than)not)we)have)to)settle)with)these,)and)rather)admit)that)they)do)not)fully)capture)the)risk)of)the)portfolio.)Therefore,)managing)risk)by)stop)loss)and)drawdown)may)prevent)the)most)severe)losses)that)are)not)picked)up)by)the)VaR)measure.)))))

) 72)
Table,15,
12'months'trading''
postItransaction'costs,
Total,Drawdown, Top'30' Top'5' Top'10' Top'20' Top'11I20' Top'21I30' Average'
Excess'return' 4.21%' 11.24%' 8.45%' 4.08%' 1.50%' 4.51%' 5.66%'
SR' 0.52' 0.71' 0.72' 0.47' 0.12' 0.37' 0.49'
Skewness' 0.64' 0.79' 0.51' 0.38' 0.38' 0.52' 0.53'
Kurtosis' 9.57' 10.76' 5.90' 5.92' 7.23' 6.17' 7.59'
T'value'(NW)' 1.78' 2.51' 2.65' 1.64' 0.48' 1.34' 1.73'
Beta' 0.06' 0.01' 0.03' 0.05' 0.08' 0.07' 0.05'
VaR'5%' I0.73%' I1.42%' I1.11%' I0.80%' I1.16%' I1.11%' I1.05%'
Var'5%'yrl' I11.79%' I22.90%' I17.89%' I12.82%' I18.71%' I17.83%' I16.99%'
VaR'1%' I1.18%' I2.37%' I1.68%' I1.31%' I2.13%' I1.94%' I1.77%'
Var'1%'yrl' I19.08%' I38.22%' I27.04%' I21.06%' I34.28%' I31.23%' I28.49%',,Total, OS,30, OS,5, OS,10, OS,20, OS,11B20, OS,21B30, Average,
Excess'return' 4.49%' 11.53%' 8.37%' 4.47%' 0.46%' 4.66%' 5.66%'
SR' 0.53' 0.69' 0.70' 0.48' 0.04' 0.38' 0.47'
Skewness' 0.54' 0.70' 0.45' 0.29' I0.10' 0.54' 0.40'
Kurtosis' 8.23' 9.10' 5.41' 4.72' 5.32' 6.29' 6.51'
T'value'(NW)' 1.88' 2.46' 2.56' 1.70' 0.13' 1.38' 1.69'
Beta' 0.06' 0.01' 0.04' 0.06' 0.08' 0.07' 0.05'
VaR'5%' I0.77%' I1.55%' I1.15%' I0.85%' I1.16%' I1.10%' I1.16%'
VaR'5%'yrl' I12.35%' I24.96%' I18.55%' I13.65%' I18.70%' I17.80%' I17.67%'
VaR'1%' I1.22%' I2.47%' I1.82%' I1.51%' I2.14%' I1.94%' I1.85%'
Var'1%'yrl' I19.73%' I39.80%' I29.28%' I24.28%' I34.56%' I31.24%' I29.82%')Excess)returns)are)calculated)by)taking)the)daily)average)return)over)the)sample)period)and)multiplying)by)260)trading)days.)The)standard)deviations)used)to)compute)the)Sharpe)Ratios)(SR))are)the)average)daily)standard)deviations)over)the)period)multiplied)by)the)square)root)of)260)trading)days.)Since)we)are)equally)long)and)short,)our)excess)returns)are)equal)to)our)nominal)returns)without)deducting)the)risk)free)rate.)The)T)value)is)calculated)by)using)the)Newey)West)(NW))standard)errors)where)we)use)30)lags)to)control)for)serial)correlation)in)the)residuals.)The)beta)value)is)the)market)exposure)calculated)by)using)daily)observations.)The)Value)at)Risk)(VaR))is)calculated)by)using)the)
historical)approach)and)take)the)bottom)5%)and)1%)daily)return)over)the)sample)period)to)calculate)the)daily)VaR.)To)achieve)the)yearly)VaR)(yrl))we)multiply)with)the)square)root)of)260)trading)days.)
)
7.7.3. Our,pairs,trading,portfolio,as,a,hedging,component,
Our)daily)returns)have)a)low)sensitivity)to)the)returns)of)the)DAX)index,)so)they)appear)to)be)close)to)market)neutral.)The)index)investment)is)obviously)a)directional)bet,)and)in)line)with)the)earlier)discussion)on)market)neutral)strategies)as)a)hedging)component,)we)want)to)look)at)the)relative)performance)of)a)combination)of)our)strategy)and)the)DAX)index.))The)area)of)interest)is)the)Sharpe)ratio,)since)market)returns)generally)are)larger)in)magnitude,)while)the)pairs)trading)strategy)has)a)lower)standard)deviation.)From)Table)16)we)

) 73)
see)that)the)combination)portfolio)does)not)yield)a)consistently)better)Sharpe)ratio,)even)though)the)average)is)higher)than)for)both)the)market)and)the)pairs)trading)portfolio.))
Table,16,
Hedge''
postItransaction'costs' '' '' '' '' '' '' ''
Excess,returns, Top,30,, Top,5,, Top,10,, Top,20,, Top,11B20,, Top,21B30,, Average,
Total' 4.49%' 11.53%' 8.37%' 4.47%' 0.46%' 4.66%' 5.66%'
Market' 9.10%' 9.10%' 9.10%' 9.10%' 9.10%' 9.10%' 9.10%'
Combination) 7.28%' 10.80%' 9.22%' 7.27%' 5.26%' 7.36%' 7.87%'
'' '' '' '' '' '' '' ''
Sharpe,ratio, '' '' '' '' '' '' ''
Total' 0.53' 0.69' 0.70' 0.48' 0.04' 0.38' 0.47'
Market' 0.38' 0.38' 0.38' 0.38' 0.38' 0.38' 0.42'
Combination) 0.51' 0.71' 0.64' 0.51' 0.34' 0.49' 0.53'
Improvement' I0.02' 0.01' I0.06' 0.03' I0.05' 0.11' 0.06'
Improvement'in'%' I3.59%' 1.74%' I8.53%' 5.41%' I11.84%' 27.58%' 12.92%'
'' '' '' '' '' '' '' ''
VaR, '' '' '' '' '' '' ''
VaR'5%' I1.23%' I1.35%' I1.25%' I1.24%' I1.37%' I1.27%' I1.28%'
VaR'5%'yrl' I19.76%' I21.85%' I20.11%' I19.94%' I22.15%' I20.49%' I20.72%'
VaR'1%' I2.47%' I2.40%' I2.39%' I2.49%' I2.58%' I2.57%' I2.48%'
Var'1%'yrl' I39.84%' I38.69%' I38.55%' I40.18%' I41.57%' I41.51%' I40.06%')
Excess)returns)are)calculated)by)taking)the)daily)average)return)over)the)sample)period)and)multiplying)by)260)trading)days.)The)standard)deviations)used)to)compute)the)Sharpe)Ratios)(SR))are)the)average)daily)standard)deviations)over)the)period)multiplied)by)the)square)root)of)260)trading)days.)Since)we)are)equally)long)and)short,)our)excess)returns)are)equal)to)our)nominal)returns)without)deducting)the)risk)free)rate.)The)DAX)index)(Market))excess)returns)is)the)returns)in)excess)of)the)risk)free)rate.)The)Value)at)Risk)(VaR))is)calculated)by)using)the)
historical)approach)and)take)the)bottom)5%)and)1%)daily)return)over)the)sample)period)to)calculate)the)daily)VaR.)To)achieve)the)yearly)VaR)(yrl))we)multiply)with)the)square)root)of)260)trading)days.)
)The)average)Sharpe)ratio)increases)by)12.92%)or)0.06)points,)largely)due)to)the)improvement)for)the)top)21C30)ranked)pairs.)The)drawback)is)that)the)tail)risk)increases)quite)a)lot)compared)to)the)pairs)trading)strategy.)The)yearly)5%)(1%))VaR)of)the)combination)portfolio)is)20.72%)(40.06%),)compared)to)our)pairs)trading)portfolios)with)a)VaR)at)17.67%)(29.82%).)The)average)performance)of)the)combined)portfolio)is)slightly)better)than)our)pairs)trading)strategy,)but)the)performance)of)the)majority)of)the)subCportfolios)are)not)noticeably)better.)In)addition,)the)combined)portfolio)has)a)significantly)higher)tail)risk,)which)makes)it)less)attractive)for)the)investor.)In)conclusion,)we)find)no)clear)benefits)of)diversification)by)combining)our)portfolio)with)a)directional)component.)))

) 74)
We)have)managed)to)obtain)weakly)abnormal)returns,)and)illustrated)how)the)introduction)of)risk)management)tools)can)further)enhance)performance.)Still)we)have)not)yet)tested)why)we)are)able)to)obtain)these)returns.)The)upcoming)section)will)look)at)the)relationship)between)risk)factors)discussed)in)academic)literature)and)our)pairs)trading)returns,)to)see)if)we)are)able)to)identify)factors)that)can)explain)our)returns.))
7.8. Regression,analysis,
Previous)literature)has)so)far)been)unable)to)come)up)with)a)good)explanation)for)why)pairs)trading)actually)works,)and)in)the)upcoming)section)we)will)do)our)best)to)shed)more)light)on)this)subject.)Gatev,)Goetzmann)and)Rouwenhorst)(2006))suggest)that)the)pairs)trading)portfolio)earns)a)premium)through)exposure)to)a)latent)risk)factor,)but)they)are)unable)to)make)any)suggestions)of)what)this)risk)factor)might)be.)Our)portfolio)yields)weakly)abnormal)returns)postCtransaction)costs,)and)the)portfolio)significantly)outperforms)the)market)in)periods)of)financial)turbulence.)In)the)upcoming)section)we)use)regression)analysis)to)see)if)we)can)identify)any)factors)that)are)able)to)explain)our)returns)and)help)us)identify)the)main)drivers)of)profitability)within)pairs)trading.)))
7.8.1. Explanatory,Variables,and,Hypotheses,
As)shown)earlier)in)the)thesis,)the)portfolio)based)on)the)Total)metric)seems)to)yield)the)best)and)most)stable)returns.)With)this)in)mind)we)limit)our)regression)analysis)to)this)portfolio)and)regress)our)preCtransaction)costs)returns)on)different)factors)that)we)believe)can)explain)the)performance)of)the)portfolio.)The)inclusion)of)transaction)costs)can)overshadow)the)real)sources)of)returns,)and)for)that)reason)it)is)omitted)when)we)perform)our)regressions.)However,)the)exclusion)of)transaction)costs)also)has)a)clear)downside.)If)a)factor)is)positive)and)significant)we)can)only)make)implications)on)how)the)factor)affects)our)gross)returns.)The)net)effect)might)actually)be)significant)with)the)opposite)sign)as)exposure)to)some)factors)can)increase)the)transaction)costs)substantially.)For)our)sample,)this)is)particularly)relevant)for)the)liquidity)variables.)Additionally,)we)expect)the)subCportfolios)with)the)largest)number)of)pairs)to)generate)the)most)reliable)results,)as)they)should)be)less)sensitive)to)idiosyncratic)shocks.)In)example)the)top)5)is)likely)to)offer)lower)explanatory)power)than)the)top)30)as)idiosyncratic)risk)plays)a)much)bigger)role)for)the)top)5.)Nevertheless,)we)include)all)the)subC

) 75)
portfolios)in)the)regression)analysis)to)test)the)consistency)of)our)regression)results.)We)use)monthly)data)in)the)regressions,)since)we)do)not)expect)daily)changes)in)risk)factors)to)give)a)clear)relationship)to)our)portfolio)returns,)since)the)variation)in)some)of)our)risk)factors)are)very)small)on)a)daily)basis.)Weekly)returns)could)be)tried)out,)but)we)are)under)the)impression)that)a)longer)time)period)is)necessary)to)capture)the)relationship,)as)some)of)the)factors,)i.e.)liquidity,)are)more)persistent)over)time)(Acharya)and)Pedersen)2005).)Regressing)on)yearly)data)would)obviously)not)work)as)the)data)sample)would)be)way)to)small,)and)yearly)observations)is)not)able)capture)short)and)medium)term)relationships)between)risk)factors)and)our)returns.)In)conclusion,)we)think)monthly)data)will)provide)the)best)foundation)to)test)our)proposed)relationships.))#
7.8.1.1. Market-exposure-
We)expect)our)portfolio)to)be)close)to)market)neutral,)but)would)not)be)surprised)by)a)small)positive)or)negative)beta)exposure.)Since)we)have)a)Euro)neutral)portfolio,)we)are)not)guaranteed)a)low)beta)exposure,)but)in)a)portfolio)with)a)higher)number)of)paired)stocks)that)are)supposed)to)follow)each)other)quite)closely,)we)expect)the)portfolio)to)be)close)to)market)neutral.)In)the)previous)sections)we)calculated)the)beta)based)on)daily)data)and)found)our)returns)to)be)close)to)market)neutral.)In)this)section)we)use)monthly)data)and)expect)it)to)give)a)clearer)picture)of)how)exposed)we)are)to)general)market)trends.)The)sign)of)the)market)coefficient)is)ambiguous,)since)it)depends)on)the)average)difference)in)the)beta)of)our)long)positions)versus)our)short)positions.)Gatev,)Goetzmann)and)Rouwenhorst)(2006))have)both)negative)and)positive)market)exposure,)depending)on)the)independent)variables)in)the)regressions)and)the)number)of)pairs)in)the)portfolio.)The)main)reason)for)the)inclusion)of)market)returns)is)to)control)for)returns)generated)by)our)beta)exposure.)We)want)to)isolate)the)returns)that)are)generated)from)other)sources)of)risk,)and)if)we)do)not)include)market)exposure)in)our)regression,)the)covariance)between)the)independent)variables)and)our)returns)might)just)as)well)be)market)risk.)The)market)return)time)series)are)represented)by)both)the)DAX)and)the)broader)European)Stoxx)600)index)(SXXP),)and)are)monthly)returns)time)series)reported)in)decimals.))

) 76)
7.8.1.2. Fama-&-French-Factors-
As)previously)mentioned)in)the)thesis,)the)HML)and)SMB)factors)presented)by)Fama)and)French)(1992))are)considered)statistical)anomalies)that)have)been)able)to)explain)returns)in)the)past,)thus)we)want)to)include)them)to)see)if)our)returns)are)explained)by)these)factors,)and)if)we)are)able)to)obtain)a)positive)alpha)after)taking)them)into)account.)The)FamaCFrench)factors)(F&F)factors))are)based)on)European)data,)as)they)are)not)available)specifically)for)Germany.)These)time)series)are)also)reported)as)monthly)returns)in)decimals.))The)expected)sign)for)the)HML)factor)is)uncertain.)Our)trading)strategy)does)not)take)book)values)into)account)whatsoever,)but)the)strategy)invests)long)in)stocks)that)lag)behind)their)partner)stocks)in)terms)of)stock)returns.)In)other)words,)the)strategy)buys)the)relatively)cheap)stock)and)short)the)relatively)expensive)stock,)so)the)HML)factor)might)appear)with)a)positive)sign.)If)the)relationship)is)statistically)significant)is,)however,)difficult)to)say.)We)do)not)expect)our)returns)to)be)significantly)related)to)the)SMB)factor,)as)it)is)no)intuitive)explanation)for)why)this)might)be)the)case.)Even)though)we)exclude)all)stocks)below)€1)billion)our)sample)does)not)have)a)clear)overC)or)underweight)in)small)or)large)cap)stocks,)so)a)significant)relation)to)the)SMB)factor)is)unexpected.))
7.8.1.3. Momentum-Momentum)is)a)factor)that)has)proven)to)yield)abnormal)returns)in)the)past)(Carhart)1997;)Asness,)Moskowitz,)and)Pedersen)2013),)and)the)essence)of)a)momentum)strategy)is)to)buy)stocks)that)have)recently)outperformed)and)sell)stocks)that)have)recently)underperformed.))Our)pairs)trading)strategy)short)the)stock)that)performs)the)best)and)invest)long)in)the)stock)that)underperforms)within)a)pair,)thus)it)almost)performs)the)opposite)action)of)the)momentum)trader.)Therefore)we)expect)our)return)series)to)be)negatively)correlated)to)the)momentum)factor.)Along)with)the)F&FCfactors)momentum)is)included)as)a)control)variable)to)see)if)we)still)are)able)to)earn)a)positive)alpha)after)it)is)taken)into)account.)The)monthly)returns)from)the)momentum)time)series)are)reported)in)decimals.))

) 77)
7.8.1.4. Volatility-
Nagel)(2012))finds)evidence)that)the)performance)of)a)liquidity)providing)strategy)can)be)predicted)by)the)VIX)index,)and)furthermore)that)strategies)which)provide)liquidity)to)the)market)perform)especially)well)under)periods)of)financial)turbulence.)Since)we)hypothesize)that)liquidity)provision)might)be)one)of)the)explanations)for)our)returns,)we)include)measures)of)volatility)in)our)regressions.)Moreover,)volatility)is)often)an)important)determinant)of)returns)in)capital)markets,)and)in)our)time)sample)volatility)is)negatively)correlated)with)excess)return)of)both)the)SXXP)index)and)the)DAX)index,)with)coefficients)of)33%)and)41%,)respectively.)The)development)of)the)DAX)Total)Return)index)and)the)volatility)index)is)illustrated)below,)and)the)negative)correlation)is)easily)observed.))Figure!11!
)For)our)traded)portfolio)we)anticipate)a)low)market)exposure)and)present)two)effects)that)can)explain)how)market)volatility)influences)our)returns.)The)monthly)30Cdays)volatility)of)the)DAX)is)used)as)the)main)measure)of)volatility)in)our)regressions,)but)we)also)regress)our)returns)with)respect)to)the)30Cdays)volatility)of)the)SXXP)index.)30Cdays)volatility)covers)the)average)monthly)volatility)in)the)market)and)should)be)an)appropriate)measure)for)the)monthly)data.)A)shock)to)the)volatility)level)can)affect)our)returns)in)two)ways)(1))it)can)force)investors)to)exit)trades)due)to)increased)margin)calls,)higher)required)collateral)or)just)fear,)which)leads)to)a)selling)pressure)that)can)cause)paired)stocks)to)deviate.)If)the)pair)trader)has)open)positions,)increased)volatility)can)hurt)his)returns)as)pairs)might)experience)substantial)divergence,)or)(2))it)can)increase)the)probability)of)opening)a)pair)and)moreover)the)
0)10)20)30)40)50)60)70)80)
0)1000)2000)3000)4000)5000)6000)7000)8000)9000)
DAX!vs!volatility!
Total)Return)DAX) VOLATILITY_30D)

) 78)
frequency)of)crossings)in)our)pairs.)This)can)again)enhance)the)profits)of)our)portfolio.)We)expect)the)second)effect)to)dominate,)hence)we)anticipate)a)positive)coefficient)for)the)volatility)measure)in)our)regressions.)Our)expectations)are)based)on)results)from)previous)research)as)well)as)this)thesis,)which)both)find)evidence)that)pairs)trading)performs)well)in)periods)of)financial)turmoil.)We)conjecture)that)increased)volatility)will)make)pairs)diverge)and)lead)us)to)open)and)close)pairs)more)frequently)and)earn)a)higher)profit.)The)relationship)between)volatility)and)our)returns)can)also)be)nonClinear,)as)the)positive)effect)on)returns)might)be)almost)nonCexistent)except)in)a)very)volatile)market)environment.)This)implies)a)positive)quadratic)term,)which)should)serve)as)an)indication)of)a)convex)relationship)between)our)returns)and)the)market)volatility.)))If)we)are)able)to)predict)the)returns)from)a)pairs)trading)portfolio,)we)can)time)our)trades,)and)in)that)sense)only)initiate)trades)in)periods)where)we)expect)pairs)trading)to)yield)abnormal)profits.)Our)actual)volatility)measure)should)be)a)good)indicator)of)the)current)volatility)in)the)market,)but)we)also)want)to)investigate)if)past)months’)volatility)are)related)to)our)returns.)Since)we)are)uncertain)about)the)timing)of)this)relationship,)we)regress)our)returns)on)volatility)lagged)1)to)6)months.)A)measure)of)implied)volatility)similar)to)the)one)used)by)Nagel)(2012))is)also)included,)as)an)additional)measure)to)investigate)the)relationship)between)volatility)and)our)returns.)We)use)the)specific)VIX)index)for)the)DAX)(VDAX))and)test)if)it)offers)predictive)power)over)the)following)month’s)return.)))Moreover,)high)volatility)in)the)formation)period,)can)also)impact)the)returns)of)our)portfolio.)Stocks)that)follow)each)other,)even)in)a)volatile)market)environment,)might)be)more)robust)than)pairs)identified)in)relatively)calm)markets.)Thus)the)chance)of)constructing)pairs)based)on)pure)randomness)might)be)smaller.)To)test)the)hypothesis)that)a)volatile)market)environment)will)help)us)identify)higher)quality)pairs,)we)include)volatility)lagged)12)months.)A)12)months)lagged)series)means)that)we)regress)volatility)in)January)2011)on)returns)in)January)2012,)so)it)is)an)imperfect)measure)of)the)volatility)in)the)formation)period,)but)might)offer)some)value)as)it)indicates)if)pairs)were)formed)in)a)volatile)market)environment.)Furthermore,)the)persistence)in)the)volatility)of)the)market)environment)should)offer)some)support)to)this)measure)even)if)it)is)quite)flawed.))

) 79)
7.8.1.5. Liquidity-
Previous)literature)(Do)and)Faff)2010;)Gatev,)Goetzmann,)and)Rouwenhorst)2006))claim)that)pairs)trading)works)particularly)well)in)periods)of)financial)crises,)where)it)is)reasonable)to)believe)that)liquidity)conditions)are)poor.)In)financial)crises)market)liquidity)usually)dries)up,)which)can)cause)prices)to)deviate)from)their)fundamental)values)as)investors)sell)off)assets.)Stocks)that)normally)follow)each)other)closely)can)diverge)due)to)this)selling)pressure,)which)results)in)an)opportunity)to)enter)trades.)Pairs)traders)take)the)role)as)liquidity)providers)in)these)situations.)They)buy)stocks)that)decline)relative)to)their)partner)stock)and)sell)the)stock)that)does)relatively)well,)and)can)earn)profits)in)accordance)with)the)theory)introduced)by)Acharya)and)Pedersen)(2005).)Hence,)we)expect)pairs)trading)profits)to)be)negatively)correlated)with)liquidity)in)the)market.))In)our)regression)analysis,)we)are)not)able)to)identify)the)average)liquidity)of)stocks)held)long)versus)stocks)held)short,)because)we)have)no)measure)of)liquidity)for)individual)stocks.)Despite)this)we)argue)that)it)is)reasonable)to)assume)that)due)to)the)flight)to)liquidity,)introduced)by)Acharya)and)Pedersen)(2005),)the)pairs)trader)will)end)up)buying)illiquid)and)selling)liquid)stocks,)because)the)latter)increase)in)value)relative)to)its)peers)as)a)result)of)excess)demand.)Thus)we)consider)the)premium)for)holding)stocks)that)becomes)illiquid)during)market)decline)to)be)relevant)for)the)pairs)trader.)Moreover,)since)the)pairs)trader)shorts)the)stock)in)the)pair)that)have)done)relatively)well)and)invests)long)in)the)stock)that)has)yielded)relatively)poor)returns,)the)pairs)trader)will)end)up)selling)stocks)that)performs)relatively)well)in)a)crisis)and)buying)stocks)that)performs)relatively)poorly)in)a)crisis.)This)effect)is)also)explained)by)Acharya)and)Pedersen,)and)should)give)the)pairs)trader)a)premium)for)provision)of)liquidity,)as)it)meets)the)demand)for)liquid)stocks)in)a)poor)return)market)environment.)As)mentioned,)we)are)not)able)to)address)which)of)the)three)effects)introduced)by)Acharya)and)Pedersen,)which)determine)the)profits)within)pairs)trading.)))We)regress)our)returns)on)two)different)measures)of)liquidity)(1))trading)volumes)and)(2))the)US)and)the)Euro)TED)spreads8.)For)trading)volume)we)use)data)from)the)DAX)index)and)SXXP)index)as)proxies)for)market)for)liquidity.)The)volume)for)the)DAX)index)should)be)a)good)proxy)for)the)market)liquidity)in)the)German)stock)market,)while)the)volume)of)the)SXXP)index)is)suggested)as)a)broader)measure)of)market)liquidity)in)the)European)market.)The)))))))))))))))))))))))))))))))))))))))))))))))))))))))))8)The)Euro)TED)spread)will)be)abbreviated)EU)TED)spread)for)the)remainder)of)the)thesis.))
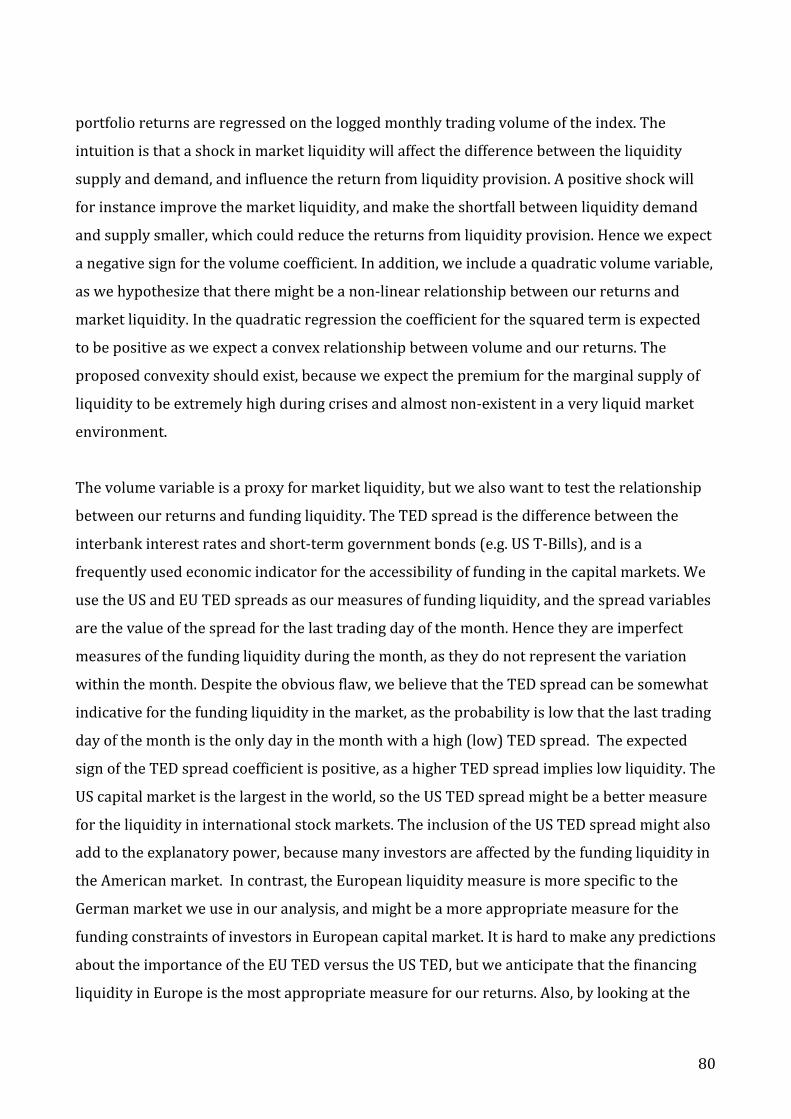
) 80)
portfolio)returns)are)regressed)on)the)logged)monthly)trading)volume)of)the)index.)The)intuition)is)that)a)shock)in)market)liquidity)will)affect)the)difference)between)the)liquidity)supply)and)demand,)and)influence)the)return)from)liquidity)provision.)A)positive)shock)will)for)instance)improve)the)market)liquidity,)and)make)the)shortfall)between)liquidity)demand)and)supply)smaller,)which)could)reduce)the)returns)from)liquidity)provision.)Hence)we)expect)a)negative)sign)for)the)volume)coefficient.)In)addition,)we)include)a)quadratic)volume)variable,)as)we)hypothesize)that)there)might)be)a)nonClinear)relationship)between)our)returns)and)market)liquidity.)In)the)quadratic)regression)the)coefficient)for)the)squared)term)is)expected)to)be)positive)as)we)expect)a)convex)relationship)between)volume)and)our)returns.)The)proposed)convexity)should)exist,)because)we)expect)the)premium)for)the)marginal)supply)of)liquidity)to)be)extremely)high)during)crises)and)almost)nonCexistent)in)a)very)liquid)market)environment.))The)volume)variable)is)a)proxy)for)market)liquidity,)but)we)also)want)to)test)the)relationship)between)our)returns)and)funding)liquidity.)The)TED)spread)is)the)difference)between)the)interbank)interest)rates)and)shortCterm)government)bonds)(e.g.)US)TCBills),)and)is)a)frequently)used)economic)indicator)for)the)accessibility)of)funding)in)the)capital)markets.)We)use)the)US)and)EU)TED)spreads)as)our)measures)of)funding)liquidity,)and)the)spread)variables)are)the)value)of)the)spread)for)the)last)trading)day)of)the)month.)Hence)they)are)imperfect)measures)of)the)funding)liquidity)during)the)month,)as)they)do)not)represent)the)variation)within)the)month.)Despite)the)obvious)flaw,)we)believe)that)the)TED)spread)can)be)somewhat)indicative)for)the)funding)liquidity)in)the)market,)as)the)probability)is)low)that)the)last)trading)day)of)the)month)is)the)only)day)in)the)month)with)a)high)(low))TED)spread.))The)expected)sign)of)the)TED)spread)coefficient)is)positive,)as)a)higher)TED)spread)implies)low)liquidity.)The)US)capital)market)is)the)largest)in)the)world,)so)the)US)TED)spread)might)be)a)better)measure)for)the)liquidity)in)international)stock)markets.)The)inclusion)of)the)US)TED)spread)might)also)add)to)the)explanatory)power,)because)many)investors)are)affected)by)the)funding)liquidity)in)the)American)market.))In)contrast,)the)European)liquidity)measure)is)more)specific)to)the)German)market)we)use)in)our)analysis,)and)might)be)a)more)appropriate)measure)for)the)funding)constraints)of)investors)in)European)capital)market.)It)is)hard)to)make)any)predictions)about)the)importance)of)the)EU)TED)versus)the)US)TED,)but)we)anticipate)that)the)financing)liquidity)in)Europe)is)the)most)appropriate)measure)for)our)returns.)Also,)by)looking)at)the)
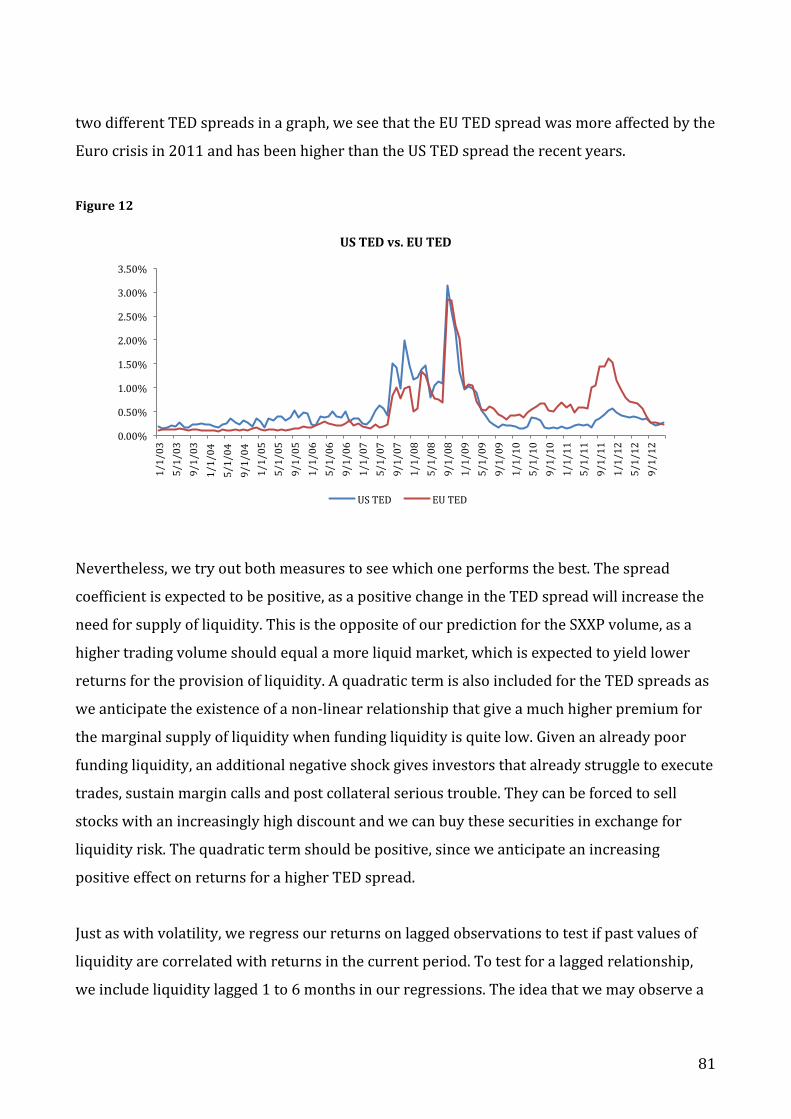
) 81)
two)different)TED)spreads)in)a)graph,)we)see)that)the)EU)TED)spread)was)more)affected)by)the)Euro)crisis)in)2011)and)has)been)higher)than)the)US)TED)spread)the)recent)years.))Figure!12!
))Nevertheless,)we)try)out)both)measures)to)see)which)one)performs)the)best.)The)spread)coefficient)is)expected)to)be)positive,)as)a)positive)change)in)the)TED)spread)will)increase)the)need)for)supply)of)liquidity.)This)is)the)opposite)of)our)prediction)for)the)SXXP)volume,)as)a)higher)trading)volume)should)equal)a)more)liquid)market,)which)is)expected)to)yield)lower)returns)for)the)provision)of)liquidity.)A)quadratic)term)is)also)included)for)the)TED)spreads)as)we)anticipate)the)existence)of)a)nonClinear)relationship)that)give)a)much)higher)premium)for)the)marginal)supply)of)liquidity)when)funding)liquidity)is)quite)low.)Given)an)already)poor)funding)liquidity,)an)additional)negative)shock)gives)investors)that)already)struggle)to)execute)trades,)sustain)margin)calls)and)post)collateral)serious)trouble.)They)can)be)forced)to)sell)stocks)with)an)increasingly)high)discount)and)we)can)buy)these)securities)in)exchange)for)liquidity)risk.)The)quadratic)term)should)be)positive,)since)we)anticipate)an)increasing)positive)effect)on)returns)for)a)higher)TED)spread.))Just)as)with)volatility,)we)regress)our)returns)on)lagged)observations)to)test)if)past)values)of)liquidity)are)correlated)with)returns)in)the)current)period.)To)test)for)a)lagged)relationship,)we)include)liquidity)lagged)1)to)6)months)in)our)regressions.)The)idea)that)we)may)observe)a)
0.00%)
0.50%)
1.00%)
1.50%)
2.00%)
2.50%)
3.00%)
3.50%)
1/1/03)
5/1/03)
9/1/03)
1/1/04)
5/1/04)
9/1/04)
1/1/05)
5/1/05)
9/1/05)
1/1/06)
5/1/06)
9/1/06)
1/1/07)
5/1/07)
9/1/07)
1/1/08)
5/1/08)
9/1/08)
1/1/09)
5/1/09)
9/1/09)
1/1/10)
5/1/10)
9/1/10)
1/1/11)
5/1/11)
9/1/11)
1/1/12)
5/1/12)
9/1/12)
US!TED!vs.!EU!TED!
US)TED) EU)TED)

) 82)
lead)lag)relationship)can)be)related)to)the)theory)of)Acharya)and)Pedersen)(2005).)The)simple)intuition)is)that)the)expected)return)increases)because)the)pairs)trading)investor)is)exposed)to)additional)liquidity)risks,)but)that)does)not)mean)that)the)portfolio)experiences)an)instant)boost)in)its)profit.)It)might)take)time)before)the)profit)is)realized,)so)the)lagged)variables)might)help)us)pick)up)when)the)investors)actually)profits)from)the)additional)risk)exposure.)))As)a)final)remark,)we)avoid)the)inclusion)of)liquidity)and)volatility)in)the)same)regressions,)as)it)is)likely)to)cause)mulitcollinearity)issues.)Instead)we)regress)on)them)separately)to)see)if)both)can)explain)our)pairs)trading)returns,)but)a)significant)drawback)is)that)we)are)not)able)to)completely)isolate)the)effect)of)the)two)variables.)The)consequence)is)a)slightly)biased)coefficient,)as)part)of)the)effect)might)be)explained)by)a)positive)covariance)between)the)included)regressor)and)the)omitted)variable.))
7.8.2. Regression,results,
This)section)reports)the)results)from)our)regression)analysis,)and)discusses)the)validity)of)our)hypotheses.)We)do)not)report)results)for)every)single)regression,)as)different)measures)of)e.g.)market)exposure,)liquidity)or)volatility)usually)yield)the)same)results.)In)the)upcoming)discussion)we)only)report)the)regressions)with)DAX)index)as)the)market)variable,)DAX)trading)volume)as)the)market)liquidity)variable)and)the)EU)TED)spread)as)the)funding)liquidity)variable.)The)results)for)similar)variables,)like)the)US)TED)spread)and)SXXP)volume,)are)provided)in)the)appendix)(A.5.).)))Since)time)series)data)often)struggles)with)serial)correlation)in)the)errors)(autocorrelation),)we)investigate)if)this)is)a)problem)for)our)dataset.)The)regression)models)are)tested)using)the)Durbin)Watson)test)statistics)and)as)we)find)evidence)of)autocorrelation)in)most)of)our)regression,)we)use)the)NeweyCWest)standard)errors)for)all)regressions.)They)adjust)for)both)autocorrelation)and)heteroskedasticity,)and)guarantee)consistent)estimates.)The)estimates)are,)however,)less)efficient,)which)makes)it)more)difficult)to)find)statistically)significant)results9.)In)the)interpretation)of)the)results)our)main)focus)is)on)the)top)30)results,)as)these)
))))))))))))))))))))))))))))))))))))))))))))))))))))))))9)For)the)NeweyCWest)standard)errors)we)use)the)rule)of)thumb,)N1/4,)for)number)of)lags,)and)find)approximately)3)lags.)N)is)the)number)of)observations.)Three)months)lag)also)seems)reasonable)to)the)authors.)))
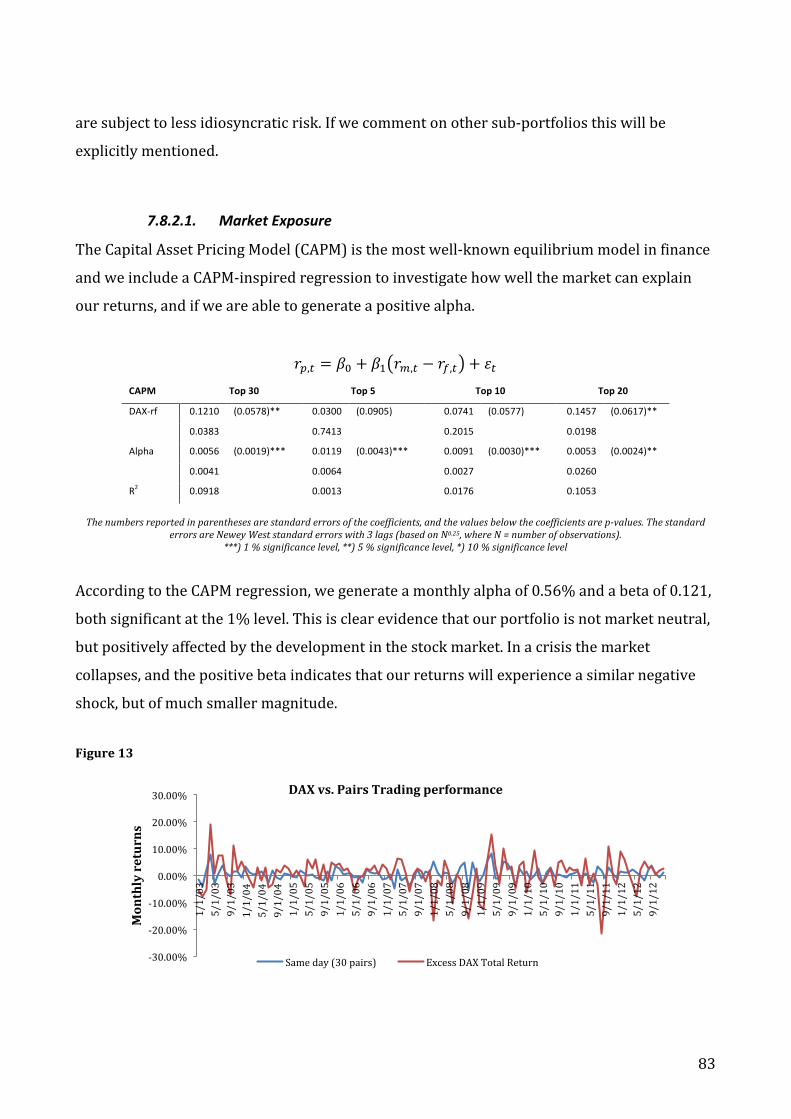
) 83)
are)subject)to)less)idiosyncratic)risk.)If)we)comment)on)other)subCportfolios)this)will)be)explicitly)mentioned.))
7.8.2.1. Market-Exposure-
The)Capital)Asset)Pricing)Model)(CAPM))is)the)most)wellCknown)equilibrium)model)in)finance)and)we)include)a)CAPMCinspired)regression)to)investigate)how)well)the)market)can)explain)our)returns,)and)if)we)are)able)to)generate)a)positive)alpha.))
!!,! = !! + !! !!,! − !!,! + !!)CAPM, Top,30, Top,5, Top,10, Top,20,
DAXIrf' 0.1210' (0.0578)**' 0.0300' (0.0905)' 0.0741' (0.0577)' 0.1457' (0.0617)**'
'' 0.0383' '' 0.7413' '' 0.2015' '' 0.0198' ''
Alpha' 0.0056' (0.0019)***' 0.0119' (0.0043)***' 0.0091' (0.0030)***' 0.0053' (0.0024)**'
'' 0.0041' '' 0.0064' '' 0.0027' '' 0.0260' ''
R2' 0.0918' '' 0.0013' '' 0.0176' '' 0.1053' ''
)
The#numbers#reported#in#parentheses#are#standard#errors#of#the#coefficients,#and#the#values#below#the#coefficients#are#p9values.#The#standard#errors#are#Newey#West#standard#errors#with#3#lags#(based#on#N0.25,#where#N#=#number#of#observations).##
***)#1#%#significance#level,#**)#5#%#significance#level,#*)#10#%#significance#level#)According)to)the)CAPM)regression,)we)generate)a)monthly)alpha)of)0.56%)and)a)beta)of)0.121,)both)significant)at)the)1%)level.)This)is)clear)evidence)that)our)portfolio)is)not)market)neutral,)but)positively)affected)by)the)development)in)the)stock)market.)In)a)crisis)the)market)collapses,)and)the)positive)beta)indicates)that)our)returns)will)experience)a)similar)negative)shock,)but)of)much)smaller)magnitude.))!
Figure!13!
)C30.00%)
C20.00%)
C10.00%)
0.00%)
10.00%)
20.00%)
30.00%)
1/1/03)
5/1/03)
9/1/03)
1/1/04)
5/1/04)
9/1/04)
1/1/05)
5/1/05)
9/1/05)
1/1/06)
5/1/06)
9/1/06)
1/1/07)
5/1/07)
9/1/07)
1/1/08)
5/1/08)
9/1/08)
1/1/09)
5/1/09)
9/1/09)
1/1/10)
5/1/10)
9/1/10)
1/1/11)
5/1/11)
9/1/11)
1/1/12)
5/1/12)
9/1/12)
Monthly!returns!
DAX!vs.!Pairs!Trading!performance!
Same)day)(30)pairs)) Excess)DAX)Total)Return)

) 84)
The)yearly)returns)of)our)portfolio)during)crises)are)positive)and)substantially)higher)than)the)market.)In)other)words,)it)does)not)seem)to)be)notably)affected)by)a)market)decline.)Figure)13)illustrates)the)difference)between)the)monthly)return)series)for)our)30)pairs)portfolio)and)the)excess)market)return)(DAX).)Our)portfolio)avoids)the)big)hits)the)market)experiences)in)2008,)2009)and)2011,)and)yields)a)better)return)than)the)market)in)all)these)years.))The)CAPM)regression)is)only)able)to)explain)0.0918)of)our)returns,)so)we)expect)to)find)additional)explanatory)power)by)including)other)factors)in)our)regressions.)Gatev,)Goetzmann)and)Rouwenhorst)(2006))find)a)negative)beta,)which)is)larger)than)our)beta)in)absolute)terms.)The)two)strategies)are)slightly)different,)since)we)rebalance)daily,)and)that)is)most)likely)one)of)the)reasons)for)the)different)results.)It)is,)however,)hard)to)perfectly)understand)the)difference,)because)the)traded)portfolios)are)in)different)time)periods)and)market)environments.))
7.8.2.2. FamaNFrench-Factors-
The)FamaCFrench)factors)have)shown)the)ability)to)explain)returns)in)the)past,)so)we)include)them)to)see)if)they)can)help)explain)the)performance)of)our)portfolio.)))
!!,! = !! + !! !!,! − !!,! + !!!"#! + !!!"#! + !!))
F&F, Top,30, Top,5, Top,10, Top,20,
DAXIrf' 0.0874' (0.0649)' 0.0401' (0.0906)' 0.0583' (0.0683)' 0.1256' (0.0732)*'
'' 0.1807' '' 0.6588' '' 0.3953' '' 0.0888' ''
SMB' I0.0153' (0.0903)' I0.1276' (0.2264)' I0.0438' (0.1418)' 0.0064' (0.1127)'
'' 0.8659' '' 0.5740' '' 0.7578' '' 0.9547' ''
HML' 0.1906' (0.1532)' I0.0968' (0.2819)' 0.0784' (0.2142)' 0.1144' (0.1505)'
'' 0.2159' '' 0.7320' '' 0.7150' '' 0.4486' ''
Alpha' 0.0055' (0.0019)***' 0.0122' (0.0044)***' 0.0092' (0.0030)***' 0.0053' (0.0024)**'
'' 0.0051' '' 0.0061' '' 0.0030' '' 0.0273' ''
R2' 0.1137' '' 0.0051' '' 0.0201' '' 0.1115' ''
)
The#numbers#reported#in#parentheses#are#standard#errors#of#the#coefficients,#and#the#values#below#the#coefficients#are#p9values.#The#standard#errors#are#Newey#West#standard#errors#with#3#lags#(based#on#N0.25,#where#N#=#number#of#observations).##
***)#1#%#significance#level,#**)#5#%#significance#level,#*)#10#%#significance#level##
)

) 85)
After)we)take)the)F&FCfactors)into)account)we)still)generate)a)significant)positive)alpha)of)0.55%)and)the)DAX)becomes)insignificant)for)all)subCportfolios)except)top)20.)Both)the)HML)and)SMB)factors)are)insignificant,)hence)consistent)with)our)hypothesis,)it)does)not)seem)like)the)two)F&FCfactors)are)the)source)of)our)returns.)Compared)to)the)CAPM)regression,)the)explanatory)power)increases)slightly)to)an)r2)of)0.1137,)but)this)is)probably)due)to)the)increased)number)of)regressors.)))
7.8.2.3. Momentum-
As)we)continue)the)search)for)factors)that)might)help)explain)our)returns,)we)include)the)momentum)factor)in)the)regression.)))
!!,! = !! + !! !!,! − !!,! + !!!"#! + !!!"#! + !!!"#! + !!))
F&F,+,
Mom, Top,30, Top,5, Top,10, Top,20,
DAXIrf' 0.0357' (0.0477)' I0.0094' (0.0996)' 0.0192' (0.0648)' 0.0767' (0.0553)'
'' 0.4558' '' 0.9250' '' 0.7673' '' 0.1678' ''
SMB' I0.0508' (0.1024)' I0.1616' (0.2327)' I0.0706' (0.1440)' I0.0400' (0.1178)'
'' 0.6211' '' 0.4887' '' 0.6245' '' 0.7350' ''
HML' 0.0249' (0.1363)' I0.2555' (0.2837)' I0.0469' (0.2054)' I0.0424' (0.1420)'
'' 0.8556' '' 0.3697' '' 0.8199' '' 0.7661' ''
WML' I0.2473' (0.0497)***' I0.2369' (0.0973)**' I0.1869' (0.0661)***' I0.2339' (0.0604)***'
'' 0.0000' '' 0.0165' '' 0.0055' '' 0.0002' ''
Alpha' 0.0076' (0.0017)***' 0.0141' (0.0046)***' 0.0107' (0.0031)***' 0.0072' (0.0022)***'
'' 0.0000' '' 0.0026' '' 0.0007' '' 0.0014' ''
R2' 0.2661' '' 0.0366' '' 0.0646' '' 0.2193' ''
)
The#numbers#reported#in#parentheses#are#standard#errors#of#the#coefficients,#and#the#values#below#the#coefficients#are#p9values.#The#standard#errors#are#Newey#West#standard#errors#with#3#lags#(based#on#N0.25,#where#N#=#number#of#observations).##
***)#1#%#significance#level,#**)#5#%#significance#level,#*)#10#%#significance#level#
)The)F&FCfactors)are)still)insignificant,)as)in)the)previous)regression,)but)the)momentum)factor)is)highly)significant)(1%))and)has)a)coefficient)of)C0.2473.)This)is)in)line)with)our)expectations,)because)momentum)is)betting)on)a)continuation)of)the)trend,)while)our)investment)strategy)buys)stocks)that)have)recently)underperformed)and)sell)recent)outperformers)in)a)pair.)As)mentioned)earlier,)the)trading)pattern)of)our)strategy)makes)it)a)contrarian)strategy,)which)has)a)several)similarities)to)a)simple)reversal)strategy.)The)intercept)stays)significant)and)

) 86)
when)the)momentum)factor)is)taken)into)account,)our)monthly)alpha)actually)increases)to)0.77%.)Moreover,)the)explanatory)power)almost)triples)to)0.2661,)so)our)returns)seems)to)be)strongly)related)to)momentum.)Moving)on,)we)take)the)focus)away)from)statistical)anomalies)and)look)at)other)risk)factors)that)might)explain)our)returns.))
7.8.2.4. Volatility--
Next,)we)look)at)how)our)returns)vary)with)volatility,)and)we)hypothesized)a)positive)correlation)between)our)own)returns)and)volatility.))
!!,! = !! + !! !!,! − !!,! + !!!"#30!"#$! + !!))
Volatility, Top,30, Top,5, Top,10, Top,20,
DAX' 0.1457' (0.0588)**' 0.0853' (0.0760)' 0.1005' (0.0567)*' 0.1721' (0.0629)***'
'
0.0147'
'
0.2644'
'
0.0792'
'
0.0072'
'DAXvol30' 0.0004' (0.0002)*' 0.0009' (0.0004)**' 0.0004' (0.0002)*' 0.0004' (0.0002)**'
'
0.0649'
'
0.0269'
'
0.0584'
'
0.0486'
'Alpha' I0.0030' (0.0048)' I0.0074' (0.0094)' I0.0001' (0.0058)' I0.0039' (0.0053)'
'
0.5312'
'
0.4287'
'
0.9846'
'
0.4633'
'R2' 0.1256'
'
0.0396'
'
0.0375'
'
0.1359'
'#
The#numbers#reported#in#parentheses#are#standard#errors#of#the#coefficients,#and#the#values#below#the#coefficients#are#p9values.#The#standard#errors#are#Newey#West#standard#errors#with#3#lags#(based#on#N0.25,#where#N#=#number#of#observations).##
***)#1#%#significance#level,#**)#5#%#significance#level,#*)#10#%#significance#level#)When)we)regress)our)returns)on)volatility,)we)find)a)coefficient)of)0.0004,)and)it)is)significant)at)10%.)This)means)that)a)oneCpoint)increase)in)the)volatility)index)will)increase)our)monthly)returns)by)0.04%.)This)looks)like)a)relatively)small)coefficient,)but)the)volatility)index)in)the)trading)period)varies)between)10)and)70)with)a)standard)deviation)of)11.30,)so)volatility)seems)to)be)an)important)driver)of)our)returns.)For)instance,)a)two)standard)deviation)increase)will)improve)our)monthly)returns)by)approximately)0.9%,)which)adds)up)to)10.8%)per)annum.)The)market)returns)are)included)as)a)control)variable)to)ensure)that)the)identified)correlation)is)not)just)a)consequence)of)our)exposure)to)market)returns.)The)market)coefficient)increases)to)0.1457,)and)is)significant)at)5%.)All)our)subCportfolios)have)a)positive)volatility)coefficient)and)are)significant)at)either)5%)or)10%,)so)the)relationship)appears)to)be)quite)consistent.)The)alpha)is)now)negative)(C0.003))and)insignificant,)thus)it)does)not)seem)like)we)are)able)to)generate)excess)returns)once)the)volatility)exposure)is)taken)into)account.)

) 87)
The)explanatory)power)in)the)regression)is)only)12.56%,)so)we)are)still)unable)to)explain)a)large)fraction)of)the)returns.))We)hypothesized)that)the)relationship)between)volatility)and)our)returns)are)nonClinear,)and)we)include)a)quadratic)term)in)the)regression)to)test)if)this)is)the)case.))
!!,! = !! + !! !!,! − !!,! + !!!"#30!"#$! + !!!"#30!"#$!! + !!))
Volatility, Top,30, Top,5, Top,10, Top,20,
DAX' 0.1446' (0.0574)**' 0.0883' (0.0806)' 0.0999' (0.0563)*' 0.1708' (0.0611)***'
'' 0.0132' '' 0.2755' '' 0.0788' '' 0.0061' ''
DAXvol30' 0.0012' (0.0007)' I0.0013' (0.0012)' 0.0008' (0.0008)' 0.0014' (0.0007)**'
'' 0.1122' '' 0.2872' '' 0.3147' '' 0.0376' ''
DAXvol30^2' I0.00001' (0.0000)' 0.00003' (0.0000)*' I0.00001' (0.0000)' I0.00001' (0.0000)'
'' 0.2949' '' 0.0571' '' 0.6212' '' 0.1349' ''
Alpha' I0.0123' (0.0087)' 0.0189' (0.0156)' I0.0051' (0.0098)' I0.0153' (0.0081)*'
'' 0.1605' '' 0.2278' '' 0.5990' '' 0.0617' ''
R2' 0.1372' '' 0.0608' '' 0.0392' '' 0.1498' ''
)
The#numbers#reported#in#parentheses#are#standard#errors#of#the#coefficients,#and#the#values#below#the#coefficients#are#p9values.#The#standard#errors#are#Newey#West#standard#errors#with#3#lags#(based#on#N0.25,#where#N#=#number#of#observations).##
***)#1#%#significance#level,#**)#5#%#significance#level,#*)#10#%#significance#level#)Three)out)of)four)coefficients)are)negative)and)support)a)concave)relationship)between)volatility)and)our)returns.)This)implies)a)decreasing)return)for)the)marginal)increase)in)volatility)for)higher)values,)but)we)should)not)put)too)much)emphasis)on)these)results)as)they)appear)insignificant.)The)only)significant)result)supports)our)hypothesized)convex)effect.)The)quadratic)term)is)significant)at)a)10%)level)for)the)top)5)subCportfolio,)but)the)lack)of)consistency)across)subCportfolios)and)the)size)of)the)coefficients)do)not)indicate)a)nonClinear)relationship.)The)results)when)we)replace)the)DAX)measures)with)SXXP)and)the)SXXP)volatility)index)is)also)unable)to)identify)a)nonClinear)relationship.)In)conclusion)we)find)conflicting)coefficients)and)no)clear)evidence)of)a)nonClinear)relationship)between)our)returns)and)volatility.)#

) 88)
7.8.2.5. Liquidity-
)As)our)hypothesis)states)we)conjecture)that)provision)of)liquidity)might)explain)a)part)of)the)returns)in)our)portfolio,)and)we)look)closer)at)the)results)in)the)table)below.)Different)measures)of)liquidity)might)affect)our)returns,)so)we)start)by)looking)at)the)relationship)between)market)liquidity)and)our)returns)before)we)move)on)to)funding)liquidity.)))
Market)liquidity))Trading)volume)is)included)in)the)CAPMCregression)to)see)if)our)returns)are)related)to)the)liquidity)in)the)market.)))
!!,! = !! + !! !!,! − !!,! + !!!"#$%! + !!)Liquidity,
(volume), Top,30, Top,5, Top,10, Top,20,
DAX' 0.1365' (0.0591)**' 0.0348' (0.0905)' 0.0819' (0.0586)' 0.1522' (0.0655)**'
'' 0.0227' '' 0.7014' '' 0.1651' '' 0.0218' ''
log(DAXvm)' 0.0085' (0.0092)' 0.0026' (0.0173)' 0.0043' (0.0111)' 0.0035' (0.0099)'
'' 0.3597' '' 0.8794' '' 0.7031' '' 0.7202' ''
Alpha' I0.0222' (0.0293)' 0.0033' (0.0559)' I0.0048' (0.0361)' I0.0063' (0.0312)'
'' 0.4505' '' 0.9535' '' 0.8940' '' 0.8406' ''
R2' 0.0999' '' 0.0014' '' 0.0187' '' 0.1064' ''
)
The#numbers#reported#in#parentheses#are#standard#errors#of#the#coefficients,#and#the#values#below#the#coefficients#are#p9values.#The#standard#errors#are#Newey#West#standard#errors#with#3#lags#(based#on#N0.25,#where#N#=#number#of#observations).##
***)#1#%#significance#level,#**)#5#%#significance#level,#*)#10#%#significance#level#)The)volume)measure)for)SXXP)and)DAX)turn)out)to)be)highly)insignificant)for)all)subCportfolios,)and)the)coefficients)have)different)signs)depending)on)the)use)of)SXXP)volume)(C0.0049))or)DAX)volume)(0.0085))as)the)market)liquidity)variable.)Since)our)coefficients)are)inconsistent)and)insignificant,)we)cannot)claim)the)existence)of)any)relationship)between)market)liquidity)and)our)returns.)The)quadratic)terms)for)SXXP)and)DAX)volume)also)display)inconsistent)signs)for)the)coefficients)and)appear)insignificant.)In)conclusion)we)are)unable)to)find)any)relationship)between)pairs)trading)and)market)liquidity,)either)linear)or)nonClinear.)A)potential)reason)for)the)lack)of)results)might)also)be)that)trading)volumes)are)imperfect)measures)of)market)liquidity)and)do)not)capture)the)relationship)between)market)liquidity)and)our)portfolio)returns.))

) 89)
Funding)Liquidity))Even)if)market)liquidity)does)not)explain)our)returns,)funding)liquidity)might)be)a)better)measure)to)capture)our)proposed)returns)from)liquidity)provision.))
!!,! = !! + !! !!,! − !!,! + !!!"#!!" + !!))
Liquidity, Top,30, Top,5, Top,10, Top,20,
DAX' 0.1453' (0.0625)**' 0.0516' (0.0880)' 0.0994' (0.0613)' 0.1664' (0.0661)**'
'' 0.0218' '' 0.5584' '' 0.1074' '' 0.0131' ''
EUTED' 0.9142' (0.3875)**' 0.8143' (0.8284)' 0.9529' (0.4517)**' 0.7792' (0.4070)*'
'' 0.0200' '' 0.3277' '' 0.0370' '' 0.0580' ''
Intercept' 0.0007' (0.0028)' 0.0075' (0.0061)' 0.0040' (0.0039)' 0.0011' (0.0033)'
'' 0.8085' '' 0.2165' '' 0.3003' '' 0.7307' ''
R2' 0.1303' '' 0.0082' '' 0.0390' '' 0.1274' ''
)
The#numbers#reported#in#parentheses#are#standard#errors#of#the#coefficients,#and#the#values#below#the#coefficients#are#p9values.#The#standard#errors#are#Newey#West#standard#errors#with#3#lags#(based#on#N0.25,#where#N#=#number#of#observations).##
***)#1#%#significance#level,#**)#5#%#significance#level,#*)#10#%#significance#level#))Both)the)US)and)the)EU)TED)spread)are)positively)correlated)with)our)returns.)The)top)30)portfolio)has)a)coefficient)of)0.9142,)which)is)significant)at)a)5%,)and)the)relationship)seems)to)be)quite)consistent)across)subCportfolios.)The)interpretation)is)that)a)1)bp)increase)in)the)EU)TED)spread,)increases)our)monthly)returns)by)0.9142)bps.)In)our)data)sample,)the)EU)TED)spread)usually)varies)in)the)interval)of)10C50)bps,)but)the)average)spread)in)our)sample,)based)on)monthly)data,)is)around)50)bps)with)a)standard)deviation)of)50)bps)for)both)the)EU)and)US)TED)spread.)The)averages)and)the)standard)deviations)are)very)much)affected)by)the)liquidity)crunch)in)the)financial)crisis,)so)the)medians)are)substantially)lower)(33)bps)and)35)bps)for)the)EU)and)US)TED)spreads,)respectively).)To)put)our)results)into)context,)an)increase)in)the)TED)spread)by)100)bps,)will)lead)to)an)increase)of)0.9142)%Cpoints)in)our)monthly)returns,)which)adds)up)to)around)11%)annually.)However,)the)difference)between)the)maximum)and)minimum)in)our)sample)is)only)300)bps,)so)a)100)bps)increase)is)considered)a)very)drastic)change)in)funding)liquidity.)Even)though)such)an)increase)rarely)happens,)funding)liquidity)still)seems)to)play)a)central)role)as)a)source)of)return.)Our)results)are)approximately)the)same)across)subCportfolios)for)the)US)TED)spread,)and)the)difference)is)also)small)when)we)replace)the)DAX)with)the)SXXP.)They)should)serve)as)an)indication)that)our)strategy)performs)better)

) 90)
in)poor)liquidity)conditions)and)credit)crunches,)for)instance)during)the)financial)crises,)and)are)consistent)with)Acharya)and)Pedersen)(2005),)who)argue)that)liquidity)provision)must)be)compensated.))The)explanatory)power)is)still)only)13.03%,)so)liquidity)does)not)seem)to)be)the)main)source)of)return)for)our)pairs)trading)strategy.))Asness,)Moskowitz)and)Pedersen)(2013))find)a)positive)relationship)between)liquidity)risk)and)momentum.)As)we)want)to)isolate)the)effect)of)funding)liquidity)we)include)momentum)in)the)regression)to)control)for)the)covariance)between)the)two)variables.)The)coefficient)of)the)EU)TED)spread)is)still)significant)at)the)1%)level)after)the)inclusion)of)momentum,)but)it)is)slightly)reduce)to)0.8832)(reported)in)the)appendix)A.5.1.5.3).)This)is)evidence)that)funding)liquidity)has)explanatory)power)beyond)momentum)and)confirm)that)our)strategy)receive)compensation)for)providing)liquidity)in)the)market.))We)expect)the)compensation)for)the)marginal)supply)of)liquidity)to)be)especially)good)in)an)illiquid)market)environment,)which)makes)it)interesting)to)test)for)a)nonClinear)between)liquidity)and)our)returns.)))
!!,! = !! + !! !!,! − !!,! + !!!"#!!" + !!!"#!!"! + !!))
Liquidity, Top,30, Top,5, Top,10, Top,20,
DAX' 0.1419' (0.0628)**' 0.0519' (0.0896)' 0.0927' (0.0623)' 0.1643' (0.0672)**'
'' 0.0257' '' 0.5639' '' 0.1392' '' 0.0160' ''
EUTED' 1.5669' (0.8819)*' 0.7701' (2.1131)' 2.2380' (1.2948)*' 1.1900' (0.9626)'
'' 0.0782' '' 0.7162' '' 0.0866' '' 0.2189' ''
EUTED2' I30.3800' (39.9280)' 2.0580' (89.2744)' I59.8100' (48.4598)' I19.1000' (38.6230)'
'' 0.4483' '' 0.9816' '' 0.2196' '' 0.6219' ''
Intercept' I0.0011' (0.0034)' 0.0076' (0.0077)' 0.0006' (0.0047)' 0.0000' (0.0040)'
'' 0.7548' '' 0.3238' '' 0.8997' '' 0.9941' ''
R2' 0.1342' '' 0.0082' '' 0.0467' '' 0.1286' ''
)
The#numbers#reported#in#parentheses#are#standard#errors#of#the#coefficients,#and#the#values#below#the#coefficients#are#p9values.#The#standard#errors#are#Newey#West#standard#errors#with#3#lags#(based#on#N0.25,#where#N#=#number#of#observations).##
***)#1#%#significance#level,#**)#5#%#significance#level,#*)#10#%#significance#level#)When)we)regress)our)returns)on)both)the)linear)and)nonClinear)liquidity)term,)we)find)no)evidence)of)a)nonClinear)relationship.)Our)results)also)appear)inconsistent)across)subC

) 91)
portfolios)and)the)sign)of)the)coefficient)for)both)the)EU)and)US)TED)offers)no)significant)results.)))
7.8.2.6. Predicting-pairs-trading-returns-
In)this)subsection)we)look)at)how)lagged)variables)of)volatility)and)liquidity)are)related)to)our)returns)and)see)if)there)are)any)relationships)that)can)help)us)forecast)future)profitability)of)pairs)trading.))
7.8.2.6.1. Volatility'
A)lagged)relationship)between)our)returns)and)volatility)would)create)a)great)platform)for)predicting)the)profitability)of)the)strategy.)We)do)not)find)any)significant)results)for)the)first)three)lags)in)the)volatility)regression)by)using)our)actual)30)days)volatility)measure.)However,)we)find)significant)relationships)between)our)returns)and)the)4)to)6)months)lagged)volatility.)The)result)for)the)5)months)lagged)volatility)regression)is)reported)below.))
!!,! = !! + !! !!,! − !!,! + !!!"#$%&30! + !!!"#$%&30!!! + !!))
Volatility, Top,30, Top,5, Top,10, Top,20,
DAX' 0.0729' (0.0513)' 0.0289' (0.0837)' 0.0367' (0.0579)' 0.0848' (0.0465)*'
'' 0.1584' '' 0.7308' '' 0.5274' '' 0.0712' ''
DAXvol30' 0.0001' (0.0002)' 0.0007' (0.0005)' 0.0002' (0.0002)' 0.0001' (0.0002)'
'' 0.4994' '' 0.2047' '' 0.4663' '' 0.4534' ''
DAXvol30(I5)' 0.0006' (0.0002)***' 0.0005' (0.0003)*' 0.0006' (0.0002)***' 0.0006' (0.0001)***'
'' 0.0001' '' 0.0847' '' 0.0018' '' 0.0001' ''
Intercept' I0.0105' (0.0044)**' I0.0124' (0.0107)' I0.0064' (0.0060)' I0.0099' (0.0049)**'
'' 0.0177' '' 0.2478' '' 0.2915' '' 0.0458' ''
R2' 0.1747' '' 0.0436' '' 0.0611' '' 0.1425' ''
)
The#numbers#reported#in#parentheses#are#standard#errors#of#the#coefficients,#and#the#values#below#the#coefficients#are#p9values.#The#standard#errors#are#Newey#West#standard#errors#with#3#lags#(based#on#N0.25,#where#N#=#number#of#observations).##
***)#1#%#significance#level,#**)#5#%#significance#level,#*)#10#%#significance#level#)The)regression)results)indicate)that)a)period)with)high)volatility)will)be)followed)by)an)increase)in)returns)5)months)later.)For)instance,)a)volatile)stock)market)in)January)should)increase)our)returns)in)June.)If)volatility)increases)by)10)points,)our)monthly)returns)will)increase)by)0.6%)five)months)later.)During)our)time)period,)the)volatility)index)has)a)

) 92)
maximum)of)71.72)and)a)minimum)of)8.43,)so)it)can)vary)quite)a)lot)and)have)a)substantial)effect)on)our)returns.)The)coefficient)is)significant)at)a)1%)level,)which)should)be)considered)a)robust)statistical)relationship.)Additionally,)the)three)largest)subCportfolios)are)all)significant)at)a)1%)level)and)have)approximately)the)same)factor)loadings.)A)similar)lagged)relationship)is)found)between)our)returns)and)5)months)lagged)volatility,)when)we)use)the)SXXP)index)as)benchmark)for)market)returns)and)volatility.)Both)the)four)lags)and)the)six)lags)regressions)also)show)a)positive)and)significant)relationship)to)our)returns,)but)with)slightly)weaker)statistical)support.)Our)results)suggest)that)pairs)trading)profitability)can)be)predicted)by)looking)at)past)values)of)volatility.)When)we)include)the)lagged)variables)volatility)in)the)current)economic)environment)turns)up)insignificant.)The)explanatory)power)is)not)very)high)(0.1747),)so)the)identified)relationship)is)not)able)to)explain)our)returns)to)the)extent)that)it)can)work)as)the)foundation)of)an)investment)strategy)that)tries)to)predict)the)profitability)of)pairs)trading.)The)lagged)12)months)volatility)does)not)show)any)significant)results.))We)also)try)to)regress)our)returns)on)the)implied)volatility,)represented)by)the)VIX)index)(VDAX),)to)see)if)we)find)the)same)leadClag)relationship)as)Nagel)(2012).)The)VDAX)is)lagged)once,)since)it)is)a)measure)of)the)implied)volatility)for)the)next)month)based)on)the)current)prices)of)index)options.)))
!!,! = !! + !! !!,! − !!,! + !!!"#$!!! + !!))
Implied,
volatility, Top,30, Top,5, Top,10, Top,20,
DAX' 0.1217' (0.0576)**' 0.0315' (0.0793)' 0.0748' (0.0560)' 0.1464' (0.0602)**'
'' 0.0368' '' 0.6920' '' 0.1841' '' 0.0165' ''
VDAX' 0.0005' (0.0002)**' 0.0013' (0.0005)**' 0.0006' (0.0003)**' 0.0006' (0.0002)**'
'' 0.0240' '' 0.0186' '' 0.0403' '' 0.0202' ''
Intercept' I0.0059' (0.0055)' I0.0164' (0.0124)' I0.0050' (0.0077)' I0.0075' (0.0061)'
'' 0.2776' '' 0.1908' '' 0.5197' '' 0.2248' ''
R2' 0.1283' '' 0.0506' '' 0.0456' '' 0.1406' ''
)
The#numbers#reported#in#parentheses#are#standard#errors#of#the#coefficients,#and#the#values#below#the#coefficients#are#p9values.#The#standard#errors#are#Newey#West#standard#errors#with#3#lags#(based#on#N0.25,#where#N#=#number#of#observations).##
The#VDAX#is#a#forward#looking#measure#so#we#regress#our#returns#on#the#VDAX#value#in#end#of#the#previous#month.#***)#1#%#significance#level,#**)#5#%#significance#level,#*)#10#%#significance#level#
)
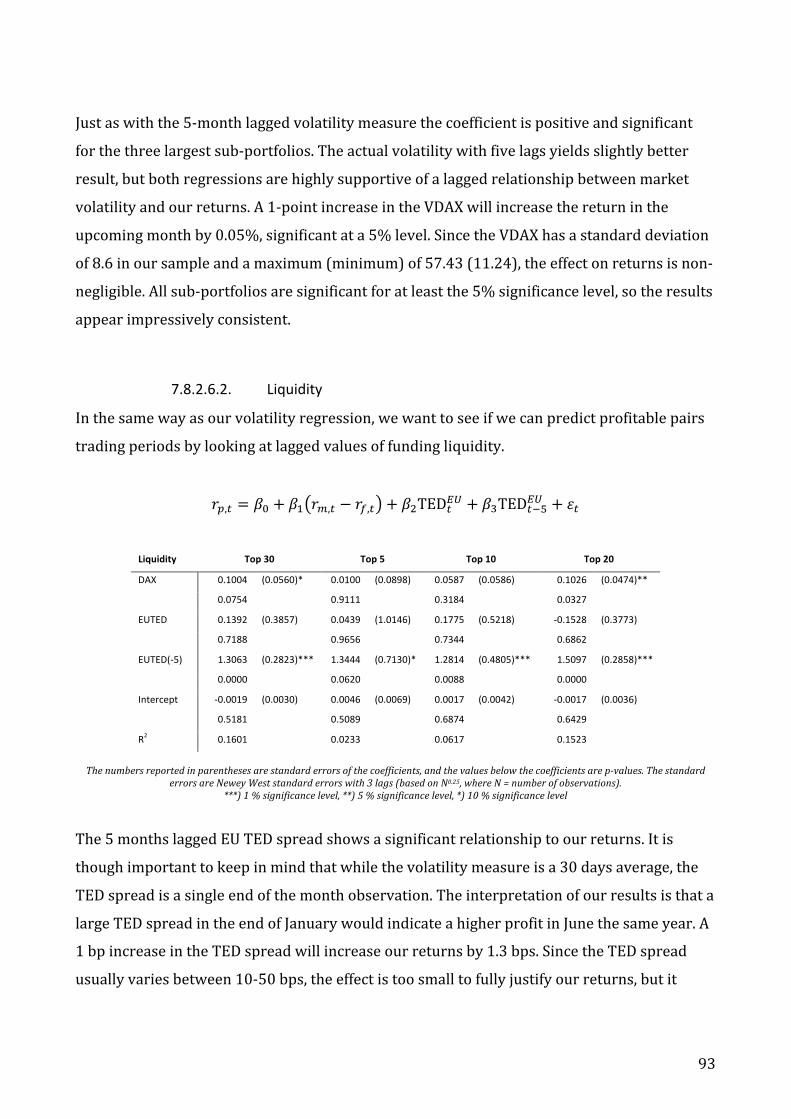
) 93)
Just)as)with)the)5Cmonth)lagged)volatility)measure)the)coefficient)is)positive)and)significant)for)the)three)largest)subCportfolios.)The)actual)volatility)with)five)lags)yields)slightly)better)result,)but)both)regressions)are)highly)supportive)of)a)lagged)relationship)between)market)volatility)and)our)returns.)A)1Cpoint)increase)in)the)VDAX)will)increase)the)return)in)the)upcoming)month)by)0.05%,)significant)at)a)5%)level.)Since)the)VDAX)has)a)standard)deviation)of)8.6)in)our)sample)and)a)maximum)(minimum))of)57.43)(11.24),)the)effect)on)returns)is)nonCnegligible.)All)subCportfolios)are)significant)for)at)least)the)5%)significance)level,)so)the)results)appear)impressively)consistent.))
7.8.2.6.2. Liquidity'
In)the)same)way)as)our)volatility)regression,)we)want)to)see)if)we)can)predict)profitable)pairs)trading)periods)by)looking)at)lagged)values)of)funding)liquidity.)))
!!,! = !! + !! !!,! − !!,! + !!TED!!" + !!TED!!!!" + !!))
Liquidity, Top,30, Top,5, Top,10, Top,20,
DAX' 0.1004' (0.0560)*' 0.0100' (0.0898)' 0.0587' (0.0586)' 0.1026' (0.0474)**'
'' 0.0754' '' 0.9111' '' 0.3184' '' 0.0327' ''
EUTED' 0.1392' (0.3857)' 0.0439' (1.0146)' 0.1775' (0.5218)' I0.1528' (0.3773)'
'' 0.7188' '' 0.9656' '' 0.7344' '' 0.6862' ''
EUTED(I5)' 1.3063' (0.2823)***' 1.3444' (0.7130)*' 1.2814' (0.4805)***' 1.5097' (0.2858)***'
'' 0.0000' '' 0.0620' '' 0.0088' '' 0.0000' ''
Intercept' I0.0019' (0.0030)' 0.0046' (0.0069)' 0.0017' (0.0042)' I0.0017' (0.0036)'
'' 0.5181' '' 0.5089' '' 0.6874' '' 0.6429' ''
R2' 0.1601' '' 0.0233' '' 0.0617' '' 0.1523' ''
)
The#numbers#reported#in#parentheses#are#standard#errors#of#the#coefficients,#and#the#values#below#the#coefficients#are#p9values.#The#standard#errors#are#Newey#West#standard#errors#with#3#lags#(based#on#N0.25,#where#N#=#number#of#observations).##
***)#1#%#significance#level,#**)#5#%#significance#level,#*)#10#%#significance#level#)The)5)months)lagged)EU)TED)spread)shows)a)significant)relationship)to)our)returns.)It)is)though)important)to)keep)in)mind)that)while)the)volatility)measure)is)a)30)days)average,)the)TED)spread)is)a)single)end)of)the)month)observation.)The)interpretation)of)our)results)is)that)a)large)TED)spread)in)the)end)of)January)would)indicate)a)higher)profit)in)June)the)same)year.)A)1)bp)increase)in)the)TED)spread)will)increase)our)returns)by)1.3)bps.)Since)the)TED)spread)usually)varies)between)10C50)bps,)the)effect)is)too)small)to)fully)justify)our)returns,)but)it)

) 94)
seems)to)have)some)degree)of)explanatory)power.)In)2008,)the)TED)spread)increased)to)285)bps)in)the)end)of)September,)so)for)a)level)of)that)magnitude)the)TED)spread)actually)has)a)substantial)effect)on)our)returns.)An)extreme)increase)of)2%Cpoints)in)the)TED)spread)would)indicate)a)return)increase)of)2.6%)per)month,)and)is)by)far)the)most)extreme)case)in)our)sample.)We)find)the)same)relationship)when)we)interchange)the)DAX)with)SXXP)and)the)EU)TED)with)the)US)TED)spread.)The)current)TED)spread)is)insignificant)for)both)the)EU)and)US)measure)when)we)include)the)lagged)variables,)hence)returns)seems)more)dependent)on)lagged)rather)than)current)liquidity)conditions.)For)the)12)months)lag)we)do)not)find)any)significant)results)and)conclude)that)liquidity)conditions)in)the)formation)period,)does)not)seem)to)have)any)effect)on)future)profitability.)))
8. Discussion,This)part)of)the)thesis)will)discuss)our)findings)in)light)of)previous)literature)and)elaborate)on)the)limitations)and)potential)improvements)in)our)research.))We)place)our)trading)strategy)under)the)broad)category)of)statistical)arbitrage,)since)we)use)statistical)methods)and)historical)data)to)form)our)portfolios)of)pairs.)Our)trading)strategy)and)constructed)model)are)inspired)by)Gatev,)Goetzmann)and)Rouwenworst)(2006))and)Do)and)Faff)(2010),)but)we)are)unable)to)find)evidence)of)abnormal)returns)when)we)use)a)6)months)trading)period.)However,)by)extending)the)trading)period)by)six)additional)months)we)are)able)to)generate)abnormal)returns.)The)Total)portfolio)obtains)a)Sharpe)ratio)of)0.47,)compared)to)0.38)for)the)DAX)index,)which)is)clear)evidence)of)a)nonCnegligible)outperformance)of)the)market)portfolio.)Do)and)Faff)(2010))points)out)that)pairs)in)recent)years)are)open)for)longer)periods)of)time)because)they)converge)more)slowly)and)our)results)imply)the)same.)Their)findings)were)based)on)US)data)for)approximately)the)same)time)period)as)we)operate)in,)and)it)seems)like)the)same)effect)is)present)in)the)European)market)we)trade)in.)Our)findings)are)consistent)with)a)worsening)of)arbitrage)risk)mentioned)by)Do)and)Faff,)and)this)can)be)a)result)of)either)fundamental)risk,)noise)trader)risk)or)synchronization)risk)discussed)earlier)in)the)thesis.)A)potential)explanation)can)be)that)easier)access)to)capital)

) 95)
markets)for)nonCprofessional)investors)have)led)to)a)worsening)in)noise)trader)risk,)which)makes)arbitrageurs)hesitant)to)initially)correct)prices.)))In)general,)we)find)much)lower)statistical)support)for)our)research)compared)to)Gatev,)Goetzmann)and)Rouwenhorst)(2006).)The)simple)explanation)is)that)they)operate)with)a)considerably)longer)sample)period)and)much)larger)universe)of)stocks.)In)particular,)our)results)for)the)sameCindustry)pairs)is)most)likely)affected)by)our)limited)data)sample,)as)we)seem)to)conclude)the)complete)opposite)of)previous)research.)To)elaborate,)the)two)papers)are)able)to)sort)out)specific)industries)that)work)well)in)pairs)trading,)i.e.)utilities)and)financials,)so)the)results)they)find)are)based)on)much)finer)and)accurate)industry)classifications)than)the)one)we)use.)Future)research)on)European)data)should)try)to)add)stocks)from)additional)countries)as)well)as)extending)the)time)frame)of)the)sample,)and)thus)have)a)larger)stock)sample)that)can)combine)pair)trading)portfolios)across)countries)and)time.)Combining)pairs)across)the)Euro)area)should)not)require)more)advanced)analysis)as)stocks)are)quoted)in)the)same)currency.)This)would)greatly)increase)the)probability)of)finding)results)with)statistical)relevance)and)offer)further)contributions)to)the)pairs)trading)literature,)both)for)the)performance)of)restricted)and)nonCrestricted)pairs.)For)our)research,)extending)the)time)frame)would)oppose)the)intention)of)our)research,)which)is)to)test)the)profitability)of)pairs)trading)in)recent)time,)without)time)periods)where)pair)trading)has)already)proven)to)be)highly)profitable.)))Transaction)costs)significantly)depresses)our)returns,)but)contrary)to)Do)and)Faff)(2012))we)still)find)evidence)of)abnormal)postCtransaction)costs)returns.)The)estimates)of)transaction)costs)used)in)the)thesis)are)average)estimates)for)a)longer)period)of)time,)hence)they)do)not)give)a)completely)accurate)picture)of)how)the)transaction)costs)change)in)different)market)environments.)There)is)reason)to)believe)that)the)bidCask)spread)and)market)impact)will)increase)during)crises)and)we)cannot)exclude)the)possibility)that)the)lending)fee)is)increased)as)well.)Our)crisis)versus)nonCcrisis)analysis)implied)a)superior)performance)during)crises,)but)this)might)be)a)consequence)of)measurement)bias,)as)the)transaction)costs)will)overestimate)the)positive)performance)of)pairs)trading)in)periods)of)market)turbulence.)Nonetheless,)they)should)still)yield)accurate)estimates)for)the)period)as)a)whole.)The)transaction)costs)wipe)out)a)large)fraction)of)our)returns,)so)accurate)and)conservative)estimates)of)transaction)costs)is)

) 96)
instrumental)to)make)an)appropriate)conclusion)regarding)the)profitability)of)pairs)trading.)We)should)emphasize)that)rebalancing)would)optimally)be)done)less)frequently)to)minimize)the)transaction)costs,)thus)daily)rebalancing)should)be)considered)an)extreme)case.)A)more)efficient)tradeCoff)between)rebalancing)and)transaction)costs)can)potentially)increase)the)abnormal)returns,)as)transaction)costs)will)be)substantially)lower.)Thus,)in)that)sense)our)results)are)quite)conservative)compared)to)what)a)more)skilled)pairs)trader)can)achieve.))))We)wanted)to)see)how)daily)rebalancing)affected)our)performance,)and)hypothesized)that)it)would)make)us)less)sensitive)to)market)fluctuations,)something)we)now)know)was)false.)Throughout)the)whole)thesis)we)argue)that)pairs)trading)is)a)market)neutral)strategy,)and)that)we)are)confident)that)our)rebalancing)is)likely)to)give)a)quite)low)beta)exposure,)even)though)we)focus)on)being)monetary)neutral.)Our)daily)returns)exhibit)a)quite)low)correlation)to)the)market,)but)the)monthly)regressions)clearly)show)that)the)returns)of)the)strategy)have)a)significant)sensitivity)to)market)trends.)This)means)that)our)strategy)does)not)perfectly)fit)under)the)category)of)market)neutral)strategies)as)all)variations)of)our)strategy)exhibit)a)significant)beta)exposure)for)the)monthly)observations.)The)result)was)highly)unexpected,)and)future)research)should)focus)on)other)weighting)schemes)than)monetary)neutral)to)guarantee)a)lower)sensitivity)to)the)market.)The)obvious)suggestion)is)beta)neutral)pairs,)but)positions)can)also)be)weighted)to)make)each)pair)standard)deviation)neutral.)The)positions)can)be)adjusted)so)that)the)position)in)each)stock)equals)1)Euro)divided)by)the)standard)deviation)of)the)stock)in)the)formation)period.)This)means)that)the)position)in)a)given)stock)is)a)decreasing)function)of)the)standard)deviation)in)the)formation)period,)as)shown)in)the)below)equation.)
€!! = ± 1!!!)
This)method)of)position)sizing)is)useful,)because)it)can)make)the)portfolio)less)sensitive,)not)only)to)market)risk,)but)also)to)other)unidentified)sources)of)risk.)The)explanation)is)that)standard)deviation)calculated)with)data)from)the)past)year)is)a)consequence)of)all)the)exposures)of)the)security,)and)can)therefore)potentially)be)an)even)better)risk)measure)for)the)stock)than)the)beta.)This)approach)can)of)course)be)combined)with)a)rebalancing)scheme)in)the)similar)manner)as)our)own)strategy.))

) 97)
Increased)transaction)costs)is)not)the)only)consequence)of)a)daily)rebalancing)scheme.)An)undesired)development)in)our)pairs)would)demand)a)considerable)amount)of)capital,)thus)our)return)calculation)with)committed)capital)does)not)necessarily)provide)accurate)estimates)of)our)returns.)The)daily)rebalancing)makes)us)implicitly)assume)that)investors)have)infinite)capital)to)continually)rebalance)the)portfolio.)This)is)an)obvious)flaw)in)the)thesis)and)can)potentially)lead)to)upwardly)biased)estimates)for)our)excess)returns)and)Sharpe)ratios.)Our)findings)of)abnormal)risk)adjusted)returns)might)not)hold)when)we)take)into)account)the)required)capital)demanded)by)the)investment)strategy,)but)we)do)not)provide)any)estimates)that)shed)light)on)how)much)bigger)the)capital)base)is)required)to)be.)Another)large)cost)we)do)not)take)into)account)is)the)cost)of)developing)sophisticated)trading)infrastructure)to)perfectly)implement)the)strategy,)and)this)should)be)included)in)to)evaluate)the)true)profitability)of)the)strategy.))According)to)Malkiel)(2003))abnormal)returns)disappear)after)a)trading)strategy)get)published)or)receive)lots)of)attention.)This)does)not)seem)to)be)the)case)for)pairs)trading,)so)generation)of)higher)riskCadjusted)returns)than)the)market)portfolio)should)be)explained)by)exposure)to)underlying)risk)factors)if)the)market)is)close)to)efficient.)Our)results)seem)consistent)with)this)explanation,)as)we)find)evidence)of)positive)exposure)to)volatility)and)liquidity)risk)for)our)portfolio.)Furthermore,)the)identified)lead)lag)relationship)between)implied)volatility)(VDAX))and)returns)support)Nagel’s)(2012))discovery)of)the)VIX)index’s)predictive)power)over)the)returns)of)a)liquidity)providing)strategy.)Unfortunately,)the)lagged)values)of)actual)and)implied)volatility)do)not)exhibit)enough)explanatory)power)to)fully)explain)our)returns.)Our)findings)imply)that)pairs)trading)is)a)liquidity)providing)strategy)and)support)the)idea)of)compensation)for)liquidity)provision)discussed)by)Acharya)and)Pedersen)(2005).)Engelberg,)Gao)and)Jagannathan)(2008))discuss)how)stocks)can)move)away)from)each)other)due)to)different)liquidity)in)the)two)stocks)in)a)pair,)and)even)though)we)see)this)as)a)valid)explanation)for)why)pairs)trading)might)be)profitable,)we)are)not)able)to)explicitly)test)it)in)our)model.)This)might)be)just)as)important)as)the)effect)we)find)on)funding)liquidity,)and)should)get)even)more)attention)from)future)research.)))We)hypothesize)that)the)pairs)trader)always)plays)the)role)of)a)liquidity)provider,)but)that)the)premium)for)this)service)is)higher)in)crises.)We)are,)however,)not)able)to)test)this)hypothesis)

) 98)
explicitly,)but)rather)look)at)the)general)relationship)between)liquidity)and)our)returns.)Our)research)identifies)liquidity)as)an)important)source)of)return,)but)it)does)not)fully)explain)the)magnitude)of)our)returns.)However,)the)effect)in)a)normal)versus)crisis)environment)might)be)different,)so)we)cannot)dismiss)the)possibility)that)liquidity)plays)the)main)role)in)a)crisis)environment.)The)problem)is)that)testing)the)role)of)liquidity)during)crises)would)require)a)much)larger)data)sample)with)more)data)on)periods)with)financial)crises.))
9. Conclusion,We)construct)a)pairs)trading)portfolio)with)daily)rebalancing,)which)yields)positive)abnormal)returns)in)the)period)2003C2012.)Our)best)portfolio)earns)an)excess)return)of)5.66%)and)has)a)Sharpe)ratio)0.47.)This)thesis)adds)new)evidence)to)the)pairs)trading)literature,)as)it)investigates)the)performance)of)the)pairs)trading)in)the)most)recent)years,)which)includes)the)outbreak)of)the)Euro)crisis.)Do)and)Faff)(2010))find)that)pairs)after)1988)takes)longer)to)converge)and)explain)this)by)a)worsening)of)arbitrage)risk.)When)we)take)into)account)the)worsening)arbitrage)risk,)and)double)the)length)of)the)trading)period)the)performance)of)the)portfolio)is)substantially)better,)and)it)is)only)after)we)extend)the)length)of)the)trading)period)that)we)are)able)to)earn)a)higher)riskCadjusted)return)than)the)market.)The)ability)of)pairs)trading)to)perform)well)in)a)volatile)market)environment)seems)to)persist)in)more)recent)periods.)Further)investigation)implies)that)the)relationship)between)pairs)trading)returns)and)volatility)is)lagged,)which)can)be)explained)by)an)opening)of)pairs)due)to)a)shock)in)volatility)followed)by)subsequent)convergence)in)later)periods.)Our)research)also)identifies)a)shortCterm)relationship)between)the)implied)volatility)and)our)returns,)in)accordance)with))Nagel)(2012).)Furthermore,)our)analysis)implies)that)pairs)trading)is)a)liquidity)providing)strategy,)but)the)relationship)between)our)returns)and)liquidity)seems)to)be)lagged)rather)than)dependent)on)values)in)the)current)market)environment.)The)predictive)power)for)both)volatility)and)liquidity)is)however)limited)as)it)is)only)able)to)explain)a)small)part)of)our)returns.)Our)overall)findings)are)consistent)with)the)idea)that)pairs)trading)performs)well)in)a)volatile)market)environment)and)that)the)pairs)trader)is)compensated)for)the)provision)of)liquidity.)This)thesis)should)work)as)an)addition)to)the)existing)literature)on)pairs)trading,)and)is)supportive)evidence)that)pairs)trading)have)the)potential)to)earn)abnormal)returns.)Our)

) 99)
research)also)suggests)a)potential)improvement)to)the)strategy)by)implementing)risk)management)tools.)An)adoption)of)stop)loss)increases)our)Sharpe)ratio)to)0.51)and)decreases)the)VaR)slightly,)but)since)our)implementation)is)slightly)unrealistic,)it)should)not)be)directly)interpreted)as)an)obtainable)riskCadjusted)profit.)Further)research)on)pairs)trading)should)create)a)more)realistic)inclusion)of)risk)management,)as)it)is)informative)for)the)true)profitability)of)the)strategy.)Finally,)the)profitability)of)pairs)trading)should)be)investigated)with)a)more)comprehensive)data)sample)on)European)data,)to)create)even)stronger)statistical)support.))) )

) 100)
,References,
Abreu, Dilip, and Markus K. Brunnermeier. 2002. Synchronization Risk and Delayed Arbitrage. Journal of Financial Economics 66, 341-360.
Acharya, Viral V., and Lasse H. Pedersen. 2005. Asset pricing with liquidity risk. Journal of Financial Economics 77, 375-410.
Andrade, Sandro C., di Pietro, Vadim, and Seashole, Mark S. 2005. Understanding the Profitability of Pairs Trading.working paper ed.
Asness, Clifford S., Tobias J. Moskowitz, and Lasse H. Pedersen. 2013. Value and Momentum Everywhere. Journal of Finance 68, no. 3:929-985.
Avellaneda, Marco, Lee, Jeong -Huyn. 2010. Statistical arbitrage in the US equities market. Quantitative Finance 10, no. 7:761-782.
Black, Fischer. 1986. Noise. Journal of Finance 41, no. 3:529-543.
Bondarenko, Oleg. 2003. Statistical Arbitrage and Securities Prices. Review of Financial Studies 16, no. 3:875-919.
Brunnermeier, Markus K., and Lasse H. Pedersen. 2009. Market Liquidity and Funding Liquidity. Review of Financial Studies 22, no. 6:2201-2238.
Carhart, Mark M. 1997. On the persistence in mutual fund performance. Journal of Finance 52, no. 1:57-82.
Crawford, Alan. 2010. Germany to Temporarily Ban Naked Short Selling, Some Swaps Euro Bond. Bloomberg.
Credit Suisse Asset Management, LLC. 2009. Equity Market: Diversifier Across Market Cycles.
D'Avolio, Gene. 2002. The Market for Borrowing Stocks. Journal of Financial Economics 66, 271-306.
De Bondt, Werner F. M., and Richard Thaler. 1985. Does the Stock Market Overreact? Journal of finance 40, no. 3:793-805.
DeLong, J. B., Andrei Shleifer, Lawrence H. Summers, and Robert J. Waldmann. 1990. Noise Trader Risk in Financial Markets. Journal of Political Economy 98, no. 4:703-738.
Do, Binh, and Robert Faff. 2012. Are Pairs Trading Profits Robust to Trading Costs? Journal of Financial Research 35, no. 2:261-287.
Do, Binh, and Robert Faff. 2010. Does Simple Pairs Trading Still Work? Financial Analysts Journal 66, no. 4:1-13.
Ehrman, Douglas. 2006. The Handbook of Pairs Trading: Strategies Using Equities, Options and Futures. In . Hoboken, New Jersey: John Wiley & Sons, Inc.
) 101)
Eichler, Alexander. 2011. Italy, France, Spain, Belgium Ban Short Selling In Order To Protect Markets. The Huffington Post Business, .
Engelberg, Joseph, Pengjie Gao, and Ravi Jagannathan. 2008. An Anatomy of Pairs Trading: The Role of Idiosyncratic News, Common Information and Liquidity. Third Singapore International Conference on Finance 2009.
Fama, Eugene F. 1998. Market efficiency, long term returns, and behavioral finance. Journal of Financial Economics 49, no. 3:283-306.
Fama, Eugene F. 1970. Efficient Capital Markets: A Review of Theory and Empirical Work. Journal of Finance 25, no. 2:383-417.
Fama, Eugene F. 1965. The Behavior of Stock-Market Prices. Journal of Business 38, no. 1:34-105.
Fama, Eugene F., and Kenneth R. French. 1992. The Cross-Section of Expected Stock Returns. Journal of Finance 47, no. 2:427-465.
Frazzini, Andrea, Israel, Ronen, and Moskowitz, Tobias J. Trading Costs of Asset Pricing Anomalies.Working paper ed.
Frazzini, Andrea, and Lasse H. Pedersen. Forthcoming. Betting Agains Beta. Journal of Financial Economics.
Fung, William, and David A. Hsieh. 1999. A primer on hedge funds. Journal of Empirical Finance 6, 309-339.
Gatev, Evan, William N. Goetzmann, and K. G. Rouwenhorst. 2006. Pairs Trading: Performance of a Relative-Value Arbitrage Rule. Review of Financial Studies 19, no. 3:797-827.
Grossman, Sanford, and Joseph Stiglitz. 1980. On the Impossibility of Informationally Efficient Markets. American Economic Review 70, no. 3:393-410.
Ibbotson. 1999. Cost of Capital Quarterly, 1999 Yearbook, 2nd ed. Chicago: Ibbotson Associates, 1976.
Jacobs, Bruce I., and Levy, Kenneth N. 2005. Market Neutral Strategies.
Jegadeesh, Narasimhan, and Sheridan Titman. 1995. Overreaction, delayed reaction, and contrarian profits. Review of Financial Studies 8, no. 4:973-993.
Jegadeesh, Narasimhan, and Sheridan Titman. 1993. Returns to Buying Winners and Selling Losers: Implications for Stock Market Efficiency. Journal of Finance 48, no. 1:65-91.
Krstic, Ivan. 2009. How Porsche hacked the financial system and made a killing.
Lamont, Owen, and Richard H. Thaler. 2003. Can the Market Add and Subtract? Mispricing in Tech Stock Carve-Outs. Journal of Political Economy 111, 227-268.
Malkiel, Burton G. 2003. The Efficient Market Hypothesis and Its Critics. The Journal of Economic Perspectives 17, no. 1:59-82.

) 102)
Malkiel, Burton G., and Atanu Saha. 2005. Hedge Funds: Risk and Returns. Financial Analysts Journal 61, no. 6:80-88
Merton, Robert C. 1987. A simple model of of Capital Market Equilibrium with Incomplete Information. Journal of Finance 42, no. 3:483-510.
Mitchell, Mark, Todd Pulvino, and Erik Stafford. 2002. Limited Arbitrage in Equity Markets. The Journal of Finance 57, no. 2:551-584.
Nagel, Stephen. 2012. Evaporating Liquidity. Review of Financial Studies 25, no. 7:2005-2039.
Nath, Purnendu. 2003. High Frequency Pairs Trading with U.S. Treasury Securities: Risks and Rewards for Hedge Funds.
Pedersen, Lasse H. Not yet published. Hedge Fund Strategies.
Rosenthal, Leonard, and Colin Young. 1990. The seemingly anomalous price behavior of Royal Dutch/Shell and Unilever N.V./PLC. Journal of Financial Economics 26, no. 1:123-141.
Shleifer, Andrei, and Robert W. Vishny. 1997. The Limits of Arbitrage. The Journal of Finance 52, no. 1:35-55.
Smitten, Richard. 2004. Trade like Jesse Livermore.1st ed. Hoboken, New Jersey: John Wiley and Sons Inc.
Taleb, Nassim N. 2010. The Black Swan: The impact of the highly improbable.2nd ed. New York, United States: Random House Trade Paperbacks.
Vidyamurthy, Ganapathy. 2004. Pairs Trading: Quantative methods and analysis.
! !

! I!
Appendix(!!A.1.! INDUSTRY!CLASSIFICATION!.............................................................................................................................................!IV!A.2.! BASIC!TRADING!RESULTS!ONE6DAY!DELAY!....................................................................................................................!V!A.2.1.! Pre(transaction0costs0returns0................................................................................................................................0V!
A.2.1.1.! 6!months!trading!...................................................................................................................................................................................!V!A.2.1.2.! 12!months!trading!................................................................................................................................................................................!VI!
A.2.2.! Post(transaction0costs0returns0..........................................................................................................................0VII!A.2.2.1.! 6!months!trading!................................................................................................................................................................................!VII!A.2.2.2.! 12!months!trading!.............................................................................................................................................................................!VIII!
A.3.! INDIVIDUAL!YEARS!PERFORMANCE!...............................................................................................................................!IX!A.3.1.! Pre(transaction0costs0return0................................................................................................................................0IX!
A.3.1.1.! 6!months!trading!..................................................................................................................................................................................!IX!A.3.1.1.1.! Minimum(distance((Returns)!..........................................................................................................................................!IX!A.3.1.1.2.! Minimum(distance((Sharpe(ratio)!..................................................................................................................................!X!A.3.1.1.3.! Zero(Crossing((Returns)!.....................................................................................................................................................!XI!A.3.1.1.4.! Zero(Crossing((Sharpe(ratios)!.......................................................................................................................................!XII!A.3.1.1.5.! Total((Returns)!.....................................................................................................................................................................!XIII!A.3.1.1.6.! Total((Sharpe(ratio)!...........................................................................................................................................................!XIV!
A.3.1.2.! 12!months!trading!...............................................................................................................................................................................!XV!A.3.1.2.1.! Minimum(distance((Returns)!.........................................................................................................................................!XV!A.3.1.2.2.! Minimum(distance((Sharpe(ratios)!...........................................................................................................................!XVI!A.3.1.2.3.! Zero(Crossing((Returns)!................................................................................................................................................!XVII!A.3.1.2.4.! Zero(Crossing((Sharpe(ratios)!...................................................................................................................................!XVIII!A.3.1.2.5.! Total((Returns)!.....................................................................................................................................................................!XIX!A.3.1.2.6.! Total((Sharpe(ratios)!...........................................................................................................................................................!XX!
A.3.2.! Post(transaction0costs0returns0.........................................................................................................................0XXI!A.3.2.1.! 6!months!................................................................................................................................................................................................!XXI!
A.3.2.1.1.! Minimum(distance((Returns)!.......................................................................................................................................!XXI!A.3.2.1.2.! Minimum(distance(6(months(trading((Sharpe(ratio)!....................................................................................!XXII!A.3.2.1.3.! Zero(crossing((Returns)!...............................................................................................................................................!XXIII!A.3.2.1.4.! Zero(crossing((Sharpe(ratio)!.....................................................................................................................................!XXIV!A.3.2.1.5.! Total((Return)!......................................................................................................................................................................!XXV!A.3.2.1.6.! Total((Sharpe(ratio)!........................................................................................................................................................!XXVI!
A.3.2.2.! 12!months!.........................................................................................................................................................................................!XXVII!A.3.2.2.1.! Minimum(distance((Returns)!...................................................................................................................................!XXVII!A.3.2.2.2.! Minimum(distance((Sharpe(ratio)!.......................................................................................................................!XXVIII!A.3.2.2.3.! Zero(crossing((Returns)!...............................................................................................................................................!XXIX!A.3.2.2.4.! Zero(crossing((Sharpe(ratio)!.......................................................................................................................................!XXX!A.3.2.2.5.! Total((Returns)!..................................................................................................................................................................!XXXI!A.3.2.2.6.! Total((Sharpe(ratio)!.......................................................................................................................................................!XXXII!
A.4.! ADDITIONAL!TRADING!RESULTS!ONE6DAY!DELAY!.............................................................................................!XXXIII!A.4.1.! Pairs0ranked081(1000.......................................................................................................................................0XXXIII!
A.4.1.1.! 12!months!.......................................................................................................................................................................................!XXXIII!A.4.1.2.! Individual!years!performance!................................................................................................................................................!XXXIV!
A.4.2.! Intra(Industry0Pairs0..........................................................................................................................................0XXXV!A.4.2.1.! 12!months!.........................................................................................................................................................................................!XXXV!A.4.2.2.! Individual!years!performance!................................................................................................................................................!XXXVI!
A.4.3.! Crises0versus0non(crises0................................................................................................................................0XXXVII!A.4.4.! Stop0loss0trading0results0............................................................................................................................0XXXVIII!A.4.5.! Drawdown0control0...........................................................................................................................................0XXXIX!
A.5.! REGRESSION!RESULTS!.....................................................................................................................................................!XL!A.5.1.! DAX0results0.................................................................................................................................................................0XL!
A.5.1.1.! CAPM!.........................................................................................................................................................................................................!XL!A.5.1.2.! Fama6French!Factors!.........................................................................................................................................................................!XL!A.5.1.3.! Fama6French!Factors!+!Momentum!..........................................................................................................................................!XLI!A.5.1.4.! Volatility!................................................................................................................................................................................................!XLI!

! II!
A.5.1.4.1.! Linear!.........................................................................................................................................................................................!XLI!A.5.1.4.2.! Quadratic!.................................................................................................................................................................................!XLI!A.5.1.4.3.! Lagged(1(month!...................................................................................................................................................................!XLII!A.5.1.4.4.! Lagged(2(months!.................................................................................................................................................................!XLII!A.5.1.4.5.! Lagged(3(months!.................................................................................................................................................................!XLII!A.5.1.4.6.! Lagged(4(months!...............................................................................................................................................................!XLIII!A.5.1.4.7.! Lagged(5(months!...............................................................................................................................................................!XLIII!A.5.1.4.8.! Lagged(6(months!...............................................................................................................................................................!XLIII!A.5.1.4.9.! Lagged(12(months!............................................................................................................................................................!XLIV!A.5.1.4.10.! Lagged(12(months!.........................................................................................................................................................!XLIV!
A.5.1.5.! Liquidity!.............................................................................................................................................................................................!XLIV!A.5.1.5.1.! EU(TED!....................................................................................................................................................................................!XLIV!A.5.1.5.2.! US(TED!......................................................................................................................................................................................!XLV!A.5.1.5.3.! EU(TED(+(Momentum!.......................................................................................................................................................!XLV!A.5.1.5.4.! US(TED(+(Momentum!.......................................................................................................................................................!XLV!A.5.1.5.5.! Volume!...................................................................................................................................................................................!XLVI!A.5.1.5.6.! EU(TED(Quadratic!............................................................................................................................................................!XLVI!A.5.1.5.7.! US(TED(Quadratic!.............................................................................................................................................................!XLVI!A.5.1.5.8.! EU(TED(lagged(1(month!...............................................................................................................................................!XLVII!A.5.1.5.9.! US(TED(lagged(1(month!................................................................................................................................................!XLVII!A.5.1.5.10.! EU(TED(lagged(2(months!..........................................................................................................................................!XLVII!A.5.1.5.11.! US(TED(lagged(2(months!.........................................................................................................................................!XLVIII!A.5.1.5.12.! EU(TED(lagged(3(months!........................................................................................................................................!XLVIII!A.5.1.5.13.! US(TED(lagged(3(months!.........................................................................................................................................!XLVIII!A.5.1.5.14.! EU(TED(lagged(4(months!............................................................................................................................................!XLIX!A.5.1.5.15.! US(TED(lagged(4(months!.............................................................................................................................................!XLIX!A.5.1.5.16.! EU(TED(lagged(5(months!............................................................................................................................................!XLIX!A.5.1.5.17.! US(TED(lagged(5(months!....................................................................................................................................................!L!A.5.1.5.18.! EU(TED(lagged(6(months!...................................................................................................................................................!L!A.5.1.5.19.! US(TED(lagged(6(months!....................................................................................................................................................!L!A.5.1.5.20.! EU(TED(lagged(12(months!..............................................................................................................................................!LI!A.5.1.5.21.! US(TED(lagged(12(months!...............................................................................................................................................!LI!
A.5.2.! SXXP0results0................................................................................................................................................................0LII!A.5.2.1.! CAPM!.........................................................................................................................................................................................................!LII!A.5.2.2.! Fama6French!Factors!.........................................................................................................................................................................!LII!A.5.2.3.! Fama6French!Factors!+!Momentum!............................................................................................................................................!LII!A.5.2.4.! Volatility!................................................................................................................................................................................................!LIII!
A.5.2.4.1.! Linear!.........................................................................................................................................................................................!LIII!A.5.2.4.2.! Quadratic!.................................................................................................................................................................................!LIII!A.5.2.4.3.! 1(month(lagged!.....................................................................................................................................................................!LIII!A.5.2.4.4.! 2(months(lagged!...................................................................................................................................................................!LIV!A.5.2.4.5.! 3(months(lagged!...................................................................................................................................................................!LIV!A.5.2.4.6.! 4(months(lagged!...................................................................................................................................................................!LIV!A.5.2.4.7.! 5(months(lagged!.....................................................................................................................................................................!LV!A.5.2.4.8.! 6(months(lagged!.....................................................................................................................................................................!LV!A.5.2.4.9.! 12(months(lagged!..................................................................................................................................................................!LV!A.5.2.4.10.! Implied(volatility((VIX)!.................................................................................................................................................!LVI!
A.5.2.5.! Liquidity!................................................................................................................................................................................................!LVI!A.5.2.5.1.! EU(TED!.......................................................................................................................................................................................!LVI!A.5.2.5.2.! US(TED!.......................................................................................................................................................................................!LVI!A.5.2.5.3.! EU(TED(+(Momentum!.......................................................................................................................................................!LVII!A.5.2.5.4.! US(TED(+(Momentum!.......................................................................................................................................................!LVII!A.5.2.5.5.! Volume!.....................................................................................................................................................................................!LVII!A.5.2.5.6.! EU(TED(Quadratic!............................................................................................................................................................!LVIII!A.5.2.5.7.! US(TED(Quadratic!.............................................................................................................................................................!LVIII!A.5.2.5.8.! EU(TED(1(month(lagged!................................................................................................................................................!LVIII!A.5.2.5.9.! US(TED(1(month(lagged!....................................................................................................................................................!LIX!A.5.2.5.10.! EU(TED(2(months(lagged!..............................................................................................................................................!LIX!A.5.2.5.11.! US(TED(2(months(lagged!...............................................................................................................................................!LIX!A.5.2.5.12.! EU(TED(3(months(lagged!................................................................................................................................................!LX!A.5.2.5.13.! US(TED(3(months(lagged!.................................................................................................................................................!LX!A.5.2.5.14.! EU(TED(4(months(lagged!................................................................................................................................................!LX!A.5.2.5.15.! US(TED(4(months(lagged!...............................................................................................................................................!LXI!

! III!
A.5.2.5.16.! EU(TED(5(months(lagged!..............................................................................................................................................!LXI!A.5.2.5.17.! US(TED(5(months(lagged!...............................................................................................................................................!LXI!A.5.2.5.18.! EU(TED(6(months(lagged!.............................................................................................................................................!LXII!A.5.2.5.19.! US(TED(6(months(lagged!..............................................................................................................................................!LXII!A.5.2.5.20.! EU(TED(lagged(12(months!..........................................................................................................................................!LXII!A.5.2.5.21.! US(TED(lagged(12(month!...........................................................................................................................................!LXIII!
(( (

! IV!
!
A.1. Industry!classification!!Health!care!and!pharmaceuticals! Industrial!Transportation! Travel!and!Leisure!Pharmaceuticals-and-Biotechnology- Industrial-Transportation- Travel-and-Leisure-Health-Care-Equipment-and-Services-
- -- - -Automobiles!and!parts! Chemicals! Consumer!goods!Automobiles-and-parts--
Chemicals--
Electronics-and--Electronical-equipements-
! !Food-and-drug-retailers-
! !Food-Producers-
! !General-Retailers-
! !
Household-Goods-and--Home-Construction-
! ! !Energy! Financials! Industrials!Alternative-energy- Banks- Construction-and-materials-Electricity- Financial-Services- General-Industrials-Gas-water-and-Utilities- Life-Insurance- Industrial-Engineering-
!Nonlife-Insurance- Industrial-Metals-and-Mining-
! ! !Media! Mobile! Real!Investment!and!Services!Media- Mobile- Real-Investment-and-Services-
! ! !Software!and!support!services!! !Software-and-Computer-Services- !! !!
Support-Services-! !Technology-Hardware-and-Equipment-! !!
! !
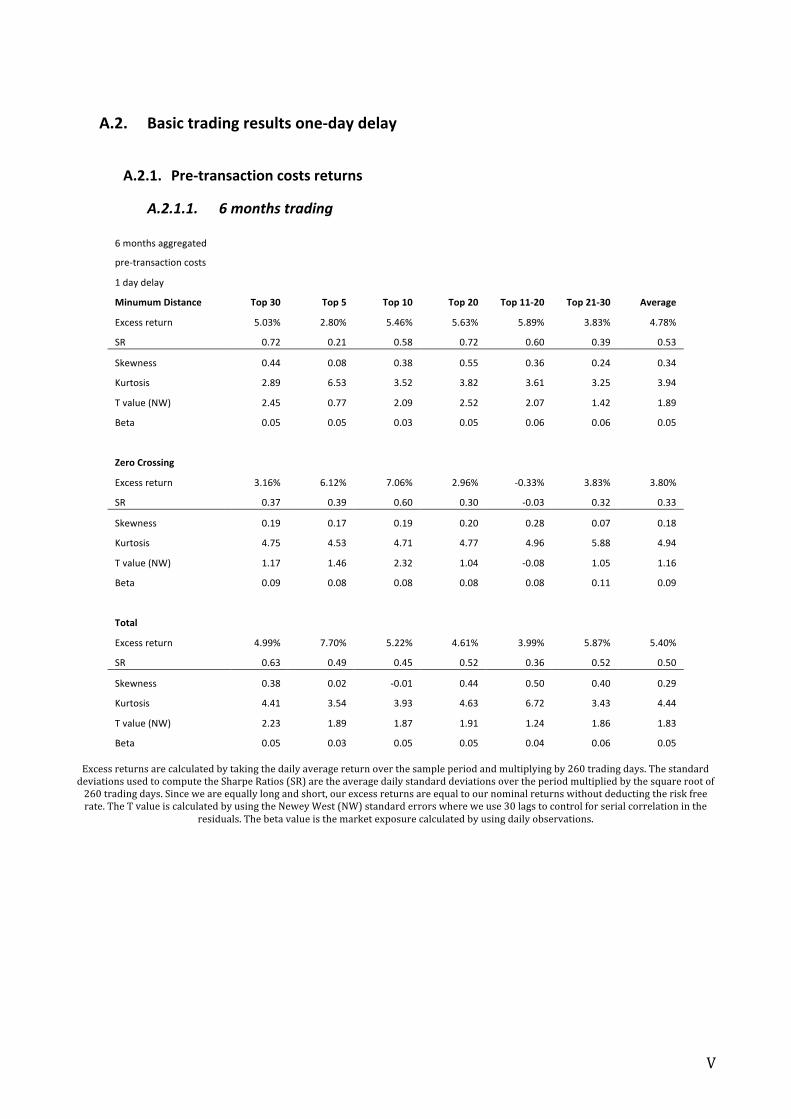
! V!
A.2. Basic!trading!results!oneFday!delay!!
A.2.1. PreFtransaction!costs!returns!
A.2.1.1. 6&months&trading&!
6!months!aggregated!!
pre/transaction!costs! !! !! !! !! !! !!
1!day!delay!!
!! !! !! !! !! !!
Minumum!Distance! Top!30! Top!5! Top!10! Top!20! Top!11F20! Top!21F30! Average!
Excess!return! 5.03%! 2.80%! 5.46%! 5.63%! 5.89%! 3.83%! 4.78%!
SR! 0.72! 0.21! 0.58! 0.72! 0.60! 0.39! 0.53!
Skewness! 0.44! 0.08! 0.38! 0.55! 0.36! 0.24! 0.34!
Kurtosis! 2.89! 6.53! 3.52! 3.82! 3.61! 3.25! 3.94!
T!value!(NW)! 2.45! 0.77! 2.09! 2.52! 2.07! 1.42! 1.89!
Beta! 0.05! 0.05! 0.03! 0.05! 0.06! 0.06! 0.05!
!! !! !! !! !! !! !! !!
Zero!Crossing! !! !! !! !! !! !! !!
Excess!return! 3.16%! 6.12%! 7.06%! 2.96%! /0.33%! 3.83%! 3.80%!
SR! 0.37! 0.39! 0.60! 0.30! /0.03! 0.32! 0.33!
Skewness! 0.19! 0.17! 0.19! 0.20! 0.28! 0.07! 0.18!
Kurtosis! 4.75! 4.53! 4.71! 4.77! 4.96! 5.88! 4.94!
T!value!(NW)! 1.17! 1.46! 2.32! 1.04! /0.08! 1.05! 1.16!
Beta! 0.09! 0.08! 0.08! 0.08! 0.08! 0.11! 0.09!
!! !! !! !! !! !! !! !!
Total!! !! !! !! !! !! !! !!
Excess!return! 4.99%! 7.70%! 5.22%! 4.61%! 3.99%! 5.87%! 5.40%!
SR! 0.63! 0.49! 0.45! 0.52! 0.36! 0.52! 0.50!
Skewness! 0.38! 0.02! /0.01! 0.44! 0.50! 0.40! 0.29!
Kurtosis! 4.41! 3.54! 3.93! 4.63! 6.72! 3.43! 4.44!
T!value!(NW)! 2.23! 1.89! 1.87! 1.91! 1.24! 1.86! 1.83!
Beta! 0.05! 0.03! 0.05! 0.05! 0.04! 0.06! 0.05!!
Excess!returns!are!calculated!by!taking!the!daily!average!return!over!the!sample!period!and!multiplying!by!260!trading!days.!The!standard!deviations!used!to!compute!the!Sharpe!Ratios!(SR)!are!the!average!daily!standard!deviations!over!the!period!multiplied!by!the!square!root!of!260!trading!days.!Since!we!are!equally!long!and!short,!our!excess!returns!are!equal!to!our!nominal!returns!without!deducting!the!risk!free!rate.!The!T!value!is!calculated!by!using!the!Newey!West!(NW)!standard!errors!where!we!use!30!lags!to!control!for!serial!correlation!in!the!
residuals.!The!beta!value!is!the!market!exposure!calculated!by!using!daily!observations.!! !

! VI!
A.2.1.2. 12&months&trading&!
12!months!!
pre/transaction!costs! !! !! !! !! !! !!
1!day!delay!!
!! !! !! !! !! !!
Minumum!Distance! Top!30! Top!5! Top!10! Top!20! Top!11F20! Top!21F30! Average!
Excess!return! 6.04%! 11.29%! 7.14%! 6.62%! 6.53%! 4.88%! 7.08%!
SR! 0.75! 0.80! 0.66! 0.71! 0.57! 0.48! 0.66!
Skewness! 0.51! 0.26! 0.76! 0.67! 0.57! 0.01! 0.47!
Kurtosis! 7.18! 15.02! 17.25! 10.25! 7.46! 3.91! 10.18!
T!value!(NW)! 2.65! 3.15! 2.47! 2.72! 2.16! 1.65! 2.47!
Beta! 0.07! 0.06! 0.05! 0.07! 0.09! 0.06! 0.07!
!! !! !! !! !! !! !! !!
Zero!Crossing! !! !! !! !! !! !! !!
Excess!return! 4.97%! 9.47%! 7.44%! 7.01%! 7.18%! 1.17%! 6.21%!
SR! 0.57! 0.61! 0.63! 0.71! 0.58! 0.09! 0.53!
Skewness! 0.36! 0.48! 0.27! 0.47! 0.69! 0.28! 0.43!
Kurtosis! 3.76! 5.01! 3.99! 4.61! 6.61! 6.83! 5.14!
T!value!(NW)! 1.85! 2.27! 2.22! 2.46! 2.05! 0.30! 1.86!
Beta! 0.07! 0.05! 0.03! 0.05! 0.06! 0.12! 0.06!
!! !! !! !! !! !! !! !!
Total!! !! !! !! !! !! !! !!
Excess!return! 5.94%! 13.16%! 9.38%! 5.59%! 1.79%! 6.65%! 7.08%!
SR! 0.70! 0.79! 0.78! 0.60! 0.15! 0.54! 0.59!
Skewness! 0.56! 0.63! 0.38! 0.32! /0.05! 0.48! 0.39!
Kurtosis! 9.19! 9.13! 5.68! 5.50! 5.48! 6.11! 6.85!
T!value!(NW)! 2.51! 2.75! 2.89! 2.11! 0.52! 2.02! 2.13!
Beta! 0.06! 0.01! 0.03! 0.06! 0.08! 0.06! 0.05!
!Excess!returns!are!calculated!by!taking!the!daily!average!return!over!the!sample!period!and!multiplying!by!260!trading!days.!The!standard!deviations!used!to!compute!the!Sharpe!Ratios!(SR)!are!the!average!daily!standard!deviations!over!the!period!multiplied!by!the!square!root!of!260!trading!days.!Since!we!are!equally!long!and!short,!our!excess!returns!are!equal!to!our!nominal!returns!without!deducting!the!risk!free!rate.!The!T!value!is!calculated!by!using!the!Newey!West!(NW)!standard!errors!where!we!use!30!lags!to!control!for!serial!correlation!in!the!
residuals.!The!beta!value!is!the!market!exposure!calculated!by!using!daily!observations.!! !
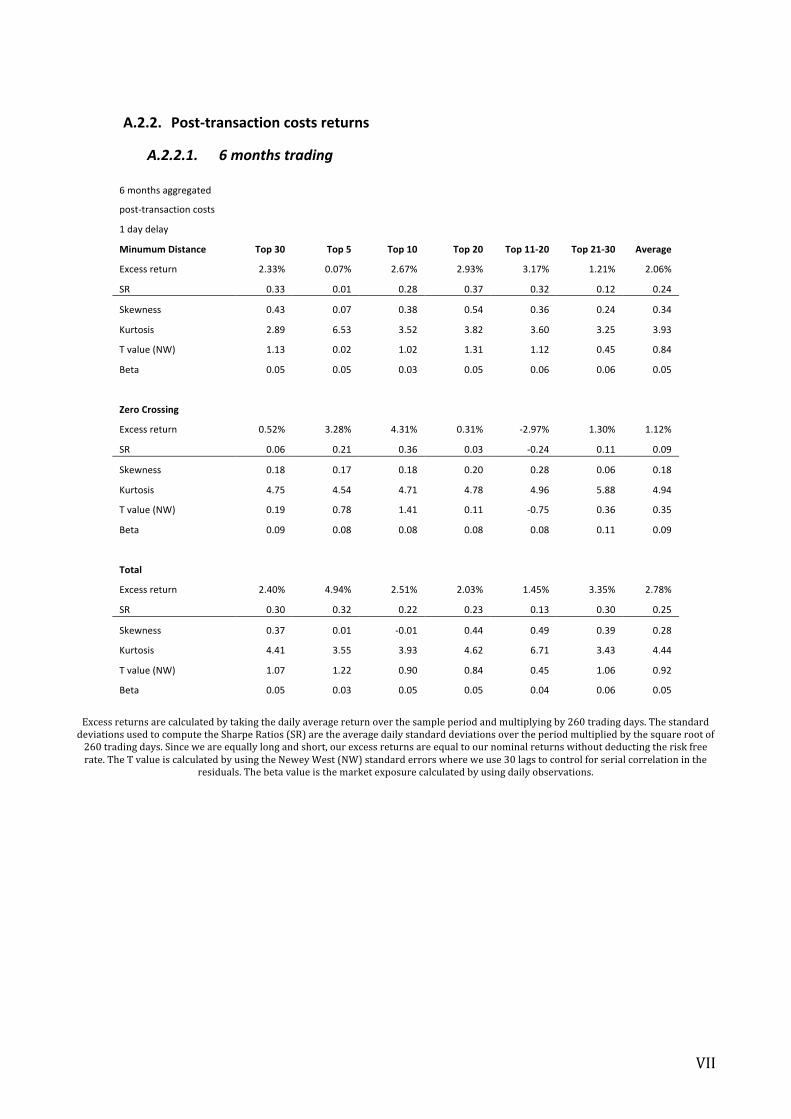
! VII!
A.2.2. PostFtransaction!costs!returns!
A.2.2.1. 6&months&trading&!
6!months!aggregated!!
post/transaction!costs! !! !! !! !! !! !!
1!day!delay!!
!! !! !! !! !! !!
Minumum!Distance! Top!30! Top!5! Top!10! Top!20! Top!11F20! Top!21F30! Average!
Excess!return! 2.33%! 0.07%! 2.67%! 2.93%! 3.17%! 1.21%! 2.06%!
SR! 0.33! 0.01! 0.28! 0.37! 0.32! 0.12! 0.24!
Skewness! 0.43! 0.07! 0.38! 0.54! 0.36! 0.24! 0.34!
Kurtosis! 2.89! 6.53! 3.52! 3.82! 3.60! 3.25! 3.93!
T!value!(NW)! 1.13! 0.02! 1.02! 1.31! 1.12! 0.45! 0.84!
Beta! 0.05! 0.05! 0.03! 0.05! 0.06! 0.06! 0.05!
!! !! !! !! !! !! !! !!
Zero!Crossing! !! !! !! !! !! !! !!
Excess!return! 0.52%! 3.28%! 4.31%! 0.31%! /2.97%! 1.30%! 1.12%!
SR! 0.06! 0.21! 0.36! 0.03! /0.24! 0.11! 0.09!
Skewness! 0.18! 0.17! 0.18! 0.20! 0.28! 0.06! 0.18!
Kurtosis! 4.75! 4.54! 4.71! 4.78! 4.96! 5.88! 4.94!
T!value!(NW)! 0.19! 0.78! 1.41! 0.11! /0.75! 0.36! 0.35!
Beta! 0.09! 0.08! 0.08! 0.08! 0.08! 0.11! 0.09!
!! !! !! !! !! !! !! !!
Total!! !! !! !! !! !! !! !!
Excess!return! 2.40%! 4.94%! 2.51%! 2.03%! 1.45%! 3.35%! 2.78%!
SR! 0.30! 0.32! 0.22! 0.23! 0.13! 0.30! 0.25!
Skewness! 0.37! 0.01! /0.01! 0.44! 0.49! 0.39! 0.28!
Kurtosis! 4.41! 3.55! 3.93! 4.62! 6.71! 3.43! 4.44!
T!value!(NW)! 1.07! 1.22! 0.90! 0.84! 0.45! 1.06! 0.92!
Beta! 0.05! 0.03! 0.05! 0.05! 0.04! 0.06! 0.05!
! !Excess!returns!are!calculated!by!taking!the!daily!average!return!over!the!sample!period!and!multiplying!by!260!trading!days.!The!standard!deviations!used!to!compute!the!Sharpe!Ratios!(SR)!are!the!average!daily!standard!deviations!over!the!period!multiplied!by!the!square!root!of!260!trading!days.!Since!we!are!equally!long!and!short,!our!excess!returns!are!equal!to!our!nominal!returns!without!deducting!the!risk!free!rate.!The!T!value!is!calculated!by!using!the!Newey!West!(NW)!standard!errors!where!we!use!30!lags!to!control!for!serial!correlation!in!the!
residuals.!The!beta!value!is!the!market!exposure!calculated!by!using!daily!observations.!
!
!! !
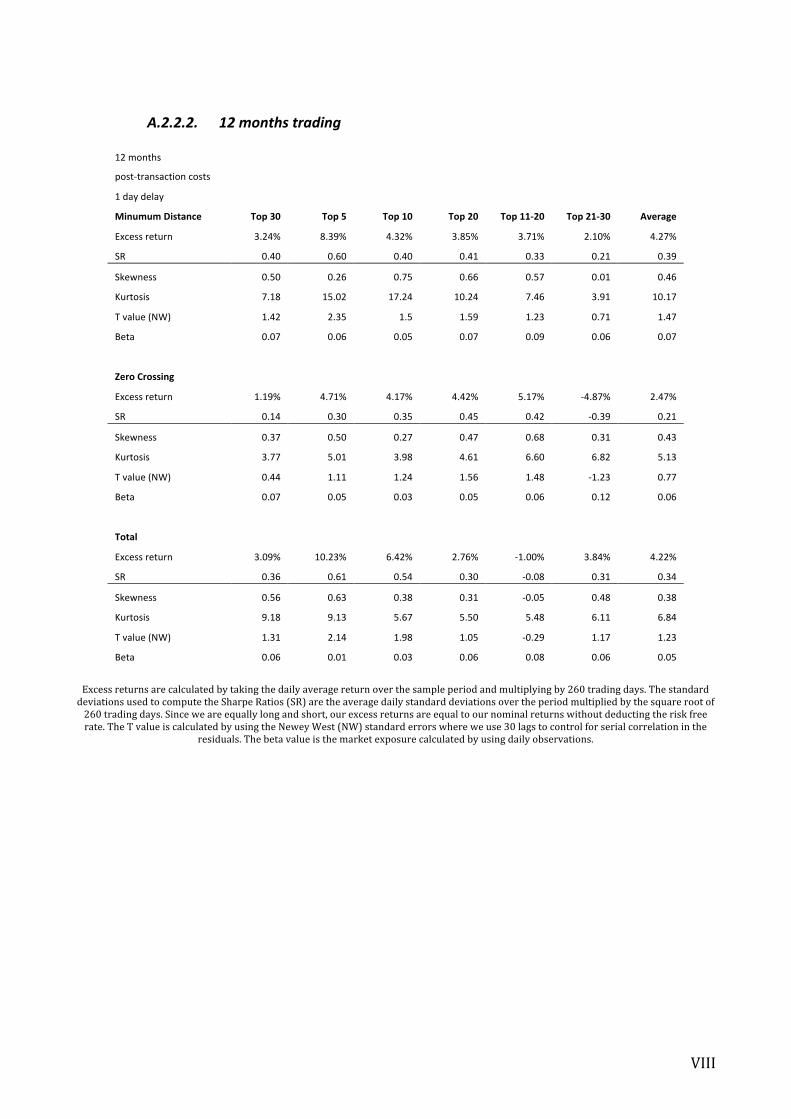
! VIII!
A.2.2.2. 12&months&trading&!
12!months!!
post/transaction!costs! !! !! !! !! !! !!
1!day!delay!!
!! !! !! !! !! !!
Minumum!Distance! Top!30! Top!5! Top!10! Top!20! Top!11F20! Top!21F30! Average!
Excess!return! 3.24%! 8.39%! 4.32%! 3.85%! 3.71%! 2.10%! 4.27%!
SR! 0.40! 0.60! 0.40! 0.41! 0.33! 0.21! 0.39!
Skewness! 0.50! 0.26! 0.75! 0.66! 0.57! 0.01! 0.46!
Kurtosis! 7.18! 15.02! 17.24! 10.24! 7.46! 3.91! 10.17!
T!value!(NW)! 1.42! 2.35! 1.5! 1.59! 1.23! 0.71! 1.47!
Beta! 0.07! 0.06! 0.05! 0.07! 0.09! 0.06! 0.07!
!! !! !! !! !! !! !! !!
Zero!Crossing! !! !! !! !! !! !! !!
Excess!return! 1.19%! 4.71%! 4.17%! 4.42%! 5.17%! /4.87%! 2.47%!
SR! 0.14! 0.30! 0.35! 0.45! 0.42! /0.39! 0.21!
Skewness! 0.37! 0.50! 0.27! 0.47! 0.68! 0.31! 0.43!
Kurtosis! 3.77! 5.01! 3.98! 4.61! 6.60! 6.82! 5.13!
T!value!(NW)! 0.44! 1.11! 1.24! 1.56! 1.48! /1.23! 0.77!
Beta! 0.07! 0.05! 0.03! 0.05! 0.06! 0.12! 0.06!
!! !! !! !! !! !! !! !!
Total!! !! !! !! !! !! !! !!
Excess!return! 3.09%! 10.23%! 6.42%! 2.76%! /1.00%! 3.84%! 4.22%!
SR! 0.36! 0.61! 0.54! 0.30! /0.08! 0.31! 0.34!
Skewness! 0.56! 0.63! 0.38! 0.31! /0.05! 0.48! 0.38!
Kurtosis! 9.18! 9.13! 5.67! 5.50! 5.48! 6.11! 6.84!
T!value!(NW)! 1.31! 2.14! 1.98! 1.05! /0.29! 1.17! 1.23!
Beta! 0.06! 0.01! 0.03! 0.06! 0.08! 0.06! 0.05!
!Excess!returns!are!calculated!by!taking!the!daily!average!return!over!the!sample!period!and!multiplying!by!260!trading!days.!The!standard!deviations!used!to!compute!the!Sharpe!Ratios!(SR)!are!the!average!daily!standard!deviations!over!the!period!multiplied!by!the!square!root!of!260!trading!days.!Since!we!are!equally!long!and!short,!our!excess!returns!are!equal!to!our!nominal!returns!without!deducting!the!risk!free!rate.!The!T!value!is!calculated!by!using!the!Newey!West!(NW)!standard!errors!where!we!use!30!lags!to!control!for!serial!correlation!in!the!
residuals.!The!beta!value!is!the!market!exposure!calculated!by!using!daily!observations.!! !
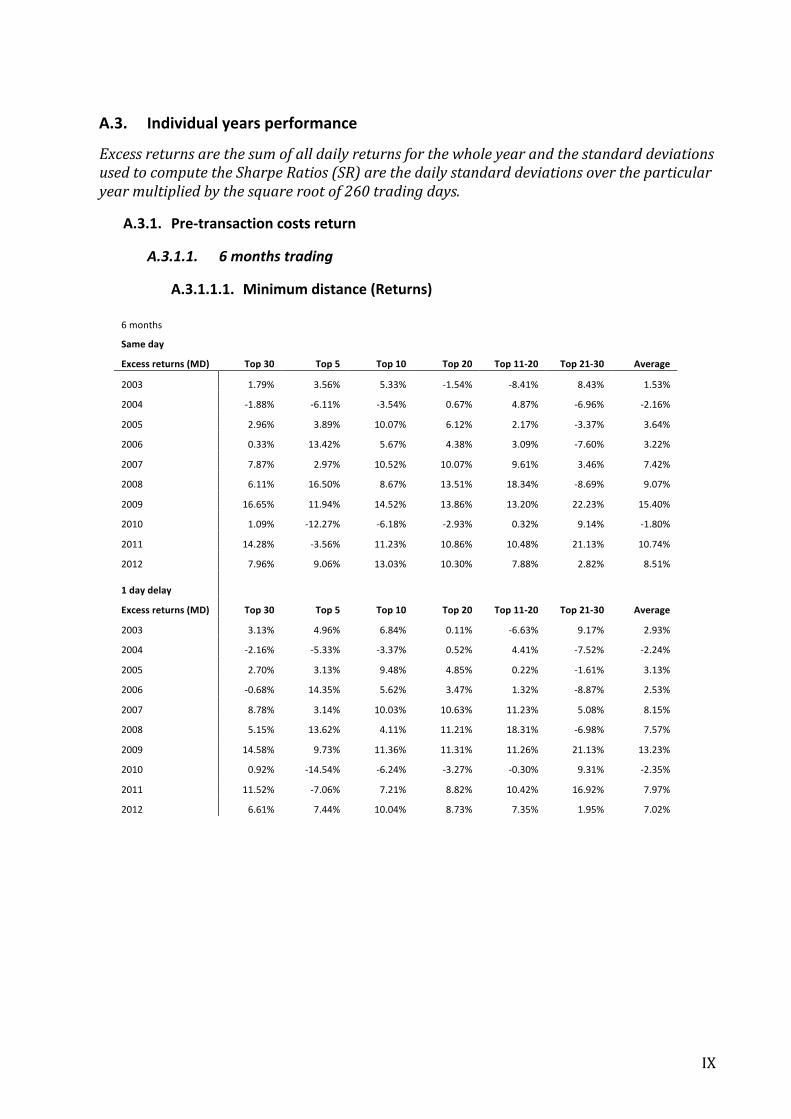
! IX!
A.3. Individual!years!performance!
Excess0returns0are0the0sum0of0all0daily0returns0for0the0whole0year0and0the0standard0deviations0used0to0compute0the0Sharpe0Ratios0(SR)0are0the0daily0standard0deviations0over0the0particular0year0multiplied0by0the0square0root0of02600trading0days.0
A.3.1. PreFtransaction!costs!return!
A.3.1.1. 6&months&trading&
A.3.1.1.1. Minimum!distance!(Returns)!!
6!months!
Same!day! !! !! !! !! !! !! !!
Excess!returns!(MD)! Top!30! Top!5! Top!10! Top!20! Top!11F20! Top!21F30! Average!
2003! 1.79%! 3.56%! 5.33%! /1.54%! /8.41%! 8.43%! 1.53%!
2004! /1.88%! /6.11%! /3.54%! 0.67%! 4.87%! /6.96%! /2.16%!
2005! 2.96%! 3.89%! 10.07%! 6.12%! 2.17%! /3.37%! 3.64%!
2006! 0.33%! 13.42%! 5.67%! 4.38%! 3.09%! /7.60%! 3.22%!
2007! 7.87%! 2.97%! 10.52%! 10.07%! 9.61%! 3.46%! 7.42%!
2008! 6.11%! 16.50%! 8.67%! 13.51%! 18.34%! /8.69%! 9.07%!
2009! 16.65%! 11.94%! 14.52%! 13.86%! 13.20%! 22.23%! 15.40%!
2010! 1.09%! /12.27%! /6.18%! /2.93%! 0.32%! 9.14%! /1.80%!
2011! 14.28%! /3.56%! 11.23%! 10.86%! 10.48%! 21.13%! 10.74%!
2012! 7.96%! 9.06%! 13.03%! 10.30%! 7.88%! 2.82%! 8.51%!!1!day!delay! !! !! !! !! !! !! !!
Excess!returns!(MD)! Top!30! Top!5! Top!10! Top!20! Top!11F20! Top!21F30! Average!
2003! 3.13%! 4.96%! 6.84%! 0.11%! /6.63%! 9.17%! 2.93%!
2004! /2.16%! /5.33%! /3.37%! 0.52%! 4.41%! /7.52%! /2.24%!
2005! 2.70%! 3.13%! 9.48%! 4.85%! 0.22%! /1.61%! 3.13%!
2006! /0.68%! 14.35%! 5.62%! 3.47%! 1.32%! /8.87%! 2.53%!
2007! 8.78%! 3.14%! 10.03%! 10.63%! 11.23%! 5.08%! 8.15%!
2008! 5.15%! 13.62%! 4.11%! 11.21%! 18.31%! /6.98%! 7.57%!
2009! 14.58%! 9.73%! 11.36%! 11.31%! 11.26%! 21.13%! 13.23%!
2010! 0.92%! /14.54%! /6.24%! /3.27%! /0.30%! 9.31%! /2.35%!
2011! 11.52%! /7.06%! 7.21%! 8.82%! 10.42%! 16.92%! 7.97%!
2012! 6.61%! 7.44%! 10.04%! 8.73%! 7.35%! 1.95%! 7.02%!
!! !

! X!
A.3.1.1.2. Minimum!distance!(Sharpe!ratio)!!6!months!
Same!day! !! !! !! !! !! !! !!
Annual!SR!(MD)! Top!30! Top!5! Top!10! Top!20! Top!11F20! Top!21F30! Average!
2003! 0.20! 0.30! 0.52! /0.16! /0.71! 0.86! 0.17!
2004! /0.40! /0.52! /0.53! 0.12! 0.73! /1.16! /0.30!
2005! 0.52! 0.50! 1.54! 1.00! 0.27! /0.42! 0.57!
2006! 0.07! 1.50! 0.61! 0.71! 0.36! /0.93! 0.38!
2007! 1.14! 0.27! 1.21! 1.42! 1.01! 0.33! 0.90!
2008! 0.57! 0.72! 0.56! 1.08! 1.29! /0.69! 0.59!
2009! 1.98! 0.69! 1.28! 1.38! 0.99! 1.97! 1.38!
2010! 0.23! /1.21! /0.84! /0.58! 0.06! 1.23! /0.19!
2011! 2.10! /0.34! 1.36! 1.57! 1.14! 1.87! 1.28!
2012! 1.36! 0.90! 1.96! 1.81! 0.90! 0.25! 1.20!!1!day!delay! !! !! !! !! !! !! !!
Annual!SR!(MD)! Top!30! Top!5! Top!10! Top!20! Top!11F20! Top!21F30! Average!
2003! 0.20! 0.30! 0.52! /0.16! /0.71! 0.86! 0.17!
2004! /0.40! /0.52! /0.53! 0.12! 0.73! /1.16! /0.30!
2005! 0.52! 0.50! 1.54! 1.00! 0.27! /0.42! 0.57!
2006! 0.07! 1.50! 0.61! 0.71! 0.36! /0.93! 0.38!
2007! 1.14! 0.27! 1.21! 1.42! 1.01! 0.33! 0.90!
2008! 0.57! 0.72! 0.56! 1.08! 1.29! /0.69! 0.59!
2009! 1.98! 0.69! 1.28! 1.38! 0.99! 1.97! 1.38!
2010! 0.23! /1.21! /0.84! /0.58! 0.06! 1.23! /0.19!
2011! 2.10! /0.34! 1.36! 1.57! 1.14! 1.87! 1.28!
2012! 1.36! 0.90! 1.96! 1.81! 0.90! 0.25! 1.20!!
!! !

! XI!
A.3.1.1.3. Zero!Crossing!(Returns)!!6!months!
Same!day! !! !! !! !! !! !! !!
Excess!returns!(ZC)! Top!30! Top!5! Top!10! Top!20! Top!11F20! Top!21F30! Average!
2003! 7.66%! /9.47%! 7.91%! 6.63%! 5.36%! 9.79%! 4.65%!
2004! 5.01%! 9.04%! 17.82%! 4.60%! /8.62%! 5.84%! 5.61%!
2005! 0.91%! 5.49%! 2.82%! 0.95%! /0.92%! 0.84%! 1.68%!
2006! 2.02%! /2.24%! /1.21%! /2.84%! /4.47%! 11.75%! 0.50%!
2007! /23.83%! 3.14%! /0.16%! /24.22%! /48.46%! /23.28%! /19.47%!
2008! 16.29%! 15.79%! 15.09%! 14.21%! 13.34%! 20.44%! 15.86%!
2009! 9.02%! 23.70%! 7.01%! 11.38%! 15.75%! 4.30%! 11.86%!
2010! 2.01%! /1.74%! /1.20%! 3.96%! 9.13%! /1.88%! 1.71%!
2011! 7.30%! 23.79%! 15.91%! 5.03%! /5.86%! 11.86%! 9.67%!
2012! 6.73%! /4.45%! 7.00%! 11.05%! 15.11%! /1.90%! 5.59%!!1!day!delay! !! !! !! !! !! !! !!
Excess!returns!(ZC)! Top!30! Top!5! Top!10! Top!20! Top!11F20! Top!21F30! Average!
2003! 7.66%! /9.47%! 7.91%! 6.63%! 5.36%! 9.79%! 4.65%!
2004! 5.01%! 9.04%! 17.82%! 4.60%! /8.62%! 5.84%! 5.61%!
2005! 0.91%! 5.49%! 2.82%! 0.95%! /0.92%! 0.84%! 1.68%!
2006! 2.02%! /2.24%! /1.21%! /2.84%! /4.47%! 11.75%! 0.50%!
2007! /23.83%! 3.14%! /0.16%! /24.22%! /48.46%! /23.28%! /19.47%!
2008! 16.29%! 15.79%! 15.09%! 14.21%! 13.34%! 20.44%! 15.86%!
2009! 9.02%! 23.70%! 7.01%! 11.38%! 15.75%! 4.30%! 11.86%!
2010! 2.01%! /1.74%! /1.20%! 3.96%! 9.13%! /1.88%! 1.71%!
2011! 7.30%! 23.79%! 15.91%! 5.03%! /5.86%! 11.86%! 9.67%!
2012! 6.73%! /4.45%! 7.00%! 11.05%! 15.11%! /1.90%! 5.59%!
!! !

! XII!
A.3.1.1.4. Zero!Crossing!(Sharpe!ratios)!!6!months!
Same!day! !! !! !! !! !! !! !!
Annual!SR!(ZC)! Top!30! Top!5! Top!10! Top!20! Top!11F20! Top!21F30! Average!
2003! 0.21! /0.15! 0.03! 0.05! 0.04! 0.34! 0.09!
2004! 1.32! 1.17! 1.97! 1.22! /0.60! 0.81! 0.98!
2005! 0.05! 0.52! /0.12! /0.10! /0.03! 0.30! 0.10!
2006! 0.44! 0.78! 0.38! /0.25! /1.06! 2.11! 0.40!
2007! /1.71! /1.77! /1.52! /1.01! /0.30! /1.98! /1.38!
2008! 1.31! 0.04! 0.69! 0.96! 0.86! 1.30! 0.86!
2009! 1.14! 1.42! 0.73! 0.79! 0.65! 0.95! 0.95!
2010! 1.52! 0.43! 0.83! 1.37! 1.39! 1.01! 1.09!
2011! 1.83! 0.88! 1.28! 1.32! 0.51! 1.90! 1.29!
2012! 0.77! 0.10! 0.83! 1.18! 1.02! /0.15! 0.63!!1!day!delay! !! !! !! !! !! !! !!
Annual!SR!(ZC)! Top!30! Top!5! Top!10! Top!20! Top!11F20! Top!21F30! Average!
2003! 0.27! /0.16! 0.00! 0.11! 0.19! 0.38! 0.13!
2004! 1.30! 1.03! 1.87! 1.12! /0.66! 0.90! 0.93!
2005! /0.13! 0.42! /0.27! /0.40! /0.31! 0.42! /0.05!
2006! 0.28! 0.73! 0.31! /0.33! /1.16! 1.81! 0.27!
2007! /1.92! /1.71! /1.54! /1.35! /0.72! /2.06! /1.55!
2008! 1.07! /0.24! 0.34! 0.71! 0.81! 1.18! 0.64!
2009! 1.03! 1.27! 0.60! 0.69! 0.60! 0.91! 0.85!
2010! 1.41! 0.46! 0.68! 1.22! 1.31! 1.00! 1.01!
2011! 1.65! 0.83! 1.17! 1.26! 0.56! 1.62! 1.18!
2012! 0.54! 0.11! 0.90! 1.10! 0.86! /0.53! 0.50!
!! !

! XIII!
A.3.1.1.5. Total!(Returns)!!6!months!
Same!day! !! !! !! !! !! !! !!
Excess!returns!(Total)! Top!30! Top!5! Top!10! Top!20! Top!11F20! Top!21F30! Average!
2003! 8.45%! /10.29%! 1.03%! 8.17%! 15.31%! 9.02%! 5.28%!
2004! 2.69%! 22.42%! 10.99%! 8.57%! 6.15%! /9.08%! 6.96%!
2005! 3.50%! 10.80%! 7.85%! 5.66%! 3.46%! /0.82%! 5.08%!
2006! 13.13%! 11.19%! 10.68%! 10.45%! 10.22%! 18.48%! 12.36%!
2007! 0.74%! 3.84%! /3.49%! /4.19%! /4.88%! 10.59%! 0.43%!
2008! 15.16%! 22.95%! 12.92%! 14.65%! 16.38%! 16.18%! 16.37%!
2009! 7.84%! 23.25%! 13.67%! 7.38%! 1.10%! 8.74%! 10.33%!
2010! /4.68%! /3.39%! 0.15%! /1.65%! /3.44%! /10.75%! /3.96%!
2011! 10.41%! 18.23%! 10.85%! 10.20%! 9.55%! 10.84%! 11.68%!
2012! 4.82%! /1.47%! 13.67%! 4.39%! /4.90%! 5.68%! 3.70%!!1!day!delay! !! !! !! !! !! !! !!
Excess!returns!(Total)! Top!30! Top!5! Top!10! Top!20! Top!11F20! Top!21F30! Average!
2003! 8.45%! /10.29%! 1.03%! 8.17%! 15.31%! 9.02%! 5.28%!
2004! 2.69%! 22.42%! 10.99%! 8.57%! 6.15%! /9.08%! 6.96%!
2005! 3.50%! 10.80%! 7.85%! 5.66%! 3.46%! /0.82%! 5.08%!
2006! 13.13%! 11.19%! 10.68%! 10.45%! 10.22%! 18.48%! 12.36%!
2007! 0.74%! 3.84%! /3.49%! /4.19%! /4.88%! 10.59%! 0.43%!
2008! 15.16%! 22.95%! 12.92%! 14.65%! 16.38%! 16.18%! 16.37%!
2009! 7.84%! 23.25%! 13.67%! 7.38%! 1.10%! 8.74%! 10.33%!
2010! /4.68%! /3.39%! 0.15%! /1.65%! /3.44%! /10.75%! /3.96%!
2011! 10.41%! 18.23%! 10.85%! 10.20%! 9.55%! 10.84%! 11.68%!
2012! 4.82%! /1.47%! 13.67%! 4.39%! /4.90%! 5.68%! 3.70%!
!! !

! XIV!
A.3.1.1.6. Total!(Sharpe!ratio)!!6!months!
Same!day! !! !! !! !! !! !! !!
Annual!SR!(Total)! Top!30! Top!5! Top!10! Top!20! Top!11F20! Top!21F30! Average!
2003! 0.42! /0.16! /0.21! 0.17! 0.37! 0.73! 0.22!
2004! 1.89! 2.85! 2.08! 2.52! 1.64! /0.23! 1.79!
2005! 0.48! 1.29! 0.25! 0.22! 0.12! 0.62! 0.50!
2006! 0.86! /0.30! /0.18! 0.16! 0.69! 1.59! 0.47!
2007! /1.02! /0.61! /0.27! /1.10! /1.81! /0.07! /0.81!
2008! 0.96! 1.05! 0.84! 0.73! 0.29! 0.91! 0.80!
2009! 1.13! 1.45! 0.94! 1.08! 0.65! 0.68! 0.99!
2010! 0.25! 0.00! 1.00! 0.80! 0.12! /0.48! 0.28!
2011! /0.04! 0.95! 0.95! 0.53! /0.12! /0.67! 0.27!
2012! 1.31! 0.10! 1.84! 0.68! /0.47! 1.96! 0.90!!1!day!delay! !! !! !! !! !! !! !!
Annual!SR!(Total)! Top!30! Top!5! Top!10! Top!20! Top!11F20! Top!21F30! Average!
2003! 0.54! /0.25! /0.23! 0.28! 0.53! 0.80! 0.28!
2004! 1.70! 2.80! 2.02! 2.36! 1.44! /0.33! 1.66!
2005! 0.30! 1.07! 0.05! 0.01! /0.02! 0.57! 0.33!
2006! 0.77! /0.28! /0.21! 0.01! 0.43! 1.68! 0.40!
2007! /1.42! /0.88! /0.70! /1.49! /2.05! /0.18! /1.12!
2008! 0.72! 0.87! 0.35! 0.30! 0.12! 0.98! 0.56!
2009! 0.95! 1.31! 0.79! 0.95! 0.61! 0.52! 0.86!
2010! 0.10! 0.17! 1.19! 0.75! /0.10! /0.69! 0.24!
2011! /0.22! 0.89! 0.83! 0.34! /0.33! /0.73! 0.13!
2012! 0.94! 0.11! 1.59! 0.28! /0.91! 1.84! 0.64!
! !
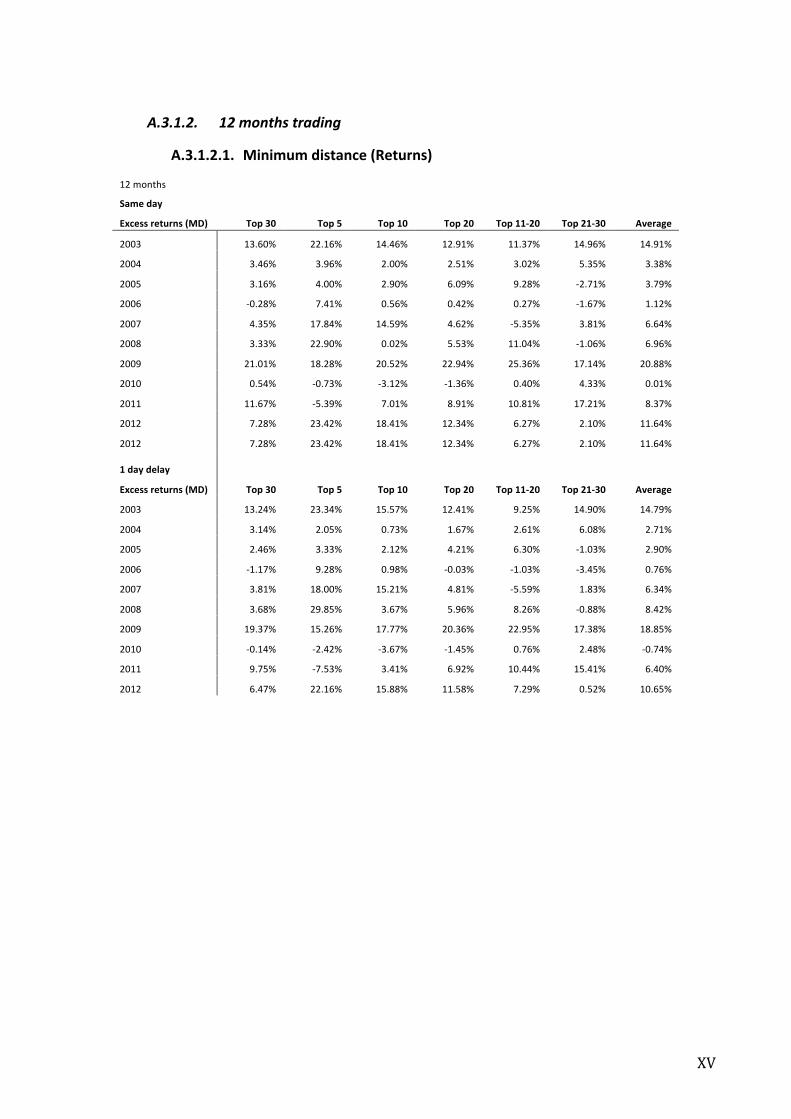
! XV!
A.3.1.2. 12&months&trading&&
A.3.1.2.1. Minimum!distance!(Returns)!!12!months!
Same!day! !! !! !! !! !! !! !!
Excess!returns!(MD)! Top!30! Top!5! Top!10! Top!20! Top!11F20! Top!21F30! Average!
2003! 13.60%! 22.16%! 14.46%! 12.91%! 11.37%! 14.96%! 14.91%!
2004! 3.46%! 3.96%! 2.00%! 2.51%! 3.02%! 5.35%! 3.38%!
2005! 3.16%! 4.00%! 2.90%! 6.09%! 9.28%! /2.71%! 3.79%!
2006! /0.28%! 7.41%! 0.56%! 0.42%! 0.27%! /1.67%! 1.12%!
2007! 4.35%! 17.84%! 14.59%! 4.62%! /5.35%! 3.81%! 6.64%!
2008! 3.33%! 22.90%! 0.02%! 5.53%! 11.04%! /1.06%! 6.96%!
2009! 21.01%! 18.28%! 20.52%! 22.94%! 25.36%! 17.14%! 20.88%!
2010! 0.54%! /0.73%! /3.12%! /1.36%! 0.40%! 4.33%! 0.01%!
2011! 11.67%! /5.39%! 7.01%! 8.91%! 10.81%! 17.21%! 8.37%!
2012! 7.28%! 23.42%! 18.41%! 12.34%! 6.27%! 2.10%! 11.64%!
2012! 7.28%! 23.42%! 18.41%! 12.34%! 6.27%! 2.10%! 11.64%!!1!day!delay! !! !! !! !! !! !! !!
Excess!returns!(MD)! Top!30! Top!5! Top!10! Top!20! Top!11F20! Top!21F30! Average!
2003! 13.24%! 23.34%! 15.57%! 12.41%! 9.25%! 14.90%! 14.79%!
2004! 3.14%! 2.05%! 0.73%! 1.67%! 2.61%! 6.08%! 2.71%!
2005! 2.46%! 3.33%! 2.12%! 4.21%! 6.30%! /1.03%! 2.90%!
2006! /1.17%! 9.28%! 0.98%! /0.03%! /1.03%! /3.45%! 0.76%!
2007! 3.81%! 18.00%! 15.21%! 4.81%! /5.59%! 1.83%! 6.34%!
2008! 3.68%! 29.85%! 3.67%! 5.96%! 8.26%! /0.88%! 8.42%!
2009! 19.37%! 15.26%! 17.77%! 20.36%! 22.95%! 17.38%! 18.85%!
2010! /0.14%! /2.42%! /3.67%! /1.45%! 0.76%! 2.48%! /0.74%!
2011! 9.75%! /7.53%! 3.41%! 6.92%! 10.44%! 15.41%! 6.40%!
2012! 6.47%! 22.16%! 15.88%! 11.58%! 7.29%! 0.52%! 10.65%!
! !

! XVI!
A.3.1.2.2. Minimum!distance!(Sharpe!ratios)!!12!months!
Same!day! !! !! !! !! !! !! !!
Annual!SR!(MD)! Top!30! Top!5! Top!10! Top!20! Top!11F20! Top!21F30! Average!
2003! 1.59! 1.53! 1.32! 1.39! 0.92! 1.54! 1.38!
2004! 0.68! 0.41! 0.31! 0.49! 0.47! 0.77! 0.52!
2005! 0.49! 0.50! 0.37! 0.80! 0.97! /0.36! 0.46!
2006! /0.06! 0.86! 0.07! 0.07! 0.03! /0.20! 0.13!
2007! 0.60! 1.66! 2.03! 0.60! /0.44! 0.38! 0.80!
2008! 0.22! 0.81! 0.00! 0.30! 0.61! /0.07! 0.31!
2009! 2.26! 1.12! 1.95! 1.96! 1.45! 1.63! 1.73!
2010! 0.10! /0.07! /0.39! /0.23! 0.06! 0.64! 0.02!
2011! 1.45! /0.50! 0.84! 1.17! 1.04! 1.21! 0.87!
2012! 1.22! 2.30! 2.74! 2.06! 0.70! 0.19! 1.54!!1!day!delay! !! !! !! !! !! !! !!
Annual!SR!(MD)! Top!30! Top!5! Top!10! Top!20! Top!11F20! Top!21F30! Average!
2003! 1.56! 1.61! 1.43! 1.34! 0.75! 1.54! 1.37!
2004! 0.63! 0.21! 0.12! 0.33! 0.41! 0.88! 0.43!
2005! 0.39! 0.42! 0.27! 0.56! 0.66! /0.14! 0.36!
2006! /0.24! 1.07! 0.13! 0.00! /0.13! /0.42! 0.07!
2007! 0.53! 1.67! 2.10! 0.63! /0.47! 0.18! 0.77!
2008! 0.24! 1.06! 0.16! 0.32! 0.46! /0.06! 0.36!
2009! 2.07! 0.90! 1.66! 1.73! 1.32! 1.66! 1.55!
2010! /0.03! /0.22! /0.46! /0.25! 0.11! 0.37! /0.08!
2011! 1.25! /0.70! 0.41! 0.92! 1.02! 1.13! 0.67!
2012! 1.10! 2.17! 2.43! 1.95! 1.23! 0.05! 1.49!
!! !
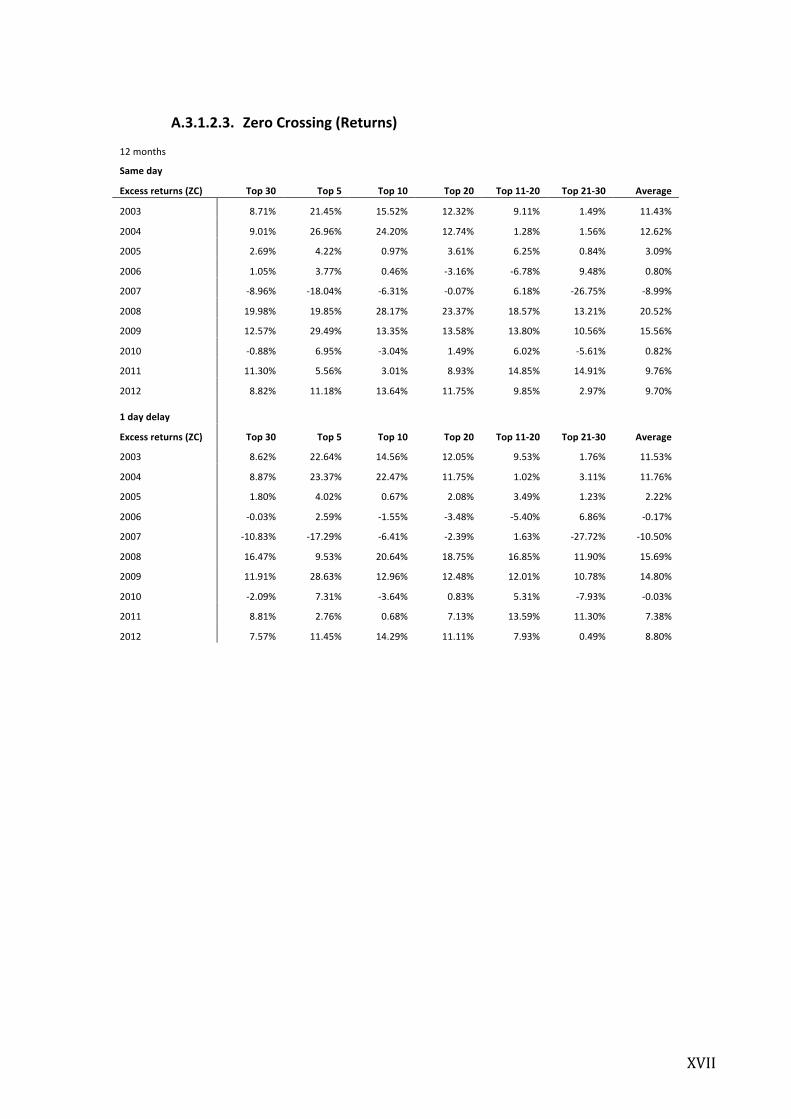
! XVII!
A.3.1.2.3. Zero!Crossing!(Returns)!!12!months!
Same!day! !! !! !! !! !! !! !!
Excess!returns!(ZC)! Top!30! Top!5! Top!10! Top!20! Top!11F20! Top!21F30! Average!
2003! 8.71%! 21.45%! 15.52%! 12.32%! 9.11%! 1.49%! 11.43%!
2004! 9.01%! 26.96%! 24.20%! 12.74%! 1.28%! 1.56%! 12.62%!
2005! 2.69%! 4.22%! 0.97%! 3.61%! 6.25%! 0.84%! 3.09%!
2006! 1.05%! 3.77%! 0.46%! /3.16%! /6.78%! 9.48%! 0.80%!
2007! /8.96%! /18.04%! /6.31%! /0.07%! 6.18%! /26.75%! /8.99%!
2008! 19.98%! 19.85%! 28.17%! 23.37%! 18.57%! 13.21%! 20.52%!
2009! 12.57%! 29.49%! 13.35%! 13.58%! 13.80%! 10.56%! 15.56%!
2010! /0.88%! 6.95%! /3.04%! 1.49%! 6.02%! /5.61%! 0.82%!
2011! 11.30%! 5.56%! 3.01%! 8.93%! 14.85%! 14.91%! 9.76%!
2012! 8.82%! 11.18%! 13.64%! 11.75%! 9.85%! 2.97%! 9.70%!!1!day!delay! !! !! !! !! !! !! !!
Excess!returns!(ZC)! Top!30! Top!5! Top!10! Top!20! Top!11F20! Top!21F30! Average!
2003! 8.62%! 22.64%! 14.56%! 12.05%! 9.53%! 1.76%! 11.53%!
2004! 8.87%! 23.37%! 22.47%! 11.75%! 1.02%! 3.11%! 11.76%!
2005! 1.80%! 4.02%! 0.67%! 2.08%! 3.49%! 1.23%! 2.22%!
2006! /0.03%! 2.59%! /1.55%! /3.48%! /5.40%! 6.86%! /0.17%!
2007! /10.83%! /17.29%! /6.41%! /2.39%! 1.63%! /27.72%! /10.50%!
2008! 16.47%! 9.53%! 20.64%! 18.75%! 16.85%! 11.90%! 15.69%!
2009! 11.91%! 28.63%! 12.96%! 12.48%! 12.01%! 10.78%! 14.80%!
2010! /2.09%! 7.31%! /3.64%! 0.83%! 5.31%! /7.93%! /0.03%!
2011! 8.81%! 2.76%! 0.68%! 7.13%! 13.59%! 11.30%! 7.38%!
2012! 7.57%! 11.45%! 14.29%! 11.11%! 7.93%! 0.49%! 8.80%!
! !
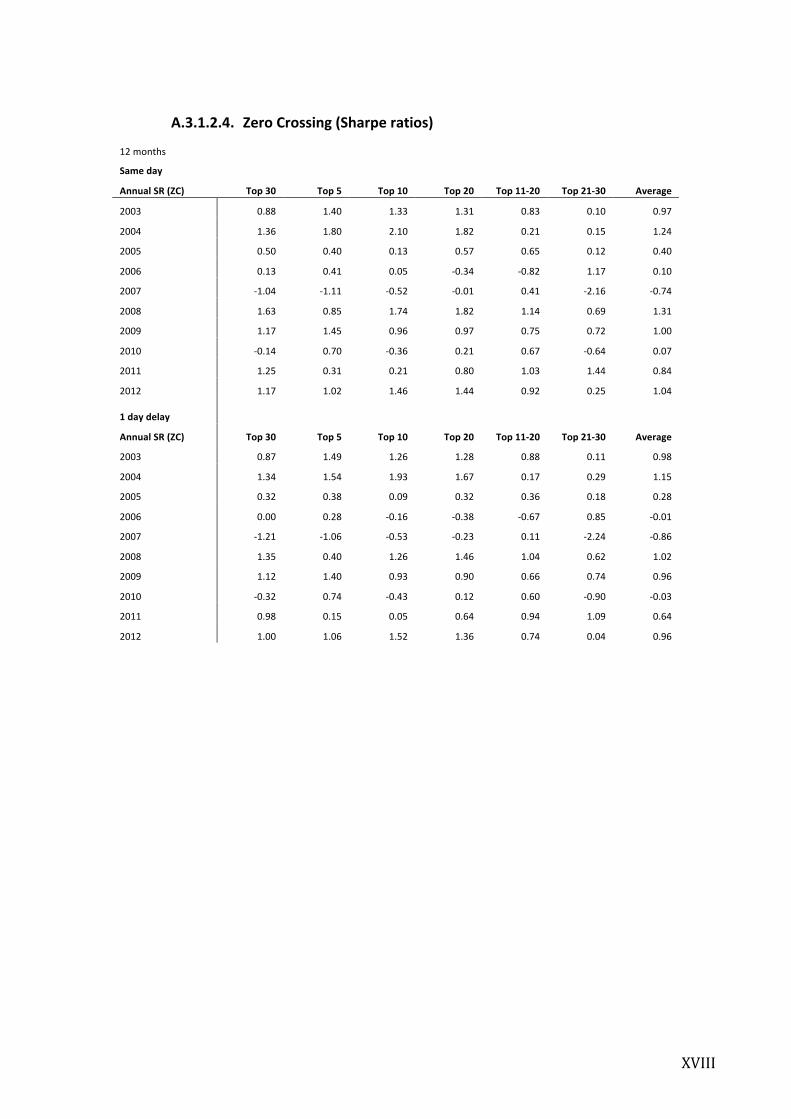
! XVIII!
A.3.1.2.4. Zero!Crossing!(Sharpe!ratios)!!12!months!
Same!day! !! !! !! !! !! !! !!
Annual!SR!(ZC)! Top!30! Top!5! Top!10! Top!20! Top!11F20! Top!21F30! Average!
2003! 0.88! 1.40! 1.33! 1.31! 0.83! 0.10! 0.97!
2004! 1.36! 1.80! 2.10! 1.82! 0.21! 0.15! 1.24!
2005! 0.50! 0.40! 0.13! 0.57! 0.65! 0.12! 0.40!
2006! 0.13! 0.41! 0.05! /0.34! /0.82! 1.17! 0.10!
2007! /1.04! /1.11! /0.52! /0.01! 0.41! /2.16! /0.74!
2008! 1.63! 0.85! 1.74! 1.82! 1.14! 0.69! 1.31!
2009! 1.17! 1.45! 0.96! 0.97! 0.75! 0.72! 1.00!
2010! /0.14! 0.70! /0.36! 0.21! 0.67! /0.64! 0.07!
2011! 1.25! 0.31! 0.21! 0.80! 1.03! 1.44! 0.84!
2012! 1.17! 1.02! 1.46! 1.44! 0.92! 0.25! 1.04!!1!day!delay! !! !! !! !! !! !! !!
Annual!SR!(ZC)! Top!30! Top!5! Top!10! Top!20! Top!11F20! Top!21F30! Average!
2003! 0.87! 1.49! 1.26! 1.28! 0.88! 0.11! 0.98!
2004! 1.34! 1.54! 1.93! 1.67! 0.17! 0.29! 1.15!
2005! 0.32! 0.38! 0.09! 0.32! 0.36! 0.18! 0.28!
2006! 0.00! 0.28! /0.16! /0.38! /0.67! 0.85! /0.01!
2007! /1.21! /1.06! /0.53! /0.23! 0.11! /2.24! /0.86!
2008! 1.35! 0.40! 1.26! 1.46! 1.04! 0.62! 1.02!
2009! 1.12! 1.40! 0.93! 0.90! 0.66! 0.74! 0.96!
2010! /0.32! 0.74! /0.43! 0.12! 0.60! /0.90! /0.03!
2011! 0.98! 0.15! 0.05! 0.64! 0.94! 1.09! 0.64!
2012! 1.00! 1.06! 1.52! 1.36! 0.74! 0.04! 0.96!
!! !

! XIX!
A.3.1.2.5. Total!(Returns)!!12!months!
Same!day! ! ! ! ! ! ! !
Excess!returns!(Total)! Top!30! Top!5! Top!10! Top!20! Top!11F20! Top!21F30! Average!
2003! 10.32%! 28.58%! 15.30%! 12.61%! 9.92%! 5.74%! 13.74%!
2004! 5.66%! 20.86%! 11.51%! 8.35%! 5.19%! 0.30%! 8.65%!
2005! 1.35%! 9.08%! 0.11%! 1.84%! 3.58%! 0.35%! 2.72%!
2006! 4.50%! /8.44%! /8.26%! 1.71%! 11.68%! 10.07%! 1.88%!
2007! /7.80%! 5.80%! 6.06%! /15.87%! /37.80%! 12.43%! /6.20%!
2008! 12.86%! 35.50%! 26.03%! 15.97%! 5.90%! 6.64%! 17.15%!
2009! 21.37%! 33.01%! 26.48%! 23.88%! 21.28%! 16.35%! 23.73%!
2010! 4.93%! /0.46%! 8.15%! 5.63%! 3.11%! 3.53%! 4.15%!
2011! 6.28%! 9.93%! 10.67%! 6.31%! 1.94%! 5.61%! 6.79%!
2012! 13.12%! 11.18%! 17.57%! 12.71%! 7.84%! 13.95%! 12.73%!!1!day!delay! !! !! !! !! !! !! !!
Excess!returns!(Total)! Top!30! Top!5! Top!10! Top!20! Top!11F20! Top!21F30! Average!
2003! 10.46%! 26.91%! 14.40%! 12.55%! 10.71%! 6.27%! 13.55%!
2004! 5.02%! 19.57%! 10.77%! 7.75%! 4.74%! /0.44%! 7.90%!
2005! 0.60%! 8.70%! /0.18%! 0.60%! 1.37%! 0.61%! 1.95%!
2006! 3.45%! /9.18%! /9.06%! 0.48%! 10.02%! 9.39%! 0.85%!
2007! /9.77%! 2.52%! 1.90%! /19.12%! /40.15%! 10.94%! /8.95%!
2008! 10.36%! 31.90%! 18.81%! 11.40%! 3.98%! 8.29%! 14.12%!
2009! 19.98%! 32.64%! 25.13%! 22.78%! 20.43%! 14.39%! 22.56%!
2010! 4.13%! 1.02%! 9.08%! 4.96%! 0.84%! 2.47%! 3.75%!
2011! 4.00%! 6.53%! 7.55%! 4.42%! 1.30%! 2.76%! 4.43%!
2012! 10.83%! 11.45%! 15.76%! 10.22%! 4.68%! 12.04%! 10.83%!
!! !
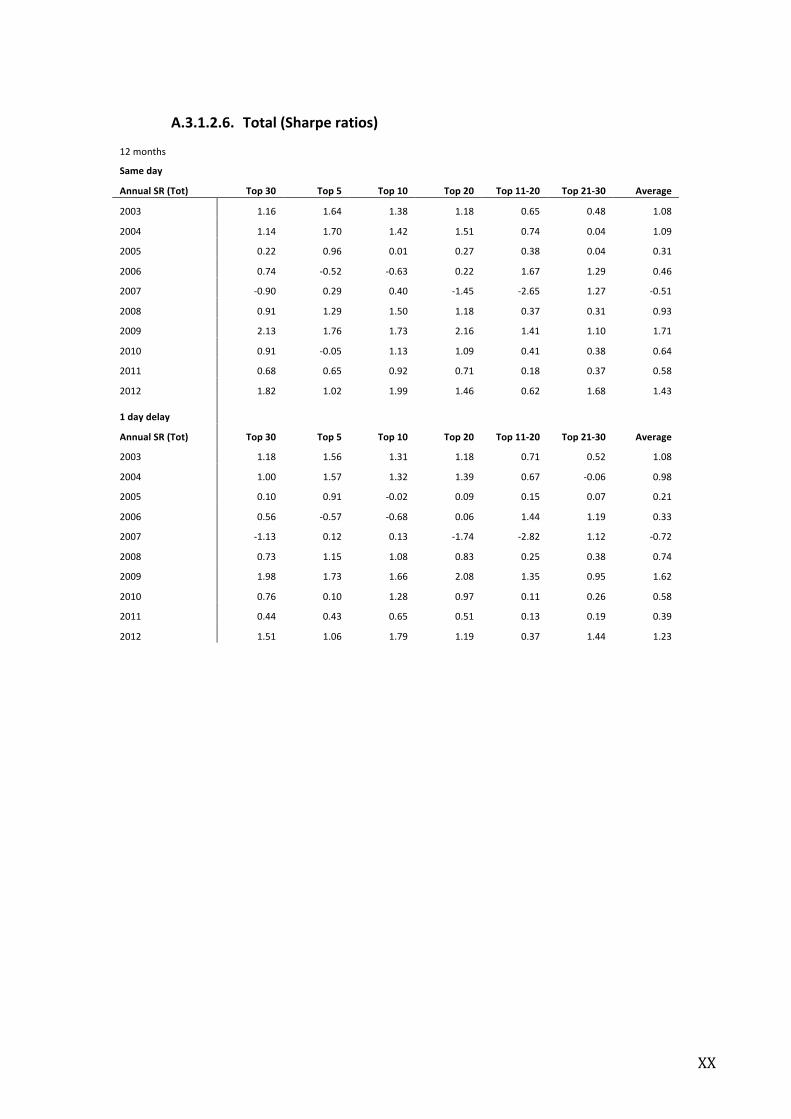
! XX!
A.3.1.2.6. Total!(Sharpe!ratios)!!12!months!
Same!day! !! !! !! !! !! !! !!
Annual!SR!(Tot)! Top!30! Top!5! Top!10! Top!20! Top!11F20! Top!21F30! Average!
2003! 1.16! 1.64! 1.38! 1.18! 0.65! 0.48! 1.08!
2004! 1.14! 1.70! 1.42! 1.51! 0.74! 0.04! 1.09!
2005! 0.22! 0.96! 0.01! 0.27! 0.38! 0.04! 0.31!
2006! 0.74! /0.52! /0.63! 0.22! 1.67! 1.29! 0.46!
2007! /0.90! 0.29! 0.40! /1.45! /2.65! 1.27! /0.51!
2008! 0.91! 1.29! 1.50! 1.18! 0.37! 0.31! 0.93!
2009! 2.13! 1.76! 1.73! 2.16! 1.41! 1.10! 1.71!
2010! 0.91! /0.05! 1.13! 1.09! 0.41! 0.38! 0.64!
2011! 0.68! 0.65! 0.92! 0.71! 0.18! 0.37! 0.58!
2012! 1.82! 1.02! 1.99! 1.46! 0.62! 1.68! 1.43!!1!day!delay! !! !! !! !! !! !! !!
Annual!SR!(Tot)! Top!30! Top!5! Top!10! Top!20! Top!11F20! Top!21F30! Average!
2003! 1.18! 1.56! 1.31! 1.18! 0.71! 0.52! 1.08!
2004! 1.00! 1.57! 1.32! 1.39! 0.67! /0.06! 0.98!
2005! 0.10! 0.91! /0.02! 0.09! 0.15! 0.07! 0.21!
2006! 0.56! /0.57! /0.68! 0.06! 1.44! 1.19! 0.33!
2007! /1.13! 0.12! 0.13! /1.74! /2.82! 1.12! /0.72!
2008! 0.73! 1.15! 1.08! 0.83! 0.25! 0.38! 0.74!
2009! 1.98! 1.73! 1.66! 2.08! 1.35! 0.95! 1.62!
2010! 0.76! 0.10! 1.28! 0.97! 0.11! 0.26! 0.58!
2011! 0.44! 0.43! 0.65! 0.51! 0.13! 0.19! 0.39!
2012! 1.51! 1.06! 1.79! 1.19! 0.37! 1.44! 1.23!
!! !
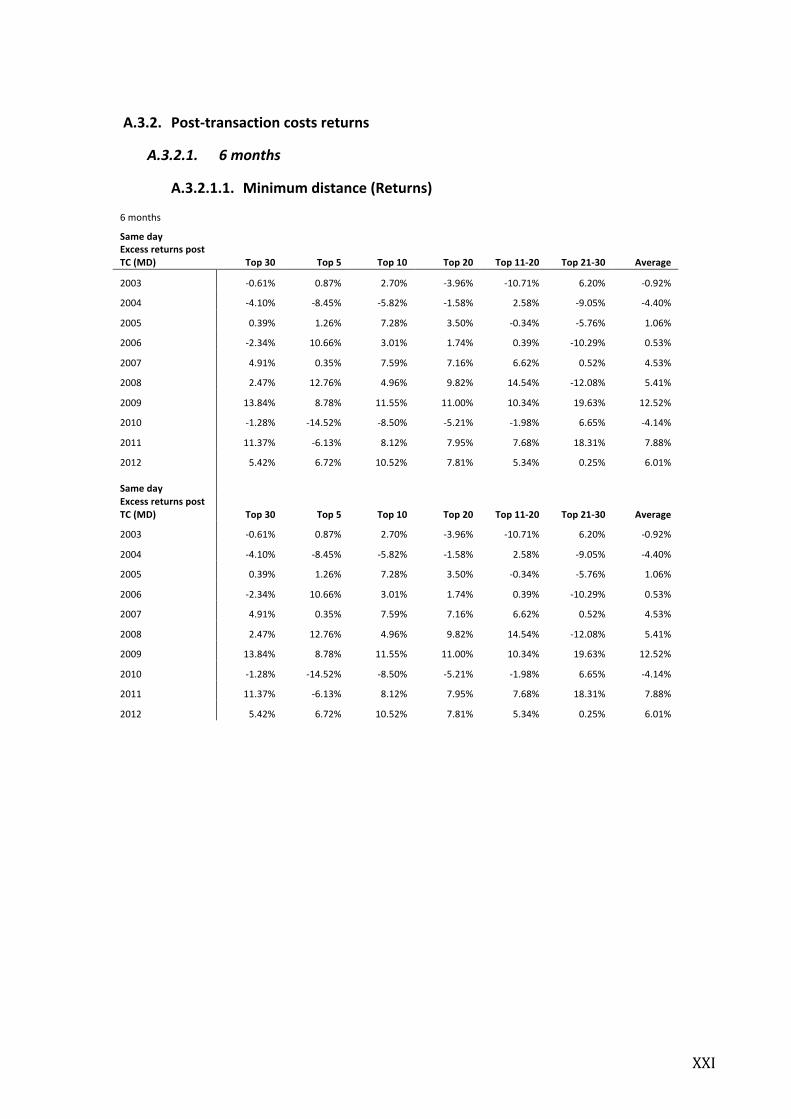
! XXI!
A.3.2. PostFtransaction!costs!returns!
A.3.2.1. 6&months&
A.3.2.1.1. Minimum!distance!(Returns)!!6!months!
Same!day! !! !! !! !! !! !! !!Excess!returns!post!TC!(MD)! Top!30! Top!5! Top!10! Top!20! Top!11F20! Top!21F30! Average!
2003! /0.61%! 0.87%! 2.70%! /3.96%! /10.71%! 6.20%! /0.92%!
2004! /4.10%! /8.45%! /5.82%! /1.58%! 2.58%! /9.05%! /4.40%!
2005! 0.39%! 1.26%! 7.28%! 3.50%! /0.34%! /5.76%! 1.06%!
2006! /2.34%! 10.66%! 3.01%! 1.74%! 0.39%! /10.29%! 0.53%!
2007! 4.91%! 0.35%! 7.59%! 7.16%! 6.62%! 0.52%! 4.53%!
2008! 2.47%! 12.76%! 4.96%! 9.82%! 14.54%! /12.08%! 5.41%!
2009! 13.84%! 8.78%! 11.55%! 11.00%! 10.34%! 19.63%! 12.52%!
2010! /1.28%! /14.52%! /8.50%! /5.21%! /1.98%! 6.65%! /4.14%!
2011! 11.37%! /6.13%! 8.12%! 7.95%! 7.68%! 18.31%! 7.88%!
2012! 5.42%! 6.72%! 10.52%! 7.81%! 5.34%! 0.25%! 6.01%!!Same!day! !! !! !! !! !! !! !!Excess!returns!post!TC!(MD)! Top!30! Top!5! Top!10! Top!20! Top!11F20! Top!21F30! Average!
2003! /0.61%! 0.87%! 2.70%! /3.96%! /10.71%! 6.20%! /0.92%!
2004! /4.10%! /8.45%! /5.82%! /1.58%! 2.58%! /9.05%! /4.40%!
2005! 0.39%! 1.26%! 7.28%! 3.50%! /0.34%! /5.76%! 1.06%!
2006! /2.34%! 10.66%! 3.01%! 1.74%! 0.39%! /10.29%! 0.53%!
2007! 4.91%! 0.35%! 7.59%! 7.16%! 6.62%! 0.52%! 4.53%!
2008! 2.47%! 12.76%! 4.96%! 9.82%! 14.54%! /12.08%! 5.41%!
2009! 13.84%! 8.78%! 11.55%! 11.00%! 10.34%! 19.63%! 12.52%!
2010! /1.28%! /14.52%! /8.50%! /5.21%! /1.98%! 6.65%! /4.14%!
2011! 11.37%! /6.13%! 8.12%! 7.95%! 7.68%! 18.31%! 7.88%!
2012! 5.42%! 6.72%! 10.52%! 7.81%! 5.34%! 0.25%! 6.01%!
!! !

! XXII!
A.3.2.1.2. Minimum!distance!6!months!trading!(Sharpe!ratio)!!6!months!
Same!day! !! !! !! !! !! !! !!Annual!SR!post!TC!(MD)! Top!30! Top!5! Top!10! Top!20! Top!11F20! Top!21F30! Average!
2003! /0.07! 0.07! 0.26! /0.41! /0.90! 0.63! /0.07!
2004! /0.88! /0.72! /0.87! /0.27! 0.38! /1.51! /0.65!
2005! 0.07! 0.16! 1.11! 0.57! /0.04! /0.71! 0.19!
2006! /0.47! 1.19! 0.32! 0.28! 0.04! /1.26! 0.02!
2007! 0.71! 0.03! 0.87! 1.01! 0.69! 0.05! 0.56!
2008! 0.23! 0.55! 0.32! 0.78! 1.02! /0.96! 0.33!
2009! 1.65! 0.51! 1.01! 1.10! 0.78! 1.74! 1.13!
2010! /0.27! /1.43! /1.16! /1.03! /0.34! 0.90! /0.56!
2011! 1.67! /0.59! 0.98! 1.15! 0.84! 1.62! 0.94!
2012! 0.92! 0.66! 1.58! 1.38! 0.61! 0.02! 0.86!!Same!day! !! !! !! !! !! !! !!Annual!SR!post!TC!(MD)! Top!30! Top!5! Top!10! Top!20! Top!11/20! Top!21/30! Average!
2003! /0.07! 0.07! 0.26! /0.41! /0.90! 0.63! /0.07!
2004! /0.88! /0.72! /0.87! /0.27! 0.38! /1.51! /0.65!
2005! 0.07! 0.16! 1.11! 0.57! /0.04! /0.71! 0.19!
2006! /0.47! 1.19! 0.32! 0.28! 0.04! /1.26! 0.02!
2007! 0.71! 0.03! 0.87! 1.01! 0.69! 0.05! 0.56!
2008! 0.23! 0.55! 0.32! 0.78! 1.02! /0.96! 0.33!
2009! 1.65! 0.51! 1.01! 1.10! 0.78! 1.74! 1.13!
2010! /0.27! /1.43! /1.16! /1.03! /0.34! 0.90! /0.56!
2011! 1.67! /0.59! 0.98! 1.15! 0.84! 1.62! 0.94!
2012! 0.92! 0.66! 1.58! 1.38! 0.61! 0.02! 0.86!
!! !

! XXIII!
A.3.2.1.3. Zero!crossing!(Returns)!!6!months!
Same!day! !! !! !! !! !! !! !!Excess!returns!post!TC!(ZC)! Top!30! Top!5! Top!10! Top!20! Top!11F20! Top!21F30! Average!
2003! 4.89%! /12.19%! 4.80%! 3.70%! 2.50%! 7.40%! 1.85%!
2004! 2.63%! 7.81%! 16.35%! 2.43%! /11.55%! 3.10%! 3.46%!
2005! /1.05%! 3.36%! 1.02%! /0.64%! /2.38%! /1.80%! /0.25%!
2006! 0.53%! /5.16%! /2.37%! /4.40%! /6.53%! 10.48%! /1.24%!
2007! /25.02%! /0.84%! /2.64%! /23.56%! /44.98%! /28.11%! /20.86%!
2008! 14.09%! 13.82%! 13.51%! 12.62%! 11.56%! 17.19%! 13.80%!
2009! 7.89%! 23.61%! 6.43%! 10.55%! 14.57%! 2.66%! 10.95%!
2010! 0.59%! /4.49%! /2.75%! 2.21%! 7.09%! /2.57%! 0.01%!
2011! 9.43%! 25.30%! 17.76%! 6.63%! /4.64%! 15.17%! 11.61%!
2012! 5.38%! /4.68%! 4.98%! 8.84%! 12.63%! /1.46%! 4.28%!!1!day!delay! !! !! !! !! !! !! !!Excess!returns!post!TC!(ZC)! Top!30! Top!5! Top!10! Top!20! Top!11F20! Top!21F30! Average!
2003! 5.20%! /11.98%! 5.38%! 4.20%! 2.91%! 7.38%! 2.18%!
2004! 2.83%! 6.59%! 15.42%! 2.36%! /10.77%! 3.85%! 3.38%!
2005! /1.56%! 3.12%! 0.33%! /1.54%! /3.49%! /1.53%! /0.78%!
2006! /0.66%! /5.31%! /4.08%! /5.51%! /7.03%! 9.14%! /2.24%!
2007! /26.80%! /0.25%! /3.28%! /27.14%! /51.30%! /26.23%! /22.50%!
2008! 12.75%! 11.95%! 11.25%! 10.61%! 9.80%! 17.21%! 12.26%!
2009! 6.43%! 20.68%! 4.42%! 8.88%! 13.24%! 1.63%! 9.21%!
2010! /0.65%! /4.30%! /3.84%! 1.27%! 6.28%! /4.38%! /0.94%!
2011! 4.89%! 21.10%! 13.39%! 2.56%! /8.41%! 9.68%! 7.20%!
2012! 4.24%! /6.91%! 4.42%! 8.57%! 12.65%! /4.35%! 3.10%!
!! !

! XXIV!
A.3.2.1.4. Zero!crossing!(Sharpe!ratio)!!6!months!
Same!day! !! !! !! !! !! !! !!Annual!SR!post!TC!(ZC)! Top!30! Top!5! Top!10! Top!20! Top!11F20! Top!21F30! Average!
2003! 0.52! /0.79! 0.43! 0.40! 0.22! 0.49! 0.21!
2004! 0.45! 0.63! 1.78! 0.37! /1.52! 0.39! 0.35!
2005! /0.19! 0.32! 0.12! /0.10! /0.29! /0.27! /0.07!
2006! 0.08! /0.43! /0.24! /0.53! /0.86! 1.33! /0.11!
2007! /2.66! /0.06! /0.25! /2.13! /2.64! /2.36! /1.68!
2008! 1.07! 0.52! 0.70! 0.84! 0.70! 1.05! 0.81!
2009! 0.78! 1.30! 0.52! 0.91! 1.01! 0.16! 0.78!
2010! 0.10! /0.42! /0.31! 0.34! 0.91! /0.30! 0.05!
2011! 1.11! 1.73! 1.44! 0.69! /0.37! 1.27! 0.98!
2012! 0.84! /0.38! 0.54! 1.24! 1.27! /0.16! 0.56!!Same!day! !! !! !! !! !! !! !!Annual!SR!post!TC!(ZC)! Top!30! Top!5! Top!10! Top!20! Top!11F20! Top!21F30! Average!
2003! 0.52! /0.79! 0.43! 0.40! 0.22! 0.49! 0.21!
2004! 0.45! 0.63! 1.78! 0.37! /1.52! 0.39! 0.35!
2005! /0.19! 0.32! 0.12! /0.10! /0.29! /0.27! /0.07!
2006! 0.08! /0.43! /0.24! /0.53! /0.86! 1.33! /0.11!
2007! /2.66! /0.06! /0.25! /2.13! /2.64! /2.36! /1.68!
2008! 1.07! 0.52! 0.70! 0.84! 0.70! 1.05! 0.81!
2009! 0.78! 1.30! 0.52! 0.91! 1.01! 0.16! 0.78!
2010! 0.10! /0.42! /0.31! 0.34! 0.91! /0.30! 0.05!
2011! 1.11! 1.73! 1.44! 0.69! /0.37! 1.27! 0.98!
2012! 0.84! /0.38! 0.54! 1.24! 1.27! /0.16! 0.56!
! !
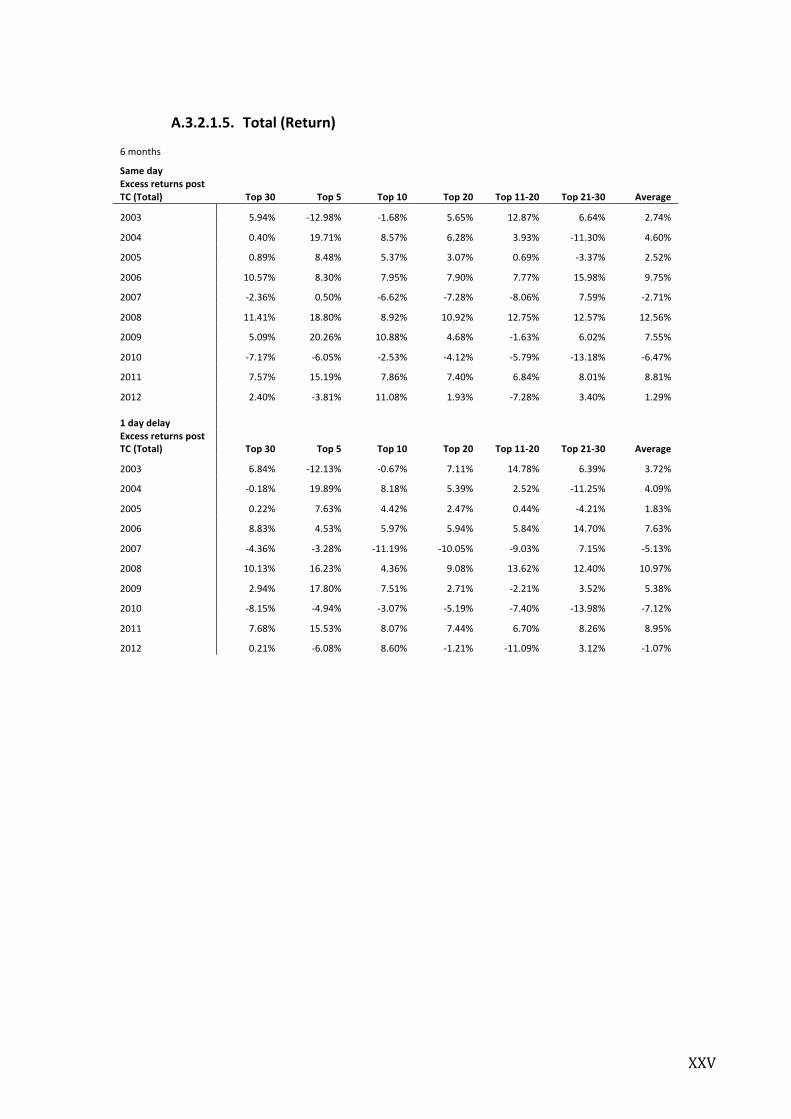
! XXV!
A.3.2.1.5. Total!(Return)!!6!months!
Same!day! !! !! !! !! !! !! !!Excess!returns!post!TC!(Total)! Top!30! Top!5! Top!10! Top!20! Top!11F20! Top!21F30! Average!
2003! 5.94%! /12.98%! /1.68%! 5.65%! 12.87%! 6.64%! 2.74%!
2004! 0.40%! 19.71%! 8.57%! 6.28%! 3.93%! /11.30%! 4.60%!
2005! 0.89%! 8.48%! 5.37%! 3.07%! 0.69%! /3.37%! 2.52%!
2006! 10.57%! 8.30%! 7.95%! 7.90%! 7.77%! 15.98%! 9.75%!
2007! /2.36%! 0.50%! /6.62%! /7.28%! /8.06%! 7.59%! /2.71%!
2008! 11.41%! 18.80%! 8.92%! 10.92%! 12.75%! 12.57%! 12.56%!
2009! 5.09%! 20.26%! 10.88%! 4.68%! /1.63%! 6.02%! 7.55%!
2010! /7.17%! /6.05%! /2.53%! /4.12%! /5.79%! /13.18%! /6.47%!
2011! 7.57%! 15.19%! 7.86%! 7.40%! 6.84%! 8.01%! 8.81%!
2012! 2.40%! /3.81%! 11.08%! 1.93%! /7.28%! 3.40%! 1.29%!!1!day!delay! !! !! !! !! !! !! !!Excess!returns!post!TC!(Total)! Top!30! Top!5! Top!10! Top!20! Top!11F20! Top!21F30! Average!
2003! 6.84%! /12.13%! /0.67%! 7.11%! 14.78%! 6.39%! 3.72%!
2004! /0.18%! 19.89%! 8.18%! 5.39%! 2.52%! /11.25%! 4.09%!
2005! 0.22%! 7.63%! 4.42%! 2.47%! 0.44%! /4.21%! 1.83%!
2006! 8.83%! 4.53%! 5.97%! 5.94%! 5.84%! 14.70%! 7.63%!
2007! /4.36%! /3.28%! /11.19%! /10.05%! /9.03%! 7.15%! /5.13%!
2008! 10.13%! 16.23%! 4.36%! 9.08%! 13.62%! 12.40%! 10.97%!
2009! 2.94%! 17.80%! 7.51%! 2.71%! /2.21%! 3.52%! 5.38%!
2010! /8.15%! /4.94%! /3.07%! /5.19%! /7.40%! /13.98%! /7.12%!
2011! 7.68%! 15.53%! 8.07%! 7.44%! 6.70%! 8.26%! 8.95%!
2012! 0.21%! /6.08%! 8.60%! /1.21%! /11.09%! 3.12%! /1.07%!
!! !
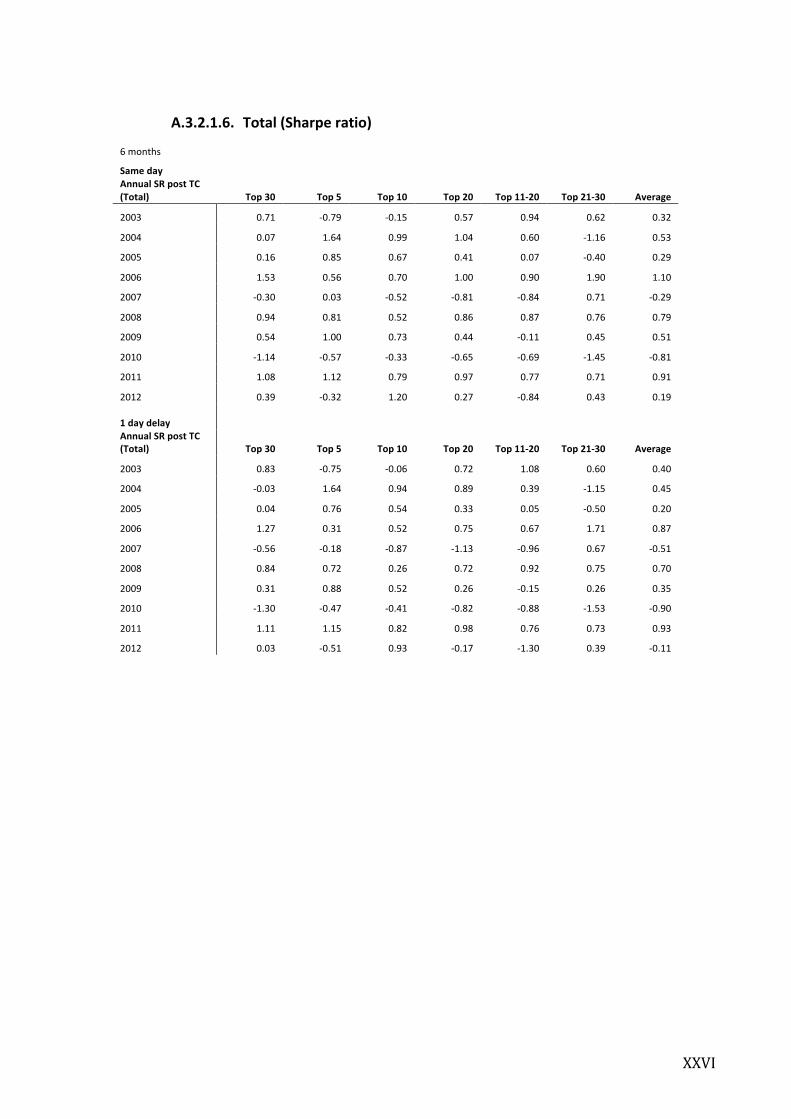
! XXVI!
A.3.2.1.6. Total!(Sharpe!ratio)!!6!months!
Same!day! !! !! !! !! !! !! !!Annual!SR!post!TC!(Total)! Top!30! Top!5! Top!10! Top!20! Top!11F20! Top!21F30! Average!
2003! 0.71! /0.79! /0.15! 0.57! 0.94! 0.62! 0.32!
2004! 0.07! 1.64! 0.99! 1.04! 0.60! /1.16! 0.53!
2005! 0.16! 0.85! 0.67! 0.41! 0.07! /0.40! 0.29!
2006! 1.53! 0.56! 0.70! 1.00! 0.90! 1.90! 1.10!
2007! /0.30! 0.03! /0.52! /0.81! /0.84! 0.71! /0.29!
2008! 0.94! 0.81! 0.52! 0.86! 0.87! 0.76! 0.79!
2009! 0.54! 1.00! 0.73! 0.44! /0.11! 0.45! 0.51!
2010! /1.14! /0.57! /0.33! /0.65! /0.69! /1.45! /0.81!
2011! 1.08! 1.12! 0.79! 0.97! 0.77! 0.71! 0.91!
2012! 0.39! /0.32! 1.20! 0.27! /0.84! 0.43! 0.19!!1!day!delay! !! !! !! !! !! !! !!Annual!SR!post!TC!(Total)! Top!30! Top!5! Top!10! Top!20! Top!11F20! Top!21F30! Average!
2003! 0.83! /0.75! /0.06! 0.72! 1.08! 0.60! 0.40!
2004! /0.03! 1.64! 0.94! 0.89! 0.39! /1.15! 0.45!
2005! 0.04! 0.76! 0.54! 0.33! 0.05! /0.50! 0.20!
2006! 1.27! 0.31! 0.52! 0.75! 0.67! 1.71! 0.87!
2007! /0.56! /0.18! /0.87! /1.13! /0.96! 0.67! /0.51!
2008! 0.84! 0.72! 0.26! 0.72! 0.92! 0.75! 0.70!
2009! 0.31! 0.88! 0.52! 0.26! /0.15! 0.26! 0.35!
2010! /1.30! /0.47! /0.41! /0.82! /0.88! /1.53! /0.90!
2011! 1.11! 1.15! 0.82! 0.98! 0.76! 0.73! 0.93!
2012! 0.03! /0.51! 0.93! /0.17! /1.30! 0.39! /0.11!
!! !

! XXVII!
A.3.2.2. 12&months&
A.3.2.2.1. Minimum!distance!(Returns)!!12!months!
Same!day! !! !! !! !! !! !! !!Excess!returns!post!TC!(MD)! Top!30! Top!5! Top!10! Top!20! Top!11F20! Top!21F30! Average!
2003! 10.81%! 19.27%! 11.54%! 10.20%! 8.73%! 12.15%! 12.11%!
2004! 1.18%! 1.57%! /0.52%! 0.23%! 0.90%! 3.16%! 1.09%!
2005! 0.88%! 1.78%! 0.69%! 3.77%! 6.78%! /4.85%! 1.51%!
2006! /3.13%! 4.42%! /2.40%! /2.38%! /2.45%! /4.54%! /1.75%!
2007! 1.57%! 15.09%! 11.80%! 1.88%! /8.16%! 1.06%! 3.88%!
2008! /0.20%! 19.68%! /3.71%! 1.94%! 7.43%! /4.31%! 3.47%!
2009! 18.19%! 15.09%! 17.77%! 20.20%! 22.51%! 14.29%! 18.01%!
2010! /2.24%! /3.53%! /5.96%! /4.17%! /2.47%! 1.70%! /2.78%!
2011! 8.66%! /8.82%! 3.91%! 5.89%! 7.75%! 14.40%! 5.30%!
2012! 4.48%! 20.71%! 15.45%! 9.56%! 3.59%! /0.66%! 8.85%!!1!day!delay! !! !! !! !! !! !! !!Excess!returns!post!TC!(MD)! Top!30! Top!5! Top!10! Top!20! Top!11F20! Top!21F30! Average!
2003! 10.60%! 20.36%! 12.61%! 9.71%! 6.69%! 12.49%! 12.08%!
2004! 0.94%! /0.36%! /1.53%! /0.54%! 0.39%! 3.95%! 0.47%!
2005! 0.05%! 0.86%! /0.32%! 1.77%! 3.78%! /3.32%! 0.47%!
2006! /3.90%! 6.62%! /1.49%! /2.60%! /3.79%! /6.43%! /1.93%!
2007! 0.80%! 15.05%! 12.38%! 1.97%! /8.54%! /1.44%! 3.37%!
2008! 0.07%! 25.79%! /0.11%! 2.35%! 4.63%! /4.31%! 4.74%!
2009! 16.43%! 12.01%! 14.81%! 17.38%! 19.82%! 14.65%! 15.85%!
2010! /2.62%! /5.00%! /6.23%! /3.87%! /1.57%! /0.06%! /3.22%!
2011! 6.56%! /10.37%! 0.21%! 3.77%! 7.22%! 12.25%! 3.27%!
2012! 3.66%! 19.32%! 13.11%! 8.81%! 4.44%! /2.34%! 7.83%!
!! !

! XXVIII!
A.3.2.2.2. Minimum!distance!(Sharpe!ratio)!!12!months!
Same!day! !! !! !! !! !! !! !!Annual!SR!post!TC!(MD)! Top!30! Top!5! Top!10! Top!20! Top!11F20! Top!21F30! Average!
2003! 1.26! 1.33! 1.05! 1.09! 0.71! 1.25! 1.12!
2004! 0.23! 0.16! /0.08! 0.04! 0.14! 0.46! 0.16!
2005! 0.14! 0.22! 0.09! 0.50! 0.71! /0.64! 0.17!
2006! /0.64! 0.51! /0.31! /0.40! /0.31! /0.55! /0.28!
2007! 0.22! 1.41! 1.64! 0.24! /0.68! 0.10! 0.49!
2008! /0.01! 0.69! /0.16! 0.10! 0.41! /0.30! 0.12!
2009! 1.96! 0.92! 1.69! 1.73! 1.29! 1.36! 1.49!
2010! /0.44! /0.32! /0.74! /0.72! /0.37! 0.25! /0.39!
2011! 1.08! /0.82! 0.47! 0.77! 0.74! 1.01! 0.54!
2012! 0.75! 2.03! 2.30! 1.59! 0.40! /0.06! 1.17!!1!day!delay! !! !! !! !! !! !! !!Annual!SR!post!TC!(MD)! Top!30! Top!5! Top!10! Top!20! Top!11F20! Top!21F30! Average!
2003! 1.25! 1.41! 1.16! 1.05! 0.54! 1.29! 1.12!
2004! 0.19! /0.04! /0.24! /0.11! 0.06! 0.57! 0.07!
2005! 0.01! 0.11! /0.04! 0.24! 0.40! /0.44! 0.04!
2006! /0.80! 0.76! /0.20! /0.44! /0.49! /0.78! /0.32!
2007! 0.11! 1.40! 1.71! 0.26! /0.72! /0.14! 0.43!
2008! 0.00! 0.92! 0.00! 0.13! 0.26! /0.30! 0.17!
2009! 1.76! 0.70! 1.38! 1.48! 1.14! 1.40! 1.31!
2010! /0.51! /0.46! /0.78! /0.66! /0.23! /0.01! /0.44!
2011! 0.84! /0.97! 0.02! 0.50! 0.70! 0.90! 0.33!
2012! 0.62! 1.89! 2.00! 1.48! 0.75! /0.22! 1.09!
!! !

! XXIX!
A.3.2.2.3. Zero!crossing!(Returns)!!12!months!
Same!day! !! !! !! !! !! !! !!Excess!returns!post!TC!(ZC)! Top!30! Top!5! Top!10! Top!20! Top!11F20! Top!21F30! Average!
2003! 5.92%! 18.56%! 12.61%! 9.60%! 6.47%! /1.32%! 8.64%!
2004! 6.74%! 24.57%! 21.68%! 10.46%! /0.84%! /0.63%! 10.33%!
2005! 0.40%! 2.00%! /1.23%! 1.29%! 3.75%! /1.30%! 0.82%!
2006! /1.80%! 0.78%! /2.51%! /5.96%! /9.51%! 6.61%! /2.06%!
2007! /11.75%! /20.79%! /9.10%! /2.81%! 3.38%! /29.51%! /11.76%!
2008! 16.45%! 16.64%! 24.44%! 19.77%! 14.95%! 9.97%! 17.04%!
2009! 9.75%! 26.30%! 10.61%! 10.83%! 10.94%! 7.71%! 12.69%!
2010! /3.66%! 4.15%! /5.88%! /1.32%! 3.15%! /8.25%! /1.97%!
2011! 8.29%! 2.12%! /0.09%! 5.91%! 11.79%! 12.10%! 6.69%!
2012! 6.02%! 8.47%! 10.67%! 8.96%! 7.17%! 0.22%! 6.92%!!1!day!delay! !! !! !! !! !! !! !!Excess!returns!post!TC!(ZC)! Top!30! Top!5! Top!10! Top!20! Top!11F20! Top!21F30! Average!
2003! 5.83%! 19.75%! 11.65%! 9.33%! 6.89%! /1.05%! 8.73%!
2004! 6.59%! 20.96%! 19.95%! 9.47%! /1.09%! 0.92%! 9.47%!
2005! /0.48%! 1.80%! /1.53%! /0.23%! 1.01%! /0.91%! /0.05%!
2006! /13.34%! /19.89%! /9.05%! /4.98%! /1.01%! /29.95%! /13.04%!
2007! /13.08%! /19.59%! /8.64%! /4.55%! /0.57%! /30.02%! /12.74%!
2008! 12.94%! 6.33%! 16.93%! 15.16%! 13.24%! 8.66%! 12.21%!
2009! 9.10%! 25.45%! 10.22%! 9.75%! 9.16%! 7.93%! 11.93%!
2010! /4.87%! 4.51%! /6.48%! /1.97%! 2.45%! /10.56%! /2.82%!
2011! 5.79%! /0.67%! /2.42%! 4.12%! 10.53%! 8.47%! 4.30%!
2012! 4.75%! 8.74%! 11.32%! 8.31%! 5.20%! /2.26%! 6.01%!
!! !
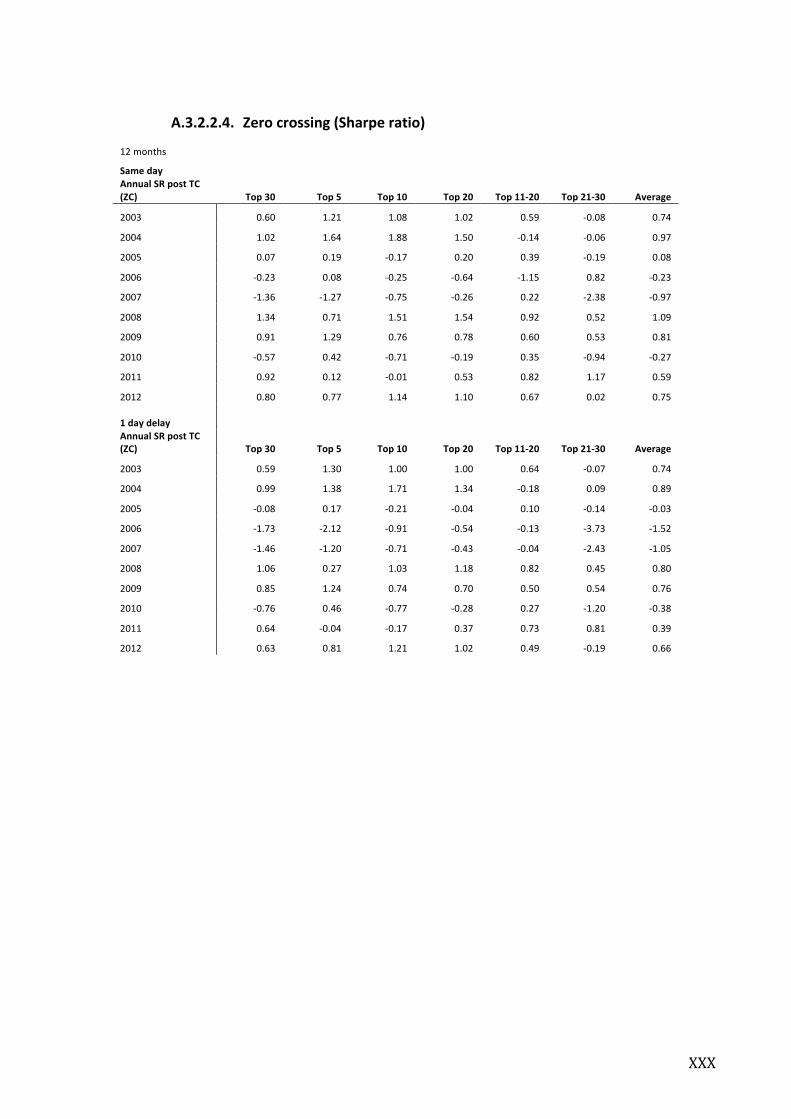
! XXX!
A.3.2.2.4. Zero!crossing!(Sharpe!ratio)!!12!months!
Same!day! !! !! !! !! !! !! !!Annual!SR!post!TC!(ZC)! Top!30! Top!5! Top!10! Top!20! Top!11F20! Top!21F30! Average!
2003! 0.60! 1.21! 1.08! 1.02! 0.59! /0.08! 0.74!
2004! 1.02! 1.64! 1.88! 1.50! /0.14! /0.06! 0.97!
2005! 0.07! 0.19! /0.17! 0.20! 0.39! /0.19! 0.08!
2006! /0.23! 0.08! /0.25! /0.64! /1.15! 0.82! /0.23!
2007! /1.36! /1.27! /0.75! /0.26! 0.22! /2.38! /0.97!
2008! 1.34! 0.71! 1.51! 1.54! 0.92! 0.52! 1.09!
2009! 0.91! 1.29! 0.76! 0.78! 0.60! 0.53! 0.81!
2010! /0.57! 0.42! /0.71! /0.19! 0.35! /0.94! /0.27!
2011! 0.92! 0.12! /0.01! 0.53! 0.82! 1.17! 0.59!
2012! 0.80! 0.77! 1.14! 1.10! 0.67! 0.02! 0.75!!1!day!delay! !! !! !! !! !! !! !!Annual!SR!post!TC!(ZC)! Top!30! Top!5! Top!10! Top!20! Top!11F20! Top!21F30! Average!
2003! 0.59! 1.30! 1.00! 1.00! 0.64! /0.07! 0.74!
2004! 0.99! 1.38! 1.71! 1.34! /0.18! 0.09! 0.89!
2005! /0.08! 0.17! /0.21! /0.04! 0.10! /0.14! /0.03!
2006! /1.73! /2.12! /0.91! /0.54! /0.13! /3.73! /1.52!
2007! /1.46! /1.20! /0.71! /0.43! /0.04! /2.43! /1.05!
2008! 1.06! 0.27! 1.03! 1.18! 0.82! 0.45! 0.80!
2009! 0.85! 1.24! 0.74! 0.70! 0.50! 0.54! 0.76!
2010! /0.76! 0.46! /0.77! /0.28! 0.27! /1.20! /0.38!
2011! 0.64! /0.04! /0.17! 0.37! 0.73! 0.81! 0.39!
2012! 0.63! 0.81! 1.21! 1.02! 0.49! /0.19! 0.66!
! !

! XXXI!
A.3.2.2.5. Total!(Returns)!!12!months!
Same!day! !! !! !! !! !! !! !!Excess!returns!post!TC!(Total)! Top!30! Top!5! Top!10! Top!20! Top!11F20! Top!21F30! Average!
2003! 7.55%! 25.57%! 12.28%! 9.80%! 7.19%! 3.19%! 10.93%!
2004! 3.30%! 18.16%! 9.02%! 6.00%! 2.92%! /2.03%! 6.23%!
2005! /1.07%! 6.88%! /2.11%! /0.50%! 1.05%! /2.15%! 0.35%!
2006! 1.72%! /11.23%! /11.04%! /1.01%! 8.94%! 7.26%! /0.89%!
2007! /10.69%! 3.01%! 3.14%! /18.68%! /40.61%! 9.47%! /9.06%!
2008! 9.25%! 31.61%! 22.08%! 12.30%! 2.35%! 3.31%! 13.48%!
2009! 18.42%! 30.08%! 23.61%! 21.01%! 18.29%! 13.36%! 20.79%!
2010! 2.17%! /3.38%! 5.20%! 2.92%! 0.55%! 0.76%! 1.37%!
2011! 3.11%! 6.64%! 7.34%! 3.23%! /0.98%! 2.44%! 3.63%!
2012! 10.26%! 8.47%! 14.57%! 9.85%! 5.03%! 11.19%! 9.90%!!1!day!delay! !! !! !! !! !! !! !!Excess!returns!post!TC!(Total)! Top!30! Top!5! Top!10! Top!20! Top!11F20! Top!21F30! Average!
2003! 7.70%! 23.90%! 11.39%! 9.75%! 7.98%! 3.72%! 10.74%!
2004! 2.67%! 16.87%! 8.28%! 5.41%! 2.47%! /2.76%! 5.49%!
2005! /1.81%! 6.50%! /2.40%! /1.74%! /1.15%! /1.88%! /0.41%!
2006! 0.67%! /12.00%! /11.86%! /2.22%! 7.33%! 6.55%! /1.92%!
2007! /12.66%! /0.27%! /1.02%! /21.93%! /42.95%! 7.98%! /11.81%!
2008! 6.76%! 28.01%! 14.87%! 7.74%! 0.44%! 4.97%! 10.47%!
2009! 17.04%! 29.71%! 22.26%! 19.91%! 17.45%! 11.41%! 19.63%!
2010! 1.38%! /1.90%! 6.14%! 2.26%! /1.72%! /0.28%! 0.98%!
2011! 0.81%! 3.24%! 4.19%! 1.33%! /1.64%! /0.41%! 1.25%!
2012! 7.96%! 8.74%! 12.72%! 7.34%! 1.88%! 9.29%! 7.99%!
! !

! XXXII!
A.3.2.2.6. Total!(Sharpe!ratio)!!12!months!
Same!day! !! !! !! !! !! !! !!Annual!SR!post!TC!(Total)! Top!30! Top!5! Top!10! Top!20! Top!11F20! Top!21F30! Average!
2003! 0.85! 1.47! 1.11! 0.92! 0.47! 0.27! 0.85!
2004! 0.67! 1.48! 1.11! 1.08! 0.42! /0.29! 0.75!
2005! /0.17! 0.72! /0.28! /0.07! 0.11! /0.25! 0.01!
2006! 0.28! /0.70! /0.84! /0.13! 1.28! 0.93! 0.14!
2007! /1.23! 0.15! 0.21! /1.71! /2.85! 0.97! /0.74!
2008! 0.66! 1.15! 1.27! 0.91! 0.15! 0.15! 0.72!
2009! 1.84! 1.60! 1.54! 1.90! 1.21! 0.90! 1.50!
2010! 0.40! /0.34! 0.72! 0.56! 0.07! 0.08! 0.25!
2011! 0.33! 0.43! 0.63! 0.36! /0.09! 0.16! 0.31!
2012! 1.42! 0.77! 1.65! 1.13! 0.40! 1.34! 1.12!!Same!day! !! !! !! !! !! !! !!Annual!SR!post!TC!(Total)! Top!30! Top!5! Top!10! Top!20! Top!11F20! Top!21F30! Average!
2003! 0.85! 1.47! 1.11! 0.92! 0.47! 0.27! 0.85!
2004! 0.67! 1.48! 1.11! 1.08! 0.42! /0.29! 0.75!
2005! /0.17! 0.72! /0.28! /0.07! 0.11! /0.25! 0.01!
2006! 0.28! /0.70! /0.84! /0.13! 1.28! 0.93! 0.14!
2007! /1.23! 0.15! 0.21! /1.71! /2.85! 0.97! /0.74!
2008! 0.66! 1.15! 1.27! 0.91! 0.15! 0.15! 0.72!
2009! 1.84! 1.60! 1.54! 1.90! 1.21! 0.90! 1.50!
2010! 0.40! /0.34! 0.72! 0.56! 0.07! 0.08! 0.25!
2011! 0.33! 0.43! 0.63! 0.36! /0.09! 0.16! 0.31!
2012! 1.42! 0.77! 1.65! 1.13! 0.40! 1.34! 1.12!
!! !

! XXXIII!
A.4. Additional!trading!results!oneFday!delay!!
A.4.1. Pairs!ranked!81F100!
A.4.1.1. 12&months&!
12!months!!
post/transaction!costs!
1!day!delay!
Pairs!ranked!81F100! Top!81F100! Top!96F100! Top!91F100! Top!81F90! Average!
Excess!return! /2.58%! /5.08%! /7.55%! 2.39%! /3.21%!
SR! /0.29! /0.35! /0.64! 0.23! /0.26!
Skewness! /0.17! 0.07! 0.04! /0.07! /0.03!
Kurtosis! 6.70! 8.86! 7.00! 9.20! 7.94!
T!value!(NW)! /0.87! /1.16! /2.04! 0.70! /0.84!
Beta! 0.10! 0.12! 0.11! 0.07! 0.10!
!! !! !! !! !!!
Total! Top!20! Top!5! Top!10! Top!11F20! Average!
Excess!return! 2.76%! 10.23%! 6.42%! /1.00%! 4.61%!
SR! 0.30! 0.61! 0.54! /0.08! 0.34!
Skewness! 0.31! 0.63! 0.38! /0.05! 0.32!
Kurtosis! 5.50! 9.13! 5.67! 5.48! 6.44!
T!value!(NW)! 1.05! 2.14! 1.98! /0.29! 1.22!
Beta! 0.06! 0.01! 0.03! 0.08! 0.05!
!Excess!returns!are!calculated!by!taking!the!daily!average!return!over!the!sample!period!and!multiplying!by!260!trading!days.!The!standard!deviations!used!to!compute!the!Sharpe!Ratios!(SR)!are!the!average!daily!standard!deviations!over!the!period!multiplied!by!the!square!root!of!260!trading!days.!Since!we!are!equally!long!and!short,!our!excess!returns!are!equal!to!our!nominal!returns!without!deducting!the!risk!free!rate.!The!T!value!is!calculated!by!using!the!Newey!West!(NW)!standard!errors!where!we!use!30!lags!to!control!for!serial!correlation!in!the!
residuals.!The!beta!value!is!the!market!exposure!calculated!by!using!daily!observations.!! !

! XXXIV!
A.4.1.2. Individual&years&performance&!
12!months!!
post/transaction!costs!
1!day!delay!
Return!Top!!
81F100!Top!!
96F100!Top!!
91F100!Top!!
81F90! Average! Top!20! Top!5! Top!10!Top!!
11F20! Average!
2003! 13.59%! /1.95%! /4.90%! 32.08%! 9.71%! 9.75%! 23.90%! 11.39%! 7.98%! 13.25%!
2004! /1.87%! 3.86%! 4.67%! /8.41%! /0.44%! 5.41%! 16.87%! 8.28%! 2.47%! 8.26%!
2005! /9.48%! /15.63%! /9.77%! /9.20%! /11.02%! /1.74%! 6.50%! /2.40%! /1.15%! 0.31%!
2006! 0.81%! /7.40%! /4.99%! 6.61%! /1.24%! /2.22%! /12.00%! /11.86%! 7.33%! /4.69%!
2007! /5.70%! 10.44%! /12.98%! 1.58%! /1.67%! /21.93%! /0.27%! /1.02%! /42.95%! /16.54%!
2008! /11.97%! /9.23%! /14.36%! /9.57%! /11.28%! 7.74%! 28.01%! 14.87%! 0.44%! 12.77%!
2009! 4.21%! 1.00%! /0.68%! 9.10%! 3.41%! 19.91%! 29.71%! 22.26%! 17.45%! 22.33%!
2010! /1.92%! 1.53%! /1.48%! /2.35%! /1.06%! 2.26%! /1.90%! 6.14%! /1.72%! 1.19%!
2011! /5.50%! /15.49%! /21.96%! 10.96%! /8.00%! 1.33%! 3.24%! 4.19%! /1.64%! 1.78%!
2012! /5.87%! /16.72%! /4.81%! /6.94%! /8.59%! 7.34%! 8.74%! 12.72%! 1.88%! 7.67%!
SR!Top!!
81F100!Top!!
96F100!Top!!
91F100!Top!!
81F90! Average! Top!20! Top!5! Top!10!Top!!
11F20! Average!
2003! 1.90! 0.03! /0.20! 3.39! 1.28! 0.92! 1.38! 1.04! 0.53! 0.97!
2004! 0.03! 0.90! 1.15! /0.82! 0.31! 0.97! 1.36! 1.02! 0.35! 0.92!
2005! /1.47! /1.40! /1.08! /1.26! /1.30! /0.25! 0.68! /0.32! /0.12! 0.00!
2006! 0.67! /0.47! /0.37! 1.24! 0.27! /0.28! /0.74! /0.90! 1.05! /0.22!
2007! /0.32! 1.07! /0.94! 0.42! 0.06! /2.00! /0.01! /0.07! /3.02! /1.27!
2008! /0.53! /0.22! /0.50! /0.34! /0.40! 0.56! 1.01! 0.85! 0.03! 0.61!
2009! 0.58! 0.22! 0.15! 0.94! 0.47! 1.81! 1.58! 1.47! 1.15! 1.50!
2010! 0.07! 0.39! 0.11! 0.00! 0.14! 0.44! /0.19! 0.86! /0.23! 0.22!
2011! /0.33! /0.98! /1.66! 1.38! /0.40! 0.15! 0.21! 0.36! /0.16! 0.14!
2012! /0.51! /1.67! /0.32! /0.52! /0.75! 0.85! 0.81! 1.44! 0.15! 0.81!
!Excess!returns!are!the!sum!of!all!daily!returns!for!the!whole!year!and!the!standard!deviations!used!to!compute!the!Sharpe!Ratios!(SR)!are!the!
daily!standard!deviations!over!the!particular!year!multiplied!by!the!square!root!of!260!trading!days.!
!! !

! XXXV!
A.4.2. IntraFIndustry!Pairs!
A.4.2.1. 12&months&!
12!months!!
post/transaction!costs!
1!day!delay!
IntraFIndustry!pairs! Top!10! Top!5!
Excess!return! 0.54%! 3.82%!
SR! 0.05! 0.27!
Skewness! 0.63! 0.06!
Kurtosis! 13.76! 6.68!
T!value!(NW)! 0.19! 0.94!
Beta! 0.12! 0.09!
!! !! !!
Same!Industry!pairs! Top!10! Top!5!
Excess!return! 6.42%! 10.23%!
SR! 0.54! 0.61!
Skewness! 0.38! 0.63!
Kurtosis! 5.67! 9.13!
T!value!(NW)! 1.98! 2.14!
Beta! 0.03! 0.01!
!Excess!returns!are!calculated!by!taking!the!daily!average!return!over!the!sample!period!and!multiplying!by!260!trading!days.!The!standard!deviations!used!to!compute!the!Sharpe!Ratios!(SR)!are!the!average!daily!standard!deviations!over!the!period!multiplied!by!the!square!root!of!260!trading!days.!Since!we!are!equally!long!and!short,!our!excess!returns!are!equal!to!our!nominal!returns!without!deducting!the!risk!free!rate.!The!T!value!is!calculated!by!using!the!Newey!West!(NW)!standard!errors!where!we!use!30!lags!to!control!for!serial!correlation!in!the!
residuals.!The!beta!value!is!the!market!exposure!calculated!by!using!daily!observations.!! !

! XXXVI!
A.4.2.2. Individual&years&performance&!
12!months!!
post/transaction!costs!
1!day!delay!
IntraFIndustry!Pairs! !! !! NonFrestricted!pairs! !! !!Excess!return! Top!5! Top!10! Average!
Excess!return! Top!5! Top!10! Average!
2003! 11.32%! 12.54%! 11.93%! 2003! 23.90%! 11.39%! 17.64%!
2004! 8.03%! 19.05%! 13.54%! 2004! 16.87%! 8.28%! 12.58%!
2005! /1.20%! 2.65%! 0.72%! 2005! 6.50%! /2.40%! 2.05%!
2006! 1.23%! 3.81%! 2.52%! 2006! /12.00%! /11.86%! /11.93%!
2007! 9.89%! 0.80%! 5.35%! 2007! /0.27%! /1.02%! /0.65%!
2008! /2.45%! 6.09%! 1.82%! 2008! 28.01%! 14.87%! 21.44%!
2009! 6.35%! 17.50%! 11.92%! 2009! 29.71%! 22.26%! 25.98%!
2010! /10.16%! /9.09%! /9.63%! 2010! /1.90%! 6.14%! 2.12%!
2011! /19.56%! /15.56%! /17.56%! 2011! 3.24%! 4.19%! 3.72%!
2012! 1.93%! 0.34%! 1.13%! 2012! 8.74%! 12.72%! 10.73%!
SR! Top!5! Top!10! Average! SR! Top!5! Top!10! Average!
2003! 1.16! 0.89! 1.02! 2003! 1.56! 1.31! 1.43!
2004! 1.13! 1.66! 1.40! 2004! 1.57! 1.32! 1.45!
2005! /0.19! 0.23! 0.02! 2005! 0.91! /0.02! 0.44!
2006! 0.22! 0.31! 0.27! 2006! /0.57! /0.68! /0.62!
2007! 1.10! 0.10! 0.60! 2007! 0.12! 0.13! 0.12!
2008! /0.11! 0.25! 0.07! 2008! 1.15! 1.08! 1.12!
2009! 0.59! 1.18! 0.88! 2009! 1.73! 1.66! 1.70!
2010! /1.03! /0.66! /0.85! 2010! 0.10! 1.28! 0.69!
2011! /1.82! /1.11! /1.47! 2011! 0.43! 0.65! 0.54!
2012! 0.23! 0.03! 0.13! 2012! 1.06! 1.79! 1.42!
!Excess!returns!are!the!sum!of!all!daily!returns!for!the!whole!year!and!the!standard!deviations!used!to!compute!the!Sharpe!Ratios!(SR)!are!the!
daily!standard!deviations!over!the!particular!year!multiplied!by!the!square!root!of!260!trading!days.!!! !

! XXXVII!
A.4.3. Crises!versus!nonFcrises!!
12!months!!
post/transaction!costs!
1!day!delay!
Crises! OS!30!! OS!5!! OS!10!! OS!20!! OS!11F20!! OS!21F30!! Average!
Excess!Returns! 3.69%! 15.55%! 9.48%! 4.50%! /0.61%! 2.26%! 5.81%!
Sharpe!ratio! 0.31! 0.70! 0.64! 0.39! /0.05! 0.12! !0.35!!
Skewness! 0.79! 0.90! 0.74! 0.40! 0.05! 0.48! !0.56!!
Kurtosis! 9.58! 10.92! 8.75! 8.37! 3.32! 3.30! !7.37!!
T!value!(NW)! 0.60! 1.27! 1.22! 0.70! /0.08! 0.24! !0.66!!
Beta! 0.08! 0.02! 0.05! 0.06! 0.08! 0.10! !0.06!!
VaR!5%! /1.03%! /1.86%! /1.24%! /1.02%! /1.27%! /1.73%! /1.36%!
VaR!5%!yrl! /16.63%! /29.97%! /20.04%! /16.46%! /20.42%! /27.85%! /21.89%!
VaR!1%! /1.70%! /3.54%! /2.04%! /1.85%! /2.21%! /2.59%! /2.32%!
Var!1%!yrl! /27.35%! /57.05%! /32.92%! /29.87%! /35.61%! /41.82%! /37.44%!
!! !! !! !! !! !! !! !!
NonFcrises! OS!30!! OS!5!! OS!10!! OS!20!! OS!11F20!! OS!21F30!! Average!
Excess!return! 2.78%! 11.29%! 5.92%! 2.38%! /1.26%! 3.67%! 4.13%!
Sharpe!ratio! 0.32! 0.65! 0.48! 0.25! /0.10! 0.30! !0.32!!
Skewness! 0.60! 0.66! 0.41! 0.34! /0.08! 0.50! !0.41!!
Kurtosis! 10.81! 9.29! 6.02! 6.19! 6.14! 7.03! !7.58!!
T!value!(NW)! 1.01! 2.00! 1.55! 0.76! /0.31! 0.99! !1.00!!
Beta! 0.02! /0.03! /0.02! 0.03! 0.07! 0.00! !0.01!!
VaR!5%! /0.78%! /1.63%! /1.19%! /0.86%! /1.16%! /1.08%! /1.12%!
VaR!5%!yrl! /12.60%! /26.33%! /19.17%! /13.88%! /18.71%! /17.39%! /18.01%!
VaR!1%! /1.19%! /2.58%! /1.89%! /1.59%! /2.11%! /2.01%! /1.90%!
Var!1%!yrl! /19.14%! /41.64%! /30.54%! /25.65%! /34.00%! /32.45%! /30.57%!
!Excess!returns!are!calculated!by!taking!the!daily!average!return!over!the!sample!period!and!multiplying!by!260!trading!days.!The!standard!deviations!used!to!compute!the!Sharpe!Ratios!(SR)!are!the!average!daily!standard!deviations!over!the!period!multiplied!by!the!square!root!of!260!trading!days.!Since!we!are!equally!long!and!short,!our!excess!returns!are!equal!to!our!nominal!returns!without!deducting!the!risk!free!rate.!The!T!value!is!calculated!by!using!the!Newey!West!(NW)!standard!errors!where!we!use!30!lags!to!control!for!serial!correlation!in!the!residuals.!The!beta!value!is!the!market!exposure!calculated!by!using!daily!observations.!The!Value!at!Risk!(VaR)!is!calculated!by!using!the!historical!approach!and!takes!the!bottom!5%!and!1%!daily!return!over!the!sample!period!to!calculate!the!daily!VaR.!To!achieve!the!yearly!
VaR!(yrl)!we!multiply!with!the!square!root!of!260!trading!days.!! !

! XXXVIII!
A.4.4. Stop!loss!trading!results!!12!months!!
post/transaction!costs!
1!day!delay!
Stop!loss!Total! OS!30!! OS!5!! OS!10!! OS!20!! OS!11F20!! OS!21F30!! Average!
Excess!return! 3.50%! 9.75%! 6.04%! 3.48%! 0.80%! 3.66%! 4.54%!
Sharpe!ratio! 0.42! 0.58! 0.50! 0.38! 0.07! 0.30! !0.37!!
Skewness! 0.58! 0.62! 0.38! 0.36! 0.15! 0.48! !0.43!!
Kurtosis! 9.43! 8.69! 5.65! 5.61! 4.47! 6.12! !6.66!!
T!value!(NW)! 1.49! 2.03! 1.89! 1.35! 0.26! 1.11! !1.36!!
Beta! 0.06! 0.02! 0.04! 0.06! 0.08! 0.06! !0.05!!
VaR!5%! /0.77%! /1.58%! /1.15%! /0.86%! /1.11%! /1.11%! /1.10%!
VaR!5%!yrl! /12.37%! /25.52%! /18.57%! /13.87%! /17.83%! /17.89%! /17.68%!
VaR!1%! /1.19%! /2.57%! /1.82%! /1.44%! /2.00%! /1.95%! /1.83%!
Var!1%!yrl! /19.14%! /41.37%! /29.28%! /23.29%! /32.23%! /31.47%! /29.46%!
!! !! !! !! !! !! !! !!
Total! OS!30!! OS!5!! OS!10!! OS!20!! OS!11F20!! OS!21F30!! Average!
Excess!return! 3.09%! 10.23%! 6.42%! 2.76%! /1.00%! 3.84%! 4.22%!
Sharpe!ratio! 0.36! 0.61! 0.54! 0.30! /0.08! 0.31! !0.34!!
Skewness! 0.56! 0.63! 0.38! 0.31! /0.05! 0.48! !0.38!!
Kurtosis! 9.18! 9.13! 5.67! 5.50! 5.48! 6.11! !6.84!!
T!value!(NW)! 1.31! 2.14! 1.98! 1.05! /0.29! 1.17! !1.23!!
Beta! 0.06! 0.01! 0.03! 0.06! 0.08! 0.06! !0.05!!
VaR!5%! /0.78%! /1.57%! /1.15%! /0.86%! /1.15%! /1.11%! /1.10%!
VaR!5%!yrl! /12.52%! /25.28%! /18.61%! /13.87%! /18.58%! /17.89%! /17.79%!
VaR!1%! /1.21%! /2.57%! /1.83%! /1.51%! /2.08%! /1.95%! /1.86%!
Var!1%!yrl! /19.47%! /41.37%! /29.45%! /24.28%! /33.56%! /31.47%! /29.93%!
!Excess!returns!are!calculated!by!taking!the!daily!average!return!over!the!sample!period!and!multiplying!by!260!trading!days.!The!standard!deviations!used!to!compute!the!Sharpe!Ratios!(SR)!are!the!average!daily!standard!deviations!over!the!period!multiplied!by!the!square!root!of!260!trading!days.!Since!we!are!equally!long!and!short,!our!excess!returns!are!equal!to!our!nominal!returns!without!deducting!the!risk!free!rate.!The!T!value!is!calculated!by!using!the!Newey!West!(NW)!standard!errors!where!we!use!30!lags!to!control!for!serial!correlation!in!the!residuals.!The!beta!value!is!the!market!exposure!calculated!by!using!daily!observations.!The!Value!at!Risk!(VaR)!is!calculated!by!using!the!historical!approach!and!takes!the!bottom!5%!and!1%!daily!return!over!the!sample!period!to!calculate!the!daily!VaR.!To!achieve!the!yearly!
VaR!(yrl)!we!multiply!with!the!square!root!of!260!trading!days.!! !

! XXXIX!
A.4.5. Drawdown!control!!
12!months!trading!period!!
post/transaction!costs!
1!day!delay!
Total!Drawdown! OS!30!! OS!5!! OS!10!! OS!20!! OS!11F20!! OS!21F30!! Average!
Excess!return! 2.67%! 9.82%! 6.36%! 2.61%! /0.75%! 3.50%! 4.03%!
Sharpe!ratio! 0.33! 0.61! 0.54! 0.30! /0.07! 0.29! !0.33!!
Skewness! 0.62! 0.72! 0.40! 0.39! 0.13! 0.49! !0.46!!
Kurtosis! 10.88! 10.78! 6.21! 7.19! 5.03! 6.11! !7.70!!
T!value!(NW)! 1.16! 2.15! 2.02! 1.08! /0.24! 1.07! !1.21!!
Beta! 0.06! 0.01! 0.03! 0.05! 0.08! 0.06! !0.05!!
VaR!5%! /0.73%! /1.44%! /1.12%! /0.82%! /1.08%! /1.11%! /1.05%!
VaR!5%!yrl! /11.82%! /23.30%! /18.01%! /13.25%! /17.45%! /17.90%! /16.96%!
VaR!1%! /1.18%! /2.39%! /1.80%! /1.31%! /1.94%! /1.94%! /1.76%!
Var!1%!yrl! /19.02%! /38.56%! /29.06%! /21.06%! /31.31%! /31.29%! /28.38%!
!! !! !! !! !! !! !! !!
Total! OS!30!! OS!5!! OS!10!! OS!20!! OS!11F20!! OS!21F30!! Average!
Excess!return! 2.78%! 11.29%! 5.92%! 2.38%! /1.26%! 3.67%! 4.13%!
Sharpe!ratio! 0.32! 0.65! 0.48! 0.25! /0.10! 0.30! !0.32!!
Skewness! 0.60! 0.66! 0.41! 0.34! /0.08! 0.50! !0.41!!
Kurtosis! 10.81! 9.29! 6.02! 6.19! 6.14! 7.03! !7.58!!
T!value!(NW)! 1.31! 2.14! 1.98! 1.05! /0.29! 1.17! !1.23!!
Beta! 0.02! /0.03! /0.02! 0.03! 0.07! 0.00! !0.01!!
VaR!5%! /0.78%! /1.63%! /1.19%! /0.86%! /1.16%! /1.08%! /1.12%!
VaR!5%!yrl! /12.60%! /26.33%! /19.17%! /13.88%! /18.71%! /17.39%! /18.01%!
VaR!1%! /1.19%! /2.58%! /1.89%! /1.59%! /2.11%! /2.01%! /1.90%!
Var!1%!yrl! /19.14%! /41.64%! /30.54%! /25.65%! /34.00%! /32.45%! /30.57%!
!Excess!returns!are!calculated!by!taking!the!daily!average!return!over!the!sample!period!and!multiplying!by!260!trading!days.!The!standard!deviations!used!to!compute!the!Sharpe!Ratios!(SR)!are!the!average!daily!standard!deviations!over!the!period!multiplied!by!the!square!root!of!260!trading!days.!Since!we!are!equally!long!and!short,!our!excess!returns!are!equal!to!our!nominal!returns!without!deducting!the!risk!free!rate.!The!T!value!is!calculated!by!using!the!Newey!West!(NW)!standard!errors!where!we!use!30!lags!to!control!for!serial!correlation!in!the!residuals.!The!beta!value!is!the!market!exposure!calculated!by!using!daily!observations.!The!Value!at!Risk!(VaR)!is!calculated!by!using!the!historical!approach!and!takes!the!bottom!5%!and!1%!daily!return!over!the!sample!period!to!calculate!the!daily!VaR.!To!achieve!the!yearly!
VaR!(yrl)!we!multiply!with!the!square!root!of!260!trading!days.!! !

! XL!
A.5. Regression!results!
All0our0regressions,0also0the0ones0included0in0the0paper,0are0reported0below,0to0make0the0list0complete.0The0numbers0in0parentheses0are0the0standard0deviation0of0the0coefficients0while0the0p(values0are0reported0below0the0coefficients.0The0significance0level0is0not0indicated0by0stars0(*),0but0by0the0level0of0the0p(values.0
A.5.1. DAX!results!!
A.5.1.1. CAPM&CAPM! Top!30! Top!5! Top!10! Top!20!
DAX/rf! 0.1210! (0.0578)! 0.0300! (0.0905)! 0.0741! (0.0577)! 0.1457! (0.0617)!
!! 0.0383! !! 0.7413! !! 0.2015! !! 0.0198! !!
Alpha! 0.0056! (0.0019)! 0.0119! (0.0043)! 0.0091! (0.0030)! 0.0053! (0.0024)!
!! 0.0041! !! 0.0064! !! 0.0027! !! 0.0260! !!
R2! 0.0918! !! 0.0013! !! 0.0176! !! 0.1053! !!
!!
A.5.1.2. FamaBFrench&Factors&!
F&F! Top!30! Top!5! Top!10! Top!20!
DAX/rf! 0.0874! (0.0649)! 0.0401! (0.0906)! 0.0583! (0.0683)! 0.1256! (0.0732)!
!! 0.1807! !! 0.6588! !! 0.3953! !! 0.0888! !!
SMB! /0.0153! (0.0903)! /0.1276! (0.2264)! /0.0438! (0.1418)! 0.0064! (0.1127)!
!! 0.8659! !! 0.5740! !! 0.7578! !! 0.9547! !!
HML! 0.1906! (0.1532)! /0.0968! (0.2819)! 0.0784! (0.2142)! 0.1144! (0.1505)!
!! 0.2159! !! 0.7320! !! 0.7150! !! 0.4486! !!
Intercept! 0.0055! (0.0019)! 0.0122! (0.0044)! 0.0092! (0.0030)! 0.0053! (0.0024)!
!! 0.0051! !! 0.0061! !! 0.0030! !! 0.0273! !!
R2! 0.1137! !! 0.0051! !! 0.0201! !! 0.1115! !!
!!! &

! XLI!
A.5.1.3. FamaBFrench&Factors&+&Momentum&!
F&F!+!Mom! Top!30! Top!5! Top!10! Top!20!
DAX/rf! 0.0357! (0.0477)! /0.0094! (0.0996)! 0.0192! (0.0648)! 0.0767! (0.0553)!
!! 0.4558! !! 0.9250! !! 0.7673! !! 0.1678! !!
SMB! /0.0508! (0.1024)! /0.1616! (0.2327)! /0.0706! (0.1440)! /0.0400! (0.1178)!
!! 0.6211! !! 0.4887! !! 0.6245! !! 0.7350! !!
HML! 0.0249! (0.1363)! /0.2555! (0.2837)! /0.0469! (0.2054)! /0.0424! (0.1420)!
!! 0.8556! !! 0.3697! !! 0.8199! !! 0.7661! !!
WML! /0.2473! (0.0497)! /0.2369! (0.0973)! /0.1869! (0.0661)! /0.2339! (0.0604)!
!! 0.0000! !! 0.0165! !! 0.0055! !! 0.0002! !!
Intercept! 0.0076! (0.0017)! 0.0141! (0.0046)! 0.0107! (0.0031)! 0.0072! (0.0022)!
!! 0.0000! !! 0.0026! !! 0.0007! !! 0.0014! !!
R2! 0.2661! !! 0.0366! !! 0.0646! !! 0.2193! !!
!!
A.5.1.4. Volatility&!
A.5.1.4.1. Linear!!
Volatility! Top!30! Top!5! Top!10! Top!20!
DAX/rf! 0.1457! (0.0588)! 0.0853! (0.0760)! 0.1005! (0.0567)! 0.1721! (0.0629)!
!! 0.0147! !! 0.2644! !! 0.0792! !! 0.0072! !!
DAXvol30! 0.0004! (0.0002)! 0.0009! (0.0004)! 0.0004! (0.0002)! 0.0004! (0.0002)!
!! 0.0649! !! 0.0269! !! 0.0584! !! 0.0486! !!
Intercept! /0.0030! (0.0048)! /0.0074! (0.0094)! /0.0001! (0.0058)! /0.0039! (0.0053)!
!! 0.5312! !! 0.4287! !! 0.9846! !! 0.4633! !!
R2! 0.1256! !! 0.0396! !! 0.0375! !! 0.1359! !!
!!
A.5.1.4.2. Quadratic!!
Volatility!squared! Top!30! Top!5! Top!10! Top!20!
DAX/rf! 0.1446! (0.0574)! 0.0883! (0.0806)! 0.0999! (0.0563)! 0.1708! (0.0611)!
!! 0.0132! !! 0.2755! !! 0.0788! !! 0.0061! !!
DAXvol30! 0.0012! (0.0007)! /0.0013! (0.0012)! 0.0008! (0.0008)! 0.0014! (0.0007)!
!! 0.1122! !! 0.2872! !! 0.3147! !! 0.0376! !!
DAXvol30^2! 0.0000! (0.0000)! 0.0000! (0.0000)! 0.0000! (0.0000)! 0.0000! (0.0000)!
!! 0.2949! !! 0.0571! !! 0.6212! !! 0.1349! !!
Intercept! /0.0123! (0.0087)! 0.0189! (0.0156)! /0.0051! (0.0098)! /0.0153! (0.0081)!
!! 0.1605! !! 0.2278! !! 0.5990! !! 0.0617! !!
R2! 0.1372! !! 0.0608! !! 0.0392! !! 0.1498! !!
!

! XLII!
!A.5.1.4.3. Lagged!1!month!
!Volatility!F1! Top!30! Top!5! Top!10! Top!20!
DAX/rf! 0.1342! (0.0707)! 0.0937! (0.0888)! 0.0810! (0.0699)! 0.1618! (0.0749)!
!! 0.0603! !! 0.2935! !! 0.2494! !! 0.0328! !!
DAXvol30! 0.0003! (0.0006)! 0.0010! (0.0008)! 0.0002! (0.0007)! 0.0003! (0.0006)!
!! 0.6736! !! 0.2222! !! 0.8086! !! 0.6018! !!
DAXvol30(/1)! 0.0002! (0.0005)! /0.0001! (0.0009)! 0.0003! (0.0007)! 0.0002! (0.0005)!
!! 0.7303! !! 0.8763! !! 0.6290! !! 0.7235! !!
Intercept! /0.0037! (0.0044)! /0.0071! (0.0101)! /0.0011! (0.0056)! /0.0044! (0.0051)!
!! 0.4026! !! 0.4847! !! 0.8423! !! 0.3875! !!
R2! 0.1282! !! 0.0390! !! 0.0419! !! 0.1372! !!
!!
A.5.1.4.4. Lagged!2!months!!
Volatility!F2! Top!30! Top!5! Top!10! Top!20!
DAX/rf! 0.1352! (0.0604)! 0.0928! (0.0707)! 0.0874! (0.0530)! 0.1612! (0.0649)!
!! 0.0271! !! 0.1919! !! 0.1020! !! 0.0145! !!
DAXvol30! 0.0004! (0.0003)! 0.0013! (0.0007)! 0.0005! (0.0004)! 0.0004! (0.0003)!
!! 0.2089! !! 0.0530! !! 0.1857! !! 0.1894! !!
DAXvol30(/2)! 0.0001! (0.0002)! /0.0005! (0.0007)! 0.0000! (0.0003)! 0.0001! (0.0003)!
!! 0.8348! !! 0.4753! !! 0.9928! !! 0.7379! !!
Alpha! /0.0042! (0.0047)! /0.0045! (0.0099)! /0.0013! (0.0063)! /0.0052! (0.0055)!
!! 0.3681! !! 0.6500! !! 0.8394! !! 0.3395! !!
R2! 0.1251! !! 0.0544! !! 0.0412! !! 0.1337! !!
!!
A.5.1.4.5. Lagged!3!months! !!
Volatility!F3! Top!30! Top!5! Top!10! Top!20!
DAX/rf! 0.1341! (0.0571)! 0.0747! (0.0743)! 0.0881! (0.0543)! 0.1591! (0.0593)!
!! 0.0207! !! 0.3167! !! 0.1072! !! 0.0083! !!
DAXvol30! 0.0004! (0.0002)! 0.0008! (0.0005)! 0.0004! (0.0003)! 0.0004! (0.0003)!
!! 0.1128! !! 0.1102! !! 0.1287! !! 0.0923! !!
DAXvol30(/3)! 0.0001! (0.0001)! 0.0000! (0.0004)! 0.0000! (0.0002)! 0.0002! (0.0002)!
!! 0.4182! !! 0.9560! !! 0.8674! !! 0.3773! !!
Alpha! /0.0050! (0.0054)! /0.0057! (0.0100)! 0.0000! (0.0067)! /0.0071! (0.0065)!
!! 0.3574! !! 0.5701! !! 0.9992! !! 0.2772! !!
R2! 0.1260! !! 0.0337! !! 0.0634! !! 0.1388! !!
!!

! XLIII!
A.5.1.4.6. Lagged!4!months!!
Volatility!F4! Top!30! Top!5! Top!10! Top!20!
DAX/rf! 0.0904! (0.0591)! 0.0255! (0.0831)! 0.0481! (0.0601)! 0.0977! (0.0513)!
!! 0.1291! !! 0.7590! !! 0.4246! !! 0.0595! !!
DAXvol30! 0.0002! (0.0002)! 0.0005! (0.0006)! 0.0002! (0.0003)! 0.0001! (0.0002)!
!! 0.4529! !! 0.3568! !! 0.5408! !! 0.4894! !!
DAXvol30(/4)! 0.0004! (0.0002)! 0.0005! (0.0004)! 0.0004! (0.0002)! 0.0004! (0.0002)!
!! 0.0071! !! 0.1535! !! 0.0629! !! 0.0129! !!
Alpha! /0.0069! (0.0055)! /0.0113! (0.0118)! /0.0030! (0.0069)! /0.0070! (0.0060)!
!! 0.2119! !! 0.3416! !! 0.6606! !! 0.2407! !!
R2! 0.1121! !! 0.0371! !! 0.0355! !! 0.1024! !!
!!
A.5.1.4.7. Lagged!5!months!!
Volatility!F5! Top!30! Top!5! Top!10! Top!20!
DAX/rf! 0.0729! (0.0513)! 0.0289! (0.0837)! 0.0367! (0.0579)! 0.0848! (0.0465)!
!! 0.1584! !! 0.7308! !! 0.5274! !! 0.0712! !!
DAXvol30! 0.0001! (0.0002)! 0.0007! (0.0005)! 0.0002! (0.0002)! 0.0001! (0.0002)!
!! 0.4994! !! 0.2047! !! 0.4663! !! 0.4534! !!
DAXvol30(/5)! 0.0006! (0.0002)! 0.0005! (0.0003)! 0.0006! (0.0002)! 0.0006! (0.0001)!
!! 0.0001! !! 0.0847! !! 0.0018! !! 0.0001! !!
Alpha! /0.0105! (0.0044)! /0.0124! (0.0107)! /0.0064! (0.0060)! /0.0099! (0.0049)!
!! 0.0177! !! 0.2478! !! 0.2915! !! 0.0458! !!
R2! 0.1747! !! 0.0436! !! 0.0611! !! 0.1425! !!
!!
A.5.1.4.8. Lagged!6!months!!
Volatility!F6! Top!30! Top!5! Top!10! Top!20!
DAX/rf! 0.0946! (0.0573)! 0.0571! (0.0827)! 0.0505! (0.0571)! 0.0967! (0.0481)!
!! 0.1015! !! 0.4911! !! 0.3787! !! 0.0466! !!
DAXvol30! 0.0002! (0.0002)! 0.0008! (0.0005)! 0.0002! (0.0003)! 0.0002! (0.0002)!
!! 0.3046! !! 0.1482! !! 0.4121! !! 0.3537! !!
DAXvol30(/6)! 0.0004! (0.0001)! 0.0005! (0.0003)! 0.0007! (0.0002)! 0.0006! (0.0002)!
!! 0.0060! !! 0.1076! !! 0.0022! !! 0.0004! !!
Alpha! /0.0079! (0.0051)! /0.0140! (0.0107)! /0.0088! (0.0061)! /0.0105! (0.0052)!
!! 0.1245! !! 0.1907! !! 0.1550! !! 0.0452! !!
R2! 0.1193! !! 0.0526! !! 0.0834! !! 0.1456! !!
!!

! XLIV!
A.5.1.4.9. Lagged!12!months!!
Volatility!F12! Top!30! Top!5! Top!10! Top!20!
DAX/rf! 0.1128! (0.0706)! 0.0630! (0.0945)! 0.0767! (0.0697)! 0.1161! (0.0635)!
!! 0.1133! !! 0.5063! !! 0.2735! !! 0.0706! !!
DAXvol30! 0.0004! (0.0003)! 0.0009! (0.0005)! 0.0004! (0.0003)! 0.0003! (0.0003)!
!! 0.2033! !! 0.0715! !! 0.1232! !! 0.1769! !!
DAXvol30(/12)! 0.0001! (0.0002)! 0.0001! (0.0004)! 0.0001! (0.0002)! 0.0002! (0.0002)!
!! 0.7374! !! 0.7849! !! 0.6242! !! 0.2010! !!
Intercept! /0.0030! (0.0069)! /0.0095! (0.0127)! /0.0021! (0.0085)! /0.0064! (0.0067)!
!! 0.6611! !! 0.4556! !! 0.8093! !! 0.3412! !!
R2! 0.0914! !! 0.0376! !! 0.0250! !! 0.0699! !!
!!
A.5.1.4.10. Lagged!12!months!!
Implied!volatility! Top!30! Top!5! Top!10! Top!20!
DAX/rf! 0.1217! (0.0576)! 0.0315! (0.0793)! 0.0748! (0.0560)! 0.1464! (0.0602)!
!! 0.0368! !! 0.6920! !! 0.1841! !! 0.0165! !!
VIX! 0.0005! (0.0002)! 0.0013! (0.0005)! 0.0006! (0.0003)! 0.0006! (0.0002)!
!! 0.0240! !! 0.0186! !! 0.0403! !! 0.0202! !!
Alpha! /0.0059! (0.0055)! /0.0164! (0.0124)! /0.0050! (0.0077)! /0.0075! (0.0061)!
!! 0.2776! !! 0.1908! !! 0.5197! !! 0.2248! !!
r2! 0.1283! !! 0.0506! !! 0.0456! !! 0.1406! !!
!!
A.5.1.5. Liquidity&
A.5.1.5.1. EU!TED!!
Liquidity! Top!30! Top!5! Top!10! Top!20!
DAX/rf! 0.1453! (0.0625)! 0.0516! (0.0880)! 0.0994! (0.0613)! 0.1664! (0.0661)!
!! 0.0218! !! 0.5584! !! 0.1074! !! 0.0131! !!
EUTED! 0.9142! (0.3875)! 0.8143! (0.8284)! 0.9529! (0.4517)! 0.7792! (0.4070)!
!! 0.0200! !! 0.3277! !! 0.0370! !! 0.0580! !!
Intercept! 0.0007! (0.0028)! 0.0075! (0.0061)! 0.0040! (0.0039)! 0.0011! (0.0033)!
!! 0.8085! !! 0.2165! !! 0.3003! !! 0.7307! !!
R2! 0.1303! !! 0.0082! !! 0.0390! !! 0.1274! !!
!!( !

! XLV!
A.5.1.5.2. US!TED!!
Liquidity!US!TED! Top!30! Top!5! Top!10! Top!20!
DAX/rf! 0.1444! (0.0628)! 0.0822! (0.0738)! 0.1049! (0.0555)! 0.1645! (0.0654)!
!! 0.0232! !! 0.2678! !! 0.0613! !! 0.0133! !!
USTED! 0.9042! (0.3946)! 2.0258! (0.9264)! 1.1934! (0.5434)! 0.7292! (0.4738)!
!! 0.0237! !! 0.0308! !! 0.0300! !! 0.1265! !!
Intercept! 0.0010! (0.0025)! 0.0016! (0.0058)! 0.0030! (0.0033)! 0.0016! (0.0028)!
!! 0.7034! !! 0.7880! !! 0.3645! !! 0.5782! !!
R2! 0.1266! !! 0.0406! !! 0.0486! !! 0.1231! !!
!!
A.5.1.5.3. EU!TED!+!Momentum!!
Liquidity+WML! Top!30! Top!5! Top!10! Top!20!
DAX/rf! 0.0661! (0.0451)! /0.0097! (0.0956)! 0.0432! (0.0578)! 0.0944! (0.0505)!
!! 0.1458! !! 0.9196! !! 0.4565! !! 0.0641! !!
EUTED! 0.8832! (0.3104)! 0.7904! (0.8305)! 0.9310! (0.4213)! 0.7510! (0.3612)!
!! 0.0052! !! 0.3432! !! 0.0291! !! 0.0398! !!
WML! /0.2471! (0.0433)! /0.1912! (0.0866)! /0.1753! (0.0596)! /0.2245! (0.0506)!
!! 0.0000! !! 0.0293! !! 0.0040! !! 0.0000! !!
Alpha! 0.0027! (0.0026)! 0.0091! (0.0061)! 0.0055! (0.0038)! 0.0030! (0.0030)!
!! 0.2913! !! 0.1385! !! 0.1497! !! 0.3228! !!
r2! 0.3000! !! 0.0310! !! 0.0827! !! 0.2382! !!
!!
A.5.1.5.4. US!TED!+!Momentum!!
Liquidity!US+WML! Top!30! Top!5! Top!10! Top!20!
DAX/rf! 0.0648! (0.0431)! 0.0223! (0.0822)! 0.0489! (0.0501)! 0.0921! (0.0477)!
!! 0.1353! !! 0.7864! !! 0.3310! !! 0.0559! !!
USTED! 0.8398! (0.2874)! 1.9774! (0.9305)! 1.1482! (0.5242)! 0.6706! (0.4096)!
!! 0.0042! !! 0.0357! !! 0.0305! !! 0.1043! !!
WML! /0.2456! (0.0441)! /0.1849! (0.0775)! /0.1726! (0.0588)! /0.2234! (0.0504)!
!! 0.0000! !! 0.0187! !! 0.0040! !! 0.0000! !!
Alpha! 0.0032! (0.0022)! 0.0032! (0.0059)! 0.0046! (0.0033)! 0.0036! (0.0025)!
!! 0.1464! !! 0.5889! !! 0.1634! !! 0.1535! !!
r2! 0.2941! !! 0.0620! !! 0.0910! !! 0.2327! !!
!!( !

! XLVI!
A.5.1.5.5. Volume!!
Liquidity!volume! Top!30! Top!5! Top!10! Top!20!
DAX/rf! 0.1365! (0.0591)! 0.0348! (0.0905)! 0.0819! (0.0586)! 0.1522! (0.0655)!
!! 0.0227! !! 0.7014! !! 0.1651! !! 0.0218! !!
log(!DAXvm)! 0.0085! (0.0092)! 0.0026! (0.0173)! 0.0043! (0.0111)! 0.0035! (0.0099)!
!! 0.3597! !! 0.8794! !! 0.7031! !! 0.7202! !!
Intercept! /0.0222! (0.0293)! 0.0033! (0.0559)! /0.0048! (0.0361)! /0.0063! (0.0312)!
!! 0.4505! !! 0.9535! !! 0.8940! !! 0.8406! !!
R2! 0.0999! !! 0.0014! !! 0.0187! !! 0.1064! !!
!!
A.5.1.5.6. EU!TED!Quadratic!!
Liquidity!squared! Top!30! Top!5! Top!10! Top!20!
DAX/rf! 0.1419! (0.0628)! 0.0519! (0.0896)! 0.0927! (0.0623)! 0.1643! (0.0672)!
!! 0.0257! !! 0.5639! !! 0.1392! !! 0.0160! !!
EUTED! 1.5669! (0.8819)! 0.7701! (2.1131)! 2.2380! (1.2948)! 1.1900! (0.9626)!
!! 0.0782! !! 0.7162! !! 0.0866! !! 0.2189! !!
EUTED^2! /30.3800! (39.9280)! 2.0580! (89.2744)! /59.8100! (48.4598)! /19.1000! (38.6230)!
!! 0.4483! !! 0.9816! !! 0.2196! !! 0.6219! !!
Intercept! /0.0011! (0.0034)! 0.0076! (0.0077)! 0.0006! (0.0047)! 0.0000! (0.0040)!
!! 0.7548! !! 0.3238! !! 0.8997! !! 0.9941! !!
R2! 0.1342! !! 0.0082! !! 0.0467! !! 0.1286! !!
!!
A.5.1.5.7. US!TED!Quadratic!!
Liquidity!US!squared! Top!30! Top!5! Top!10! Top!20!
DAX/rf! 0.1419! (0.0645)! 0.0519! (0.0752)! 0.0927! (0.0566)! 0.1643! (0.0675)!
!! 0.0298! !! 0.4917! !! 0.1040! !! 0.0164! !!
USTED! 1.5669! (1.1257)! 0.7701! (2.9682)! 2.2380! (1.8513)! 1.1900! (1.2765)!
!! 0.1666! !! 0.7957! !! 0.2292! !! 0.3532! !!
USTED^2! /30.3800! (42.3860)! 2.0580!(125.3765)! /59.8100! (62.9481)! /19.1000! (44.4735)!
!! 0.4750! !! 0.9869! !! 0.3440! !! 0.6684! !!
Intercept! /0.0011! (0.0035)! 0.0076! (0.0095)! 0.0006! (0.0057)! 0.0000! (0.0039)!
!! 0.7623! !! 0.4219! !! 0.9178! !! 0.9939! !!
R2! 0.1310! !! 0.0420! !! 0.0486! !! 0.1282! !!
!!( !

! XLVII!
A.5.1.5.8. EU!TED!lagged!1!month!!
Liquidity!F1! Top!30! Top!5! Top!10! Top!20!
DAX/rf! 0.1441! (0.0640)! 0.0551! (0.0844)! 0.0974! (0.0608)! 0.1669! (0.0677)!
!! 0.0264! !! 0.5152! !! 0.1120! !! 0.0153! !!
EUTED! 1.2103! (0.9490)! /1.8812! (1.0080)! 0.0788! (1.0433)! 0.9674! (1.0338)!
!! 0.2047! !! 0.0645! !! 0.9399! !! 0.3514! !!
EUTED(/1)! /0.3565! (0.9668)! 3.1545! (1.4986)! 0.9882! (1.0244)! /0.2126! (1.0220)!
!! 0.7130! !! 0.0375! !! 0.3367! !! 0.8356! !!
Alpha! 0.0011! (0.0029)! 0.0049! (0.0064)! 0.0035! (0.0039)! 0.0012! (0.0034)!
!! 0.7107! !! 0.4422! !! 0.3674! !! 0.7205! !!
R2! 0.1275! !! 0.0373! !! 0.0434! !! 0.1264! !!
!!
A.5.1.5.9. US!TED!lagged!1!month!!
Liquidity!US!F1! Top!30! Top!5! Top!10! Top!20!
DAX/rf! 0.1424! (0.0635)! 0.0891! (0.0733)! 0.1041! (0.0553)! 0.1646! (0.0665)!
!! 0.0267! !! 0.2266! !! 0.0626! !! 0.0148! !!
USTED! 1.3525! (0.8626)! 0.3683! (2.0025)! 0.2851! (0.9567)! 0.7405! (1.1770)!
!! 0.1196! !! 0.8544! !! 0.7663! !! 0.5305! !!
USTED(/1)! /0.5518! (0.8807)! 2.0384! (2.0034)! 1.0687! (0.9914)! /0.0120! (1.0261)!
!! 0.5322! !! 0.3111! !! 0.2833! !! 0.9907! !!
Alpha! 0.0016! (0.0026)! /0.0006! (0.0057)! 0.0023! (0.0036)! 0.0016! (0.0029)!
!! 0.5512! !! 0.9152! !! 0.5207! !! 0.5850! !!
R2! 0.1266! !! 0.0555! !! 0.0548! !! 0.1217! !!
!!
A.5.1.5.10. !EU!TED!lagged!2!months!!
Liquidity!F2! Top!30! Top!5! Top!10! Top!20!
DAX/rf! 0.1346! (0.0640)! 0.0333! (0.0844)! 0.0784! (0.0608)! 0.1576! (0.0677)!
!! 0.0378! !! 0.6935! !! 0.2000! !! 0.0218! !!
EUTED! 0.4945! (0.9490)! /0.4043! (1.0080)! /0.2357! (1.0433)! 0.1153! (1.0338)!
!! 0.6033! !! 0.6891! !! 0.8217! !! 0.9114! !!
EUTED(/2)! 0.4664! (0.9668)! 1.5178! (1.4986)! 1.4297! (1.0244)! 0.8338! (1.0220)!
!! 0.6304! !! 0.3133! !! 0.1655! !! 0.4163! !!
Alpha! 0.0008! (0.0029)! 0.0065! (0.0064)! 0.0035! (0.0039)! 0.0005! (0.0034)!
!! 0.7725! !! 0.3094! !! 0.3697! !! 0.8800! !!
R2! 0.1167! !! 0.0183! !! 0.0529! !! 0.1273! !!
!!

! XLVIII!
A.5.1.5.11. US!TED!lagged!2!months!!
Liquidity!US!F2! Top!30! Top!5! Top!10! Top!20!
DAX/rf! 0.1389! (0.0616)! 0.0822! (0.0743)! 0.0975! (0.0507)! 0.1632! (0.0635)!
!! 0.0262! !! 0.2705! !! 0.0570! !! 0.0115! !!
USTED! 0.3015! (0.6123)! 0.4743! (1.2526)! /0.1581! (0.6565)! /0.0531! (0.7732)!
!! 0.6234! !! 0.7057! !! 0.8101! !! 0.9454! !!
USTED(/2)! 0.7370! (0.5894)! 2.0572! (1.7088)! 1.7065! (0.7185)! 1.0196! (0.6406)!
!! 0.2137! !! 0.2311! !! 0.0192! !! 0.1143! !!
Alpha! 0.0007! (0.0029)! /0.0006! (0.0067)! 0.0019! (0.0039)! 0.0007! (0.0032)!
!! 0.8151! !! 0.9263! !! 0.6287! !! 0.8374! !!
R2! 0.1203! !! 0.0573! !! 0.0691! !! 0.1280! !!
!!
A.5.1.5.12. EU!TED!lagged!3!months!!
Liquidity!F3! Top!30! Top!5! Top!10! Top!20!
DAX/rf! 0.1410! (0.0659)! 0.0567! (0.0951)! 0.0957! (0.0641)! 0.1598! (0.0677)!
!! 0.0344! !! 0.5521! !! 0.1381! !! 0.0200! !!
EUTED! 0.8002! (0.4669)! 1.1788! (1.3855)! 0.5382! (0.6206)! 0.5013! (0.4915)!
!! 0.0893! !! 0.3967! !! 0.3876! !! 0.3099! !!
EUTED(/3)! 0.1415! (0.4402)! /0.4618! (1.5371)! 0.6650! (0.6027)! 0.3724! (0.4798)!
!! 0.7485! !! 0.7644! !! 0.2722! !! 0.4393! !!
Alpha! 0.0007! (0.0032)! 0.0076! (0.0071)! 0.0027! (0.0042)! 0.0009! (0.0038)!
!! 0.8379! !! 0.2907! !! 0.5205! !! 0.8191! !!
R2! 0.1201! !! 0.0115! !! 0.0449! !! 0.1165! !!
!!
A.5.1.5.13. US!TED!lagged!3!months!!
Liquidity!US!F3! Top!30! Top!5! Top!10! Top!20!
DAX/rf! 0.1393! (0.0659)! 0.0808! (0.0811)! 0.1031! (0.0579)! 0.1582! (0.0669)!
!! 0.0368! !! 0.3209! !! 0.0775! !! 0.0198! !!
USTED! 0.9086! (0.4910)! 1.1850! (1.5918)! 0.7904! (0.6618)! 0.4830! (0.6564)!
!! 0.0668! !! 0.4582! !! 0.2349! !! 0.4633! !!
USTED(/3)! /0.0583! (0.4251)! 1.1532! (1.6475)! 0.6078! (0.6333)! 0.2953! (0.5102)!
!! 0.8911! !! 0.4854! !! 0.3393! !! 0.5639! !!
Alpha! 0.0014! (0.0029)! 0.0069! (0.0066)! 0.0020! (0.0038)! 0.0016! (0.0032)!
!! 0.6348! !! 0.3007! !! 0.6021! !! 0.6182! !!
R2! 0.1158! !! 0.0498! !! 0.0526! !! 0.1109! !!
!!

! XLIX!
A.5.1.5.14. EU!TED!lagged!4!months!!
Liquidity!F4! Top!30! Top!5! Top!10! Top!20!
DAX/rf! 0.1126! (0.0618)! 0.0241! (0.0922)! 0.0710! (0.0610)! 0.1167! (0.0536)!
!! 0.0712! !! 0.7939! !! 0.2466! !! 0.0316! !!
EUTED! 0.3449! (0.4220)! 0.3198! (1.0635)! 0.1746! (0.5838)! 0.0448! (0.4680)!
!! 0.4155! !! 0.7642! !! 0.7654! !! 0.9239! !!
EUTED(/4)! 1.0054! (0.4634)! 1.0683! (0.8923)! 1.4567! (0.6383)! 1.2559! (0.5658)!
!! 0.0321! !! 0.2337! !! 0.0244! !! 0.0284! !!
Alpha! /0.0018! (0.0032)! 0.0037! (0.0070)! 0.0002! (0.0043)! /0.0018! (0.0038)!
!! 0.5738! !! 0.5994! !! 0.9644! !! 0.6284! !!
R2! 0.1289! !! 0.0184! !! 0.0726! !! 0.1242! !!
!!
A.5.1.5.15. US!TED!lagged!4!months!!
Liquidity!US!F4! Top!30! Top!5! Top!10! Top!20!
DAX/rf! 0.1155! (0.0650)! 0.0635! (0.0816)! 0.0835! (0.0579)! 0.1195! (0.0553)!
!! 0.0786! !! 0.4383! !! 0.1518! !! 0.0330! !!
USTED! 0.4614! (0.4594)! 1.7512! (1.2367)! 0.6142! (0.6112)! 0.1293! (0.5885)!
!! 0.3174! !! 0.1595! !! 0.3171! !! 0.8265! !!
USTED(/4)! 0.6721! (0.5069)! 0.5992! (1.0567)! 0.9779! (0.6604)! 0.8743! (0.5898)!
!! 0.1875! !! 0.5718! !! 0.1415! !! 0.1411! !!
Alpha! /0.0004! (0.0031)! /0.0010! (0.0064)! 0.0007! (0.0041)! 0.0000! (0.0033)!
!! 0.9102! !! 0.8727! !! 0.8547! !! 0.9992! !!
R2! 0.0968! !! 0.0458! !! 0.0541! !! 0.0860! !!
!!
A.5.1.5.16. EU!TED!lagged!5!months!!
Liquidity!F5! Top!30! Top!5! Top!10! Top!20!
DAX/rf! 0.1004! (0.0560)! 0.0100! (0.0898)! 0.0587! (0.0586)! 0.1026! (0.0474)!
!! 0.0754! !! 0.9111! !! 0.3184! !! 0.0327! !!
EUTED! 0.1392! (0.3857)! 0.0439! (1.0146)! 0.1775! (0.5218)! /0.1528! (0.3773)!
!! 0.7188! !! 0.9656! !! 0.7344! !! 0.6862! !!
EUTED(/5)! 1.3063! (0.2823)! 1.3444! (0.7130)! 1.2814! (0.4805)! 1.5097! (0.2858)!
!! 0.0000! !! 0.0620! !! 0.0088! !! 0.0000! !!
Alpha! /0.0019! (0.0030)! 0.0046! (0.0069)! 0.0017! (0.0042)! /0.0017! (0.0036)!
!! 0.5181! !! 0.5089! !! 0.6874! !! 0.6429! !!
R2! 0.1601! !! 0.0233! !! 0.0617! !! 0.1523! !!
!!

! L!
A.5.1.5.17. US!TED!lagged!5!months!!
Liquidity!US!F5! Top!30! Top!5! Top!10! Top!20!
DAX/rf! 0.1056! (0.0571)! 0.0541! (0.0755)! 0.0722! (0.0524)! 0.1072! (0.0459)!
!! 0.0669! !! 0.4749! !! 0.1710! !! 0.0212! !!
USTED! /0.0446! (0.4342)! 1.3177! (1.1178)! 0.3542! (0.6800)! /0.4522! (0.5027)!
!! 0.9185! !! 0.2410! !! 0.6035! !! 0.3703! !!
USTED(/5)! 1.4822! (0.4179)! 1.1667! (0.7961)! 1.2865! (0.6039)! 1.7896! (0.4300)!
!! 0.0006! !! 0.1456! !! 0.0354! !! 0.0001! !!
Alpha! /0.0015! (0.0031)! /0.0009! (0.0066)! 0.0011! (0.0038)! /0.0012! (0.0034)!
!! 0.6160! !! 0.8941! !! 0.7807! !! 0.7153! !!
R2! 0.1631! !! 0.0512! !! 0.0663! !! 0.1645! !!
!!
A.5.1.5.18. !EU!TED!lagged!6!months!!
Liquidity!F6! Top!30! Top!5! Top!10! Top!20!
DAX/rf! 0.0965! (0.0568)! 0.0253! (0.0953)! 0.0648! (0.0625)! 0.1004! (0.0511)!
!! 0.0918! !! 0.7913! !! 0.3027! !! 0.0518! !!
EUTED! 0.3242! (0.3812)! 0.3280! (0.9215)! 0.4402! (0.4858)! 0.0899! (0.3652)!
!! 0.3970! !! 0.7226! !! 0.3669! !! 0.8059! !!
EUTED(/6)! 0.9360! (0.3992)! 0.6783! (0.7501)! 0.7162! (0.4278)! 1.0171! (0.2846)!
!! 0.0208! !! 0.3678! !! 0.0969! !! 0.0005! !!
Alpha! /0.0009! (0.0033)! 0.0073! (0.0075)! 0.0036! (0.0046)! /0.0003! (0.0037)!
!! 0.7770! !! 0.3374! !! 0.4367! !! 0.9456! !!
R2! 0.1229! !! 0.0102! !! 0.0381! !! 0.1072! !!
!!
A.5.1.5.19. US!TED!lagged!6!months!!
Liquidity!US!F6! Top!30! Top!5! Top!10! Top!20!
DAX/rf! 0.1020! (0.0585)! 0.0737! (0.0796)! 0.0816! (0.0579)! 0.1049! (0.0512)!
!! 0.0841! !! 0.3566! !! 0.1612! !! 0.0429! !!
USTED! 0.4044! (0.3999)! 1.9322! (1.1294)! 0.9629! (0.6737)! 0.1218! (0.5048)!
!! 0.3141! !! 0.0899! !! 0.1557! !! 0.8098! !!
USTED(/6)! 0.6889! (0.5416)! 0.0492! (0.9590)! 0.1930! (0.5509)! 0.7722! (0.4566)!
!! 0.2061! !! 0.9592! !! 0.7268! !! 0.0936! !!
Alpha! 0.0002! (0.0031)! 0.0023! (0.0067)! 0.0038! (0.0038)! 0.0011! (0.0031)!
!! 0.9427! !! 0.7349! !! 0.3171! !! 0.7293! !!
R2! 0.0982! !! 0.0411! !! 0.0378! !! 0.0840! !!
!!

! LI!
A.5.1.5.20. EU!TED!lagged!12!months!!
Liquidity!F12! Top!30! Top!5! Top!10! Top!20!
DAX/rf! 0.1042! (0.0685)! 0.0219! (0.1061)! 0.0692! (0.0731)! 0.1007! (0.0608)!
!! 0.1310! !! 0.8366! !! 0.3463! !! 0.1008! !!
EUTED! 0.7458! (0.4201)! 0.9765! (0.8414)! 0.8879! (0.5040)! 0.5082! (0.4069)!
!! 0.0788! !! 0.2485! !! 0.0811! !! 0.2145! !!
EUTED(/12)! 0.4463! (0.4325)! 0.0848! (0.6873)! 0.3209! (0.6034)! 0.6114! (0.4299)!
!! 0.3045! !! 0.9020! !! 0.5960! !! 0.1580! !!
Alpha! /0.0009! (0.0036)! 0.0046! (0.0074)! 0.0022! (0.0048)! /0.0007! (0.0041)!
!! 0.7991! !! 0.5317! !! 0.6482! !! 0.8574! !!
R2! 0.0922! !! 0.0124! !! 0.0339! !! 0.0768! !!
!!
A.5.1.5.21. US!TED!lagged!12!months!!
Liquidity!US!F12! Top!30! Top!5! Top!10! Top!20!
DAX/rf! 0.1054! (0.0687)! 0.0568! (0.0863)! 0.0763! (0.0641)! 0.1014! (0.0591)!
!! 0.1282! !! 0.5116! !! 0.2363! !! 0.0891! !!
USTED! 0.6274! (0.3851)! 2.0435! (1.0189)! 0.9839! (0.6507)! 0.3231! (0.4177)!
!! 0.1063! !! 0.0475! !! 0.1335! !! 0.4410! !!
USTED(/12)! 0.6547! (0.4705)! 0.5547! (0.8224)! 0.6871! (0.7205)! 0.8679! (0.5109)!
!! 0.1670! !! 0.5015! !! 0.3425! !! 0.0924! !!
Alpha! /0.0011! (0.0035)! /0.0032! (0.0069)! 0.0001! (0.0041)! /0.0009! (0.0036)!
!! 0.7588! !! 0.6471! !! 0.9720! !! 0.8081! !!
R2! 0.0973! !! 0.0602! !! 0.0533! !! 0.0861! !!
!!! !

! LII!
A.5.2. SXXP!results!!
A.5.2.1. CAPM&CAPM! Top!30! Top!5! Top!10! Top!20!
SXXP/rf! 0.1457! (0.0728)! 0.0234! (0.1206)! 0.0781! (0.0857)! 0.1677! (0.0779)!
!! 0.0477! !! 0.8465! !! 0.3644! !! 0.0333! !!
Alpha! 0.0058! (0.0019)! 0.0120! (0.0042)! 0.0093! (0.0029)! 0.0056! (0.0023)!
!! 0.0027! !! 0.0055! !! 0.0020! !! 0.0176! !!
R2! 0.0759! !! 0.0004! !! 0.0111! !! 0.0794! !!
! ! ! ! ! ! ! ! !
!A.5.2.2. FamaBFrench&Factors&
!F&F! Top!30! Top!5! Top!10! Top!20!
SXXP/rf! 0.0970! (0.0785)! 0.0408! (0.1169)! 0.0536! (0.0932)! 0.1332! (0.0884)!
!0.2191!
!0.7280!
!0.5663!
!0.1345!
!SMB! /0.0477! (0.0972)! /0.1427! (0.2171)! /0.0659! (0.1384)! /0.0533! (0.1198)!
!0.6245!
!0.5124!
!0.6349!
!0.6571!
!HML! 0.2078! (0.1485)! /0.0849! (0.2842)! 0.1015! (0.2018)! 0.1456! (0.1405)!
!0.1645!
!0.7656!
!0.6161!
!0.3023!
!Alpha! 0.0057! (0.0019)! 0.0123! (0.0043)! 0.0093! (0.0030)! 0.0056! (0.0023)!
!0.0031!
!0.0051!
!0.0021!
!0.0173!
!R2! 0.1036!
!0.0045!
!0.0159!
!0.0912!
!!&
A.5.2.3. FamaBFrench&Factors&+&Momentum&!
F&F!+!Mom! Top!30! Top!5! Top!10! Top!20!
SXXP/rf! 0.0210! (0.0639)! /0.0320! (0.1250)! /0.0049! (0.0884)! 0.0603! (0.0720)!
!! 0.7431! !! 0.7983! !! 0.9562! !! 0.4042! !!
SMB! /0.0651! (0.1020)! /0.1593! (0.2175)! /0.0793! (0.1373)! /0.0700! (0.1188)!
!! 0.5248! !! 0.4654! !! 0.5650! !! 0.5572! !!
HML! 0.0450! (0.1347)! /0.2408! (0.2890)! /0.0238! (0.1977)! /0.0105! (0.1375)!
!! 0.7392! !! 0.4064! !! 0.9043! !! 0.9391! !!
WML! /0.2540! (0.0536)! /0.2431! (0.1000)! /0.1954! (0.0704)! /0.2436! (0.0687)!
!! 0.0000! !! 0.0166! !! 0.0064! !! 0.0006! !!
Intercept! 0.0077! (0.0016)! 0.0142! (0.0044)! 0.0108! (0.0030)! 0.0075! (0.0022)!
!! 0.0000! !! 0.0018! !! 0.0004! !! 0.0007! !!
R2! 0.2617! !! 0.0371! !! 0.0638! !! 0.2062! !!
!!

! LIII!
A.5.2.4. Volatility&!
A.5.2.4.1. Linear!!
Volatility! Top!30! Top!5! Top!10! Top!20!
SXXP/rf! 0.2119! (0.0799)! 0.1338! (0.1120)! 0.1457! (0.0907)! 0.2293! (0.0864)!
!! 0.0091! !! 0.2348! !! 0.1111! !! 0.0090! !!
SXXPvol30! 0.0006! (0.0003)! 0.0010! (0.0005)! 0.0006! (0.0003)! 0.0006! (0.0003)!
!! 0.0301! !! 0.0286! !! 0.0313! !! 0.0332! !!
Intercept! /0.0054! (0.0052)! /0.0067! (0.0093)! /0.0022! (0.0060)! /0.0049! (0.0052)!
!! 0.2974! !! 0.4699! !! 0.7171! !! 0.3505! !!
R2! 0.1316! !! 0.0354! !! 0.0410! !! 0.1177! !!
!!
A.5.2.4.2. Quadratic!!
Volatility!squared! Top!30! Top!5! Top!10! Top!20!
SXXP/rf! 0.2016! (0.0786)! 0.1456! (0.1217)! 0.1355! (0.0900)! 0.2193! (0.0844)!
!! 0.0116! !! 0.2338! !! 0.1346! !! 0.0105! !!
SXXPvol30! 0.0017! (0.0007)! /0.0002! (0.0010)! 0.0017! (0.0008)! 0.0016! (0.0007)!
!! 0.0182! !! 0.8784! !! 0.0442! !! 0.0225! !!
SXXPvol30^2! 0.0000! (0.0000)! 0.0000! (0.0000)! 0.0000! (0.0000)! 0.0000! (0.0000)!
!! 0.1071! !! 0.2049! !! 0.1624! !! 0.0824! !!
Intercept! /0.0161! (0.0076)! 0.0055! (0.0123)! /0.0127! (0.0086)! /0.0152! (0.0077)!
!! 0.0362! !! 0.6532! !! 0.1452! !! 0.0514! !!
R2! 0.1571! !! 0.0429! !! 0.0535! !! 0.1366! !!
!A.5.2.4.3. 1!month!lagged!
!Volatility!F1! Top!30! Top!5! Top!10! Top!20!
SXXP/rf! 0.1888! (0.0969)! 0.0618! (0.1299)! 0.0886! (0.1084)! 0.1987! (0.0974)!
!! 0.0537! !! 0.6353! !! 0.4152! !! 0.0435! !!
SXXPvol30! 0.0004! (0.0006)! 0.0000! (0.0008)! /0.0001! (0.0007)! 0.0002! (0.0005)!
!! 0.5750! !! 0.9988! !! 0.9145! !! 0.7317! !!
SXXPvol30(/1)! 0.0003! (0.0004)! 0.0011! (0.0009)! 0.0008! (0.0005)! 0.0004! (0.0004)!
!! 0.5079! !! 0.2149! !! 0.1437! !! 0.2478! !!
Intercept! /0.0056! (0.0050)! /0.0082! (0.0096)! /0.0029! (0.0058)! /0.0054! (0.0052)!
!! 0.2661! !! 0.3960! !! 0.6189! !! 0.3084! !!
R2! 0.1323! !! 0.0516! !! 0.0561! !! 0.1248! !!
!!!

! LIV!
A.5.2.4.4. 2!months!lagged!!
Volatility!F2! Top!30! Top!5! Top!10! Top!20!
SXXP/rf! 0.1995! (0.0869)! 0.1411! (0.1178)! 0.1247! (0.0944)! 0.2136! (0.0927)!
!! 0.0236! !! 0.2336! !! 0.1894! !! 0.0230! !!
SXXPvol30! 0.0006! (0.0004)! 0.0013! (0.0007)! 0.0006! (0.0005)! 0.0005! (0.0004)!
!! 0.1838! !! 0.0843! !! 0.2353! !! 0.2333! !!
SXXPvol30(/2)! 0.0001! (0.0003)! /0.0003! (0.0007)! 0.0001! (0.0004)! 0.0002! (0.0003)!
!! 0.8084! !! 0.7196! !! 0.7141! !! 0.4715! !!
Alpha! /0.0057! (0.0045)! /0.0054! (0.0095)! /0.0029! (0.0057)! /0.0061! (0.0051)!
!! 0.2084! !! 0.5729! !! 0.6141! !! 0.2327! !!
R2! 0.1281! !! 0.0409! !! 0.0427! !! 0.1185! !!
!!!!
A.5.2.4.5. 3!months!lagged!!
Volatility!F3! Top!30! Top!5! Top!10! Top!20!
SXXP/rf! 0.2032! (0.0796)! 0.1298! (0.1161)! 0.1293! (0.0916)! 0.2227! (0.0861)!
!! 0.0120! !! 0.2657! !! 0.1607! !! 0.0109! !!
SXXPvol30! 0.0006! (0.0003)! 0.0010! (0.0006)! 0.0006! (0.0003)! 0.0006! (0.0003)!
!! 0.0443! !! 0.0866! !! 0.0809! !! 0.0604! !!
SXXPvol30(/3)! 0.0000! (0.0002)! /0.0001! (0.0005)! 0.0000! (0.0003)! 0.0001! (0.0002)!
!! 0.9208! !! 0.7699! !! 0.9916! !! 0.8103! !!
Alpha! /0.0049! (0.0058)! /0.0038! (0.0093)! /0.0008! (0.0062)! /0.0057! (0.0062)!
!! 0.3935! !! 0.6851! !! 0.8943! !! 0.3624! !!
R2! 0.1257! !! 0.0312! !! 0.0349! !! 0.1163! !!
!!!
A.5.2.4.6. 4!months!lagged!!
Volatility!F4! Top!30! Top!5! Top!10! Top!20!
SXXP/rf! 0.1441! (0.0807)! 0.0562! (0.1140)! 0.0712! (0.0945)! 0.1399! (0.0717)!
!! 0.0769! !! 0.6232! !! 0.4528! !! 0.0535! !!
SXXPvol30! 0.0003! (0.0003)! 0.0005! (0.0006)! 0.0002! (0.0003)! 0.0002! (0.0002)!
!! 0.2622! !! 0.3730! !! 0.4587! !! 0.3782! !!
SXXPvol30(/4)! 0.0005! (0.0002)! 0.0008! (0.0004)! 0.0006! (0.0003)! 0.0005! (0.0002)!
!! 0.0068! !! 0.0412! !! 0.0171! !! 0.0035! !!
Alpha! /0.0081! (0.0051)! /0.0113! (0.0107)! /0.0056! (0.0060)! /0.0077! (0.0052)!
!! 0.1109! !! 0.2912! !! 0.3469! !! 0.1445! !!
R2! 0.1235! !! 0.0438! !! 0.0543! !! 0.1089! !!
!

! LV!
!!
A.5.2.4.7. 5!months!lagged!!
Volatility!F5! Top!30! Top!5! Top!10! Top!20!
SXXP/rf! 0.1195! (0.0706)! 0.0626! (0.1173)! 0.0591! (0.0905)! 0.1215! (0.0654)!
!! 0.0932! !! 0.5943! !! 0.5149! !! 0.0658! !!
SXXPvol30! 0.0002! (0.0002)! 0.0006! (0.0006)! 0.0002! (0.0003)! 0.0001! (0.0002)!
!! 0.4410! !! 0.2960! !! 0.5130! !! 0.5780! !!
SXXPvol30(/5)! 0.0008! (0.0002)! 0.0006! (0.0004)! 0.0007! (0.0003)! 0.0007! (0.0002)!
!! 0.0000! !! 0.1175! !! 0.0096! !! 0.0001! !!
Alpha! /0.0108! (0.0037)! /0.0093! (0.0096)! /0.0064! (0.0058)! /0.0094! (0.0044)!
!! 0.0044! !! 0.3347! !! 0.2715! !! 0.0341! !!
R2! 0.1930! !! 0.0383! !! 0.0693! !! 0.1508! !!
!!
A.5.2.4.8. 6!months!lagged!!
Volatility!F6! Top!30! Top!5! Top!10! Top!20!
SXXP/rf! 0.1380! (0.0752)! 0.0943! (0.1189)! 0.0707! (0.0921)! 0.1287! (0.0674)!
!! 0.0692! !! 0.4294! !! 0.4444! !! 0.0587! !!
SXXPvol30! 0.0003! (0.0003)! 0.0008! (0.0006)! 0.0003! (0.0003)! 0.0002! (0.0002)!
!! 0.2448! !! 0.1772! !! 0.3973! !! 0.4197! !!
SXXPvol30(/6)! 0.0004! (0.0002)! 0.0003! (0.0004)! 0.0006! (0.0003)! 0.0006! (0.0002)!
!! 0.0244! !! 0.3953! !! 0.0219! !! 0.0028! !!
Alpha! /0.0076! (0.0048)! /0.0068! (0.0093)! /0.0051! (0.0055)! /0.0078! (0.0045)!
!! 0.1158! !! 0.4649! !! 0.3479! !! 0.0864! !!
R2! 0.1236! !! 0.0333! !! 0.0586! !! 0.1227! !!
!!!
A.5.2.4.9. 12!months!lagged!!
Volatility!F12! Top!30! Top!5! Top!10! Top!20!
SXXP/rf! 0.1633! (0.0904)! 0.1035! (0.1305)! 0.1026! (0.1051)! 0.1531! (0.0873)!
!! 0.0739! !! 0.4297! !! 0.3315! !! 0.0824! !!
SXXPvol30! 0.0005! (0.0003)! 0.0009! (0.0005)! 0.0005! (0.0003)! 0.0004! (0.0003)!
!! 0.1384! !! 0.0718! !! 0.1142! !! 0.1910! !!
SXXPvol30(/12)! 0.0001! (0.0002)! 0.0001! (0.0004)! 0.0002! (0.0003)! 0.0003! (0.0002)!
!! 0.6584! !! 0.8244! !! 0.5634! !! 0.2192! !!
Intercept! /0.0048! (0.0065)! /0.0075! (0.0110)! /0.0034! (0.0079)! /0.0065! (0.0062)!
!! 0.4619! !! 0.4956! !! 0.6652! !! 0.2980! !!
R2! 0.0840! !! 0.0338! !! 0.0302! !! 0.0757! !!

! LVI!
!A.5.2.4.10. Implied!volatility!(VIX)!
!Implied!volatility! Top!30! Top!5! Top!10! Top!20!
SXXP/rf! 0.1521! (0.0722)! 0.0381! (0.1056)! 0.0856! (0.0835)! 0.1748! (0.0751)!
!! 0.0373! !! 0.7189! !! 0.3072! !! 0.0217! !!
VIX! 0.0006! (0.0002)! 0.0013! (0.0005)! 0.0007! (0.0003)! 0.0006! (0.0003)!
!! 0.0191! !! 0.0180! !! 0.0382! !! 0.0166! !!
Alpha! /0.0066! (0.0056)! /0.0165! (0.0126)! /0.0053! (0.0079)! /0.0082! (0.0063)!
!! 0.2401! !! 0.1911! !! 0.5038! !! 0.1944! !!
r2! 0.1179! !! 0.0504! !! 0.0410! !! 0.1204! !!
!!
A.5.2.5. Liquidity&!
A.5.2.5.1. EU!TED!!
Liquidity! Top!30! Top!5! Top!10! Top!20!
SXXP/rf! 0.1995! (0.0826)! 0.0652! (0.1230)! 0.1295! (0.0966)! 0.2140! (0.0863)!
!! 0.0173! !! 0.5970! !! 0.1826! !! 0.0146! !!
EUTED! 1.1156! (0.4506)! 0.8665! (0.8886)! 1.0670! (0.5276)! 0.9604! (0.4810)!
!! 0.0147! !! 0.3315! !! 0.0454! !! 0.0482! !!
Intercept! /0.0002! (0.0030)! 0.0073! (0.0063)! 0.0036! (0.0041)! 0.0004! (0.0034)!
!! 0.9492! !! 0.2464! !! 0.3903! !! 0.8999! !!
R2! 0.1283! !! 0.0076! !! 0.0357! !! 0.1102! !!
!!
A.5.2.5.2. US!TED!!
Liquidity!US!TED! Top!30! Top!5! Top!10! Top!20!
SXXP/rf! 0.2073! (0.0808)! 0.1396! (0.1006)! 0.1500! (0.0854)! 0.2192! (0.0841)!
!! 0.0116! !! 0.1678! !! 0.0816! !! 0.0103! !!
USTED! 1.2115! (0.4571)! 2.2847! (0.9544)! 1.4143! (0.5869)! 1.0128! (0.5330)!
!! 0.0091! !! 0.0183! !! 0.0175! !! 0.0598! !!
Intercept! /0.0004! (0.0027)! 0.0003! (0.0058)! 0.0020! (0.0034)! 0.0004! (0.0029)!
!! 0.8804! !! 0.9597! !! 0.5508! !! 0.8905! !!
R2! 0.1309! !! 0.0445! !! 0.0495! !! 0.1098! !!
!! !! !! !! !! !! !! !! !!
!!( !
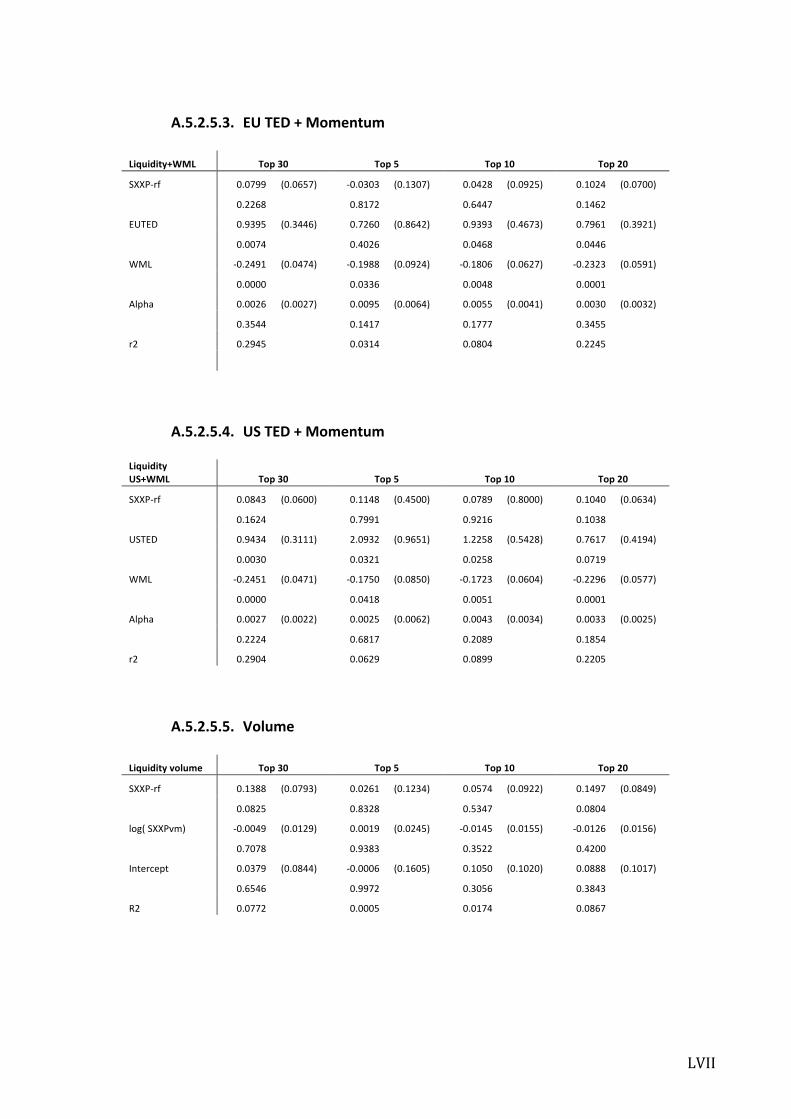
! LVII!
A.5.2.5.3. EU!TED!+!Momentum!!
Liquidity+WML! Top!30! Top!5! Top!10! Top!20!
SXXP/rf! 0.0799! (0.0657)! /0.0303! (0.1307)! 0.0428! (0.0925)! 0.1024! (0.0700)!
!! 0.2268! !! 0.8172! !! 0.6447! !! 0.1462! !!
EUTED! 0.9395! (0.3446)! 0.7260! (0.8642)! 0.9393! (0.4673)! 0.7961! (0.3921)!
!! 0.0074! !! 0.4026! !! 0.0468! !! 0.0446! !!
WML! /0.2491! (0.0474)! /0.1988! (0.0924)! /0.1806! (0.0627)! /0.2323! (0.0591)!
!! 0.0000! !! 0.0336! !! 0.0048! !! 0.0001! !!
Alpha! 0.0026! (0.0027)! 0.0095! (0.0064)! 0.0055! (0.0041)! 0.0030! (0.0032)!
!! 0.3544! !! 0.1417! !! 0.1777! !! 0.3455! !!
r2! 0.2945! !! 0.0314! !! 0.0804! !! 0.2245! !!
!! !! !! !! !! !! !! !! !!
!!
A.5.2.5.4. US!TED!+!Momentum!!
Liquidity!US+WML! Top!30! Top!5! Top!10! Top!20!
SXXP/rf! 0.0843! (0.0600)! 0.1148! (0.4500)! 0.0789! (0.8000)! 0.1040! (0.0634)!
!! 0.1624! !! 0.7991! !! 0.9216! !! 0.1038! !!
USTED! 0.9434! (0.3111)! 2.0932! (0.9651)! 1.2258! (0.5428)! 0.7617! (0.4194)!
!! 0.0030! !! 0.0321! !! 0.0258! !! 0.0719! !!
WML! /0.2451! (0.0471)! /0.1750! (0.0850)! /0.1723! (0.0604)! /0.2296! (0.0577)!
!! 0.0000! !! 0.0418! !! 0.0051! !! 0.0001! !!
Alpha! 0.0027! (0.0022)! 0.0025! (0.0062)! 0.0043! (0.0034)! 0.0033! (0.0025)!
!! 0.2224! !! 0.6817! !! 0.2089! !! 0.1854! !!
r2! 0.2904! !! 0.0629! !! 0.0899! !! 0.2205! !!
!!
A.5.2.5.5. Volume!!
Liquidity!volume! Top!30! Top!5! Top!10! Top!20!
SXXP/rf! 0.1388! (0.0793)! 0.0261! (0.1234)! 0.0574! (0.0922)! 0.1497! (0.0849)!
!! 0.0825! !! 0.8328! !! 0.5347! !! 0.0804! !!
log(!SXXPvm)! /0.0049! (0.0129)! 0.0019! (0.0245)! /0.0145! (0.0155)! /0.0126! (0.0156)!
!! 0.7078! !! 0.9383! !! 0.3522! !! 0.4200! !!
Intercept! 0.0379! (0.0844)! /0.0006! (0.1605)! 0.1050! (0.1020)! 0.0888! (0.1017)!
!! 0.6546! !! 0.9972! !! 0.3056! !! 0.3843! !!
R2! 0.0772! !! 0.0005! !! 0.0174! !! 0.0867! !!
!!!

! LVIII!
A.5.2.5.6. EU!TED!Quadratic!!
Liquidity!squared! Top!30! Top!5! Top!10! Top!20!
SXXP/rf! 0.1953! (0.0859)! 0.0669! (0.1304)! 0.1158! (0.1017)! 0.2127! (0.0907)!
!! 0.0249! !! 0.6090! !! 0.2573! !! 0.0207! !!
EUTED! 1.4547! (0.8725)! 0.7316! (2.1380)! 2.1711! (1.3263)! 1.0670! (0.9545)!
!! 0.0982! !! 0.7328! !! 0.1043! !! 0.2659! !!
EUTED^2! /16.1700! (41.5936)! 93.5859! (94.0060)! /52.6670! (53.7929)! /5.0880! (40.2444)!
!! 0.6982! !! 0.3216! !! 0.3296! !! 0.8996! !!
Intercept! /0.0011! (0.0034)! 0.0006! (0.0077)! 0.0007! (0.0047)! 0.0001! (0.0040)!
!! 0.7524! !! 0.9333! !! 0.8813! !! 0.9703! !!
R2! 0.1294! !! 0.0076! !! 0.0415! !! 0.1103! !!
!!
A.5.2.5.7. US!TED!Quadratic!!
Liquidity!US!squared! Top!30! Top!5! Top!10! Top!20!
SXXP/rf! 0.2161! (0.0853)! 0.1334! (0.1032)! 0.1514! (0.0885)! 0.2291! (0.0889)!
!! 0.0126! !! 0.1985! !! 0.0897! !! 0.0113! !!
USTED! 0.1754! (1.0884)! 3.0214! (2.9743)! 1.2515! (1.8594)! /0.1613! (1.2519)!
!! 0.8723! !! 0.3118! !! 0.5022! !! 0.8977! !!
USTED^2! 45.3000! (42.3287)! /32.2200!(127.1905)! 7.1210! (64.4434)! 51.3400! (44.8720)!
!! 0.2868! !! 0.8005! !! 0.9122! !! 0.2549! !!
Intercept! 0.0025! (0.0034)! /0.0017! (0.0095)! 0.0025! (0.0057)! 0.0036! (0.0038)!
!! 0.4662! !! 0.8550! !! 0.6615! !! 0.3394! !!
R2! 0.1382! !! 0.0454! !! 0.0467! !! 0.1173! !!
!!
A.5.2.5.8. EU!TED!1!month!lagged!!
Liquidity!F1! Top!30! Top!5! Top!10! Top!20!
SXXP/rf! 0.2028! (0.0910)! 0.0582! (0.1213)! 0.1226! (0.1017)! 0.2204! (0.0939)!
!! 0.0278! !! 0.6321! !! 0.2307! !! 0.0206! !!
EUTED! 1.6547! (1.1237)! /1.8026! (1.1429)! 0.3106! (1.2193)! 1.4134! (1.1609)!
!! 0.1436! !! 0.1175! !! 0.7994! !! 0.2259! !!
EUTED(/1)! /0.6090! (1.0028)! 3.0847! (1.5245)! 0.8376! (1.0717)! /0.4849! (1.0342)!
!! 0.5448! !! 0.0453! !! 0.4361! !! 0.6400! !!
Alpha! 0.0002! (0.0030)! 0.0050! (0.0066)! 0.0032! (0.0041)! 0.0005! (0.0036)!
!! 0.9563! !! 0.4475! !! 0.4417! !! 0.8884! !!
R2! 0.1278! !! 0.0356! !! 0.0129! !! 0.1118! !!
!!
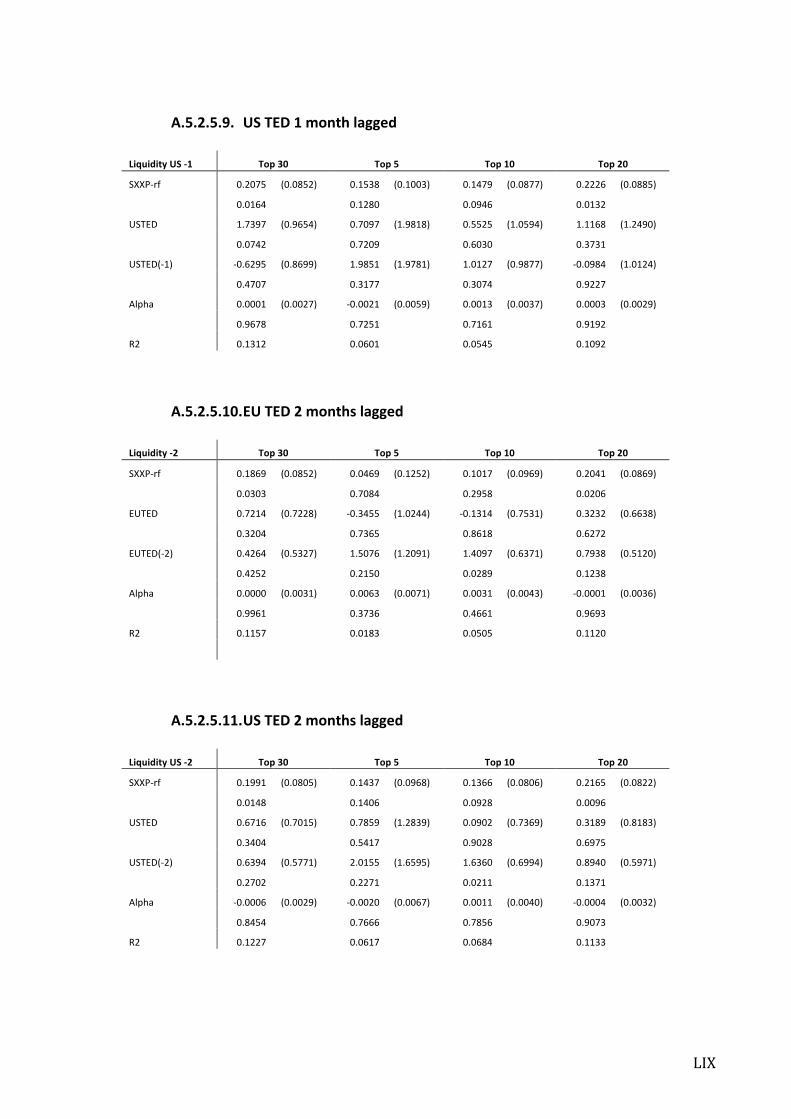
! LIX!
A.5.2.5.9. US!TED!1!month!lagged!!
Liquidity!US!F1! Top!30! Top!5! Top!10! Top!20!
SXXP/rf! 0.2075! (0.0852)! 0.1538! (0.1003)! 0.1479! (0.0877)! 0.2226! (0.0885)!
!! 0.0164! !! 0.1280! !! 0.0946! !! 0.0132! !!
USTED! 1.7397! (0.9654)! 0.7097! (1.9818)! 0.5525! (1.0594)! 1.1168! (1.2490)!
!! 0.0742! !! 0.7209! !! 0.6030! !! 0.3731! !!
USTED(/1)! /0.6295! (0.8699)! 1.9851! (1.9781)! 1.0127! (0.9877)! /0.0984! (1.0124)!
!! 0.4707! !! 0.3177! !! 0.3074! !! 0.9227! !!
Alpha! 0.0001! (0.0027)! /0.0021! (0.0059)! 0.0013! (0.0037)! 0.0003! (0.0029)!
!! 0.9678! !! 0.7251! !! 0.7161! !! 0.9192! !!
R2! 0.1312! !! 0.0601! !! 0.0545! !! 0.1092! !!
!!
A.5.2.5.10. EU!TED!2!months!lagged!!
Liquidity!F2! Top!30! Top!5! Top!10! Top!20!
SXXP/rf! 0.1869! (0.0852)! 0.0469! (0.1252)! 0.1017! (0.0969)! 0.2041! (0.0869)!
!! 0.0303! !! 0.7084! !! 0.2958! !! 0.0206! !!
EUTED! 0.7214! (0.7228)! /0.3455! (1.0244)! /0.1314! (0.7531)! 0.3232! (0.6638)!
!! 0.3204! !! 0.7365! !! 0.8618! !! 0.6272! !!
EUTED(/2)! 0.4264! (0.5327)! 1.5076! (1.2091)! 1.4097! (0.6371)! 0.7938! (0.5120)!
!! 0.4252! !! 0.2150! !! 0.0289! !! 0.1238! !!
Alpha! 0.0000! (0.0031)! 0.0063! (0.0071)! 0.0031! (0.0043)! /0.0001! (0.0036)!
!! 0.9961! !! 0.3736! !! 0.4661! !! 0.9693! !!
R2! 0.1157! !! 0.0183! !! 0.0505! !! 0.1120! !!
!! !! !! !! !! !! !! !! !!
!!
A.5.2.5.11. US!TED!2!months!lagged!!
Liquidity!US!F2! Top!30! Top!5! Top!10! Top!20!
SXXP/rf! 0.1991! (0.0805)! 0.1437! (0.0968)! 0.1366! (0.0806)! 0.2165! (0.0822)!
!! 0.0148! !! 0.1406! !! 0.0928! !! 0.0096! !!
USTED! 0.6716! (0.7015)! 0.7859! (1.2839)! 0.0902! (0.7369)! 0.3189! (0.8183)!
!! 0.3404! !! 0.5417! !! 0.9028! !! 0.6975! !!
USTED(/2)! 0.6394! (0.5771)! 2.0155! (1.6595)! 1.6360! (0.6994)! 0.8940! (0.5971)!
!! 0.2702! !! 0.2271! !! 0.0211! !! 0.1371! !!
Alpha! /0.0006! (0.0029)! /0.0020! (0.0067)! 0.0011! (0.0040)! /0.0004! (0.0032)!
!! 0.8454! !! 0.7666! !! 0.7856! !! 0.9073! !!
R2! 0.1227! !! 0.0617! !! 0.0684! !! 0.1133! !!
!!

! LX!
A.5.2.5.12. EU!TED!3!months!lagged!!
Liquidity!F3! Top!30! Top!5! Top!10! Top!20!
SXXP/rf! 0.1949! (0.0882)! 0.0796! (0.1348)! 0.1242! (0.1023)! 0.2071! (0.0894)!
!! 0.0292! !! 0.5562! !! 0.2271! !! 0.0223! !!
EUTED! 1.0252! (0.5691)! 1.2737! (1.4684)! 0.6608! (0.7387)! 0.7046! (0.5900)!
!! 0.0743! !! 0.3875! !! 0.3730! !! 0.2349! !!
EUTED(/3)! 0.1053! (0.4352)! /0.4765! (1.5325)! 0.6418! (0.6103)! 0.3336! (0.4842)!
!! 0.8093! !! 0.7564! !! 0.2952! !! 0.4923! !!
Alpha! /0.0002! (0.0033)! 0.0072! (0.0073)! 0.0023! (0.0045)! 0.0002! (0.0039)!
!! 0.9570! !! 0.3252! !! 0.6039! !! 0.9504! !!
R2! 0.1186! !! 0.0115! !! 0.0414! !! 0.1016! !!
!!
A.5.2.5.13. US!TED!3!months!lagged!!
Liquidity!US!F3! Top!30! Top!5! Top!10! Top!20!
SXXP/rf! 0.2023! (0.0865)! 0.1585! (0.1113)! 0.1493! (0.0902)! 0.2134! (0.0871)!
!! 0.0211! !! 0.1573! !! 0.1006! !! 0.0158! !!
USTED! 1.2239! (0.5516)! 2.9467! (1.6010)! 1.0220! (0.7088)! 0.7784! (0.6911)!
!! 0.0285! !! 0.0683! !! 0.1521! !! 0.2624! !!
USTED(/3)! /0.0677! (0.3717)! /0.7779! (1.5990)! 0.6007! (0.5983)! 0.2781! (0.4633)!
!! 0.8558! !! 0.6276! !! 0.3175! !! 0.5494! !!
Alpha! 0.0000! (0.0030)! 0.0002! (0.0066)! 0.0009! (0.0040)! 0.0004! (0.0033)!
!! 0.9914! !! 0.9791! !! 0.8131! !! 0.9029! !!
R2! 0.1207! !! 0.0557! !! 0.0538! !! 0.1000! !!
!!
A.5.2.5.14. EU!TED!4!months!lagged!!
Liquidity!F4! Top!30! Top!5! Top!10! Top!20!
SXXP/rf! 0.1558! (0.0816)! 0.0358! (0.1254)! 0.0848! (0.0968)! 0.1511! (0.0733)!
!! 0.0588! !! 0.7757! !! 0.3829! !! 0.0416! !!
EUTED! 0.5768! (0.5326)! 0.3792! (1.1214)! 0.2673! (0.6867)! 0.2440! (0.5565)!
!! 0.2811! !! 0.7359! !! 0.6978! !! 0.6619! !!
EUTED(/4)! 0.8847! (0.4881)! 1.0403! (0.8682)! 1.3921! (0.6649)! 1.1396! (0.5907)!
!! 0.0726! !! 0.2334! !! 0.0385! !! 0.0562! !!
Alpha! /0.0023! (0.0033)! 0.0035! (0.0073)! 0.0001! (0.0045)! /0.0021! (0.0038)!
!! 0.4838! !! 0.6264! !! 0.9748! !! 0.5774! !!
R2! 0.1307! !! 0.0185! !! 0.0692! !! 0.1177! !!
!! !! !! !! !! !! !! !! !!
!!

! LXI!
A.5.2.5.15. US!TED!4!months!lagged!!
Liquidity!US!F4! Top!30! Top!5! Top!10! Top!20!
SXXP/rf! 0.1709! (0.0830)! 0.1298! (0.1057)! 0.1199! (0.0880)! 0.1647! (0.0749)!
!! 0.0418! !! 0.2220! !! 0.1760! !! 0.0300! !!
USTED! 0.8112! (0.5485)! 2.0911! (1.2464)! 0.8518! (0.6587)! 0.4409! (0.6530)!
!! 0.1420! !! 0.0962! !! 0.1986! !! 0.5010! !!
USTED(/4)! 0.5385! (0.5014)! 0.5184! (0.9978)! 0.8821! (0.6468)! 0.7385! (0.5978)!
!! 0.2851! !! 0.6044! !! 0.1754! !! 0.2193! !!
Alpha! /0.0014! (0.0032)! /0.0024! (0.0066)! 0.0001! (0.0042)! /0.0008! (0.0034)!
!! 0.6627! !! 0.7121! !! 0.9852! !! 0.8170! !!
R2! 0.1073! !! 0.0515! !! 0.0555! !! 0.0852! !!
!!
A.5.2.5.16. EU!TED!5!months!lagged!!
Liquidity!F5! Top!30! Top!5! Top!10! Top!20!
SXXP/rf! 0.1378! (0.0762)! 0.0147! (0.1216)! 0.0712! (0.0954)! 0.1309! (0.0672)!
!! 0.0731! !! 0.9039! !! 0.4570! !! 0.0538! !!
EUTED! 0.3341! (0.4779)! 0.0674! (1.0683)! 0.2509! (0.6143)! 0.0038! (0.4551)!
!! 0.4859! !! 0.9498! !! 0.6838! !! 0.9934! !!
EUTED(/5)! 1.2098! (0.2995)! 1.3333! (0.6983)! 1.2397! (0.4824)! 1.4266! (0.2771)!
!! 0.0001! !! 0.0588! !! 0.0115! !! 0.0000! !!
Alpha! /0.0024! (0.0031)! 0.0045! (0.0072)! 0.0016! (0.0044)! /0.0019! (0.0037)!
!! 0.4487! !! 0.5292! !! 0.7185! !! 0.5973! !!
R2! 0.1597! !! 0.0233! !! 0.0595! !! 0.1453! !!
!!
A.5.2.5.17. !US!TED!5!months!lagged!!
Liquidity!US!F5! Top!30! Top!5! Top!10! Top!20!
SXXP/rf! 0.1534! (0.0744)! 0.1145! (0.0998)! 0.1046! (0.0829)! 0.1431! (0.0623)!
!! 0.0417! !! 0.2541! !! 0.2099! !! 0.0235! !!
USTED! 0.2482! (0.5106)! 1.6317! (1.1462)! 0.5532! (0.7270)! /0.2122! (0.5576)!
!! 0.6278! !! 0.1574! !! 0.4484! !! 0.7042! !!
USTED(/5)! 1.3851! (0.4027)! 1.0803! (0.7791)! 1.2203! (0.5869)! 1.7037! (0.4106)!
!! 0.0008! !! 0.1684! !! 0.0399! !! 0.0001! !!
Alpha! /0.0025! (0.0032)! /0.0021! (0.0068)! 0.0004! (0.0040)! /0.0019! (0.0034)!
!! 0.4367! !! 0.7532! !! 0.9129! !! 0.5801! !!
R2! 0.1683! !! 0.0559! !! 0.0674! !! 0.1597! !!
!!
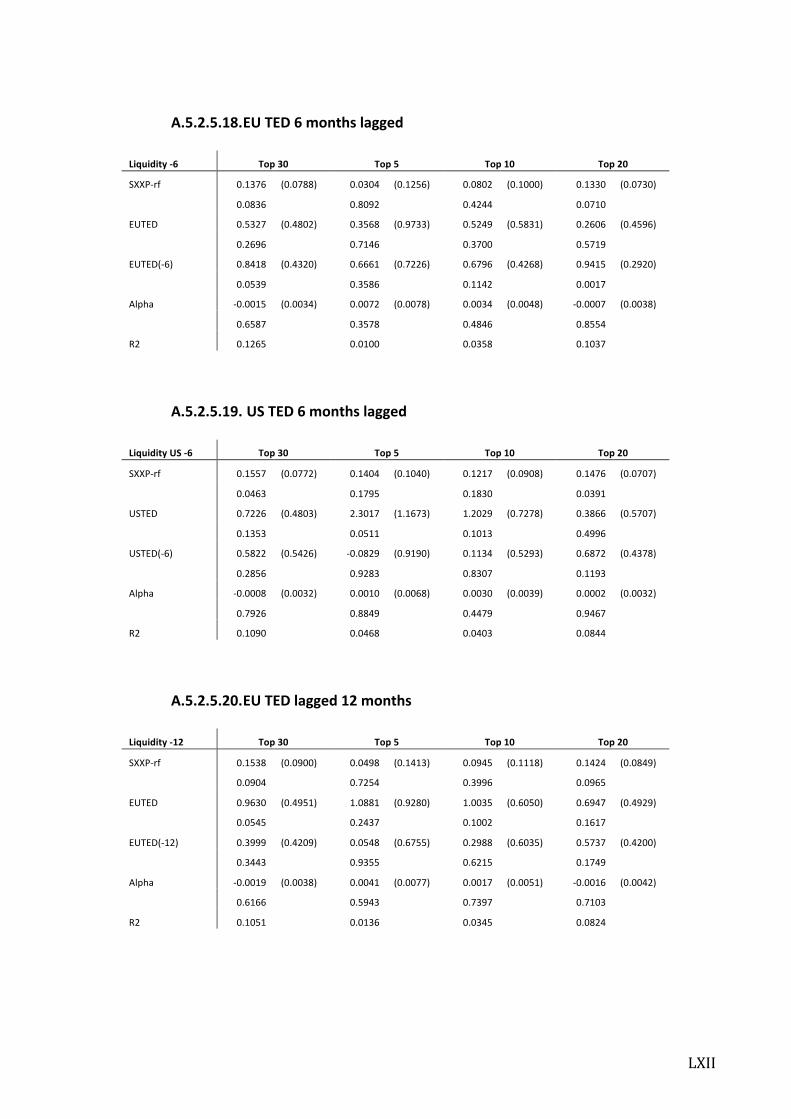
! LXII!
A.5.2.5.18. EU!TED!6!months!lagged!!
Liquidity!F6! Top!30! Top!5! Top!10! Top!20!
SXXP/rf! 0.1376! (0.0788)! 0.0304! (0.1256)! 0.0802! (0.1000)! 0.1330! (0.0730)!
!! 0.0836! !! 0.8092! !! 0.4244! !! 0.0710! !!
EUTED! 0.5327! (0.4802)! 0.3568! (0.9733)! 0.5249! (0.5831)! 0.2606! (0.4596)!
!! 0.2696! !! 0.7146! !! 0.3700! !! 0.5719! !!
EUTED(/6)! 0.8418! (0.4320)! 0.6661! (0.7226)! 0.6796! (0.4268)! 0.9415! (0.2920)!
!! 0.0539! !! 0.3586! !! 0.1142! !! 0.0017! !!
Alpha! /0.0015! (0.0034)! 0.0072! (0.0078)! 0.0034! (0.0048)! /0.0007! (0.0038)!
!! 0.6587! !! 0.3578! !! 0.4846! !! 0.8554! !!
R2! 0.1265! !! 0.0100! !! 0.0358! !! 0.1037! !!
!!
A.5.2.5.19. !US!TED!6!months!lagged!!
Liquidity!US!F6! Top!30! Top!5! Top!10! Top!20!
SXXP/rf! 0.1557! (0.0772)! 0.1404! (0.1040)! 0.1217! (0.0908)! 0.1476! (0.0707)!
!! 0.0463! !! 0.1795! !! 0.1830! !! 0.0391! !!
USTED! 0.7226! (0.4803)! 2.3017! (1.1673)! 1.2029! (0.7278)! 0.3866! (0.5707)!
!! 0.1353! !! 0.0511! !! 0.1013! !! 0.4996! !!
USTED(/6)! 0.5822! (0.5426)! /0.0829! (0.9190)! 0.1134! (0.5293)! 0.6872! (0.4378)!
!! 0.2856! !! 0.9283! !! 0.8307! !! 0.1193! !!
Alpha! /0.0008! (0.0032)! 0.0010! (0.0068)! 0.0030! (0.0039)! 0.0002! (0.0032)!
!! 0.7926! !! 0.8849! !! 0.4479! !! 0.9467! !!
R2! 0.1090! !! 0.0468! !! 0.0403! !! 0.0844! !!
!!
A.5.2.5.20. EU!TED!lagged!12!months!!
Liquidity!F12! Top!30! Top!5! Top!10! Top!20!
SXXP/rf! 0.1538! (0.0900)! 0.0498! (0.1413)! 0.0945! (0.1118)! 0.1424! (0.0849)!
!! 0.0904! !! 0.7254! !! 0.3996! !! 0.0965! !!
EUTED! 0.9630! (0.4951)! 1.0881! (0.9280)! 1.0035! (0.6050)! 0.6947! (0.4929)!
!! 0.0545! !! 0.2437! !! 0.1002! !! 0.1617! !!
EUTED(/12)! 0.3999! (0.4209)! 0.0548! (0.6755)! 0.2988! (0.6035)! 0.5737! (0.4200)!
!! 0.3443! !! 0.9355! !! 0.6215! !! 0.1749! !!
Alpha! /0.0019! (0.0038)! 0.0041! (0.0077)! 0.0017! (0.0051)! /0.0016! (0.0042)!
!! 0.6166! !! 0.5943! !! 0.7397! !! 0.7103! !!
R2! 0.1051! !! 0.0136! !! 0.0345! !! 0.0824! !!
!!

! LXIII!
A.5.2.5.21. US!TED!lagged!12!month!!
Liquidity!US!F12! Top!30! Top!5! Top!10! Top!20!
SXXP/rf! 0.1624! (0.0860)! 0.1313! (0.1106)! 0.1159! (0.0946)! 0.1483! (0.0786)!
!! 0.0619! !! 0.2380! !! 0.2232! !! 0.0619! !!
USTED! 0.9208! (0.4437)! 2.3818! (1.0246)! 1.1896! (0.6849)! 0.5726! (0.4807)!
!! 0.0404! !! 0.0220! !! 0.0854! !! 0.2363! !!
USTED(/12)! 0.6272! (0.4412)! 0.5172! (0.7942)! 0.6680! (0.7057)! 0.8456! (0.4885)!
!! 0.1581! !! 0.5164! !! 0.3460! !! 0.0864! !!
Alpha! /0.0025! (0.0037)! /0.0049! (0.0070)! /0.0008! (0.0042)! /0.0021! (0.0037)!
!! 0.5011! !! 0.4906! !! 0.8426! !! 0.5824! !!
R2! 0.1145! !! 0.0681! !! 0.0574! !! 0.0935! !!
!!