| RETURN TO Public Disclosure Authorized WVV'itT HIN 1 P … · The Banlk G,ounp does not ace-pt...
91
| RETURN TO REPORT DESK WVV'itT HIN U,l~T O~NE WEEK 1 P AITUM IIONAL BANK FOR RECONSTRUCTION NNe *i1'iTi3?T A PT A T T7 nEl' rT A OOCITAATIOiLou IN1E 1Rd¶'4A tII0'JINIiL Li.VE.Arv ILi O Ail J Not For piuhbir IM Te Report No. 165-IN SURVEY OF COMMERCIAL VEHICLE INDUSTRY INDIA A Background Paper in connection with the Appraisal of the Eighth Industrial Imports Credit May 16,j 197 3 Industrial Projects Department This report was prepared for official use only by the Bank Group. It may not be published, quoted of cited without Bank Grouinp authorLyation. The Banlk G,ounp does not ace-pt respoon-sb. f.t. ehnI accuracy or completeness of the report. Public Disclosure Authorized Public Disclosure Authorized Public Disclosure Authorized Public Disclosure Authorized
Transcript of | RETURN TO Public Disclosure Authorized WVV'itT HIN 1 P … · The Banlk G,ounp does not ace-pt...

| RETURN TOREPORT DESK
WVV'itT HIN U,l~TO~NE WEEK 1 P
AITUM IIONAL BANK FOR RECONSTRUCTION NNe*i1'iTi3?T A PT A T T7 nEl' rT A OOCITAATIOiLouIN1E 1Rd¶'4A tII0'JINIiL Li.VE.Arv ILi O Ail J
Not For piuhbir IM Te
Report No. 165-IN
SURVEY OF COMMERCIAL VEHICLE INDUSTRY
INDIA
A Background Paper in connection with theAppraisal of the Eighth Industrial Imports Credit
May 16,j 197 3
Industrial Projects Department
This report was prepared for official use only by the Bank Group. It may not be published, quotedof cited without Bank Grouinp authorLyation. The Banlk G,ounp does not ace-pt respoon-sb. f.t. ehnI
accuracy or completeness of the report.
Pub
lic D
iscl
osur
e A
utho
rized
Pub
lic D
iscl
osur
e A
utho
rized
Pub
lic D
iscl
osur
e A
utho
rized
Pub
lic D
iscl
osur
e A
utho
rized

Currency Equivalents as at Ma 11, 1973
1 US $ Rs 7.6*1 Rupee = US $ 0.131 Million Rupees US $ 132,000
* India has not yet declared a new par value following the devaluation ofthe US dollar. The Rupee is officially valued at a fixed Pound Sterlingrate; and, as the Pound is now floating relative to the US dollar, theUS dollar-rupee exchange rate is subject to change. Conversion in thispaper were made at Rs 7.9 to US $ which was the prevailing rate at thetime of preparation of this report.
Time Spans
The Indian Government financial year runs from April 1to March 31. In this report the financial years arewritten as, for example, 1972/73 designating the financialyear from April 1, 1972 to March 31, 1973.
Longer intervals of time are written as, e.g., 1970-72(two year interval), 1970-1978 (eight year interval).
Abbreviations
TELCO - Tata Engineering and Locomotive Co.DGTD - Directorate General of Technical DevelopmentCKD - Completely Knocked-Down UnitSKD - Semi-Knocked-Down UnitAU License - Actual User import license (issued to
manufacturers based on established levelof consumption, not transferable)
REP - Import Replenishment Entitlement (importlicense issued to exporter, total valuein any year is based on percentage ofexport (sales)
SURVEY OF COMMERCIAL VEHICLE INDUSTRY
INDIA
TABLE OF CONTENTS
Page No.
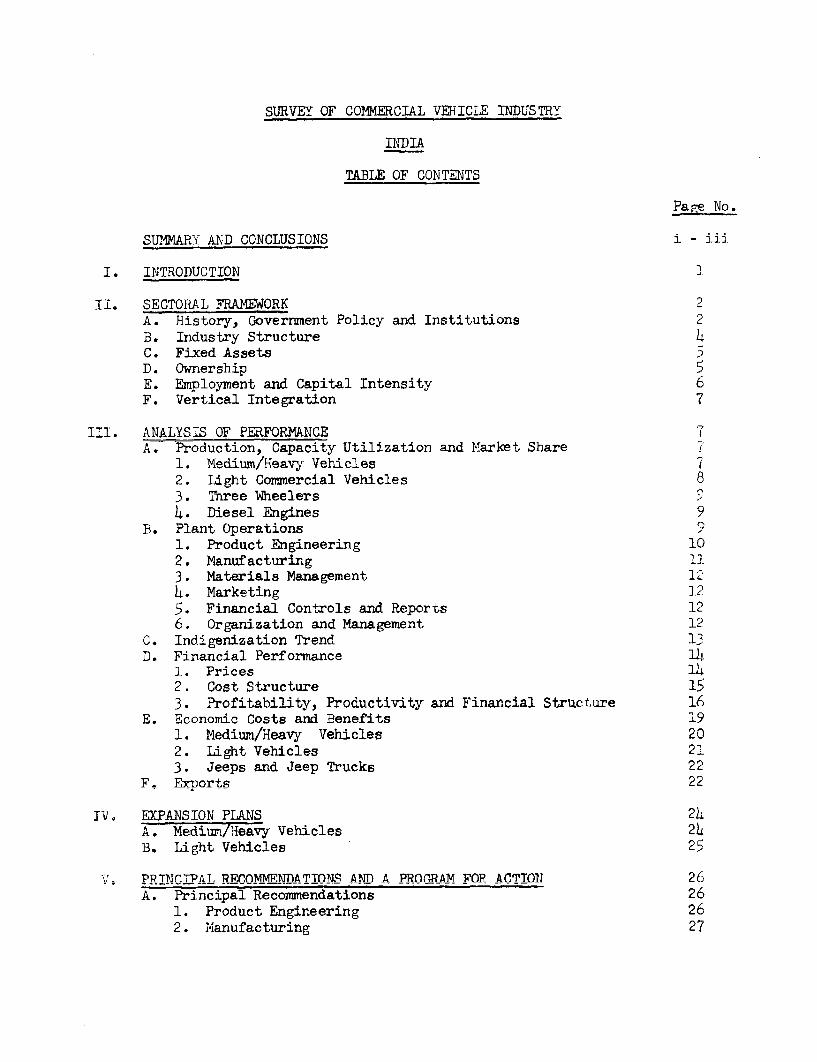
SUMMARY AND CONCLUSIONS i -
I. INTRODUCTION 1
II. SECTORAL FRAMEWORK 2A. History, Government Policy and Institutions 2B. Industry Structure 4C. Fixed AssetsD. OwnershipE. Employment and Capital Intensity 6F. Vertical Integration 7
III. ANALYSIS OF PERFORMANCE 7A. Production, Capacity Utilization and Market Share I
1. Medium/Heavy Vehicles 72. light Commercial Vehicles 83. Three Wheelers 94. Diesel Engines 9
B. Plant Operations r
1. Product Engineering 102. Manufacturing I3. Materials Management 124. Marketing 125. Financial Controls and Reports 126. Organization and Management 12
C. Indigenization Trend 13D. Financial Performance 14
1. Prices 142. Cost Structure 153. Profitability, Productivity and Financial Struecture 16
E. Economic Costs and Benefits 191. Medium/Heavy Vehicles 202. Light Vehicles 213. Jeeps and Jeep Trucks 22
F. Exorts 22
TV. A FPANSTON PLANS 2LA . Medium/Heavy Vehicles 2BR. T.ight VahicleR 25
PpRTMrTPAT. RERMMMFMlATTOUR ANM A PROr'RAM FOR AGTTON 26A. Principal Recoimmendations 26
1. Product Rnginreering 26
2. M7ianufacturing 27
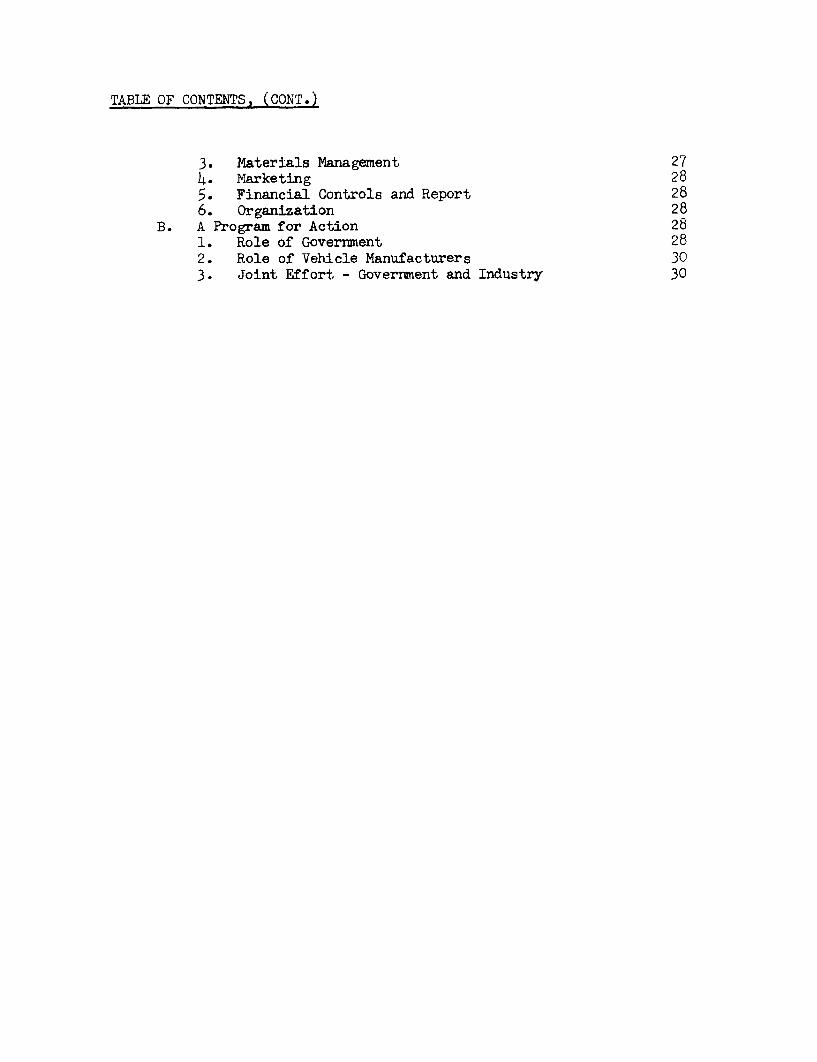
TABLE OF CONTENTS, (CoNT.)
3. Materials Management 274. Marketing 285. Financial Controls and Report 286. Organization 28
B. A Program for Action 281. Role of Government 282. Role of Vehicle Manufacturers 303. Joint Effort - Government and Industry 30

Annex 1/
1 Vehicle PonunIt1inn 19 4R-19722 Demarcation of Component Production by Ancillaries
3 Note on Indian Export Promotion Incentives4 World Truck and Bvs Produceion rk%iy rompa^ 19Q655 Licensed Capacity, Installed Capacity and CaDacity
TTHiliz,atio n - Meedium/heav y Conm.aerclal Vehicles,1964-1979
6 Licensed CapacIty, Installed Capacity and CapacItyUtilization - Light Commercial Vehicles and Jeeps1966-79
7 Plant Operations Rating SystemR Progressc of TnAdigemn^,, Contont-
9 Foreign Exchange Requirements10 Fir.ancial Data and AnlysIs11 Economic Analysis12 E Mr Ma:ke Stutr - Sources uEyo LoJ)an
Destination (countries)13 DomestIc 1r-ces, Ex-dou r and nReai zatIon
Commercial Vehicles, 1971/7214 xoLrs o Uf Co,-[U,eIrcIalI _ Vehicles andU Components, 19' 115 Export Performance of Manufacturers, 1969-197216 Demand Forecast17 Actual and Projected Production, 1964-1979
Map Locations of Commercial Vehicle Manufacturers
! Additional data is contained in a separate report entitled: India,Commercial Vehicle Sector, General Appraisal (Vol. 1) and India,individual Truck Manufacturers, General Appraisal (Vol. 2) datedJanuary 15, 1973 and prepared by Raymond E. Danto Associates, Inc.,Detroit, U.S.A., consultants. Tne consultants! report is availablefrom Mr. Goderez of the Industrial Projects Department on special re-quest only and since it contains confidential data on each of thecommercial vehicle manufacturers its use is restricted to authorizedpersonnel within the Association and Indian Government officials.


SURVEY OF COMMERCIAL VEHICLE INDUSTRY
INDIA
SUMMARY AND CONCLUSIONS
J. Silnce 1964, the International Development Association (IDA) hasextended seven credits to India totalling US$680 million for the import ofmaterials, components, spares and some balancing equipment for selected in-dustrial sectors. The purpose of these credits has been to increase capacityutilization and operating efficiency and reduce manufacturing cost by helpingto provide a timely flow of needed imported inputs at competitive world prices.In its past appraisals, -DA had given about equal attention to each of the 5to 12 industrial sectors variably covered but these appraisals were evidentlynot sufficiently detailed to allow meaningful recommendations on specificmeasures regarding sectoral policies and improvement of industrial performance.To achieve this goal it was recognized that more intensive sectoral surveyswere required; consequently this report on the Indian Commercial Vehicle In-dustry is the first of a series of surveys that IDA intends to undertake inclose cooperation with the Indian Government in the course of the next fewyears.
ii. The commercial vehicle industry, one of the highest priority sec-tors in India, has been included in every IDA industrial imports credit for acumulative allocation of about US$139 million, equal to 20.47 of the totalcredits granted. Prior to 1952, production was based entirely on the assemblyof imported components. In the relatively short period of 20 years, the in-dustry has converted to indigenous production and today only 8 to 10% of theex-factory price of a vehicle corresponds to foreign exchange cost of directimports. During the same 20 year period, production in terms of numbers ofvehicles grew at an average annual rate of 18% and current production is about60,000 per year in all vehicle sizes; by 1978/79 annual production is prolectedto reach 100,000. Gross product value currently amounts to Rs. 2 billion perannum (US$255 million) and accounts for about 8% of the total production ofengineering goods in India.
iii. There has also been an encouraging beginning in exports of vehiclesand parts which have increased from virtually nothing in the mid-1960's to anestimated Rs. 150 million (US$20 million) in 1972/73 and are expected to growfurther to Rs. 300 million by 1978/79. Over the last few years exports aver-aged 5.5% of gross product value and have earned about half of the foreignexchange expended in direct imports. It is worth noting that if indigenousdeep-draw steel sheets were available domestically, this industrv would alreadybe earning more foreign exchange than needed for direct imports.
iv. While the efficiency of the industry has imnroved, Indian trurksare still priced 10 to 20% higher than foreign models if ex-factory prices arecompared. This price handicap and the eenerally outmoded designs of Indiantrucks have been major constraints inhibiting export growth. Exports dependon cash and other incentives to comnensate for the 30 to 35 price discount(below domestic f.o.b. vehicle prices) at which exports must be made to placeorders and even then epnorts are on the whole limited to special trading sit-

--4 -r
uations where bilateral agreements and Indian export credit are able to inducebuyer acceptance. Nevertheless, compared to the opportuni;ty cost of Lorelgnexchange, such exports are economic. A further increase in cash incentiveswould not be economically justified and therefore only those incentives andmeasures should be considered which contribute to reduction in manufacturingcosts and improved product quality.
v. The performance of the sector in terms of efficiency of piant op-erations, capacity utilization, earnings and financial strength, degree ofinternational competitiveness both in quality and price and export performance-a_ries widely among the manufacturers. For example, while capacity utilizationof the industry is 71%, this average hides the fact that in the medium/heavyvehicle range, TELCO, the largest and most efficient manufacturer, is operatingat 104% of installed capacity and Hindustan Motors, the least efficient produc-er, at only 8%. Other manufacturers are operating between 60 and 80% of capa-city. TELCO also accounts for more than 70% of the industry's exports. Profitsbefore taxes and interest varied from 7 to 17% of total capital employed in1971/72 and have been increasing at modest rates since 1969 when prices weredecontrolled. However, since finished vehicle prices have risen at a slowerrate than the cost of external inputs (bought-out materials and parts), it maybe concluded that overall plant efficiency -- measured by labor and capitalproductivity -- has generally improved.
vi. Despite the sector's past growth and other achievements, there issubstantial room for improvement. Only TELCO and Bajaj Tempo have successfullybeen implementing a methodical plan of expansion and improvement based on com-petent management and adequate resources, but even these relatively efficientmanufacturers could better their performance in certain functional areas. Allother firms, especially Hindustan Motors and Simpson (the latter the only in-dependent producer of engines) need considerable overall improvement, particu-larly in product planning and engineering, manufacturing methods, marketing,financial controls and corporate organization and capabilities. Improvementin plant operations is the area where a major effort is required and whereimportant cost reductions could be rapidly achieved.
vii. In castings, forgings and machined components and assemblies forthe vehicle industry. India appears to be already internationally competitivein price and quality, at least among a number of more efficient ancillary pro-ducers. There is a worldwide shortage of these comoonents and large vehiclemanufacturers in developed countries are searching the world for new sources.With organized promotion, it should be feasible to develon significant exnortsales of Indian components to the developed countries. A longer range buteqnutll fpeasble goal wtould he to tepn tin exnnrts of nmnlpete vehicles tounderdeveloped countries parallel with a drive to increase operational effi-ciency and reducesa nots. neveunnitna count-rieq, -with onditinns szimilar to
India's -- overloading of vehicles, substandard roads and severe climate -- area natural market for Tndian uehicles whirh Aar kno.nn to be able to stand upwell to extraordinary stresses.

- iii -
viii. The Government has accepted proposals for a program of action to
improve plant operations with a view to help accelerate the development of the
industry and export growth. Main responsibility for the action program must
rest with the vehicle manufacturers. The Government's contribution to the
program would consist of policy and procedural measures; these would involve
marginal liberalization of import licensing, support in establishing overseas
trade development centers to foster exports of components, and more liberal
interpretation of the rules governing foreign collaboration agreements and
technical assistance contracts.


I. INTRODUCT1UION
1.01 In May 1972, in presenting the Seventh Industrial Imports Projectin India, the Executive Directors of the International Development Association(IDA) were informed that IDA, in close cooperation with the Indian Government,would thenceforth carry out intensive surveys of the priority sectors that hadbeen receiving assistance under the Association's industrial import credits.The purpose of these surveys would be: (a) to establish in the Bank a betterunderstanding of sectoral problems, constraints and potential for growth and(b) to suggest possible remedies for improvement of industrial performance.
1.02 In its past appraisals, IDA gave equal emphasis to each of the 5to 12 sectors variably covered by the seven credits approved between 1964 and1972. This approach has adequately served the purpose of producing whatmight be termed macro-evaluations of acceptable depth for the sectors. But ithad also become increasingly apparent that meaningful recommendations on morespecific measures affecting sectoral policies and industrial performance wouldhave to be supported by more reliable data and more incisive analysis. Fur-thermore, since it was clearly beyond the capacity of any reasonably-sizedmission, time schedule or budget to undertake intensive surveys of severalsectors simultaneously it was recognized that a new appraisal methodology wasrequired.
1.03 The appraisal of the Eighth Credit therefore was implemented intwo steps: (a) an intensive survey of the commercial vehicle and agriculturaltractor industries, two categories deemed of high priority, and (b) a reapprais-al of the remaining IDA industries based on a limited field survey and theupdating of performance data. In each future appraisal, it is planned tosurvey intensively one or two of the other IDA industries, so that in a cvcle ofthree to four years all will have been appraised in depth. This report reviewsthe commercial vehicle industry. 1/
1.04 Essential to the successful imnlementation of the intensive reviewwas the need to incorporate in it a higher level of technical expertise thanhad been the nrantiep in nrior missions. After cnnsiAdratinn of a nmber of
international consulting firms, the services of R.E. Danto Associates, Inc.Of Detroit (USA) were contracted. The company's evnertricp res-ts on lnng year
of experience in operations and management plus consulting services to leadingtrurk and trantor manufactuirern in the TJ=S= anti ahroad.
1.05 The renoret /- reflecr.s the findings of the mission 1n Tndia in
September/October 1972 which consisted of Messrs. Goderez (Chief) andIskander of the Indtrl e De_artmentnd.Rindn- atnl Po - n- ent nA -- P nnt a
D. Rowe, consultants. It is based on a comprehensive questionnaire returnedby1 all -om nrcial *re'h4icle ma -nufturers -ror to t h te- arrival of the m.issior
in India; visits to all major and most of the smaller plants; and discussionswith company managements a.d Goverr-met officials. A short follow-up mission
1/ A similar survey for the agricultural tractor industry is attached tothe President's Report.
2/ This report was prepared by Messrs. Goderez and Iskander of the IndustrialProjects Department.

- 2 -
took place in January 1973 to fill some data gaps but more importantly to re-view with the Government the major findings and recommendations for action ofthis report, to which the Government reacted favorably. The excellent coop-eration extended to the mission by Government officials and company managementsand staff is highlv appreciated! without the indiemnous i.puts,amanngfulreport could not have been prepared.
TT, SCETOR.41. FRXI..EWRK
A. History, Government Policy and Institutions
2.01 Manufacture of commercial vehicles in India is of rather recentorigir.; until tshe early- .19°50's the industLy was subst LantLIa'L'Ly an assemblLoperation importing partially or completely knocked down (CKD's) units orfinished -eh_4cles. imp;or-s in all fo.-msL were tabout 9 ,500 vehicles in i95i,the year in which the Government decided to establish indigenous manufactureo-f vehi4cles. At the -'me there were 12 vehicle assembly piants in india ofwhich only two (Hindustan Motors and Premier Automobiles) had progressed tothe point of local manufacture of some com,lponents. In 1953 the Governmentdecreed that all firms without a definite timetable for progressive domesticmanufacture of components should cease operations and declared the productionof commercial vehicles a priority industry. 11 The remaining producers weregiven suLfficient foreign exchange to meet their tooling needs. Furthermore,to offset the increases in cost anticipated with domestic production of partsand componients, tne Government lowered the duties on some items still permittedto be imported.
2.02 By 1956 there were seven surviving manufacturers of commercialvehicles and one manufacturer of diesel engines; of these, four produced trucksof medium to heavy range (5 tons and above), and one each produced light com-mercial vehicles, jeeps and jeep trucks and three-wheelers. As a result ofthe Government policy of restricting imports and promoting local manufacture,indigenous production increased rapidly to about 20,000 vehicles in 1956/57with a local content of about 50%.
2.03 Following the foreign exchange crisis of 1956/57, import controlswere intensified and imports of parts and components were banned whenever theGovernment was satisfied that adequate domestic capacity existed. Productionfell by about 7% in the following year (1957/58). Because of unsatisfied de-mand, price controls and vehicle allocations were instituted. This situationpersisted until 1964/65 when production reached 46,000 vehicles. The recessionof the mid-sixties, however, put an end to the seller's market, production
1/ Priority industries are listed in the annual publication "Import TradeControl Rules and Procedures" and are entitled to more favorable treatmentthan non-priority industries under licensing regimes. In 1972/73. thiscategory was comprised of 59 industries, including all IDA sectors.

-3-
stagnated and some tirms which had been selling poor quality products suffereda marked decline in demand. It was not until 1970/71 that production and de-mand recovered to pre-recession levels.
2.04 Production in all sizes including 3-wheelers was reported at 57,400vehicles in 1971/72 and estimated at 62,900 for 1972/73, implying an annualrate of growth of 18% over the last two decades. Though still small by U.S.and European standards, the Indian market for commercial vehicles is the secondlargest in Asia, next to Japan, and fourth among the developing countries afterBrazil, Spain and Argentina. The registered number of commercial vehicles hasrisen from 128,000 in March 1951 to an estimated 565,000 at the end of 1971/72broken down as follows: trucks - 340,000; buses - 100,000; jeeps - 87,000
and three-wheelers - 38,000 (Annex 1).
2.05 During the last two decades the principal instruments used by theGovernment to promote industrial development have been the industrial licensingand import licensing regimes. Failure to meet targets for "indigenous content"could result in significant delays or refusal of license applications for im-ports of parts and materials. During the 1960's indigenous production of ve-hicle components started in virtually all categories. The pressure towardsincreased indigenization, however, initially led vehicle manufacturers to under-take in-house production of parts contrary to the intent of the Governmentwhich was to encourage production by ancillary plants.
2.06 In 1965, the Government formalized its policy of encouraging growthand diversification in the ancillary industries by restricting a series of itemsto production only by ancillaries (subject to considerations of quality, deli-very and price) while permitting other items to be produced by both ancillariesand vehicle manufacturers (Annex 2). Vehicle manufacturers already producinggoods reserved to the ancillary industry could continue operations but werenot permitted to expand. These policies -- import restrictions (banned list)tngether with the list of nroducts reserved to the ancillaries -- providedstrong protection to potential entrants into the automotive ancillary industryand rapidly increased the indigenous content of commercial vehicles from about50% in the mid-1950's to close to 100% in the early 1970's (disregarding im-port content of botught-out ancillary components and materials).
2.07 iultanisly, in the 1960's the Government began to encourageexports through a number of incentive schemes. Until the 1966 devaluation,these consisted of import entitlements and direct tax concessions,, both tied
to export performance. Following the devaluation, new incentive schemes wereintroduced t1 including duty drwback; cash assistance; import replenishmententitlements; supply of steel at international prices; and sales tax exemption.The drawback system is a cash payment designed t-o compensatP firms for customqand excise duties paid on its inputs and averages about 12-16% of the f.o.b.value of th1e exportedAvehicle. Cash assistance re-resents a payment eqlual to
a specified percentage of the f.o.b. value of exports. It is meant 2/ to"comer.sat-e exports flor the te-.,porar; han.d caps th-at ste-" from transT tional
1/ Export incentives are briefly described in Annex 3.2/ Export Policy Resolution 1970, para. 14, page 7.
-4-
difficulties iniherent in a developing economy and to alleviate the disadvantages
arising from India's fiscal policies or tariff barriers in developing countries".
The rates of cash assistance are 251% for commercial vehicles and 20% for jeeps.
Import replenishment entitlements (REP's) are special import licenses issued
to the exporter in addition to the Actual Users import licenses; for commerc-'l.
vehicles REP's are issued in an am,ount equal to 20% of the f.o.b. value of
exports. The advantages of the REP's over Actual Users licenses are: (1)
free foreign exchange (Actual Users licenses are primarily issued against bi-
lateral credits); (2) somewh4at less riaiditv in applying the constraints of
the banned list; (3) transferability within the same industrial sector;
REP's can com ^nd a premium of about 50% of the nominal value when sold.
B. ILrdustry Structu,-e
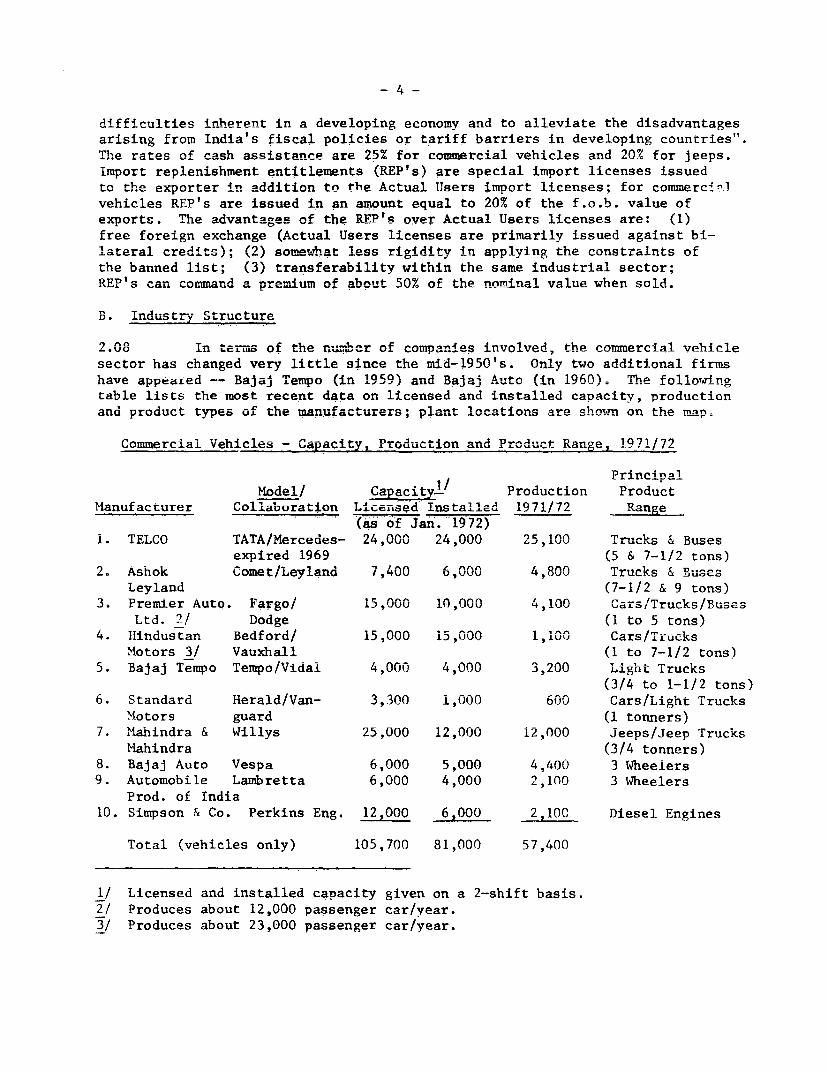
2.08 In. term of the nuiMber of com.anies involved, the rcommercial vehicle
sector has changed very little since the mid-1950's. Only two additional firms
have appeared -- Bajaj Temtpo (in 1959) and Ba4aJ Auto (in 1960) Tb. follosirn
table lists the most recent data on licensed and installed capacity, production
and product types of the manufacturers; plant locations are shown on the mqp.
Commercial Vehixcles - Capacity, Production and Product Range, 1971/72
Principal
Model/ Capacity! Production Product
Manufacturer Collaboration Licensed Installed 1971/72 vae
f Jan. 1972)
i. TELCO TATA/Mercedes- 24,000 24,000 25,100 Trucks & Buses
expired 1969 (5 & 7-1/2 tons)
2. Ashok Comet/Leyland 7,400 6,00u 4,800 Trucks & Buses
Leyland (7-1/2 & 9 tons)
3. Premier Auto. Fa go/ 15,000 10,000 4,100 Cars/Trucks/Buses
Ltd. 2/ Dodge (I to 5 tons)
4. Hindustan Bedford/ 15,000 15,000 1,100 Cars/Trucks
Motors 3/ Vauxhall (1 to 7-1/2 tons)
5. Bajaj Tempo Tempo/Vidal 4,000 4,000 3,200 Light Trucks(3/4 to 1-1/2 tons)
6. Standard Herald/Van- 3,300 1,000 600 Cars/Light Trucks
Motors guard (1 tonners)
7. Mahindra & Willys 25,000 12,000 12,000 Jeeps/Jeep Trucks
Mahindra (3/4 tonners)
8. Bajaj Auto Vespa 6,000 5,000 4,400 3 Wheelers
9. Automobile Lambretta 6,000 4,000 2,100 3 Wheelers
Prod. of India10. Simpson & Co. Perkins Eng. 12,000 62000 2,10C Diesel Engines
Total (vehicles only) 105,700 81,000 57,400
1/ Licensed and installed capacity given on a 2-shift basis.
2/ Produces about 12,000 passenger car/year.3/ Produces about 23,000 passenger car/year.

- 5 -
Excludina diesel enaines, total nroduction in 1971/72 of 57,400 units renre-sented an ex-factory value estimated at about Rs. 1,940 million, accountingfor 8% of all engineering goods pnrduction in the organized sector (Rq 25,nn0million) and about 2.7% of all industrial production. With the exception ofTELC0, which accounts for over 40% of the total output (in nu mbers) and Ma-hindra & Mahindra with 20% of the total, the scale of operations is very small
Fy developed count.Lty standards Aex 4).
2.09 The npay.load range of co.merciai vehicles has changed o tim-
Up to 1955 almost the entire fleet consisted of light trucks of up to 3-toncapacity, but between 1955 and 1965 demand shited to 5-t-on (medium.., and si.c
then to 5-7-1/2 ton trucks. Both because of the shortage of trucks and therapidly increasing Uurde, ol taxes andu levies that t-he IndA4an road transport
system has to bear, overloading is common. Trucks generally run at load levelsabout 25/o above uianufacturersU recuLLuLenUat.Lons and often higher. Ll..e resultingwear and tear, further aggravated by sub-standard road conditions, makes majoroverhauls necessary at much shorter iLnterLva'Ls than 'Ls the practiLce iLn developUeudcountries and truck life is reduced. Trucks and buses are mainly diesel powered(85%o or ene total production) and are prouuceu in Uothi 4 X 2 and 4 A 4 drive
versions. Total installed capacity and production for 1971/72 for the varioustypes of vehicles are summarized below from Annexes 5 and 6.
Installed Capacity and Production by Vehicie Type, 1971/72
Type Installed Capacity ProductionMedium/Heavy Vehicles 55,000 67.9% 35,100 61.2%Light Vehicles 7,000 8.6% 4,600 8.0%Jeeps 10,000 12.5% 11,200 19.5%Three Wheelers 9,000 11.0% 6,00 11.3%
Total 81,000 100.0% 57,400 100.0%
C. Fixed Assets
2.10 For the automobile and commercial vehicle sector combined, fixedassets totalled nominally about Rs. 1,300 million (US$163 million) in December1971, of which Rs. 350 million were in buildings and Rs. 950 million in machinesand equipment. No separate figures are available for commercial vehicles, butit is estimated that fixed assets devoted to commercial vehicle manufacturewere about Rs. 900 million (US$117 million). This figure underestimates thereal market value of the assets, partly because of price increases which haveoccurred since investment and partly because much of the investment in thecommercial vehicle industry took place from 1954 to 1964 prior to the 1965 de-valuation. Total capital employed in the commercial vehicle industry is esti-mated at about Rs. 1,600 million, of which Rs. 900 million is fixed capitaland Rs. 700 million working capital.
D. Ownership
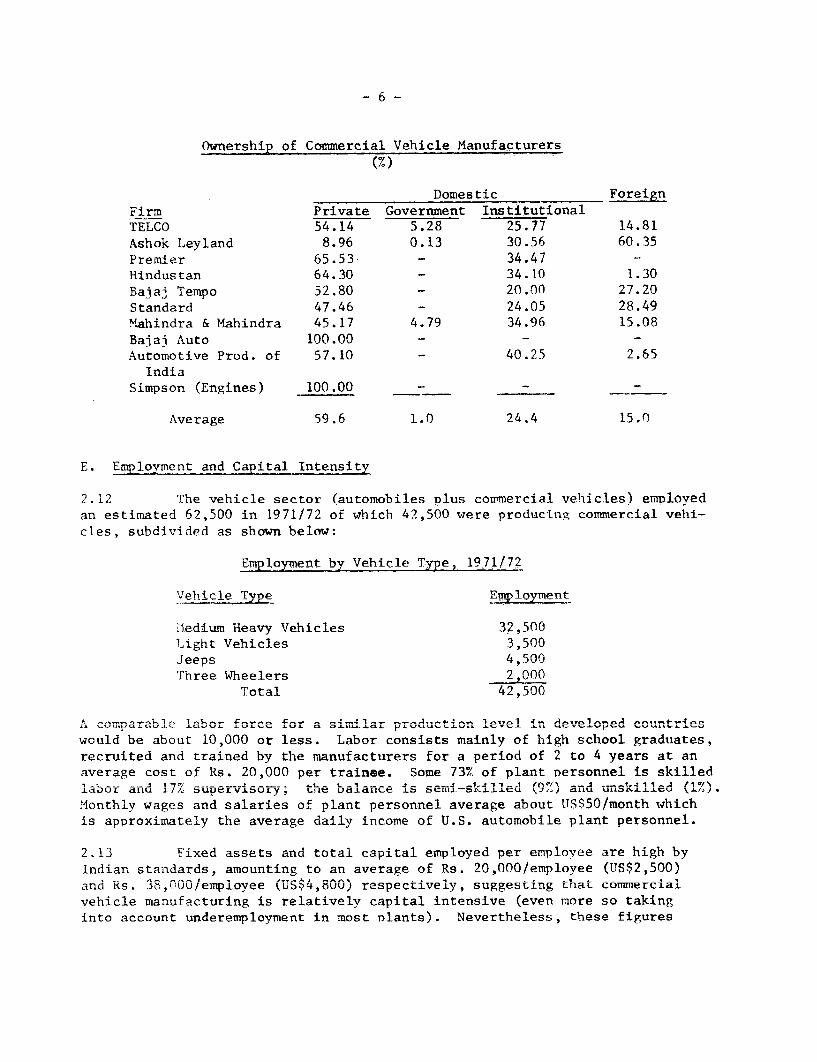
2.11 Equity participation in the commercial vehicle sector is about 85%domestic and 14% foreign with the former subdivided into 60% private, 1%government and 24% institutional (banks and insurance companies) as shown inthe following table:
- 6 -
Ownership of Commercial Vehicle Manufacturers
Domestic ForeignFirm Private Government InstitutionalTELCO 54.14 5.28 25.77 14.81Ashok Leyland 8.96 0.13 30.56 60.35Premier 65.53 - 34.47 -Hindustan 64.30 - 34.10 1.30
Bajaj Tempo 52.80 - 20.00 27.20Standard 47.46 - 24.05 28.49Mahindra & Mahindra 45.17 4.79 34.96 15.08Bajai Auto 100.00 - - -Automotive Prod. of 57.10 - 40.25 2.65
IndiaSimpson (Engines) 100.00 - - -
Average 59.6 1.0 24.4 15.0
E. Employment and Capital Intensity
2.12 The vehicle sector (automobiles Dlus cormercial vehicles) employedan estimated 62,500 in 1971/72 of which 42,500 were producing commercial vehi-cls. subdivided as shown below:
Emoloyvment bv Vehicle Tvne. 1971/72
V-h i r 1 t Tvny Emnl nvmPnt
.iediu m Heavy IT eh icl 32,50nLight Vehicles 3,500Jeeps 4,500Three Wheelers 2,000
Total! 42,500
, coumparable labor Iforce for a sim41.lar prodution level- in dvle4tiwould be about 10,000 or less. Labor consists mainly of high school graduates,recruiLteA an' tralr,el ly -le ,-,nufacturers 'or a perG d 40A 2 to 4 years al. anaverage cost of Rs. 20,000 per trainee. Some 73YO of plant personnel is skilledlabor and 17% supervisory; the balance s semi-skilled (9%) and unskilled (1%').Monthly wages and salaries of plant personnel average about US$50/month whichis approximately the average daily income of U.S. autoiLobile plant prUsoUnUl.
2.I3 tixec assets ana total capiLa; emnployeu per emplUyee arle hgu byIndian standards, amounting to an average of Rs. 20,000/employee (US$2,500)and Rs. 38,00/employee (US$4,800) respectively, suggesting that commercialvehicle manufacturing is relatively capital intensive (even more so takinginto account underemployment in most Diants). Nevertheless, these figures

- 7 -
are only 15 to 20% of the corresponding figures in developed countries. Thefixed asset/employee ratio ranges from Rs. 12,000 in the light commercial ve-hicle sector to Rs. 18-19,000 in the medium/heavy with the exception of Hindu-stan Motors where it is Rs. 35,700. The high figure for Hindustan is an ano-maly, reflecting the extremely low capacity utilization of that company.
F. Vertical Integration
2.14 The degree of vertical integration, as indicated by the ratio ofmaterials plus bought out parts over sales (excluding excise tax), has notchanged in the last three years and ranges from 0.66 for TELCO to 0.75 forAshok Leyland 1/. This range of ratios is comparable to those of commercialvehicle manufacturers in develoned countries where the dearee of verti-a-1lintegration averages about 0.64.
TTT ANATLYSTS OF PERF'ORMA1NCE
A. Production, Capacity Utilization and Market Share
1. Medium/Heavy Vehicles
3.01 The following table summarizes the trends in production, capacityutilizatior. and rmaket share of the four medium/heavy commwercial vehicle manu-facturers since 1964/65 (Annex 5):
Production, Capacity Utilization and Market Share, 1964-1972
Production(Nunbers) Capacity Utilization(%) Mkt. Share (%)J1764/J 197I/7/ I964/6D 9I7//1; 19O64/65 i97l/72
TELCO 16,100 25,057 89 104 51.4 71.5Ashok Leyland 3,800 4,769 60 75 12.1 13.6Premier Automobiles 6,000 4,075 100 68 19.1 11.6Hindustan Motors 5,400 1,141 52 8 17.3 3.3
Total 31,300 35,042Index UV h0/ 1I1
3.* 02 Production stagnated during the second half of the 1960's but in-creased substantially following the economic recovery at the end of that period.Since 1970/71, however, growth has again levelled off and preliminary production
1/ For the other producers, the ratio is Hindustan 0.69; Premier 0.69 andlight commercial vehicles 0.72. The higher the ratio isj the lower thethe degree of vertical integration.
2/ Base year 1964/65 index = 100.. official production figures were deflatedto reflect only production and do not include assembly of imported CKD's.
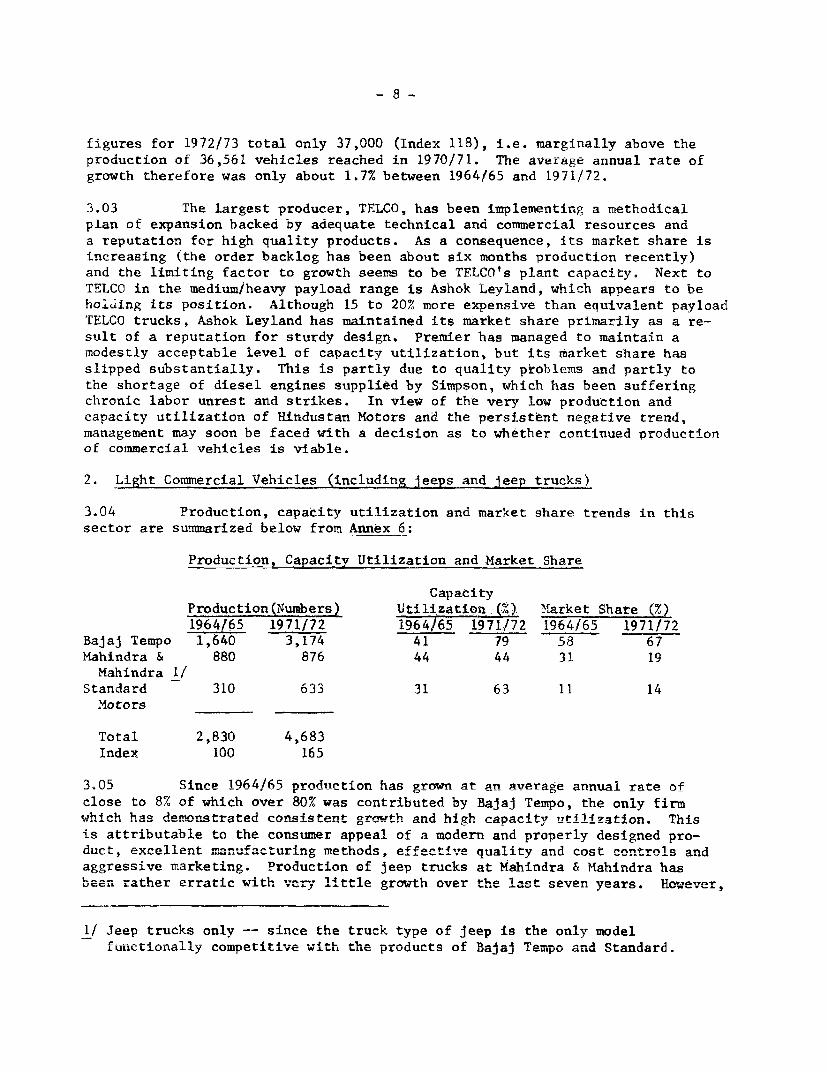
figures for 1972/73 total only 37,000 (Index 118), i.e. marginally above theproduction of 36,561 vehicles reached in i970/711. mne average annual rate of
growth therefore was only about 1.7% between 1964/65 and 1971/72.
3.03 The largest producer, TELCO, has been implementing a methodicalplan of expansion backed by adequate technical and commercial resources anda reputation for high quality products. As a consequence, its market share isincreasing (the order backlog has been about six months production recently)and the limiting factor to growth seems to be TELCO's plant capacity. Next toTELCO in the medium/heavy payload range is Ashok Leyland, which appears to beholding its position. Although 15 to 20% more expensive than equivalent payloadTELCO trucks, Ashok Leyland has maintained its market share primarily as a re-sult of a reputation for sturdy design. Premier has managed to maintain amodestly acceptable level of capacity utilization, but its market share hasslipped substantially. This is partly due to quality problems and partly tothe shortage of diesel engines supplied by Simpson, which has been sufferingchronic labor unrest and strikes. In view of the very low production andcapacity utilization of Hindustan Motors and the persistent negative trend,management may soon be faced with a decision as to whether continued productionof commercial vehicles is viable.
2. Light Commercial Vehicles (including jeeps and jeep trucks)
3.04 Production, capacity utilization and market share trends in thissector are summarized below from Annex 6:
Production, Capacity Utilization and Market Share
CapacityProduction(Numbers) Utilization m(.), Market Share (%)
1964/65 1971/72 1964/65 1971.172 1964/65 1971/72Bajaj Tempo 1,640 3,174 41 79 58 67Mahindra & 880 876 44 44 31 19
Mahindra i/Standard 310 633 31 63 11 14
Motors
Total 2,830 4,683Tndex 100 165
3n05 S1nre 1964/65 nrndait-l on has grown at an average annual rate ofclose to 8% of which over 80% was contributed by Bajaj Tempo, the only firmwhich has demonstrated consistent growth and high ca-acitv utilizatlon. Thisis attributable to the consumer appeal of a modern and properly designed pro-duct, excellent m-nufacturitng methods, effective quality ar. cost controls and
aggressive marketing. Production of jeep trucks at Mahindra & Mtahindra haslbeen. rathLer erratic wit-h ver-. 14ttle gr5 th over t1.e last seven years. Hw ever,
1/ Jeep trucks only -- since the truck type of jeep is the only model
Lurict'LorLaLLLy comUpetiLtiLve wiLLth Use proLducts of Bajaj Tem,po andA' Standard.

- 9 -
production and capacity utilization figures for jeep trucks along present adistorted picture of company size and performance since there is a good dealof functional and component substitutability between jeeps -- the malor product --and jeep trucks. Capacity utilization figures for the conbined productionhas averaged a high 97% over the last three years and production has increasedfrom 8,000 in 1968/69 to 12,000 in 1971/72, the latter valued at Rs. 230 million(US$33 million) or 12% of the gross product value of the industry. Productionat Standard Motors has been quite erratic mainly as a result of labor problems.
3. Three Wheelers
3.06 There are only two companies, Bajaj Auto and Automobile Productsof India, together licensed to mAnufacture 12,0Q0 three wheelers of which in-stalled capacity is 9,000 at present. Annual production has increased from4.700 in 1968/69 to 6,500 in 1971/72 and an estimated 8,000 in 1972/73. Util-ization of capacity was 72% in 1971/72, having risen from 59% in 1968/69 and1970/71. Gross nroduct value was reported as Rs. 37 million (US$5 m4llIonN) in1971/72 as against Rs. 25 million in 1968/69 and accounts for less than 2% ofgross nrndu-t value of the comnercial vehicle sector.
4. Diesel Enaineqs
3=n7 There is or.e indeper.det m-nufacturer of diesel eng4nes used Intrucks and buses, Simpson Co., licensed to manufacture 12,000 Perkins engineswith an installed capacity of 6,000 units at present. Simpson suJp'les en-gines to Premier (the only vehicle manufacturer without in-house engine pro-duction facilIties) and TAFE (tractors) in the range of 3510r to 120 !1P.Utilized capacity was a low 43% in 1971/72 having fallen from 46% in 1968/69an.d 53Y% 4,, 'L. T.he if'Lri-u'UsUpoor performa,ce 18 attributUable to antiquatedproduction methods, poor management and poor labor relations.
B. Plant Operations
3.08 Evaluation of plant operations was carried out by the consultants.The performance oI the major firms in seven major functional areas of plantoperations as well as the average sector performance are given in the table
L1 . A A~ 1~ below. A Uetailed description of the functional areas and the rating systemis given in Annex 7.

- 10 -
Summary Performance Ratings of the Six Major Vehicle Manufacturers(percent)
Bajaj Mahindra &TELCO Ashok Premier Hindustan Tempo Mahindra Average
Prod. Engineering 77 38 43 15 88 32 -49Manufacturing 87 51 79 29 89 35 62Materials Management 88 58 75 20 90 23 59Marketing 75 39 25 26 78 25 45Parts & Service 100 57 50 32 79 43 60Financial Controls and
Reports 54 26 49 21 86 29 44Organization 90 56 59 33 89 34 60
Overall 82 46 58 26 85 33 55
3.09 In the following paragraphs, the principal features of operatingperformance are discussed. By necessity, a summary of this sort cannot do morethan touch on the differences in performance between individual manufacturers,which -- as the above table demonstrates -- varies widely. Detailed descriptionsof each manufacturer's performance is given in the consultants report.
1. Product Engineering
3.10 Product engineering, including vehicle and engine design, stylingand product planning are on the whole deficient by world standards with twoexceptions - TELCO and Bajaj Tempo. The truck lines of the latter are wellengineered, suitably styled and economical to manufacture and with the growingscale of production should soon be competitive in export markets. TELCO's pro-ducts are quite good both as to functional design and economv of manufacturingin the context of the Indian market, but require updating if export marketpenetration is to be accelerated. Basic vehicle designs for the other manufar-turers, on the other hand, are substantially out of date. For the most partthese vehicles lack eye appeal; driver comfort and comnetitive nerfnrmancp rhar-acteristics and are costly to manufacture and operate.
3.11 Engine development lags seriously behind the needs of the domesticas well 2S the pmnrt market. Most engines are out of date arnd some are ex-cessively costly to build and maintain. Only Bajaj Tempo is regarded as havinga fully suitable en-4ne All d4esel -owee trucks -roduced in India aregrossly underpowered, based on generally accepted ratios of gross vehicle weightto engine (cylinder) dIsplacementJ- Taking in-…- acour.t a'-^ th -- al- pracice
of over-loading beyond the recommended payload, the two factors together resultin excessive wear, bre -qA owns nd costly ove.-hauls a- muchL more fLreque. inter-valsthan normal by modern standards.
3.12 Product planning, which is concerned with the design and developmentofl products to meet cLear'Ly defifned cost ar,d markACetir.g VobUJ CL.LVC, Uoes nOL
exist in India as an organized effort although TELCO and Bajaj Tempo are develop-ing capaDiiLities Li this area. Detailed stuLes of manufacturing costs and tnemost appropriate manufacturing methods, including standardization of materials,

- 11 -
are not generally carried through when preparing to produce a new, or substan-tially modified, product or part. Investigation of material or component sub-stitutions to reduce cost, improve performance or ease procurement problems isnot generally practiced. Competitive vehicles are not disassembled to identifyopportunities to cut costs and improve performance. Little attention is givento assessing customer needs and preferences as a guide to developing newmodels.
2. Manufacturing
3.13 Vehicle manufacturing in India, in general, compares favorably withsimilar activities in the U.S. and Canada. The commercial vehicle industrv isvirtually self-sufficient except for deep-draw sheet steel and a relativelysmall number of special materials and comnonents. Production builaings nre nfup to date design and the overall layout of most truck plants is good, althoughin some cases improper location of one or more nroduction departments giveSrise to unnecessary and time-consuming material handling and additional in-processinventorv. Buildines are generallv well maintained nnd wilt-h the nx-AntAn nfHindustan Motors and Mahindra & Mahindra, housekeeping is good to excellent.Material handling systemc have not kept pace with increased production and 4Sapparently not yet recognized as a major production cost factor. Improperhandling of gears and other highly mnchined parts, contribute to higher thanwarranted rejection rates.
3.14 Plants are generally well equipped considering current productionlevels and cost consdr io with a roximtely half of the metal workigr,
machines made in India. Most machines are single purpose and are deemed suit-ahlp fnr riiurrnt prodtiont, inn A pou4 .o M ei4-, -an vol.. -- of. pro=
duction. However, cutting speeds and rates could be increased in most machining.orin. Most of Idia's truck manufactur g plants re under=utilized
even considering the normal work period of two shifts per day and six days aweek. Underutilization can be attri-buted in a-large -l-a-uL Lo poor -c-e-ulLg,
inadequate floor supervision, shortages of parts and electric power and to alesser Aegree to Ineffie- plant la-yout, poor product accepLaLice (a majorfactor in at least one case) and some weaknesses, or inexperience, in general
mangemMnrt .n,ni oan osn J_
3.15 The qu a4.Lty ofJL most tLUk proUUUceU Ld I LL.dia, partLiu.Larly that Of
TELCO and Bajaj Tempo, is good. On the whole, quality control is given ade-quat attLeto but there is some 'uoseness in the systems of tabulating andreporting quality defects in a timely manner. Such systems are essential toreduce the LatdLtofl time and eliminate defects berore ratner than arter thefact. Bad castings are a major source of quality problems and in some plantsthey do not seem to be identified until after costly macnining. Generally,the relatively large number of "finished" vehicles observed in the repairareas at some plants suggests that both in-process inspection and assemblysupervision need strengthening.
- 12 -
3.16 Possibly the weakest function in the broad area of manufacturingis personnel relations. Only TELCO, Bajaj Tempo and Premier appeared todemonstrate appropriate concern for employee welfare. The apparent indifferenceto legitimate employee welfare objectives in other plants may be a root causeof labor unrest. Training programs, on the other hand, are generally ratedhigh. Many of those trained by truck manufacturers have moved to the automo-tive ancillary industries and are in large part responsible for the rapiddevelopment of India's mechanical industries, particularly metalworking.
3. Materials ianagement
3.17 Materials management, which is concerned with procurement, storageand inventory control, usually is not assigned to a single executive in India'struck companies. Partly as a consequence of diffused responsibility, inventoriesof raw and in-process materials tend to be higher than warranted, even takinginto account typical procurement difficulties. Because qualified supply sourcesare limited, the buying function in this industry is largely an ordering pro-cedure and too little attention is being paid to prices and delivery schedules.However, the more efficient manufacturers (who are also the larger customers)are rating suppliers on price, delivery and quality and this is having a salu-tary effect on the entire ancillary industry. These efforts bv the manufactur-ers still have limited impact because in many categories competition is minimumor absent and the supplier is in a stroneg "seller's market" position.
4. Marketing
3.18 Because at present truck demand is far ahead of supply in Indiathe marketing function is virtually non-existent and is largely limited to or-der nrncessina. With the excention of TELCO and Baiai Tempo. there are also
deficiencies in the distribution of spare parts and repair services and littleeffort seems tn he devnted tn deaeAr development- Virtually no attemnt i9 heingmade to systematically develop exports, with the exception of TELCO which isplanning l0ng ri"an penetration nf three In-rape ovPreQas mnrket - Egvnt
Nigeria and Indonesia - based on assembly line production in those countries.
5. Financial Controls and Reports
3.19 All truck companies are handicapped in varying degrees in achievingMax4m, ut-lizatior, of mApower an.d e Mi p m- absennce of varlable-
volume budgeting and a system of action-oriented reports on performance thatare accuratte, til y zn- -- A co-e,a i. *rU- 4nds.--t. overal rating i.n thU
critical area is the lowest of all categories evaluated (44X).
6. Organization and Management
3.20 Deficiencies in organization are reflected in the problems discussedabove. The major organization/structural deficiencies include (1) the non-existence of, or the low priority given to, important positions or functions;(2^) the failure to group together related functions and operations; and (3)the failure to clearly assign duties and responsibilities. Although it wasnot in the missionTs terms of reference to evaluate key personnel they were

- 13 -
Jugel to le comarable in com-e-en.ce and perfo,mance to their cour.terpartsJ U L.I u ~ C&~U.L~ A.L LIUL LCLL LU L~ _LLl~LL~ L.LLL A- L.LJ.LL~L~L
in North America and Europe. Most of the operational problems noted appearto be due priMarily to inadequate organiZation planning rather than to iL-competent management. 1/
C. Indigenization Trend
3.21 The impressive production growth rate averaging 18% over the lastdecace nas Deen paraiieiea Dy an equally remarkable growth in indigenous con-tent, 2/ shown in the table below (Annex 8):
Growth of Indigenous Content, 1962-1971
Vehicle Type i96i/62 i964j65 i970/7i
Truck, BusesTELCO 67.0 86.0 98.5Ashok Leyland 43.3 81.5 97.7Premier 74.0 88.2 99.8Hindustan 60.9 73.9 93.0
Jeeps 59.0 90.0 98.0Three Wheelers 59.0 86.5 97.4Diesel Engines 70.0 87.5 97.5
3.22 The figures given above do not include materials imported by thevehicle manufacturers or the import content of components purchased from theancillary industries (Annex 9). If these inputs were to be included, the"true" indigenous content would drop to about 85%. A major item in the 15%of total imported value is deep-draw steel sheet and if domestic productionwere able to supply the demand, the indigenous content figure would rise toover 90% which is probably very close to the maximum economic level.
1/ In Chapter V, recommendations on action needed to overcome the operational~~~~U,tcu e AM thi S=_ _V 4arte S--111a i e . .M_Jw_- WzLL-LL&L..L> ULJ.Uat:U 1&L WLL.L b~LUVL a, bLu1J1~ ±I.«tu.
21 "Indigenous content" is defined by the government as the foreign value ofsez-fiL.Lnished anud 'L'u.sUdU cUUminuuie.± WILLCLI are prLoUUUCeU UUd L.±caly, ex-pressed as a percentage of the ex-factory price of the equivalent foreignvehicle. It is expressed mathematically as 1 - m/p where m is the ex-ractoryforeign value of imported components and p is the ex-factory foreign price ofthe vehicle. import of raw materials are not included in m because it is notpart of the manufacturers responsibility to produce his own raw materials.Furthermore, m does not include the import of finished and semi-finished ma-terials used by the ancillary industry. -This a manufacturer that buys a largeportion of its components from domestic suppliers will show a very high levelof indigenous content even though the impore content of his suppliers might behigh. Indigenous content was so defined to give"every encouragement to manu-facturers to buy components from outside ancillaries". To the extent that the"indigenous content" does not take into account direct imports of raw materialsand indirect import of materials and components by suppliers, it tends to over-state the foreign exchange savings.
- 14 -
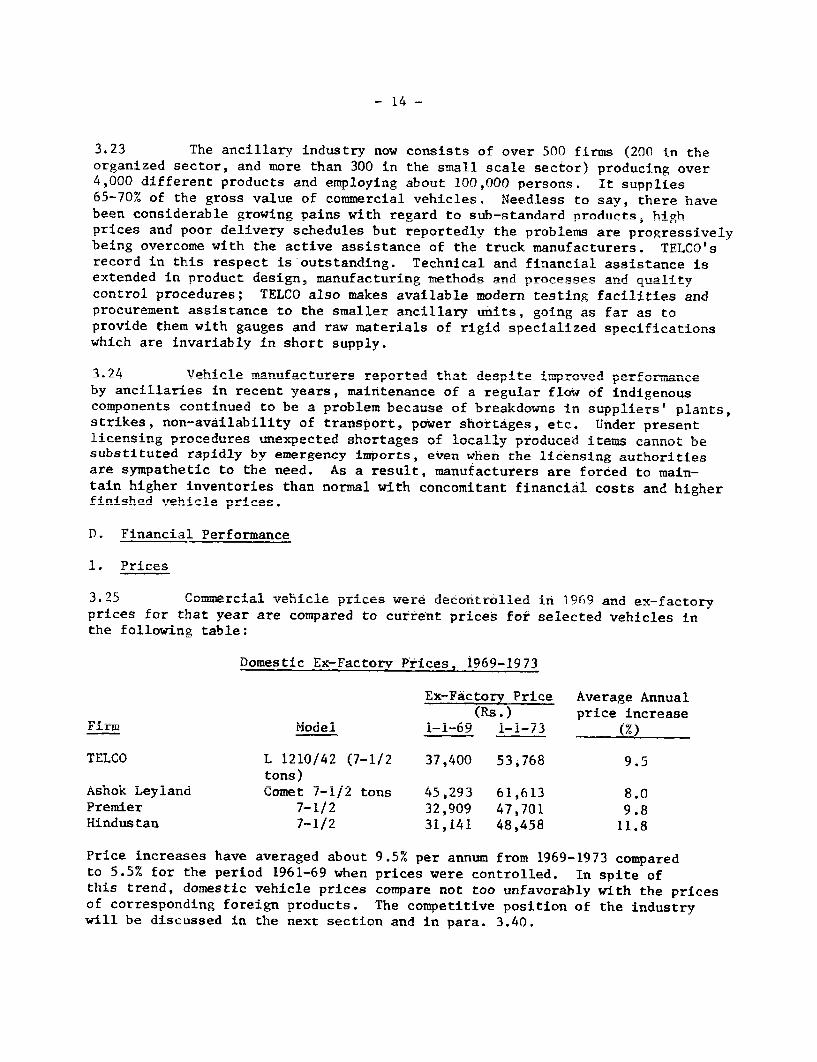
3.23 The ancillary industry now consists of over 500 firms (2n0 in theorganized sector, and more than 300 in the small scale sector) producing over4,000 different products and employing about 100,000 persons. It sunnlies65-70% of the gross value of commercial vehicles. Needless to say, there havebeen considerable growing pains with regard to sub-standard nrodunts, highprices and poor delivery schedules but reportedly the problems are progressivelybeing overcome with the active assistance of the truck manufacturer8 TFT CO'srecord in this respect is outstanding. Technical and financial assistance isextended in product design, manufacturing methods and nrocesses and qntilitycontrol procedures; TELCO also makes available modern testing facilities andprocurement assistance to the smaller ancillA- uni ts, going as far as toprovide them with gauges and raw materials of rigid specialized specificationswhich are invariahlv in shnrt .- PnPly
3.24 Vehirle maniuffane-rs rpeprted tha.t- dpite 4 -proved performanceby ancillaries in recent years, maintenance of a regular flow of indigenouscornonents continued to be a problem be-use of brea'-Aw..S 4; nsuppliers' plants,strikes, non-availability of transport, power shortages, etc. Uinder presentlicensing procedures unexp-ected shortages of locally produced i'tem can-lot besubstituted rapidly by emergency imports, even when the licensing authoritiesare svymnthotir tn the need. Asaresult, manufacturers are forced to main,-tain higher inventories than normal with concomitant financial costs and higherfinizh.ede .yliehlcl rcs
D. Finrancial Performance
1. Pr4ces
5Commercial vehicle prces were decontrolled in i1969 and ex-factoryprices for that year are compared to current prices for selected vehicles in
lom-iesti c Ex-Factory Prices, 1969-1973
Ex-Factory Price Average Annual(Rs.) price increase
Firm Model 1-1-69 1-1-73 (%)
TELCO L 1210/42 (7-1/2 37,400 53j768 9.5tons)
Ashok Leyland Comet 7-1/2 tons 45,293 61,613 8.0Premier 7-1/2 32,909 47,701 9.8Hindustan 7-1/2 31,141 48,458 11.8
Price increases have averaged about 9.5% per annum from 1969-1973 comparedto 5.5% for the period 1961-69 when prices were controlled. In spite ofthis trend, domestic vehicle prices compare not too unfavorably with the pricesof corresponding foreign products. The competitive position of the industrywill be discussed in the next section and in para. 3.40.

2. Cost Structure
3.26 The table below compares the cost structure of the more efficientIndian producers with the best available estimate of comparable foreign pro-ducers:
Comparison of Indian and Foreign Cost Structure
Domestic Cost Foreign CostBreakdown Breakdown
(%) (%)Bought-out(a) Materials 10 - 33 n.a.(b) Components 65 - 33 n.a.
Total Bought-out (average) 71 64
Labor (direct and indirect) 10 - 14 15 - 22Other Expenditures 3 - 6 4 - 6Depreciation 2 - -5 5 - 7Interest 3 - 6 3 - 4Profit before Tax 4 - 8 6 - 10
Average Conversion 29 36
Total 100 100
The essential differences between the Indian and foreign cost structure are:(i) external innuts- basiatllv materials and comnonents, are nabnt 10 higherin India, and (ii) conversion cost (value added) is about 20% lower. If theforeign rnat breAkdownm wuere adJusted to reflect theo '-.n% lower f .o.b priceof foreign vehicles, however, the differences in terms of actual foreigncurrency or equivalenrt r-ee costs tould be reduced by 5-10Zv.
327 Matp l AiMlervals, ma4n1y steel,- are pronnred rthrtuih Hinfiictan Steel
(HSL). Manufacturers reported that their supply of steel is adequate and,even. during the-n 0naseso g ir. 197071 , no firm experIenced anysignificant slowdown in production because of the shortages. On the averageprices of IndTia.n anrd i4nort steeal arae a.bout nq1 A large nwmbe.ar of compo
nents are already competitively priced. These are usually made of steel andhave a hbi4gh abnr content, e. . castng forn r_r.gs, machined parts A.A C-.df
injection pumps. On the other hand, prices of proprietary items such asAn1nQe_4nn1n ke.. 5 .4at A O A F4 _An A) _. 2 4 -4 _,A k J.- s 4-ks 4 S5 E;t. XXr4cals, batteries an. tAireOS are 2 Lt *VJ Xt8ime as hiL911L aO tLhe c.. * vL*. prLcs0
of comparable imports primarily because of high cost of raw materials and the'Low sca.le oli operaLoC LsLPA. fl0U LLLL Iou LtiLCtL O UIpLCI aii3.9C1.. LII LUa 1 Jo -I±I.lwsale of oprLi.-. L)gt=u ir,d'L.Lnger.ous co,..or.ents ra-L.ge from lOfo highrerthan c.i.f. for TELCO to 30% higher for Bajaj Tempo. The relatively lower costLiLgure Lor TEL,CO ib UUe PdLL±. LU Lil .arLgeL scale operations of the ancillaryproducers developed by TELCO who supply both the original equipment demand(2J5UU0 truckrs/year) and the replacement market (j;5,000 urucks on tne road),and partly because of TELCO's bargaining power vis-a-vis suppliers. The premium

- 16 -
of 30% paid by Bajaj Tempo would be even higher were it not for the company'sstrategy of maintaining multiple sources of supply to induce competition andguard against disruption of operations. Relative to the low scale of operations,30% is a reasonable premium and testifies to the success of the firm's procure-ment strategy.
3. Profitability, Productivity and Financial Structure
3.28 The principal indicators of financial performance for the commercialvehicle producers over the past three years are shown on the following page.Aaior trends are briefly summarized below and are supported by the detaileddata in Annex 10.
3.29 Profitability as related to sales has deteriorated somewhat forall vehicle producers except for Balai Tempo wqhich showed a strong gain. Therehas been a definite improvement, however, in the return on capital, which, withthe exception of Hindustan and Premier, is good by Indian standards. The lossrate at Premier is decreasing but Hindustan's profitability remains rather poorand. indeed; would have to be renorted as a loss if full deDreciation were tobe charged. The growth in profitability was achieved despite an average annualincrease of 16% for raw materials and 10% for items bought from ancillarv in-dustries compared to only a 7-10% annual increase in comrmercial vehicle prices.This indicates that nlant efficiencies are fmnrovingn At rates that m-re thancompensate for the rise in prices of external inputs. Also part of the priceincrasqes are eip ton nrtdti-t- inrovements- eopeninl1v at TETGC0
3.30 ''na117tin0 of 2ssets as meaiired hv r2t40sn of valuep qeAr overtotal capital employed and fixed assets respectively, has generally increased
improved. Despite the significant improvement at Hindustan, primarily as aresult of increased production of passenger cars, its performance as a co0ercialvehicle manufacturer has remained extremely poor. Some further gains can beexpected 4n the coming years by i..creasin.g producto4n at Ashok 1e al T -. A -r,d
Bajaj Tempo, but for firms which have already reached their rated capacity (TELCO& at..fllA c '. a.o,~t,..t ,- -it. JJla .. .LLJA iVt&pA W. L.± A. iCVt L. isntny Li.LUIn
more efficient production methods.
3.31 Labor productivity as measured by value added (at constant prices)per eployee las increased by between5 o Jh for hind1UUstLanLU Ji. 5 ur 1TLU overthe last two years. The sharp increase in TELCO's labor productivity can beexplained by the intensive training given by that company. In spite of theincrease in value added per employee for all firms, only two, TELCO and BajajTempo, 'nave experienced an increasea in value added per rupee of iabor.

INDIASELECTED FINANGLAL PER]FORMANCE INDICATORS OF
('CQ0MERCIAL VEHICLE MANUFACTURERS - 1969-1972
Mahindra &TELCO Ashok Leyland Premier _ Hindustan Mahindra _laja; Tenmo
1969 1972 1969 1'972 1969 1972 1969 1972 1969 1972 1969 1972
Sales (Rs. million) 963.0 1,479.0 3365.1 339*5* 306 3 382.5* 468.6 642.8 275.1 367.7* 46.4 63.2*
Profit before Tax, Rs. millionr, (loss)58.2 75.5 18.5 20.4* (71.1) (67.(\)* 12.3 11.1 8.2 10.4 i.0 5.40
Profit before Tax as; % of Sales 6.0 5.l 7.0 9* - 2.6 1.7 3.0 2.8 2.2 8.5
Profit before Tax & Interest,as % of Capital Employed 11.30 il.93 11 .9 13 i3 - - 6.30 7.00 10.00 12.13 12.95 16.75
Net Profit/Equity (31) 13.0 11.5 3.S 7.3* 4.5 4.2 7.2 8.7* 7.9 15.5*
Sales/Capital Employed 1.07 1.48 1.51 j.74* 1.17 1.47* 0.84 1.08 1.57 2.05* 1.65 1.54*
Value Added/Capital Employed 0.36 0.50 0.37 0.40* 0.37 0.45 0.27 0.336 0.44 0.55 0.41 0.47
Value Added/Fixed Assets 0.73 1.11 0.86 1.02 0.62 0.72 0.36 0.52 1.18 1.14 0.82 0.94
Value Added/Employee (Rs/Employee) 13,100 20,000 17,600 '8,500 n.a. n.a. 13,100 13,900 15,900 18,900 n.a. 12,100
Value Added/Rs.of Labor Cost 2.62 '.67 C0( 2.5? 1.39 1.37 2.80 2. 4 2.20C 1.92 :3.18 3.36
SlesiTnv.entori es 2.93 2.68 3.60 2.43 2.63 2.95 2.52 2.38 4.55 4.23 2.79 2.46
Current Assets/Current Liabilities 3.0 2.6 1.9 2.7* 2.7 3.4* 2.5 2.4 2.6 1.9* 3.4 3.0*
Debt/Equity 65/35 60/40 '35/65 35/r 5 60/40 59/41* 52/48 55/45 66/34 '7,/35* 70/30 47/53
* For 1370/71L.
- 18 -
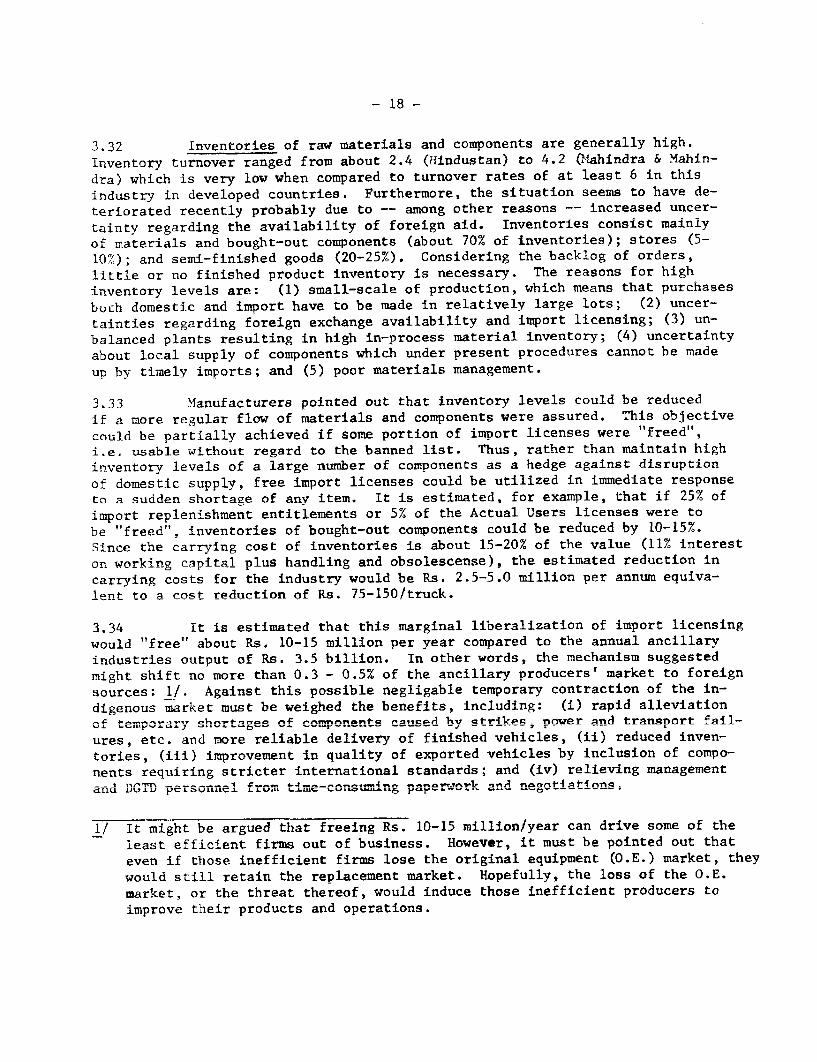
3.32 Inventories of raw materials and components are generally high.
Inventory turnover ranged from about 2.4 (Hindustan) to 4.2 (Mahindra & Mahin-
dra) which is very low when compared to turnover rates of at least 6 in this
industry in developed countries. Furthermore, the situation seems to have de-
teriorated recently probably due to -- among other reasons -- increased uncer-
tainty regarding the availability of foreign aid. Inventories consist mainly
of materials and bought-out components (about 70% of inventories); stores (5-10%1); and semi-finished goods (20-25%). Considering the backlog of orders,little or no finished product inventory is necessary. The reasons for highinventory levels are: (1) small-scale of production, which means that purchases
buch domestic and import have to be made in relatively large lots; (2) uncer-tainties regarding foreign exchange availability and import licensing; (3) un-
balanced plants resulting in high in-process material inventory; (4) uncertainty
about local supply of components which under present procedures cannot be made
up bv timely imports; and (5) poor materials management.
3.33 Manufacturers pointed out that inventory levels could be reduced
if a more regular flow of materials and components were assured. This objective
could be partially achieved if some portion of import licenses were "freed",i.e. usable without regard to the banned list. Thus, rather than maintain highinventory levels of a large number of components as a hedge against disruption
of domestic supply, free import licenses could be utilized in immediate responseto a sudden shortage of any item. It is estimated, for example, that if 25% of
import replenishment entitlements or 5% of the Actual Users licenses were tobh '"freed".. inventories of bought-out components could be reduced by 10-15%.Since the carrying cost of inventories is about 15-20% of the value (11% interest
on working canital nlus handling and obsolescense), the estimated reduction in
carrying costs for the industry would be Rs. 2.5-5.0 million per annum equiva-lent tn a cnst rP6urtion of Rs. 75-150/truck.
3 34 T-t im estimrted that this mArainal liberalization of import licensingwould "free" about Rs. 10-15 million per year compared to the annual ancillaryindustries output of RsB. 3 b hillifnn Tn other words; the mechanism suegested
might shift no more than 0.3 - 0.5% of the ancillary producers' market to foreignsources: -- . Again.t th4i pnasibhlp nealigaqlhe temnorarv contraction of the in-
digenous market must be weighed the benefits, including: (i) rapid alleviationof tempora,ry shortages of co-onents causedc by strikes pnower and transport fail-
ures, etc. and more reliable delivery of finished vehicles, (ii) reduced inven-tores, (i444 4m.roveme.nt in. quality of eorted v-ehirles bhv inrlitsinn of romno-
nents requiring stricter international standards; and (iv) relieving managementandiu DTnJVL personr.el from ti4me-cons-4ng p-pe rk.r-1 and negoVrt-iat4onsQ
1/ It might be argued that freeing Rs. 10-15 million/year can drive some of the
least efficient firms out of business. However, it must be pointed out that
even if those inefficient firms lose the original equipment (O.E.) market, they
would still retain the replacement market. Hopefully, the loss of the O.E.
market, or the threat thereof, would induce those inefficient producers toimprove their products and operations.

- 19 -
3.35 Starting in April 1973 the Government has allowed exporters to use5% of their REPs for importing any industrial requirement without having to ob-tain the "indigenous angle" clearance, subject to a limit of Rs. 10,000 per itemin each licensing year. Exporters who have doubled their exports in 1972/73would be granted an additional 5%. Other proposals are also being consideredand these efforts are significant steps forward. However, the restrictionsimposed on the marginal liberalization measures adopted tend to vitiate theirbenefits. Reliance on existing tariffs rather than quantitative restrictionsto protect domestic industry against marginal import liberalization would bemuch more effective in achieving the benefits mentioned in the previous para-graph.
3.36 Related to the above discussion, there is within the general prob-lem area of import constraints; the need to accelerate and rationalize the en-tire import licensing system. Computer processing of the masses of data submittedby manufarturers as well asl coTrrmnuter monitnring of licenses issued and usedwould not only speed up the licensing process but would provide timely and essen-tial dta to assist short and long range planning, deaIs on-making and fast reac-tion to unforeseen trends in available foreign exchange. The computer dataprocessing -ro-ram. is current!- under review and should be imp1nepmentpe aR soon
as possible.
3.37 There has been a general deterioration in working capital over thepast' thL ree years; but the liquid4ty position of all co "anieS is st,ll sat-
factory even taking into account inflated current assets on account of undulvhigh inve r.torie. CapitalizatLon 4i. temLs 0fI the relat4 o.shi.p
debt and equity ranges from 35/65 for Ashok Leyland to 65/35 for Mahindra &IiLLLUL Sir.Lce thle 'Latter alUso hLlas th,e -weakest liquidity position its over-
all financial position appears to be strained.
E. Economic Costs and Benefits
3.38 As was mentioned previously, the principal instruments used to ir-plement the Government's strategy for growth and indigenizatLon are ind-ustriallicensing, indigenous content commitments, restrictive import licensing (quan-
titative restrictions on i'mport'ng iLtems mLanulfacturedU ±n IndiaU andU price COn=
trol. In addition, exports are encouraged by incentives including, inter-aliaduty draw-backs, cash assistance (oonuses paid on exports), special import re-plenishment entitlements (REP's) and relaxation of industrial licensing con-straints on t'larger" houses exporting a determined share of their output.
3.39 The purpose of this section is to evaluate the degree of protectionimplied by the above set of measures and the current cost competitiveness of theindustry. The concepts which are used in this section to measure the extent ofprotection and cost competitiveness are simple price difference between the do-mestic and similar imported vehicle; adjusted price difference with inputs atinternational prices; effective rate of protection; and domestic resource costof foreign exchange. These concetts are defined in Annex 11.
3.40 The indices quantifying the Drotection and cost competitiveness cal-culated for six important product lines are given below:

- 20 -
Indices of Protection and Cost Comnetitiveness of Commercial Vehicles
Simnle AdiustedPrice Price Effective Rate Domestic Resource
Difference Difference of Protertinn 1/ Cost of Fnr Fzrch.2,- (%) (%) (Rs./US$)
Tmnort TmnortSubsti- Substi-tut- on Exort tuti o n .Eor-t
Medium/HeavyTELCO (7-1/2 torns) -11 -18 -38 -44 6A33 0n.5Ashok Leyland (7-1/2 + 1 - 8 -34 -22 6.90 10.05
to-s)
T -4 .-4,
Bajaj Tempo (1 ton) +32 + 6 +23 -20 9.46 12.8BaJaJ4 Te,n,o (1=1/2) ton) L)7 L A -L1 -16 Q. tl 2.0
Jeep + 4 - 6 -20 -22 7.28 10.1Teep TrucLks = 9 =1 =55, 6. 12.2
1/ The percentage excess of value added by the manufacturer obtainable bv reason01 LarrllS anu otner proLecLive (promoiLon) measures on Lte proaucL ana i.sinputs over value added in a trade situation.
2/ The domestic resource cost, direct and indirect, of a product over the dif-ference between c.i.t. value of imports (or f.o.b. value of exports) and theforeign exchange expenditure, direct and indirect, for domestic production.
The items in the table above account for about 93% of the output in mediumiheavy vehicles, 60% of light commercial vehicles, and 100% of the jeeps andjeep trucks and include all product lines for which reliable data are available.These figures show that there is a wide range in the current cost competitivenessand protection given to the various products.
1. Medium/Heavy Commercial Vehicles
3.41 The simple price differences calculated for TELCO and Ashok Leylandshow that the ex-factory cost of the domestic product compares quite favorablywith the estimated c.i.f. price of comparable imports, i.e., 11% less than thec.i.f. price for the TELCO product and 1% more than the c.i.f. price for theAshok Leyland product. The adjusted price difference indicates that the productswould be even more competitive if the manufacturers were able to procure inputsat prices that would obtain under free trade conditions. TELCO's and Leyland'sex-factory prices would drop respectively to 18% and 8% below c.i.f. prices ofcomparable imports.

- 21 -
3.42 Both firms are subiect to negative effective rates of protectionfor their import substituting activities (-38% and -34°' respectively for TELCOand Ashok Leyland) and export activities (-44% and -22% resnectively). Desnitethis negative rate of protection, gross profit before tax and interest (on totalcapital employed) is 14% for TELCO and 15.5% for Leyland: iwhich is a reasonablereturn on investment. The small difference between the effective rate of pro-tection for import substitutine activities and exnort activities implies thatexport incentives are adequate. TELCO's lower rate of effective protection forexDorts (-44%,V is based on sales to Egvnt; where data were available; and mayhe attributed to the low f.o.b. export price. This price is equal to 657 of thedomestic ex-factorv cost and ig deemed neressarv to rompensate for the hibh trans-portation cost. As part of a long-range market penetration strategy, the low.export nrice apnears Justifiable-
3.43 The domestic resouirce rnost of a unit of fore-if n exchange for the im-port substitution activities of TELCO and Ashok Leyland indicates that productionof reditim-heruv veh4r1el in TnMn for the domestIc market 4s definitely an econo-mic activity for these two firms. This competitiveness is essentially due to(i) the ability of TInd4an mannfact-uirerQ to atnnAarei7e produrtion of chassito two or three models; (ii) relatively low labor cost; and (iii) the hightransportat-ion cost- Plement in imports. The dome-tl re-urce cost fjgures
for the export activities are higher due to the lower prices of exports whichare necessary for market penetration. NevertlMl- if --- ----- the pro-
position that the opportunity cost of foreign exchange in India is about ".s.i - U - i't "" ,e n"'he exor ac-U-le v s are eLIUIIL VoIIo nL eveLa ""s erV
stage of export experience.
3.44 lie can thus conclude (a) that the medium/heavy commercial vehiclesmanufactured by the t.wo more efficient producers in India are competitivedespite the relatively high price of inputs and levies and that they wouldb-e even more compyetiti-ve if the Jrice of0 indigenous inputs were to drop tothe c.i.f. value of comparable imports; (b) that the production of medium/hleavy -vehicles both for export and une aomestic market at T1ET.IO-s and AsnokTeyland's scales of production is economic; (c) that there is very littlehias aaciLnst teuArtgLL1II L.LV1LeSj andti tIxAis i1U nexuart incentives are adequaue.
2. Light CoT-ii-i-iercial Veh'c'es
3.4, D)espite the ract that Bajaj Tempo mav be consinered the most efficientmanufacturer of commercial vehicles in India, the ex-factorv nrice is about 307higher than the c.i.r. value of an equivalent import. IThis is due to the factthat -- as pointed out in para. 3.24 -- cost of materials and bought-out partsare high primuarily because of tne smaii scaie or operation ann in additionthe manufacturer has unutilized capacitv due to unavailability of castings.IL thlis rirm were to obtain raw materials and components at internationalprices, its product prices would drop to about 5% above the c.i.f. price ofequivalent imports at today's level ot production. It production were toincrease from 3,500 to 8,000-9,000 vehlicles a vear, it is estimated that theprice of a vehicle would be about 3%o below the c.i.f. price of comparableimposts.

3.A6 Effective rates of protection for the im,pnort substituiting. activ-ities are 23% and 11% for the 1 and 1-112 tons trucks respectively and ther,qnpqti- rpmnsnrce oncts n,cr tnIt rof foreiern exchangp saved iF Ps. 9.46 undPs5;. .3nl respectivelv. For a relatively recent undertakinc, and at thie rtcr-rnr e rsale of nrnilirrinn- theqe are reasonabhle nrntprtcrn an(! cdomestic
resource cost levels and one can conclude that tinder nrevailing conditionsthe import subcticttting arlrity is ernnnnircally soundi The evnnrt nrtivxirx'on the other hand, does not fare as well. Domestic resource costs per initof foreIgn e-change earned ranae between Ps. 12.0 to 12.9 for both mTodels
rrl'ich is hligoher than the assuimed opportunitv cost of foreign exchange.uesnite-, ,-nort incen*tivs', the effect nrntnrtInn i^ -?' f-h'h i .far
less than thze effective protection afforded to thc irort sulh-titution activ-4tes(20.'". ThoIls does -ot miean th.at incre.ase3? 0ex,r.!r nc8-vsae1eJ
sinace the domestic resource cost ner unit of foreItgn excYlnge earned bin' ex-*ri,- vebi .c'esO ts QLCV onj the hi/41 ^hn I/a'. ilcA- 4tL does tOCiean is that as
long as the light cormmercial vehicle sector consists of small-scale producerr,,/roduct,,,zl~~Ve 4z ;ehic_ for exr,ort wil' 11 sl 4 SI-4 cost a..tSI-4t
T- -ep - n - J ITeep 'Pruc'-s
''-7 ThC nr0A.uC,4o of 4ecel-s an-d Jeep triucl.,s for thie lotrestufc markeet
is xtiite corinetitive at current levels of production and technology and furtlhercost reUL L . LUon o li aLk1:VOC1 bv i ,r ini JrtLL/V iAI"A tLIUL 1 *'!-L[Ii/thd . hI,Jw VtL
the product designs are at least 25 Years old and hhave little export potential.
F. Exports --
2 .4. The conmercial vehicle industry has made a nronising beginning inea.ri n g foreign exchange. Over the 1ls- tr-1--.,,- _4 --e ._ r~O CCIL CC Iil~C V L CI- IaO -L//LO :voit L -II-, -/, IL-I '0 Ut L A p U LL O IL L _ /ItI?~
total output of commercial vehicles Is estimated at 5.5% covering over half oft te tct foeg 0±511 rqieLsoQe sUeLcLtLo r f Lor imports. r LarL C1ng
frorm about Es. 2 m7illion in 1964/65, exports reached a neok of some Rs. 160m illion in 1970/71 but dropped to Rs. 100 million in ll "MU" due to delays inrenewin- a trade agreement with Egypt, the largest importer of Indian trucks.Exnorts have been directed to over 20 countries in Arrica. Asia, tne MiddieEast and Eastern Europe. Over the period 1969-1972, four cotntries accountedfor about 33% or indian exports, Egypt (31.2%); Ceylon (26.30): Yugoslavia(13.7%') ; and Nigeria (11.7%). ks a rtule exports are made under bilateraltrade agreements. tELCO, Mahindra & Mahindra and kshok l.eyland account forabout 95% of all vehicle exports and TELCO is bv far the leading exnorterwn rh more than 70% of the total.
3.49 Export prices range trom ?() to 400/ below the domestic ex-factoryprices (Annex 13). In addition to the f.o.b. price, the exnorting firm receivesthe dutv and. excise tax draw-backs of about 13-167, the cash assistance bonuis
1/ See also Annexes 12, 13, 14, and 15.

- 23 -
of between ?0f-95-, snd thp preomfiim value of REP'P _/ rof ahbout i0nT The reali-zation from exports, therefore, is between 83% and 103% of the domestic ex-factorv nrire As wnasdiscussed in paras. 3.41 and 3.46 it 4, doubtful thatthere is anv economic justification for increasing the export incentivesalready in effect- Further export growth should he bae natrci>customers through improved design, better qxality and adherance to deliverypromises, stepped up .m-arketing efforts, better assessment of customer needas well as through price-reductions by improved operational efficiency ofthe vehicle manufacturers and ancillartes.
'i rn A1lthugh actlon_s ~1___ 1Us "ne _. @ t1 reur.. som t__r to ta'-e._..AX L 5 i 1 L X .' W1 1. ' L i t tu e: t U t L1!1 LU Ld'
effect, the three manufacturers which account for the bulk of India's vehicleexports -TJ. O ,AshokI l-;ln adI iahindria Ca 1'[1.LIda) ar-e J1t:'VL[e1lesS opti-
mistic about their ability to further penetrate markets abroad and have proV-e etheir e..c-norts to grow as follows:
Projected Exports of Commercial Vehicles, 9l72-i'ai7(in Rs. million)
1970/71 1l72/73 1974/75 1978/79 % of estimated Gross(actual) (est.) (prol.) (proj.) Prodiwtion (197j/79)
TELCO 106 110 150 210 10Ashok Levlan.,i 20) 1 8 25 40 8.TahIndra & Mahindra 22 12 15 20 3Others 7 10 15 30 5
Total 155 150 2-05 30n 3.3 (average)
3.5i E'Exports of Indian trucks and buses can assuredly be increasedfurther and economically at that. Not only are the three major exporters, par--ticularly TELCO, already quite competitive, but Indian vehicles have a nunmber ofother advantages in developing countries vis-a-vis competitive products fromindustrialized countries. Firstlv, the Indian market pattern for commercialvehicles and the most important components largely coincide with the pattern inin developing countries; secondly, the conditions in most developing countriesare similar to Indian conditions -- overloading, noor roads, severe climate --and thirdly. Indian vehicles are able to stand up well to extraordinary stresses.India also rates high as a manufacturer and user of those types and sizes oftrucks and buses that are the most popular in developing countries (Bedford,Dodge, Fargo, Leyland and Mercedes Benz).
2/ It miglht be argued that firms like TELCO that don't sell their REP's donot realize the resale premium of 50. T.he fact that L .LCO prefers toutilize the REP's for their own needs implies that to TELCO they areworth at least as muchU a probably more tnan thne resale value when usedto provide scarce imported inputs (thereby enhancing the exportabilityof their products). It seems reasonable, therefore, in trying to quantifythe incentive method provided by the REP's to assign a 50% premium above
teUnom.inal value -whether resold or'utilized by the recipient.

3.52 Any increase in exports will of course have to be closely coordinate(dwith plans to exp~and prouct'on to neet duomestic demand; these plans are dis-cussed further beloxw (paras. 4.01-4.04). At present the three major vehicleexporters have LLttle or uo excess capacity. Although exports are only marginal-ly attractive financially, it was gratifying to learn that company managementsiunderstana tue national need to earn foreign exchange and are more than willingto cooperate to the extent possible. Thus, for example, TELCO has accepted theobligation to export 2070 or its recently license(d incremental capacity and AsshnkLevyand has made a similar commitment.
3.53 In addition to the export Potential of complete vehicles in develop-ing countries, there are good opporttnitles for exporting components to developedcountries, esnecially for discontinued mnodels requiring relatively short pro-luction runs rhich are uneconomical to produce in developed countries. A numberof Indian producers are competitive both as to quality and price in castings,forgings and machined parts which have a high skilled labor content. The mainimpediment up to now seems to have been a lack of marketing effort. There isa worldwide shortage of castings and forgings andi large manufacturers both inthe U.S. and Europe are searching for new sources. The fact that there appearsto be no strong interest in India yet indicates that India has not seized theopportunity to make potential buvers awiare of Indian prices ond qualitv. Indi.nTrade Promotion Offices -- perhaps one in Detroit and one in Europe to start --cotild act as two-way channels promoting both the export of Indian vehicle com-nonents as well, as a flow of technical- assistance to India.
3.! 5A Finally, while there seems to be no need to fujrther increase exportincentive.s, thev could certainly be rendered more effective. The cash assistancescheme appears nowq to be operating; much more smoothlv than in the past; of thl'amouniit due, 7n7 is now remitted against shinping bills and thie balance againstforeir,n ex:change receipts. But there are considerable nroblems with the diit)-dIraw-T,nach, The exporter has to ne-otiate for each shinment the amount of dl!ti'esand excise ' txes eligible for recovery. This is time-consumiTng and results i.nconsiderable delays in obtaining the drawback. Tt would be desirable to esta--blish an ad valorem rate for commercial vehicles i7hich could be negotiatedannually.
TV. FYPASTlN PLT.TS
.I1 The expected demand and sunply for commercia,,l voehicl.es through 1'79are pro-jected in Annexes 16 and 17 an(d are briefly summarizer' in this section.
P,. VMedium/ev Vehicles
4.02 The demand for mediuim an(d heanv trucks an(! hnses haF been projectedto 197./79 by the Tata Fconomic Consuntancy Croup, the latest arnd consideredby the inrlhistry to be the nr,ut comprehensive study currently available.

Demandi and kuply Projections -t"fediur, .'nd lBlavvComrerci.al Vehlcles, 1Q72-iQ7Q
(numbers)
Projected License-i InstnlledYear Demand Capncitv Capacity [rd_;atuction
1971/72(actual) - - 35,0591972/73 43,6Y0) 76,000 - 37,001973/74 4(9,8sn 76,non - 30,390
1974/75 54,500 76,oon 57,58n 43,5001975/76 58,90n 76, 090 6. 8,0 r) 1 7,5001976/77 64,000 76,nnn 76,non- ;t,noo1977/7P 71,00n 76,non 76,0n0 54,5001978/79 77,600 76,9000 76,n00 5S,000
1/ Composed of TELCO 36,000e; Ashok Levland 10,909: Premier 15,000; andHindustan 15,000.
Licensed capacity in the table above includes rccentlTh anrroved projects wl)i :n
w7ill. raise installed capacity from 24,0oo to 36,o00 unlits/year -at TFLCO andfrom 6,000 to 1n,000 units/year at Ashok Leyland. In 1976/77, v'TeIn both rpro-jects are exnected to be fully operative, production is prolocted in that yearat only 67% of capacity (51,000 of 76,000) rising to 76f' bv 1978R/79. Thiswould anpear to be a low capacity utilization but production of even the 5 nonivehicles projected for 1976/77 means that both TELCO and, Ashok Leyland w7ouldhave to operate at 95% of capacity, if the tx.o other nroducers (Premier andHindustan) were not able to increase outputt above the present lox; utilizationrates. Indeed, under such assumption, TELCO's and Ashok Leyland's capacitieswould virtually be fully utilized were these two firms to achieve their exporttargets on top of Producing their share for the domestic market.
4.n3 With proper plant and product imnrovements, Premier should be ableto achieve a doubling of production from 4,1,00 in 1971/72 to 8-9,on0 units bly1978/79 provided sufficient engine supply from Simnson or from a nev? engineplant is forthcoming. An even greater uncertainty is posed bv the fourthproducer. Hindustan. While it is assumed that this comnany will conti.nuemaking commercial vehicles by reversing or at least stabilizing the recent I'e-clinine trend in production, the attainmcnt of a nrodtuction of even 1-4;ilT)vehicles in the latter part of the 1970's together with the needed improverientin quality iB only lik=elv if drastic reorevniaztion annd nlant imnroveuTent mea-
sures are adopted. In any case, in this payload range TET.CO, Ashok Tleyland snd,to a lesser extent, Premier arp likely to remain the nrincinnl nroducers.
B T.ieht Gnmme-rc-ial Vehicles
4-04 As is the case for medieum. and heavy trucks and bluses, projected do-
mestic demand for light commercial vehicles during the 1970's is expected to
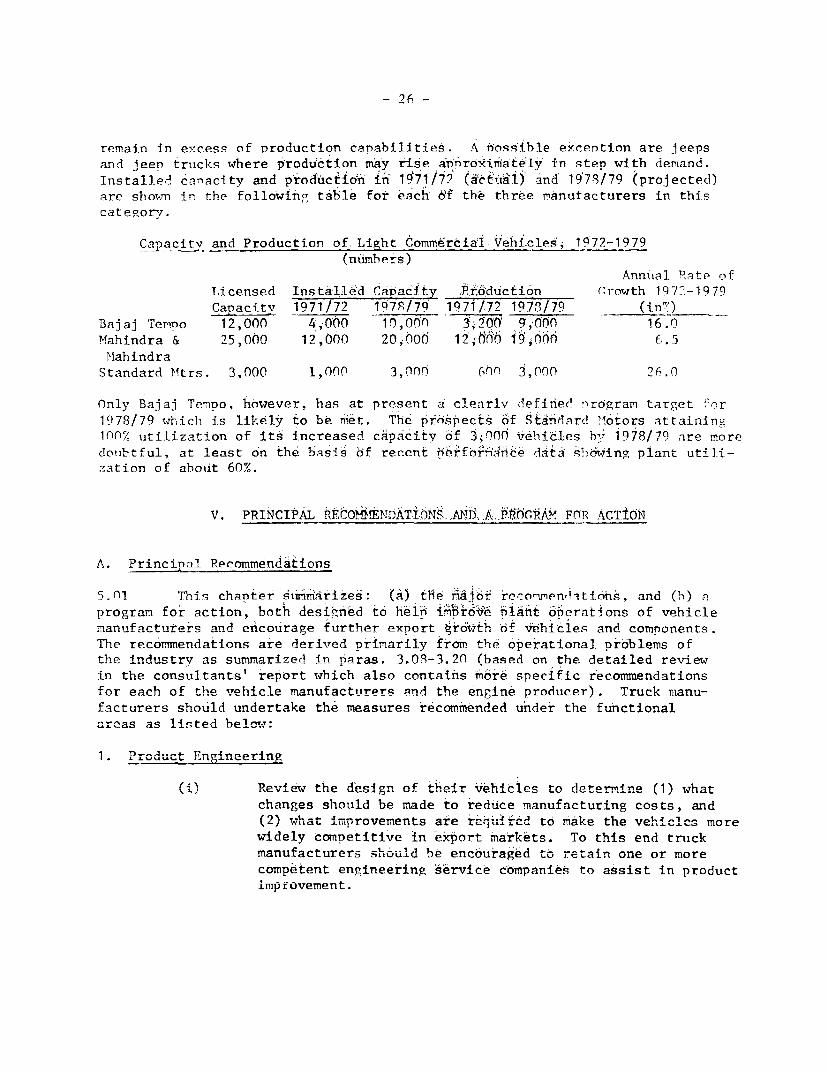
- 76 -
remain in excess of Production canabilities. A n~ossible excention are jeeps
and jeen tricks where produc6tion may rise ap'nrox-imate]y in step with demand.
Installed canacity and producion in' 1qit/9 (ictual) and 1973/79 (projected)
are shown in the following table for each of the three nanufacturers in this
cat egorv.
Capacitv and Production of Light Commrciai iVehicles, 1972-1979(numbers)
Anniual .ate ofLicensed Installed Capac-Ity Pit.rdtiction G.rowth 197'.-1979
Capacity 1971/72 197P3/79 197i/72 1970/79 (in°')Bajaj Temno 12,000 4,000 10,000n-n 3 ,4001 9s,n0in 16.oMahindra & 25,000 12,000 20,000 i2AO( 1i,OO 6.5
MahindraStandard Mtrs. 3,000 1,000 3, 00 600 J,00n 26.0
Only Baia! TemDo, however, has at present a clearly definied 'rogram target For
1978/79 wh,ichi is likely to be met. The prosbects of 'Standard M6tors attaining
100% utilization of its increased capacity of 3;900 vehicles by 1978/79 are more
doubtful, at least on the basis df recent darfo'frine .la .sh6iwing plant utili-
zation of about 60%.
V. PRINCIPAL PEC,01N-DATI.NS. A1'U,-A P.0GRAi' FOR ACTION
At Princinal Recommendations
5=nl- Mi chanpter sumimarizes: ("J t1e iatbr ie-w,en,i6hn. and (h) a
program for action, both desisYned to heln iiil6' hiant 6berations of vehicle
manufacturers and encourage further export t6owith of vehicles and comnonents.
The recommendations are derived primarily from the operational oroblems ofthe industry as summarized in paras. 3-03-3.2n (based on the detailed review
in the consultants' report which also contaiins m'6ore specific recommendations
for each of the vehicle manufacturers and the engine producer). Truck manu-
facturers should undertake the measures recommended undeir the functional
areas as listed belom.7:
1 . Product Engineergt.
14 D RevIew the dosign of theIr vehicles to detertm.ine (1) what
changes should be made to reduce manufacturing costs, and
(2) what iL .MIrovements are .C t'jc toC ,,...k the- vehicles m.ore
widely competitive in export markets. To this end truck
ri-ianufLactLurers shouuild be encouragLed ILo retain one or more
competent engineering s'rvice companies to assist in product
improvement.

- 27 -
(4i i TIevelop, i . ... th succh techn icl assistance as may be re,nuired,
diesel engines of more acceptable performance. Such technical.assistance could be provrfdeA b- reta
4inin on a proj
4ec by
r,t, L*~s .sI UV ta7 t.f -fl CS - j
project basis a competent engineering firm, or by enteringin a collaboratio, agreement , 7,ossibLl Ly as a paC r tn er in. anon-captive engine company, with a firum which has a broad lineor proven d'esel engines, preferabl ragi, f.ror, 13^ -- 5rJr IT"IJI ~9LUV .L UL X .L I J .J L U.L) LUII.~-I- LLY, I.J111 J)%7 LUL JXiJll Fl1
( reate a truck industry committee to standardize materialsspecifications, particularl.y steel-
(iv) Adopt known market research techniques to assist ini-identify-ing customer needs and oreferences to better (define the zhasirsnecifications of new vehicles.
2. Manufactuxring
(v) Improve production methods to rediuce costc and increaseproductivlty- In particular this mi-ht be arhieved byimnroved (a) materials hanalin'g methods to reduce in-nrocessinventories and damage to costly machinedT parts; and (b)plant lavo'tt for better materials flow annd to reduceunnecessary handlin7: and (c) by an increase in the speedand feeds of cutting machines and the re-engineering offixtures.
(vi) Install where needed standby power units to reduce costlyinterruptions in prodeuction and damage to machinery due topower failures;
(vii) Expansion of training programs for rachinc maintenancepersonnel an,i the development and enforcement of preventivCemaintenance programs as well as the broadening of otlhertraining profgrams for workers, sunervisnrv and managementpersonnel:
(voiii) Strengtnen in.11ecti.on planning and :rocerlures to be abl.e toapply correct4,e action in a timely rmanner on identifiedquality defects;
(ix) Develop an(d enforce adenuate safety and health regulations;
3. Matetirls Management
(x) Improve procurement practices and review and improve inventor-.control. and materials storage svstems;
(xi) Study an.d nrnject the needs for rawy materials and components;hy year, through 1Q9n, and in cooneration with -overnment takpprompt action to ensure timely availabilltv at competitive
pricess

- 28 -
(xii) Consider the establishment of a system of raw material serviceservice centers to handle the distribution and partialprocessing of steel and possibly other materials such 1as
aluminum:
4. Marketing
(xiii) Begin to organize the skills required in market planninc.,merchandizinQ. and dealer develonment
(xiv) Take steps to expand exnort marketinq efforts directlv(as well as through the proposed Indian Trade Developmentoffiees):
r; nnnr1 nl Controlsx and Renortq
(xv) Develop and iLqe variable volimne _-<nene btirdets and a sys termof action-oriented reports of performance against btudgets;
6. Organization
(xvi) Review organization plans and structuires to ensure complete-nes , nroner groupninc nf fiinert1inrv .nd tbhe ce-1a-r asigiz4n-
ment of responsibilities as well as the aDpOintment of aspecialist in organization matters reportin, to the Manag,-ina Director.
B. A Program for Action
5.02'' A sectoral program of operational and product improvement requirescllUose cooperatiLon UIetLween industry an.l1 the 7'0vernment iL L t lIs to succeedl. 'i Lorecommended program for action as spelled out below, therefore, is presentedulner thiLree headings to IntLJiLcaLLe primrary responsiDL.bLit.Ly -- Gove,..irer.;, LindUstrvJ,
and joint effort. Agreement on the action program has been reached during nego-tiations for the Eighth Industrial Import Credit.
1. Role or Government
(i) After review and general acceptance of this report, the.Govern-Government would make knowqn to the. commercial vehiclemanufacturers and the engine nroducer the findings andrecommendations relevant to eqch company's operations aspresented.in detail in the consultants' report and sum-marized above (nnrn. R,.O1) ;

- 29 -
(ii) Each company would file with the Government a "plan ofaction" to implement the recommended efficiency measuresand a time-table for imnlementation. It is recognizedthat there is room for discussion and that some plantmanagements may have honest differences of opinion as tothe validity of some of the report's concltisions. Howq-ever, suich differences of opinion, it is believed, vyillbe matters of deqree onlv since most of the deficienciesare self-evident.
(iii) There would be periodic follow-uDs, perhaps at six monthintervals, to determine the progress of each plan ofaction. This could be a combination of renorting proce-dures and plant visits by Government personnel;
(iv) The Government woultd consider favorablkr appropriate pro-Dosals involvinR collaboration agreements and/or technical.assistance designed to achieve improved product desi,gnand operating efficiencies;
(v) The Government would take the necessary stons to overcomethe growing shortage of hiTh-ruality castings and toconsider domestin nroducti(n of deen-dral, steel sh)eet:
(vi) The Govern-vent j.rnulda n(mni-Ster indylStri11 lirensinp
policy so that: (a) efficient producers may grow andachiee needd.pA ec'nnmTic nf crnen anrd (h) nncllnarv
sectors exneriencing actual or anticipated shortagesTwouI ld helan encouragedmrl tor evpnnd, nprl.ri ly 'IV ovxnandincexisting efficient producers hut also including, wherenanfsr 0 ~~ licenses' for net n.,roducers;
(vii) Govenr .... ent to conside fln; R L of the L 4tul Use rs
licenses or 25% of the Import Replenishment Entitlementpermitting their -se res.ardless of the banned list (nnrl.
3.33)-
(viii) As a further incentive to exnort, the Government wouldreview the sLtrear.linin,0, ofthe dr-Lback pa,yment procedurewith a view to establishing a 12-month level of drawbackfor ealch¶. vehII.l ce raC. u.a ract urer an tmd vehi -c'l t-ye LVi h an nual
review and revision (para. 3.54)
(in) Computer data processing and retrieval of import licenso.Mfor1TmatiSon would 'ue i n)-1 emeUntted as soon as Dossi'L'U' in
accordance xwith plans prepared and currentlv being reviserlby the indian institute of Ianagenment kpara 3.3o);

- 30 -
2. Role of Vehicle Manufacturers
(x) Prepare and imnlement the action programs to improve plantoperations (para. 5.01);
(xi) TNegotiate where anpronriate foreig,n collaboration and/ortechnical assistance to improve and modernize productdesign and plant operations. Contracts negotiated shiould,whenever possible, provide for conmensation through theexport of Indian compnonents:
(xii) Pronote exports of components throtugh, btht not necessar Il ,r
limited to. the proposed Indian Trade Development Office(para. 3.53):
3. Joint Effort - Governmont and Industry
(xiii) Coonerate in establislhing T.nd.an Trade Dovelonment offi.esin Detroit and. Europe to act aF tjo-Tja7 channels for-(a) promoting the snie of Indian co"nonents overseas,nncl (h) fnqtprine rollahration nnd tsurl-iniral sqq1ltncr
agreements (para. 3.53);
(xiv Collaborate generally in seeking out soujrces of appropri atenw-Irtyl A .^ 4 artie4, 1 n rl tr p,1 mr4 rvo4 t1? , 4 c ,f T.ouTl beA In
the establishment of a new non-captive diesel eng-ine
(xv) Collaborate in studvin,- th feasibilitv and appropriateform of innlementation of raxw material sorvice centers.

Annex 1
INDIA: IDA EIGHTII INDUSTRIAL ID?ORTS CREDIT
Vehicle PoDulations 19148-2972
EstGoods Total, Increase Prodn Scrap
3use.s xVehicles (JOO's) (1,OO0s) cL.OOs) ((.1OOC's)
191,8 20j 20 1JK 66149 27, 2, 72,926 100 3145'0 30 ,317 785537 109 + 951 3)4A411 81,8833 316 + 752 3 I4,G7 81,013 229 + 353 33,728 91,1425 130 +115}; ho,276y 98,920 139 +. 955' 14C,9t7 10Sfl4,389 145 + 656 14 ,L6 ' v I 9,097 166 F2l57 38,4125 123,886 162 - 4
5 v' ,: 1 3 1 + 759 148,C'6 1147,625 196 +27 20 - 7,o 53'l.L ±l)JG2 J) 27 +2361 56,792 167,6149 2214 +14 25 412v2 59,60 189.09" 2,49 + 163 62, 5M'O 215,;o08 278 +29 28 _ 1604 `6 ,51-3 22h,181 29.1 +13 3365 69,oi.9 220,393 290 - 1 37 +3866 73,106 238,,179 311 +21 341 +1367 73,972 265,570 314O +29 31 + 268 79,229 299,846 379 +39 35 - 469 83,000 312,000 397 +18 38 +20
>70 91,000 327,000 1418 +21 35 +147:! 97,1CcC 347,600 45 27 41 +14
*7e2 104,200 368,000 472 27 42 +15
Sources
PC,uTt oI t Handbook of Associ.ation of AutomobileAncillary anu.facturers -
Production Total comrercial vehicle productionsupplied by D.G.T.D.
*Estiyiated aesuming a rate of attrition of 3.355 the average for the years 1959-1969.
Industrial Projects DepartmentMav 16, 1973

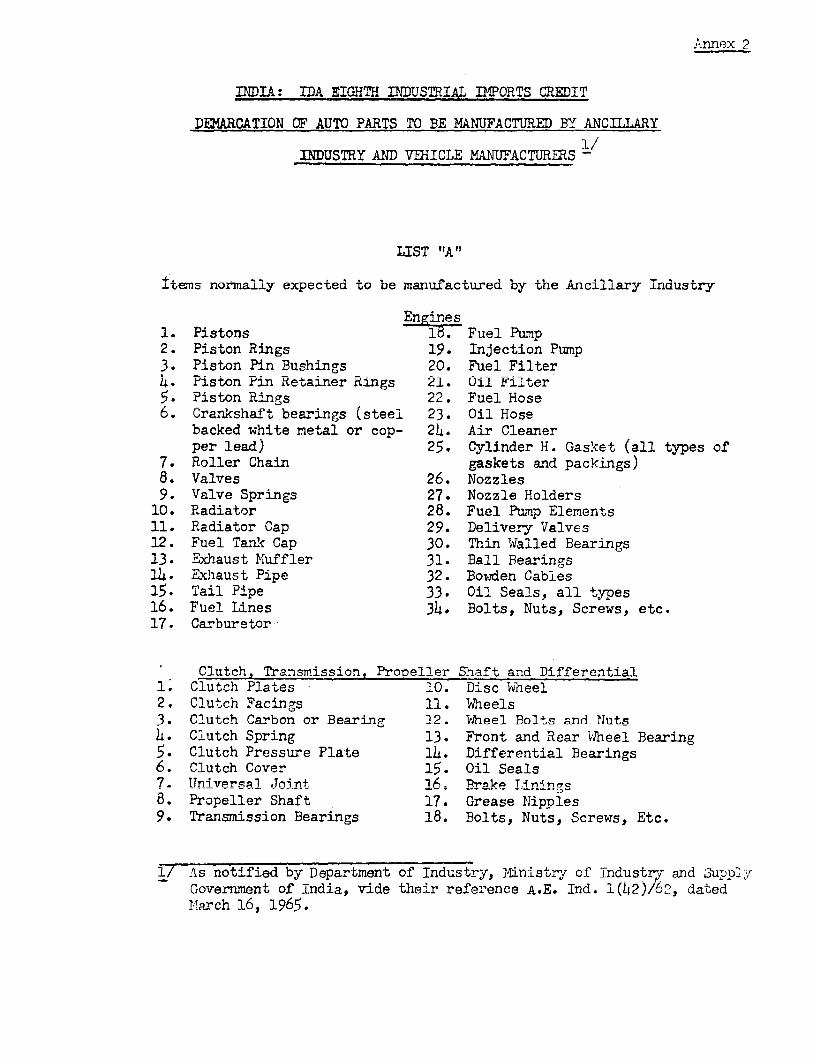
Annex 2
Tn A EIVT 4. TNTTMJ TATAT TMPCRT4 rp (nTT
T7ATrWAPTfth rF ATTM'n PA^'Pr mAn BE MAMTVACTPT v AJTrTT-TAPV.W-- 4f*U 40 b ATm .I0- BE I-- _ b7LJ.A BYn S J_J__
ThJmTTCmrMV AWM ~TrTr'TP VAAMTr~AP"rPTMTfe
=STL~ A
Items normaily expect,ed to be ManLU.aaCTUreCr by t'ne Inciiiary Industry
zn ines1. Pistons ld. Fuel Pump2. Piston Rings 19. Injection Pump3. Piston Pin Bushings 20. Fuel Filter4. Piston Pin Retainer Rings 21. Oil Filter5. Piston Rings 22. Fuel Hose6. Crankshaft bearings (steel 23. Oil Hose
backed white netal or cop- 24. Air Cleanerper lead) 25. Cylinder H. Gasket (all types of
7. Roller Chain gaskets and packings)8. Valves 26. Nozzles9. Valve Springs 27. Nozzle Holders
10. Radiator 28. Fuel Pump Elements11. Radiator Cap 29. Delivery Valves12. Fuel Tank Cap 30. Thin Walled Bearings13. Exhaust Muffler 31. Ball Bearings14. Exhaust Pipe 32. Bowden Cables15. Tail Pipe 33. Oil Seals, all types16. Fuel Lines 34. Bolts, Nuts, Screws, etc.17. Carburetor-
I Clutch, Transmission, Propeller Shaft and Differential1. Clutch Plates 10. Disc Wheel2. Clutch Facings 11. Wheels3. Clutch Carbon or Bearing 12. Wheel Bolts and Nuts4. Clutch Spring 13. Front and Rear Wtheel Bearing5. Cluteh Pressuire PlAte i) -niffPren+.tn1 Pznaring.s6. Clutch Cover 15. Oil Seals7. Universal Joint 16= Brake I.inings8. Propeller Shaft 17. Grease Nipples9. T B~earinfngs 18. Bolts, Nuts, Screws, Etc.
1/ As notified by Department of Industry, Min:istry of Tndustry and 3u-ppt,ZGovernment of India, vide their reference A.E. Ind. 1(42)/62, datedMlarch 16, 1965.

2-2
Chassis Frame, Front Axle and Steering1. Leaf Springs 11. Bolts, Nuts, Screws, etc.2. Spring Brackets, Shackles, Hangers 12. Suspension Leaf Springs
(cast type) 13. Suspension Coil Springs3. Shock Absorbers 14. Spring U. BoltsL. Hydraulic Brake System 15. Spring Centre Bolts5. Vacuum servor or Air Brakes 16. Spring Sbackle Bolts6. Brake Cables 17. Spring Shackle Pins7. Brake Fluid 18. Spring Clips8. Ball Bearings 19. Spring Bushes9. Roller Bearings 20. Spring Seat
10. Taper Roller Bearings
Electrical Eouioment1a Dynamo s 16. Stop Lams2. Starter Notors 17. Spot Lights3. CablesJr 18. Control LamosLi. Starter Cables 19. Direction Indicators5. JWiring Harness 2.f Flashers
6. Igniti-on Coils 21. Stop Lamp Switches7. Sparking Plugs 22. Horns, Electrical8. Distributor with Vacuum Controls 23. Horn Buttons9. Voltage Regulators 24. Electric Bulbs
10. Electrical Cables, all types 25. Bulb Sockets11. iFgnitiOn Switches, all types 26. Wind Shield Wipers12. Head Lamps 27. Electrical Fuses13. T ai Lam1 sys 2 ectrical FSe Boxes14. Side Lamps 29. Contact Brake Points1i* Fog Lamps
Rubber Parts1. Tires 6. Bulb Horns2. Tbes 7. Weather striD3. Flaps 8. Door Buffers and similar othier
Fan Belts rubber components5. All types of Rubber Hoses 9. Silent block or resilient mountings
Body1. Door Locks l. Speedometer2. Hinges 15. Flexible Shafts for Speedometers
3. Windows for bus and trucks 16. Oil Pressure Gauges4. Seats for bus and trucks 17. Fuel Gauges5. Safety Glass (Laminated or 18. Air Pressure Gauges
Toughtened) 19. Thermostats6. Window Regulators 20. Paints, Lacquer, Varnishes7. Window G-ides 21. Sun ShadesB. Ornar-mental Fittings 22. Sun Visors9. Upholstorv Miaterials 23. Luggage Carriers
10. Trinsirn, Yaterials 24. Ash Travs1'. Rear \r'''w 14irrors 25. Door Handles12. DaSElh U-7.rd Tnstru.Lments 26. Dolts, Huts, Scrj':, etc.13. Arnieter 27. Mlascots and TIo+.ifs

2-3
Service Equipments1. Tool Kits 5. Hand and Foot Tire Inflators2. Starter Handles 6. Air Pressure Gauges3. Tire Levers 7. Lubricating Equipment4. Mechanical and Hydraulic Jacks
LIST "B"Items which may be manufactured either by the Vehicle Manufacturers or by the
Ancillary Industry
1. Cvlinder Liners 67 Crown Wheel and Pinions2. Connecting Rod Bolts 7. Differential Gears3= Stater Gear Rings 8. Differential Housings4. Oil Pan 9. Rear Axle Shafts5. Timng Gears 10. Blrake Drurns6. Valve Seat Inserts 11. Hubs7. Valve Seat
1. Clutch Levers 6 Crown WlJeel ar-d ?wnicns2. Clutch Hous4ngs 7. Djff erential Geas3. Flywheel Housings 8. Differential Housings
T) -r4-n. s40n tase 9. De--, A-le C!I-,04s5. All types of Transmission Gears 10. Brake Drums
Pnr.e. 4 e '.~........F _. F _P.t a 2I Q, St-ar. i-_v^cos- * £ * O4i t ..... * * .fll u *JLZ ¼ o' u u L "F
1. Tie Rods 5. Steering Gears2. Tie Rod nd"s 6.Se.n h sIi* ~~~~~~~ ~~~~ ~ ~ ~ ~ % LJ* LUrl -LIAG ZLI AILD
3. King Pins 7. Spring Shackle (forged type)4. -;L 4J\.LWILL& u8 lorsion B-sI
1. Cabs h. Car Seats2. Bus Bodies 5. Hub Caps3. Truck Bodies
Industrial Projects Dept.Yiay 16, 1973


ANNEX 3
INDIA: IDA EIGHTH INDUSTRIAL IMPORTS CREDIT
NOTE ON INDIAN EXPORT PROMOTION INCENTIVES
1. Indi has a "le rar.ge of export pro,mioton -ncentlves disc-ussedU _lnn'4a I'ls W.L Li Oi~jUL J. uUIU Li.A. ±LIL.LV~ U±.UbU JI
the following paragraphs:
Cash Assistance
2. Cash assistance is granted to exporters with the intention of com-pensating for disadvantages iunerent in the present stage oL developmentof the Indian economy such as high cost of materials, small scale of pro-duction and the VariouS centrlu government and iocaL taxes and levies nototherwise refunded (para. 7). The scheme now covers about 12% of all exportsand includes inter alia engineering goods, chemicals, plastics and paperproducts. Expressed as a percentage of f.o.b. value, cash assistance forengiieeriiig guods now varies from 10% for batteries and industrial machineryto 30C for bicycles and components. The average for all industries is aboutlv 0to 1 5.
import Replenishment Entitlements (REP's)
3. Exporters of most of the manufactured goods, including engineeringgoods, receive REP's for maintenance imports. The value of the entitle-ments is shown as a percentage of f.o.b. value of the export in a list whichis published annually. The rates for IDA sector goods vary from 20% formotor vehicles and machine tools to 50% for storage batteries and otherautomobile parts. For maintenance imports, manufacturers normally are issued"Actual User Licenses' which are based upon the consumption of imported goodsin the preceding period and bilateral as well as IDA credits are allocated tothese licenses. The main advantages of REP's over Actual User Licensesissued against bilateral credits are (1) free foreign exchange, an advantageto exporters in terms of flexibility, price and fast delivery; (2) a widerrange of materials, spare parts and components, and even capital goods tosome extent, can be imported; (3) transferability to other manufacturers inthe same industrial sector. (In engineering industries, for example, REP'scommand a premium when transferred of about 50% of nominal value). Due tothese advantages, REP's appear to be an effective export incentive.
Preferences and Penalties in Import Licensing
4. In the Actual User Import Licensing Scheme, all firms which exported10% or mole of their production in the previous year obtain import licensesfor maintenance imports with foreign exchange from the sources of their choice.They also receive preferential treatment when applying for import licensesnecessary to expand capacity. The extent of preferential treatment varieswith the export performance of the firms. Companies which supply materialsand components to production for export are, however, not considered underthe scheme.

3 - 2
Automotive ancillaries, small and cutting tools, bicycles, dieselengines and several other industries which are considered to be in afavorable position to increase exports have been singled out and specific.export obligations are stipulated. In these industries, only those firmswhich exported more than 5% of their production in the previous year areassured of their maintenance import requirements in full and to the extentpossible from preferred sources.
Industrial Licensing
6. The "larger" houses and foreign firms are confined to a "core"-/ andheavy investment sector, and restricted from investing in other sectorsnormally reserved for medium and small industry. However, these firms maybe permitted to expand into the restricted areas if they are prepared tocommit themselves to export 60a or more of the additional production withinthree years. Also, any other firms are allowed into the areas reserved forsmall scale firms only if they commit themselves to export 75% or more ofthe additional production.
Tax Incentives
7. Drawback of customs and excise duty is available on export of variousproducts. Although only customs duties and excise taxes on the inputs tothe final stage of production for export is returned, the amounts can besignificant. Enormous difficulties arise from the process of identifyingexactly that part of the sales price which is due to import duties and excisetaxes paid by the ex)orter. For that reason fixed drawback rates have beenset for about 150 export items but for many more items it is still necessaryfor the rates to be fixed based on precise and time-consuming scrutiny ofapplications. Export market development expenditures can be deducted fromcorporate income to the extent of 1.33 times the costs. Furthermore, exportsare exempt from state sales tax in all states. In Bombay, Madras and C.lcutta,the "octroi" (a tax on commodities brought into a town) is refunded.
Export Credit
8. Short term pre-shipment credit and medium term post-shiprnent creditschemes are available. The short term pre-shipment credit granted bycommercial banks to exporters of engineering products is extended at 6'per annum and the commercial bank can discount such credit at the ReserveBank of India at 41< per annum. Medium term export credit is available throughthe Industrial Development Bank of India (IDBI) under two schemes; (a) re-financinaby IDBI at h<% interest of the credit directly provided by commercial banks atnot more than 6% interest: and (b) credit directly provided by IDBI at thesame hQJ interest rate up to a limit of two thirds of the total value of theshipment. This means that with commercial banks nroviding the remaining 1/3at 6%, export credit in the most favorable case can be obtained at an effect-ive 5 npr cent.. The second scheme was initiated in 1968 because commercial
1/ "Core" industries are planned in detail by the Government and controlledthl- ir h lacnoflnrr

3 -3
banks were reluctant to extend export credit under the first scheme. Exportcredit for 7 years; and in exceptionally deserving cases up to 10 Vonrq- isavailable. The Export Credit Guarantee Corporation extends insurance coverageon al11 ePo.Yrt.s. bnt. where fin_nnro hlr TnPT +.h_o 1relrancem ^olircri a preQcondition. The insurance coverage of engineering goods under post-shipmenternort crediit nprnmdiires is availale 1n +.ut 90Q for both conminerclln andpolitical risks.
Trade Development Authority
9. The Trade Development Authority, an ancillary organization to theMninstv.vrof - om.erxc teaa ases-bli-ed i 1070 to pw -. selectivand intensive export development of products with potential growth inHemand ini develo pedj cn ,tes. To t.hi S end, II irdust es (including auto-mobile ancillaries) and about 200 firms in these sectors have been selectedon the basis of +heir +ech- ' &nd -A -o-.me rC4- 4- for - a n
The Authority provides these firms with a package of services in the fieldsof production and marketing. For ex&riple, a "trade data bk"-.t-= wa og z-'and is conducting research and analysis of potential markets. The Authoritya'-so pro.motes technca developm.ent for export m,.erchan dse. AIost importnly,simplified procedures have been evolved for processing applications by thesefi ms for mport of mater ls and e-ort of products ad, in order to meet theurgent needs of the firms, a special allocation of foreign exchange has beenniaced at th*e A; s.4pFwJC.4- 4.. -o 1f A-uL4or- ±
Q.4 . A .. j - A 1-.QI A4 A
10-'--,. S.ince ALpil 1967U(, IiiU±a 'as operated a scneme under wnich manu-facturers of engineering goods can obtain the difference between the worldpIce and the domestic pr-ice of the steel contained in exports if and whenforeign steel is less expensive than domestic steel. For most Indian steelproducts this is rnot the case at present. Domestically produced steel isallocated by the Steel Priority Committee, and export industries are giventh.e highest priority after defense needs are met. During the period ofsteel shortages in 1970 and 1971, special efforts were made to ensure needed
i.rsofP stee'l fo eot ^vutiV-YW SJ. v U.L .LLJ YAJJI ..L1JUW. L.LU11.
0.-O>er AS4stanice
11.± Inadditi,on tu the major export. promotion schemes explained above,there are: (a) railway freight concessions, varying fron 0 to 40%, increasing"wth the distance; (b) Export Promotion Councils have been set up for each ofthe main export lines including engineering goods which conduct export publi-city and research largely financed out of the governmentis Market DevelopmentFund; (c) Government quality control and pre-shipment inspection services(since 1963); (d) for b-usLness trips abroad, firms which have a record ofRs. 500,000 or more annual export sales receive blanket foreign exchangeapprovals 'u cUver travel expenses; and (e) exporters with an outstandingexport record are eligible for awards by the Government.
Industrial ProJects DepartmentMay 16, 1973


Annex 2.4
ITVTI)A: IDA ETGbITI TNMDUSRiTA7, T-lPOR;'S C3EDT'T
.1/World Automotive Production by Comtpany ize, '965
Total 'roduction Total Percent of AveragX Voulfuie pelOutput fo . of Output World i'i rmTI
(Millions! Firms (Millions) Production (tG nearest tl,ou'.r<
Trucks and Buses
0.5 - 0.8 2 1.3 27.7 650,00o
0.1 - 0.2 10 1.5 31.9 150,0)00
0.013 - 0.1 32 .? 2K5. 38, 000
Below 13,000 206 0.7 14.9 3,n,n)C
Sub totalsand 250 4.7 100.0 19,00
Aver-age
1/ Source, ' Automotive Industries i.n Developing Countries' (.TBRD) -
by Jack Baranson, p. 88 (Table, Annex 4).
* Estimated from Source material available in librarv refererces.

4 - 2
INDIA: IDA EIGHITH IDUSTRIAL IPfTORTS CREDIT,
World Truck Production by Country andLeading Firms, 1965 1/
U°A JaPan UK Gra Bra a z
(1) General Notors (3) Toyota (5) BMC (13) VolkswaEcan (32) -i-'.Tiiys
757,000 240,900 153,200 94 ,70U 3,(A
(2) Ford Motors (4) Toyo Koggo (10) Bedford (19) Daimler-
547,000 192,000 (Vauxhall) Denz -n
(7) International (6) Nissan 112,400 (2,90 (35) Citroen
171,000 175,700 (IL) Ford (28) Fcrd 20,500( C) Chrysler Corp. (9) Diahatsu 85,300 26,800
1L3,000 137,500 (26) Xootes (40) Qpal(12) Kaiser (11) Nlitsubshi 38,200 15,()0 Ar&eYr-e r
106,5C00 110,500 (29) Leyland (42) Rheinstahl- (37) IKY
(31) --. ite (18) Isuzu 25,000 FHano,na,g 18,60
25,000 57,700 France 15,000(36) Mack (20) Fugi __Cnl ada
20,000 54,600 (15) Citroen India
Italy (21) Honda 85,000 (1T7^eneri (39) Tata(2LI) Fiat 46,700 (16) Renault Notors. r.ercedes
1i1.000 (22) Prince 72,000 ,)0100 17,000
Australia L,600 (33) Peugeot (23) Ford
(3Lh General jfotors (25) Suzuki 23,000 o,o,o
22,600 LO,000 (41) Berliet (38) CluryslerSweden (27) Aichi 15,500 17,000
(53) Volvo 33,400'5;000 (31) Hino
24,800
ii Source: 'Automotive Industries in Developing Countries' (IB RD).
by Jack Barason, p. 89 - (Table Annex 5)
N,ote: World ranking in parenthesis
Industrial Projects DepartmentMu,1 La1 t

s ' I 4 ~ ~ ~ ~ ~ ~ ~ ~ ~~~~~iji S [~~~~~~~~~~~~~~~~~'i
@~~~~~~~~~~~~~~~~~~~~~~~~~~ o
~~~1 1
8 8 § 8§ §§ o § § § N i fi n LH
~ 1.
~~~~~ t
~~~~~~ -¢

NDLTkA IDA EIGHT'H !NDUSTRLAL IMPORTS CREDIT
LICENSED AND iNSTALLED CAPA.JITY & PRODUCTION OF LIGHT COMMERCIAL VEHICLES
2/ ~~~~~~~~~~~~~~~~2 /!aiaj epo- ahindr-a & Mahindra Standard MotorsCapacity Capacity CapacltyLicensed Installed Production Utili7ation Licensed Installed Productiona Utilization Licensed Inistalled Production Utilization
1966 - 67 T.L. n.,. 1,562 I. c. n.a. 10,000 1(J,759 107 3,000 1,000 979 98
1.969 - 70 5,000 4.00( 3,147 79 25,000 10,000 9,,880 99 3,000 1,000 545 54
1.970 - 71 3,000 4,000 3,505 88 5,000 12,000 10,788 90 3,000 1,000 38 4
1.971 - 72 5,000 4,0300 :.174 79 25,000 12,000 32,103 101 3,000 1,000 633 6:3
1.972 - 73 5,000 4,j000 4,000 100 15,000 15,000 1 4 500 97 3,0)0 1,500 100 66
1.974 - 75** 12,000 5,D000 5,000 L(O 25,000 18,000 17,500 97 3,000 3,000 1,500 50**
1.978 - 79 12,000 10,000 9,000 90 25,000 25,000 19,000 95 3,0)00 3,000 2,000 66
I./ Inclutdes three wheelers.2 Inc ludes Jeeps
Est imate di* Projected
Industrial Projects DepartmentMay 16, ]973
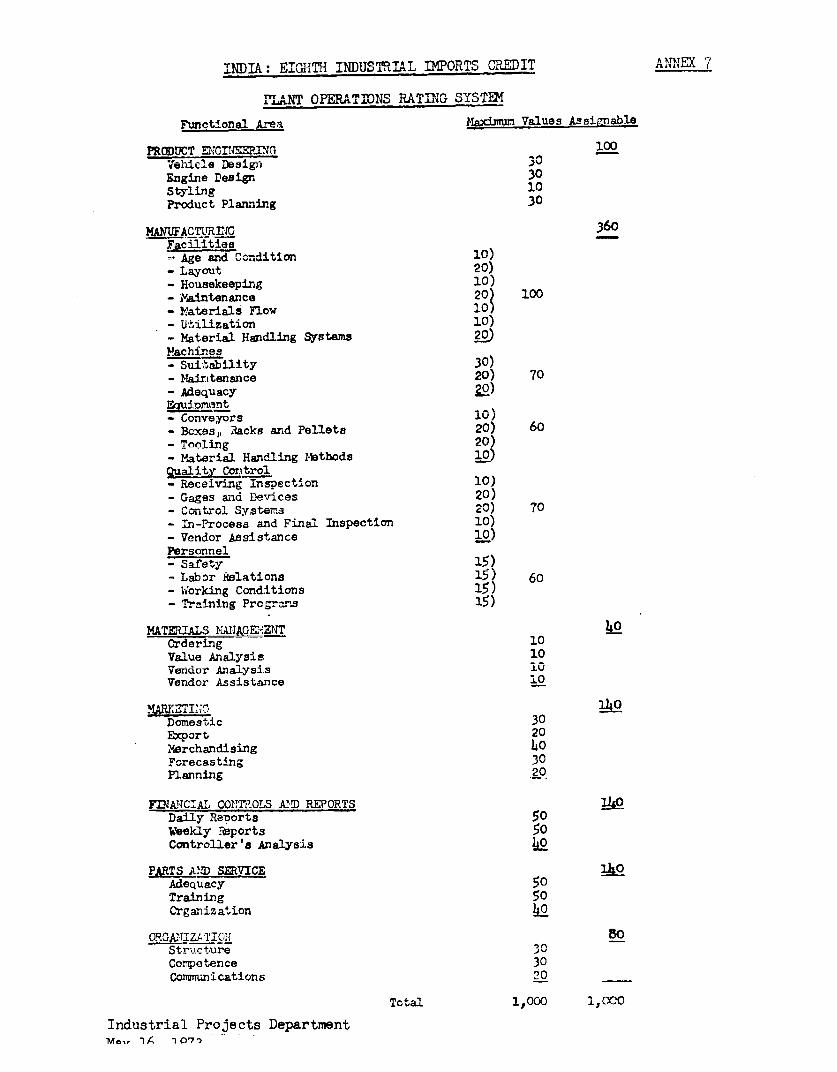
hT1:rnTA t'T(ITJfllU T1.1TT,C nR IAT " RD MC r' CPTV1'T1' A,MzTEX f 7
flY A %Ii f~fl ' r^l A IY? fl A f"MTlv~.f ~*~r'TPTy OrATMN noG TYSTc
Functional Area Xamm1 Values Assignable
PRODUCT ENGINEERING 100VeULicle De8Lign ,Engine Design 30Styling 10Product Planning 30
I'{ANtJFACTURflIG 360Facfl itiae=- arge ,d ondit40lo. 10)- Layout 20)- Housekeeping 10)- M¶aintenance 20) 100- IYaterials Flow 10)- Utilization 10)- Material Handling Systems 20)Mtachines
-Sui>,ability 30)- itairtennance 20) 70- Adequacy 20)EqUiDmOant- Conveyors 10)- Boxas,, iacks and Pellets 20) 60- Tooling 20)- Material Handling Ei*thods 1Quality Conitrol- Receiving Inspection 10)- Gages and Devices 20)- Control Sy,ste,i.3 20 7- In-Process and Final Inspection 10)- Vendor Assistance 10)Personnel- Safety 15)- Labor Relations 15) 60- Working Conditions 15)- Training Prog-.---s 1ff
MATERIALS NJUJAGE'ZNT 40Ordering 10Value Analysis 10Vendor Analysis 10Vendor Assistance 10
_ _A__ _TI_ 140Domestic 30Export 20Merchandising 40Fore castin g30Planning 20
FINLAJCIAL COL1TROLS A!D REPORTS 90Daily Renorts 50Weekly Reports 50Controller's Analysis 0
PARTS Al-D SERVICE 140Adequacy c9oTraining 50Crganization 40
OR5E'W.tIZA I'I011 soStru rc tlr 30Corpetence 30Communications 20
Total 1,000 1,CX0
Industrial Projects DepartmentYn,, IA - C071

]IDlDB, IDA EIl'HTH IN'DUSThIAL 11MBOMMKIT
ProgreSs; of T_d!LRenous Content in Commerc3al Veh.icLes
Ccmw 19161-62 1962B-6 '1- l96L-65 1965-66, 1566-67 1 967--68 19683-69 1969-70 197?0-71 1971-72
Trucks ard bUses
Te:l.co 67.0 67,,0 77.0 86.0 g91.(, 91.0 95.o 98.0 98.0 58-5 98.'
AFvhok Leyland (Comiet) 43 33 58.8 76.6 81.5 8 <. 1.5 90.C 95.0 95 .0 97.7 98.0
Prerier 74.o 74.0 7983 88.3 84.o 96 .5 96.5 98.0 99.8 99.8 959.B
'lini&astan 60.'3 60O0.9so.9 73.9 80.0o 8 .3 90.0 90.0 92.0 93.0 93.0
Jeeps 59.o 6B.o 79.3 82.9 90g'0 93.0 95 o 96.0 96.0 98.0 98.o
h.ree Wheelers 63.0 68.o 75.- 88 ,5 92 .0 95.0 95.0 96.0 97 *4 97 B
Diesel Engines 70.0 75.0 82.0 85.( 90.0 95.0 97.5 97.5 97.5 97.5 97.5
SIo''rc* Handbook of Association of Automobile Ancillary IT4anufacturers.
Industrial Projects Deipartment. co
May 16, 1973

ANNEX 9
INDIA: IDA EIGHTH INDUSTRIAI. IMTORTS CREDIT
COMMERCIAL VEFICLE INDUSTRY
FOREIGN EXCHANGE REQUIREFMT - Il41RT NEEDS 1973/74
As indicated earlier, the commercial vehicle industry- has achieveda very high percentage of indigenous content. The direct and indirectimport content average about 7 and 8% of the c.i.f. of imported vehiclesrespectively. Over 60% of the direct imDort bill is for raw materials,20% for components, 20% for tools and spare parts. Further reduction ofimnort. bill by import substitution of components, is however, unlikely,and would probably be uneconomic. Thus, it is unlikely that any substantialreduction in import requirements of the commercial vehicle industry willoccur Lntil the indigenous supply of steel becomes sufficient.
The foreign exchange requirement for the sector is estimated atRs. 261 million (about $35.1 million), - $21.5 million for materials and$14.6 million for components and spares.
Each firm in this IDA sector makes its commercial vehicle undersome form of collaboration agreements with well-known international Westerncompanies, i.e., each nnit has its own particular requirement not only asregards volume of foreign exchange but also its source. For exa=nle, Telco(Mercedes-Benz) needs West German currency to obtain components for finalassembly of their vehicles whereas Ashok Leyland and Hindiistan Motors(Bedford) require sterlilg for this purpose. Premier (Fargo/Dodge) needsboth sterling and US dollars as one model is TK-ba9ed and the other US based.Similar limitations apply to machinery spares according to the origin ofthe imported machinArv and plant ntstalled, Tied frnds for these uses -components and machinery spares - are available from West Germany, and theUnited lingdon. GGTj therefore, allocates ht1hese bilateral cr ts in thefirst case and then supplements where required with IDA credits.
As regards imported raw materials all of the manufacturers ofcomiorcdall vehicles -refer that their import licenses be isued against IDAcredits on account of the following:
(i) IDA licenses enable them to purchase the materials required bythem'rom the most c-etitive gources from th0e point of of qu
specifications, prices and deliveries.
(ii) The terms and conditions subject to which IDA licenses are tobe opnrated are m-uch less rigid than the ters and conditions subject lowhich the import licenses under other; tied credits can be utilized. IDAlicenss tlherefore.j pro.t At a much greater sco-e to phase out puarclhsesof materials in the most economical manner. For all practical purposes,the m A license i -" inventory since it cn be converted into materialsin the quickest and cheapest possible manner.
(iii) Tied credits have obvious disadvantages. To enumerate the principalones - (i) materiAls m, not be jUst available or not available to the exactspecifications required by them from the source to which the credit is tied;
9-2
(Ii the operation of Jr,mport license agains tied cet ii
and. time consuming; (iii) the validity of tied credits is often not, aslong as they require; and (iv) the suppliers fromn th'e source to whic'the credit is tied know that the Indian buyers have no alternative excep.to approach them and hence negotiate prlces fror an advantageous position.
It is evident that in this industry IDA funds allocated and IDA iJcensesissued are being fully utilized as are tied fuuds from Wlest -erman,- UK
and. above all, USA.
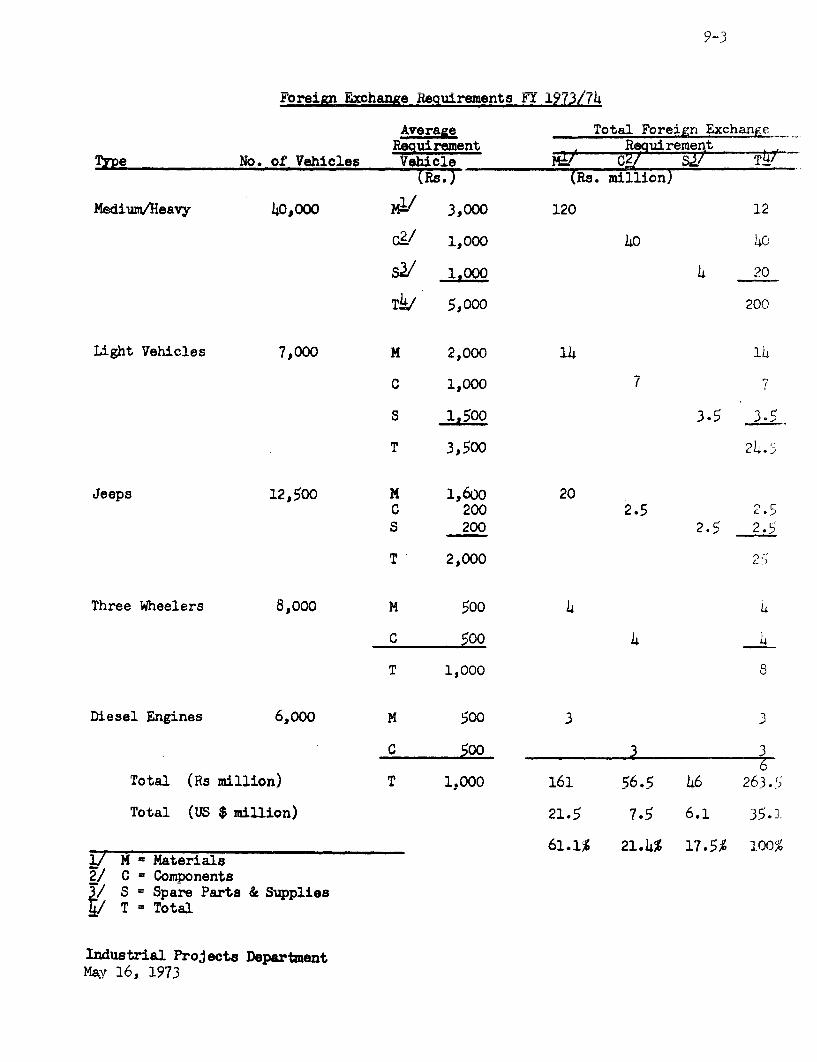
9-3
Foreign Exchange Reauirements FT 1973/74
Average TotaLb F BExchaneReauirement Suiremep
Type No. of Vehicles Vehicle Mf Ct/ sa/ T±(Rs.) (Rs. million)
Medium/Heavy 40,000 Ml/ 3,000 120 12
G_2 1,000 40 40
SV/ 1.000 4 20
TV/ 5,000 200
Light Vehicles 7,000 M 2,000 14 14
C 1,000 7
S 1,500 3.5 3.5
T 3,500 24.
Jeeps 12,500 M 1,6oo 20C 200 2.5S 200 2.5 2.5
T 2,000 2;
Three Wheelers 8,000 M 500 4 4
C 500 4 4
T 1,000 8
Diesel Engines 6,ooo M 500 3 3
c 500 3 36
Total (Rs million) T 1,000 161 56.5 L6 263.5)
Total (US $ million) 21.5 7.5 6.1 35 '
61.1% 21.14 17.5Z 100%1/ M Materials2/ = Components2/ S = Spare Parts & Supplies
T - Total
Industrial Projects DepartmentMav 16. 1973


10-2
AS'nD LEYLAND}
FINANCIAL PERFORMANCE
1968/6Y 1969/70 197()/71 1971/72'
Profit & Loss Account Information;^
Sales (excluding excise tax) 265.1 305. 339.5 |
Materials & Bought Out (B.O.) Parts 199.1 232.7 262.0Salaries, Wages & BenefitsProfit before tax and interest 23.9 27.4 27.7Profit before tax 16.5 21.5 20.4Profit after tax 9.7
Balance Sheet Information
Fixed Assets 75. 73.5 75.6Current Assets 15I.5 1t73.3 1895Current Liabilities 52.1 64.3 6
Debt 61.8 64-7 69.L Equity 114.2 118.2 128.2
Capital Eaployed 176.0 182.9 197.6Total Assets 228.0 247.0 265.1
Others
Value Added 65.o 72.7 77.5NO. of msployees 3700 39;15 11190Inventories 73.9 81.9 92.5
General
Sales T Total Assets 1.17 1.25 1. 30Sales i Capital "lployed 1.51 1.79 1=74Net Profit before tax / Sales | 6.95 6.95, 5.911
Structural
Fixed Assets / No. of Employees (1000 Rs I Employee) 20.4 | 18.7 18.0Materials + B.O. parts / Sales 0-73 0 7 0.75
Managerial Performance
Net Profit before tax and interest / Capital _ro.edA 13.AS8- i 6 1 5.53X
Value added / Capital EWloyed 0.37 0.40 0.39Value added 0 d A.86 1.02Value sdded / No. of Employees (1000 Rs / Employee) 17.6 18.iO0 18.50Value added / Re Labour 2.99 2.11b 2.52
Sales / Inventories 3.60 3.64 3 43Materials & Bought Out Parts / Inventories 2.62 2 67 2.77
Fi^n^ancal Performanc^e I
Debt / Equity Ratio 0.541 0.55 0.54|Current Assets CuFrrent Liabilities 2.91 2.67 2.73
Profit after tax & intereat / Equity 8.51% 9.23% 7.26%
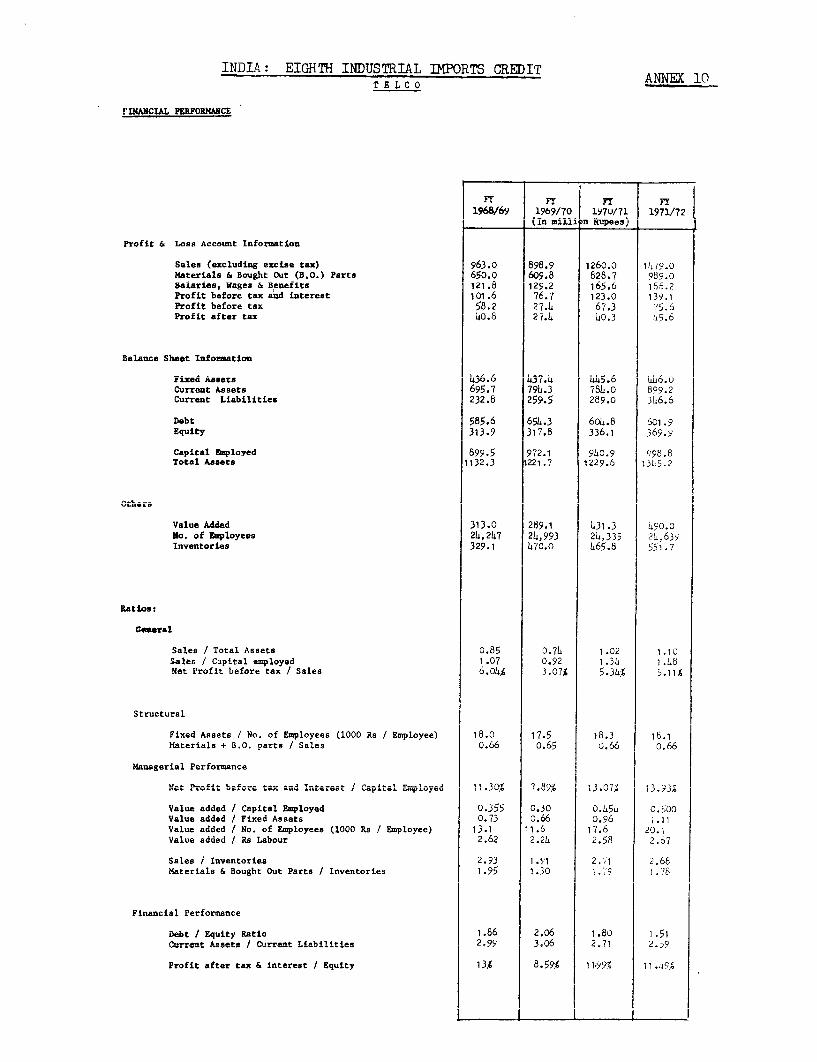
INDIA: EIGHTH INDUSTRIAL IMPORTS CREDIT ANNAC 10T E L C 0 -
rINANCIAL PERiORMANCE
BT Fl F FY1968/6y 1969/70 197u/71 197V172
kin msiwlin xupoes)
Profit & Loss Account Information I I
Sales (excluding excise tax) 963.0 898.9 1260.0 1479.0Materials 6 Bought Out (B.0.) Parts I65o.o 16o9.8 1828.7 sas8.o Salaries, Wages & Benefits 121.8 129.2 165.6 lbS.2Profit before tax asnd interest 101.6 76.7 123.0 139.1Profit before tax 58.2 27.4 67.3 75.6yrofit after tax- 4* 0 2L.4 4O.3 b5.6
Balance Shoet Information -,
Pixed Assets i4-1; u. w:.oCurrent Assets 695.7 794.3 784.0 8s9.2Current Liabilities 232.8 259.5 289.0 34 6 .6
Debt 585.6 654.3 3 60.8 601.9Equity 313.9 317.8 336.1 369.9
Capital Szployed 899.5 972.1 980,9 998.8Total Assets 1132.3 1221.7 | 1229.6 | l345,.2
Others ValueAddI
Value Addded | 313.0 928.1 | 31.3 | 90. |No. of ployees i 24,247 252,993 25,335 20,639 Inventories 329.1 470.0 | 65.8 55 .7
RatiosI
Sales / Total Assets 0.85 0-74 1.02 1.10'-'es / Capal ... ,loy0d 70 01. . CNIt Profit before tax / Sales | 6.0 | 3.07%| 5.35 | .1
Structural
Fixed Assets / No. of Employees (1000 Rs / Employee) 18.0 17.5 18.3 1b8.1Materials + B.0. parts / Sales o.66 0o.65 | 66 | 0.66
Managerial Performance
N.et Profi: before. t:^x a.nd In.terest / Capital 'lyd |1.0 .9 30< 11.3
Value added / Capital Employed 0.355 0.30 0. v 55 0.500Value 0.73 (0 Fix-e Ast wvValue added / No. of Employees (1000 Rs / Employee) 13.1 1116 117.6 | 20.IValue added / Rs Labour 2.62 |2.25 2.58 2.67
Sales I Inventories 2.93 1.1 2. 1 2.68Materials & Bought Out Parts / Inventories 1.95 | 1.30 1.79 .78
Firmaneial Performn^ee
Debt / Equity Ratio 1.86 | 2.06 1 .80 | 151Crr t Assets ! Current Liabilities 2.99 I 3 6 2.71
Profit after tax & interest / Equity 13% 8.59% 11.991% 11.n9%

10-3
FINANCILAL PERFO.RACE
FY FF FY i -1968/69 1969/70 197I/71 1971/72
(In millil m Rupees)
Profit & Loss Account Information
Sales exc.1uing exsc,ie tax), 306.30 3 329.25 382.50Materials & Bought Out (B.O.) Parts 208.8o 227.50 26h.50Salaries, Wages & Benefits 70.20 74.70 79.50Profit before tax and interest -55.60 -56.70 -54.10Profit before tax -71.10 -69.60 -67.0Profit after tax -71.10 -69.6,, -67.oo
Ralancre Sheet lnformationnlll
Fixed Assets 1.80 161 ,. | 1&680Cllrrent Assets 1 60.7i) 172.j'J , 173.8 Current Liabilities 5B8.70 ,7hI00 o 1 .50
Debt 157.30 156.70 153.90Equity |1 o.oo 105.80c 105.80
Cauital Emmloved 261.30 262.s0 259.70Total Assets 316.50 333.70 338.60
Others
Value Added 97.50 102.50 118.00No. of Employees n.a. n.a. n.a.
Inventories 116.50 126.1,o 129.20
Ratios:
Gene ra
Sales / Total Assets'ales / Capital amployad 1.17 I .2'. 1 .07Net Profit before tax / Saleb
Structural
Fixed Assets / No. of Employees (1000 Rs ,Emiployee) | l.a. n.y. | r.a.Materials + B.O. parts / Sales o.68 o.69 o.69
Managerial Performance i
Net Profit before tax and Interest / Capital Employed
Value added / Capital Employed 0.37 J 0.39 0.45bValue added / Fixed Assets 0.62 0.6L4 1 . 72Value added / No. of Employees (1000 Rs / Deployee) n.a. fI n.a. | .s.Value added / Rs Labour 1 .35 1i37 19.
Sales / Inventories 2.63 2.61 2. 5Materials & Bought Out Parts / Inventories .0 i.uL
Financial Performance
Debt / Equity Ratio 1 .51 1 L L.s5Current Assets / Current Liabilities 2.73 2-32 3-37
Profit after tax & interest / Equity
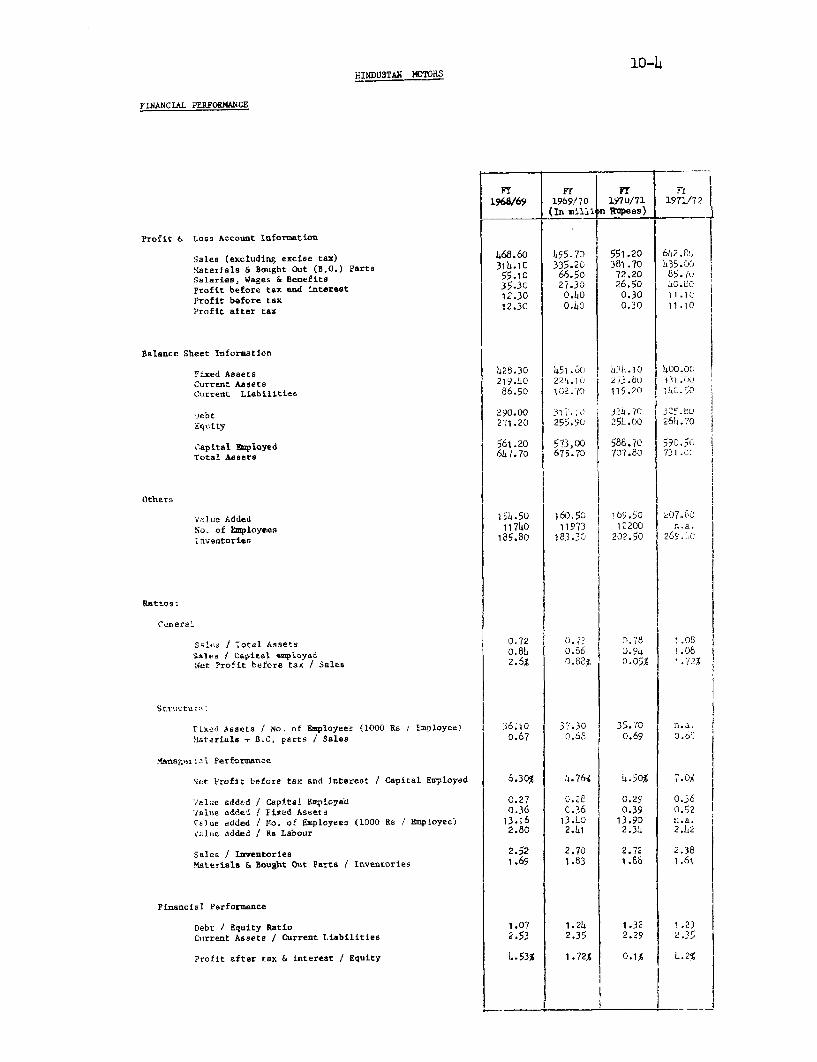
HIND1USTAN MNOVRS
FINANCIAL PERFORMANCE
-1968/69 19/70 I|lU/71 1971/72| "a" _ (In MillilIn _ _pes-) _
Profit 4& Loss Account Information I |
Sales (excluding excise tax) 3360.60 45.3 10 551.70 4625.M0
Materials & Bought Out (B.0.) Parts 35.iO 65.2 387.70 835.0 j
Salaries, Waazes & Benefits 55.10 66,50 72.20 85.70
Profit before tax asud interest 35.30 27J.3 265 LU.CVProfit before tax 12.30 0.40 0.30 11.1C Profit after tax 12.30 0.40 0.30 11.10
Balance Sheet Information |
Fixed Assets 428.30 45i ,6c ICh)O 1 00.00Current Assets 219.LO 2254.10 j 2(3. o j3i ICurrent LiabiLities 86.50 102.;') 119.20 1405,0
i7jebt 290.00 j1 1 t.! .v'c 3:1.u0
rquity 271.20 255. it 251;.0 264.70
Capital acloyed 561.20 573,00 500.7U 595Total Assets 607.70 675.70 707.80 731I
Others ,Value Added I 5150 160.5o I 169.50 | 207. 0No. of Employees tt740 11973 12200
inventories 105.00 1C);.'. Lur.t 1269.1 j
Rattos:
Ceneral
Sales | Total Assets | 0-72 | Li 0.78 1.0 Sales / Capital .viployad | o81 1 0.D6 0.94 1.08Net Profit before tax / Sales C. 0 t1
Str':.tuc:n
Fixed Assets / No. of Employees (1000 Rs Eployee) 36 n.a.Mlaterials , B.C. parts / Sales 0.67 o.68 0.69 3.6
Marlagnritl Performance I I
Net Profit before tax and interest / Capital Employed 6.30% 4.76% | 4-.50% 7-0
VJelite sddtd I Capital 9m;)loyed R 0.27 / E y 0.9 | 0.Valuse added J Fixed Assets 0.36 C.36 0.39 0 0.52Value added J Nlo. of Employees (1000 s / Employee) 13.90 na iu
value added / Rs Labour 2.80 2.41 2434 22 h
Sales / Inventories 2 2.72Materials & Bought Out Parts / Inventories 1.69 1.83 | .8 |
Financial Performance
Debt / Equity Ratio 1.07 | 24 1132 1.23Cuirrent Assets / Current Liabilities 2 53 | 235 2 2.9 2.3
Profit after tax & interest / Equity | 4.53% 1.72% 0.1% 4.2%
_ _ _ _ _ _ _ _ _ _ _ _ _ _ _
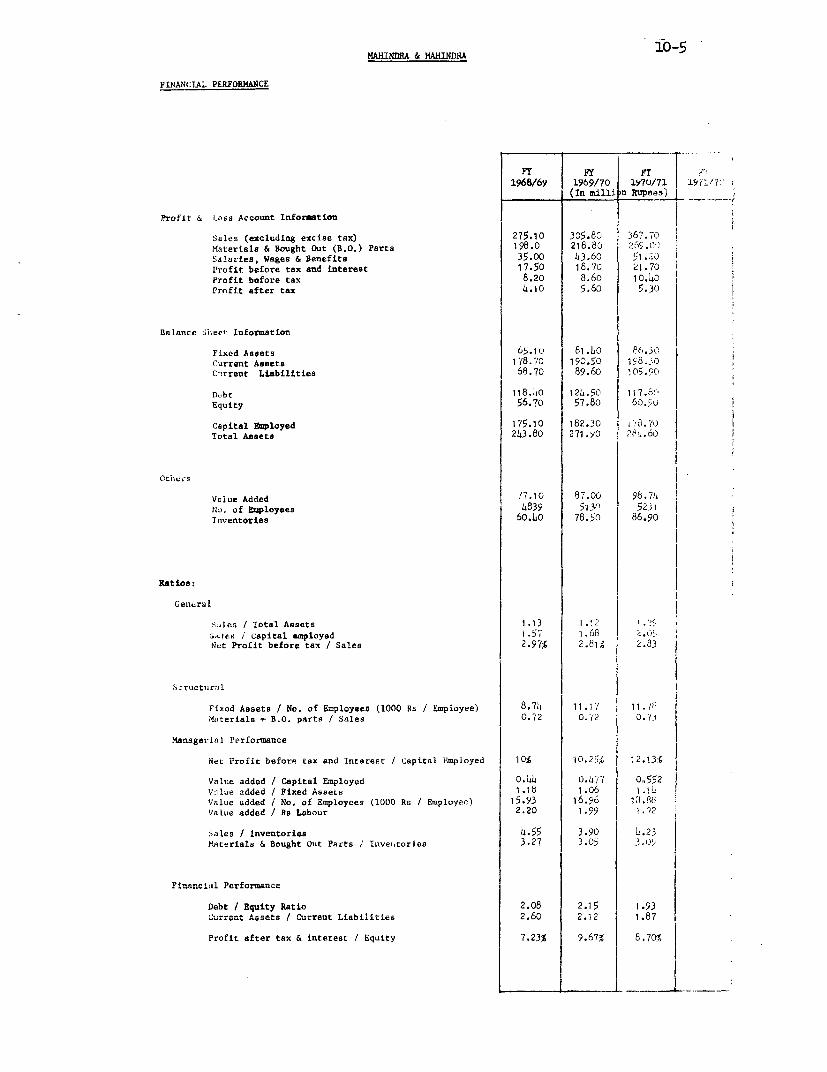
io-5MAHINDRL & MAHINRA
FINANCIAL PERFORMANCE
1968/69 1969/70 |1F7l/71 |9ly1 7| { ~(In millim) Rupees)
Profit & Loss Account Information ( m .
Sales (excluding excise tax) 275.10 305.80 367.70Materials & Bought Out (B.O.) Parts 198.0 218.80 206.(Salaries, Wages & Benefits 35.00 43.60 51-:-)Profit before tax and interest 17.50 18.70 21.70Profit before tax 8.20 8.60 10.4h0Profit after tax 4.10 5.60 5.3o
Balance SieeI Information
Fixed Assets 65.10 8i.Lo ee'.3ClCurrent Assets 178.70 190.50 198.30Ci-rrent Liabilities 68.70 89.60 105. 9c
D,bt 118.00o 124.50 1 117. 82Equity 56.70 | 57.80 60.9,!U
Capital Employed | 175.10 182.30 70Total Aasets 243.80 271.yO 2iV,.6 )
U1ti;e:rs
Value Added 17.1O 87.00 98.741o. of Employees a839 5i Y, 52i1
Inventories 6o.4o 78.50 86.90
Ratios:
Cen.ral
Sales T Iotal Assets 1.13 .12 1.?9&.~1es/ Capital amployed i.5I 1 iNet Profit before tax / Sales 2.97% 2.81 I 2.33
Structur lI
Fixed Assets / No. of Employees (1000 Rs / Employee) 8.74 11.11 1 i . jFMaterials + B.0. parts / Sales 0.72 0.72 1 0.7
Managerial Performance I
Net Profit before tax and Interest / Capital Employed IUI 10 jl0. 12.1.b
Valoie added / Capital Employed | 0.0 | .77 0.552Vnlue added / Fixed Assets 1.18 1 jo .i !Value added / No. of Employees (1000 Ra / Employee) 15:93 16.96 j3.2lValue added / Rs Labour 2.20 1.99 1.92
Sales / Inventories 4.55 3.90 4.23Materials & Bought Ouit Parts i Inventories 3.27 3050
Financial Performance
Debt I Equity Ratio 2.08 2.15 193CurrenAt Assets / .8rr7nt Liabilities I 2.i2 ]:of
Profit after tax & interest / Equity 7.23% | 9.67% 8.70f

10-6WAJ& TDW0
FTAcA DVD.^tDiU, AW
lio/yW loy I,0j7 iLyfvj7 j11(In millil n Rupees)
Profit & Loss Account IfoarpIn n
Sales (excludUig -esise tax| 46.40 56.40o 63.20Materials & Baugbt Out (B.O.) P?rts 34.80 41 o .43. Salaries, Vages & Emfite 36 .8Profit before tax and interest 2.80 6.00 6.goProfit before tax 1.00 4.40 5.40Profit after tax 0.90 3.90 3.40
Balance Sheet Inforunation
Fixed Assets | 14-00 18.10 12'.70Current Assets 20.00 24.40 130.6Current Liabilities S o.L0 10.13
Debt 16.70 17.30 | .20Equity 11.40 I0B.80 1 0. 2. 0
Capital EWlayed .10 36-10 |11.20Total Assets 14..u i4e.>U >I .
Otbers
Value Added i1.60 5.5°No. of Employees n.a . n.a. j1713Inventories 16.60 20.59 25.65
Ratios:
General s
Sales ota Assets Sales ICapital smp;oyed 1.605 1.57 i:1.! 1Net Profit before tax / SaLes 2.15 7.80 8.,!
Structural ||Fixed Assets / No. of Employees (1000 / Employee) n.a. n.a. 2.10
ffaterials t B.O. .parts / Sal 1 ° U.75 J u.(U
Managerial Performance INet Profit before tax ad Inte / C'aptal 'nuployed 12.99 16.62 j6.7
Value added / Capital z-loyMd I u*u.I -I value~~~~ aae I Ua:r per4 I .U: U.) sI 0).sJ 1-
Value added / Fixed Assets 0.82 0.85 0.916Value added / No. of gployees (1000 Rs / Employee) n.a n.a. 12.10Value added /-as Labour 3.16 3.It )-)a
Sales / Inventories 2.79 2.71 | 2.46Materials & Bougnt wtr Parce i luvenrtorles -.1 1.99 1 i.6L
Financial Performance
Debt / Equity Ratio 1y46 0.92 0Current Assets / Current Liabilities 3.41z 3.81 3 0
Profit after tax & -a,aLuat / .quity 7.89 2G.70Y 5
Industrial Projects Departmentmay 16, 1973

ANNEX 11
TNfTA: mTA EIT¶T TP nMTTqTPTAT. T7PORT rP,nTT
Economvic Analysis
JJe policy of Iiumpor-t subtiLUU1U1 1oluLwe. b-y ±ldiKLa s.L1ICe YWVM' TL- X±
had the twin objectives of improving the balance of payments and stimulatingdevelom,,ent of indigenoUus mn UfacTuring. The principal instruments used toimplement this policy in the commercial vehicles industry are industrial licen-Sing, inuLgenIous content requiremenTs, restrictive import iicensing (quantita-tive restrictions on importing items manufactured in India). In addition,exports are encouraged by a set of incentives including duty drawback, cashsubsidies, import replenishment entitlements and relaxation of industrial licen-sing constraints on 'larger, houses exporting a determined share of their out-put. This system of export incentives is usually coupled with a set of exportperformance criteria that specifies the firms' obligation to export a share ofthe output.
The purpose of this Annex is to evaluate the degree of protection im-plied by the set of measures listed above and the current price and cost com-petitiveness of the industry. The concepts used for this purpose are used inthis section to measure the extent of protection and the cost competitivenessof the two industries are:
1. Simple price difference2. Adjusted price difference with inputs at international prices3. Effective rate of protection4. Domestic resource cost of foreign exchange
They are defined as follows:
1. Simple price difference is defined as the percentage excess of the ex-factory price of the product to the CIF value of a comparable product. Thismeasure is used as an indicator of gross protection in the price of the finalproduct_J.
2. Adjusted price difference with inuts at international prices is definedas the pecntg 6xe~ftee-factory price of the product with inputs atastepercentage excess of ipthe exprices which would prevail under free trade conditions over the import of c.i.f.price. This is the protection which the item would require if the domesticmanufacturer were to pay for both imported and domestic inputs the prices whichwould obtain under free trade conditions for a like import, given the existingproduction efficiency. It is lower than the simple price difference by ineffi-ciencies and/or high profits in the supply industries, or high cost material andequipment.
1/ In e presence of quantitative restriction, as is the case in India, thereare conceptual difficulties in interpreting the implicit tariff obtained hythis measure since there is no guarantee that the real equilibrium (importand domestic output levels) will remain unchanzed in the economv if nnantfi+a-tive restrictions are replaced by an explicit tariff of the same magnitude asthe one implied by the simple price difference. Nevertheless. t.he measirP isa good approximation to a gross protection in the price of the final product.

-1 -I-_
procurement or higher domestic cost caused by protection or a revenue orientedtariff system.
3. Effective Protection. The concept of effective protection refersto the protection of a process as distinct from the protection of a productitself. It is defined as the percentage excess domestic value added, obtain-able by reason of the imposition of tariffs and other protective measureson the products and its inputs, over value added in a free trade situation.It includes the joint effects on the process activity of protection of theproduct and its inputs.
The effective rate of protection calculated applies to the conmmercialvehicle manufacturers' activities only. As such, it is the private (asopposed to social) effective rate of protection and is meant to providea rough measure of the "resource pull" into the activity in question. Twoeffective rates of protection were calculated for every product; one for theimport substitution activity (95% of output) and the second for the exportactivity; the difference between the two indices gives a measure of thebias against the export or import substitution activity.
The principal instruments of protection in India are quantitativerestrictions on imports and/or prohibitive tariffs, thereby necessitatingthe use of domestic import prices (actual or estimated) in calculating theeffective rate of protection rather than tariff. In making price comparisonswe have taken the ex-factory cost of the vehicles to be the relevant domesticprice for the output; for the inputs the relevant domestic prices are theex-factory price of suppliers plus the indirect taxes paid by the comnercialvehicle manufacturer. These prices were then compared to the c.i.f. pricesof imports. For commodities which were not imported because of either prohi-bitive tariffs or quantitative restrictions, we have estimated the c.i.f. pricethat would obtain if imports were to take place. For this nurpose we haveused the prices of potential suppliers adjusted for quality differences,and added transportation cost from the country of origin to India.
To calculate the effective rate of protection for exports. the valueof the export incentive is added to the f.o.b. export price to arrive atthe firm's cash realization from exports. Export incentives that havebeen included in the study are the cash subsidies, the duty drawback andthe replenishment import entitlements. Ynort credit preferential creditrates have been excluded, because they are relativeJy negligible. One ofthe major difficulties in arriving at an estimate -f +:h domestic valueadded, and thus for an effective rate of protection for exports, is the dif-ficultv in arrivinr at a reliahle nrenmim on t.he imnor+. repn s:hment entitle-ments. This is due to a number of factors. First, the segmentation of theimport entitTement, markets (rdie tn +.'he riule governing transferability ofentitlements) means that the level of the premium varies from commodity tocommoditv. Second. the oremium= varies rwith time within each ml arket. Thefactors that might determine the premium include the entitlement rate, therestrietiveness of the permissible import lists the exnrectation aloutdomestic shortages of inputs, and the anticipated and future inflow of en-titlements into +.he commercial vehicles and related indus-es ma1 t.

11-3
When sold, the premium on REPs has varied between 40 and 60; with an estima-ted average of 50%; it was never belo. 25%. The effective rate of Yro-tecf-.onfor exports is thus estimated for 3 different premium levels on imporL en-titlements: a) no premium; b) 25%; c) 50%. with the latter being the ex-pected premium on the import entitlements.
Value added can either be defined in terms of gross or in net terms,depending on whether we include or exelunde denreciation on building,.nar:h±neryand equipment. To measure the extent of protection, the latter formja ,nis more ananronriate since it. ta-k accoAun+. of the fact that, investmanr, goodsare inputs, and in large part internationally traded inputs and has been used.
The Corden method has been followed in the treatment of non-tradedi nnputs* - .48 .4 1s. 4.J.. +1% d ctrl- UaAA-A 4- 4 p.odu -or, Oa - -..W--- - WUA.MLU-LO L "% J.L WAAJA -~ * %AW M%"W. A A." LA1O IJL-jUU% .; .UIA LAL LtLIC LLJIi--
traded input in the processing of the activity in question.
4. Domestic Resource Cost. This is defined as the domestic resource cost_~1 ~man+r (A"t.4 o_+nA 4 ysA4 ,,,,+ 5 r.-# g ,w,p.A,,.4 rQw 4-1 A; Pf'ar->-o -o-Y.roov,hc
J ti \ v _ v av.A A ' J NJ~ 0. vJa vJ d v- NJ V N. wSVII v_ . NJ __
c.i.f. value of imports (or the FOB value for exports) and the direct and in-'-~ '~ ~-- "~ ~-6~ ~S0J~NJ % .WAY~V J± J.L . JJ LLA.) I d.,U CL Ul L _II NJ-L O , L ,
rate) required for domestic production. It provides a measure of efficiencyofP +'k- A^.oe ir.dustril st-ructure ofP wh1e sec4tor icu- hs;leran1-NJ l ~ A*N.W--NJ ~ U %" ~C L 0. UI. U_ LUI L J. I1 ~ WI1.9L'4ULL, II 0U~JIJ_ 1
sub-supplier industries for this product. The activity is economic if t}is_d.. - ls--s 4-.- _ "-- 4.- .4. e 4-.
4."A± L -4r VIjLI tUUILO0 U±OU I jVU±L~ L;U, CL-Ld.± ±11AU±L 11VU, jJd2.± U,~ d.L.U
components are treated as "home goods" since it is doubtful that most suip-pJlAiers WvoLALU u-v±ve t± L4IUt Wit UUbe 04. orVde1[FLt±I.UXLa_L VeIcleU mU_ uda; U-ers
in India.,!/ Locally produced materials and supplies were also treated ash±omiie goodus S-nce it was found thatby- aU lar-ge, domesLic cost of pruuucLw,u
lie between the c.i.f. price of imports and f.o.b. of exports.
In calculating the domestic resource cost, market prices were adjustedto reflect the opportunity cost of the factors employed directly and indirectlTin producing the velicles. Discriminatory taxes (import duties, excidse tax,etc c were excludeUd fromi t±-e UOlLtebstiC -euce costs since -Uney 2epr-sea atransfer payment within the economy. However, non-discriminatory taxes wlereincluded in Lhe dome3tic cost element since they could be considered as feespaid for services supplied by the Goverrnment.
Return on capital employed (paid up capital, reserves and surplus,plus long-term debt) in firms for wnich we have calculated the domestic re-source cost were found to range between 13.5% and 16.56, which is approximatelyequal to the opportunity cost of capital in India (assumed T5%). The sameapplies to the combined return on capital of the suppliers and sub-suppliers.
1/ Export of components account for only 5% of the value of the ancillarvoutput, and even then a large part is done to meet the firms? obliga tionto export.

11-4
In addition, it is estimated that the wages and salaries paid tolabor (73% skilled, 9% semi-skilled and 1% unskilled) and supervisory per-sonnel (14,. technical, and 3% non-technical) adequately reflect opportunitycost.2/ Accordingly, ex-factory prices of "home goods" have been used,after adjusting for discriminatory taxes as an adequate approximation ofthe shadow price of domestic factors.
Data
The data used in the calculation of the above measures of pro-tection and competitiveness were obtained from questionnaires sent to theproducers of commercial vehicles and was further supplemented during themission's visits to the firms. The data obtained, on a confidential basis,consists of:
I. Prices of final product:
1) ex-factory cost2) import price of a comoarable nrodict (c.i.f.)3) export price (f.o.l.)
Major differences between the locally produced product and the exportedone were also described.
II. The Cost StructuAre of the. PrrdAm-+.
1) Raw Materials Inputs: a) locally produced; b) im.ported2) Bought out Components: a) locally produced; b) imported3) Lahbor (incluling benefits)4) Manufacturing expenses and overheads
6) Sales Expenses7) Tntp.er.t
8) Taxes9) Prnfit+ af+tePr +tx'
III. rhi+y -ran+ts oni Jm"p,-d material aTIT_ P"Joa 'k-+--~iJ~~ lila U -a1 -JlJ lAJljJJlOi-i
IV. Price comr>ari son between the o1,ally produced boughut compOM-r, -s
and comparable imported products.
V. Export incentives, including:
1) Duty drawback2) Cash suid4ie4-
3) Import replenishment entitlement
1/ bour consists manly of high school graduate recruited and trained fora period of 2 to 4 years at a cost of Rs 20,000-30,000 Rs/man. The wagesand benefits of skilled labor (avevraging Rs 3600-6000) are thus approxi-mately equal to the opportunity cost (assumed 15%).


11-,
VI, Annual reports for the last three financial years.
VII. Composition of labor and training cost of labor.
Industrial Projects DepartmentMay 16, 1973

INDIA:_ IDA EIGHTH INDUSTRTAI, I14PORTS CRIm)IT
STERUCTURE CF EXORT MRE;T
Cormnercial Vehicles axd_Aare Parts (1969-72)(Rs. Nillicns7
Source Telco Ashok- Hindustan Premnium Mahindra & Bajaj Stadadd Total Share ofDestination Leyland Motors M? tors Mahindra Tempo MtA:rs Countxy
Ceylon 59.62 35.16 2.12 0.04 1. 66 1. 17 0.06 99.94 26.34
Egypt 101.33 - 7.31 1.41 0.0)3 0.61 110.69 31.16
Yugoslavia 19.22 - .. 28.92 0.05 _ 48.19 13.73
Persian Gulf 17.15 - _- - 0.014 - 17.19 4.83
Nigeria 40.30 _ 1.32 0.03 - 41.65 11.71
East Africa 3-29 0.20 _ * 0.14 - - 3.89 1.10
Eastern Europe 5'.29 - _- - 5.29 1.49
South Eas,t Asiia 4.88 1.22 2 . 2.39 - - 8.49 2.41
Others 0.69 2.912 0.81 5.75 5.-78 0.04 2.03 18.25 5.23
252 .10 39.50 10.23 7.24 40.10 1.94 2.09 353.53 100.,00
Shere c,f Finr 70.80 11.35 2.994 2.08 11.614 0.56 0.60 100.00iLn
Source: IDA estinates
Indus-trial Projects Depaxtnerktmay 16, 1973


COMPARISON BETWTEEN DOMESTIC AND EXPORT PRICES AND REALIZATIONFO COMM(ERCIAL VEHICIZ-S - FY197IF7-2 -
Telco Ashok- Hindustan Premier Mahindra & Mahindra Bajaj TempuLeY land Viking Mlatad<r
7-i Ton Coment 78 ton 7}; Petroi Jeep Jeep, Truck Delivery Pick-uipChassis _Chassis Chassis Chassis _ Van Van
A. Domestic Sale
Ex factory price 53,768 tl,613 'c',459 47.701 20,700 24,000 20,655 27,567
B. Export Sale
B1 F.O.B. 33,000 37,000 t3,80, '3,00C 3 ,',4Ji 15,000 15. 750 12,438 1.7,088
B2 Dutv Drawback 6,000 6,000 4,056 5,000 2,031) 9C0 900 1,617 2,222
B. Cash Assistance 0.25 B, 8,750 5,, 250 10,952 8,250 9,612 .,000 3,93 .3,l1'J 4,272
B4 Import Entitlement 0.20 Bi 7,500 7,400 9,,0 6,600 7. 6C: 9 00(! 3,1.50 2,488 3,417
C. Realization on Ex' ort
C1 No premium on B4 49,7-50 52.250 5S,bl.. 4i,2'50 50,062 18,900 20,587 '7,65 23,582
C2 25% premium on B4 51,625 54,100 51,254 48,9100 5i2985 19,250 21.,374 17,787 24,436
C3 50% premium on B4 53,500 55,950 63,19 5t1, 550 53.,908 20.40( 22,162 18,409 2!5,29S
D0 Export Sale Realization -
Domestic Sale Realization
D No premium on B4 (4,0!8) (1,513) l2,799) 2,361 (I,S00) (3,413) (3,490) (3,985)
f- 05'5 premium on B4 2,368) 332 ( 3 3%9i 441) 4,284 (1,65U) (2,626) (2,868) :3.130)
53: premium on B4 ( 518) 2:.17'2 2,0Pi 1,0!91 6,207 ( 200) (1,838) (2.246) (2,276)
E. Expert Price/Domestic Price, B1 /A 0.6.5 0.69 0.71 0.68 0.81 0.73 0.66 0.60 0.62
1/ Ectimnaed f.o.b. export: price to Eg-t.2/ Estimated f.o.b. export: price to Ceylon.3/ Estimated4/ Ca,h assistance fnr jeeps is 20'7 of f.c.h. export pri.ce.
* Estimated
Industrial Projects DepartnentMt-., i6. 1971
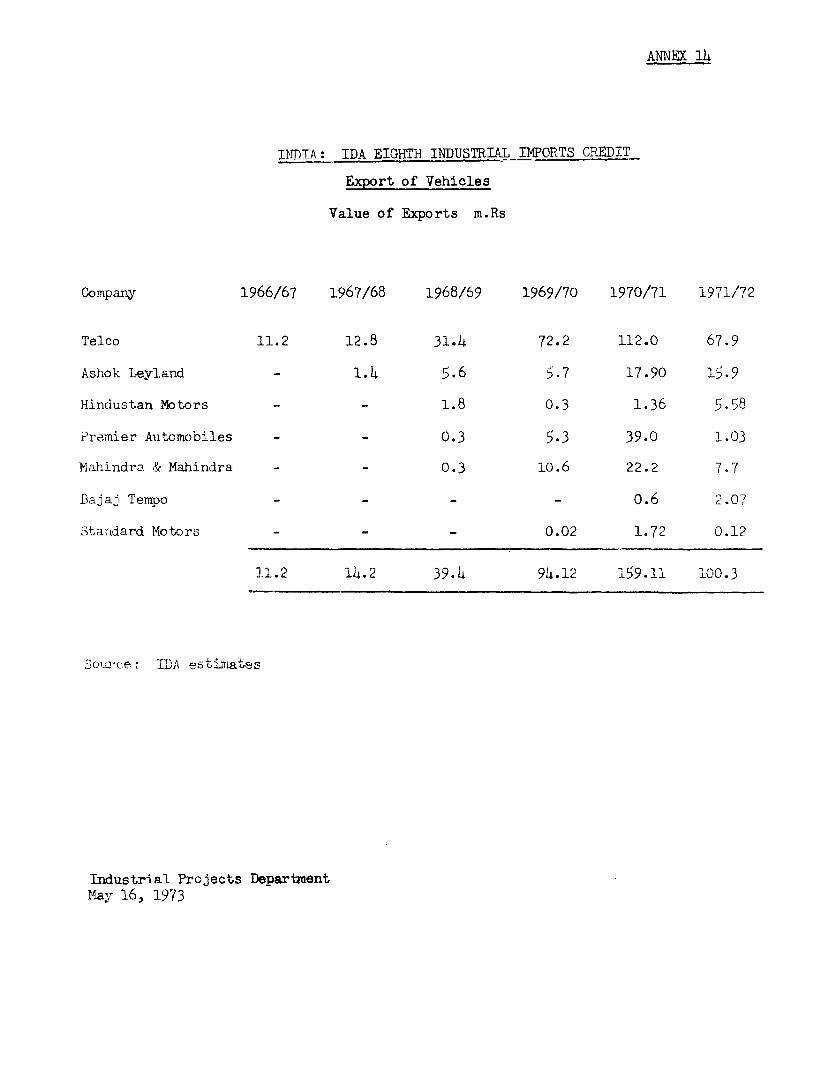
ANNaI 114
TDTIA: IDA EIGHTH INDUSTRIAL I1ORTS CREDIT
Export of Vehicles
Value of Exports m.Rs
Company 1966/67 1967/68 1968/69 1969/70 1970/71 1971/72
Telco 11.2 12.8 31.14 72.2 112.0 67.9
Ashok Leyland - 1.4 5.6 5.7 17.90 15.9
Hinclustan Motors - - 1.8 0.3 1.36 5.58
Premier Automobiles - - 0.3 5.3 39.0 1.03
Mahindra & Mahindra - - 0.3 10.6 22.2 7.7
Balai Tempo - - - - 0.6 2.07
Stancdard Motors - - - 0.02 1.72 0.12
11.2 14.2 39.4 914.12 159.11 l00.3
So- c e iDA est-ates
Trxdustrial Proiects DepartnentMay 16, 1973
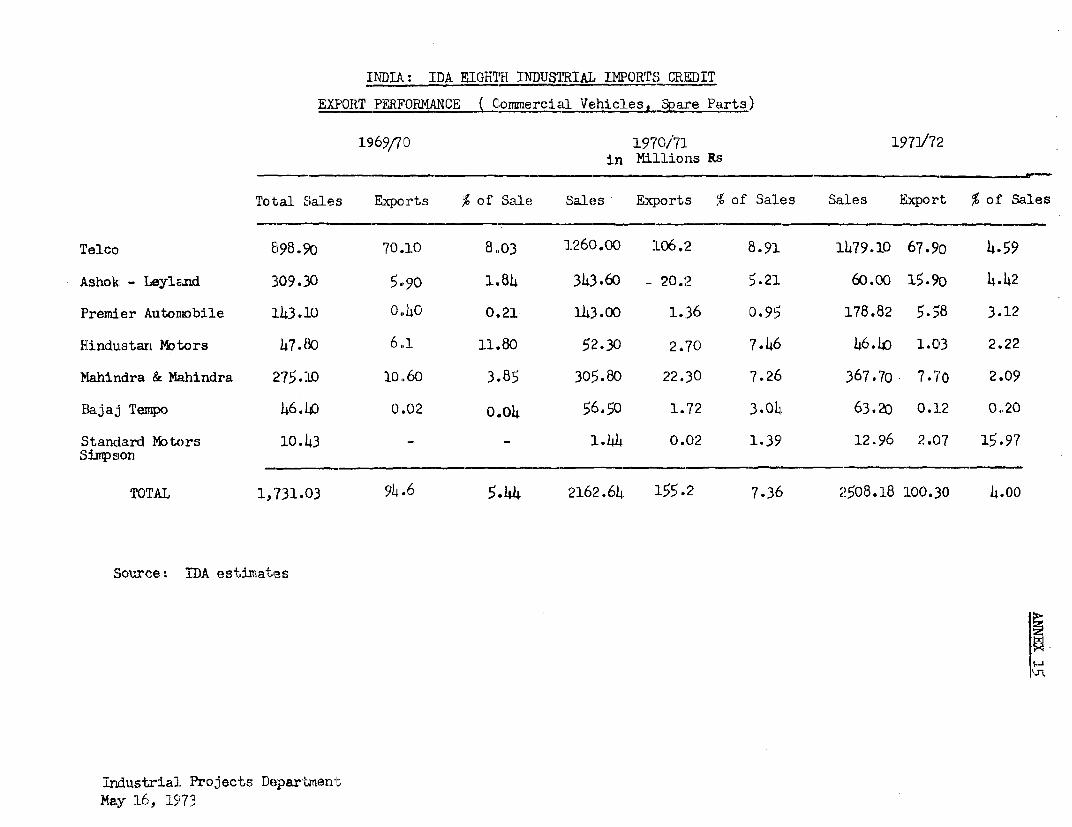
INDIA: IDA EIGHTH I1DUSTRIAJ, IM1ORTS CRIMIT
EXPORT PFRF'ORMANCE ( Commercia.l VehicieS, Spare Parts)
19,69/710 1970/71 1971/72in Mi:LliOI1S RS
Total S'ales Exports , of Sale Sales E;xports 5 % of Sales Sales Export % of Sales
Telco E198.9o 70.10 8-,03 1260.00 :Lo6. 2 3.91 1479.10 67.90 4.59
Ashok - LeylEnd 309.30 5.90 1,84 34:3.60 - 20.2 5.21 60.00 15-90 4.42
Premdier AUtonObile 143.10 0,44 0.21 143.00 1.36 0.95 178.82 5.58 3.12
Hind1ULStan Motors 47.8f0 6.1 11.80 52.30 2.'70 7.46 46.40 1.03 2.22
Mahirndra & Mahindra 275.:LI lo,.6o 3.85 305.80 22.30 7.26 367.70 7.7o' 2.,09
Bajaij Ten@po 46.1p 0.02 0.04 56.50 1.72 3-04 63.20 0.12 0.20
'Standard Motors 10.l43 - - 1.44 0.02 1.351 12.96 2.C07 15,97
Sjinv son
TOTEAL 1,731.033 9.46 5.4 4 2162.64 155.2 7.36 2508.18 :L00.30 44.00
Source: IDA est:iates
IJ.
industrialE Projects Departmnent:
May 16,, 19773


ANhNEk 16
INMIA: EIGTiI 1=5UTRIAL IMPORTS CREDIT
D1Wl FORECAST FUR 0NMSICIAL VEHICLES
1. *This Annex reviews a number of estimates of passenger and goods,.,.4aA _ ~ ~ ~. , iA w -A Wi 4-,' 1 7 -- t.4%Yia n. -Ietra-fic c-Jr-A by -v; -- o r to 1970 as well a pro.ections Ifor --.
Fifth Plan Period (1974/79) followed by estimates of potential demand for,.rcwn.,.r.4 el vehic$4 e Or vw4 eAia u4 to. i o7R /70 'Tha miyne,auco ,f +.he8e
estimates are:
(a) The Planning Comnission Working Group (1968)(b) Tata ~onoi-o a4cnd Conau ' t cy 4ces f(S)t (fA-41i 1972 )(c) Report of the working Group on Road Transport Vehicles
(d) The Indian Institute of Public cpinion (IIPO) (March 1972)
A. ESTIMAT3S OF GOODS AND PASSENGER TRAFFIC
2. Table 1 and Table 2 (next page)pre ent figures for ril road traffic.LMm, ±7,-)\J UVJ .L7 f V± [ JuruLIg il.e laua Iwu UOctauI, thie gos0U taUfL.L.L0c 'in.caed
at an average annual rate of 12.5% from 49 billion ton km. in 1950/51 to 190w454 J. 1_ J. 1fleIWIn - 1_ ^.1. ___ __w _>_w_ULJ...L.LULJ AJLA4 ZI Ul AJJ 7 . u7 f -Ly 4 1 j L W M U= WJ - '.LUU PjdaOLPW1J L UL-- 'L.L U .LJL.L-' U qU
at 7.7% from 90 billion passenger km. to 235 billion passenger km. Whileral-"Yay t'ransport still holds a preonMuinant position, the importance ofroads and conwercial vehicles is rising very rapidly. Since 1951, the volwueof goods and passenger traffic carried by roau har increased eleven and fivetimes respectively. The increasing importance of the road transport industryi8 also evident from the fact thuat road transport nuw accounts for 3)3%)? of
the total goods ton km. and about 50% of the total passenger km. as against11% anu eua respectively twenty years ago. The trend oI railways losing trafficto roads is likely to continue in spite of public subsidy of railways andtne high burden of taxes and levies that indian road transport has to bear.
TabTim 1
r.oons TRAFTTG rARRTTf RY RATL AND ROAD: l950/71
Year Rail Road Total Rail Road Total(! Tion ton kilometer) (Indices)
i9t0o/5L 44,117 5;5Oo ),.9617 100 100 100(88.9) (11.1)
I955./5 59,576 8-950 68A526 _3_ 169.7 I _3
86.9 (13.1)IQ6n0/l A7 -RAn 17 Jn00 10, 080 T987 O16in 211.8
(83.4) 16.61965/66 116,936 34w'1 i ,rn6 2O6N1 62 3oh.o
(77.4) (22.6)I970/71 127,3-8 62,500 189,858 288.7 1136.3 3 6_,
(67) (33)
Base year 1956/7M; index - 100.

16-2
Tnbhl 2
PASSENGER TRAFFIC CARRIED BY RAIL AND RO 5/51
Year Rai-1 Road Total Rail Road Total(In million passenger kilometers) (Indices)
1950/151 66.5 23.1 89.6 100 100 1OC(74.2) (25.8)
1955/56 62.L, 31.5 93.9 93.8 136.1 104. 7(66.5) (33.5)
1960/61 77.7 57.0 134.7 116.8 246.L 150.2(57.6) (42.4)
1 965/66 96.3 86.6 182.9 144.8 37lh .4 204 .C(52.7) (47.3)
1970/71 118.1 116.l 234.5 177.6 503. 2 261.6(50.h1 ((h9.6)
Base Year 1950/511 index 100.
3. Table 3 below gives a picture of the pattern of traffic liftedcoinodity-wise by the Irdian ra.1±ways (Soyurce: "Idan R.ailways Report 1970/71):
TbL -e 3BROAD PATTERN OF TAFIC LIFT71 COMDITY-WIS1
(Tons Originating in Millions)
1960/61 1965/66 1970/71ActuaL ACUal ACtuaL At uaL
Coal 20.2 2107 30.9 19.8 22.9 7.9 2la.4iini1way Coal 10.7 1165 19.5 12.4 20.3 10.0 16.X4 8.3.-i-> ali,c Ores 3.9 14.2 12.4 7.9 20.2 10.0 24.1 12.3
.sf,one, Dolor ite anxdGyp Sr. 2.8 3.0 11.1 7.1 14.9 7.3 13.0 6.6
Qe:mellr 1-1 El2.14 2.6 6.5 4.2 8.6 4.2 11.0 5.6'1? 3 ra2ns 7.8 8.)! 12.7 8.1 1L.5 7.1 15.1 7.7,- LL;.; 1, 1.6 2.0 1.3 2.6 1.3 2.5 1.3
Dil.eec1s3 1r,6 1.7 1.5 1.0 1.5 0.7 1.1 0.60.9 10 1.5 1.0 1.6 0.8 1.3 0.7
Mlineral O1l 2.4 2.6 4.7 3.0 7.5 3.7 8.9 4.5Iron & Steel 2.8 3e0 7.6 4.9 10.0 4.9 9.3 4.7Other Conmmodities 26.9 28.9 28.8 18.4 34.2 16.9 33.7 17.1Railway rrmaterials
including ballast 9.1 9.8 20. 7 10 6.2TOTAL 93.0 100.0 156.2 100.0 203.0 100.0 196.5 100.0Average length of haul
in kins. 470 561 575 648

16-3
Cu o -Is Awe masJor corU-mod -LLl.Uy cL spUH.LL dU by ra I'I, WiLtlhl _) El I!I-LI Ulil .ULIs in11
1970/71 against 30 million tons in 1951. As a proportion of total freightmoving by ,-', co accounIts for- nerly one-third now, which is the s__eas in 1950/51. Other major items transported by rail are metallic ores,mainly- irOn ore for export to Japan which has increased from 4.2% in 1950/51(3.9 million tons) to 12.3% in 1970/71 (2L.l million tons). The othercommuodities wnich have accounted for larger shares in rail movement arelimestone, dolomite, gypsum and cement, all for national usage. Transport offood grains have increased also, although not substantially, from -(.8 milliontons in 1950/51 to 15.1 million tons in 1970/71. Movement of minerals, oil,iron and steel have increased substantially. All other commodities carriedby rail were Just 33.7 million tons, or one-sixth of the total in 1970/71compared to 26.9 million tonnes in 1950/51, or one-third of the total.Average length of haul in km. has increased from 470 km. in 1950/51 to 6h8 kr,.in 1970/T. Tne above figures clearly indicate that rail transport stillcaters to heavy and bulk goods carried over long distances, while othercommodities have consistently declined in share (and probably switched overto road transport). This trend is likely to continue in the foreseeableThture.
L. * u -SU-La., only tih railwa,ys are aobe to provide reliable information;all the available data on roads are based on assumptions and estimates onvariOUS aspects of road transport. LJp to 1968/69, all the estimates of roadtransport were based on the final report of the Committee of Transnoort Policyand CoordinationL (1966), -which gives data up to 96I4/65 and forms the basisof the data for subsequent years used by various sources. The basic assunp-t-±iors miade by the above source in obtaining estimates for road transport were:
Average load carried per vehicle - 5 tonsAverage annual distance carried per vehicle - 48,oo00 km.Load factor - 66%Average ton km. per vehicle - 160,000 ton km.
per year
However, the actual operations, as studied by TECS in a field survey of about3,000 operators in various states (1972) showed the following:
(i) Basically, trucks in India cater to three types of traffic:
(a) Long distance(D) Medium distance and feeder, and(c) Local or inner-city
These traffic needs are met primarily at present by 5 and 71- ton trucks.
(ii) About 80% of the new 71½ ton trucks and 50% of the new 5 tontrucks produced in the country in a given year are exclusively puton long distance traffic for an average period of three years,and then transferred to feeder and local traffic.

(iii) en long distance haulage, these new trucks accept loads of up01c 4-1 ~+ - Th.srl (n7rq £'nf rl('+_ -x r -'zv rl C fo e n(Y) i,,.nto, °5% er +he pt o pload capacit." , travel 80,0nQ -
per year and the load factor is 90%. Thus:
The average ton km. for 5 ton trucks/year - 450,000 ton km. per
The average ton km. for 7!t ton tru-cks/year - 675,000 ton km. per,,-e ar
UL vii-s b2asis, tota ' long %distance h.a,' nage fo tS'/1 olsotto be 31.3 billion ton km.
(iv) 'Trhe TECS survey also estimates that, the total carriage is equail;-distrutLu uedi betiween long UdlZUZt nd4 feedar . roadsti.
.i us the totaL goods bralf±c carri.ed uy Iru.au nI I 1?,0 ± Wr rkU - ut 'A,.
be 62.5 billion ton km., accounting for 33 percent of the total goods trafficltor thsle yearl, whlhiclh is not unreasonabUle-. JThese figUrts have been aUoL),tedU by,'
the V!orking Group on Road Transport 'lehicles Industries as a basis for pro jectinl:road traflic and pot'ential truck deMald. EstimuUates of the Planning Commrlissicrnand the ITIPO seem to be based on Source 1, which puts it about 48 billion ton
<m.Ior 27.3%' of the total goods traffic. To tne extent tLat the TECS sureyestimate is based on 1971 data, and obtained from an actual field survey, i.t
* ____1 J __ _- - __- -L - 4 _____.__1- _ I_ _ - 1 1 ___ M __ -. __1_ _ _-I2_ L n 4)t woUldUappear thvat iu i more accurate thanI olther- fi gurswv based onthe Uli lt
practices .
6. In projecting total goods traffic from ].970 to 1980, the TECS and t.heUiorking Group on Road Transport Vehicles (1972) studied the relationship betweenthe natioral. income and total goods traffic from the years 1960/61 to 1968/6°.Regression analysis was used to determine the relationship between national incomeand goods traffic. The data for the two variables, the independent variablenational income and the dependent variable total goods traffic, for the years.960/61 to 1968/69, were taken from the official publications of the CentralStatistical Organization, Planning Commission and Traffic Commissions. Duringthis period it was observed that for every 1.0% increase in national income,the total goods traffic in the country increased by 1.78%.
7. The projection of the total goods traffic for each of the next ten.pears was derived from this relationship, assuming that the national incomewculd gros- at 4.5% per annum from 1971/72 to 1973/74 and 5% per annum thereafter.Total goods traffic was established to be 276.L billion km. in 1973/74, cormaredto 243 billion km. projected by the planning commissions (1968). Estimates fortraffic goods by the four sources is given in Table 4.
°. The total goods traffic for each year is then divided into total goods-raffic carried (a) by raii and (b) by road. The total goods by rail wasestimated by the Working Group (1968) to be 159 billion tons km. in 1973/74,assuming 6% uniform growth rate from 1968/69. Total goods traffic by roadin 1973/7l6 was estimated to be 80 billion tons km. assuming a uniform growthrate of 15') from 1968/69.

i6-5
9Q ThA TEGS estimate of total goods traffic by roads was derived onthe basis that the share of the road transport would uniformly rise from329 of tn.ot1 goods traffic in 1970/71 to 43% in 1978/79. This was obtainedby applying the slightly reduced variation of the uniform growth rate that
c fmninrl +n nod, iqt. for tUhn 1.qt 10--l soars. i.e.. a time-trend estimatedeliberately toned down in the expectation that the Government would notencourage the qnmr a-rnwth rate A9 shown in the Dast to continue officiallyin the future; also, on this basis the total goods traffic for 1973/74was estimated at 2147-248 billion ton km. The total in the railway goodstraffic for the same year as 158 billion ton km. and the total goods trafficby road cm.e to 98 billion to"n vm,
10. Th.e IIP0 esJt.+vS in TNla Iwer hbias on techniques correlatinc
demand for trucks with industrial output. No coefficient of correlation wasgiven by TIPO, howmever. Mf,e M¶CS study reyr+ i ant. the rcoeffirlent. of
correlation between industrial output of traffic growth was found to be insig-nificant,
r%LIKKA7MT 'CVrNT I'(ThUV'DtTAT TT1'3TOTrTMC
'e JJL2iLJ.A. £Jul1ce =-i,e road .rLJ haLL L'sLJLJ Ubee p yc , - - - - to
estimate the number and size of trucks to carry the additional load generatedb-y aconomi growth and to replace the hau'age capacity lost through scrappage.However, in addition to reviewing estimates of demand for commercial vehiclesior ly97/ (l . -tL o U/ f 9/ ILL9 tSJ L,±Ui_L W±± L-wl summar-Lze t rtIL u bI~y
TECS and adopted by the Working Group (1972) in projecting the demand forcoimmercial vehicles since itho0 'WS 50 ligilht on 41te operation an use of
commercial vehicles; an area which is poorly covered statistically.
The demand for commercial vehicles is subdivided into:
1. Demand for medium/heavy commercial vehicles (5, 7½z and 10 tons:(a) for trucks and (b) for buses
2. Demand for off-highway vehicles3. Demand for light vehicles (3 tons or less)
Tnese estimates are based on work done by th.e Planni1ng ComIaJLssIonWorking Group (1968), the TECS and the Working Group on Road Transport Vehicleindustry (1972). The last two are almost identical.
U13U'MMH.&AVY UUMIRLU1AL VsIFLLSUJh
12. The projected goods traffic by road is shown in Table 4 on the nextpage. The estimate of the additional road traffic for any particular yearwithin the planned period is estimated to be the difference between the goodtraffic in the year in question compared with the one in the previous year.Of this additional road traffic for each year, one-half was assumed to belong distance traffic and the other half feeder traffic, on the assumption thatthe total volume of goods carried by road is equally divided between longdistances and the feeder traffic. TECS study reports that this assumptionwas substantiated by an extensive field survey.

EZi'ADIATES CF TOTAL GOODS THkFFITC
'Naticnal Exp)ectetd Es-timated Estimated AdditionalY e a r Income Total GOOdS Traffic Percentage Share Road Goods Traffic Road Traffic
(RL. Bi11ionsL jB1lion tonne km of Road Traffic (Bil1ion tonne km) (B11iion tonrne kni1970/71 1T3.-7--- 19S5S7 32 .0 -
1971/72 192.C)5 2L115 33.3 70-6 8.01972/73 200. 69 2)8.9 334.6 79.3 8.81973/74 2'09.72 2147.6 36.0 89.3 10.01974/75 220.20 269.6 37-4 101.1 11.,81975/76 231.- 21 29)4.3 38.9 114.7 13.61976/77 242-77 3,21.2 40-5 130.3 15-,61977/78 e5L .cl9 351.1 142.1 148.1 17,,81978/79 267.t)6 382.0 .Q 3.8 168.1 20.01979/8,0 281.0)4 41L75 h5.5 190.2 22.4
* At constant prices (1961).

16-7
13. For long distance traffic new trucks are generally employed.Lne Iield survey indicates tnat old trucks wuich have completed tuuee yearsoperation on long distance traffic are taken off such service and put onfeeder traffic. nhua, every year, in addition to the incremental longdistance traffic generated by the economic growth of the country therewould be a replacement demand due to the attrition of the three year oldtrucks.
14. The replacement demand due to the attrition in any year wasassumed to be one-third of the total long distance traffic of the previcusyear.
15. The aggregate of the additional long distance traffic for eachyear and the total tonnage lost during the year, due to the attrition, givethe long distance traffic during the year which would have to be carriedby new trucks.
16. To determine the number of trucks of different size required tomeet the demand for long distance haulage each year the following assumptionswere made by TECS (1972) based on a field survey.
(i) Each truck completes annually 80,000 km. for long distancehaulage, and the load carried is 25% over and above themanufacturer's recommended capacity and that the load factoris 90% of the total capacity.
(ii) Currently this additional demand is met by 80% of the new 72ton and 50% of the new 5 ton trucks. Very few 10 ton trucksare used due to the condition of the roads and the absenceof a suitably priced 10-ton truck. In the 1970's it isassumed that the additional long distance traffic will becarried by 78 ton and 10 ton trucks and the market for the 10-ton trucks would grow from the estimated current 6 or 10%to 50% by the end of the decade. On these assumptions thetonnage to be carried by long distance goods traffic duringeach of the years 1971/72 to 1979/80 was translated intodemand for 10 tonners and 7½ tonners.
17. To calculate the number of new trucks of various size required tomeet the demand for feeder road traffic the following assumptions were made:
(i) Average annual haul for short distance travel 400,000 km.(ii) Load factor: 90% of G.L.W. for trucks less than 3 years old
70% of G.L.W. for trucks from 3 to 8 years old50% of G.L.W. for trucks more than 8 years old
(iii) The scrappage rate for the feeder fleet in any year isassumed to be 7% of the feeder fleet in the previous year;this is equivalent to a scrappage rate of about 5% for thetotal fleet.
(iv) The additional demand for truck on feeder roads generatedevery year by economic growth and due to scrappage of oldtrucks will be met by
(a) The three year old trucks transferred forthe long distance haulage

16-8
(b) By new 5 and 7½12 ton trucks
18. The estimate for requirement for new trucks for goods trafficis thus the summation of trucks referred for long distance and feeder roadtraffic. These are given in Table 5 below:
Table 5TOTAL DEMAND FOR TRUCKS IN INDIA: 1971/72-1979/80
Y e a r 10 tonner T-' tonner Others Total19 71/72 1.900 24.000 4,500 30,400
(6.3) (78.9) (14.8)1979/73 2.300 26.300 4,900 33,500
(6.9) (78-5) (i4.6)1O7',/7)I 3000 30.800 5,600 39,400
(7.6) (76.2) (i4.2)1974)/75 1t.200 33,100 6,900 44,200
(9-5) (74.9) (15.6)1Q75,/76 8;000 33,500 8,100 49,600
(16.1) (67.5) (16.4)1976/77 19700 33,800 9,400 54.900
(21-3) (61.6) (16.1)1077/71 34,700 13,000 63,500
(24.3) (55.7) (20.0)1976/79 1FL600 37,900 16,000 72,500
(24.7) (50.9) (24.4)1979/80 2X 800 JOhiOO 19,900 82,100
(26.6) (49.2) (24.2)
Note: 1) iares in 'hrakets represn t percentages to the total.
2) The demand estimates above are for trucks and not for chassis'n ge-1 wh.ich could be used for buses also.
3) The demand estimates for different sizes of trucks presenteda -.b^ed on t-he assWn1tion t.hat appropnriatcr ely, designed andpriced trucks of the different sizes are freely available.The i-1Jications of this assimntin are diRssed in Sectlon 1t
of Chapter V.
Buses
18. Based on the estimates of the Planning Comnission it was assumedthat the tntrwer of buses on the road woul'd rise at the rate of 7% annuallyduring the five year planning period (1974A1979) and the replacement demandin any year -wo-uld be 9% of the totl population ov er the buses in the prev,ious
year. It was assumed that there would be equal preference among bus operatorEfor 10 ton and 7 ` ton buses. Assu,mng the demand for 7- and 10 ton vehicles
on an all-India basis to be 45% each of the total demand for buses and theremaining lCV being mret by light vehicles, the size pattermn of dAm.and was
obtained. Table 6 shows the demand estimate for the period 1971A1980:

16-9
Table 6BREAK DOkW OF DEMAI\ 1D PROJECTIONS FOR BUSES IN INDIA BY SIZE
1971-1980
Y e a r 10 Tonner 7 Tonner Others Total1971/72 7,020 7,020 1,560 15,6001972/73 7,515 7,515 1,670 16,7001973/74 8,010 8,010 1,780 17,8001974/75 8,595 8,595 1,910 19,1001975/76 8,681 8,681 1,938 19,3001976/77 9,225 9,225 2,050 20,5001977/78 10,305 10,305 2,290 22,9001978/79 10.530 10.530 2,3140 23,4001979/80 11,340 11,340 2,520 25,200
19. The estimate for total demand for chassis (buses and trucks) wasobtained by adding the potential demand for buses and trucks. This isshowrn in Table 7 below:
Table 7BRRFAK DOwN OF DEMAND FOR TRUCK AND BUS CHASSIS BY SIZE
1971/72 to 1979/80
Y e a r 10 Tonner 7 Tonner Others Total1971/72 8.920 31.020 -.5W5 460G01972/73 9,815 33,815 6,570 50,200197-/7h 1 1010 38.810 7.380 57.2001974/75 12,795 41,695 8,810 63,300107q/76 16-726 )12,226 io. 0h8 69,0001976/77 20,925 43,025 11.,450 74,50Q1977/78 2j-Ioc )450o05 15s290 86,X001978/79 29,130 48,430 18,340 95,900I Q7Q/Rn Ar _,1n h 7), n 99iL 1, O in7f0
* Others included 5 Tonner, 3 Tonner and 1 Tonner chassis.
on_ IT+ hoTidl be nted Jh +.the Arn-nne ac+A;ni+.pq f't)r +.hi-- se. -If
trucks presented by those sources is based on the assiumption that appropriatelydes-a i,5. .end n"A " .A +and^.Ir p-ri'e trck of na si ze are re- all abr ra e, 1 orI , in oth-n r
words, there are no supply constraints. This would mean that the commercialvehcl -dust. 4- 'dhae 4abli and resources, both, organizatiove4lcl .A4tALALO IlL J V1IJLLtA iiLVW VALK;~ C.LJ4.LJ.- 4 I, AL .JL I , j 'Ji J.
and financial, for setting up and using the additional capacities for ineeting4he - m____A_ t4 Js a"lso bas^- or, th 4 s.to Wha de~velprto VALK; %IALcLkdLU.O# a L U _L _.ojLdOIL Li CP Vitt; L 0 Qa1uiiiJj IdVI.V~J'jA VLIv " .. pin o11 .L rowill keep pace with the grawth of the transport industry, for unless roadconLditui.rs Ji.Ljrove se-vrere re.tL rictJLa VVwUo.LLLiu LI'dL beJ vaseo.he e p i-
the number of 10-tonners that could operate on the India highways. Theseare UefLiL.LteJly str .nig asswauLtLiOnS and noJL-A LVVU0ZL Uotrkl haL1 bee WdoneLItoIes .a teiv
demand rise of trucks under various road investment programs and supplypotk e,taldJ. ofL 1Und.La. JJ1e J_alutLor wVIlL Ue.L -Lin i telJ.y fLa'L' L Lbeh-in tre nless
measures are taken to improve the performance of Premier and Hindustan M.otors.
Industrial Projects DepartmentMay 16, 1973

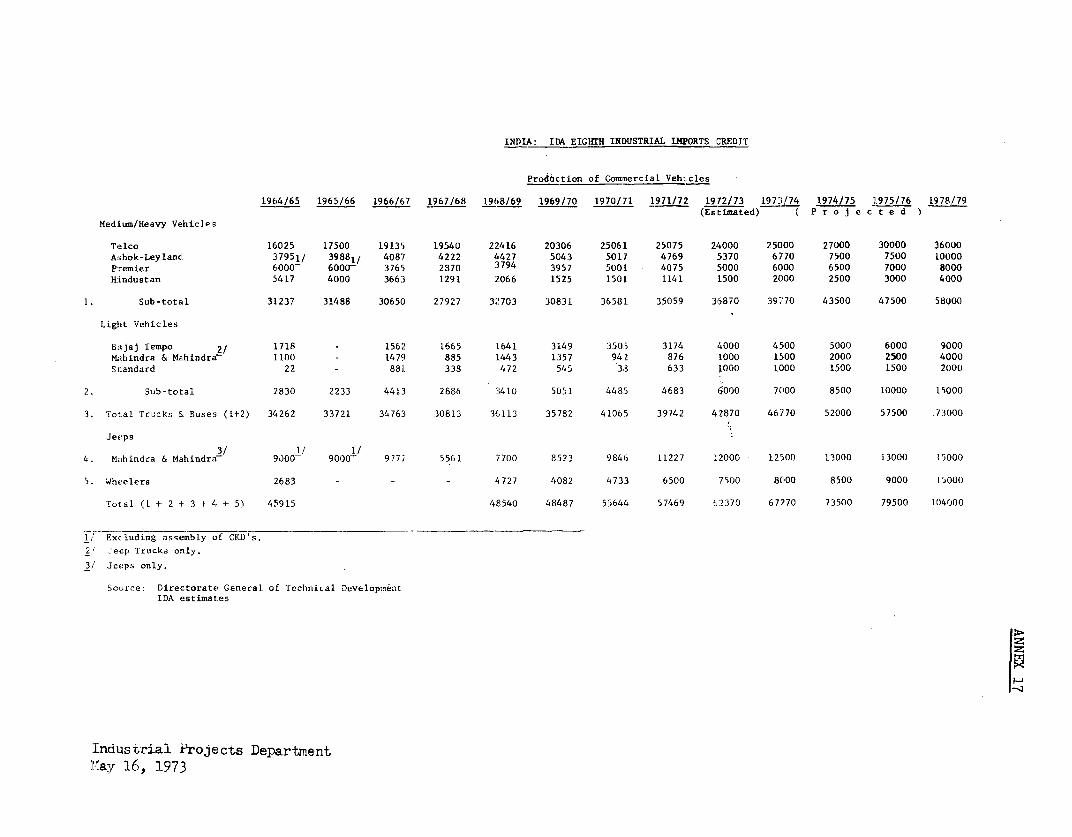
INDLA: IEA EIGHTH INDUSTRIAL IWIORTS CREDIT
Prodtction of Commercial Vehi-cles
19C4/65 1965/66 1966/67 1967/68 1968/69 1969/70 1970/71 1971/72 1972/73 197:/74 1974/75 ]1975/765 1978/79(Estimated) Pro j e c t e dMedium/Heavy Vehicles
Telco 16025 17500 1913'i 19540 22416 20306 25061 25075 24000 25C100 27000 30000 36000Ashok-Leyland 37951/ 39861/ 4087 4222 4427 5043 5017 4769 .5370 6770 7500 7500 10(00Premier 6000 6000- 376'i 2370 3794 3957 5001 4075 5000 6000 6500 7000 8000Hindustan 5417 4000 366:3 1291 2066 1525 1501 1141 1500 2000 2500 3000 40001. Sub-totsLl 31237 31488 3065(0 27927 32703 30831 36581 35059 365870 39770 43500 47500 58000
Light Vehicles
Bajaj Tempo 2/ 1718 - 1562 1665 1]641 3149 3505 3174 4000 4500 5000 6000 9000Mahindra & Ma.hindria 1100 - 1479 885 1443 1357 942 876 'LOOO 1500 2000 2500 4000Standard 22 - 881 338 472 545 38 633 L000 1000 1500 1500 20002. Sub-total 2830 2233 4413 2886 3410 5051 4485 4683 6,000 7000 8500 10000 15000
3. Tot:al Trucks & Buses (1+2) 34262 33721 34763 :30813 36113 35782 41065 39742 42870 46770 52000 57500 .73000
Jeeps
3/ I/ I/4. Mahindra & Mahindrza- 9000- 9000- 9777 5561 7700 8523 9846 11227 12000 12500 13000 13000 15000
5. Wheelers 2683 - - - 4727 4082 473:3 6500 7500 8C100 8500 9000 I000
Total (1 + 2 + 3 + 4 + 5) 45915 48540 48487 55644 57469 62370 67270 73500 79500 104000
1: Excluding assembly cof CKD's.2; Jeep Trucks only.
3/ Jeeps onLy.
Source: Directorate! General of Technical DevelopmentIDA estimates
Industrial Projects Departmnent"ay 16, 1973

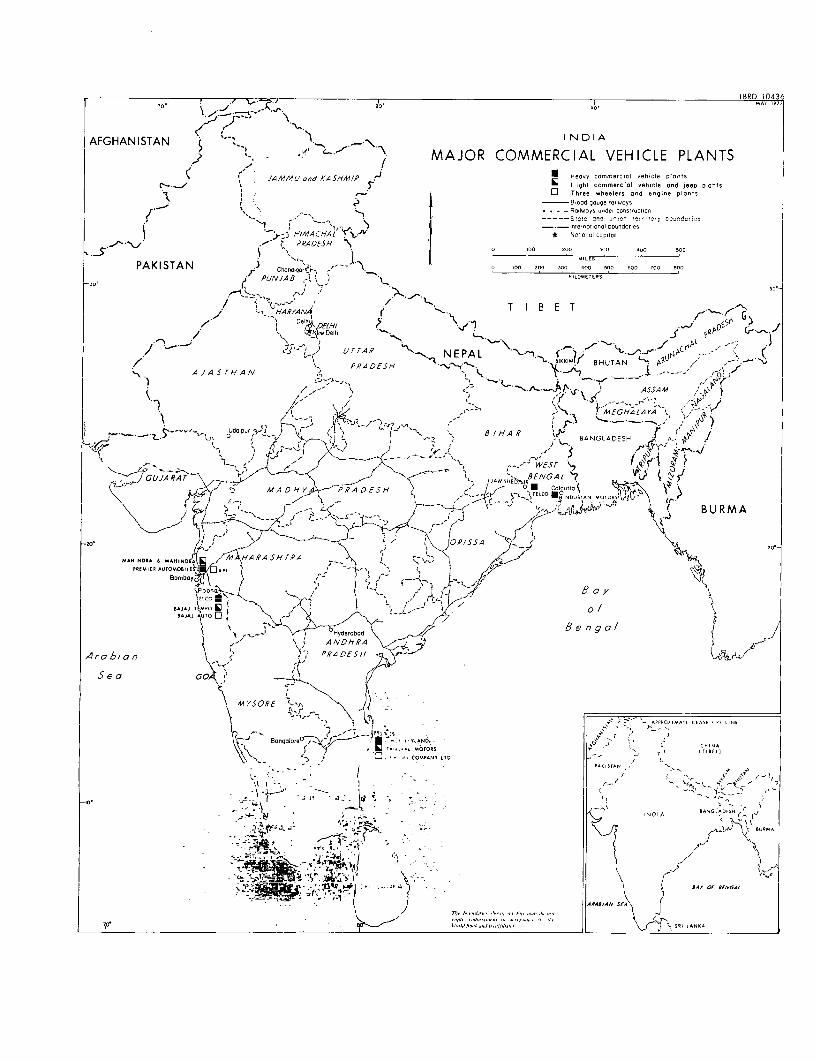
r 70- i Z >] ' 60- ! ~~~~~~~~~~~~~~~~~~~~~~~~~~~IBRD 10436
AFGHANISTAN IN- > _ 1sD I A
I~~~~~~~~~~~~~~~~~~~~~~~~~~~~~~--llVLl\ fL V L. IAO CO MRCA I X L LE PL -I'ANTSI
[ . ; ~~~~~~~~~~~JA M ML ond K'A SHM/R !-Ja ey omrolvhc pns
| . ' . ' / _+__R~~~~~~~~~~~~~~~~~~~~~~~~~~~~~~allay ude o o- strucria l ehi~:on ~ e...f _;~~~~~~~~~~~~~~~~~~~~C Thll Soeel, and u,gi- pet!! OAJloMs
i .-5 F.IMAC/1A! vx,.* _ InTeroo!onOlbounda-d
PAKISTAN Ch-nd.qorK5r.," ?. e0 I0P 00a ...o o 6o o
-a Jr ~~~~~~~~~~PUNJAS ., s ?< KLa.ETr"S
R . ,/ '-w 9/1~~~~~~~~ARYANAuvi ^ T I B E T_ ,
| / / " vtiC~~~~~~*elhi ~ .[1J Pt >/
j_>_ \_t 2 ~~~~~~~~~UTTAR O NPAL'-I,lKMi8UA
>,A JA S TH A N I, ---t~,,t - _
n , \ ,) ,> ' - ee W ,'~~~~~~~~~~~~~~~~~~~~~V ASSAM6 'v
i1 .^-- -R_S ~~~~~~~~~~~~~~~~Mf H ZALYUdr't }A RBN!DS ..
d~~~~~~~~~~d PY BURMA
20'~~~~~~~~~~~~~~~~~~~~~~~~~~~~~~~~~R N . A r F ,H!O/S yXz
l~ ~ ~~~~~~~~~~~~~~:~ - I A I IHortG \E 'C7o \ S
] Seo GOX5 t . ,>ASH lR; \ = h ' 1 - fip.. a , , Q
B~~\:,i1... ,MIOST t I',' 4J olbA~ ~ ~ ~ ~ ~ ~ ~ ~ 0, ^ D|.K5A _
¢F .; - : 11 9 .'tSrXcUz^:~L , ng
I - .. ss,5j:.! " \ -. 11 0 X Q-Hyd,ob.| . ' *6 M~~~~~~I+:t ,t_ rXfXVDH Ar ZCA
0 - _ _ \ J 77, h bb,:RAD::!1E SH...E:||taAt t
ArobionI; I ;,,. :2:: ,1,:" te | q r Ar