SINGLE - CASE, QUASI-EXPERIMENT, AND DEVELOPMENTAL RESEARCH.

THE EFFECT OF SAVI ( SOMATIC,AUDITORY,VISUALIZATION,
INTELECTUAL ) TECHNIQUE ON STUDENT’S SPEAKING ABILITY
( Quasi Experiment Research On The Second Grade Students at Senior High
School Pancasila Kota Bengkulu in Academic Year 2018/2019 )
THESIS
Submitted as a Partial Requirements for the Degree of Sarjana Pendidikan (S.Pd)
in English Education Department of IAIN Bengkulu
By:
AWAB AL- ISLAMY
NIM. 141 623 2920
STUDY PROGRAM OF ENGLISH EDUCATION
DEPARTMENT OF TADRIS
FACULTY OF TARBIYAH AND TADRIS
STATE INSTITUTE FOR ISLAMIC STUDIES
(IAIN)BENGKULU
2019


DEDICATION
The researcher would like to dedicate this thesis to:
1. Allaah SWT, as the Only One of my God, the researcher would like to say
Alhamdulillahirobbil‟alamin, who has given me mercy and healthy in
finishing this thesis.
2. My lovely parent, Bapak Mulyanto and Ibu Suwarti. Thank you so much
for your entire struggle for me to fulfill all my necessaries and taught me
what the bad things and the good things until I can face this life in the right
way.
3. My lovely sisters and brother, my Elder brother Ahmad Sahim Al islamy
and Abdurrahman Fahim Al islamy, Didin Syafarudin, Mushab masrur.
and also my sister Faizzah Rosyidatilah, Huriyah, Muti‟ah Amatullah Al
islamy, Humairoh Diahhastuti Al islamy. Thanks you for your support and
helps. You are my best brother and sisters. I love you guys.
4. My best Brotherhood of PSHT, Sedulur Letingan, ( Wahyu, Santo, Ridho,
Zepri, Alm Fajri ) especially to Mas Irwan Setiawan and Mbak Jumirah as
a parents in here.Thanks a lot for your support and helps. every advice,
suggestion, and sharing time. I love you.
5. All of my lovely classmate: Abdi, Rolli, Anti, Hardianti, Lize, Yulin, Rani,
and all of TBI 2014. How lovely I am, have you guys.
6. All of my friends of KKN Pondok Kubang and PPL SMA Pancasila, let‟s
raise our dreams together.
7. My Almamater.

SPECIAL THANKS TO:
1. Dr. Ali Akbarjono,M.Pd as my supervisor I, thank you so much for your
attention and the easiness that you give to me in finishing this thesis.
2. Fera Zasrianita, M.Pd as my supervisor II, thank you for all your goodness.
Advice, suggestions, and time until I can finish this thesis on time.
3. All English Education Program lecturers. Thank you so much, because
you all want to transfer your knowledge to us, maybe we cannot replay
your kindness but ALLAH SWT will do it. Sorry if as student I always did
many mistakes that hurt your heart directly or indirectly, you are all
special for me, I cam here from zero and can go from here to be hero in
education field.
v

MOTTO
Allaah is everything I need.
Be sure and believe in Allaah, The Al – ‘Aliim
Because Allaah knows what the best for His servant
Berkah, Ridho, dan Doa Mamak
Allaah is everything I need.
As for man, when his lords tries him by giving him honour and gifts, then he says
“My Lord has honoured me. “
( Q.S Al Fajr: 15 )
Berkah, Ridho, dan Doa Orang tua
Vi


ACKNOWLEDGEMENT
All praise and thanks to Allah SWT the Almighty who give me mercy and
blessing, His grace and guidance so that I can finish this thesis which entitled
“The Effect of SAVI Technique on student’s Speaking ability. ( Quasi Experiment
Researche On Second Grade Students at Senior High School Pancasila Kota
Bengkulu in Academic Year 2018/2019 ) ”. Peace be upon Prophet Muhammad
SAW, the great leader and good inspiration of world revolution. Thus, the
researcher would like to express her deepest thanks to all of those who had helped,
supported, and suggested me during the process of writing this thesis. This goes to:
1. Prof. Dr. H. Sirajuddin M, M.Ag., M.H., as the rector of IAIN Bengkulu.
2. Dr. Zubaedi, M.Ag., M.Pd., as the dean of Tarbiyah and Tadris Faculty.
3. Eva Dewi, M.Ag., as the head of Tadris.
4. Feny Martina, M.Pd., as the head of English Education Department.
5. Dr. Ali Akbarjono, M.Pd. as the first advisor and Fera Zasrianita, M.Pd.
as the second advisor.
6. All of English lecturers and staff administration of IAIN Bengkulu
7. All of my family members.
8. My almamater.
The researcher relizes that this thesis would not be completed without the
help of various parties. The researcher would like to say thank you to lecturer,
friends, partner, and family for guidance, direction, correction, and suggestion.
Constructive criticsm and suggestions are expected by the researcher for the
perfection of this thesis.
Bengkulu, February 2019
The researcher,
Awab Al Islamy
SRN. 141 623 2920

ABSTRACT
Al-Islamy, Awab. 2018. The Effect of SAVI (Somatic, Auditory, Visualization,
Intellectual) Technique on Student’s Speaking Ability in Senior
High School ( Quasi Experimental Research at the Eleventh Grade
Students of Senior High School Pancasila kota Bengkulu in
Academic Year 2018/2019).
Thesis English letter of English Study Program, Islamic Education and
Tadris Faculty.
Advisor: 1). Dr. Ali Akbarjono, M.Pd 2). Fera Zasrianita, M.Pd
Key Words: Somatic, Auditory, Visualization, Intellectualy, and Speaking.
The title of this research is The Effect of SAVI (Somatic, Auditory,
Visualization, Intellectualy) Technique on Student‟s Speaking Ability in Senior
High School ( Quasi Experimental Research at the Eleventh Grade Students of
Senior High School Pancasila kota Bengkulu in Academic Year 2018/2019). The
objective of the research was to investigate whether SAVI Technique can improve
students‟ speaking ability at the eleventh grade students of SMA Pancasila
Bengkulu in the academic year 2018/2019. The results showed that there was any
significance mean score of pre-test and post-test of the experimental class and
control class was 48 while difference mean score of pre-test and post-test from
control class was 15. The difference mean score of experimental class was higher
than control class (48>15). It meant that the scores of students in experimental
class was higher than the score of students in control class. It meant that the
students‟ speaking ability in English speaking skill after the researcher gave the
treatments was improved. The researcher concluded that the SAVI (Somatic,
Auditory, Visualization, Intellectualy) technique gave a positive effect to Students‟
Speaking Ability in Senior High School ( Quasi Experimental Research at the
Eleventh Grade Students of Senior High School Pancasila kota Bengkulu in
Academic Year 2018/2019).

ABSTRACT
Al-Islamy, Awab. 2018. The Effect of SAVI (Somatic, Auditory, Visualization,
Intellectualy) Technique on Student’s Speaking Ability in Senior
High School ( Quasi Experimental Research at the Eleventh Grade
Students of Senior High School Pancasila kota Bengkulu in
Academic Year 2018/2019).
Thesis English letter of English Study Program, Islamic Education and
Tadris Faculty.
Advisor: 1). Dr. Ali Akbarjono, M.Pd 2). Fera Zasrianita, M.Pd
Key Words: Somatic, Auditory, Visualization, Intellectualy, and Speaking.
Judul penelitian ini adalah Pengaruh Teknik SAVI (Somatik, Auditori,
Visualisasi, Intelektual) untuk meningkatkan Kemampuan Berbicara Siswa di
Sekolah Menengah Atas (Penelitian Kuasi Eksperimental pada Siswa Kelas XI
SMAN Pancasila kota Bengkulu pada Tahun Akademik 2018) / 2019). Tujuan
dari penelitian ini adalah untuk menyelidiki apakah Teknik SAVI dapat
meningkatkan kemampuan berbicara siswa di siswa kelas sebelas SMA Pancasila
Bengkulu pada tahun akademik 2018/2019. Hasil penelitian menunjukkan bahwa
ada nilai rata-rata signifikansi dari pre-test dan post-test dari kelas eksperimen dan
kelas kontrol adalah 48 sedangkan skor rata-rata perbedaan dari pre-test dan post-
test dari kelas kontrol adalah 15. Perbedaan skor rata-rata dari kelas eksperimen
lebih tinggi dari kelas kontrol (48> 15). Ini berarti bahwa skor siswa di kelas
eksperimen lebih tinggi daripada skor siswa di kelas kontrol. Itu berarti bahwa
kemampuan berbicara siswa dalam keterampilan berbahasa Inggris setelah
peneliti memberikan perawatan ditingkatkan. Peneliti menyimpulkan bahwa
teknik SAVI (Somatik, Auditori, Visualisasi, Intelektual) memberikan efek positif
terhadap Kemampuan Berbicara Siswa di Sekolah Menengah Atas (Penelitian
Kuasi Eksperimental pada Siswa Kelas XI SMA Pancasila kota Bengkulu pada
Tahun Akademik 2018) / 2019).

TABLE OF CONTENT
TITLE PAGE ...............................................................................................................
ADVISOR SHEET ....................................................................................................... i
PAGE OF RATIFICATION ....................................................................................... ii
DEDICATION .............................................................................................................. iii
MOTTO ........................................................................................................................ v
PRONOUNCEMENT ............................................................................................ vi
ACKNOWLEDGEMENT ........................................................................................... vii
TABLE OF CONTENT ............................................................................................... ix
ABSTRACT .................................................................................................................. xi
LIST OF FIGURE ....................................................................................................... xiii
LIST OF TABLE ......................................................................................................... xiv
LIST OF APPENDICES ............................................................................................. xv
CHAPTER I: INTRODUCTION ............................................................................... 1
A. Background of Study ......................................................................................... 1
B. Identification of the Problems ............................................................................ 7
C. Limitation of the Problem .................................................................................. 8
D. Research Question .............................................................................................. 8
E. Objective of Research ........................................................................................ 9
F. Significance of Research .................................................................................... 9
G. Definition of Key Term ...................................................................................... 10
CHAPTER II: LITERATURE OF REVIEW .......................................................... 11
A. The concept of Speaking .................................................................................... 11
B. Student‟s difficulties of learning speaking ......................................................... 12
C. Characteristic of succesfully speaking ............................................................... 18
D. SAVI Technique................................................................................................. 19
E. Element of SAVI Technique .............................................................................. 20
F. Principle of SAVI Approach .............................................................................. 23
G. Implementation of SAVI Technique .................................................................. 25
H. Previous Studies ................................................................................................. 28
I. Conceptual framework ....................................................................................... 31
J. Research hypothesis ........................................................................................... 32
CHAPTER III: RESEARCH METHODOLOGY .................................................... 34
A. Research Design ................................................................................................. 34
B. Population and Sample ....................................................................................... 35
C. Research Instrument ........................................................................................... 37
D. Data Collecting Technique ................................................................................. 40
E. Analyzing data .................................................................................................. 43
F. Hypothesis testing ............................................................................................. 45
G. Researche procedure ......................................................................................... 46
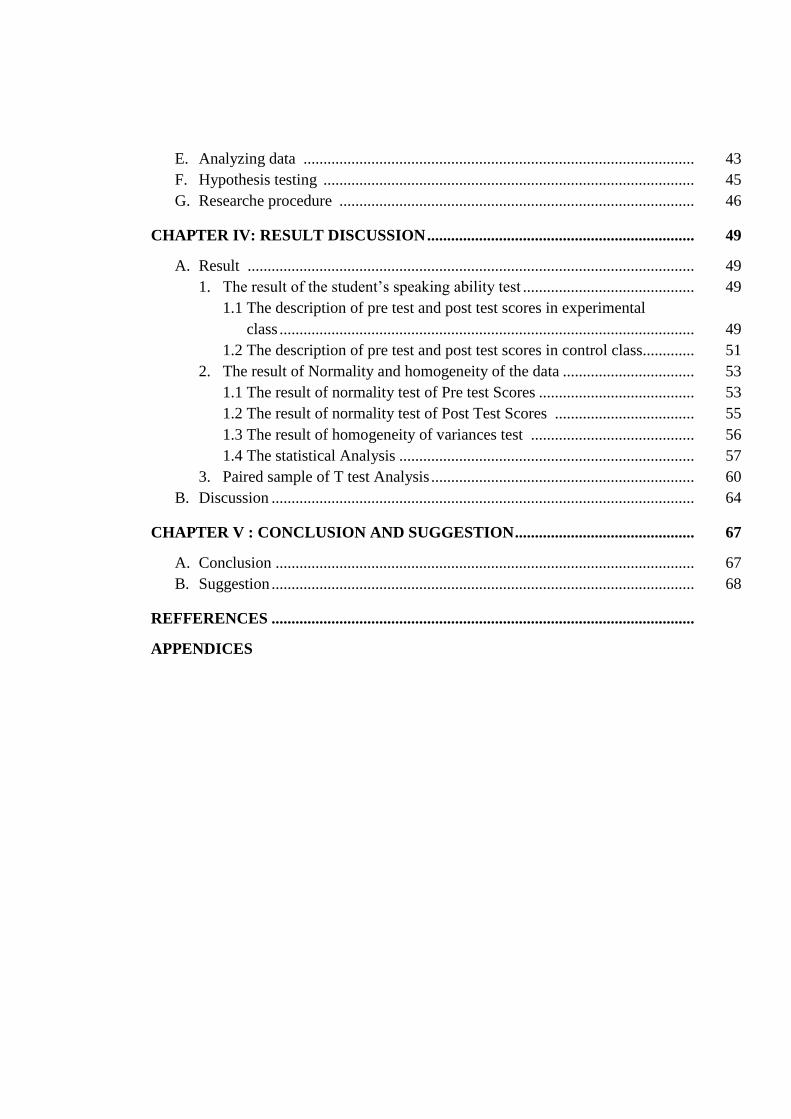
CHAPTER IV: RESULT DISCUSSION ................................................................... 49
A. Result ................................................................................................................ 49
1. The result of the student‟s speaking ability test ........................................... 49
1.1 The description of pre test and post test scores in experimental
class ........................................................................................................ 49
1.2 The description of pre test and post test scores in control class............. 51
2. The result of Normality and homogeneity of the data ................................. 53
1.1 The result of normality test of Pre test Scores ....................................... 53
1.2 The result of normality test of Post Test Scores ................................... 55
1.3 The result of homogeneity of variances test ......................................... 56
1.4 The statistical Analysis .......................................................................... 57
3. Paired sample of T test Analysis .................................................................. 60
B. Discussion .......................................................................................................... 64
CHAPTER V : CONCLUSION AND SUGGESTION ............................................. 67
A. Conclusion ......................................................................................................... 67
B. Suggestion .......................................................................................................... 68
REFFERENCES ..........................................................................................................
APPENDICES

LIST OF FIGURES
Page
Figure 2.0 The Process of Oral Communication 13
Figure 2.1 Conceptual Framework 31
Figure 2.2 Procedure of the research 46
Figure 2.3 The Chart of Pre- Test Scores in the Experimental Class 49
Figure 2.4 The Chart of Pre- Test Scores in the Control Class 51

LIST OF TABLES
Table 3.1 Treatment Design ........................................................................................... 35
Table 3.2 The number of population .............................................................................. 36
Table 4.1 The distribution scores of Experimental Class .............................................. 50
Table 4.2 The distribution scores of Control Class ........................................................ 52
Table 4.3 Test normality of pre test scores in Experimental Class ................................ 54
Table 4.4 Test normality of pre test scores in Control Class ......................................... 54
Table 4.5 Test normality of post test scores in Experimental Class .............................. 55
Table 4.6 Test normality of post test scores in Control Class ........................................ 56
Table 4.7 Homogienity Test .......................................................................................... 57
Table 4.8 Independent sample test of pre test ............................................................... 58
Table 4.9 independent sample test of post test .............................................................. 59
Table 4.10 Statistic Description .................................................................................... 60
Table 4.11 Paired sample test......................................................................................... 61
Table 4.12 Statistic Description ..................................................................................... 62
Table 4.13 Paired sample test ........................................................................................ 62
Table 4.14 The comparison of pre test and post test Result........................................... 63

LIST OF APPENDICES
1. Pre test Score Of the Experiment Class ...................... APPENDIC 1
2. Pre Test Score of The Control Class .......................... APPENDIC 2
3. Post test Score of the Experiment Class ..................... APPENDIC 3
4. Post test Score of the Control Class ............................ APPENDIC 4
5. Lembar Soal .............................................................. APPENDIC 5
6. Attendance List .......................................................... APPENDIC 6
7. Score Sheet Student‟s ................................................. APPENDIC 7
8. Lesson plan ................................................................ APPENDIC 8
9. Kartu Bimbingan ........................................................ APPENDIC 9
10. SK Seminar ................................................................ APPENDIC 10
11. Daftar Hadir Seminar .................................................. APPENDIC 11
12. SK Pembimbing .......................................................... APPENDIC 12
13. Surat Izin Penelitian .................................................... APPENDIC 13
14. Documentation ............................................................ APPENDIC 14

CHAPTER I
INTRODUCTION
A. Background of the Study
Language is the most important thing in our lives. because language is
a communication tool, humans use language as a tool to express ideas,
feelings and acceptance to others. this language can be used in all forms,
especially through oral and written communication and using expressions
with body language 1For a real practice, the people in certain area dominantly
use their local language for daily conversation, and they use Indonesian
language in formal occasion. In short, language play important roles for
human interctions and communications from local, national, and iternational
level that also reflects their culture.
One of the languages that is used as communication tool in
international level is English. As an international language, English is
spoken all over the world. Therefore, educated people should master English
to help them communicate and make relationship with people in other
countries. Mastering English can help people to understand text books that
are mostly written in English. Then, it also makes people easy when they are
sharing information with overseas students. It is known that in modern, era
almost all aspects of life from the smallest to the biggest ones mostly use
1 Jeremy Harmer. The Practice of English Language Teaching Fourth Edition, USA, Longman,
1990, P. 13

English as means of communication, for instance: in the field of business,
commerce, administration, and government. Knowing this, students are
demanded to be able to anticipate the situation, transition, development, and
the progress of civilization, even it is in the field of language. As the role of
language, it is very important for the success of or the failure of someone‟s
career. As the result, important and current information in the world can be
understood easily by mastering English.
Learning English in formal education insists students to learn four skills of
English, namely: listening, speaking, reading, and writing. Based on K-13
Curriculum:
Siswa seharusnya menguasai empat kemampuan bahasa Inggris agar
mereka dapat mengaplikasikannya dalam kehidupan nyata untuk
berinteraksi dengan lingkungannya” (the students should master four
skills of English in order they can implement their English skills in a real
life for having interaction with their own environment)2.
English is widely used as international communication in the
world. Realizing the importance of English, the Indonesian
government gives a priority to English as a foreign language to be
taught in Indonesia. Based on Standard Competence stated in
2Badan Standard Nasional Pendidikan (BSNP) and Direktorat Pembinaan SMP Ditjen
Mandikdasmen Depdiknas (Foundationd of National Standard for Education and Center of Junior
High School Training of National Educational Department). 2006. Model Silabus Mata Pelajaran
Bahasa Inggris Sekolah Menegah Pertama (Syllabus Model English Lesson for Junior High
School). Jakarta, BSNP, P. 5.

National Constitution No. 22 Tahun 2006, the goal of English
teaching and learning in Indonesia is to develop students‟ discourse
competence. It concerns on producing both oral and written texts
conveying in four integrated skills, consisting of listening, speaking,
reading, and writing
Speaking skill must be mastered by students in order to reach the
biggest advantages of English. To make the students learn speaking, in
Indonesian curriculum, speaking has become one of main skills in learning
English with various kinds of materials. Students should have good standard
of English pronunciation and large number of English vocabulary to master
speaking skill The two English elements above should be taught seriously at
schools in order to support students in mastering English skills, especially
speaking as oral production skill. Pronunciation supports students‟ confident
in producing sounds and vocabulary helps students to produce meaning. For
these problems, English teacher should give more attention in teaching
students‟ pronunciation and vocabulary in order that they can master speaking
skill easily. a teacher is a person who helps others to acquire knowledge,
competence or values. a teacher also has a very important contribution to the
learning process. The success or failure of the learning process depends on
the strategies used by the teacher in the classroom.3
Mastering speaking skill is not easy; besides mastering good
pronunciation and vocabulary, the students should also master cultural and
3 Carina Girvan. 2016. Extending experimential learning in teacher professional development,
University of dublin P.

social understanding to support their speaking skill. It means that, mastering
english so easy, if we want to learn and the teacher should not only stand in
front of whiteboard and explain the lesson, that‟s make students boring.
Students should explore various kinds of fixed expressions used in English
expressions of daily activities. It is important to underline that not all kinds of
speaking expressions can be translated. Students need to understand the
culture to use the expressions in order that they can apply them in a real life.
In other words, cultural understanding is important for the students as
supporting knowledge of speaking skill.
SMA Pancasila is one of Senior High School in Kota Bengkulu
that applies Curriculum KTSP as its guidance in conducting learning
process of English. In other words, the students should get specific
portion of learning English in SMA Pancasila Bengkulu.
To know the real problem that happens in the field. The
researcher did an observation at Eleventh grade of Senior High
School Pancasila Kota Bengkulu on March 23, 2018. It was found
some problems. First, the teacher did not use specific strategy in
teaching speaking in the classroom. The teacher only stand in front of
whiteboard and explained the lesson. Second, The students only
became good listeners. From this situation, it can be said that it used
teacher center learning. Third, there was lack interraction between
teacher and students in the classroom. Then, the teacher mostly used
Indonesian language. Fourth, the teacher did not try to encourage the

students to speak in speaking class. Fifth, most students did not pay
serious attention to the teacher. They did other activities with their
friends4.
To know the problems in deep, the researcher interviewed the
English teacher and students. The teacher said that the students‟
problem in speaking were never practice, used mother tongue ,
difficulty to improve their ideas and their ability were varied, but
most of them needed more improvement in English, especially in
speaking skill. The students have problems in English vocabulary
mastery, pronounciation, and learning motivation. Therefore, most of
the students were reluctant to speak English in English class. In
addition, the students have low confident in speaking English5.
Then, the researcher also interviewed some students. Most of
the students said that English is difficult lesson to study. They can not
understand English and they can not speak English because they do
not know much about English vocabulary. Pronouncing English is
very difficult activity for them because they rarely practice speaking
English. Then, they found that English as boring lesson because most
of the activities are only listening the teacher‟s explanation and doing
excercise in the textbook6.
4Nunu Nurahhman.. An Headmaster of SMA Pancasila Kota Bengkulu, Interviewed on
February 14, 2018. 5Hendrik Purnomo. An English Teacher of Eleventh grade of SMA Pancasila Kota
Bengkulu, Interviewed on February 14, 2018 6Astika wulan,Doni,Roy Ramadhan,Eleventh grade Students of SMA Pancasila Kota
Bengkulu, Interviewed on February 14, 2018.

From the result of obseravation and interview above, the
researcher can underline the most problems of the students are: (1)
learning motivation, (2), lack English vocabulary mastery, (3) low
pronunciation skill, (4) felling bored to English lesson, lack practice
of English. Then, the teacher also did not use enjoyable and
innovative teaching strategy to encourage students to be interested in
learning English, especially speaking skill.
To overcome the students problem in English, especially in
speaking skill, it needs develop an appropriate teaching to help them
as solution for their problems. SAVI (Somatic, Auditory, Visual, and
Intellectual) Technique can be the best solution for the students‟
problems eleventh grade of Senior High School Pancasila Kota
Bengkulu. SAVI is one technique which involves all of the potentials
in the body to study or all of sensory register, this method introduced
by Meier (1999). Somatic means that learning by moving and doing,
Auditory are learning by talking and hearing, Visual are learning by
observing and picturing, and intellectualy are learning by problem
solving and reflecting.
Based on the problem above, the researcher is going to do
research entitled “The Effect of SAVI (Somatic, Auditory,
Visualization, Intellectualy) Technique on Student’s Speaking Ability
(A Quasi Experimental Research at the Eleventh Grade Students of

Senior High School Pancasila kota Bengkulu in Academic Year
2018/2019).
B. Identification of the Problem
Based on the background above, the problems of the research
can be identified as the following detail: (1) The students felt bored to
English lesson, lack practice of English. Then, the teacher also did not
use enjoyable and innovative teaching strategy to encourage students
to be interested in learning English, especially speaking skill. (2) The
causes of students‟ problems are they have problems in English
vocabulary mastery and pronunciation. (3) The students do not have
high interest in learning English. (4) The teacher‟s teaching strategy is
till teacher center. The teacher did not use specific strategy or
tecnique and media to encourage students to speak English. In
addition, teacher‟s and students‟ interraction in the classroom needed
improvement.
C. Limited of the Researche Problem
This research only limits on solving students‟ speaking
problems by using SAVI Technique at the eleventh grade students of
SMA Pancasila Bengkulu in the academic year 2018/2019.

D. Researche Questions
From the limitation of the problem above, the problem of the
research can be formulated as follow: Are there any significant effects
on students‟ speaking ability between the students who are taught
using SAVI Technique and those of that who are not at the eleventh
grade students of SMA Pancasila Kota Bengkulu in the academic year
2018/2019?
E. Objective of the Research
The objective of this research is to investigate whether SAVI
Technique can improve students‟ speaking ability at the eleventh
grade students of SMA Pancasila Bengkulu in the academic year
2018/2019.
F. Significance of the Research
This research is hoped to give advantages for students, teachers, and the
next researcher:
English Teacher
1. This research can be a reference for English teachers who have the same
problemes with the eleventh grade students of SMA Pancasila Bengkulu
in the academic year 2018/2019. It will be useful to solve the students‟
problems.

2. As one of alternative strategy to teach speaking for senior high school
students.
Students
1. Introduce to the students one of speaking technique to improve speaking
skill. Students need to apply specific technique to learn English,
especially speaking skill.
2. Encourage students to study English, especially speaking skill.
3. Make students realize that English is not boring and difficult lesson. On
the contrary, English is amusing lesson to learn.
Next Researchers
1. This research can be a source of information for the next researchers to do
the next research with different teaching strategy.
2. Develop the next researcher thought in doing research at the same field
and wider scoope of the research.
G. Definition of Key Terms
1. Speaking Ability is an interactive process of constructing meaning
that involves producing and receiving and processing information
in form of oral interaction.
2. SAVI Technique (Somatic, Auditory, Visualization, Intelectualy) is
one of innovative teaching technique, especially speaking skill that

involves all of the potentials in the body to study or all of sensory
register, this method created by Meier .

BAB II
LITERATURE REVIEW
A. The concept of Speaking
1. The definition of Speaking
Speaking skills are considered to be the most basic and most important
in language. Being able to express yourself in the target language gives
someone an edge over others who can not think of anything to say. This is
also considered as one of the complicated skills for students to master
because it is included in productive skills. Productive skills in English consist
of speaking and writing, but they differ in many ways. However, there are a
number of language production processes that must be passed through any
media that students will use. Speaking as productive skills cannot be
separated from listening. When someone speaks, he produces text and it must
be meaningful. In the nature of communication, people can find speakers,
listeners, messages and feedback. Speaking cannot be separated from
pronunciation because it encourages students to learn the sound of English.7
Speaking is one of the important skill in Studies English8.to know
about Speaking, every Expert will define it in different ways. According to
Brown in Azlina Kurniati, speaking is a productive skill that can be observed
directly and empirically these observations are always colored by the
7 Shafaat Hussain, Teaching Speaking Skills In communication Clasroom, 2017 International
Journal of Media,journalism and Mass Communication ( IJMJMC) .2017 Volume 3, Issue 3,
2017,PP 14-21 ISSN : 2454-9479 P. 15
8 Seyed Moslem, Relationship among Self-preceived Oral Competence, communication
Apperehension, and Iranian EFL Learner’s Willingness to communicate : Cooperative teaching in
focus.2018 Journal International of foreign Language Teaching and Research. Volume 6, issue 21.

accuracy and effectiveness of the listening skills of test takers, which of
course compromises the reliability and validity of oral production tests9. It
means that, Speaking is a tool to communicate to each other, and also how to
make conversation to social.
speaking skills are important for career success, but certainly not limited to
one's professional aspirations. speaking skills can also change one's personal
life10
It means that the main objective of speaking is for communication.
According to David Nunan he said that speaking is fundamentally an
instrument act11
. It means that, Speaking is only an oral trail of abilities that
it got from structure and vocabulary. Based on the statements above the
researcher infers that if someone speaks, he/she should understand what is
he/she about. In this section, the writer should develop ideas or build some
topics to be talked and to make other responds to what speakers says.
2. Student’s difficulties in learning Speaking
Speaking is regarded as one of difficult skill because the process is
complicated. In communication, it involves the use of verbal and non verbal
media. For a speech act to take place, there are four important elements
needed: (1) the sender or source; (2) a message; (3) a receiver; and (4) a
9 Azlina Kurniati, A Study on Speaking Ability of The Second Year Students of SMK Telkom,
Pekanbaru Thesis. Riau University. P. 3 10 Ishrat Aamer Qureshi . The Important of speaking Skills for EFL Learners Vol.9 No.2
November 2014
11David Nunan. Language Teaching Methodology: A Textbook for Teachers, USA, Prantice Hall,
1995, P. 23.

response or feedback. The communication process may be illustrated
graphically as follows:
Figure 2: The Process of Oral Communication
The sender of source is the speaker or communicator and the medium
used to send the message comes in all forms such as story, poem, music, etc.
The receiver reacts or responds to thge message by means of feedback. An
important variable that could affect communication is noise. Psychological
noise is usually in the sender and/or the receiver of the message. It affects
how the sender expresses his message and how the receiver reacts to it.
Psychological noise, on the other hand, affects the intelligibility and clarity of
the message. A talking audience, background stereo music, the whirring of
the ceiling fan, and other sounds in the surrounding are examples of physical
noise.
In learning speaking, students find different kinds of difficulties. The
difficulties are based on the students‟ previous experiences. At schools,
English teachers find different experience in students‟ problems in speaking
(2)
Message
(3)
Receiver
(4)
Feedback
(1)
Sender or Source

skill, such as some teachers in Teacher Education Council, Department of
Education explained some students‟ problems in lerning speaking in the
classroom based on their experience :
1. Inhibition
Unlike reading, writing, and listening, speaking requires some
degree of real time exposure to the audience. Learners are often inhibited
to speak in foreign language, worried about making mistakes, fearful of
criticism or losing face, or simply shy of the attention their speech attracts.
2. Nothing to say
Learners often complain that they can not think of anything to say. This
condition makes them stay silent in their chair. They do not speak anything.
3. Low or uneven participation.
Only one participant can talk at a time if he or she is to be heard, and in a
large group this means that each one will have only very little talking time.
This problem is compounded by the tendency of some learners to
dominate, while others speak very little or not at all.
4. Attitude
attitude as one of the key factors that influence the success or failure of
language learners. there is a clear relationship between attitudes and
achievements in learning languages12
12 Rasheedha Banu. Difficulties Faced by Collage Student in speaking English – A sociological
Reflection 2017. International Journal of trend in Research and Development,Volume 4. May
2017.Page 3.ISSN: 2394-9333.www.ijrd.com

The students‟ difficulties above happen in English class because the
students do not know a word or just can not remember it. For this problem,
the students can employ some solutions or strategies proposed by Hammer13
:
(1) improvising – in this case, the speakers sometimes try any word or phrase
that they can come up with in the hope that it is about right. Such
improvisations sometimes work, but sometimes they can also meaning; (2)
discarding – when speakers simply can not find words what they want to say,
they may discard the thought that they can not put into words; (3)
foreignising – when operating in a foreign language, speakers sometimes
choose a word in a language they know well and „Foreignise‟ it in the hope
that it will be equivalent to the meaning they wish to express in foreign
language; (4) paraphrasing – speakers sometimes paraphrase some
information by paraphrasing lexical subtitution.
Basically, all English teachers have the same problems with above
explanation. They can be said as common problems in English class,
especially in ESL countries in the world, included Indonesia. The problems
may be cused by various factors. One of the central difficulties inherent in the
study of speaking is that it overlaps with a considerable number of other areas
and disciplines: Howfar, for instance, is the structure of a conversation
culturally determined (also dealt with in pragmatics and ethnography)? How
far are the grammar and vocabulary of speech different from other sorts of
grammar (which is related also to the fields of syntax and semantics)? What
13
Jeremy Harmer. The Practice of English Language Teaching Third Edition, USA, Longman,
1990, P. 249.

are the critical factors in the stream of speech that make it intelligible
(prosody, phonetics/phonemics)? In other words, the students should
understand distinct areas: the global or discourse level, the structural level
and the level of speech production.
These three areas above broadly relate to fairly stable areas of activity
in linguistics of discourse, lexis and grammar, and phonology/phonetics and
map on to, and overlap with, other threads of study in theoretical and
linguistics . Some of the relationships are teaching speaking is not easily
separated from other objectives When the spoken language is the focus of
classroom activity there are often other aims which the teacher might have14
.
For instance, a task may be carried out to help the student gain awareness of,
or to practise, some aspect of linguistic knowledge (whether a grammatical
rule, or application of a phonemic regularity to which they have been
introduced), or to develop productive skills (for example rhythm, intonation
or vowel-to-vowel linking), or to raise awareness of some socio-linguistic or
pragmatic point.
The goals of communication process is to get the message accross. If
the message is not understood and responded to as intended, communication
has not taken place. It means that the communication is failled. In this case,
there are some factors that cause communication breakdown. They are related
to language; the factors are:
14
Loc Cit,

1. Mispronunciations. For example, if the word “ship” is pronounced as
“sheep” that would change the meaning of the message “Look at the ship”.
2. Lack of awarness of the pronunciation of a given word in the different
varieties of English. For example in Australian English the word “today” is
pronounced “tudai”. A person used to American English would take it to
mean “to die” instead of “today.”
3. Different meaning attached to a word. Denotative meaning is the
dictionary meaning of a word while connotative meaning is the personal
meaning attached to a word.
4. Psychological factors. Our reactions to a message may be conditioned by
our opinion of and feelings for the sender of the message. Moreover, the
way we word our message and the way we respond are affected by our
feelings during the interactions.
5. Delivery of the message. The volume of one‟s voice and his rate of
speaking could have an effect on the intelligibility and clarity of the
message.
6. Situation or setting. Physical noise, the size of the room, size of the
audience could impede communication.
3. Characteristics of succesfull Speaking
In teaching an English skill, the target is successful classroom. To reach
the success class, it is important for the teachers to use the best strategy and
model during the lesson. Harmer wrote that when teaching speaking or

producing skill, the teacher can apply three major stages, those are15
: (1)
introducing new language, (2) practice, and (3) communicative activity. This
theory means that the teacher should teach the students about basic
knowledge of language (English) such as the elements of language that must
be learned by the students. Then, the teacher should ask the students to
practice the language by using various strategies. To make the students
familiar with the new language, they must use the language in every day life
in form of various kinds of communicative activities.
The success of speaking activities in class is based on student
participation in the class. To find out the characteristics of a successful
speaking class, Flojo explained that:
1. Talks are more students - as much as possible most of the period
allocated for these activities is actually occupied by learner talks.
2. Even class discussions are not dominated by a small number of
participants. All have the opportunity to speak and participate in
class.
3. High motivation - students really want to talk because they are
interested in the topic and have something new to say about it.
4. Acceptable language - students express themselves in relevant
utterances, easily understood by each other, and the level of
accuracy of acceptable language.
15
Jeremy Harmer. The Practice of English Language Teaching Third Edition, USA,
Longman, 1990, P. 269.

To achieve success in the classroom, teachers need active participation
as a teacher who guides students in the classroom: how the teacher
encourages students to speak, gives students a fair share, motivates them, and
trains them in acceptable English.16
B. Somatic, Auditory, Visualization, Intelectually ( SAVI ) Technique
1. The Definition of SAVI Technique
SAVI is abbreviation from Somatic Auditory Visual and Intellectual.
SAVI technique is introduced by Meier. SAVI technique is an technique that
combines physical movement with intellectual creativity and use all the
senses in the learning process. By Combining physical movement and
intellectual activity and the use of all senses is able to make big influence in
learning. And this study is called SAVI.17
2. The Elements of SAVI Technique
The elements of SAVI technique are Somatic, auditory visual and
Intellectual, those four elements must exist in the learning process, so the
process of learning will be optimal. For more detail bellow is the
explanations.
a. Somatic
16
Trudy Wallace. Teaching Speaking, Listening and Writting. International Academy of Education.
P. 12 17
Ibid.2000. P.91

“Somatic” comes from Greek word. It means soma-body (as in
psychosomatic). So somatic means study by using sense of touch, kinesthetic,
practice-involves physical and gesture.18
Somatic refers to the thought that
spread throughout the body. In essence,the body is the mind. The mind is the
body. The two are one completely integrated electrical-chemical biological
system To stimulate the mind-body connection, the learning atmosphere
created by making people up and out of their seats and physically active from
time to time. The brain and body are inseparably connected in various ways.
Body movements, for example, can improve brain function as Carla
Hannaford pointed out in her book Smart Moves: Why Learning Is Not All in
Your Head. And certain brain conditions can have a profound effect on the
body..19
b. Auditory
Learn by speaking (reading) and listening, ears always catch and save
auditory information unconsciously, when someone creates voice by reading,
some important areas in the brain become active.20
This can be interpreted
that teachers should talk about what they are studying, asking student to read
loudly, translating the experience of students with sound, Inviting them to
talk when solving problems, gather information, create work plans, master
skills, make the learning experience review, or create meaning for themselves.
18
Dave Meier, The Accelerated, A Creative Guide to designing and delivering faster, more
effective training programs (New York: McGraw-Hill, 2000), P. 43 19
28 Ibid 2000. P. 37
20 Ibid. 2000. P.46.

c. Visual
Visual acuity is strongest senses in the process of speaking, because in the
brain to process visual information is more than all the other senses.
Therefore,students will be easier to learn if they can see what is being learned.
Learning by visual is learning by observing and picturing. Visual learners
learn best when they can see real-world examples, icons, pictures, and
various kinds of images while they are learning. Sometimes visual learners
do even better when they create idea maps and diagrams out of what they are
learning.
d. Intellectual
Role of brain in reading activity has shown its significance. The empowering
of brain capacity to absorb particular information from reading materials
reflects to the employment of human‟s intellectual area in SAVI technique.
Brain as reflection of intellectual is devised to translate the written symbols in
speaking materials into meaningful information by which readers could
understand ideas similarly as been intended by the writer. Briefly, by using of
intellectual area, listeners are supposed to make and use their brain optimally
to create either meaning or value from experiences they get through speaking.
3. The Principles of SAVI technique
Learning language based of SAVI technique would be more effective by
noticing to the principle bellow:
a. Learning involves the whole body and mind.

This means that learning is not only the use of brain but also involves the
whole body / mind with all its emotions, senses, and nerves.
b. Learning a language is to learn to be creative.
Knowledge is not something that is absorbed, but something that is created by
the learner. Learning occurs when learners integrate new knowledge and skills
into the structure itself. Learning is literally creating a new meaning in the
system of the brain / body as a whole.
c. Cooperation helps the learning process.
All good learning has a social basis. We usually learn more by interacting with
our friends. A learning community is always better results than the few
individuals who learn on their own.
d. Learning takes place on many levels simultaneously, learning is not only
absorb Learning is not only absorbing a small thing at a time in a linear way,
but absorbing many things at once. Good learning engages people on many
levels simultaneously (conscious and unconscious, mental and physical) and
take advantage of all the receptors, the senses, system of the brain or body.
e. Learning comes from doing the work itself.
It is like proverb 'the best teacher is experience'. Real world experience as a
teacher is much better than something that is hypothetical and abstract,
because it is provided an opportunity to perform directly, getting feedback,
brooding and doing it again.

f. Positive emotions help the learning process.
Feelings determine the quality and quantity of student learning. Negative
feelings can hinder the learning process, while the positive feelings will
facilitate the learning process easier. Learning with a stressful, painful and
gloomy atmosphere can not surpass the results of learning in a fun, relaxing,
and interesting.
g. Brain-image instantly and automatically absorbs information.
The human nervous system is more a process of images rather than word. A
concrete image is easier to understand and be absorbed than abstract verbal.
Translating abstract verbal into various kinds of concrete images will make the
verbal Abstract easy to learn and to remember in the process of learning.
Based on these basic principles, the SAVI technique required the process of
learning with makes students actively involved. According to Meier learning
based of activity means moving physically active during process of learning,
with utilizing as many senses as possible, and makes the whole body / mind
involve in the learning process. All four of these learning modes have to be
present for optimal learning to occur. Since these elements are all integrated,
the best kind of learning occurs when they are all used simultaneously.21
4. The Implementation of SAVI Technique
SAVI technique is an technique that combines physical movement
withintellectual creativity and use all the senses in the learning process. SAVI
21
Ibid , Dave Meier. P. 9-10.

supposes the listeners to empower their psychomotor senses to perform their
understanding of the reading materials, maximize their hearing and seeing to
help listeners comprehend the content of the speaking, and intellectual
capacity to make understandable experiences from the discourse they have
read already. The implementation of SAVI technique in teaching learning can
be done as follow.
a. Somatic.
To stimulate the mind-body connection, the learning atmosphere created by
making people up and out of their seats and physically active from time to
time. Student can get physical while them, such as; Build a model of a process
or procedure, Physically manipulate components of a process or system,
Create large pictograms and peripherals, Act out a process, system, or set of
concepts, Have an experience, then talk about and reflect on it, Complete a
project that requires physical activity, Do an active learning exercise (a
simulation, a learning game, etc.), Take a field trip. Then write, draw, and talk
about what was learned, Interview people outside the class, and In teams,
create active learning exercises for the whole class.
b. Auditory.
Learn by speaking (reading) and listening, ears always catch and save auditory
information unconsciously, when someone creates voice by reading, some
important areas in the brain become active. Here is a brief list of starter ideas
for increasing the use of the auditory in learning. They are; Have learners read

out loud from manuals and computer screens, Have learners read materials a
paragraph at a time paraphrasing each paragraph into a tape, Recorder. Then
ask them to listen to the tape several times for reinforcement, Ask learners to
create their own audio tape of key words, processes, definitions, or procedures,
Tell learners stories that have the learning material embedded in them, Have
learners in pairs describe to each other in detail what they just learned and
how they are going to apply it, Ask learners to practice a skill or perform a
function while describing out loud in great detail what they're doing, Have
learners create a rap, rhyme or auditory mnemonic out of what they are
learning, and Ask learners in groups to talk nonstop when doing creative
problem solving or long-term planning. (The conversations can be recorded to
captain the ideas.)
c. Visual
Visual acuity is strongest senses in the process of speaking, because in the
brain to process visual information is more than all the other senses. Therefore,
students will be easier to learn if they can see what is being learned. Here are a
few more things you can use to make learning more visual. Such as;
Picturesque language (metaphors, analogies), Vivid presentation graphics, 3-
dimensional objects, Dramatic body language, Vivid stories, Pictogram
creation (by learners, Icon job aids, field observations, colorful decorations,
Room peripherals, and Mental imagery exercise.
d. Intellectual.

The empowering of brain capacity to absorb particular information from
reading materials reflects to the employment of human‟s intellectual area in
SAVI technique. Brain as reflection of intellectual is devised to translate the
written symbols in reading materials into meaningful information by which
readers could understand ideas similarly as been intended by the writer. The
Intellectual aspect of learning gets exercised when you have learners engage
in activities such as: Solving problems, Analyzing experiences, Doing
strategic planning, Generating creative ideas, Accessing and distilling
information, Formulating questions, Creating mental models, Applying new
ideas to the job, Creating personal meaning, and Thinking through the
implications of an idea.22
S-A -V-I: Putting It All Together. Learning is optimized when all four
SAVI components are present in a single learning event. For example,
people can learn something by watching a presentation (V), but they can
learn much more if they can do something while it is going on (S), talk
about what they are learning (A), and think through how to apply the
information being presented to their job (I). Or they can enhance their
problem-solving skills (I) if they are simultaneously manipulating something
(S) to produce a pictogram or 3-dimensional display (V) while they talk out
loud about what they are doing (A)
22
Dave Meier, The Accelerated, A Creative Guide to designing and delivering faster, more
effective training programs (New York: McGraw-Hill, 2000), 45-50.

C. Some Related Previous Studies
There were some studies that relevant to this study of speaking
abilty, Sholihin , the title “The Using of SAVI (Somatic, Auditory, Visual
and Intellectual) Technique in Improving the Students‟ Vocabulary at The
Seventh Grade of SMPN 01 Monta Bima.23
In this research, he analyzed
about the improvement of students‟ vocabulary by using SAVI (Somatic,
Auditory, Visual and Intellectual) Technique in teaching learning process.
The result of the study shows that the students‟ vocabulary taught
using SAVI or the experimental class show that the mean score of the pre-
test was 17.5 and the mean score of post–test was 28.33. From the mean
scores of the pre-test and post-test of the experimental class it can be seen
that there was a significant progress from pre-test to the post-test.
Meanwhile, the students‟ vocabulary taught without using SAVI or the
control class shows that the mean score of the pre-test was 7 and the mean
score of the post-test was 10.92. From the mean score of the pre-test and the
post-test of the control class, it can be seen that there was progress but not
significant progress than the mean score of the pre-test and post-test in the
experimental class. Then, the t-test value was higher than t-table value.
Based on the data analysis, it was found that there was a significant
difference between the results of teaching vocabulary using SAVI and that
teaching vocabulary without using SAVI.
23
Sholihin. The Using of Savi (Somatic, Auditory, Visual and Intellectual) Technique in
Improving the Students’ Vocabulary at The Seventh Grade of SMPN 01 Monta Bima. GaneÇ
Swara Vol. 9 No.2 September 2015.

Second, Puspitasari did a research with the title The Effect of the
somatic Auditory Visualization learning model, Intellectually (SAVI) is
assisted by photo story media on critical thinking skills of the seventh grade
students in the Surakarta 13th state junior high school.24
The result showed
that This research applied experimental method by true experimental design
as a research design which postest-only control design form. The population
of this research was seven grade students of SMP N 13 Surakarta in
academic year 2015/2016 which numbers are 255 students. Annexation
sample of this research used cluster random sampling technique.The data
collection technique used is the test, observation and documentation.The
technique of data collecting used normality test and homogenity test. The
hypothesis test in this reseache used T.test. The result of this research
indicate that the SAVI learning model assisted photo story media concern in
critical thinking skills on seven grade students of SMP N 13 Surakarta In
Academic Year 2015/2016 (Study on basic competenciesexplaining the
nature of freedom of expression)has influences. It can be approved by the
defferences of obtained average value which the experimental group class is
85,27 and the average value for the control group class is 79,8. Beside that,
based on result of T.test obtained thitung value is 2,981 meanwhile the value
of ttabel is 1.999 (interpolation), so the result is thitung (2,981) > ttabel
(1.999) by the significant level is 5% therefore H0 rejected and Hɑ accepted.
24
Puspitasari, skandar, Dadang. The Effect of the somatic Auditory Visualization
learning model, Intellectually (SAVI) is assisted by photo story media on critical thinking skills of
the seventh grade students in the Surakarta 13th state junior high school. 2017. Journal of
Education, Educitizen, Vol. 2 No. 1 Mei 2017 Page 1 p-ISSN: 2477-5924 e-ISSN: 2477-4878.

It was concluded that there is a difference between critical thinking skills of
students using SAVI learning model assisted photo story media with those
not using SAVI learning model assisted photo story media to the basic
competencies to explaining the nature of freedom of expression in class VII
in SMP N 13 Surakarta.
From three previos studies above, so the researcher could explain
both of the difference and similar things with what the researcher had done.
The first was the differences are location of research and the year of
research and also the skills those had been researched were different. The
similarity was doing the research focused on the using of Savi (Somatic,
Auditory, Visual and Intellectual) Technique. Additionally, in this research,
the researcher would like to implement The Using of Savi (Somatic,
Auditory, Visual and Intellectual) Technique to improve students speaking
skill at the eleventh grade students of SMA Pancasila Bengkulu in academic
year 2018/2019.

D. Conceptual Framework
Figure 2.1. Conceptual Framework
E.
To know the effect the students‟ ability in speaking, the researcher
used SAVI technique in the case of to know the effect from the students‟
speaking ability especially for the students at the eleventh grade of SMA
Pancasila Bengkulu.
Based on conceptual framework above, the researcher used SAVI
Technique as the steps were; the first step is the researcher provided some
pictures, hints or clues to bridge students prior knowledge, explained and
modelled In the group, students collaboratively made the scheme of the text
based on the pictures, hints or clues given by the teacher, and the students
did analyzing the picture, and then the student‟s retell what they get from
based on the pictures.
This research was done by doing some implementation of SAVI
technique in Experiment class, if the first meeting and the second meeting
Students‟ low Speaking Ability Problem
Problem
Solving
SAVI technique
Expected Result Improving of Students‟ Speaking
Ability

results did not success in effect of SAVI technique on students‟ speaking
results, so the researcher was do the same teaching steps until the students‟
speaking results were categorized as success.
E. Research Hypothesis
Hypothesis is provides direction for this study. The hypothesis
places a specific relationship between variables and thus determines the
nature of the data needed to test the preposition25
The hypothesis if the
provisional answer to the problems of the research the theoretically
considered possibly or highest the level of truth. It is provisional truth
determined by the researcher that should be tested and provided. Kinds of
hypothesis which are used here are; Zero hypothesis (Ho), is the
hypothesis which state that there is no any significant effect of the object
of the research. It is also called with negative hypothesis and alternative
hypothesis (Ha), is the hypothesis which state that there is any significant
effect of the object of the research. It is also called with positive
hypothesis. The criteria of the test of hypothesis as follow;
Ha: there is any significant effect of using SAVI technique to improve
Student‟s speaking ability in Second Grade of Senior High School
(SMA Pancasila).
Ho: there is no any significant effect of using SAVI technique to improve
Student‟s speaking ability in Second Grade of Senior High School
(SMA Pancasila).
25
Donald Ary,Lucy Cheser Jacob.Introduction to Research in Education. Australia:
WADSWORTH CENGAGE Learning. P.83

CHAPTER III
RESEARCHE METHOD
A. Researche Design
This research apply classroom A Quasi Experiment method. Quasi-
experiment is a study that aims to evaluate interventions but does not use
randomization. such as randomized trials, quasi-experiments aim to show
the causal relationship between intervention and outcome.26
And also quasi
experimental research designs, such as experimental designs, test the causal
hypothesis. in both experiments27
This method used to test a speaking
ability student with SAVI technique. Experiment is process of examining
the truth of the statistical hypothesis relating to some research method
problem. It means that, experiment is method to control class and the
researche was apply this experiment in student and also to control the
class.
Based on the definition of the expert above it can be concluded
that, Experiment is a certain method that to control the class. The control
group designs introduced were classified in this chapter under two heads:
pre test and post test28
This method is used to examainingThe effect of SAVI
technique on Student‟s speaking ability in Second Grade of Senior High
School ( SMA Pancasila ). Experimental class was treated by applying
26
Anthony D Harrris. 2004. The Use and Interpretation of Quasi Experimental Studies in
Infectious Disease.America : Antimicrobial Resistance invited Article. P. 2 27
Howard white. 2014. Quasi Experimental Design and Methods, Methodological Briefs : Impact
Evaluation No 8 : UNICEF Office of Research, Florence 28
Donalt T.Campbell.Dkk.1963. Experimental And Quasi Experimental Design for
Research.London: Houghton Mifflin Company. P. 13

SAVI Technique for each meeting, while the control class was taught by
using the conventional teaching strategy. The success of treatment was
determined by comparing pre-test and post test scores which is also used to
know whether there was significant effect of SAVI technique. The design
can be seen as follow:
Table. 3 Treatment designed
X T1 O T2
Y T1 - T2
Where:
X : Experiment class
Y : Control class
T1 : Pre-test for the experimental class and control class
T2 : Post-test for the experimental class and control class
O : Treatment for experiment class
- : Non treatment control class

B. Population and Sample
a. Population
population is a group of elements or cases, whether individuals,
objects, or events, that fit certain criteria and we mean to generalize research
results29
In addition, Sugiyono says that “Population is the generalization
range that consists of object or subject that has quality or specific
characteristic which is determined by the researcher to be learned and
withdrawn the conclusion”.30
The, Population in this research involved the
whole is three class that the research apply SAVI technique in Eleventh
grade students of SMA Pancasila kota Bengkulu. They possessed several
homogenous characteristics such as the same age, level, burden of learning,
ability and etc. The population in this study can be as in the table below:
Table 4
The Number of Population
NO CLASS M F TOTAL
1 XI IPA.1 7 9 16
2 XI IPS 1 6 11 17
3 XI IPS 2 5 9 14
SUM OF POPULATION 47
Source : SMA Pancasila Kota Bengkulu
29
James H.MCMILLAN.1996.Educational Research ( Fundamentals for The consumer). New
York: HarperCollins CollagePublished. P.85 30
Sugiyono. 2011. Metode Penelitian Pendidkan. Bandung: Alfabete. P 117

b. Sample
Sample is a single group of elements or elements, from which data is
obtained.31
It means that sample is a little part of the amount and
characteristic of population. In this research, the research was take two
classes among the third. The reason why the researcher choose to classes
were, because look at purposive sampling average score was not significant
different and the same teacher taught these classes.
Table 5
The Sample of Research
Number Group Students Classes
1 Experimental 14 XI IPS.2
2 Control 17 XI IPS.1
C. Researche instrument
Instrument is the tool used to collect the data or the needed
information. The instrument of this research is Speaking written test,
speaking oral test, Recording, and documentation.
1. Speaking oral Test
To know the effective SAVI technique, the researche be oral test to students
by giving question based topic the material, test was given to the student to
know speaking ability.
31
Loc cit. P. 86

INTEGRATED SPEAKING ASSESSMENT 32
SCORE GENERAL DESCRIPTION
DELIVERY LANGUAGE USE TOPIC DEVELOPMENT
90-100 The response fulfills the demands of the task, with at most minor lapses in completeness. It is highly intelligible and exhibits sustained, coherent discourse. A response at this level is characterized by all of the following:
Speech is generally clear, fluid, and sustained. It may include minor lapses or minor difficulties with pronunciation or intonation. Pace may vary at times as the speaker attempts to recall information. Overall intelligibility remains high.
The response demonstrates good control of basic and complex grammatical structures that allow for coherent, efficient (automatic) expression of relevant ideas. Contains generally effective word choice. Though some minor (or systematic) errors or imprecise use may be noticeable, they do not require listener effort (or obscure meaning).
The response presents a clear progression of ideas and conveys the relevant information required by the task. It includes appropriate detail, though it may have minor errors or minor omissions.
80-89 The response addresses the task appropriately, but may fall short of being fully developed. It is generally intelligible and coherent, with some fluidity of expression, though it exhibits some noticeable lapses in the expression of ideas. A response at this level is characterized by at least two of the following:
Speech is generally clear, with some fluidity of expression, but it exhibits minor difficulties with pronunciation, intonation, or pacing and may require some listener effort at times. Overall intelligibility remains good, however.
The response demonstrates fairly automatic and effective use of grammar and vocabulary, and fairly coherent expression of relevant ideas. Response may exhibit some imprecise or inaccurate use of vocabulary or grammatical structures or be somewhat limited in the range of structures used. Such limitations do not seriously interfere with the communication of the message.
The response is sustained and conveys relevant information required by the task. However, it exhibits some incompleteness, inaccuracy, lack of specificity with respect to content, or choppiness in the progression of ideas.
32
Dimitra Hartas. 2010. Educational Research and Inquiry ( Qualitative and Quantitative
Approaches). London: Continum British Library. P. 67

70-79 The response is connected to the task, though it may be missing some relevant information or contain inaccuracies. It contains some intelligible speech, but at times problems with intelligibility and/or overall coherence may obscure meaning. A response at this level is characterized by at least two of the following:
Speech is clear at times, though it exhibits problems with pronunciation, intonation, or pacing and so may require significant listener effort. Speech may not be sustained at a consistent level throughout. Problems with intelligibility may obscure meaning in places (but not throughout).
The response is limited in the range and control of vocabulary and grammar demonstrated (some complex structures may be used, but typically contain errors). This results in limited or vague expression of relevant ideas and imprecise or inaccurate connections. Automaticity of expression may only be evident at the phrasal level.
The response conveys some relevant information but is clearly incomplete or inaccurate. It is incomplete if it omits key ideas, makes vague reference to key ideas, or demonstrates limited development of important information. An inaccurate response demonstrates misunderstanding of key ideas from the stimulus. Typically, ideas expressed may not be well connected or cohesive so that familiarity with the stimulus is necessary to follow what is being discussed.
60-69 The response is very limited in content or coherence or is only minimally connected to the task. Speech may be largely unintelligible. A response at this level is characterized by at least two of the following:
Consistent pronunciation and intonation problems cause considerable listener effort and frequently obscure meaning. Delivery is choppy, fragmented, or telegraphic. Speech contains frequent pauses and hesitations.
Range and control of gram-mar and vocabulary severely limit (or prevent) expression of ideas and connections among ideas. Some very low-level responses may rely on isolated words or short utterances to communicate ideas.
The response fails to provide much relevant content. Ideas that are expressed are often inaccurate, limited to vague utterances, or repetitions (including repetition of prompt).
0-59 Speaker makes no attempt to respond OR response is unrelated to the topic.

Grades and marks should be given the following interpretation:
1. Grade 0 – 59 = very poor (E)
2. Grade 60 – 69 = poor to below average (D)
3. Grade 70 – 79 = average (C)
4. Grade 80 – 89 = above average to very good (B)
5. Grade 90 – 100 = excellent to flawless (A)
2. Recording
The researche used recording to record the students speaking ability in pre-
test and post-test both of experimental class and control class.
3. Documentation
Documentation used to supporting document to describe authenticity of the
data in the research. The documentation in form of photographs during
process of the research, namely: teaching process, teacher – students‟
interactions, teacher – collaborator discussions, and other important
activities in the classroom.
D. Collecting Data Technique
The technique of collecting data used by the researcher in doing this study
only relied on the test.
1. Test
“Test is the formulating of items examined to the sample of study. Where,
the characteristics of sample are based on the needs of study”33
. in tests,
33
Ibid.,P. 5.23

researchers have a strong data collection method, a series of impressive tests
for collecting numerical data rather than verbal types.34
In this study, the data
collect by organizing the test into pre-test and post-test.
a. Pre-Test
The researcher give the pre-test to both groups (experimental and
control group). Pre-test given to know how far the students‟ standard abilities
in speaking. This was actually a way to receive the first data of this study.
This pre-test was given to sample members before the treatment (SAVI
technique) was implemented in the experimental group and the conventional
teaching technique was implemented in the control group.
The form of pre-test was organized into speaking test format which
included the material fields as: describing people, Describing narrative text
because based on the syllabus, one of the materials for second grade at first
semester students was referred to speaking .
In giving the pre-test, the researcher used one meeting being out of
time period for cultivating study treatment. The length of time in giving pre-
test to both groups was allocated as long as 90 minutes. The researcher also
controlled students more cautiously in order that they were not cooperative
while doing the pre-test. In this study, pre-test had been provided to students
in both groups.
b. Post-test
34
Louis cohen, Researche Methods in Education: Sixth Edition. Routledge : London. P. 414

Post-test was given by the researcher to the students after the
implementation of SAVI Technique at the end or after the treatment had
really finished to be given in the experimental group and also if the SAVI
technique had been implemented in the control group. It indicated that post-
test was given to both control and experimental group and the result obtained
by both groups became the contrast value between them. Giving post-test
manifested in the last action of this study collecting data. The post-test was
also constructed in speaking of describing people format in which the
materials tested was the same as those in the pre-test which is speaking test
In giving post-test, the researcher also use one meeting being out of
time period for cultivating study treatment. The length of time in giving post-
test to both groups was also allocated as long as 90 minutes. The researcher
also controlled students more cautiously in order not to be cooperative among
them in doing the post-test. In this study, post-test was do on semester genap
2018 in a group. After finishing pre-test and post-test to either experimental
or control group, the researcher eventually knew the scores of both groups,
and found the differences between those group. Therefore, the researcher
then got the conclusion whether SAVI technique have effect toward students
speaking ability or not.
c. Treatment
As stated above, the technique of SAVI in speaking implied in this
research as the treatment was given to experimental group in the form of

SAVI Technique as the whole activity in teaching speaking process,
meanwhile for control group was in the form of ordinary way.
In addition, the treatment was implement to the subject for 7 meetings
and at the first both group was given pre-test and at the end was given post –
test. It means that the study took all the allocated time for teaching the
Narrative text in speaking test. which was given by the school based on the
semester program. Based on the semester program of SMA Pancasila
At the beginning of the experimental group, the researcher explained
the procedures and what should they do in SAVI technique in term of
training. The training was do conduct in experimental group (XI IPS I). The
activities in training section such as:
The researcher explained about SAVI technique (definition, procedure
and purpose)
The researcher explained about the role of the teacher in the class
The researcher and the students simulated the implementation of SAVI
technique in the class .
E. Analyzing Data
Analysis is the process of breaking data into smaller units, and integrating
information in a more general analytical form35
35 BED Hons .2012. Researche Methods in education. United States : Higher education commision
P.26

1. Mean score
To get the mean scores of pre and post test result in the control group,
the researcher used the formula such below:
M =
Where:
M : Mean score of control group
∑X : The sum of students‟ score in control group
N : The amount of students‟ at control group
In addition, in order to acquire the mean scores of pre and post test result in
the experimental group, the researcher used the formula below :
M =
Where:
M : Mean score of Experimental group
∑X : The sum of students‟ score in Experimental group
N : The amount of students‟ at Experimental group

2.Standard Deviation
standard deviations is determining the position by dividing the upper class of
each group .36
In gaining the standard deviation of scores in conducting the
study at control group, the researcher applied the formula below:
SDy = √
Where :
SDy= Standard deviation of control group
Y = Score of control group
Y = Mean score of control group
N = the amount of students at control group
In addition, to acquire the standard deviation of scores in conducting the
study at experimental group, the researcher used the formula below:
SDX = √
Where:
SDx :Standard deviation of experimental group
X :Score of experimental group
X :Mean score of experimental group
36 Arikunto, Suharsimi. Dasar Dasar Evaluasi Pendidikan . Jakarta : Bumu Aksara. 2013. P. 298

N :The amount of students at experimental group
3. Hypothesis testing
In testing the hypothesis devised previously, the researcher used the
statistical formula such below:
t =
√
Where:
t : t test
M1 : Mean score of the post test at experimental group
M2 : Mean score of the post test at control group
S1 : Standard deviation of post-test result at experimental group
S2 : Standard deviation of post-test result at control group
N1 : The amount of students at experimental group
N2 : The amount of students at control group
4. Regression Test
T- Test
All of data get from test are computed by statistical Package For The
Social Science ( SPSS) Version 16.0. The experiment and the control class
are given speaking test. Beside that to analyze the data researcher was use

T Test ( Independent sample test ) in order to calculate the pre test and
post result.
F. Research Procedure
The procedure of the Research in both experimental and control group can
be viewed on the framework below:
Figure 2.2
Procedure of the research
Procedure of the research
Control Group Experimental Group
Pre Test Pre Test
Treatment
Applying SAVI Technique
Non Treatment
Conventional Teaching
Strategy
Post Test Post Test
Score of Post-test
and pre- Test

The diagram above shown the way of this research was done
involving the steps which the researcher organized to obtain the result. The
steps in this study procedure which involved steps of experimental and
control group can be seen such as some point below:
1. Procedure in experimental group
The procedures in treatment used in this research particularly for
collecting data in the experimental group are as what the researcher followed
below:
a. The learning process was done in schooling time.
b. Students were given the treatment in which they learn speaking based on the
SAVI technique
c. The learning activities included these steps:
1) Teacher provided some pictures, hints or clues to bridge students prior
knowledge
2) Teacher explained and modelled In the group, students collaboratively
made the scheme of the text based on the pictures, hints or clues given by
the teacher.
3) The student speaking individually with material based on curriculum.
4) Students did pair checking
5) Teaching process was done twice a week.

2. Procedure in control class
In control group, the researcher used the conventional technique without
treatment. The processes were as the following which included all learning
materials.
a. The learning process was done in schooling time
b. Students was given the treatment in which they was taught by the
conventional teaching strategy such what was applied by the English teacher
previously.
c. The learning activities included these steps:
1) The teacher asked the students to write the information about Narrative text
2) The teacher explained what the students have to speaking and gives the
students the example how to Retell Narrative text
3) The teacher asked the students to speak individually with material based on
theirn curriculum.
4) The teacher asked one or more students to repeat what was they speak
5) The students test to teacher about Retell narrative text
6) The teacher and the student concluded what they have learn
d. Teaching process was done twice a week.

CHAPTER IV
RESULT AND DISCUSSION
A. Result
The results of the study were obtained based on the data analysis. The
data were the scores of students‟ speaking ability test results which had been
taken from pre-test given to both experiment and control classes. After that,
the data were analyzed by using t-test.
1. The Results of Students’ Speaking Ability Test
a. The Description of Pre- Test and Post- Test Scores in the
Experimental Class
The frequency of the students of pre-test and Post-test Scores in
the Experimental Class could be seen into the figure 1 below.
Students’ Pre-test and Post-test scores Experimental Class
Figure 2.3. The Chart of Pre- Test Scores in the Experimental Class
From the graph above, it can be seen that the highest frequency of students‟
pre-test score in experimental group was in “poor and very poor” categories.
pre-test
Column1
0
2
4
6
pre-test
post-test
Column1

Meanwhile, the lowest was in “excellent and very good” categories.
Furthermore, the highest frequency of students‟ post-test score in experimental
group was in “good” category. Meanwhile, the lowest was in “poor and very
poor” categories. On the other hands, the distribution of pre-test and post-test
in experimental group can be seen into the following table.
Table 4. 1 The Distribution Scores of Experimental Class
Interval
Scores
Category Pre-test Post-test
Frequency
(Students)
Percentage
(%)
Frequency
(Students)
Percentage
(%)
90-100 Excellent 0 0% 2 12%
80-89 Very Good 0 0% 4 24%
70-79 Good 1 0.5% 6 35%
60-69 Fair 4 24% 5 29%
50-59 Poor 6 35% 0 0%
≤49 Very Poor 6 35% 0 0%
From the table 1 above, it can be seen that the pre-test results of
experiment class, there was no one student or 0% student who got excellent
category. This result was the same as in very good category which was 0 (0%)
students in its category. Meanwhile, there was 1 (0.5%) student who in Good
category. After that, there were 4 (24%) students in Fair category. Then, there
were 6 (35%) students in the Poor and Very Poor categories.

Furthermore, there were 2 (12%) students in Excellent category. Then,
there were 4 (24%) students in Very Good category. After that, there were 4
(24%) students in Very Good category. Then, there were 6 (35%) students in
the Good category. Meanwhile, there were 5 (29%) students who in Fair
category. Hence, there was 0 (0%) students in the Poor and Very Poor
categories of the pre-test results of experiment class.
b. The Description of Pre- Test and Post-test Scores in the
Control Class
The frequency of the students of pre-test and Post-test Scores in the
Control Class could be seen into the figure 2 below.
Students’ Pre-test and Post-test scores Control Class
Figure 2.4 The Chart of Pre- Test Scores in the Control Class
From the graph above, it can be seen that the highest frequency of
students‟ pre-test score in Control group was in “poor and very poor”
categories. Meanwhile, the lowest was in “excellent and very good” categories.
Furthermore, the highest frequency of students‟ post-test score in Control
group was in “good” category. Meanwhile, the lowest was in “poor and very
0
1
2
3
4
5
6
7
8
excellent very good good fair poor very poor
pre-test
post-test
Column1

poor” categories. On the other hands, the distribution of pre-test and post-test
in Control group can be seen into the following table.
Table 4.2 The Distribution Scores of Control Class
Interval
Scores
Category Pre-test Post-test
Frequency
(Students)
Percentage
(%)
Frequency
(Students)
Percentage
(%)
90-100 Excellent 0 0% 1 0.6%
80-89 Very Good 0 0% 2 13%
70-79 Good 1 0.6% 2 13%
60-69 Fair 1 0.6% 5 31%
50-59 Poor 6 38% 3 19%
≤49 Very Poor 8 50% 3 19%
From the table 1 above, it can be seen that the pre-test results of
Control class, there was no one student or 0% student who got excellent and
very good categories. Meanwhile, there was 1 (0.6%) student who in Good
category. After that, there was 1 (0.6%) students in Fair category. Then, there
were 6 (38%) students in the Poor category and there were 8 (50%) students in
Very Poor category.
Furthermore, there was 1 (0.6%) student in Excellent category. Then,
there were 2 (13%) students in Very Good category. After that, there were 2
(13%) students in Very Good category. Then, there were 2 (13%) students in

the Good category. Meanwhile, there were 5 (31%) students who in Fair
category. Hence, there were 3 (19%) students in the Poor and Very Poor
categories of the pre-test results of Control class.
2. The Results of Normality and Homogeneity of the Data
Before the researcher analyzed the data which had been gotten from
students, so the normality and homogeneity of the data must be measured well.
On the other hands, the kolmogorov Smirnov test had been applied to
determine it. Then, the results of its calculation could be seen into the
following explanation.
a. The Results of Normality Test of Pre-test Scores
In analyzing the normality of the data gotten of pre-test scores, so
one sample of kolmogorov sminov test had been applied since the data in each
group was less than 50 data. The test of normality in pre-test scores of the
experimental class could be seen in the table 3 below.
Table 4. 3 Test Normality of Pre-test Scores in Experimental Class
test of normality
kolmogorov sminov Shapiro-Wilk
Statistic df Sig statistic df Sig.
pre test of
experimental class .099 31 .200 .329 31 .570
Based on the table above, it could be seen on the Kolmogorov-
Smirnov of the pre test of the experimental class showed the significance was

0.570 since (0.570) value was higher than 0.05 and from the Shapiro-Wilk test
of the pre-test in experimental class showed that significance was 0.200 since
(0.200) value was higher than 0.05, so that it could be concluded that the data
which had been obtained in this class was considered normal.
Table 4.4 Test Normality of Pre-test Scores in Control Class
test of normality
kolmogorov sminov Shapiro-Wilk
Statistic df Sig statistic df Sig.
pre test of control
class .139 31 .163 .956 31 .216
Based on the table above, it could be seen on the Kolmogorov-
Smirnov of the pre test of the control class showed the significance was 0.163
since (0.163) value was higher than 0.05 and from the Shapiro-Wilk test of the
pre-test in experimental class showed that significance was 0.216 since (0.216)
value was higher than 0.05, so that it could be concluded that the data which
had been obtained in this class was considered normal.
b. The Results of Normality Test of Post-test Scores
In analyzing the normality of the data gotten of post-test scores, so
one sample of kolmogorov sminov test had been applied since the data in each
group was less than 50 data. The test of normality in pre-test scores of the
experimental class could be seen in the table 3 below.

Table 4. 5 Test Normality of Post-test Scores in Experimental Class
test of normality
kolmogorov sminov Shapiro-Wilk
Statistic df Sig statistic df Sig.
post test of
experimental class .102 31 .200 .332 31 .676
Based on the table above, it could be seen on the Kolmogorov-
Smirnov of the post test of the experimental class showed the significance was
0.200 since (0.200) value was higher than 0.05 and from the Shapiro-Wilk test
of the post-test in experimental class showed that significance was 0.676 since
(0.676) value was higher than 0.05, so that it could be concluded that the data
which had been obtained in this class was considered normal.
Table 4.6 Test Normality of Post-test Scores in Control Class
test of normality
kolmogorov sminov Shapiro-Wilk
ticStatis df Sig statistic df Sig.
pre test of
experimental class .137 31 .177 .9 41 31 .108
Based on the table above, it could be seen on the Kolmogorov-
Smirnov of the post test of the control class showed the significance was 0.177

since (0.177) value was higher than 0.05 and from the Shapiro-Wilk test of the
post-test in experimental class showed that significance was 0.108 since
(0.108) value was higher than 0.05, so that it could be concluded that the data
which had been obtained in this class was considered normal.
c. The Results of Homogeneity of Variances Test
The results of homogeneity of variances test could be seen into the
following table.
Table 4.7 Homogeneity Test
Test of Homogeneity of Variances
Levene Statistic df1 df2 Sig.
.329 1 31 .570
The test of homogeneity of variances showed that the significance
0.329, since 0.329 was higher than alpha level 0.05. So that, this results
proved that the variances of each treatment was homogenous.
d. The Statistical Analysis
In order to verify the hypotheses proposed before, so the statistical
analysis had been applied by the researcher. in addition, the program of
SPSSInc for window had been applied in order to know whether or not there
was any significant effect of SAVI Technique to the students‟ speaking ability
between experimental class and control class.

1. Independent Sample T-test Analysis of Pre-test on Students’ Speaking
Ability in Experimental and Control Classes
Independent sample t-test had been used in order to know whether or not
there was any significant effect of SAVI Technique to the students‟ speaking
ability between experimental class which had been taught by using SAVI
technique and control class which was not taught by using SAVI technique.
Meanwhile, the result of pre-test score of students‟ speaking ability in the
experimental class and control class were compared by using independent
sample test. As seen in the following table.
Table. 4.8 Independent Sample Test of Pre-Test
Independent Samples Test
Levene's Test for
Equality of
Variances t-test for Equality of Means
F Sig. T df Sig. (2-tailed)
Mean
Difference
Std. Error
Difference
95% Confidence Interval of
the Difference
Lower Upper
NILAI Equal
varianc
es
assum
ed
.329 .570 1.278 31 .211 4.52206 3.53868 -2.69513 11.73925
Equal
varianc
es not
assum
ed
1.282 30.96
3 .209 4.52206 3.52797 -2.67363 11.71775

From the table. 8 above, it could been seen that the independent sample showed
that the comparison of pre-test of experimental class and control class
displayed the difference between both of scores in the two classes. It was
known that t count 1.28 was lower than t table 2.744. The results also showed
that sig. (2-tailed) or p-value(0.211) was higher than α-value (0.05). It could be
identified that the research hypothesis (H1) was rejected and null hypothesis
(H0) was accepted. This meant that there was no any significant difference in
the students‟ speaking ability.
2. Independent Sample T-test Analysis of Pre-test on Students’ Speaking
Ability in Experimental and Control Classes
The results of post-test post-test score of students‟ speaking ability after
the students had been taught by using SAVI technique in experimental class
and in the control class was not taught by using SAVI technique were
compared by using independent sample t-test.
Table 4.9 Independent Sample Test of Post-test
Independent Samples Test
Levene's Test for
Equality of
Variances t-test for Equality of Means
F Sig. t df
Sig. (2-
tailed)
Mean
Differenc
e
Std.
Error
Differenc
e
95% Confidence Interval
of the Difference
Lower Upper

NILAI Equal
varianc
es
assume
d
.971 .332 2.800 31 .002 10.3860
3 4.51659 1.17438 19.59768
Equal
varianc
es not
assume
d
2.800 28.80
3 .002
10.3860
3 4.54708 1.08344 19.68862
From the table. 9 above, it could been seen that the independent sample
showed that the comparison of post-test of experimental class and control class
displayed the difference between both of scores in the two classes. It was
known that t count 2.800 was higher than t table 2.744. The results also showed
that sig. (2-tailed) or p-value(0.002) was less than α-value (0.05). It could be
identified that the research hypothesis (H1) was accepted and null hypothesis
(H0) was rejected. This meant that there was any significant difference of
speaking ability between the students who were taught by using SAVI
technique with the students who were not taught by using SAVI technique.
3. Paired Sample of T-test Analysis
a. Statistical analysis on the results of pre-test and post-test in the
Experimental Class.
Table 4.10 Statistic Descriptions
Group Statistics
KELOMPOK N Mean Std. Deviation Std. Error Mean
scores pretest of
experimental 31 52.6471 10.62392 2.57668

Group Statistics
KELOMPOK N Mean Std. Deviation Std. Error Mean
scores pretest of
experimental 31 52.6471 10.62392 2.57668
posttest of
experimental 31 48.1250 9.63933 2.40983
Based on the table above, the mean of speaking pre-test in the
experimental class was 52.65 and the standard deviation was 10.62. The mean
of speaking achievement in post-test in the experimental class was 48.13. Then,
the standard deviation was 9.64.
Table 4.11 Paired Sample Test
Paired Samples Test
Paired Differences
t df
Sig. (2-
tailed)
Mean
Std.
Deviation Std. Error Mean
95% Confidence Interval
of the Difference
Lower Upper
Pair 1 pretest -
posttest
-
2.11765E
1
19.88478 4.82277 -31.40028 -10.95266 -
4.391 16 .000
From the table above, it could be seen that the paired sample difference
in mean between pretest and posttest of students‟ speaking in the experimental
class was 2.12 with standard deviation was 19.89 and t-obtained was 4.82 at the
significant level 0.05 and the degree of freedom was 16 and the value of t-table
was for two tailed test was 0.000.

From the table, it also could be seen that t-obtained 4.82 was higher
than the critical value of t-table 2.921. It could be identified that the research
hypothesis (Ha) was accepted and the null hypothesis (Ho) was rejected. It
meant that there was significant difference in speaking achievement within the
students in the experimental class.
b. Statistical analysis on the results of pre-test and post-test in the Control
Class.
The table showed the statistic description of samples pre-test and
post-test in the control class as follows.
Table 4.12 Statistic Description
Paired Samples Statistics
Mean N Std. Deviation Std. Error Mean
Pair 1 pretest 48.1250 16 9.63933 2.40983
posttest 63.4375 16 14.34326 3.58582
Based on the paired sample statistic above, so the researcher could
inform that the mean of pretest in the control class was 48.13 and the standard
deviation was 9.6 4. The mean of post test in the control group was 63. 44, then
the standard deviation was 1 4.34.

Table 4.13 Paired Samples Test
Paired Samples Test
Paired Differences
t df
Sig. (2-
tailed) Mean
Std.
Deviation
Std. Error
Mean
95% Confidence Interval
of the Difference
Lower Upper
-1.53125E1 20.28700 5.07175 -26.12268 -4.50232 -
3.019 15 .003
From the table above, paired sample difference in mean between pretest
and post test of speaking in the control class was -1.53 with the standard
deviation was 20.29 and t-obtained was -3.019 at the significant level 0.05 and
the degree of freedom 15 and the value of t-table was for two tailed test was
0.003.
From the table also could be seen that t-obtained -3.019 was higher than
the critical value of t-table 2.0. The result also showed that sig. (2-tailed) or p-
value (0.003) was less than α-value (0.005). It could be seen that the research
hypothesis (Ha) was accepted and the null hypothesis (Ho) was rejected. This
meant that there was significant difference in speaking achievement within the
students in the experimental class.
e. The Comparison of Pre-test and Post Test Results in Experimental and
Control Classes
In analyzing pre-test and post-test results, so the scores of the two
groups were compared to know whether the treatment in experimental class
could improve students‟ speaking ability or not. The scores of pre-test and

post-test in experimental class and control class could be seen into the
following table.
Table 4.14 The Comparison of Pre-Test and Post-Test Results
Classes N Highest
Score
Lowest
Score
Mean
Experimental
class
pre-test 31 75 40 26
post-test 31 95 60 74
Control class pre-test 31 70 30 48
post-test 31 90 45 63
From the table above, it could be seen that there was any significance
mean score of pre-test and post-test of the experimental class and control class
was 48 while difference mean score of pre-test and post-test from control class
was 15. The difference mean score of experimental class was higher than
control class (48>15). It meant that the scores of students in experimental class
was higher than the score of students in control class. This also meant that there
was any significance difference between the students‟ speaking ability who
were taught by using SAVI technique and the students who were not taught by
using SAVI technique in class.
B. Discussion
The experimental and control classes were the same in their initial
level of speaking ability at indicated by the speaking test were given before
treatment. The mean score of pre-test in the experimental class was 26 and the

mean score of control class was 48. Statistical analysis had revealed that there
was no significant effect in the pre-test scores of students‟ speaking ability
(t=2.921, df=29, p=0.05). on the other hands, the treatment using SAVI
technique had been started from similar level of students‟ speaking ability.
Based on the results of the study, the following interpretation
were presented to strengthen the value of the study. After doing the
post-test, the results showed that that there was a statistically
significance difference in students‟ speaking ability between the
students who were taught by using self assessment technique and
those who were not. The mean score of the post-test of experimental
class was 74 higher than the mean score of the post-test of control
class was 62. It was understood that self-assessment technique gave
significance contribution in improving students‟ speaking ability at
the eleventh grade students of SMA Pancasila Bengkulu in the
academic year 2018/2019.
The mean post-test of experimental class was compared to the
mean of control class. The result showed that sig.(2-tailed) or p-value
(0.003) was less than α-value (0.005). It meant that there was
significant difference in students‟ speaking ability which could give a
significant contribution in improving the students‟ speaking ability at
this school.
From the explanation above, it could be concluded that the
SAVI (Somatic, Auditory, Visualization, Intellectualy) Technique

could improve Students‟ Speaking Ability in Senior High School (A
Quasi Experimental Research at the Eleventh Grade Students of
Senior High School Pancasila kota Bengkulu in Academic Year
2018/2019). It meant that, this technique could be categorized as
valuable teaching speaking technique which could give positive effect
on students‟ speaking ability when leaning English.
Additionally, as what Jeremy (1990) stated that this teaching
technique was making the students were more active– as much as
possible a big part of the period allotted to the activity is in fact
occupied by learner talk. Then, also classroom discussion is not
dominated by a minority of talkative participants. All get a chance to
speak and participate in the classroom. Beside of that, the students
also would had High motivation – learners are eager to speak because
they are interested in the topic and have something new to say about
it. Furthermore, the students could express themselves in utterances
that are relevant, easily comprehensible to each other, and of an
acceptable level of language accuracy.
On the other hands, to reach the success in the classroom, it
needs active participation of teachers as tutor who guide the students
in the classroom: how the teacher encourage the learners to speak,
give students in even portion, motivate them, and train them in using
acceptable English. As stated by SAVI is abbreviation from Somatic
Auditory Visual and Intellectual. SAVI approach is introduced by

Meier. SAVI approach is an approach that combines physical
movement with intellectual creativity and use all the senses in the
learning process.37
By Combining physical movement and intellectual
activity and the use of all senses is able to make big influence in
learning.38
9 Dave Meier, The Accelerated Learning HandBaak Panduan Kreatif dan Efektif Dalam
Merancang Program Pendidikan Dan Pelatihan, (Bandung: KAIFA, 2002), 90.
38
Ibid. hal.91

CHAPTER V
CONCLUSION AND SUGGESTION
A. Conclusion
Based on the finding of research, the researcher could conclude that the
SAVI (Somatic, Auditory, Visualization, Intellectualy) Technique gives a
positive effect to Students‟ Speaking Ability in Senior High School (A Quasi
Experimental Research at the Eleventh Grade Students of Senior High School
Pancasila kota Bengkulu in Academic Year 2018/2019). It was proven by the
research result which showed that there was significance effect of students
who had taught by using SAVI technique with the students who were not
taught by using SAVI technique. Then, in the teaching and learning process
through SAVI technique researcher looked the students were more spirit in
following instruction which was because they had understood the learning
steps processes. From the result, the students‟ result in experimental group
was higher than the students‟ result in control group. It means that the
students‟ speaking ability in English speaking skill after the researcher gave
the treatments was improved.
B. Suggestion
After completing this research, the researcher would like to give
suggestions for reading lecturers, for students, and for further researchers.
The suggestions given are following:
a. For lecturers suggested that the English lecturer should apply the SAVI
(Somatic, Auditory, Visualization, Intellectualy) Technique, especially in
teaching speaking class, because this technique can make learning

environment more enjoyable and interest, so that it can motivate the
students in learning speaking prosess.
b. For the students suggested to enjoy and practice this technique (SAVI
(Somatic, Auditory, Visualization, Intellectualy) Technique), because this
teaching technique can give new sight for them who want to improve their
speaking skill..
c. For further researcher suggested that they would investigate more a research
with other teaching techniques in learning speaking skill.

REFFERENCES
Ary, D., & Jacob, L. C. (2018). Introduction to research in education.Australia :
Wadsworth Cengage Learning.
Arikunto, S. (2013). Dasar dasar evaluasi pendidikan. Jakarta : Bumi Aksara.
Banu,R.(2017). Difficulties faced by collage student in speaking English – a
sociological reflection. International Journal of Trend in Research and
Development. 4( 3)
Campbell, D.T.(1963). Experimental and quasi experimental design for research .
London: Houghton Mifflin Company.
Carina.G.(2016).Extending experimential learning in teacher professional
development. University of dublin .
Cohen, L. (2000). Researche methods in education: (6th
Ed). London: Routledge.
Eka, A .R .S. (2016). Penerapan model pembelajaran somatic, auditory,
visualization, intelectually (SAVI) terhadap hasil belajar siswa pada
materi sistem saraf. Thesis. UIN Sunan Gunung Jati. Bandung.
Harmer, J. (1990). The practice of English language teaching: (4th
ed).USA:
Longman
Harrris, A.D. (2004).The use and interpretation of quasi experimental studies in
infectious disease. America: Antimicrobial Resistance invited Article.
Hons, BED. (2012). Research methods in education. United States: Higher
education commision
James, H.(1996). Educational research ( Fundamentals for the consumer). New
York: HarperCollins Collage Published.
Kurniati, A. (2012). A study on speaking ability of the second year students of
SMK telkom Pekanbaru. Thesis: Riau University, Riau
Meier, D. (2000). The accelerated a creative guide to designing and delivering
faster more effective training programs . New York: McGraw-Hill
Puspitasari. (2017). The effect of the somatic auditory visualization learning
model, intellectually (SAVI) is assisted by photo story media on critical
thinking skills of the seventh grade students in the Surakarta 13th state
junior high school. Journal of Education, Educitizen 2(1)

Shafaat, H.(2017). Teaching speaking skills in communication clasroom,
international journal of media,journalism and mass
communication(IJMJMC).3(3)
Seyed, M. (2018). Relationship among self-preceived oral competence,
communication apperehension, and iranian EFL Learner‟s Willingness to
communicate : Cooperative teaching in focus. Journal IInternational of
Foreign Language Teaching and Research. 6(21)
Sholihin, (2015). The using of SAVI (Somatic,Auditory,Visual and Intellectual)
technique in improving the students‟ vocabulary at the seventh grade of
SMPN 01 Monta Bima. Journal of education.GaneÇ Swara 9.
Sugiyono, (2012). Metode penelitian pendidkan: Pendekatan kuantitatif,
kualitatif . Bandung: Alfabete.
Wallace, T.(2004). Teaching speaking, listening and writting. Brussels Belgium :
International Academy of Education .
White, H.(2014). Quasi experimental design and methods, methodological
Briefs. Impact Evaluation 8. UNICEF Office of Research : Florence


Appendix 1
Pre-Test Score of the Experimental Class.
No. Samples Scores Qualification
X1 X12
1. S1 55 3025 Poor
2. S2 55 3025 Poor
3. S3 65 4225 Fair
4. S4 60 3600 Fair
5. S5 45 2025 Very Poor
6. S6 55 3025 Poor
7. S7 75 5625 Good
8. S8 55 3025 Poor
9. S9 40 1600 Very Poor
10. S10 40 1600 Very Poor
11. S11 50 2500 Poor
12. S12 55 3025 Poor
13. S13 40 1600 Very Poor
14. S14 65 4225 Fair
15. S15 60 3600 Fair
16. S16 40 1600 Very Poor
17. S17 40 1600 Very Poor
∑N= 17 ∑X1= 896 ∑X12= 48925
Mean 26
Appendix 2
Pre-Test Score of the Control Class

No. Samples Scores Qualification
X1 X12
1. S1 55 3025 Poor
2. S2 45 2025 Very Poor
3. S3 60 3600 Fair
4. S4 55 3025 Poor
5. S5 40 1600 Very Poor
6. S6
55 3025 Poor
7. S7
50 2500 Poor
8. S8
45 2025 Very Poor
9. S9
30 900 Very Poor
10. S10 70 4900 Good
11. S11 45 2025 Very Poor
12. S12 50 2500 Poor
13. S13 40 1600 Very Poor
14. S14 50 2500 Poor
15. S15 40 1600 Very Poor
16. S16 40 1600 Very Poor
∑N= 16 ∑X2=770
∑X22= 38450
Mean 48
Appendix 3
Post-Test Score of the Experimental Class
No. Samples Scores Qualification
X1 X12
1. S1 75 5625 Good

2. S2 75 5625 Good
3. S3 60 3600 Fair
4. S4 75 5625 Good
5. S5 80 6400 Very good
6. S6 80 6400 Very good
7. S7 60 3600 Fair
8. S8 75 5625 Good
9. S9 85 7225 Very good
10. S10 95 9025 Excellent
11. S11 70 4900 Good
12. S12 80 6400 Very good
13. S13 60 3600 Fair
14. S14 60 3600 Fair
15. S15 60 3600 Fair
16. S16 95 9025 Excellent
17. S17 70 4900 Good
∑N= 17 ∑X1=1255 ∑X12=94775
Mean 74
Appendix 4
Table 2. Post-Test Score of the Control Class
No. Name Scores Qualification
X2 X22
1. S1 65 4225 Fair
2. S2 85 7225 Very Good
3. S3 55 3025 Poor
4. S4 50 2500 Poor

5. S5 65 4225 Fair
6. S6
65 4225 Fair
7. S7
45 2025 Very Poor
8. S8
60 3600 Fair
9. S9
75 5625 Good
10. S10 60 3600 Fair
11. S11 75 5625 Good
12. S12 45 2025 Very Poor
13. S13 45 2025 Very Poor
14. S14 55 3025 Poor
15. S15 80 6400 Very Good
16. S16 90 8100 Excellent
∑N=16 ∑X2= 1015 ∑X22=67475
Mean 63