, P.P. Khanna N.K. Saini
22
(This is a sample cover image for this issue. The actual cover is not yet available at this time.) This article appeared in a journal published by Elsevier. The attached copy is furnished to the author for internal non-commercial research and education use, including for instruction at the authors institution and sharing with colleagues. Other uses, including reproduction and distribution, or selling or licensing copies, or posting to personal, institutional or third party websites are prohibited. In most cases authors are permitted to post their version of the article (e.g. in Word or Tex form) to their personal website or institutional repository. Authors requiring further information regarding Elsevier’s archiving and manuscript policies are encouraged to visit: http://www.elsevier.com/copyright
Transcript of , P.P. Khanna N.K. Saini
(This is a sample cover image for this issue. The actual cover is not yet available at this time.)
This article appeared in a journal published by Elsevier. The attachedcopy is furnished to the author for internal non-commercial researchand education use, including for instruction at the authors institution
and sharing with colleagues.
Other uses, including reproduction and distribution, or selling orlicensing copies, or posting to personal, institutional or third party
websites are prohibited.
In most cases authors are permitted to post their version of thearticle (e.g. in Word or Tex form) to their personal website orinstitutional repository. Authors requiring further information
regarding Elsevier’s archiving and manuscript policies areencouraged to visit:
http://www.elsevier.com/copyright
Author's personal copy
Mineralogy and geochemistry of the Mahi River sedimentsin tectonically active western India: Implications for Deccan
large igneous province source, weathering and mobilityof elements in a semi-arid climate
Anupam Sharma a,⇑, Sarajit Sensarma b, Kamlesh Kumar c, P.P. Khanna d,N.K. Saini d
a Central University of Himachal Pradesh, P.O. Box 21, Dharamshala 176 215, Indiab Centre of Advanced Study in Geology, University of Lucknow, Lucknow 226 007, India
c Birbal Sahni Institute of Palaeobotany, 53 University Road, Lucknow 226 007, Indiad Wadia Institute of Himalayan Geology, 33 General Mahadeo Singh Marg, Dehradun 248 001, India
Received 28 March 2012; accepted in revised form 2 November 2012; Available online 3 December 2012
Abstract
Large igneous provinces (LIPs) hosting mafic rocks over million km2 are likely to influence global sediment production anddistribution and help in resolving discrepancies in upper continental crust (UCC) compositions. This work focuses on the tex-ture, mineralogy, and compositions including REE of fine sand/silt deposited by a small to medium-sized river, the Mahi Riv-er (about 600 km) in a tectonically active, semi-arid region draining the Deccan Traps in western India, one of the largest LIPsin the world. The results are also applied to a sedimentary rock of fluvial origin (Siwalik mudstone/siltstone) to ascertain thesource characteristics of this alluvium and evaluate comparative element (K, Ba, Sr, Na, Ca and Mg) mobility.
The Mahi sediments are lithiarenite, mostly composed of quartz and basalt fragments with lesser pyroxene, biotite, feld-spar, calcite and clay minerals (smectite ± illite). The Mahi sediments have higher FeOt (610.9 wt.%), TiO2 (62.41 wt.%),Al2O3 (615.2 wt.%), Cr (6737 ppm), Co (636 ppm), Cu (6107 ppm) than the UCC and PAAS; Ni (654 ppm) higher thanthe UCC (33.5 ppm), but similar to PAAS (60 ppm). The low CIA (37–59) values and presence of basalt fragments and smec-tite in the samples suggest incipient weathering in the semi-arid Mahi catchment. In agreement with the mineralogy, the UCC-normalized LREE depleted patterns (LREE/HREE < 1) in the Mahi sediments confirm Deccan basalt contributions from theprovenance with about 70–75% basalts and 25–30% Archean biotite-rich granitoids. The mafic contribution, in addition to theUCC, is important for the Siwalik rocks too.
Similarly limited depletion of Ba, K and Ca (Ba P K > Ca) in weathering-limited Mahi (aver CIA 47.5) and transport-lim-ited Siwalik (aver CIA 69) systems indicate their climate insensitivity. At the same time, more Ba depletion than Ca is new forthe Deccan Traps River. Decoupling of Ca and Sr, however, could be mineralogy controlled.� 2012 Elsevier Ltd. All rights reserved.
1. INTRODUCTION
Rock weathering and erosion are two fundamental earthsurface processes intrinsic to sediment formation and ele-ment distribution (e.g., Suttner, 1974; Stallard and Ed-mond, 1983; Basu, 1985; Sharma and Rajamani, 2001;Singh and Rajamani, 2001). The composition of the upper
0016-7037/$ - see front matter � 2012 Elsevier Ltd. All rights reserved.
http://dx.doi.org/10.1016/j.gca.2012.11.004
⇑ Corresponding author. Address: School of Earth and Environ-mental Sciences, Central University of Himachal Pradesh, P.O.Box 21, Dharamshala, Himachal Pradesh 176 215, India. Tel.: +9101892 229330; fax: +91 01892 237286.
E-mail address: [email protected] (A. Sharma).
www.elsevier.com/locate/gca
Available online at www.sciencedirect.com
Geochimica et Cosmochimica Acta 104 (2013) 63–83
Author's personal copy
continental crust (UCC) is approximately granodioritic(SiO2 55–66 wt.%), typically forming at the present-dayconvergent margins (Taylor and McLennan, 1985). Duringfluvial reworking, sediments get homogenized and effec-tively represent average ‘granodioritic’ continental crustalcompositions (Taylor and McLennan, 1985; Rudnick andGao, 2003). However, there are discrepancies regardingthe concentrations of certain trace elements. For example,discrepancies in Cr and Co concentrations by nearly a fac-tor of 2–3 seem common (McLennan, 2001). Weatheringaccounts for �20% Mg loss from the continents, aiding inthe formation and sustenance of a Si-rich and Mg-poorcontinental crust (Lee et al., 2008), in addition to granodi-orite production through magmatic processes. The La/Nbratio in the continental crust is better modeled by mixingbetween intraplate basalt and convergent margin magmas(Rudnick, 1995). Thus the global continental provenancemay not necessarily be of granodiorite compositions only,but it could have a more mafic component.
Mafic to ultramafic igneous rocks have higher contentsof Cr, Co, Cu than silicic and intermediate igneous rocks(Brugmann et al., 1987). The large igneous provinces (LIPs)(e.g., continental flood basalt provinces) host significantamounts of mafic rocks on the Earth’s surface, coveringabout 50–100 � 103 km2 (e.g., Sensarma, 2007; Sheth,2007; Bryan and Ernst, 2007). Altogether somewhat morethan 150 LIPs are known (see Bryan and Ernst, 2007)and the number of LIPs is expanding with better identifica-tion and recognition throughout the geologic record. Thismakes LIPs to stand out as an important provenance worthconsidering in the models of continental crustal composi-tion and its evolution. The origin of LIPs is a major areaof research in understanding global mantle and crust/man-tle systems (http://www.largeigneousprovince.org; http://www.mantleplume.org). The possible role of LIPs, withthe abundant presence of more weatherable mafic rocks,in sediment production and global sediment supply is notadequately known. This is important because LIPs mayhave significant contributions in influencing the upper crus-tal compositions and help to address discrepancies of theelemental abundances mentioned above.
The Himalayas and the Deccan LIP are the two mostimportant geologic entities of global significance in India.The contributions of the Himalayan lithology, tectonics,and climate in sediment production and distributions arewell recognized (e.g., Sarin et al., 1989; Krishnaswamiet al., 1992; France-Lanord and Derry, 1997; Gaillardetet al., 1999; Galy and France-Lanord, 2001; Singh et al.,2006, 2008). Limited research, however, has been done onthe role of the Deccan LIP on this aspect, though it covers�0.5% of the global drainage area (Das and Krishnaswami,2006).
The mainland Gujarat region in western India has sev-eral rivers including the Tapti and Narmada that flow fromthe Peninsular India into the Arabian Sea (Fig. 1a and b)passing through the Deccan Province and they must havebeen carrying sediments from multiple sources, includingthe Deccan basalts. Except for some geochemical study ofdissolved load of the rivers draining the Deccan province(e.g., Dessert et al., 2001, 2003; Gupta and Chakrapani,
2005, 2007; Das et al., 2005; Das and Krishnaswami,2007; Sharma and Subramanian, 2008; Gupta et al.,2011), limited mineralogical and geochemical study of thesesediments have been done. Moreover, these rivers are rela-tively small (<�600 km), carry higher ionic load (Sharmaet al., 2012), and are thus good candidates for unravelingweathering processes, sediment production and distribu-tion, and their source rock characteristics.
As part of our ongoing research on western Indian flu-vial sediments, comparison between the Mahi River sedi-ments and the surrounding rocks from which they werederived allows us to better explore the link between the sed-imentary record and the large Deccan basaltic provenance.In this paper, we discuss the mineralogy and geochemistryof a �8.5 m thick deposit exposed near Mujpur village(22�0900700N: 72�3502800E) in the lower Mahi River Basin.Textural and mineralogical data of sediments, bulk majorelement, and trace element compositions are combined todevelop an integrated model to understand the relative con-trol of tectonic–climate–lithology and source area charac-teristics for the Mahi sediments. Finally, the results areapplied to the alluvium in the sedimentary rock of the Siwa-lik mudstone/siltstone to test its source characteristics andevaluate mobility of certain elements. This study has animportant bearing on the general understanding of the roleof LIPs in the petrogenesis of clastic sediment productionand composition.
2. STUDY AREA AND PREVIOUS WORK
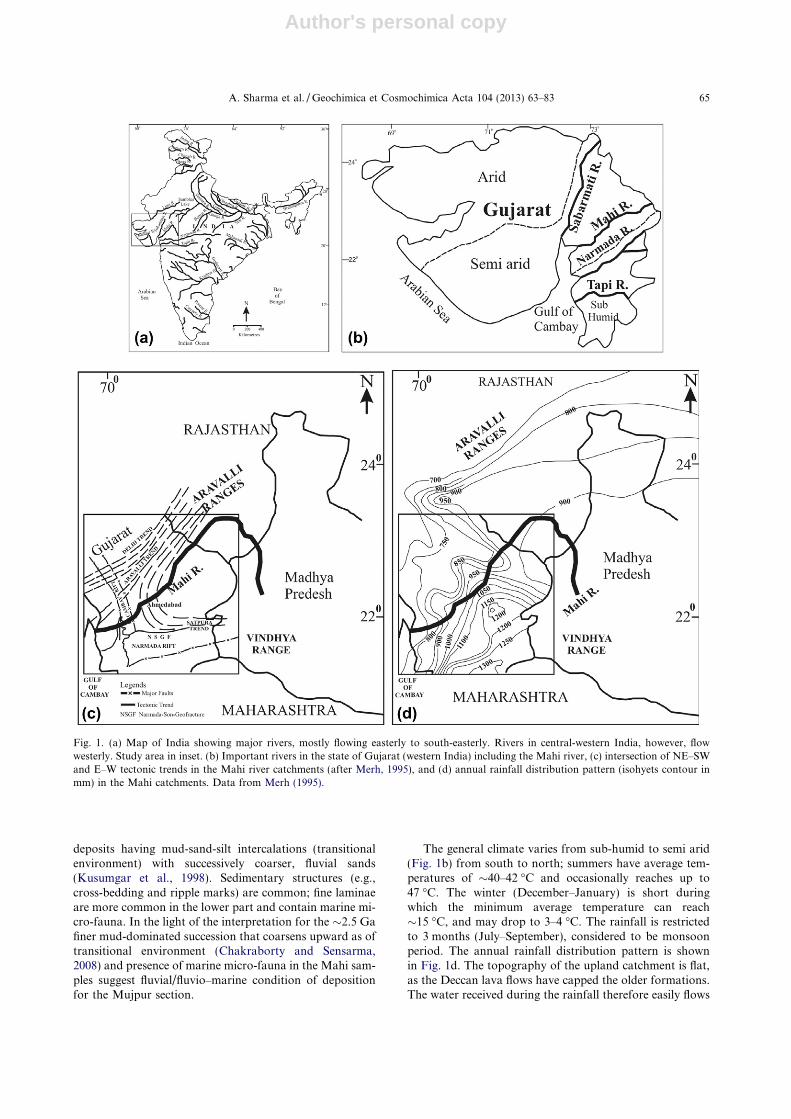
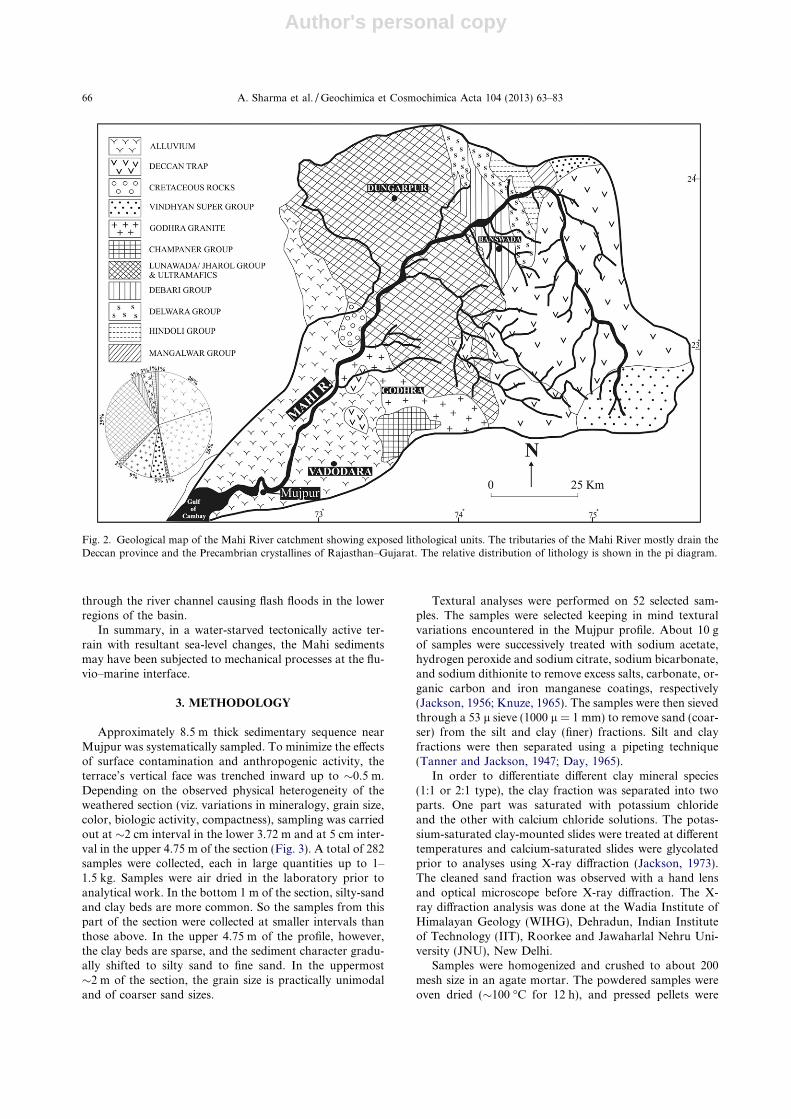
The Mahi River, approximately 600 km long, emergesnear the Sardarpur District (Madhya Pradesh) and startsflowing North-Westerly to enter into the southern Rajas-than where it takes a southwesterly turn. The river thenflows along the intercontinental Cambay Graben (Biswas,1987) to meet the Cambay Bay (Fig. 2). The intersectionof Precambrian orogenic trends, the NE–SW Aravallitrend, and the ENE–WSW Satpura trend/Narmada-Sonlineament (NSGF) led to formation of several rift basins(e.g., Narmada, Cambay and Kutch rift basins) (Biswas,1987) (Fig. 1c). The Bhuj Earthquake (intensity 6.9 onRichter scale) in 2001 suggests tectonic activity in the ter-rain continues to the present-day. The Mahi River largelyflows in the upper reaches over the Deccan Traps (basalts,picritic basalts, minor rhyolite), sedimentary-metasedimen-tary rocks of the middle Proterozoic Vindhyan Supergroup,the 2.5 Ga Aravalli Supergroup rocks (leucogranite intru-sions, metasediments, granites, minor komatiites, amphibo-lites) and the still older 3.5 Ga banded gneissic complex(BGC) rocks (Fig. 2). The BGC is predominantly composedof biotite granite gneiss with enclaves and inclusions ofamphibolites (komatiitic), quartzite and calcareous rocks,and minor pegmatite.
A complex interplay of tectonism, climate and base levelchanges during the Holocene were responsible for sedimen-tation in the area by marine, fluvio–marine, fluvial and pos-sibly some aeolian processes (e.g., Chamyal et al., 2003 andreferences therein; Tandon et al., 1999; Rachna et al., 1999;Maurya et al., 2000; Juyal et al., 2006; this work). The Mid-dle Holocene Mujpur succession represents tidal estuarine
64 A. Sharma et al. / Geochimica et Cosmochimica Acta 104 (2013) 63–83
Author's personal copy
deposits having mud-sand-silt intercalations (transitionalenvironment) with successively coarser, fluvial sands(Kusumgar et al., 1998). Sedimentary structures (e.g.,cross-bedding and ripple marks) are common; fine laminaeare more common in the lower part and contain marine mi-cro-fauna. In the light of the interpretation for the �2.5 Gafiner mud-dominated succession that coarsens upward as oftransitional environment (Chakraborty and Sensarma,2008) and presence of marine micro-fauna in the Mahi sam-ples suggest fluvial/fluvio–marine condition of depositionfor the Mujpur section.
The general climate varies from sub-humid to semi arid(Fig. 1b) from south to north; summers have average tem-peratures of �40–42 �C and occasionally reaches up to47 �C. The winter (December–January) is short duringwhich the minimum average temperature can reach�15 �C, and may drop to 3–4 �C. The rainfall is restrictedto 3 months (July–September), considered to be monsoonperiod. The annual rainfall distribution pattern is shownin Fig. 1d. The topography of the upland catchment is flat,as the Deccan lava flows have capped the older formations.The water received during the rainfall therefore easily flows
Fig. 1. (a) Map of India showing major rivers, mostly flowing easterly to south-easterly. Rivers in central-western India, however, flowwesterly. Study area in inset. (b) Important rivers in the state of Gujarat (western India) including the Mahi river, (c) intersection of NE–SWand E–W tectonic trends in the Mahi river catchments (after Merh, 1995), and (d) annual rainfall distribution pattern (isohyets contour inmm) in the Mahi catchments. Data from Merh (1995).
A. Sharma et al. / Geochimica et Cosmochimica Acta 104 (2013) 63–83 65
Author's personal copy
through the river channel causing flash floods in the lowerregions of the basin.
In summary, in a water-starved tectonically active ter-rain with resultant sea-level changes, the Mahi sedimentsmay have been subjected to mechanical processes at the flu-vio–marine interface.
3. METHODOLOGY
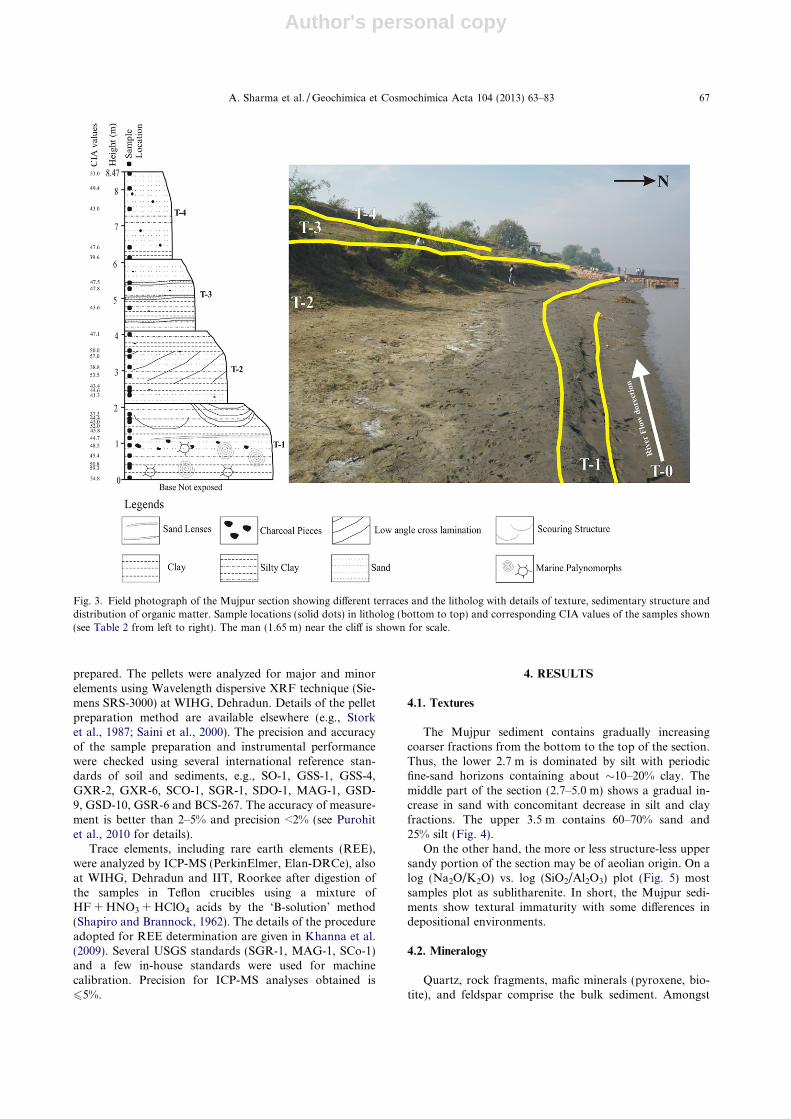
Approximately 8.5 m thick sedimentary sequence nearMujpur was systematically sampled. To minimize the effectsof surface contamination and anthropogenic activity, theterrace’s vertical face was trenched inward up to �0.5 m.Depending on the observed physical heterogeneity of theweathered section (viz. variations in mineralogy, grain size,color, biologic activity, compactness), sampling was carriedout at �2 cm interval in the lower 3.72 m and at 5 cm inter-val in the upper 4.75 m of the section (Fig. 3). A total of 282samples were collected, each in large quantities up to 1–1.5 kg. Samples were air dried in the laboratory prior toanalytical work. In the bottom 1 m of the section, silty-sandand clay beds are more common. So the samples from thispart of the section were collected at smaller intervals thanthose above. In the upper 4.75 m of the profile, however,the clay beds are sparse, and the sediment character gradu-ally shifted to silty sand to fine sand. In the uppermost�2 m of the section, the grain size is practically unimodaland of coarser sand sizes.
Textural analyses were performed on 52 selected sam-ples. The samples were selected keeping in mind texturalvariations encountered in the Mujpur profile. About 10 gof samples were successively treated with sodium acetate,hydrogen peroxide and sodium citrate, sodium bicarbonate,and sodium dithionite to remove excess salts, carbonate, or-ganic carbon and iron manganese coatings, respectively(Jackson, 1956; Knuze, 1965). The samples were then sievedthrough a 53 l sieve (1000 l = 1 mm) to remove sand (coar-ser) from the silt and clay (finer) fractions. Silt and clayfractions were then separated using a pipeting technique(Tanner and Jackson, 1947; Day, 1965).
In order to differentiate different clay mineral species(1:1 or 2:1 type), the clay fraction was separated into twoparts. One part was saturated with potassium chlorideand the other with calcium chloride solutions. The potas-sium-saturated clay-mounted slides were treated at differenttemperatures and calcium-saturated slides were glycolatedprior to analyses using X-ray diffraction (Jackson, 1973).The cleaned sand fraction was observed with a hand lensand optical microscope before X-ray diffraction. The X-ray diffraction analysis was done at the Wadia Institute ofHimalayan Geology (WIHG), Dehradun, Indian Instituteof Technology (IIT), Roorkee and Jawaharlal Nehru Uni-versity (JNU), New Delhi.
Samples were homogenized and crushed to about 200mesh size in an agate mortar. The powdered samples wereoven dried (�100 �C for 12 h), and pressed pellets were
Fig. 2. Geological map of the Mahi River catchment showing exposed lithological units. The tributaries of the Mahi River mostly drain theDeccan province and the Precambrian crystallines of Rajasthan–Gujarat. The relative distribution of lithology is shown in the pi diagram.
66 A. Sharma et al. / Geochimica et Cosmochimica Acta 104 (2013) 63–83
Author's personal copy
prepared. The pellets were analyzed for major and minorelements using Wavelength dispersive XRF technique (Sie-mens SRS-3000) at WIHG, Dehradun. Details of the pelletpreparation method are available elsewhere (e.g., Storket al., 1987; Saini et al., 2000). The precision and accuracyof the sample preparation and instrumental performancewere checked using several international reference stan-dards of soil and sediments, e.g., SO-1, GSS-1, GSS-4,GXR-2, GXR-6, SCO-1, SGR-1, SDO-1, MAG-1, GSD-9, GSD-10, GSR-6 and BCS-267. The accuracy of measure-ment is better than 2–5% and precision <2% (see Purohitet al., 2010 for details).
Trace elements, including rare earth elements (REE),were analyzed by ICP-MS (PerkinElmer, Elan-DRCe), alsoat WIHG, Dehradun and IIT, Roorkee after digestion ofthe samples in Teflon crucibles using a mixture ofHF + HNO3 + HClO4 acids by the ‘B-solution’ method(Shapiro and Brannock, 1962). The details of the procedureadopted for REE determination are given in Khanna et al.(2009). Several USGS standards (SGR-1, MAG-1, SCo-1)and a few in-house standards were used for machinecalibration. Precision for ICP-MS analyses obtained is65%.
4. RESULTS
4.1. Textures
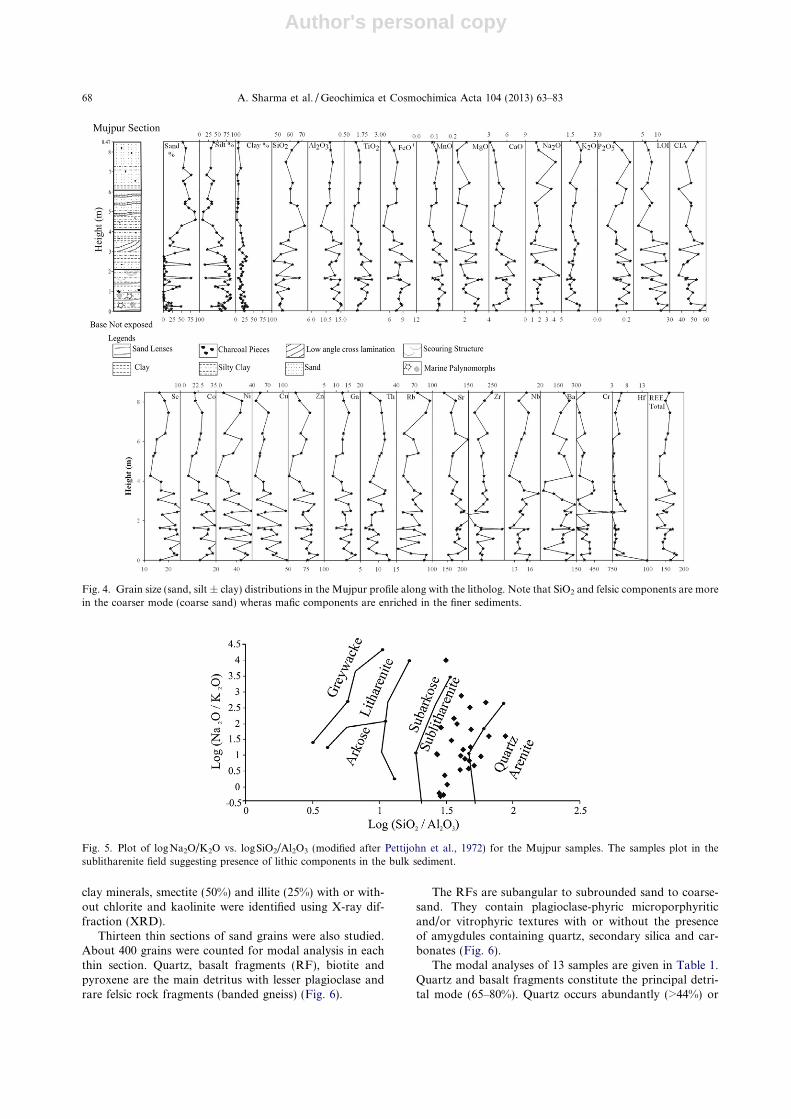
The Mujpur sediment contains gradually increasingcoarser fractions from the bottom to the top of the section.Thus, the lower 2.7 m is dominated by silt with periodicfine-sand horizons containing about �10–20% clay. Themiddle part of the section (2.7–5.0 m) shows a gradual in-crease in sand with concomitant decrease in silt and clayfractions. The upper 3.5 m contains 60–70% sand and25% silt (Fig. 4).
On the other hand, the more or less structure-less uppersandy portion of the section may be of aeolian origin. On alog (Na2O/K2O) vs. log (SiO2/Al2O3) plot (Fig. 5) mostsamples plot as sublitharenite. In short, the Mujpur sedi-ments show textural immaturity with some differences indepositional environments.
4.2. Mineralogy
Quartz, rock fragments, mafic minerals (pyroxene, bio-tite), and feldspar comprise the bulk sediment. Amongst
Fig. 3. Field photograph of the Mujpur section showing different terraces and the litholog with details of texture, sedimentary structure anddistribution of organic matter. Sample locations (solid dots) in litholog (bottom to top) and corresponding CIA values of the samples shown(see Table 2 from left to right). The man (1.65 m) near the cliff is shown for scale.
A. Sharma et al. / Geochimica et Cosmochimica Acta 104 (2013) 63–83 67
Author's personal copy
clay minerals, smectite (50%) and illite (25%) with or with-out chlorite and kaolinite were identified using X-ray dif-fraction (XRD).
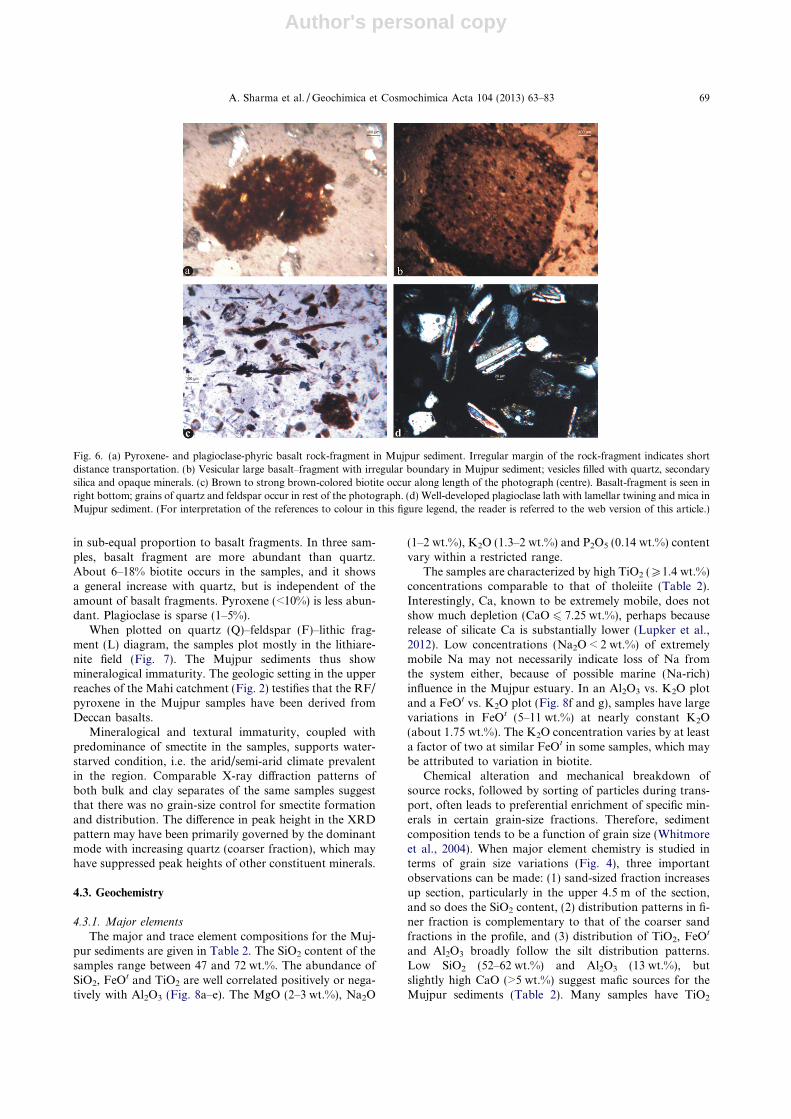
Thirteen thin sections of sand grains were also studied.About 400 grains were counted for modal analysis in eachthin section. Quartz, basalt fragments (RF), biotite andpyroxene are the main detritus with lesser plagioclase andrare felsic rock fragments (banded gneiss) (Fig. 6).
The RFs are subangular to subrounded sand to coarse-sand. They contain plagioclase-phyric microporphyriticand/or vitrophyric textures with or without the presenceof amygdules containing quartz, secondary silica and car-bonates (Fig. 6).
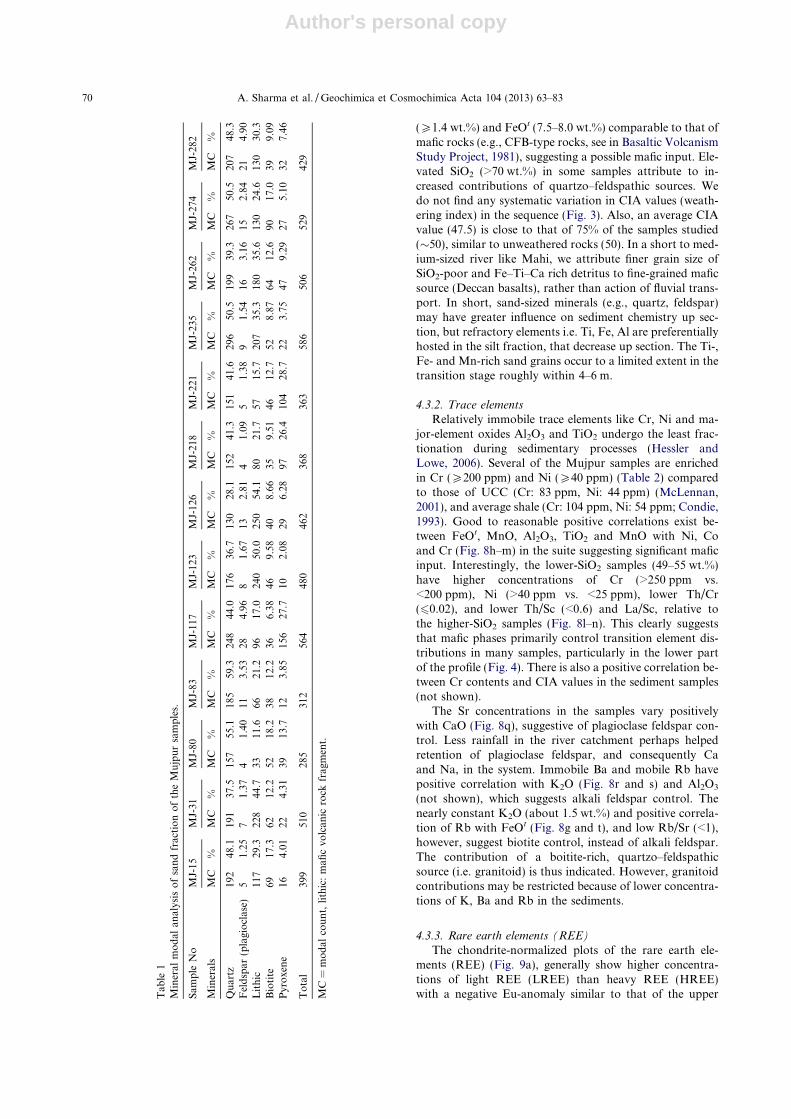
The modal analyses of 13 samples are given in Table 1.Quartz and basalt fragments constitute the principal detri-tal mode (65–80%). Quartz occurs abundantly (>44%) or
Fig. 4. Grain size (sand, silt ± clay) distributions in the Mujpur profile along with the litholog. Note that SiO2 and felsic components are morein the coarser mode (coarse sand) wheras mafic components are enriched in the finer sediments.
Fig. 5. Plot of logNa2O/K2O vs. logSiO2/Al2O3 (modified after Pettijohn et al., 1972) for the Mujpur samples. The samples plot in thesublitharenite field suggesting presence of lithic components in the bulk sediment.
68 A. Sharma et al. / Geochimica et Cosmochimica Acta 104 (2013) 63–83
Author's personal copy
in sub-equal proportion to basalt fragments. In three sam-ples, basalt fragment are more abundant than quartz.About 6–18% biotite occurs in the samples, and it showsa general increase with quartz, but is independent of theamount of basalt fragments. Pyroxene (<10%) is less abun-dant. Plagioclase is sparse (1–5%).
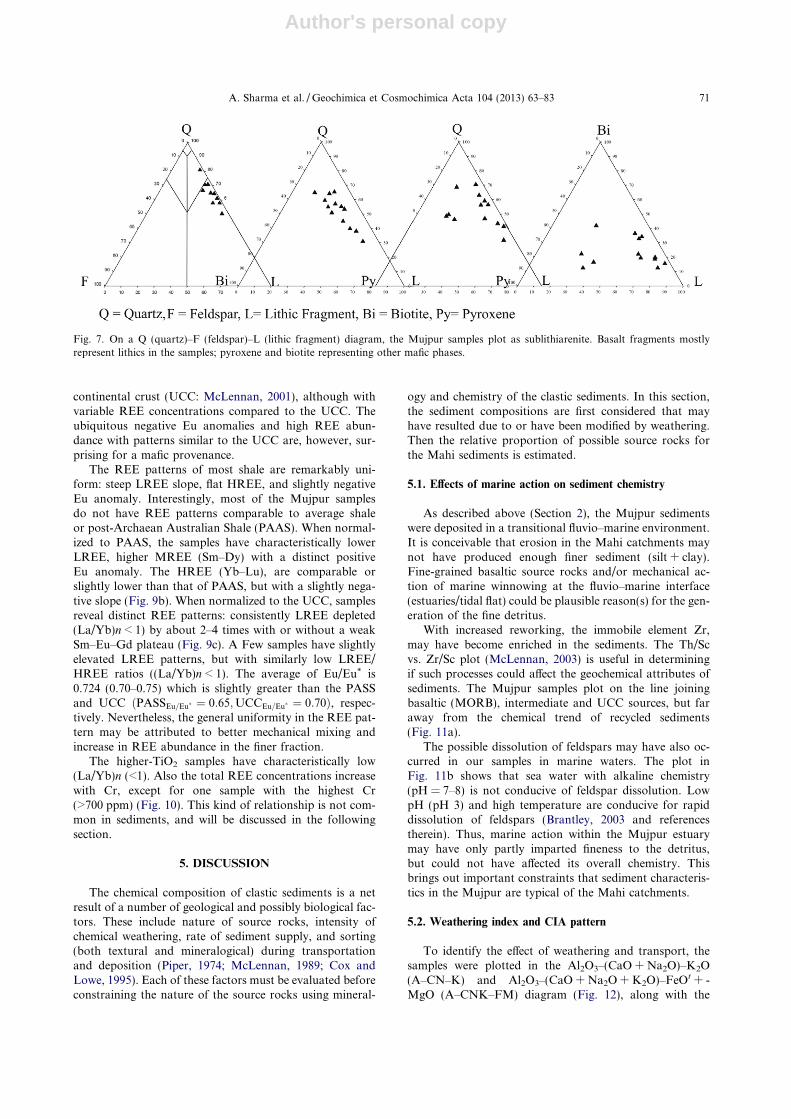
When plotted on quartz (Q)–feldspar (F)–lithic frag-ment (L) diagram, the samples plot mostly in the lithiare-nite field (Fig. 7). The Mujpur sediments thus showmineralogical immaturity. The geologic setting in the upperreaches of the Mahi catchment (Fig. 2) testifies that the RF/pyroxene in the Mujpur samples have been derived fromDeccan basalts.
Mineralogical and textural immaturity, coupled withpredominance of smectite in the samples, supports water-starved condition, i.e. the arid/semi-arid climate prevalentin the region. Comparable X-ray diffraction patterns ofboth bulk and clay separates of the same samples suggestthat there was no grain-size control for smectite formationand distribution. The difference in peak height in the XRDpattern may have been primarily governed by the dominantmode with increasing quartz (coarser fraction), which mayhave suppressed peak heights of other constituent minerals.
4.3. Geochemistry
4.3.1. Major elements
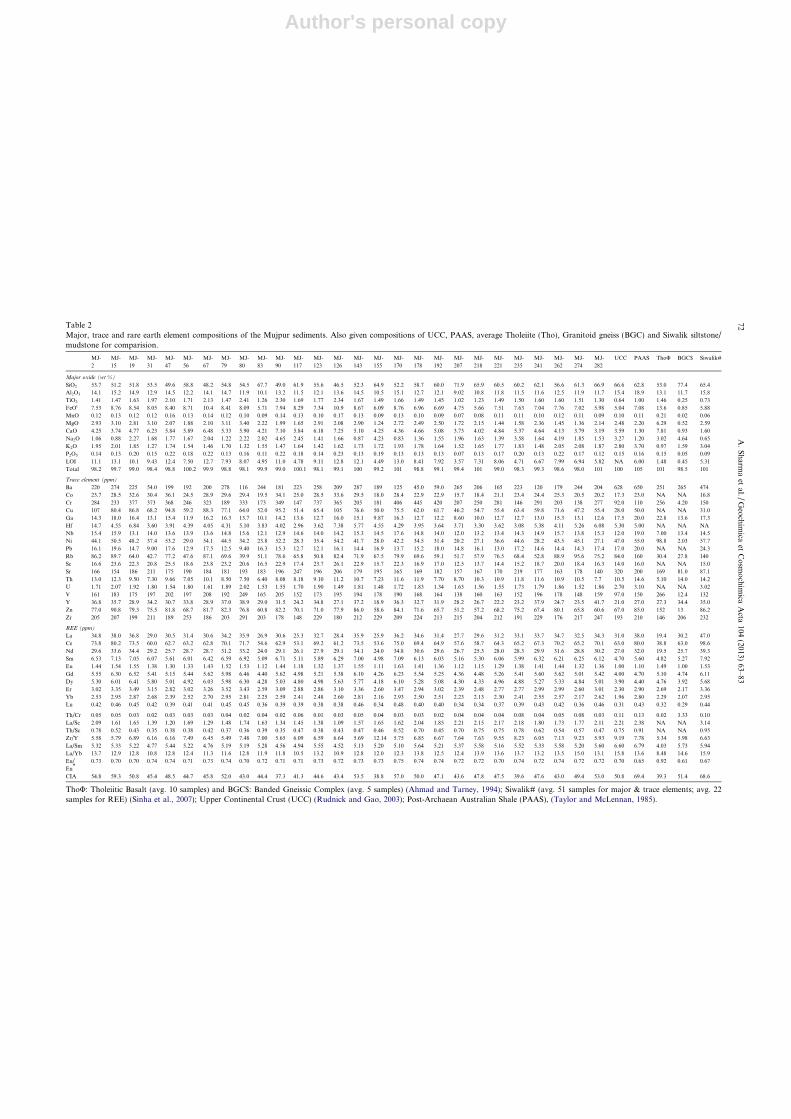
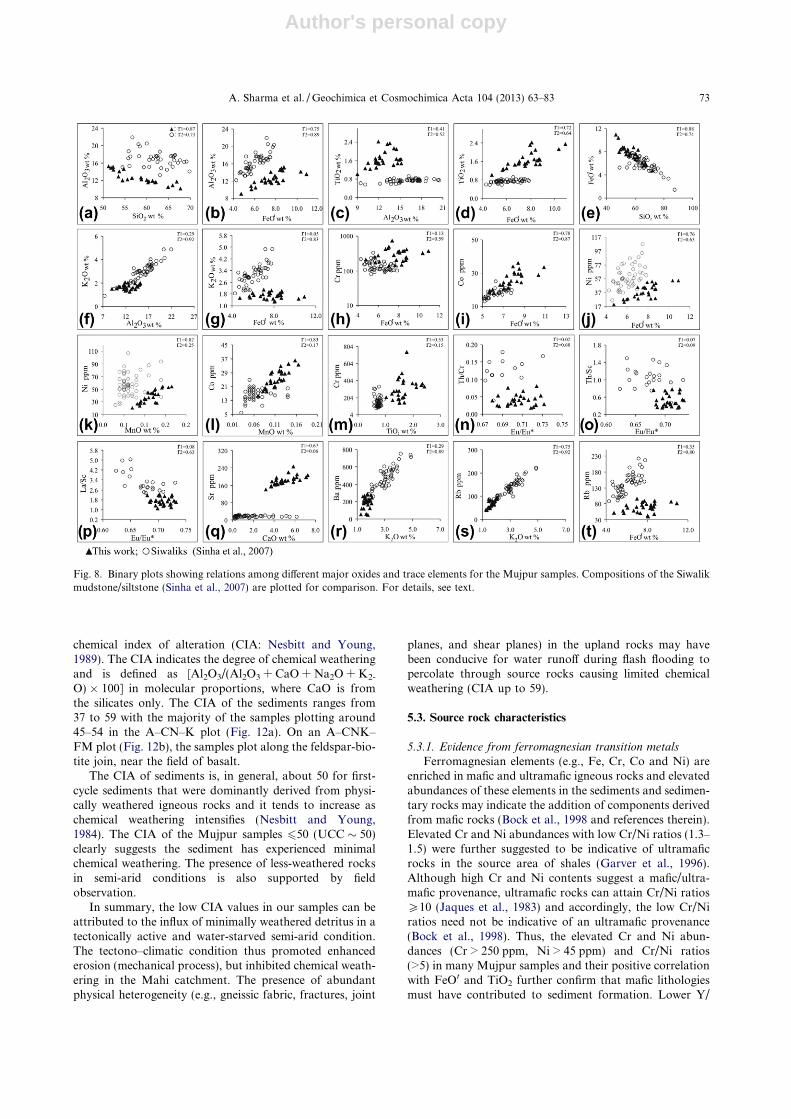
The major and trace element compositions for the Muj-pur sediments are given in Table 2. The SiO2 content of thesamples range between 47 and 72 wt.%. The abundance ofSiO2, FeOt and TiO2 are well correlated positively or nega-tively with Al2O3 (Fig. 8a–e). The MgO (2–3 wt.%), Na2O
(1–2 wt.%), K2O (1.3–2 wt.%) and P2O5 (0.14 wt.%) contentvary within a restricted range.
The samples are characterized by high TiO2 (P1.4 wt.%)concentrations comparable to that of tholeiite (Table 2).Interestingly, Ca, known to be extremely mobile, does notshow much depletion (CaO 6 7.25 wt.%), perhaps becauserelease of silicate Ca is substantially lower (Lupker et al.,2012). Low concentrations (Na2O < 2 wt.%) of extremelymobile Na may not necessarily indicate loss of Na fromthe system either, because of possible marine (Na-rich)influence in the Mujpur estuary. In an Al2O3 vs. K2O plotand a FeOt vs. K2O plot (Fig. 8f and g), samples have largevariations in FeOt (5–11 wt.%) at nearly constant K2O(about 1.75 wt.%). The K2O concentration varies by at leasta factor of two at similar FeOt in some samples, which maybe attributed to variation in biotite.
Chemical alteration and mechanical breakdown ofsource rocks, followed by sorting of particles during trans-port, often leads to preferential enrichment of specific min-erals in certain grain-size fractions. Therefore, sedimentcomposition tends to be a function of grain size (Whitmoreet al., 2004). When major element chemistry is studied interms of grain size variations (Fig. 4), three importantobservations can be made: (1) sand-sized fraction increasesup section, particularly in the upper 4.5 m of the section,and so does the SiO2 content, (2) distribution patterns in fi-ner fraction is complementary to that of the coarser sandfractions in the profile, and (3) distribution of TiO2, FeOt
and Al2O3 broadly follow the silt distribution patterns.Low SiO2 (52–62 wt.%) and Al2O3 (13 wt.%), butslightly high CaO (>5 wt.%) suggest mafic sources for theMujpur sediments (Table 2). Many samples have TiO2
Fig. 6. (a) Pyroxene- and plagioclase-phyric basalt rock-fragment in Mujpur sediment. Irregular margin of the rock-fragment indicates shortdistance transportation. (b) Vesicular large basalt–fragment with irregular boundary in Mujpur sediment; vesicles filled with quartz, secondarysilica and opaque minerals. (c) Brown to strong brown-colored biotite occur along length of the photograph (centre). Basalt-fragment is seen inright bottom; grains of quartz and feldspar occur in rest of the photograph. (d) Well-developed plagioclase lath with lamellar twining and mica inMujpur sediment. (For interpretation of the references to colour in this figure legend, the reader is referred to the web version of this article.)
A. Sharma et al. / Geochimica et Cosmochimica Acta 104 (2013) 63–83 69
Author's personal copy
(P1.4 wt.%) and FeOt (7.5–8.0 wt.%) comparable to that ofmafic rocks (e.g., CFB-type rocks, see in Basaltic VolcanismStudy Project, 1981), suggesting a possible mafic input. Ele-vated SiO2 (>70 wt.%) in some samples attribute to in-creased contributions of quartzo–feldspathic sources. Wedo not find any systematic variation in CIA values (weath-ering index) in the sequence (Fig. 3). Also, an average CIAvalue (47.5) is close to that of 75% of the samples studied(�50), similar to unweathered rocks (50). In a short to med-ium-sized river like Mahi, we attribute finer grain size ofSiO2-poor and Fe–Ti–Ca rich detritus to fine-grained maficsource (Deccan basalts), rather than action of fluvial trans-port. In short, sand-sized minerals (e.g., quartz, feldspar)may have greater influence on sediment chemistry up sec-tion, but refractory elements i.e. Ti, Fe, Al are preferentiallyhosted in the silt fraction, that decrease up section. The Ti-,Fe- and Mn-rich sand grains occur to a limited extent in thetransition stage roughly within 4–6 m.
4.3.2. Trace elements
Relatively immobile trace elements like Cr, Ni and ma-jor-element oxides Al2O3 and TiO2 undergo the least frac-tionation during sedimentary processes (Hessler andLowe, 2006). Several of the Mujpur samples are enrichedin Cr (P200 ppm) and Ni (P40 ppm) (Table 2) comparedto those of UCC (Cr: 83 ppm, Ni: 44 ppm) (McLennan,2001), and average shale (Cr: 104 ppm, Ni: 54 ppm; Condie,1993). Good to reasonable positive correlations exist be-tween FeOt, MnO, Al2O3, TiO2 and MnO with Ni, Coand Cr (Fig. 8h–m) in the suite suggesting significant maficinput. Interestingly, the lower-SiO2 samples (49–55 wt.%)have higher concentrations of Cr (>250 ppm vs.<200 ppm), Ni (>40 ppm vs. <25 ppm), lower Th/Cr(60.02), and lower Th/Sc (<0.6) and La/Sc, relative tothe higher-SiO2 samples (Fig. 8l–n). This clearly suggeststhat mafic phases primarily control transition element dis-tributions in many samples, particularly in the lower partof the profile (Fig. 4). There is also a positive correlation be-tween Cr contents and CIA values in the sediment samples(not shown).
The Sr concentrations in the samples vary positivelywith CaO (Fig. 8q), suggestive of plagioclase feldspar con-trol. Less rainfall in the river catchment perhaps helpedretention of plagioclase feldspar, and consequently Caand Na, in the system. Immobile Ba and mobile Rb havepositive correlation with K2O (Fig. 8r and s) and Al2O3
(not shown), which suggests alkali feldspar control. Thenearly constant K2O (about 1.5 wt.%) and positive correla-tion of Rb with FeOt (Fig. 8g and t), and low Rb/Sr (<1),however, suggest biotite control, instead of alkali feldspar.The contribution of a boitite-rich, quartzo–feldspathicsource (i.e. granitoid) is thus indicated. However, granitoidcontributions may be restricted because of lower concentra-tions of K, Ba and Rb in the sediments.
4.3.3. Rare earth elements (REE)
The chondrite-normalized plots of the rare earth ele-ments (REE) (Fig. 9a), generally show higher concentra-tions of light REE (LREE) than heavy REE (HREE)with a negative Eu-anomaly similar to that of the upperT
able
1M
iner
alm
od
alan
alys
iso
fsa
nd
frac
tio
no
fth
eM
ujp
ur
sam
ple
s.
Sam
ple
No
MJ-
15M
J-31
MJ-
80M
J-83
MJ-
117
MJ-
123
MJ-
126
MJ-
218
MJ-
221
MJ-
235
MJ-
262
MJ-
274
MJ-
282
Min
eral
sM
C%
MC
%M
C%
MC
%M
C%
MC
%M
C%
MC
%M
C%
MC
%M
C%
MC
%M
C%
Qu
artz
192
48.1
191
37.5
157
55.1
185
59.3
248
44.0
176
36.7
130
28.1
152
41.3
151
41.6
296
50.5
199
39.3
267
50.5
207
48.3
Fel
dsp
ar(p
lagi
ocl
ase)
51.
257
1.37
41.
4011
3.53
284.
968
1.67
132.
814
1.09
51.
389
1.54
163.
1615
2.84
214.
90L
ith
ic11
729
.322
844
.733
11.6
6621
.296
17.0
240
50.0
250
54.1
8021
.757
15.7
207
35.3
180
35.6
130
24.6
130
30.3
Bio
tite
6917
.362
12.2
5218
.238
12.2
366.
3846
9.58
408.
6635
9.51
4612
.752
8.87
6412
.690
17.0
399.
09P
yro
xen
e16
4.01
224.
3139
13.7
123.
8515
627
.710
2.08
296.
2897
26.4
104
28.7
223.
7547
9.29
275.
1032
7.46
To
tal
399
510
285
312
564
480
462
368
363
586
506
529
429
MC
=m
od
alco
un
t,li
thic
:m
afic
volc
anic
rock
frag
men
t.
70 A. Sharma et al. / Geochimica et Cosmochimica Acta 104 (2013) 63–83
Author's personal copy
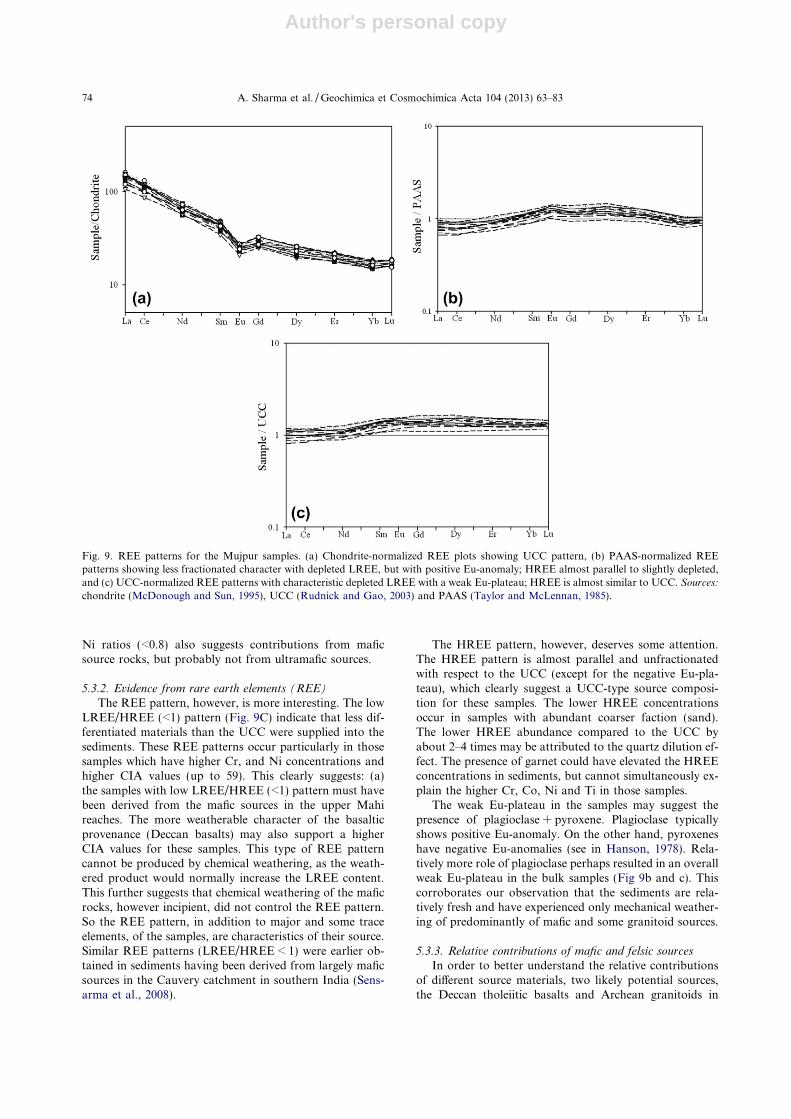
continental crust (UCC: McLennan, 2001), although withvariable REE concentrations compared to the UCC. Theubiquitous negative Eu anomalies and high REE abun-dance with patterns similar to the UCC are, however, sur-prising for a mafic provenance.
The REE patterns of most shale are remarkably uni-form: steep LREE slope, flat HREE, and slightly negativeEu anomaly. Interestingly, most of the Mujpur samplesdo not have REE patterns comparable to average shaleor post-Archaean Australian Shale (PAAS). When normal-ized to PAAS, the samples have characteristically lowerLREE, higher MREE (Sm–Dy) with a distinct positiveEu anomaly. The HREE (Yb–Lu), are comparable orslightly lower than that of PAAS, but with a slightly nega-tive slope (Fig. 9b). When normalized to the UCC, samplesreveal distinct REE patterns: consistently LREE depleted(La/Yb)n < 1) by about 2–4 times with or without a weakSm–Eu–Gd plateau (Fig. 9c). A Few samples have slightlyelevated LREE patterns, but with similarly low LREE/HREE ratios ((La/Yb)n < 1). The average of Eu/Eu* is0.724 (0.70–0.75) which is slightly greater than the PASSand UCC ðPASSEu=Eu� ¼ 0:65;UCCEu=Eu� ¼ 0:70Þ, respec-tively. Nevertheless, the general uniformity in the REE pat-tern may be attributed to better mechanical mixing andincrease in REE abundance in the finer fraction.
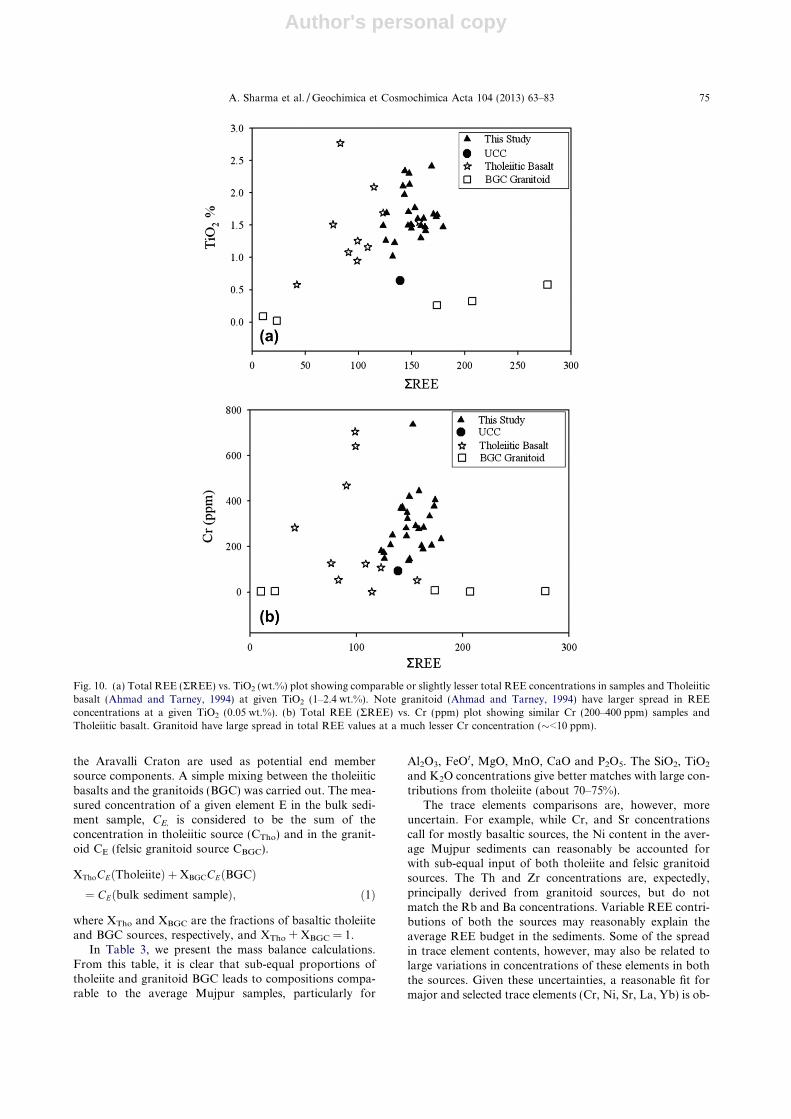
The higher-TiO2 samples have characteristically low(La/Yb)n (<1). Also the total REE concentrations increasewith Cr, except for one sample with the highest Cr(>700 ppm) (Fig. 10). This kind of relationship is not com-mon in sediments, and will be discussed in the followingsection.
5. DISCUSSION
The chemical composition of clastic sediments is a netresult of a number of geological and possibly biological fac-tors. These include nature of source rocks, intensity ofchemical weathering, rate of sediment supply, and sorting(both textural and mineralogical) during transportationand deposition (Piper, 1974; McLennan, 1989; Cox andLowe, 1995). Each of these factors must be evaluated beforeconstraining the nature of the source rocks using mineral-
ogy and chemistry of the clastic sediments. In this section,the sediment compositions are first considered that mayhave resulted due to or have been modified by weathering.Then the relative proportion of possible source rocks forthe Mahi sediments is estimated.
5.1. Effects of marine action on sediment chemistry
As described above (Section 2), the Mujpur sedimentswere deposited in a transitional fluvio–marine environment.It is conceivable that erosion in the Mahi catchments maynot have produced enough finer sediment (silt + clay).Fine-grained basaltic source rocks and/or mechanical ac-tion of marine winnowing at the fluvio–marine interface(estuaries/tidal flat) could be plausible reason(s) for the gen-eration of the fine detritus.
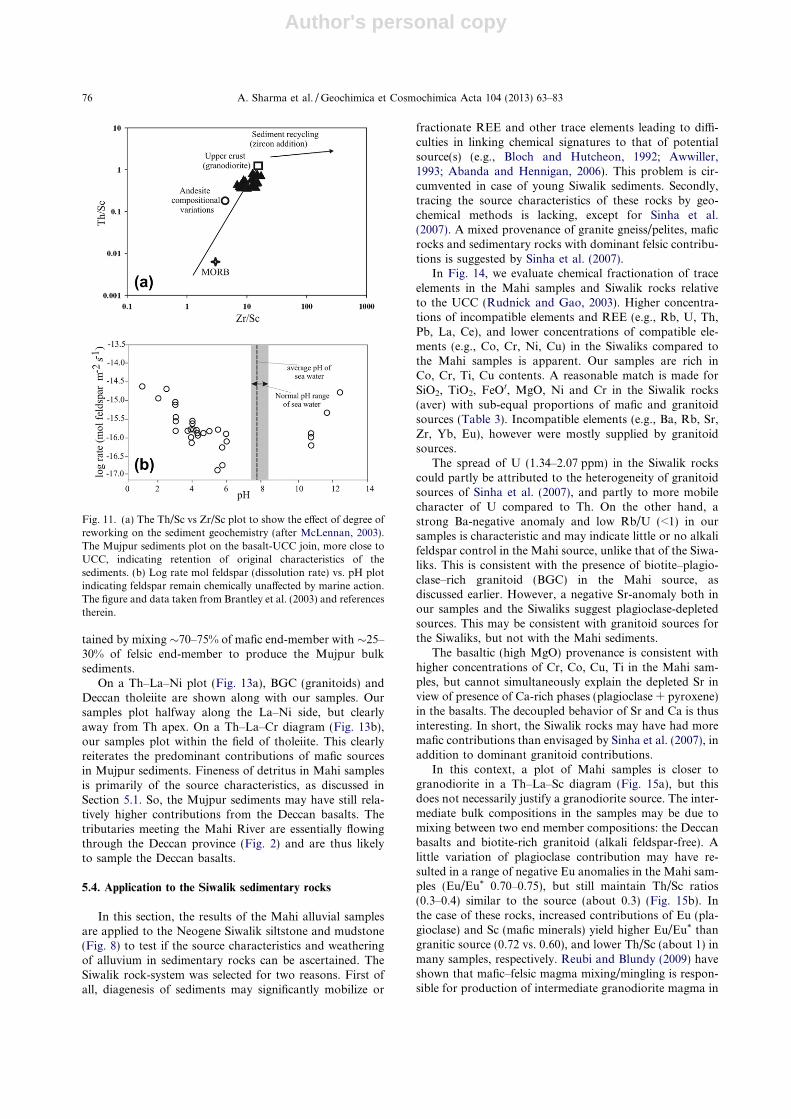
With increased reworking, the immobile element Zr,may have become enriched in the sediments. The Th/Scvs. Zr/Sc plot (McLennan, 2003) is useful in determiningif such processes could affect the geochemical attributes ofsediments. The Mujpur samples plot on the line joiningbasaltic (MORB), intermediate and UCC sources, but faraway from the chemical trend of recycled sediments(Fig. 11a).
The possible dissolution of feldspars may have also oc-curred in our samples in marine waters. The plot inFig. 11b shows that sea water with alkaline chemistry(pH = 7–8) is not conducive of feldspar dissolution. LowpH (pH 3) and high temperature are conducive for rapiddissolution of feldspars (Brantley, 2003 and referencestherein). Thus, marine action within the Mujpur estuarymay have only partly imparted fineness to the detritus,but could not have affected its overall chemistry. Thisbrings out important constraints that sediment characteris-tics in the Mujpur are typical of the Mahi catchments.
5.2. Weathering index and CIA pattern
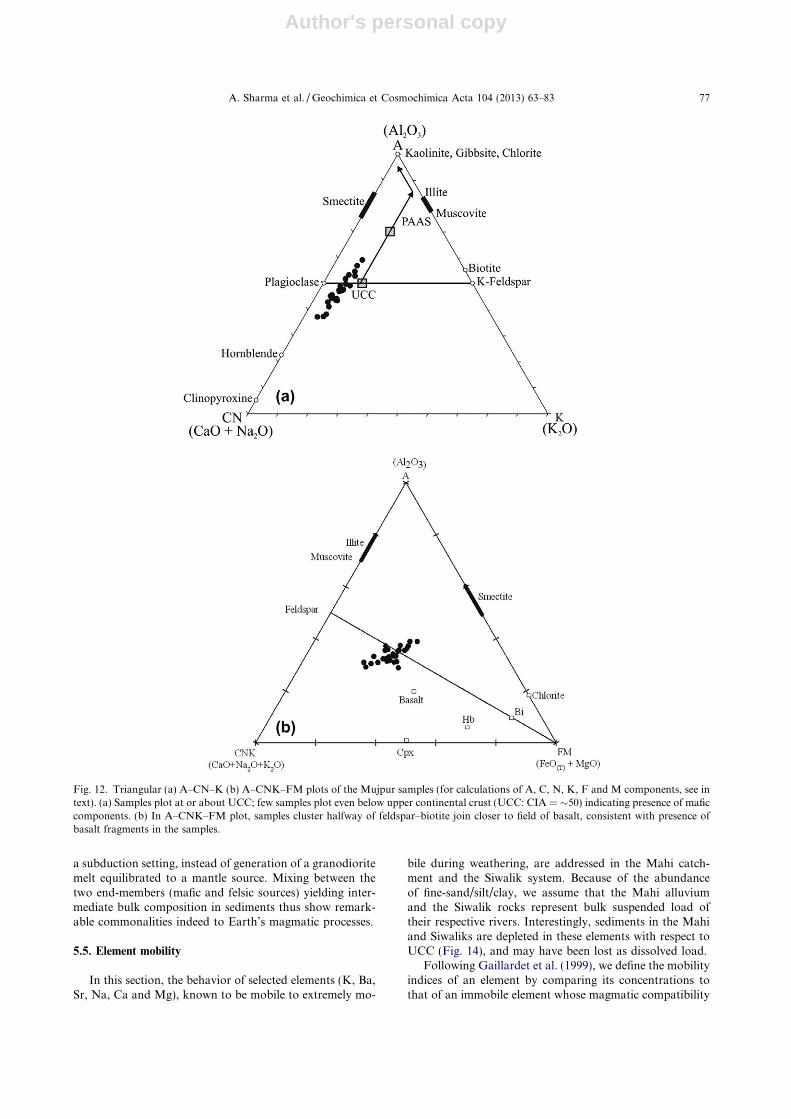
To identify the effect of weathering and transport, thesamples were plotted in the Al2O3–(CaO + Na2O)–K2O(A–CN–K) and Al2O3–(CaO + Na2O + K2O)–FeOt + -MgO (A–CNK–FM) diagram (Fig. 12), along with the
Fig. 7. On a Q (quartz)–F (feldspar)–L (lithic fragment) diagram, the Mujpur samples plot as sublithiarenite. Basalt fragments mostlyrepresent lithics in the samples; pyroxene and biotite representing other mafic phases.
A. Sharma et al. / Geochimica et Cosmochimica Acta 104 (2013) 63–83 71
Author's personal copy
Table 2Major, trace and rare earth element compositions of the Mujpur sediments. Also given compositions of UCC, PAAS, average Tholeiite (Tho), Granitoid gneiss (BGC) and Siwalik siltstone/mudstone for comparision.
MJ-
2
MJ-
15
MJ-
19
MJ-
31
MJ-
47
MJ-
56
MJ-
67
MJ-
79
MJ-
80
MJ-
83
MJ-
90
MJ-
117
MJ-
123
MJ-
126
MJ-
143
MJ-
155
MJ-
170
MJ-
178
MJ-
192
MJ-
207
MJ-
218
MJ-
221
MJ-
235
MJ-
241
MJ-
262
MJ-
274
MJ-
282
UCC PAAS ThoU BGC$ Siwalik#
Major oxide (wt %)
SiO2 53.7 51.2 51.8 53.5 49.6 58.8 48.2 54.8 54.5 67.7 49.0 61.9 55.6 46.5 52.3 64.9 52.2 58.7 60.0 71.9 65.9 60.5 60.2 62.1 56.6 61.3 66.9 66.6 62.8 53.0 77.4 65.4
Al2O3 14.1 15.2 14.9 12.9 14.5 12.2 14.1 14.7 11.9 10.1 13.2 11.5 12.1 13.6 14.5 10.5 15.1 12.7 12.1 9.02 10.8 11.8 11.5 11.6 12.5 11.9 11.7 15.4 18.9 13.1 11.7 15.8
TiO2 1.41 1.47 1.63 1.97 2.10 1.71 2.13 1.47 2.41 1.26 2.30 1.69 1.77 2.34 1.67 1.49 1.66 1.49 1.45 1.02 1.23 1.49 1.50 1.60 1.60 1.51 1.30 0.64 1.00 1.46 0.25 0.73
FeOt 7.53 8.76 8.54 8.05 8.40 8.71 10.4 8.41 8.09 5.71 7.94 8.29 7.34 10.9 8.67 6.09 8.76 6.96 6.69 4.75 5.66 7.51 7.63 7.04 7.76 7.02 5.98 5.04 7.08 13.6 0.85 5.88
MnO 0.12 0.13 0.12 0.12 0.16 0.13 0.14 0.12 0.10 0.09 0.14 0.13 0.10 0.17 0.13 0.09 0.13 0.10 0.09 0.07 0.08 0.11 0.11 0.10 0.12 0.11 0.09 0.10 0.11 0.21 0.02 0.06
MgO 2.93 3.10 2.81 3.10 2.07 1.88 2.10 3.11 3.40 2.22 1.99 1.65 2.91 2.08 2.90 1.24 2.72 2.49 2.50 1.72 2.15 1.44 1.58 2.36 1.45 1.36 2.14 2.48 2.20 6.29 0.52 2.59
CaO 4.25 3.74 4.77 6.23 5.84 5.89 6.48 5.33 5.90 4.21 7.10 5.84 6.18 7.25 5.10 4.25 4.36 4.66 5.08 3.73 4.02 4.84 5.37 4.64 4.13 3.79 3.19 3.59 1.30 7.81 0.93 1.60
Na2O 1.06 0.88 2.27 1.68 1.77 1.67 2.04 1.22 2.22 2.02 4.65 2.45 1.41 1.66 0.87 4.23 0.83 1.36 1.55 1.96 1.63 1.39 3.58 1.64 4.19 1.85 1.53 3.27 1.20 3.02 4.64 0.65
K2O 1.95 2.01 1.85 1.27 1.74 1.54 1.46 1.70 1.32 1.55 1.47 1.64 1.42 1.62 1.73 1.72 1.93 1.78 1.64 1.52 1.65 1.77 1.83 1.48 2.05 2.08 1.87 2.80 3.70 0.97 1.59 3.04
P2O5 0.14 0.13 0.20 0.15 0.22 0.18 0.22 0.13 0.16 0.11 0.22 0.18 0.14 0.23 0.13 0.19 0.13 0.13 0.13 0.07 0.13 0.17 0.20 0.13 0.22 0.17 0.12 0.15 0.16 0.15 0.05 0.09
LOI 11.1 13.1 10.1 9.43 12.4 7.50 12.7 7.93 8.07 4.95 11.0 4.78 9.11 12.8 12.1 4.49 13.0 8.41 7.92 3.57 7.31 8.06 4.71 6.67 7.99 6.94 5.82 NA 6.00 1.48 0.45 5.31
Total 98.2 99.7 99.0 98.4 98.8 100.2 99.9 98.8 98.1 99.9 99.0 100.1 98.1 99.1 100 99.2 101 98.8 99.1 99.4 101 99.0 98.3 99.3 98.6 98.0 101 100 105 101 98.5 101
Trace element (ppm)
Ba 220 274 225 54.0 199 192 200 278 116 244 181 223 258 209 287 189 125 45.0 59.0 265 206 165 223 120 179 244 204 628 650 251 265 474
Co 23.7 28.5 32.6 30.4 36.1 24.5 28.9 29.6 29.4 19.5 34.1 25.0 28.5 33.6 29.5 18.0 28.4 22.9 22.9 15.7 18.4 21.1 23.4 24.4 25.3 20.5 20.2 17.3 23.0 NA NA 16.8
Cr 284 233 377 373 368 246 323 189 333 173 349 147 737 365 205 181 406 445 420 207 250 281 146 291 203 138 277 92.0 110 256 4.20 150
Cu 107 80.4 86.8 68.2 94.8 59.2 88.3 77.1 64.0 52.0 95.2 51.4 65.4 105 76.6 50.0 75.5 62.0 61.7 46.2 54.7 55.4 63.4 59.8 71.6 47.2 55.4 28.0 50.0 NA NA 31.0
Ga 14.3 18.0 16.4 13.1 15.4 11.9 16.2 16.3 13.7 10.1 14.2 13.6 12.7 16.0 15.1 9.87 16.3 12.7 12.2 8.60 10.0 12.7 12.7 13.0 15.3 13.1 12.6 17.5 20.0 22.8 13.6 17.3
Hf 14.7 4.55 6.84 3.60 3.91 4.39 4.05 4.31 5.10 3.83 4.02 2.96 3.62 7.38 5.77 4.55 4.29 3.95 3.64 3.71 3.30 3.62 3.08 5.38 4.11 5.26 6.08 5.30 5.00 NA NA NA
Nb 15.4 15.9 13.1 14.0 13.6 13.9 13.6 14.8 15.6 12.1 12.9 14.6 14.0 14.2 15.3 14.5 17.6 14.8 14.0 12.0 13.2 13.4 14.3 14.9 15.7 13.8 15.3 12.0 19.0 7.00 13.4 14.5
Ni 44.1 50.5 48.2 37.4 53.2 29.0 54.1 44.5 34.2 23.8 52.2 28.3 35.4 54.2 41.7 28.0 42.2 34.5 31.4 20.2 27.1 36.6 44.6 28.2 43.5 45.1 27.1 47.0 55.0 98.8 2.03 57.7
Pb 16.1 19.6 14.7 9.00 17.6 12.9 17.5 12.5 9.40 16.3 15.3 12.7 12.1 16.1 14.4 16.9 13.7 15.2 18.0 14.8 16.1 13.0 17.2 14.6 14.4 14.3 17.4 17.0 20.0 NA NA 24.3
Rb 86.2 89.7 64.0 42.7 77.2 47.6 87.1 69.6 39.9 51.1 78.6 65.8 50.8 82.4 71.9 67.5 79.9 69.6 59.1 51.7 57.9 76.5 68.4 52.8 88.9 95.6 75.2 84.0 160 30.4 27.8 140
Sc 16.6 23.6 22.3 20.8 25.5 18.6 23.8 23.2 20.6 16.5 22.9 17.4 23.7 26.1 22.9 15.7 22.3 16.9 17.0 12.5 13.7 14.4 15.2 18.7 20.0 18.4 16.3 14.0 16.0 NA NA 15.0
Sr 166 154 186 211 175 190 184 181 193 183 196 247 196 206 179 195 165 169 182 157 167 170 219 177 163 178 140 320 200 169 81.0 87.1
Th 13.0 12.3 9.50 7.30 9.66 7.05 10.1 8.50 7.50 6.40 8.08 8.18 9.10 11.2 10.7 7.23 11.6 11.9 7.70 8.70 10.3 10.9 11.8 11.6 10.9 10.5 7.7 10.5 14.6 5.10 14.0 14.2
U 1.71 2.07 1.92 1.80 1.54 1.80 1.61 1.89 2.02 1.53 1.55 1.70 1.90 1.49 1.81 1.48 1.72 1.83 1.34 1.63 1.56 1.55 1.73 1.79 1.86 1.52 1.86 2.70 3.10 NA NA 3.02
V 161 183 175 197 202 197 208 192 249 165 205 152 173 195 194 178 190 168 164 138 160 163 152 196 178 148 159 97.0 150 266 12.4 132
Y 36.8 35.7 28.9 34.2 30.7 33.8 28.9 37.0 38.9 29.0 31.5 24.2 34.8 27.1 37.2 18.9 36.3 32.7 31.9 28.2 26.7 22.2 23.2 37.9 24.7 23.5 41.7 21.0 27.0 27.3 34.4 35.0
Zn 77.0 90.8 79.3 75.5 81.8 68.7 81.7 82.3 76.8 60.8 82.2 70.1 71.0 77.9 86.0 58.6 84.1 71.6 65.7 51.2 57.2 68.2 75.2 67.4 80.1 65.8 60.6 67.0 85.0 152 13 86.2
Zr 205 207 199 211 189 253 186 203 291 203 178 148 229 180 212 229 209 224 213 215 204 212 191 229 176 217 247 193 210 146 206 232
REE (ppm)
La 34.8 38.0 36.8 29.0 30.5 31.4 30.6 34.2 35.9 26.9 30.6 25.3 32.7 28.4 35.9 25.9 36.2 34.6 31.4 27.7 29.6 31.2 33.1 33.7 34.7 32.5 34.3 31.0 38.0 19.4 30.2 47.0
Ce 73.8 80.2 73.5 60.0 62.7 63.2 62.8 70.1 71.7 54.6 62.9 53.1 69.2 61.2 73.5 53.6 75.0 69.4 64.9 57.6 58.7 64.3 65.2 67.3 70.2 65.2 70.1 63.0 80.0 38.8 63.0 98.6
Nd 29.6 33.6 34.4 29.2 25.7 28.7 28.7 31.2 33.2 24.0 29.1 26.1 27.9 29.1 34.1 24.0 34.8 30.6 29.6 26.7 25.3 28.0 28.3 29.9 31.6 28.8 30.2 27.0 32.0 19.5 25.7 39.3
Sm 6.53 7.13 7.05 6.07 5.61 6.01 6.42 6.59 6.92 5.09 6.71 5.11 5.89 6.29 7.00 4.98 7.09 6.13 6.03 5.16 5.30 6.06 5.99 6.32 6.21 6.25 6.12 4.70 5.60 4.82 5.27 7.92
Eu 1.44 1.54 1.55 1.38 1.30 1.33 1.43 1.52 1.53 1.12 1.44 1.18 1.32 1.37 1.55 1.11 1.63 1.41 1.36 1.12 1.15 1.29 1.38 1.41 1.44 1.32 1.36 1.00 1.10 1.49 1.00 1.53
Gd 5.55 6.30 6.52 5.41 5.15 5.44 5.62 5.98 6.46 4.40 5.62 4.98 5.21 5.38 6.10 4.26 6.23 5.54 5.25 4.36 4.48 5.26 5.41 5.60 5.62 5.01 5.42 4.00 4.70 5.10 4.74 6.11
Dy 5.30 6.01 6.41 5.80 5.01 4.92 6.03 5.98 6.30 4.28 5.03 4.80 4.98 5.63 5.77 4.18 6.10 5.28 5.08 4.30 4.33 4.96 4.88 5.27 5.33 4.84 5.01 3.90 4.40 4.76 3.92 5.68
Er 3.02 3.35 3.49 3.15 2.82 3.02 3.26 3.52 3.43 2.59 3.09 2.88 2.86 3.10 3.36 2.60 3.47 2.94 3.02 2.39 2.48 2.77 2.77 2.99 2.99 2.60 3.01 2.30 2.90 2.69 2.17 3.36
Yb 2.53 2.95 2.87 2.68 2.39 2.52 2.70 2.95 2.81 2.25 2.59 2.41 2.48 2.60 2.81 2.16 2.93 2.50 2.51 2.23 2.13 2.30 2.41 2.55 2.57 2.17 2.62 1.96 2.80 2.29 2.07 2.95
Lu 0.42 0.46 0.45 0.42 0.39 0.41 0.41 0.45 0.45 0.36 0.39 0.39 0.38 0.38 0.46 0.34 0.48 0.40 0.40 0.34 0.34 0.37 0.39 0.43 0.42 0.36 0.46 0.31 0.43 0.32 0.29 0.44
Th/Cr 0.05 0.05 0.03 0.02 0.03 0.03 0.03 0.04 0.02 0.04 0.02 0.06 0.01 0.03 0.05 0.04 0.03 0.03 0.02 0.04 0.04 0.04 0.08 0.04 0.05 0.08 0.03 0.11 0.13 0.02 3.33 0.10
La/Sc 2.09 1.61 1.65 1.39 1.20 1.69 1.29 1.48 1.74 1.63 1.34 1.45 1.38 1.09 1.57 1.65 1.62 2.04 1.85 2.21 2.15 2.17 2.18 1.80 1.73 1.77 2.11 2.21 2.38 NA NA 3.14
Th/Sc 0.78 0.52 0.43 0.35 0.38 0.38 0.42 0.37 0.36 0.39 0.35 0.47 0.38 0.43 0.47 0.46 0.52 0.70 0.45 0.70 0.75 0.75 0.78 0.62 0.54 0.57 0.47 0.75 0.91 NA NA 0.95
Zr/Y 5.58 5.79 6.89 6.16 6.16 7.49 6.45 5.49 7.48 7.00 5.65 6.09 6.59 6.64 5.69 12.14 5.75 6.85 6.67 7.64 7.63 9.55 8.23 6.05 7.13 9.23 5.93 9.19 7.78 5.34 5.98 6.63
La/Sm 5.32 5.33 5.22 4.77 5.44 5.22 4.76 5.19 5.19 5.28 4.56 4.94 5.55 4.52 5.13 5.20 5.10 5.64 5.21 5.37 5.58 5.16 5.52 5.33 5.58 5.20 5.60 6.60 6.79 4.03 5.73 5.94
La/Yb 13.7 12.9 12.8 10.8 12.8 12.4 11.3 11.6 12.8 11.9 11.8 10.5 13.2 10.9 12.8 12.0 12.3 13.8 12.5 12.4 13.9 13.6 13.7 13.2 13.5 15.0 13.1 15.8 13.6 8.48 14.6 15.9
Eu/
Eu*
0.73 0.70 0.70 0.74 0.74 0.71 0.73 0.74 0.70 0.72 0.71 0.71 0.73 0.72 0.73 0.73 0.75 0.74 0.74 0.72 0.72 0.70 0.74 0.72 0.74 0.72 0.72 0.70 0.65 0.92 0.61 0.67
CIA 54.8 59.3 50.8 45.4 48.5 44.7 45.8 52.0 43.0 44.4 37.3 41.3 44.6 43.4 53.5 38.8 57.0 50.0 47.1 43.6 47.8 47.5 39.6 47.6 43.0 49.4 53.0 50.8 69.4 39.3 51.4 68.6
ThoU: Tholeiitic Basalt (avg. 10 samples) and BGC$: Banded Gneissic Complex (avg. 5 samples) (Ahmad and Tarney, 1994); Siwalik# (avg. 51 samples for major & trace elements; avg. 22samples for REE) (Sinha et al., 2007); Upper Continental Crust (UCC) (Rudnick and Gao, 2003); Post-Archaean Australian Shale (PAAS), (Taylor and McLennan, 1985).
72A
.S
harm
aet
al./G
eoch
imica
etC
osm
och
imica
Acta
104(2013)
63–83
Author's personal copy
chemical index of alteration (CIA: Nesbitt and Young,1989). The CIA indicates the degree of chemical weatheringand is defined as [Al2O3/(Al2O3 + CaO + Na2O + K2-
O) � 100] in molecular proportions, where CaO is fromthe silicates only. The CIA of the sediments ranges from37 to 59 with the majority of the samples plotting around45–54 in the A–CN–K plot (Fig. 12a). On an A–CNK–FM plot (Fig. 12b), the samples plot along the feldspar-bio-tite join, near the field of basalt.
The CIA of sediments is, in general, about 50 for first-cycle sediments that were dominantly derived from physi-cally weathered igneous rocks and it tends to increase aschemical weathering intensifies (Nesbitt and Young,1984). The CIA of the Mujpur samples 650 (UCC � 50)clearly suggests the sediment has experienced minimalchemical weathering. The presence of less-weathered rocksin semi-arid conditions is also supported by fieldobservation.
In summary, the low CIA values in our samples can beattributed to the influx of minimally weathered detritus in atectonically active and water-starved semi-arid condition.The tectono–climatic condition thus promoted enhancederosion (mechanical process), but inhibited chemical weath-ering in the Mahi catchment. The presence of abundantphysical heterogeneity (e.g., gneissic fabric, fractures, joint
planes, and shear planes) in the upland rocks may havebeen conducive for water runoff during flash flooding topercolate through source rocks causing limited chemicalweathering (CIA up to 59).
5.3. Source rock characteristics
5.3.1. Evidence from ferromagnesian transition metals
Ferromagnesian elements (e.g., Fe, Cr, Co and Ni) areenriched in mafic and ultramafic igneous rocks and elevatedabundances of these elements in the sediments and sedimen-tary rocks may indicate the addition of components derivedfrom mafic rocks (Bock et al., 1998 and references therein).Elevated Cr and Ni abundances with low Cr/Ni ratios (1.3–1.5) were further suggested to be indicative of ultramaficrocks in the source area of shales (Garver et al., 1996).Although high Cr and Ni contents suggest a mafic/ultra-mafic provenance, ultramafic rocks can attain Cr/Ni ratiosP10 (Jaques et al., 1983) and accordingly, the low Cr/Niratios need not be indicative of an ultramafic provenance(Bock et al., 1998). Thus, the elevated Cr and Ni abun-dances (Cr > 250 ppm, Ni > 45 ppm) and Cr/Ni ratios(>5) in many Mujpur samples and their positive correlationwith FeOt and TiO2 further confirm that mafic lithologiesmust have contributed to sediment formation. Lower Y/
Fig. 8. Binary plots showing relations among different major oxides and trace elements for the Mujpur samples. Compositions of the Siwalikmudstone/siltstone (Sinha et al., 2007) are plotted for comparison. For details, see text.
A. Sharma et al. / Geochimica et Cosmochimica Acta 104 (2013) 63–83 73
Author's personal copy
Ni ratios (<0.8) also suggests contributions from maficsource rocks, but probably not from ultramafic sources.
5.3.2. Evidence from rare earth elements (REE)
The REE pattern, however, is more interesting. The lowLREE/HREE (<1) pattern (Fig. 9C) indicate that less dif-ferentiated materials than the UCC were supplied into thesediments. These REE patterns occur particularly in thosesamples which have higher Cr, and Ni concentrations andhigher CIA values (up to 59). This clearly suggests: (a)the samples with low LREE/HREE (<1) pattern must havebeen derived from the mafic sources in the upper Mahireaches. The more weatherable character of the basalticprovenance (Deccan basalts) may also support a higherCIA values for these samples. This type of REE patterncannot be produced by chemical weathering, as the weath-ered product would normally increase the LREE content.This further suggests that chemical weathering of the maficrocks, however incipient, did not control the REE pattern.So the REE pattern, in addition to major and some traceelements, of the samples, are characteristics of their source.Similar REE patterns (LREE/HREE < 1) were earlier ob-tained in sediments having been derived from largely maficsources in the Cauvery catchment in southern India (Sens-arma et al., 2008).
The HREE pattern, however, deserves some attention.The HREE pattern is almost parallel and unfractionatedwith respect to the UCC (except for the negative Eu-pla-teau), which clearly suggest a UCC-type source composi-tion for these samples. The lower HREE concentrationsoccur in samples with abundant coarser faction (sand).The lower HREE abundance compared to the UCC byabout 2–4 times may be attributed to the quartz dilution ef-fect. The presence of garnet could have elevated the HREEconcentrations in sediments, but cannot simultaneously ex-plain the higher Cr, Co, Ni and Ti in those samples.
The weak Eu-plateau in the samples may suggest thepresence of plagioclase + pyroxene. Plagioclase typicallyshows positive Eu-anomaly. On the other hand, pyroxeneshave negative Eu-anomalies (see in Hanson, 1978). Rela-tively more role of plagioclase perhaps resulted in an overallweak Eu-plateau in the bulk samples (Fig 9b and c). Thiscorroborates our observation that the sediments are rela-tively fresh and have experienced only mechanical weather-ing of predominantly of mafic and some granitoid sources.
5.3.3. Relative contributions of mafic and felsic sources
In order to better understand the relative contributionsof different source materials, two likely potential sources,the Deccan tholeiitic basalts and Archean granitoids in
Fig. 9. REE patterns for the Mujpur samples. (a) Chondrite-normalized REE plots showing UCC pattern, (b) PAAS-normalized REEpatterns showing less fractionated character with depleted LREE, but with positive Eu-anomaly; HREE almost parallel to slightly depleted,and (c) UCC-normalized REE patterns with characteristic depleted LREE with a weak Eu-plateau; HREE is almost similar to UCC. Sources:
chondrite (McDonough and Sun, 1995), UCC (Rudnick and Gao, 2003) and PAAS (Taylor and McLennan, 1985).
74 A. Sharma et al. / Geochimica et Cosmochimica Acta 104 (2013) 63–83
Author's personal copy
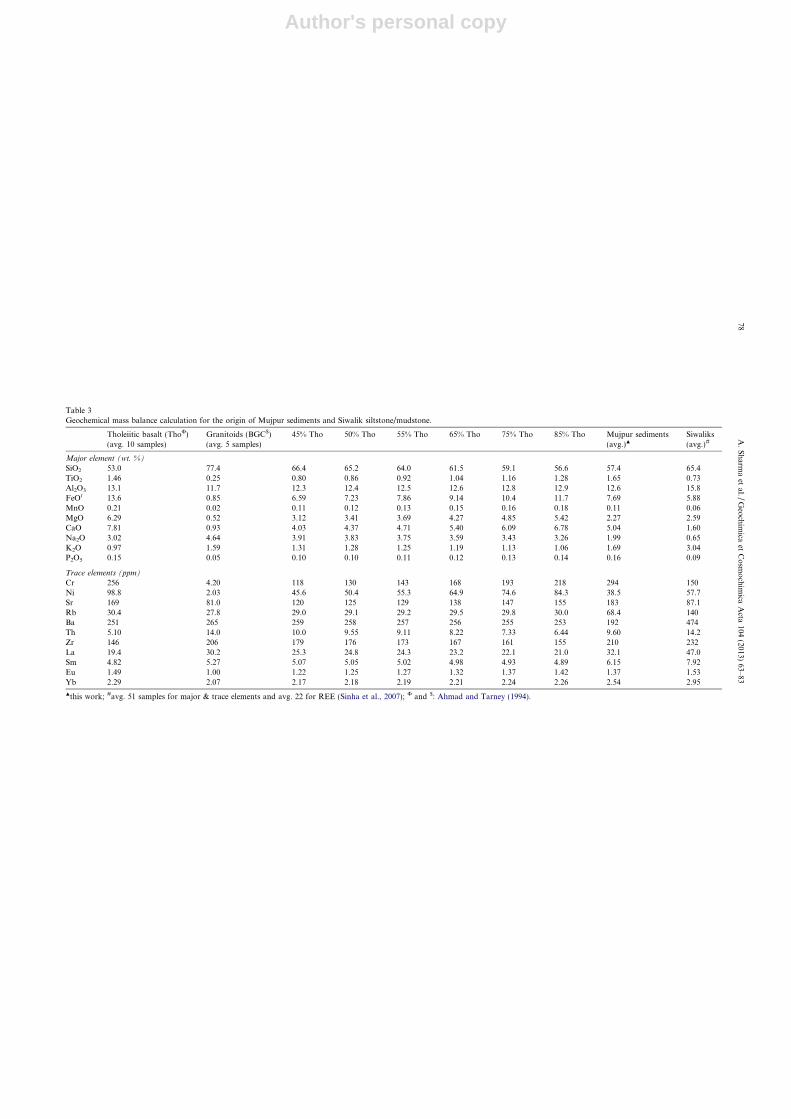
the Aravalli Craton are used as potential end membersource components. A simple mixing between the tholeiiticbasalts and the granitoids (BGC) was carried out. The mea-sured concentration of a given element E in the bulk sedi-ment sample, CE, is considered to be the sum of theconcentration in tholeiitic source (CTho) and in the granit-oid CE (felsic granitoid source CBGC).
XThoCEðTholeiiteÞ þXBGCCEðBGCÞ¼ CEðbulk sediment sampleÞ; ð1Þ
where XTho and XBGC are the fractions of basaltic tholeiiteand BGC sources, respectively, and XTho + XBGC = 1.
In Table 3, we present the mass balance calculations.From this table, it is clear that sub-equal proportions oftholeiite and granitoid BGC leads to compositions compa-rable to the average Mujpur samples, particularly for
Al2O3, FeOt, MgO, MnO, CaO and P2O5. The SiO2, TiO2
and K2O concentrations give better matches with large con-tributions from tholeiite (about 70–75%).
The trace elements comparisons are, however, moreuncertain. For example, while Cr, and Sr concentrationscall for mostly basaltic sources, the Ni content in the aver-age Mujpur sediments can reasonably be accounted forwith sub-equal input of both tholeiite and felsic granitoidsources. The Th and Zr concentrations are, expectedly,principally derived from granitoid sources, but do notmatch the Rb and Ba concentrations. Variable REE contri-butions of both the sources may reasonably explain theaverage REE budget in the sediments. Some of the spreadin trace element contents, however, may also be related tolarge variations in concentrations of these elements in boththe sources. Given these uncertainties, a reasonable fit formajor and selected trace elements (Cr, Ni, Sr, La, Yb) is ob-
Fig. 10. (a) Total REE (RREE) vs. TiO2 (wt.%) plot showing comparable or slightly lesser total REE concentrations in samples and Tholeiiticbasalt (Ahmad and Tarney, 1994) at given TiO2 (1–2.4 wt.%). Note granitoid (Ahmad and Tarney, 1994) have larger spread in REEconcentrations at a given TiO2 (0.05 wt.%). (b) Total REE (RREE) vs. Cr (ppm) plot showing similar Cr (200–400 ppm) samples andTholeiitic basalt. Granitoid have large spread in total REE values at a much lesser Cr concentration (�<10 ppm).
A. Sharma et al. / Geochimica et Cosmochimica Acta 104 (2013) 63–83 75
Author's personal copy
tained by mixing �70–75% of mafic end-member with �25–30% of felsic end-member to produce the Mujpur bulksediments.
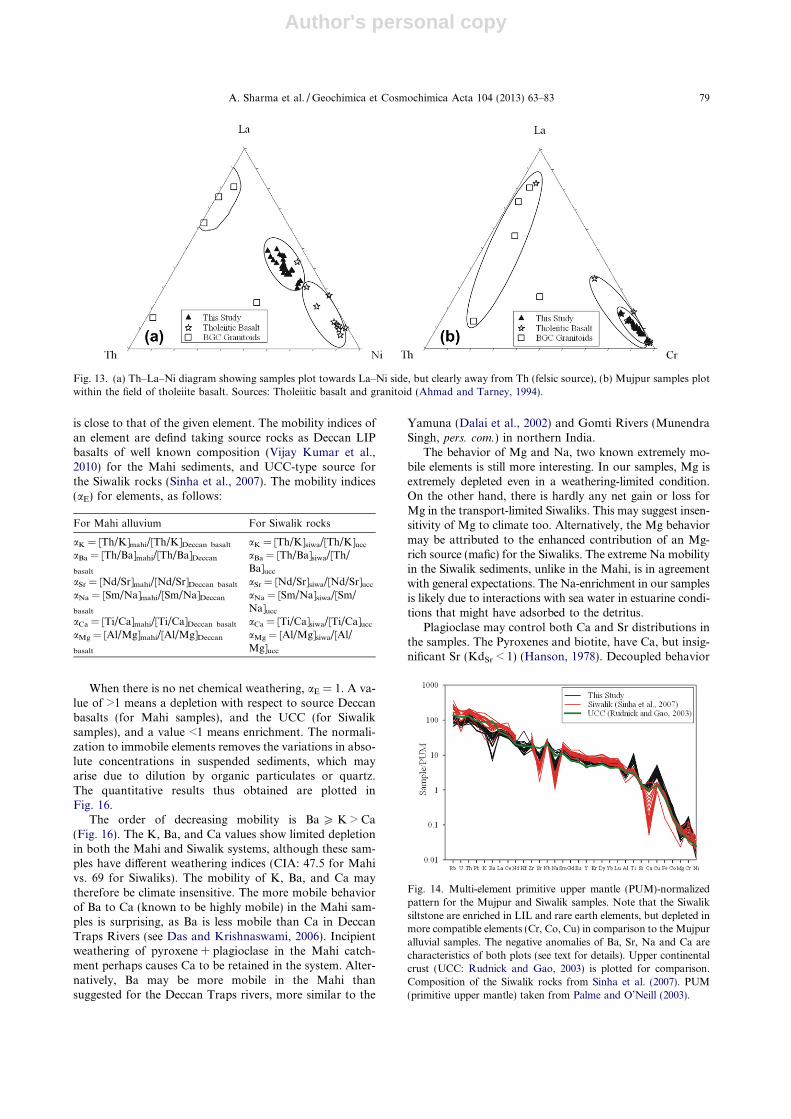
On a Th–La–Ni plot (Fig. 13a), BGC (granitoids) andDeccan tholeiite are shown along with our samples. Oursamples plot halfway along the La–Ni side, but clearlyaway from Th apex. On a Th–La–Cr diagram (Fig. 13b),our samples plot within the field of tholeiite. This clearlyreiterates the predominant contributions of mafic sourcesin Mujpur sediments. Fineness of detritus in Mahi samplesis primarily of the source characteristics, as discussed inSection 5.1. So, the Mujpur sediments may have still rela-tively higher contributions from the Deccan basalts. Thetributaries meeting the Mahi River are essentially flowingthrough the Deccan province (Fig. 2) and are thus likelyto sample the Deccan basalts.
5.4. Application to the Siwalik sedimentary rocks
In this section, the results of the Mahi alluvial samplesare applied to the Neogene Siwalik siltstone and mudstone(Fig. 8) to test if the source characteristics and weatheringof alluvium in sedimentary rocks can be ascertained. TheSiwalik rock-system was selected for two reasons. First ofall, diagenesis of sediments may significantly mobilize or
fractionate REE and other trace elements leading to diffi-culties in linking chemical signatures to that of potentialsource(s) (e.g., Bloch and Hutcheon, 1992; Awwiller,1993; Abanda and Hennigan, 2006). This problem is cir-cumvented in case of young Siwalik sediments. Secondly,tracing the source characteristics of these rocks by geo-chemical methods is lacking, except for Sinha et al.(2007). A mixed provenance of granite gneiss/pelites, maficrocks and sedimentary rocks with dominant felsic contribu-tions is suggested by Sinha et al. (2007).
In Fig. 14, we evaluate chemical fractionation of traceelements in the Mahi samples and Siwalik rocks relativeto the UCC (Rudnick and Gao, 2003). Higher concentra-tions of incompatible elements and REE (e.g., Rb, U, Th,Pb, La, Ce), and lower concentrations of compatible ele-ments (e.g., Co, Cr, Ni, Cu) in the Siwaliks compared tothe Mahi samples is apparent. Our samples are rich inCo, Cr, Ti, Cu contents. A reasonable match is made forSiO2, TiO2, FeOt, MgO, Ni and Cr in the Siwalik rocks(aver) with sub-equal proportions of mafic and granitoidsources (Table 3). Incompatible elements (e.g., Ba, Rb, Sr,Zr, Yb, Eu), however were mostly supplied by granitoidsources.
The spread of U (1.34–2.07 ppm) in the Siwalik rockscould partly be attributed to the heterogeneity of granitoidsources of Sinha et al. (2007), and partly to more mobilecharacter of U compared to Th. On the other hand, astrong Ba-negative anomaly and low Rb/U (<1) in oursamples is characteristic and may indicate little or no alkalifeldspar control in the Mahi source, unlike that of the Siwa-liks. This is consistent with the presence of biotite–plagio-clase–rich granitoid (BGC) in the Mahi source, asdiscussed earlier. However, a negative Sr-anomaly both inour samples and the Siwaliks suggest plagioclase-depletedsources. This may be consistent with granitoid sources forthe Siwaliks, but not with the Mahi sediments.
The basaltic (high MgO) provenance is consistent withhigher concentrations of Cr, Co, Cu, Ti in the Mahi sam-ples, but cannot simultaneously explain the depleted Sr inview of presence of Ca-rich phases (plagioclase + pyroxene)in the basalts. The decoupled behavior of Sr and Ca is thusinteresting. In short, the Siwalik rocks may have had moremafic contributions than envisaged by Sinha et al. (2007), inaddition to dominant granitoid contributions.
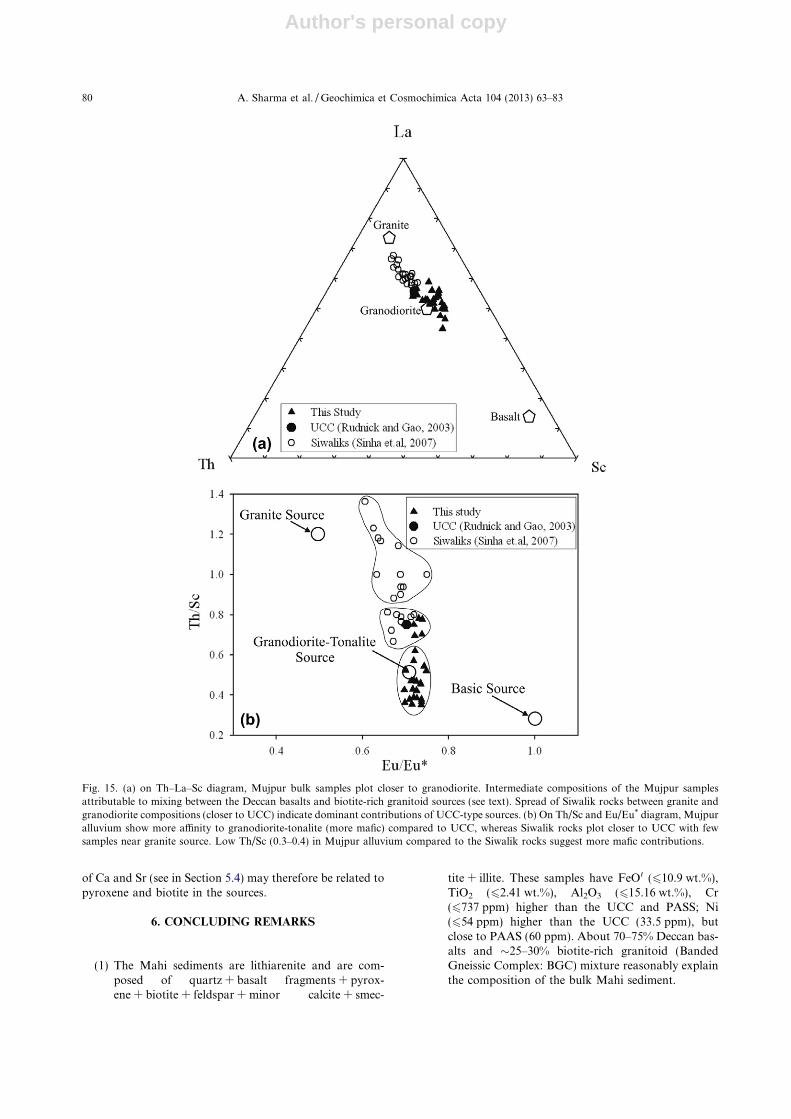
In this context, a plot of Mahi samples is closer togranodiorite in a Th–La–Sc diagram (Fig. 15a), but thisdoes not necessarily justify a granodiorite source. The inter-mediate bulk compositions in the samples may be due tomixing between two end member compositions: the Deccanbasalts and biotite-rich granitoid (alkali feldspar-free). Alittle variation of plagioclase contribution may have re-sulted in a range of negative Eu anomalies in the Mahi sam-ples (Eu/Eu* 0.70–0.75), but still maintain Th/Sc ratios(0.3–0.4) similar to the source (about 0.3) (Fig. 15b). Inthe case of these rocks, increased contributions of Eu (pla-gioclase) and Sc (mafic minerals) yield higher Eu/Eu* thangranitic source (0.72 vs. 0.60), and lower Th/Sc (about 1) inmany samples, respectively. Reubi and Blundy (2009) haveshown that mafic–felsic magma mixing/mingling is respon-sible for production of intermediate granodiorite magma in
Fig. 11. (a) The Th/Sc vs Zr/Sc plot to show the effect of degree ofreworking on the sediment geochemistry (after McLennan, 2003).The Mujpur sediments plot on the basalt-UCC join, more close toUCC, indicating retention of original characteristics of thesediments. (b) Log rate mol feldspar (dissolution rate) vs. pH plotindicating feldspar remain chemically unaffected by marine action.The figure and data taken from Brantley et al. (2003) and referencestherein.
76 A. Sharma et al. / Geochimica et Cosmochimica Acta 104 (2013) 63–83
Author's personal copy
a subduction setting, instead of generation of a granodioritemelt equilibrated to a mantle source. Mixing between thetwo end-members (mafic and felsic sources) yielding inter-mediate bulk composition in sediments thus show remark-able commonalities indeed to Earth’s magmatic processes.
5.5. Element mobility
In this section, the behavior of selected elements (K, Ba,Sr, Na, Ca and Mg), known to be mobile to extremely mo-
bile during weathering, are addressed in the Mahi catch-ment and the Siwalik system. Because of the abundanceof fine-sand/silt/clay, we assume that the Mahi alluviumand the Siwalik rocks represent bulk suspended load oftheir respective rivers. Interestingly, sediments in the Mahiand Siwaliks are depleted in these elements with respect toUCC (Fig. 14), and may have been lost as dissolved load.
Following Gaillardet et al. (1999), we define the mobilityindices of an element by comparing its concentrations tothat of an immobile element whose magmatic compatibility
Fig. 12. Triangular (a) A–CN–K (b) A–CNK–FM plots of the Mujpur samples (for calculations of A, C, N, K, F and M components, see intext). (a) Samples plot at or about UCC; few samples plot even below upper continental crust (UCC: CIA = �50) indicating presence of maficcomponents. (b) In A–CNK–FM plot, samples cluster halfway of feldspar–biotite join closer to field of basalt, consistent with presence ofbasalt fragments in the samples.
A. Sharma et al. / Geochimica et Cosmochimica Acta 104 (2013) 63–83 77
Author's personal copy
Table 3Geochemical mass balance calculation for the origin of Mujpur sediments and Siwalik siltstone/mudstone.
Tholeiitic basalt (ThoU) Granitoids (BGC$) 45% Tho 50% Tho 55% Tho 65% Tho 75% Tho 85% Tho Mujpur sediments Siwaliks(avg. 10 samples) (avg. 5 samples) (avg.)N (avg.)#
Major element (wt. %)
SiO2 53.0 77.4 66.4 65.2 64.0 61.5 59.1 56.6 57.4 65.4TiO2 1.46 0.25 0.80 0.86 0.92 1.04 1.16 1.28 1.65 0.73Al2O3 13.1 11.7 12.3 12.4 12.5 12.6 12.8 12.9 12.6 15.8FeOt 13.6 0.85 6.59 7.23 7.86 9.14 10.4 11.7 7.69 5.88MnO 0.21 0.02 0.11 0.12 0.13 0.15 0.16 0.18 0.11 0.06MgO 6.29 0.52 3.12 3.41 3.69 4.27 4.85 5.42 2.27 2.59CaO 7.81 0.93 4.03 4.37 4.71 5.40 6.09 6.78 5.04 1.60Na2O 3.02 4.64 3.91 3.83 3.75 3.59 3.43 3.26 1.99 0.65K2O 0.97 1.59 1.31 1.28 1.25 1.19 1.13 1.06 1.69 3.04P2O5 0.15 0.05 0.10 0.10 0.11 0.12 0.13 0.14 0.16 0.09
Trace elements (ppm)
Cr 256 4.20 118 130 143 168 193 218 294 150Ni 98.8 2.03 45.6 50.4 55.3 64.9 74.6 84.3 38.5 57.7Sr 169 81.0 120 125 129 138 147 155 183 87.1Rb 30.4 27.8 29.0 29.1 29.2 29.5 29.8 30.0 68.4 140Ba 251 265 259 258 257 256 255 253 192 474Th 5.10 14.0 10.0 9.55 9.11 8.22 7.33 6.44 9.60 14.2Zr 146 206 179 176 173 167 161 155 210 232La 19.4 30.2 25.3 24.8 24.3 23.2 22.1 21.0 32.1 47.0Sm 4.82 5.27 5.07 5.05 5.02 4.98 4.93 4.89 6.15 7.92Eu 1.49 1.00 1.22 1.25 1.27 1.32 1.37 1.42 1.37 1.53Yb 2.29 2.07 2.17 2.18 2.19 2.21 2.24 2.26 2.54 2.95
Nthis work; #avg. 51 samples for major & trace elements and avg. 22 for REE (Sinha et al., 2007); U and $: Ahmad and Tarney (1994).
78A
.S
harm
aet
al./G
eoch
imica
etC
osm
och
imica
Acta
104(2013)
63–83
Author's personal copy
is close to that of the given element. The mobility indices ofan element are defind taking source rocks as Deccan LIPbasalts of well known composition (Vijay Kumar et al.,2010) for the Mahi sediments, and UCC-type source forthe Siwalik rocks (Sinha et al., 2007). The mobility indices(aE) for elements, as follows:
For Mahi alluvium For Siwalik rocks
aK = [Th/K]mahi/[Th/K]Deccan basalt aK = [Th/K]siwa/[Th/K]ucc
aBa = [Th/Ba]mahi/[Th/Ba]Deccan
basalt
aBa = [Th/Ba]siwa/[Th/Ba]ucc
aSr = [Nd/Sr]mahi/[Nd/Sr]Deccan basalt aSr = [Nd/Sr]siwa/[Nd/Sr]ucc
aNa = [Sm/Na]mahi/[Sm/Na]Deccan
basalt
aNa = [Sm/Na]siwa/[Sm/Na]ucc
aCa = [Ti/Ca]mahi/[Ti/Ca]Deccan basalt aCa = [Ti/Ca]siwa/[Ti/Ca]ucc
aMg = [Al/Mg]mahi/[Al/Mg]Deccan
basalt
aMg = [Al/Mg]siwa/[Al/Mg]ucc
When there is no net chemical weathering, aE = 1. A va-lue of >1 means a depletion with respect to source Deccanbasalts (for Mahi samples), and the UCC (for Siwaliksamples), and a value <1 means enrichment. The normali-zation to immobile elements removes the variations in abso-lute concentrations in suspended sediments, which mayarise due to dilution by organic particulates or quartz.The quantitative results thus obtained are plotted inFig. 16.
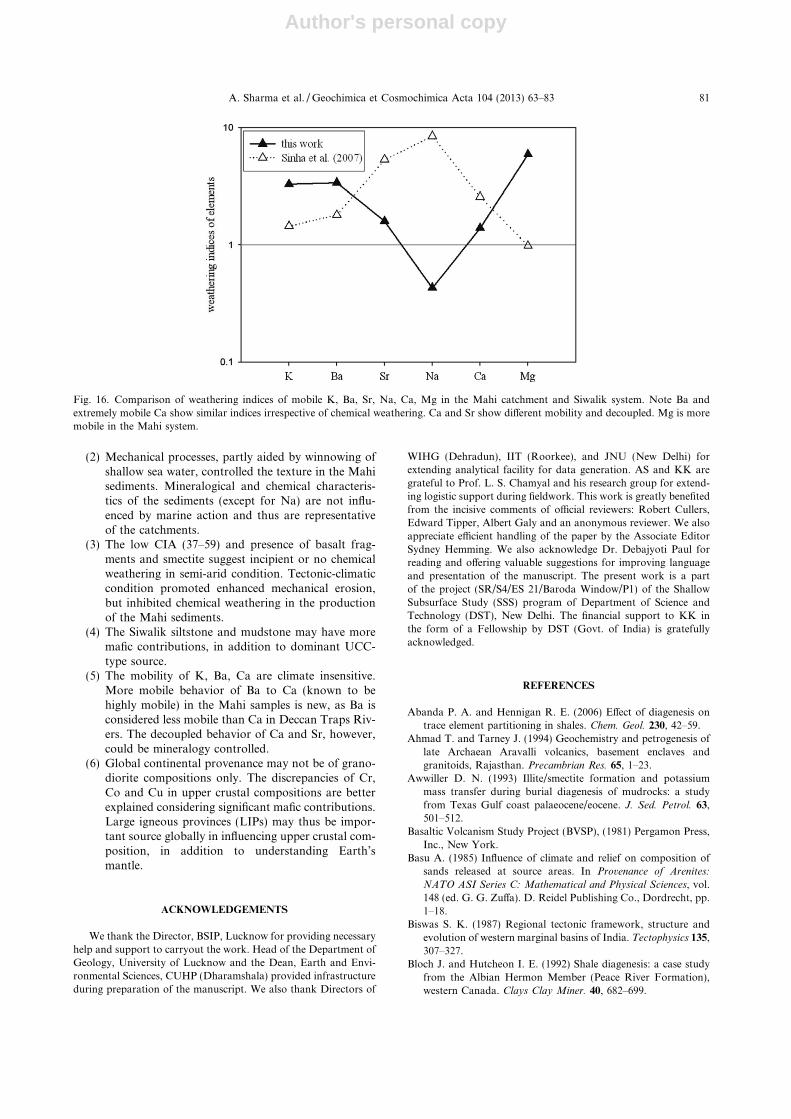
The order of decreasing mobility is Ba P K > Ca(Fig. 16). The K, Ba, and Ca values show limited depletionin both the Mahi and Siwalik systems, although these sam-ples have different weathering indices (CIA: 47.5 for Mahivs. 69 for Siwaliks). The mobility of K, Ba, and Ca maytherefore be climate insensitive. The more mobile behaviorof Ba to Ca (known to be highly mobile) in the Mahi sam-ples is surprising, as Ba is less mobile than Ca in DeccanTraps Rivers (see Das and Krishnaswami, 2006). Incipientweathering of pyroxene + plagioclase in the Mahi catch-ment perhaps causes Ca to be retained in the system. Alter-natively, Ba may be more mobile in the Mahi thansuggested for the Deccan Traps rivers, more similar to the
Yamuna (Dalai et al., 2002) and Gomti Rivers (MunendraSingh, pers. com.) in northern India.
The behavior of Mg and Na, two known extremely mo-bile elements is still more interesting. In our samples, Mg isextremely depleted even in a weathering-limited condition.On the other hand, there is hardly any net gain or loss forMg in the transport-limited Siwaliks. This may suggest insen-sitivity of Mg to climate too. Alternatively, the Mg behaviormay be attributed to the enhanced contribution of an Mg-rich source (mafic) for the Siwaliks. The extreme Na mobilityin the Siwalik sediments, unlike in the Mahi, is in agreementwith general expectations. The Na-enrichment in our samplesis likely due to interactions with sea water in estuarine condi-tions that might have adsorbed to the detritus.
Plagioclase may control both Ca and Sr distributions inthe samples. The Pyroxenes and biotite, have Ca, but insig-nificant Sr (KdSr < 1) (Hanson, 1978). Decoupled behavior
Fig. 13. (a) Th–La–Ni diagram showing samples plot towards La–Ni side, but clearly away from Th (felsic source), (b) Mujpur samples plotwithin the field of tholeiite basalt. Sources: Tholeiitic basalt and granitoid (Ahmad and Tarney, 1994).
Fig. 14. Multi-element primitive upper mantle (PUM)-normalizedpattern for the Mujpur and Siwalik samples. Note that the Siwaliksiltstone are enriched in LIL and rare earth elements, but depleted inmore compatible elements (Cr, Co, Cu) in comparison to the Mujpuralluvial samples. The negative anomalies of Ba, Sr, Na and Ca arecharacteristics of both plots (see text for details). Upper continentalcrust (UCC: Rudnick and Gao, 2003) is plotted for comparison.Composition of the Siwalik rocks from Sinha et al. (2007). PUM(primitive upper mantle) taken from Palme and O’Neill (2003).
A. Sharma et al. / Geochimica et Cosmochimica Acta 104 (2013) 63–83 79
Author's personal copy
of Ca and Sr (see in Section 5.4) may therefore be related topyroxene and biotite in the sources.
6. CONCLUDING REMARKS
(1) The Mahi sediments are lithiarenite and are com-posed of quartz + basalt fragments + pyrox-ene + biotite + feldspar + minor calcite + smec-
tite + illite. These samples have FeOt (610.9 wt.%),TiO2 (62.41 wt.%), Al2O3 (615.16 wt.%), Cr(6737 ppm) higher than the UCC and PASS; Ni(654 ppm) higher than the UCC (33.5 ppm), butclose to PAAS (60 ppm). About 70–75% Deccan bas-alts and �25–30% biotite-rich granitoid (BandedGneissic Complex: BGC) mixture reasonably explainthe composition of the bulk Mahi sediment.
Fig. 15. (a) on Th–La–Sc diagram, Mujpur bulk samples plot closer to granodiorite. Intermediate compositions of the Mujpur samplesattributable to mixing between the Deccan basalts and biotite-rich granitoid sources (see text). Spread of Siwalik rocks between granite andgranodiorite compositions (closer to UCC) indicate dominant contributions of UCC-type sources. (b) On Th/Sc and Eu/Eu* diagram, Mujpuralluvium show more affinity to granodiorite-tonalite (more mafic) compared to UCC, whereas Siwalik rocks plot closer to UCC with fewsamples near granite source. Low Th/Sc (0.3–0.4) in Mujpur alluvium compared to the Siwalik rocks suggest more mafic contributions.
80 A. Sharma et al. / Geochimica et Cosmochimica Acta 104 (2013) 63–83
Author's personal copy
(2) Mechanical processes, partly aided by winnowing ofshallow sea water, controlled the texture in the Mahisediments. Mineralogical and chemical characteris-tics of the sediments (except for Na) are not influ-enced by marine action and thus are representativeof the catchments.
(3) The low CIA (37–59) and presence of basalt frag-ments and smectite suggest incipient or no chemicalweathering in semi-arid condition. Tectonic-climaticcondition promoted enhanced mechanical erosion,but inhibited chemical weathering in the productionof the Mahi sediments.
(4) The Siwalik siltstone and mudstone may have moremafic contributions, in addition to dominant UCC-type source.
(5) The mobility of K, Ba, Ca are climate insensitive.More mobile behavior of Ba to Ca (known to behighly mobile) in the Mahi samples is new, as Ba isconsidered less mobile than Ca in Deccan Traps Riv-ers. The decoupled behavior of Ca and Sr, however,could be mineralogy controlled.
(6) Global continental provenance may not be of grano-diorite compositions only. The discrepancies of Cr,Co and Cu in upper crustal compositions are betterexplained considering significant mafic contributions.Large igneous provinces (LIPs) may thus be impor-tant source globally in influencing upper crustal com-position, in addition to understanding Earth’smantle.
ACKNOWLEDGEMENTS
We thank the Director, BSIP, Lucknow for providing necessaryhelp and support to carryout the work. Head of the Department ofGeology, University of Lucknow and the Dean, Earth and Envi-ronmental Sciences, CUHP (Dharamshala) provided infrastructureduring preparation of the manuscript. We also thank Directors of
WIHG (Dehradun), IIT (Roorkee), and JNU (New Delhi) forextending analytical facility for data generation. AS and KK aregrateful to Prof. L. S. Chamyal and his research group for extend-ing logistic support during fieldwork. This work is greatly benefitedfrom the incisive comments of official reviewers: Robert Cullers,Edward Tipper, Albert Galy and an anonymous reviewer. We alsoappreciate efficient handling of the paper by the Associate EditorSydney Hemming. We also acknowledge Dr. Debajyoti Paul forreading and offering valuable suggestions for improving languageand presentation of the manuscript. The present work is a partof the project (SR/S4/ES 21/Baroda Window/P1) of the ShallowSubsurface Study (SSS) program of Department of Science andTechnology (DST), New Delhi. The financial support to KK inthe form of a Fellowship by DST (Govt. of India) is gratefullyacknowledged.
REFERENCES
Abanda P. A. and Hennigan R. E. (2006) Effect of diagenesis ontrace element partitioning in shales. Chem. Geol. 230, 42–59.
Ahmad T. and Tarney J. (1994) Geochemistry and petrogenesis oflate Archaean Aravalli volcanics, basement enclaves andgranitoids, Rajasthan. Precambrian Res. 65, 1–23.
Awwiller D. N. (1993) Illite/smectite formation and potassiummass transfer during burial diagenesis of mudrocks: a studyfrom Texas Gulf coast palaeocene/eocene. J. Sed. Petrol. 63,
501–512.
Basaltic Volcanism Study Project (BVSP), (1981) Pergamon Press,Inc., New York.
Basu A. (1985) Influence of climate and relief on composition ofsands released at source areas. In Provenance of Arenites:
NATO ASI Series C: Mathematical and Physical Sciences, vol.148 (ed. G. G. Zuffa). D. Reidel Publishing Co., Dordrecht, pp.
1–18.
Biswas S. K. (1987) Regional tectonic framework, structure andevolution of western marginal basins of India. Tectophysics 135,
307–327.
Bloch J. and Hutcheon I. E. (1992) Shale diagenesis: a case studyfrom the Albian Hermon Member (Peace River Formation),western Canada. Clays Clay Miner. 40, 682–699.
Fig. 16. Comparison of weathering indices of mobile K, Ba, Sr, Na, Ca, Mg in the Mahi catchment and Siwalik system. Note Ba andextremely mobile Ca show similar indices irrespective of chemical weathering. Ca and Sr show different mobility and decoupled. Mg is moremobile in the Mahi system.
A. Sharma et al. / Geochimica et Cosmochimica Acta 104 (2013) 63–83 81
Author's personal copy
Bock B., McLennan S. M. and Hanson G. N. (1998) Geochemistryand provenance of the Middle Ordovician Austin Glen Member(Normanskill Formation) and the Taconian Orogeny in NewEngland. Sedimentology 45, 635–655.
Brantley S. L. (2003) Reaction kinetics of primary rock formingminerals under ambient conditions. Treatise on Geochemistry.ISBN (set): 0-08-043751-6, 5 (ISBN: 0-08-0044340-0). pp. 73–117.
Brugmann G. E., Arndt N. T., Hofmann A. W. and Tobschall H. J.(1987) Noble metal abundances in komatiite suites from Alexo,Ontario and Gorgona Island, Colombia. Geochim. Cosmochim.
Acta 51, 2159–2169.
Bryan S. E. and Ernst R. (2007) Revised definition of large igneousprovinces (LIPs). Earth Sci. Rev. 86(1–4), 175–202.
Chakraborty T. and Sensarma S. (2008) Shallow marine andcoastal aeolian quartz arenite in the Neoarchaean-Palaeopro-terozoic Karutola Formation, Dongargarh volcano-sedimen-tary succession, central India. Precambrian Res. 162, 284–301.
Chamyal L. S., Maurya D. M. and Raj R. (2003) Fluvial system ofdry lands of western India: a synthesis of late quaternarypalaeoenvironmental and tectonic changes. Quatern. Int. 104,
69–86.
Condie K. C. (1993) Chemical composition and evolution of theupper continental crust: contrasting results from surface sam-ples and shales. Chem. Geol. 104, 1–37.
Cox R. and Lowe D. (1995) A conceptual review of regional-scalecontrols on the composition of clastic sediment and the co-evolution of continental blocks and their sedimentary cover. J.
Sed. Res. 65, 1–12.
Dalai T. K., Krishnaswami S. and Sarin M. M. (2002) Major ionchemistry in the headwaters of the Yamuna River System:chemical weathering, its temperature dependence and CO2
consumption in the Himalaya. Geochim. Cosmochim. Acta 66,
3397–3416.
Das A. and Krishnaswami S. (2007) Elemental geochemistry ofriver sediments from the Deccan Traps, India: implications tosources of elements and their mobility during basalt–waterinteraction. Chem. Geol. 242, 232–254.
Das A., Krishnaswami S., Sarin M. M. and Pande K. (2005)Chemical weathering in the Krishna Basin and Western Ghatsof the Deccan Traps, India: rates of basalt weathering and theircontrols. Geochim. Cosmochim. Acta 69, 2067–2084.
Das A. and Krishnaswami S. (2006) Barium in Deccan BasaltRivers: its abundance, relative mobility and flux. Aquat.
Geochem. 12, 221–238.
Day P. R. (1965) Particle fractionation and particle-size analysis. InMethods of Soil Analysis (eds. C.A. Black, et al). Agronomy 9,545–577. Am. Soc. Agron. Inc., Madison, WI.
Dessert C., Dupre B., Francois L. M., Schott J., Gaillardet J.,Chakrapani G. and Bajpai S. (2001) Erosion of Deccan Trapsdetermined by river geochemistry: impact on the global climateand the 87Sr/86Sr ratio of sea water. Earth Planet. Sci. Lett.
188, 459–474.
Dessert C., Dupre B., Gaillardet J., Francois L. M. and Allegre C.J. (2003) Basalt weathering laws and the impact of basaltweathering on the global carbon cycle. Chem. Geol. 20, 1–17.
France-Lanord C. and Derry L. A. (1997) OC burial forcing of thecarbon cycle from the Himalayan erosion. Nature 390(9), 65–
67.
Gaillardet J., Dupre B. and Allegre C. J. (1999) Global silicateweathering and CO2 consumption rates deduced from thechemistry of large rivers. Chem. Geol. 159, 3–30.
Galy A. and France-Lanord C. (2001) Higher erosion rates in theHimalaya: geochemical constraints on riverine fluxes. Geology
29, 23–26.
Garver J. I., Royce P. R. and Smick T. A. (1996) Chromium andNickel in shale of the Taconic foreland: a case study for the
provenance of fine-grained sediments with an ultramaficssource. J. Sed. Res. 100, 100–106.
Gupta H. and Chakrapani G. J. (2005) Temporal and spatialvariations in water flow and sediment load in Narmada RiverBasin, India: natural and man-made factors. Environ. Geol. 48,
579–589.
Gupta H. and Chakrapani G. J. (2007) Temporal and spatialvariations in water flow and sediment load in Narmada RiverBasin, India: natural and man-made factors. Curr. Sci. 92(5),
679–684.
Gupta H., Chakrapani G. J., Kandasamy S. and Shuh-ji Kao.(2011) The fluvial geochemistry, contributions of silicate,carbonate and saline–alkaline components to chemical weath-ering flux and controlling parameters: Narmada River (DeccanTraps), India. Geochim. Cosmochim. Acta 75, 800–824.
Hanson G. N. (1978) The application of trace elements to thepetrogenesis of igneous rocks of granitic compositions. Earth
Planet. Sci. Lett. 38, 26–43.
Hessler A. M. and Lowe D. R. (2006) Weathering and sedimentgeneration in the Archean: an integrated study of the evolutionof the siliciclastic sedimentary rocks of the 3.2 Ga MoodiesGroup, Barberton Greenstone belt, South Africa. Precambrian
Res. 151, 185–210.
Jackson M. L. (1956) Soil Chemical Analysis – Advanced Course.Dept of Soils, Univ. of Wis., Madison 6, Wis. (Published by theAuthor).
Jackson M. L. (1973) Soil Chemical Analysis. Prentice Hall of IndiaPvt. Ltd., New Delhi.
Jaques A. L., Chappel B. W. and Taylor S. R. (1983) Geochemistryof cumulus peridotites and gabbros from the Marum OphioliteComplex, northern Papua New Guinea. Contrib. Mineral.
Petrol. 82, 154–164.
Juyal N., Chamyal L. S., Bhandari S., Bhusan R. and Singhvi A.K. (2006) Continental records of southwest monsoon duringthe last 130 ka: evidence from the southern margin of the TharDesert, India. Quatern. Sci. Rev. 25, 2632–2650.
Khanna P. P., Saini N. K., Mukherjee P. K. and Purohit K. K.(2009) An appraisal of ICP-MS technique for determination ofREEs: long term QC assessment of Silicate rock analysis.Himalayan Geol. 30(1), 95–99.
Knuze G. W. (1965) Pre-treatment for mineralogical Analysis. InMethods of Soil Analysis (eds. C. A. Black, et al). Agronomy 9,568–577. Am. Soc. Agron., Madison, WI.
Krishnaswami S., Trivedi J. R., Sarin M. M., Ramesh R. andSharma K. K. (1992) Strontium isotopes and Rubidium inthe Ganga-Brahmaputra river system: Weathering in theHimalaya, fluxes to the Bay of Bengal and contributions tothe evolution of oceanic 87Sr/86Sr. Earth Planet. Sci. Lett. 109,
243–253.
Kusumgar S., Rachna R., Chamyal L. S. and Yadav M. G. (1998)Holocene Palaeoenvironmental changes in the lower Mahibasin, western India. Radiocarbon 40, 819–823.
Lee C.-T. A., Morton D. M., Little M. G., Kistler R., HorodyskyU. N., Leeman W. P. and Agranier A. (2008) Regulatingcontinental growth and composition by chemical weathering.PNAS 105, 4981–4986.
Lupker M., France-Lanord C., Galy V., Lave J., Gaillardet J.,Gajurel A. P., Cuilmette C., Rahman M., Singh S. K. and SinhaR. (2012) Predominant floodplain over mountain weathering ofHimalayan sediments (Ganga basin). Geochim. Cosmochim.
Acta 84, 410–432.
Maurya D. M., Rachna R. and Chamyal L. S. (2000) History oftectonic evolution of Gujarat alluvial plains, Western India,during Quaternary: a review. J. Geol. Soc. India 55, 343–363.
McDonough W. F. and Sun S.-s. (1995) The composition of theearth. Chem. Geol. 120, 223–253.
82 A. Sharma et al. / Geochimica et Cosmochimica Acta 104 (2013) 63–83
Author's personal copy
McLennan S. M. (1989) Rare earth elements in sedimentary rocks:influence of provenance and sedimentary processes. In Geo-
chemistry and Mineralogy of Rare Earth Elements (eds. B. R.Lipin and G. A. Mackay). Mineralogical Society of America,
pp. 69–200.
McLennan S. M. (2001) Relationships between the trace elementcomposition of sedimentary rocks and upper continental crust.Geochem. Geophys. Geosys. 2, 2000GC00109.
McLennan S. M. (2003) Sedimentary silica on Mars. Geology 31,
315–318.
Merh S. S. (1995) Geology of Gujarat. J. Geol. Soc. India, 222p.Nesbitt H. W. and Young G. M. (1984) Prediction of some
weathering trends of plutonic and volcanic rocks based onthermodynamic and kinetic considerations. Geochim. Cosmo-
chim. Acta 54, 1523–1534.
Nesbitt H. W. and Young G. M. (1989) Formation and diagenesisof weathering profiles. J. Geol. 97, 129–147.
Palme H. and O’Neill H. St. C. (2003) Cosmochemical estimates ofmantle composition. Treatise on Geochemistry. ISBN (set): 0-08-043751-6, 2 (ISBN: 0-08-044337-0). pp. 1–38.
Pettijohn F. J., Potter P. E. and Siever R. (1972) Sand and
Sandstones. Springer-Verlag, New York.Piper D. Z. (1974) Rare Earth elements in the sedimentary cycles: a
summary. Chem. Geol. 14, 285–304.
Purohit K. K., Saini N. K. and Khanna P. P. (2010) Geochimicaldispersion pattern of heavy metal abundances in the intermon-tane Pinjaur Dun, Sub-Himalaya. Himalayan Geol. 31(1), 29–
34.
Rachna R., Maurya D. M. and Chamyal L. S. (1999) Tectoniccontrol on distribution and evolution of Ravines in the lowerMahi valley, Western India. J. Geol. Soc. India 52, 669–674.
Reubi O. and Blundy J. (2009) A dearth of intermediate melts atsubduction zone volcanoes and the petrogenesis of arc ande-sites. Nature 461, 1269–1273.
Rudnick R. L. (1995) Making continental crust. Nature 378, 571–
578.
Rudnick R. L. and Gao S. (2003) Composition of the continentalcrust. Treatise on Geochemistry. ISBN (set): 0-08-043751-6, 3(ISBN: 0-08-0044338-9). pp. 1–64.
Saini N. K., Mukherjee P. K., Rathi M. S. and Khanna P. P. (2000)Evaluation of energy dispersive X-ray fluorescence spectrome-try in the analysis of silicate rocks using pressed powder pellets.X-Ray Spectrom. 29, 166–172.
Sarin M. M., Krishnaswami S., Dilli K., Somayajulu B. L. K. andMoore W. S. (1989) Major ion chemistry of the Ganga–Brahmaputra river system: weathering processes and fluxes tothe Bay of Bengal. Geochim. Cosmochim. Acta 53, 997–1009.
Sensarma S. (2007) A bimodal large igneous province and theplume debate: the Palaeoproterozoic Dongargarh Group,Central India. Geol. Soc. Am. Spec. Pap. 430, 831–839.
Sensarma S., Rajamani V. and Tripathi J. K. (2008) Petrographyand geochemical characteristics of the sediments of the smallRiver Hemavati, Southern India: implication for provenanceand weathering processes. Sed. Geol. 205, 111–125.
Shapiro L. and Brannock W. W. (1962) Rapid analysis of silicate,carbonate and phosphate rocks. US Geol. Surv. Bull. 48, 49–55.
Sharma A. and Rajamani V. (2001) Weathering of charnockite andsediment production in the catchment area of the CauveryRiver, southern India. Sed. Geol. 143, 169–184.
Sharma A., Singh A. and Kumar K. (2012) Environmentalgeochemistry and quality assessment of surface and subsurfacewater of Mahi River basin, western India. J. Environ. Earth Sci.
65(4), 1231–1250.
Sharma S. K. and Subramanian V. (2008) Hydrochemistry of theNarmada and Tapti Rivers, India. Hydrol. Process. 22, 3444–
3455.
Sheth H. C. (2007) Large igneous provinces (LIPs): definition,recommended terminology, and a hierarchical classification.Earth Sci. Rev. 85(3–4), 117–124.
Singh P. and Rajamani V. (2001) REE geochemistry of recentclastic sediments from the Cauveri floodplain, southern India:implication to source area weathering and sedimentary pro-cesses. Geochim. Cosmochim. Acta 65, 3093–3108.
Singh S. K., Kumar A. and France-Lanord C. (2006) Sr and87Sr/86Sr in waters and sediments of the Brahmaputra riversystem: silicate weathering, CO2 consumption and Sr flux.Chem. Geol. 234, 308–320.
Singh S. K., Rai S. K. and Krishnaswami S. (2008) Sr and Ndisotopes in river sediments from the Ganga Basin: sedimentprovenance and spatial variability in physical erosion. J.
Geophys. Res. 113, F03006. http://dx.doi.org/10.1029/
2007JF000909.
Sinha S., Islam R., Ghosh S. K., Kumar Rohta and Sangode S. J.(2007) Geochemistry of Neogene Siwalik mudstone alongPunjab re-entrant, India: implication for source-area weath-ering, provenance and tectonic setting. Curr. Sci. 92(8), 1103–
1113.
Stallard R. F. and Edmond J. M. (1983) Geochemistry of theAmazon: 2. The influence of geology and weathering environ-ment on dissolved load. J. Geophys. Res. 88, 9671–9688.
Stork A. L., Smith D. K. and Gill J. B. (1987) Evaluation ofgeochemical reference standards by X-ray fluorescence analysis.Geostand. Newslett. 11, 107–113.
Suttner L. J. (1974) Sedimentary petrographic provinces: anevaluation. In Paleogeographic Provinces and Provinciality (ed.C. A. Ross). SEPM Spec. Publ. 21, 75–84.
Tandon S. K., Jain M. and Singhvi A. K. (1999) Comparativedevelopment of mid to late quaternary fluvial and Fluvio–aeolian stratigraphy in the Luni, Sabarmati and Mahi riverbasin of western India. Gond. Geol. Mag. Spec. Vol. 4, 1–16.
Tanner C. B. and Jackson M. L. (1947) Monographs of sedimen-tation times for soil particles under gravity or centrifugalacceleration. Proc. Soil. Sci. Soc. Am. 12, 50–55.
Taylor S. R. and McLennan S. M. (1985) The continental crust: its
composition and evolution. Blackwell, Malden, MA, 312 pp.Vijay Kumar K., Chavan C., Sawant S., Naga Raju. K., Kanak-
dande P., Patode S., Deshpande K., Krishnamacharyulu S. K.G., Vaideswaran T. and Balaram V. (2010) Geochemicalinvestigation of a semi-continuous extrusive basaltic sectionfrom the Deccan Volcanic Province, India: implications for themantle and magma chamber processes. Contrib. Mineral.
Petrol. 159, 839–862.
Whitmore G. P., Crook K. A. W. and Johnson D. (2004) Grain sizecontrol of mineralogy and geochemistry in modern riversediment, New Guinea collision, Papua New Guinea. Sed.
Geol. 171, 129–157.
Associate editor: Sidney Hemming
A. Sharma et al. / Geochimica et Cosmochimica Acta 104 (2013) 63–83 83