FRONTIER · Page 2 Dear Fellow Shareholder Frontier Resources Ltd is a successful, innovative and...
110
Transcript of FRONTIER · Page 2 Dear Fellow Shareholder Frontier Resources Ltd is a successful, innovative and...


Page 1
FRONTIER RESOURCES LTD ABN 96 095 684 389
CONTENTS
Chairman’s Letter .............................................................................................. 2
Review of Operations & Activities ........................................................................... 6
Directors’ Report .............................................................................................. 50
Auditor’s Independence Declaration ....................................................................... 63
Corporate Governance Statement .......................................................................... 64
Financial Report…………… ..................................................................................... 70
Directors’ Declaration ...................................................................................... 105
Independent Audit Report ................................................................................. 106
Schedule of Tenements .................................................................................... 108
Shareholder Information ................................................................................... 109
CORPORATE DIRECTORY
Managing Director & Chairman
Peter A. McNeil
Non-Executive Director
Graham J. Fish
Non-Executive Director
Warren J. Staude
Non-Executive Director
Hugh David Swain
Company Secretaries
Jay Stephenson
Julia Beckett
Stock Exchange
Australian Securities Exchange – FNT
German Stock Exchange – TG5
Principal Office
120 Tranquil Place
Stoneville WA 6081
Australia
Telephone: (08) 9295 0388
Facsimile: (08) 9295 3480
Registered Office
Level 4, 66 Kings Park Road
West Perth WA 6005
Australia
Telephone: (08) 6141 3500
Facsimile: (08) 6141 3599
Email: [email protected]
Website: www.frontierresources.com.au
Postal Address:
PO Box 52
West Perth WA 6872
Australia
Share Registry
Computershare Investor
Services Pty Limited
Level 2, 45 St Georges Terrace
PERTH WA 6000
Auditors
BDO Audit (WA) Pty Ltd
38 Station Street
Subiaco WA 6008
Bankers
Westpac Banking Corporation
1/100 Bundall Road
Bundall, QLD 4217
Lawyers
Steinepreis Paganin
Level 4, 16 Milligan Street
Perth, WA 6000
Page 2
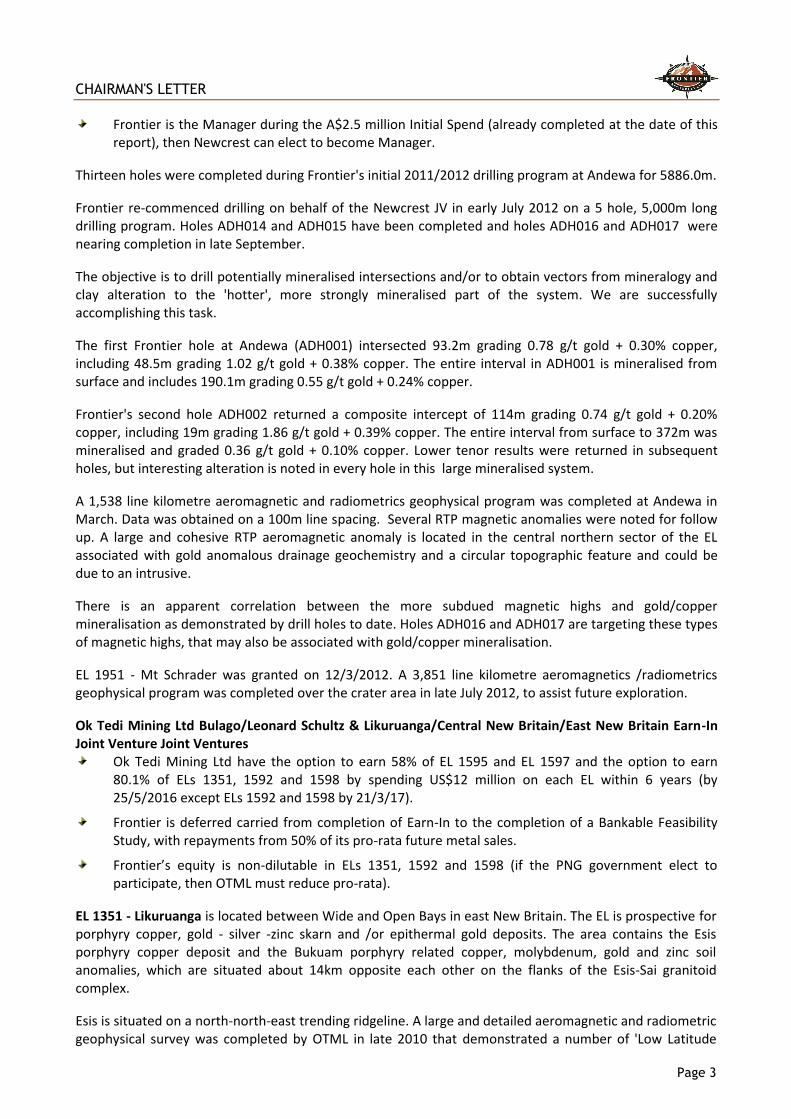
Dear Fellow Shareholder
Frontier Resources Ltd is a successful, innovative and socially responsible junior mineral explorer that had a very successful 2011/2012 focussed on a highly prospective portfolio of porphyry copper- gold -molybdenum, porphyry gold, mesothermal and epithermal gold targets in Exploration Licences in Papua New Guinea.
Ok Tedi Mining Ltd and Newcrest Mining Ltd are in Earn-In Joint Ventures, spending potentially $80 million total on 3 Agreements covering 7 ELs /~ 5,300 km
2. The Newcrest Agreement was signed in June 2012.
Frontier also owns 100% of the Sudest high grade gold EL.
The Tasmanian exploration and development assets will be de-merged from FNT (via an in-species distribution Frontier’s shareholders) through 100% owned Torque Mining Ltd. Torque raised $1.05 million in seed capital with the intent of listing on the ASX in late 2012. Frontier also maintains a 10% free carried interest to completion of Bankable Feasibility Study in all its former Tasmanian licences (except the SMRV).
Extensive and highly successful exploration was conducted by Frontier during 2011/2012 at the Andewa Project drilling wide intercepts of low grade porphyry gold and copper mineralisation.
Frontier/Torque were also very active exploring in Tasmania, drilling excellent results at the Stormont Deposit and converting the associated Inferred Resource to a comparable amount of Indicated Resource.
A large ~25km2 3D-IP grid was completed at the Moina Project, demonstrating excellent chargeability,
conductivity and resistivity anomalies that variously correspond to known gold and base metal mineralisation. A VTEM electromagnetic survey flown over the entire SMRV project area
Frontier and Torque own and operate five and three diamond drill rigs respectively, plus earthmoving and support equipment that is used to cost effectively locate and delineate precious and base metal mineralisation.
A brief summary of exploration completed during the period is included below.
EL 1594 - Sudest EL 1594 - Sudest is 100% owned and is located in the Misima Mine Gold Corridor in eastern Papua New Guinea. No drilling has ever been completed, even though alluvial gold was first discovered in PNG here in 1888 and 2 small high-grade gold hard rock mines have operated historically.
Exploration was initiated immediately after granting in mid-2012 with hand trenching and 2 soil grids covering ~6 km2. Assay results from the 2,825 soil samples are yet be finalised but are delineating significant and cohesive gold anomalies. Frontier demonstrated a rock assay grading 256 g/t gold with 19 g/t silver and located coarse visible gold in outcrop at the Adelaide Prospect.
Newcrest Mining Ltd Andewa /Schrader Earn-In Joint Venture A Farm-in Agreement with Newcrest Mining was finalised on June 17th, 2012, regarding EL 1345 -
Andewa and EL 1951 - Mt Schrader.
Newcrest Mining Ltd can earn 60% interest in EL 1345 - Andewa and EL 1951 - Schrader by sole funding A$15.25 million and $4.0 million of exploration expenditure for the projects by 31/12/2015 and 11/3/2016, respectively.
After Earn-In, Frontier may elect to be deferred carried to completion of a Feasibility Study, repayable from 50% of pro-rata mine profit.
A$1.915 million was reimbursed for actual exploration expenditure incurred since 1 January 2012 including Frontier's commercial drilling and equipment lease costs.
After Earn-in, Newcrest may acquire an additional 12% equity in the project prior to the 'Decision to Mine' for a formula based payment relating to the feasibility study's estimated reserves and resources.
CHAIRMAN'S LETTER
Page 3
Frontier is the Manager during the A$2.5 million Initial Spend (already completed at the date of this report), then Newcrest can elect to become Manager.
Thirteen holes were completed during Frontier's initial 2011/2012 drilling program at Andewa for 5886.0m.
Frontier re-commenced drilling on behalf of the Newcrest JV in early July 2012 on a 5 hole, 5,000m long drilling program. Holes ADH014 and ADH015 have been completed and holes ADH016 and ADH017 were nearing completion in late September.
The objective is to drill potentially mineralised intersections and/or to obtain vectors from mineralogy and clay alteration to the 'hotter', more strongly mineralised part of the system. We are successfully accomplishing this task.
The first Frontier hole at Andewa (ADH001) intersected 93.2m grading 0.78 g/t gold + 0.30% copper, including 48.5m grading 1.02 g/t gold + 0.38% copper. The entire interval in ADH001 is mineralised from surface and includes 190.1m grading 0.55 g/t gold + 0.24% copper.
Frontier's second hole ADH002 returned a composite intercept of 114m grading 0.74 g/t gold + 0.20% copper, including 19m grading 1.86 g/t gold + 0.39% copper. The entire interval from surface to 372m was mineralised and graded 0.36 g/t gold + 0.10% copper. Lower tenor results were returned in subsequent holes, but interesting alteration is noted in every hole in this large mineralised system.
A 1,538 line kilometre aeromagnetic and radiometrics geophysical program was completed at Andewa in March. Data was obtained on a 100m line spacing. Several RTP magnetic anomalies were noted for follow up. A large and cohesive RTP aeromagnetic anomaly is located in the central northern sector of the EL associated with gold anomalous drainage geochemistry and a circular topographic feature and could be due to an intrusive.
There is an apparent correlation between the more subdued magnetic highs and gold/copper mineralisation as demonstrated by drill holes to date. Holes ADH016 and ADH017 are targeting these types of magnetic highs, that may also be associated with gold/copper mineralisation.
EL 1951 - Mt Schrader was granted on 12/3/2012. A 3,851 line kilometre aeromagnetics /radiometrics geophysical program was completed over the crater area in late July 2012, to assist future exploration.
Ok Tedi Mining Ltd Bulago/Leonard Schultz & Likuruanga/Central New Britain/East New Britain Earn-In Joint Venture Joint Ventures
Ok Tedi Mining Ltd have the option to earn 58% of EL 1595 and EL 1597 and the option to earn 80.1% of ELs 1351, 1592 and 1598 by spending US$12 million on each EL within 6 years (by 25/5/2016 except ELs 1592 and 1598 by 21/3/17).
Frontier is deferred carried from completion of Earn-In to the completion of a Bankable Feasibility Study, with repayments from 50% of its pro-rata future metal sales.
Frontier’s equity is non-dilutable in ELs 1351, 1592 and 1598 (if the PNG government elect to participate, then OTML must reduce pro-rata).
EL 1351 - Likuruanga is located between Wide and Open Bays in east New Britain. The EL is prospective for porphyry copper, gold - silver -zinc skarn and /or epithermal gold deposits. The area contains the Esis porphyry copper deposit and the Bukuam porphyry related copper, molybdenum, gold and zinc soil anomalies, which are situated about 14km opposite each other on the flanks of the Esis-Sai granitoid complex.
Esis is situated on a north-north-east trending ridgeline. A large and detailed aeromagnetic and radiometric geophysical survey was completed by OTML in late 2010 that demonstrated a number of 'Low Latitude
Figure 6
CHAIRMAN'S LETTER
Page 4
Total Magnetic Intensity Anomalies' that represent probable intrusives. Multiple, extensive and strong copper and gold anomalous soil and trench zones have been demonstrated in previous exploration with mineralisation in quartz-diorite and magnetite breccias.
The first diamond core hole of the planned drilling program on EL 1351 was terminated at 697.6m in copper mineralisation, due to depth limitations of the drilling rig. The hole was vertical and located on the same drill pad as MD23; it was designed to confirm the historic near surface mineralisation and to test the depth extent of the system.
The drilling has now demonstrated multiple zones of porphyry copper mineralisation extending over a +1,100m strike length in drill holes that is open in all directions and in multiple zones. Ten holes have now been completed for 6,155m, hole NBE011 was abandoned and drilling continues on holes 12 and 13.
Mineralisation demonstrated at Esis during 2011/2012 includes: 238m grading 0.37% copper (from 3m to 241m) NBE001.
306.8m grading 0.28% copper (from 18m to 324.8m) NBE005.
184m grading 0.30% copper (from 2m to 186m) NBE002.
199m grading 0.28% copper( from 0m to 199m) NBE003.
EL 1595 - Bulago is located between the OK-Tedi and Porgera Deposits. Targets are very high-grade epithermal and skarn gold and bulk mineable porphyry and intrusive related gold deposits. The Suguma and Funutu Prospects have at least 10 locations with very high-grade gold in outcrop channel samples with multiple orientations of mineralisation.
The prospects are located in a 4.5km x 6km well-defined gold, zinc and copper drainage anomaly covering a recessive intrusive in a sub-circular drainage basin, with anomalism continuing up to the peripheral limestones.
Nine holes have been completed by OTML at Bulago for 3,302.9m, with 2 of those (591.9m) completed at high grade gold Suguma Prospect. Hole BUL001 was drilled to its design depth of 440m to test an aeromagnetic anomaly for porphyry copper-gold mineralisation; it returned weighted average intercepts of 124m grading 0.13 % copper + 0.06 g/t gold (from 119 to 243m) plus 76.1m grading 0.15% copper + 0.16 g/t gold (from 267 to 343.1m). Assay results are awaited for the remaining holes. The geochemistry indicates two possible mineralisation events, a copper event with some gold and a gold only event.
The high-grade gold mineralised Lower and Upper Horizons at Suguma were channel chip outcrop sampled and subsequently drilled by the JV with one vertical and one angled diamond core hole to evaluate those targets. OTML's weighted average gold and silver channel outcrop assays for the Suguma Lower Gold Horizon was 15m grading 24.7 g/t gold + 47 g/t silver + 2.08% zinc, compared to Frontier’s 18 metres grading 40.3 g/t gold + 32 g/t silver + 1.13% zinc. The next interval to be sampled should have been Frontier's 9m of 173 g/t gold + 60 g/t silver that was also open ended to the north.
EL 1597 - Leonard Schultz is located in NW PNG, about 65km along the Leonard Schultz fault zone to the east of the massive Frieda River porphyry copper deposits. Assay results from the infill-extension soil sampling program have confirmed a sizeable continuous copper anomaly over the southern half of the grid established by Frontier in 2010. Infill work is continuing and areas of stockwork quartz veining, mainly in sediments but also in intrusive have been recorded.
EL 1592 - East New Britain covers much of the Gazelle Peninsula in eastern New Britain Province. Targets are high-grade epithermal and skarn gold, bulk mineable intrusive related gold and porphyry copper-gold deposits. A large aeromagnetic and radiometric geophysical survey was completed in mid-2012 over the entire 1,003 km2 area, for 5,959 line kilometres. The geophysical data is being modelled and integrated

CHAIRMAN'S LETTER
Page 5
with the existing geological and geochemical information to discriminate and rank targets for follow up exploration, potentially including drilling.
EL 1598 - Central New Britain has porphyry copper-gold, intrusive related gold, high-grade epithermal and skarn gold targets. A 4,085 line kilometre aeromagnetics and radiometrics acquisition program was completed over the entire EL in March 2012.
I would like to thank shareholders for their support during this tumultuous period. Success is not easily achieved, but Frontier has a solid strategy and will ultimately be rewarded.
Frontier's hard working Papua New Guinean and Australian staff, casuals and directors are also thanked for their assistance throughout the year. Exploration is definitely a team effort and everyone is working hard to achieve success.
Frontier is very pleased to be exploring for major mineral deposits in Papua New Guinea and look forward to future success on our own licences, with our Earn-In Joint Ventures, plus through our equity in Torque Mining and the carried interests in the Tasmanian exploration and development projects.
For additional information relating to Frontier Resources, please visit the Company’s website at www.frontierresources.com.au or feel free to contact me.
FRONTIER RESOURCES LTD Sincerely
P.A.McNeil, M.Sc. CHAIRMAN / MANAGING DIRECTOR

Review of Operations & Activities
Page 6
Extensive and highly successful exploration was conducted by Frontier during 2010/2011 at the 100% owned Andewa Project in Papua New Guinea (Figure 1). The Sudest EL was granted and exploration commenced almost immediately. The Company was also very active in Tasmania drilling excellent results at the SMRV Project and the Stormont Deposit.
Figure below shows the locations of Frontier’s Exploration Licences and Joint Ventures in Papua New Guinea.
EL 1594 Sudest No drilling has ever been undertaken on Sudest. Frontier Resources Ltd was granted EL 1594 on March 12, 2012, for the normal renewable period of two years. Placer Pacific was the last company to explore on Sudest; they selected it for its “potential to host an economic gold reserve containing at least 1 million ounces of gold”. Sudest is approximately 100 km south-east of the former Placer owned Misima Deposit from which about 5 million ounces of low-grade epithermal gold was extracted.
Work undertaken by Placer included reconnaissance / semi-detailed geological mapping, stream sediment

Review of Operations & Activities (Cont.)
Page 7
/pan concentrate /BLEG, ridge/spur soil, rock chip/hand trench sampling, plus petrographic analysis/ fluid inclusion studies. However, no serious evaluation work was completed.
The Placer Pacific work program located a 45km NW-SE striking zone defined by gold anomalous drainage geochemistry Anomalous gold assay results (g/t) in stream sediments included 0.785 and 1.41 at Small 4-Mile, 1.49 at Nanhil, 0.808 at Cornucopia, 0.782 at Pamela, 0.635 at Gesila and 1.05 and 0.914 at Tauge – Big 4-Mile. Lower tenor gold results were also returned but it is noted that much of Sudest is mineralised in drainages.
Highlights of anomalous gold assay results (g/t) in panned concentrates included 387.0, 173.0, 64.0, 27.0, 15.5 and 21.6 at Adelaide, 202.0, 56.5, 33.8 and 21.8 at Cornucopia, 134.0, 129.0, 51.9, 43.5, 35.3 and 31.00 at Tauge, 214.0, 121.0, 71.9, 29.4 and 23.0 at Gesila / 4-Mile and 23.0 and 16.0 at Griffin Point. These are the high values, but lower tenor values were also recorded. Strongly anomalous gold assay results (g/t) in float rock chips included: 86.0, 42.5, 28.0, 27.7, 14.15 and 13.53 at Cornucopia and 260.0, 169.8, 132.7, 125.9, 46.0, 32.2, 30.9 and 28.35 at the Adelaide Prospect. Outcrop gold samples (g/t) included 4.05 and 0.974 at Adelaide and 0.41 at Small 4 Mile Prospect .The BLEG samples assayed a high of 2540ppb Au from the Cornucopia area and panned concentrate /BLEG results support an approximate east-west trending gold anomalous zone.
Field crews completed a 2.5 month 'maiden' exploration program on the Sudest EL consisting of 2 grid based soil sampling programs (covering a total of about 5 km2) and hand trenching at 2 prospects.
Review of Operations & Activities (Cont.)
Page 8
Trench No Gold in Trench AssaysInterval
From -- To
Trench
Length
Rock grab samples in trench
(measured from the start)
AT-01 2m of 0.57 g/tAu 0-2m 2m -
AT-02 2m of 0.51 g/tAu 2-4m 14m 6.10 g/tAu at 2.1m
AT-03 2m of 0.05 g/tAu 20-22m 24m 1.03 g/tAu at 18.5m
AT-04 4m of 0.22 g/tAu 4-8m 8m 5.79 g/tAu at 4.2m
AT-05 2m of 0.18 g/tAu 8-10m 10m 2.98 g/tAu at 5.5m
AT-06 2m of 7.75 g/tAu 70-72m 74m 2.16 g/tAu at 62.2m
AT-06A 3.9m of 0.76 g/tAu 4-5.9m 5.9m
AT-07 2m of 0.16 g/tAu 0-2m 8m
AT-08 4m of 6.36 g/tAu 10-14m 18m
incl. 2m of 11.60 g/tAu 12-14m - 13.01 g/tAu at 12.5m
AT-09 4m of 2.89 g/tAu 0-4m 24m 151.2 g/tAu at 2.0m
incl. 2m of 4.80 g/tAu 2-4m - 22.70 g/tAu at 2.3m
plus 2m below detection 4-6m - 4.97 g/tAu at 5.0m
plus 4m of 0.20g/tAu 20-24m - 26.60 g/tAu at 22.0m
AT-10 4m of 52.50 g/tAu 0-4m 8m
incl. 2m of 104.50 g/tAu 0-2m 8m
AT-11 2m of 0.86 g/tAu 4-6m 10m 2.36 g/tAu at 5.8m
AT-12 2m of 1.37 g/tAu 28-30m 34m
AT-13 2m of 16.0 g/tAu 0-2m 5m
AT-14 2m of 4.56 g/tAu 6-8m 12m 24.25 g/Au at 7.5m
plus 2m of 2.42 g/tAu 10-12m 12m
AT-14A 2m of 0.015 g/tAu 0-2m 7m
AT-15 2m of 0.028 g/tAu 0-2m 28m
AT-16 2m of 0.05 g/tAu 0-2m 24m
AT-17 2m of 0.10 g/tAu 2-4m 16m
AT-18 No assays available 42m
AT-19 2m of 0.005 g/tAu 2-4m 16m
AT-20 2m of 0.025 g/tAu 10-12m 12m
AT-21 2m of 0.27 g/tAu 2-4m 6m
AT-22 4m of 7.90 g/tAu 4-8m 8m 1.25 g/tAu at 5.0m
incl. 2m of 15.35 g/tAu 6-8m 8m
AT-23 2m of 0.027 g/tAu 0-2m 6m
AT-24 2m of 0.19 g/tAu 2-4m 6m
AT-25 2m of 0.78 g/tAu 2-4m 8m
AT-26 No assays available 10m
AT-27 No assays available 6m
AT-28 2m of 1.012 g/tAu 6-8m 8m
Trench No Gold in Trench AssaysInterval
From -- To
Trench
Length
Rock grab samples in trench
(measured from the start)
CT-01 No assays available 154m 3.55 g/tAu at 32.0m
CT-02 No assays available ? 1.020 g/tAu at 228m
CT-03 No assays available ?
CT-04 2m of 1.11 g/tAu 10-12m 138m
2m of 2.42 g/tAu 12-14m
6m of 10.96 g/Au 28-34m 14.49 g/tAu
incl. 2m of 20.53 g/tAu 32-34m 36.40 g/tAu
Cornucopia Trenches
Adelaide Trenches
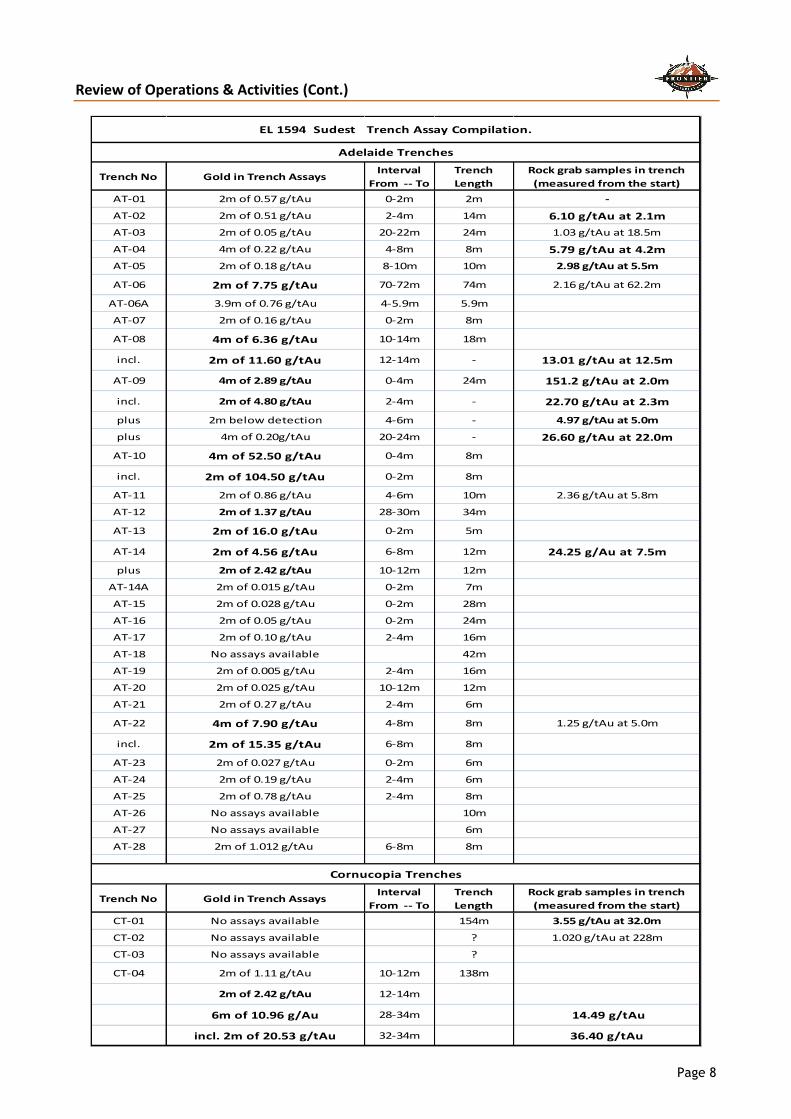
EL 1594 Sudest Trench Assay Compilation.
Review of Operations & Activities (Cont.)
Page 9
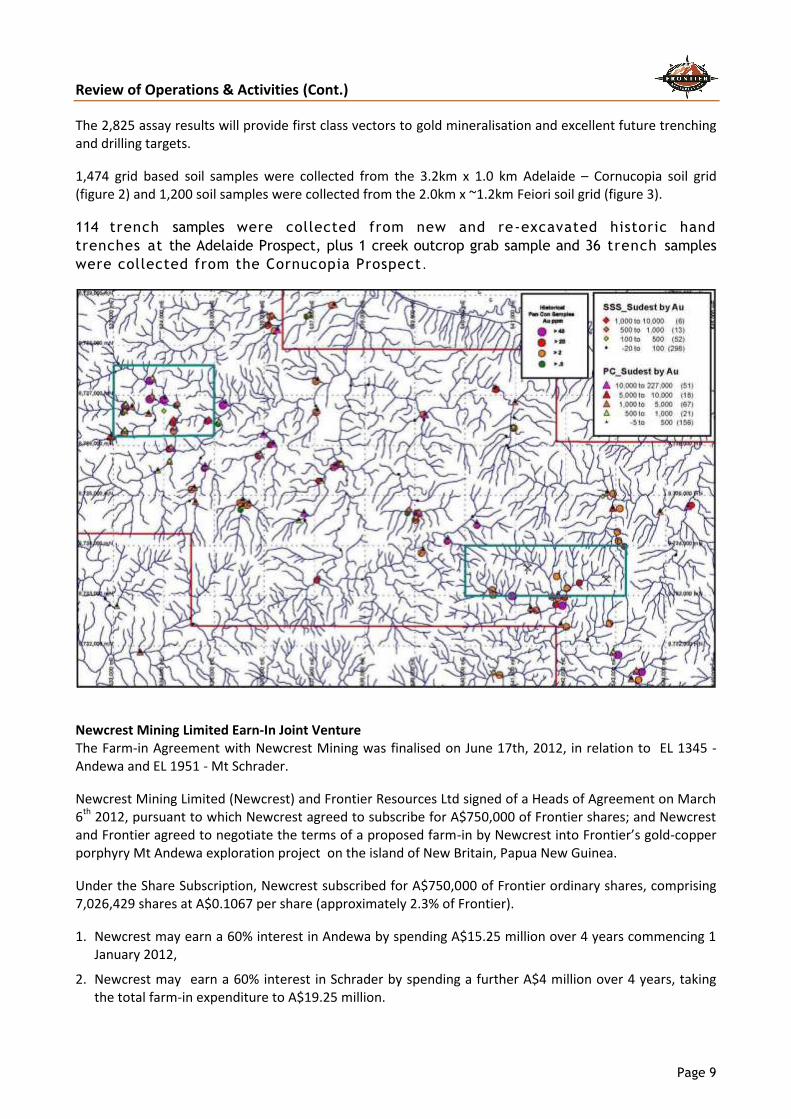
The 2,825 assay results will provide first class vectors to gold mineralisation and excellent future trenching and drilling targets.
1,474 grid based soil samples were collected from the 3.2km x 1.0 km Adelaide – Cornucopia soil grid (figure 2) and 1,200 soil samples were collected from the 2.0km x ~1.2km Feiori soil grid (figure 3).
114 trench samples were collected from new and re-excavated historic hand
trenches at the Adelaide Prospect, plus 1 creek outcrop grab sample and 36 trench samples
were collected from the Cornucopia Prospect .
Newcrest Mining Limited Earn-In Joint Venture The Farm-in Agreement with Newcrest Mining was finalised on June 17th, 2012, in relation to EL 1345 - Andewa and EL 1951 - Mt Schrader.
Newcrest Mining Limited (Newcrest) and Frontier Resources Ltd signed of a Heads of Agreement on March 6th 2012, pursuant to which Newcrest agreed to subscribe for A$750,000 of Frontier shares; and Newcrest and Frontier agreed to negotiate the terms of a proposed farm-in by Newcrest into Frontier’s gold-copper porphyry Mt Andewa exploration project on the island of New Britain, Papua New Guinea.
Under the Share Subscription, Newcrest subscribed for A$750,000 of Frontier ordinary shares, comprising 7,026,429 shares at A$0.1067 per share (approximately 2.3% of Frontier).
1. Newcrest may earn a 60% interest in Andewa by spending A$15.25 million over 4 years commencing 1 January 2012,
2. Newcrest may earn a 60% interest in Schrader by spending a further A$4 million over 4 years, taking the total farm-in expenditure to A$19.25 million.
Review of Operations & Activities (Cont.)
Page 10
3. Newcrest will have an option to acquire an additional 12% in each Project by making a payment to Frontier related to the ore reserve and resource gold (equivalent) ounces specified in any subsequent feasibility study to develop Andewa and/or Schrader.
4. Frontier may elect to be deferred-carried during the period from Newcrest completing its earn-in until completion of a project feasibility study for Andewa. The carried amount plus interest (LIBOR +5%) will be repayable to Newcrest from 50% of Frontier’s share of mine profit upon commencement of production.
5. The A$15.25 million Farm-In expenditure includes reimbursement of audited exploration costs incurred by Frontier in the period commencing 1 January 2012 of $1.915 million. A management fee equal to 10% of the actual exploration expenditure is payable to the manager of the exploration activities.
6. During the minimum expenditure period, Frontier will provide drilling, earth-moving, boat/barge and logistic support equipment and will be reimbursed by Newcrest at agreed commercial rates (part of the A$2.5 million minimum expenditure).
7. After a minimum expenditure of A$2.5 million, (the Minimum Commitment Period), Newcrest may elect to withdraw from the Proposed Farm-in.
Frontier is manager and operator of the project during the Minimum Commitment Period (completed already) with Newcrest providing technical direction and support. Newcrest may now elect to assume management of the exploration activities”.
Newcrest Executive General Manager Minerals, Colin Moorhead said “Newcrest is pleased to establish this relationship with Frontier in accord with our strategy of seeking opportunities for early stage entry into high-quality gold projects in the Asia-Pacific region.
EL 1345 - Andewa Drilling commenced early July 2011 and was temporarily halted in late April to enable a complete evaluation of the recently obtained aeromagnetic and radiometrics, in combination with the 3D-IP and soil geochemical data.
A summary of drill hole intercepts is located in the following text and hole collar and orientation information is in Table 2. Due to the long intervals of lower grade mineralisation, the entire holes are reported (at no cut off grade) along with higher grade internal intervals.
Five hand trenches were completed in the ADH002 area and all are mineralised with gold >0.1 g/t. The weighted assay average for all these trenches is 470.5m grading 0.54 g/t gold, which is comparable to the mineralisation noted in hole ADH002
The assay results from the drill holes and trenches, plus the textures, lithologies and mineralisation observed indicate that the Joint Venture is drilling into the upper sections of a major porphyry gold - copper system that is well located for future development.
ADH 001 intersected 48.5m grading 1.02 g/t gold + 0.38% copper, within 93.2m grading 0.78 g/t gold + 0.30% copper (from 166.6m to 259.8m downhole). The intercept from the top of the copper envelope to the bottom of the gold + copper envelope is 190.1m grading 0.55 g/t gold + 0.24% copper.
ADH002 intersected a composite interval of 114m* grading 0.74 g/t gold + 0.20% copper, including 19m grading 1.86 g/t gold + 0.39% copper. The entire interval from surface to 372m is mineralised and grades 0.36 g/t gold + 0.10% copper.
ADH003 intersected 409.1m grading 0.30g/t gold + 0.08% copper, including 1.0m of 9.40g/t gold + 0.26% copper.
ADH004 intersected 404.6m grading 0.24 g/t gold + 0.06 % copper.
ADH005 intersected 296.2m grading 0.29 g/t gold + 0.09 % copper.
Table 10.
Review of Operations & Activities (Cont.)
Page 11
ADH006 intersected 353.5m grading 0.13 g/t gold + 0.02 % copper.
ADH007 intersected 408.4m grading 0.09 g/t gold + 0.02 % copper.
ADH008 intersected 403.5m grading 0.27 g/t gold over its entire length, including 36.5m grading 0.77 g/t gold and 5 zones > 1.0 g/t gold.
ADH009 intersected 407.9m grading 0.23 g/t gold over its entire length, including 58.5m grading 0.33 g/t gold and multiple additional mineralised zones.
The top half of hole ADH010 intersected 187m grading 0.26 g/t gold and 0.17% copper (sampling commenced at 2m downhole) from 'surface'.
ADH 011 was being drilled at the same time and the top 118m has been analysed and intersected 114.5m (from 3.5m) downhole grading 0.08 g/t gold (no samples were below detection limit) and 232ppm copper.
Peak assays from the diamond core drill holes ADH 001 - ADH 009 were:
ADH001 - 2m of 2.46 g/t gold 1m of 0.79% copper, and 1.5m of 50 ppm molybdenum.
ADH002 - 7.12 g/t gold 1m of 1.63% copper with and 1m of 219 ppm molybdenum.
ADH003 - 1m of 9.4 g/t gold , 1.1m of 1.08 g/t gold and 1m of 106 ppm molybdenum.
ADH004 - 1m of 0.88 g/t gold, 1m of 0.41% copper and 0.6m of 1,190ppm molybdenum.
ADH005 – 0.5m of 4.89 g/t gold , and 0.9m of 0.49% copper + 0.74 g/t gold + 74 ppm molybdenum.
ADH006 – 2.0m of 0.93 g/t gold, 2m of 0.06 % copper and 8 ppm molybdenum.
ADH007- 0.6m of 4.39 g/t gold , 0.07% copper and 0.6m of 18 ppm molybdenum.
ADH008 -1.5m of 4.43 g/t gold, 1m of 0.46% copper and 1.0m of 148 ppm molybdenum.
ADH009 -1.0m of 2.00 g/t gold, 0.9m of 0.53% copper and 2.4m of 387 molybdenum.
The top half of hole ADH010 returned 187m grading 0.26 g/t gold and 0.17% copper (sampling commenced at 2m downhole) from 'surface'. Peak grades were 1m of 1.99 g/t gold and 1.5m of 0.534% copper.).
Hole ADH011 was being drilled at the same time and the top 118m has been analysed and returned 114.5m (from 3.5m) downhole grading 0.08 g/t gold (no samples were below detection limit) and 232ppm copper.

Review of Operations & Activities (Cont.)
Page 12
The gold and copper grades encountered to date have been modest, but the intercepts and their extensive lengths reflect a very large and pregnant system with excellent prospectivity. The last sample in hole ADH009 assayed 1.0m of 0.55 g/t gold + 0.11% copper (from 406 to 407m downhole).
HOLE IDEOH
DEPTH (m)
AZIM (AMG)
DIP (degrees)
EASTING (m)
NORTHING (m)
RL (m)
ADH 001 398.8m 125 -50 714546 9383269 278
ADH 002 389.6m 316 -45 716878 9384618 386
ADH 003 409.1m 226 -45 716878 9384618 386
ADH 004 404.6m 136 -45 716878 9384618 386
ADH 005 317.6m 046 -45 716878 9384618 386
ADH 006 353.5m 316 -50 716811 9385292 489
ADH 007 408.4m 136 -45 716811 9385292 489
ADH 008 403.5m 226 -75 716766 9384793 278
ADH 009 407.0m 136 -70 716766 9384793 278
ADH 010 400.0m 028 -50 714546 9383269 190
ADH 011 700.9m 316 -45 715029 9383689 202
ADH 012 667.5m 080 -80 714540 9383270 278
ADH 013 625.5m 007 -45 713628 9383379 341
ADH 014 1004.0m 173 -50 714400 9383680 163
ADH 015 850.5m 180 -50 714400 9384400 215
ADH 016 to 1,000m 0/360 -50 717549 9383084 339
ADH 017 to +800m 0/360 -50 716825 9384165 421
7740.5 mTotal to Date =

Review of Operations & Activities (Cont.)
Page 13

Review of Operations & Activities (Cont.)
Page 14

Review of Operations & Activities (Cont.)
Page 15
Review of Operations & Activities (Cont.)
Page 16

Review of Operations & Activities (Cont.)
Page 17
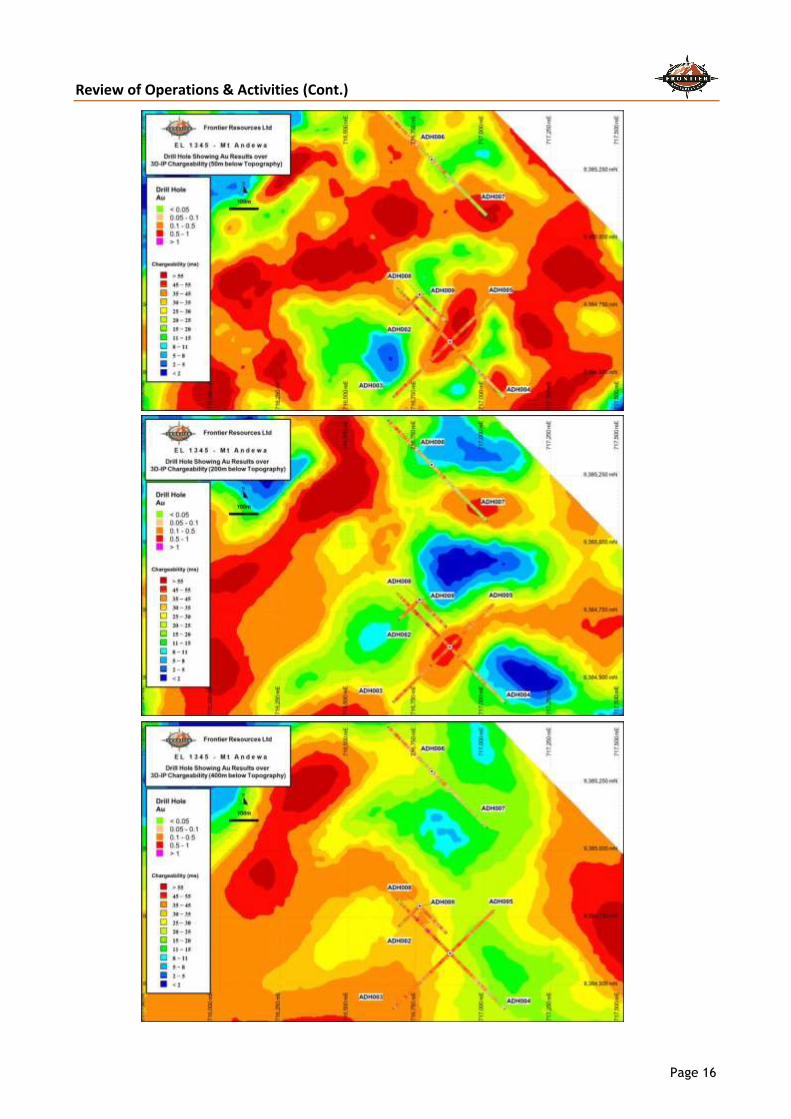
Aeromagnetic/Radiometric Program A 1,538 line kilometre aeromagnetic and radiometrics geophysical program was completed in late March, that covered the entire Andewa Exploration Licence.
The survey was flown on a 100m line spacing and is being modelled and merged with the existing 3D-IP and geochemical data sets to provide enhanced drill hole vectoring towards possible mineralised zones.
Magnetite is known (from the drilling to date) to be variably associated with the gold/copper mineralisation at Andewa and the magnetic information, in conjunction with other information, should provide enhanced vectoring for drill holes towards possible gold/copper mineralised zones.
Various plans are attached including a Digital Elevation Model (DEM) showing the location of all drill holes to date, Reduced to the Pole (RTP) magnetics, Reduced to the Pole First Vertical Derivative magnetics (RTP – VD1,) a radiometrics ternary image, a close up of the RTP magnetics and chargeability and resistivity (conductivity) images showing drill holes locations to compare to the magnetic images.
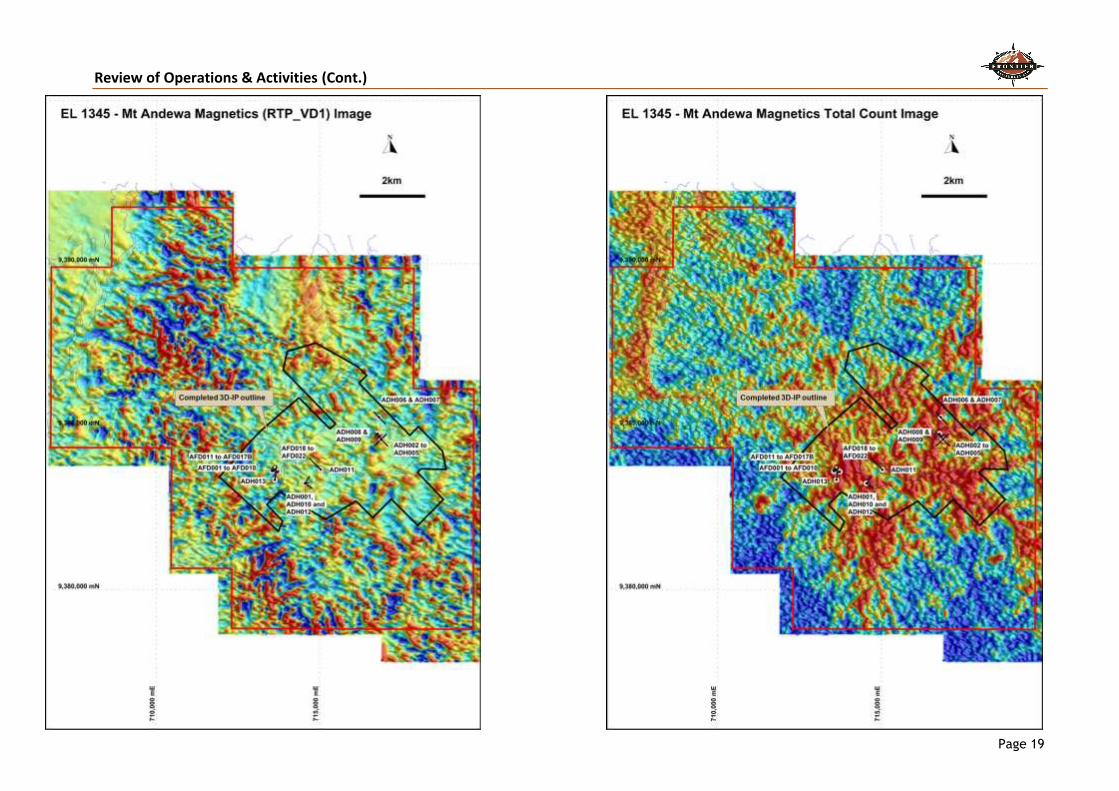
The RTP image of the survey area shows two extensive anomalies and various smaller magnetic anomalies within the Andewa crater.
The large and cohesive magnetic anomaly located in the central north sector of the EL is also associated with gold anomalous drainage geochemistry and a circular topographic feature that could reflect an intrusive at depth. Frontier has not conducted any work over the bulk of this anomaly, however, the northern sector of the 3D-IP grid just covers its southern end.
There is no significant gold in soil anomaly at that location but it does show a conductivity anomaly associated with the magnetic anomaly itself and a chargeability anomaly is associated with the structure on its southern end. Conductivity anomalies assessed to date by drilling reflect intrusives at Andewa, so this is encouraging.
The large and slightly disjointed north-northeast trending anomaly located in the western sector of the survey possibly reflects a discrete volcanic episode or lithology. At this stage, it is not possible to comment on the significance of the major magnetic anomalies with respect to possible gold/copper mineralisation, however, it is readily apparent that there is a correlation between the more subdued magnetic anomalies and gold/copper mineralisation demonstrated in drill holes. This observation indicates that the other subdued magnetic anomalies may also be associated with gold/copper mineralisation and require evaluation.

Review of Operations & Activities (Cont.)
Page 18
Outline of EL 1345 - Andewa showing the Lidar digital terrain model (DTM) drainages, the location of the 3D-IP grid and drill holes to date.
Review of Operations & Activities (Cont.)
Page 19
Review of Operations & Activities (Cont.)
Page 20
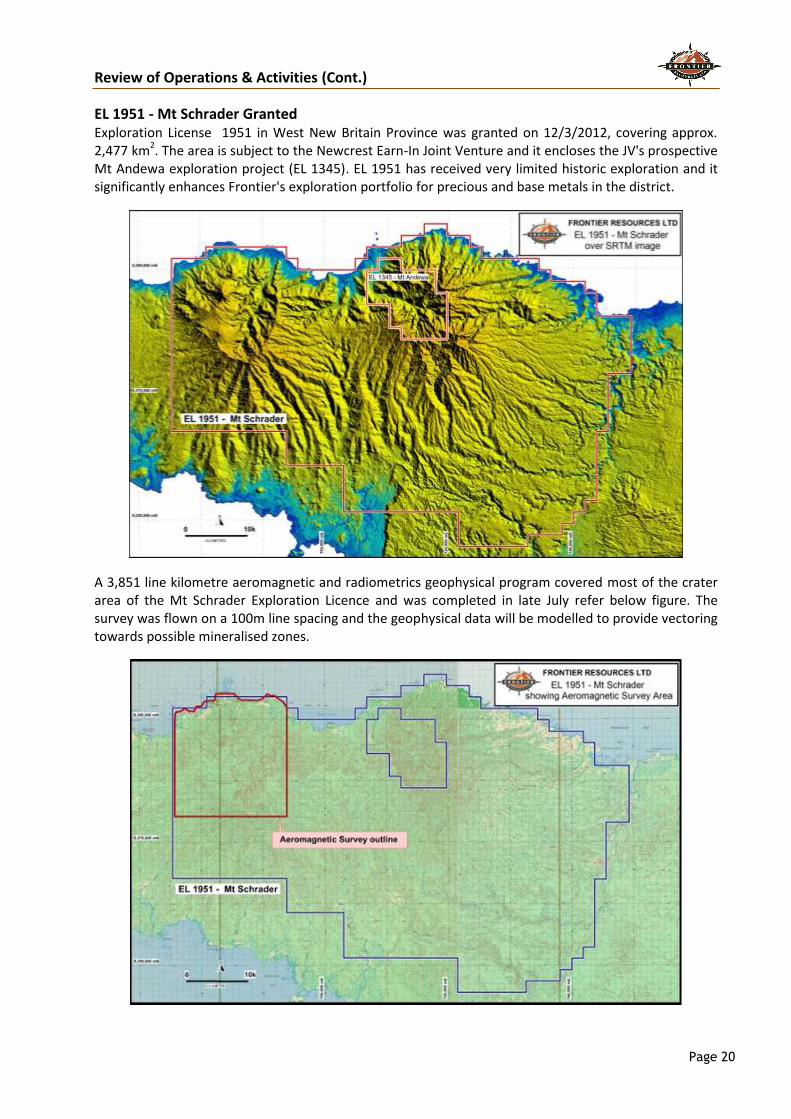
EL 1951 - Mt Schrader Granted Exploration License 1951 in West New Britain Province was granted on 12/3/2012, covering approx. 2,477 km
2. The area is subject to the Newcrest Earn-In Joint Venture and it encloses the JV's prospective
Mt Andewa exploration project (EL 1345). EL 1951 has received very limited historic exploration and it significantly enhances Frontier's exploration portfolio for precious and base metals in the district.
A 3,851 line kilometre aeromagnetic and radiometrics geophysical program covered most of the crater area of the Mt Schrader Exploration Licence and was completed in late July refer below figure. The survey was flown on a 100m line spacing and the geophysical data will be modelled to provide vectoring towards possible mineralised zones.
Figure 7 Figure 9
Figure 6

Review of Operations & Activities (Cont.)
Page 21
The Mt Schrader stratovolcano crater has several quasi-circular topographic features that have been partially explored. Alteration zones have been identified and gold mineralisation includes two stream sediment anomalies to 0.175 g/t gold, plus copper, arsenic and mercury (pathfinder elements) in hydrothermal breccia rock samples to 530 ppm Cu, 1020 ppm and 17,900 ppm, respectively. These are all favourable indicators for possible gold mineralisation in this type of 'high level' geological environment.
The Schrader EL also covers two major WNW trending structural zones (and a N-S zone) that could host gold and/or copper mineralisation. Andewa's Komsen gold Prospect is within a WNW trending mineralised structure. These structural zones are important for the localisation of mineralised intrusions further east in New Britain, such as the Kulu - Awit trend that hosts (SE to NW) the Nakru, Plesyumi, Simuku and Mt Penck deposits, plus other prospects belonging to competitors.
The Andewa and Mt Schrader craters are 150km and 180km west of the port of Kimbe, the capital of West New Britain Province. The areas are accessible by barge, boat, helicopter and locally logging tracks.
OK TEDI MINING LTD JOINT VENTURES In May 2010 Frontier and OTML established 2 Joint Ventures that relate to 3 ELs and 2 EL Applications in PNG (that have since been granted).
EL 1595 - Bulago The prospects are located in a 4.5km x 6km well-defined gold, zinc and copper drainage anomaly covering a recessive intrusive in a sub-circular drainage basin, with anomalism continuing up to the peripheral limestones (demonstrating skarn potential). The Suguma Prospect has very high gold grades in structures and is located in the NW of the grid.
Nine holes have been completed by OTML at Bulago for 3,302.9m, with 2 of those (591.9m) completed at high grade gold Suguma Prospect.
Review of Operations & Activities (Cont.)
Page 22
HOLE ID
EOH
DEPTH
(m)
Azimuth
(true)Incl.
AMG
North
(m)
AMG
Easting
(m)
RL
(m)
BUL001 440.3 295 -60 9399870 639180 1653.0
BUL002 331.1 180 -70 9399385 639379 1716.0
BUL003 389.6 210 -60 9399868 639182 1654.0
BUL004 115.0 270 -60 9399052 639723 1658.0
BUL005 363.1 160 -70 9399075 639171 1910.0
BUL006 422.4 180 -60 9399485 638919 1801.0
BUL007 649.5 0 -65 9399086 638540 ?
SUG01 329.8 0 -90 9400257 637091 1684
SUG02 262.1 25 -50 9400195 637024 1647
Total 3,302.9 m
AGD66 Zone 54
EL 1595 - Bulago Drill Hole Location and Orientation Information
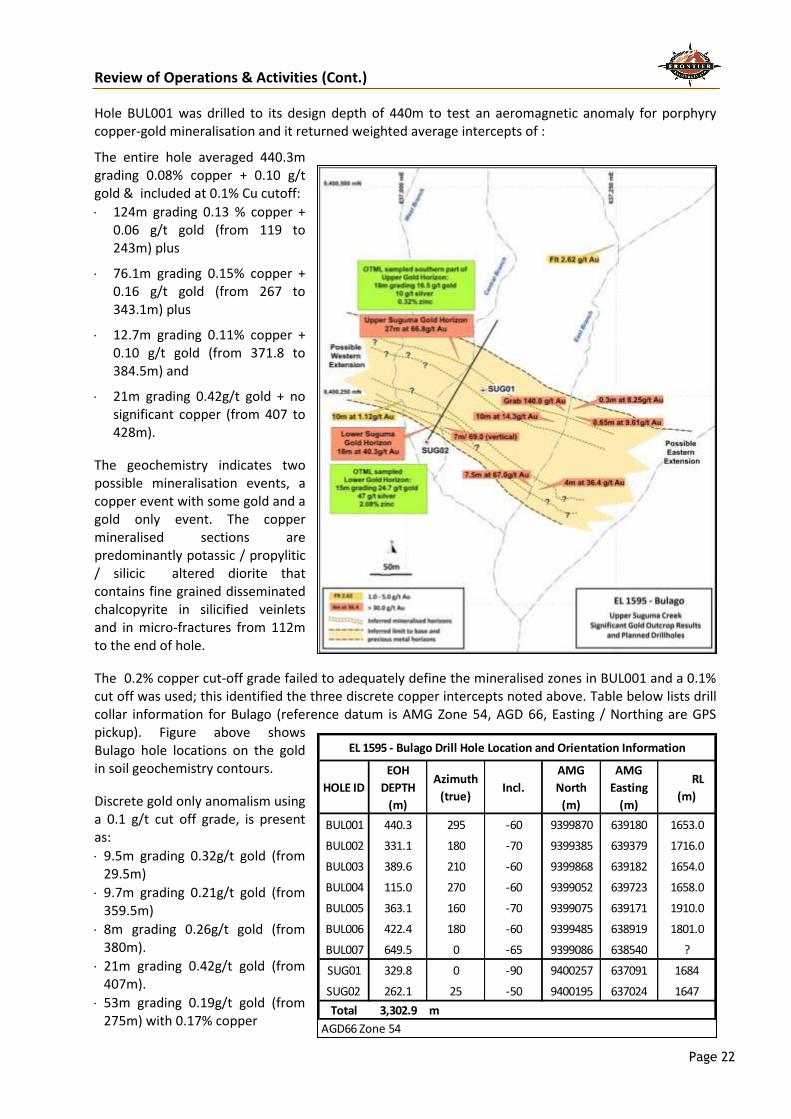
Hole BUL001 was drilled to its design depth of 440m to test an aeromagnetic anomaly for porphyry copper-gold mineralisation and it returned weighted average intercepts of :
The entire hole averaged 440.3m grading 0.08% copper + 0.10 g/t gold & included at 0.1% Cu cutoff:
124m grading 0.13 % copper + 0.06 g/t gold (from 119 to 243m) plus
76.1m grading 0.15% copper + 0.16 g/t gold (from 267 to 343.1m) plus
12.7m grading 0.11% copper + 0.10 g/t gold (from 371.8 to 384.5m) and
21m grading 0.42g/t gold + no significant copper (from 407 to 428m).
The geochemistry indicates two possible mineralisation events, a copper event with some gold and a gold only event. The copper mineralised sections are predominantly potassic / propylitic / silicic altered diorite that contains fine grained disseminated chalcopyrite in silicified veinlets and in micro-fractures from 112m to the end of hole.
The 0.2% copper cut-off grade failed to adequately define the mineralised zones in BUL001 and a 0.1% cut off was used; this identified the three discrete copper intercepts noted above. Table below lists drill collar information for Bulago (reference datum is AMG Zone 54, AGD 66, Easting / Northing are GPS pickup). Figure above shows Bulago hole locations on the gold in soil geochemistry contours.
Discrete gold only anomalism using a 0.1 g/t cut off grade, is present as:
9.5m grading 0.32g/t gold (from 29.5m)
9.7m grading 0.21g/t gold (from 359.5m)
8m grading 0.26g/t gold (from 380m).
21m grading 0.42g/t gold (from 407m).
53m grading 0.19g/t gold (from 275m) with 0.17% copper
Review of Operations & Activities (Cont.)
Page 23
The high-grade gold mineralised Lower and Upper Horizons at the Suguma Prospect , were channel chip outcrop sampled and subsequently drilled by one vertical and one angled diamond core hole to evaluate those targets (for 329.8m and 262.1m respectively).
OTML's weighted average gold and silver channel outcrop assays for the Suguma Lower Gold Horizon was 15m grading 24.7 g/t gold + 47 g/t silver + 2.08% zinc compared to Frontier’s 18 metres grading 40.3 g/t gold + 32 g/t silver + 1.13% zinc. These weighted averages are comparable because Frontier’s sample contained a higher grade of 3m of 142 g/t gold (the ‘nugget’ effect) and if this high grade is cut to the ‘average’ grade, then the intercepts are very similar in tenor for gold, silver and zinc.
Similarly, OTML sampled only the ‘southern’ part of the Upper Gold Horizon and hence it is a shorter intercept being 18m grading 16.5 g/t gold + 10 g/t silver + 0.32% zinc. The sampling appears to have commenced at the same start location as the Frontier channel sampling, which when re-calculated equates to 18m of 13.5 g/t gold + 9 g/t silver, which is very similar in tenor of both gold and silver. This would mean that the next interval to be sampled should have been the 9m of 173 g/t gold + 60 g/t silver (as sampled by Frontier) that is also open ended to the north and was evaluated by the angled hole (SUG02).
The OTML continuous chip outcrop samples were collected where possible by their exposure and orientation and do not necessarily represent true widths of mineralisation. Other samples south of the Lower Gold Zone and between it and the Upper Gold Zone returned values down to the analytical detection limits. The drilling has attempted to determine the geometry of the gold mineralised zones.
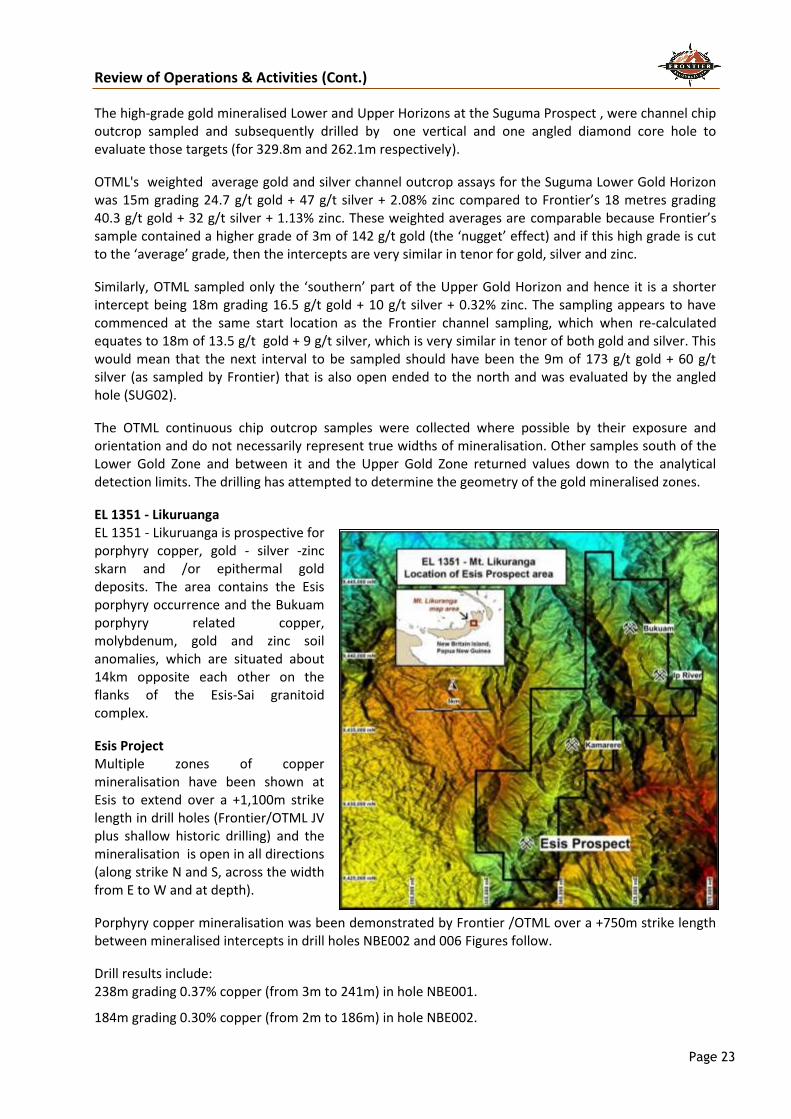
EL 1351 - Likuruanga EL 1351 - Likuruanga is prospective for porphyry copper, gold - silver -zinc skarn and /or epithermal gold deposits. The area contains the Esis porphyry occurrence and the Bukuam porphyry related copper, molybdenum, gold and zinc soil anomalies, which are situated about 14km opposite each other on the flanks of the Esis-Sai granitoid complex.
Esis Project Multiple zones of copper mineralisation have been shown at Esis to extend over a +1,100m strike length in drill holes (Frontier/OTML JV plus shallow historic drilling) and the mineralisation is open in all directions (along strike N and S, across the width from E to W and at depth).
Porphyry copper mineralisation was been demonstrated by Frontier /OTML over a +750m strike length between mineralised intercepts in drill holes NBE002 and 006 Figures follow.
Drill results include: 238m grading 0.37% copper (from 3m to 241m) in hole NBE001.
184m grading 0.30% copper (from 2m to 186m) in hole NBE002.

Review of Operations & Activities (Cont.)
Page 24
199m grading 0.28% copper( from 0m to 199m) in hole NBE003.
274.2m of 0.25% copper (from 4m to 278.2m), plus 18m of 0.30% copper from 691m to 709m in NBE004.
306.8m grading 0.28% copper (from 18m to 324.8m) in hole NBE005.
232.5m grading 0.27% copper (from 3.5m to 236.0m) in hole NBE006.
138.0m grading 0.23% copper (from 0m to 138m), plus 233.8m grading 0.20% copper (from 368.9m to 602.7m EOH) in hole NBE007.
Ten holes have now been completed for 6,155m, hole NBE011 was abandoned and drilling continues on holes 12 and 13 (re-drill of hole 11).
The copper mineralisation is open at depth (+700m vertically below surface) in multiple zones. Hole NBE001 was terminated in 0.41% copper at 697.6m (drilled vertically).Hole NBE007 was terminated with 233.8m grading 0.20% copper to 602.7m, also showing mineralisation to the west of the long section line (60 degree inclination).
The mineralisation is open to the east.
Hole NBE004 was terminated in 0.38% copper at 719.9m (60 degree inclination).
Hole NBE005 was terminated in 0.21% copper at 598.5m (60 degree inclination).
Hole NBE006 was terminated in 14.3m grading 0.23% copper at 598.3m (60 degree inclination) with elevated molybdenum (82 ppm compared to the hole average of 25 ppm) suggesting slightly different mineralisation . Refer to the Long Section + Cross Sections and Tables for information/ results and to visualise the orientation of the copper mineralisation. The location of the drill holes is shown on an oblique Google Earth image looking northerly (NNE).

Review of Operations & Activities (Cont.)
Page 25

Review of Operations & Activities (Cont.)
Page 26
Figure 2d
Review of Operations & Activities (Cont.)
Page 27
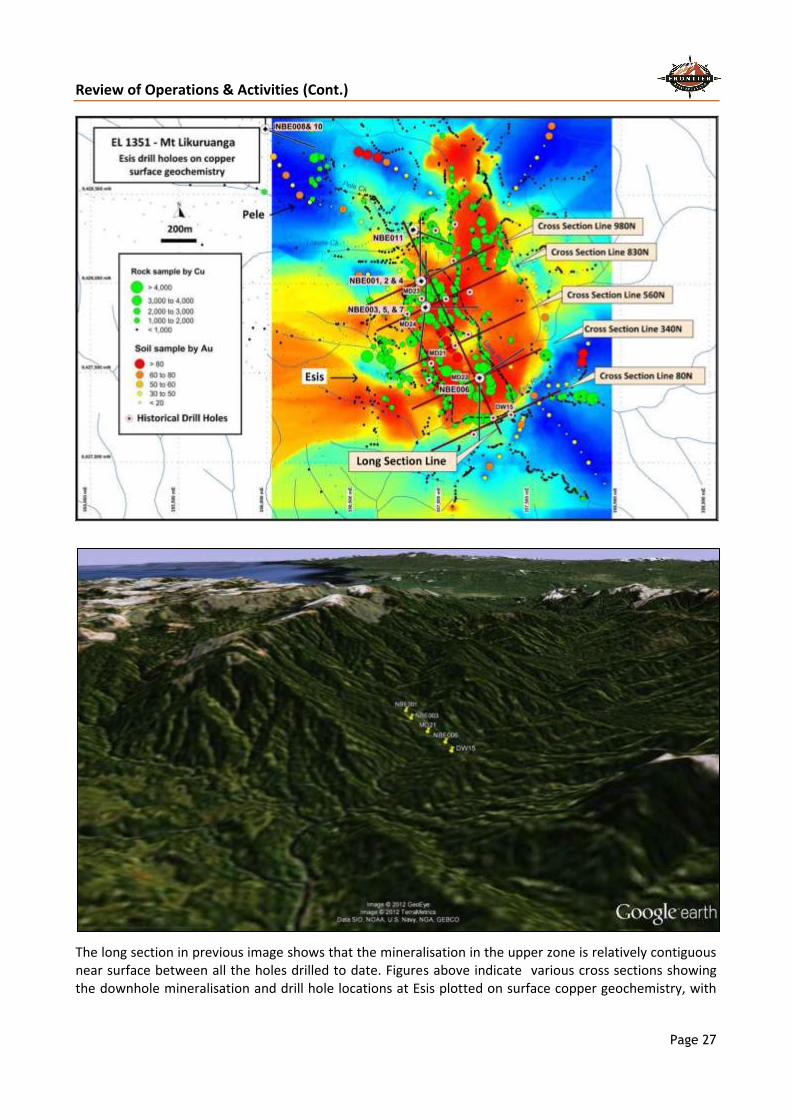
The long section in previous image shows that the mineralisation in the upper zone is relatively contiguous near surface between all the holes drilled to date. Figures above indicate various cross sections showing the downhole mineralisation and drill hole locations at Esis plotted on surface copper geochemistry, with
Figure 2
Review of Operations & Activities (Cont.)
Page 28
To
(m)
Intercept
(m)
Copper
(%)
Moly
(ppm)
Entire
Hole0.0 697.6 110.6 0.17 15
0 66.1 66.1 0.27 17
Plus 66.1 228.0 161.9 0.41 57
Plus 228.0 350.0 122.0 0.18 18
Plus 350.0 477.0 127.0 0.26 11
Plus 477.0 537.0 60.0 0.18 7
Plus 537.0 571.0 34.0 0.34 3
Plus 571.0 697.6 126.6 0.16 14
Drill Hole NBE001 Weighted Assay Results
From
(m)
To
(m)
Intercept
(m)
Copper
(%)
Moly
(ppm)
Entire
Hole0.0 716.9 716.90 0.13 14
2.0 186.0 184.0 0.30 19
Incl. 30.1 38.1 8.0 0.40 7
Plus 48.1 54.1 6.0 0.67 3
Plus 74.1 83.6 9.5 0.57 7
Plus 97.6 107.6 10.0 0.37 5
Drill Hole NBE002 Weighted Assay Results
From
(m)
lines showing the location of the long and cross sections. A Google Earth image shows the location of the various drill holes on an oblique image looking northerly (NNE).
The intercepts of significance are defined herein by a 0.15% copper cut-off, with higher grade zones generally defined by a 0.3% copper cutoff. The results for each hole contain no particularly significant gold mineralisation and as such it is not reported. The molybdenum is reported so its variation can be noted in context of genetic porphyry copper models, not because it has any particular possible economic value at Esis.
The JV diamond drill holes in varying orientations have achieved a better understanding of the geology with respect to lithology, mineralisation and alteration and will lead to the initial production of a coherent 3D model.
The long section displaying copper in the drill holes demonstrates the consistency of mineralisation between holes and the open nature of the anomaly to the east, south and at depth.
There appears to be at least 3 zones of moderate grade copper mineralisation that are separated by lower grade copper intervals both horizontally and vertically (as seen in the long section and cross sections).
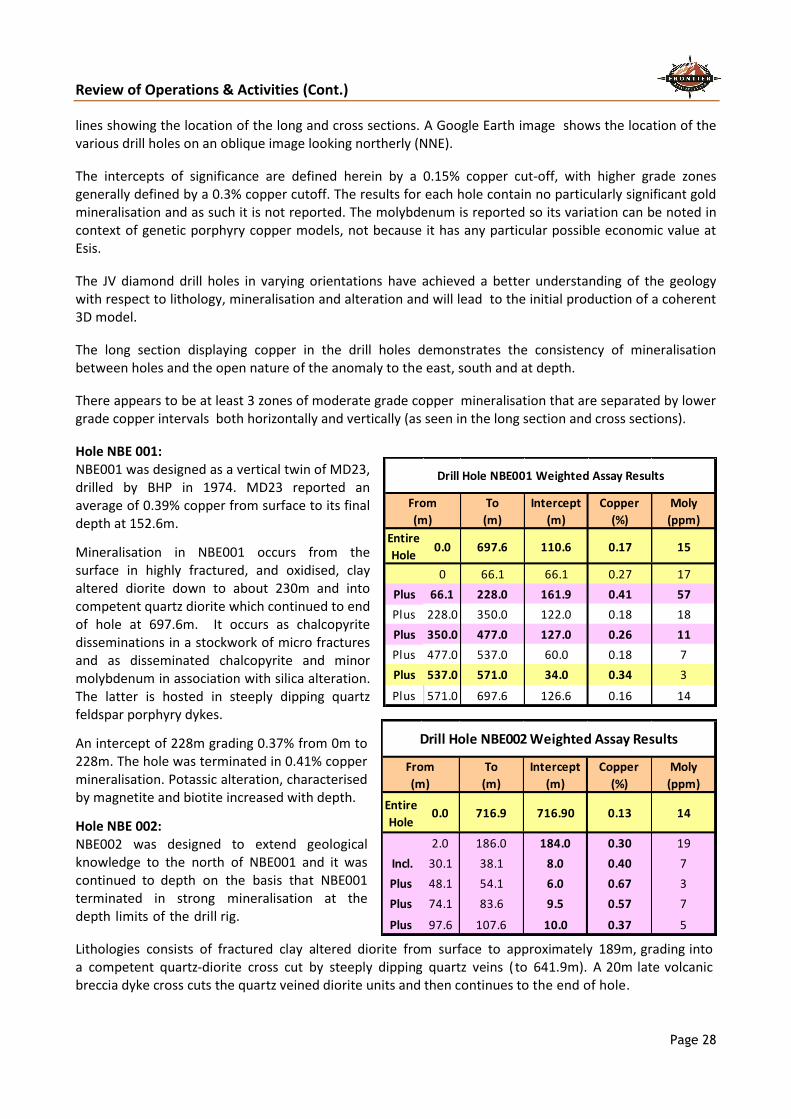
Hole NBE 001: NBE001 was designed as a vertical twin of MD23, drilled by BHP in 1974. MD23 reported an average of 0.39% copper from surface to its final depth at 152.6m.
Mineralisation in NBE001 occurs from the surface in highly fractured, and oxidised, clay altered diorite down to about 230m and into competent quartz diorite which continued to end of hole at 697.6m. It occurs as chalcopyrite disseminations in a stockwork of micro fractures and as disseminated chalcopyrite and minor molybdenum in association with silica alteration. The latter is hosted in steeply dipping quartz feldspar porphyry dykes.
An intercept of 228m grading 0.37% from 0m to 228m. The hole was terminated in 0.41% copper mineralisation. Potassic alteration, characterised by magnetite and biotite increased with depth.
Hole NBE 002:
NBE002 was designed to extend geological knowledge to the north of NBE001 and it was continued to depth on the basis that NBE001 terminated in strong mineralisation at the depth limits of the drill rig.
Lithologies consists of fractured clay altered diorite from surface to approximately 189m, grading into a competent quartz-diorite cross cut by steeply dipping quartz veins ( to 641.9m). A 20m late volcanic breccia dyke cross cuts the quartz veined diorite units and then continues to the end of hole.
Review of Operations & Activities (Cont.)
Page 29
To
(m)
Intercept
(m)
Copper
(%)
Moly
(ppm)
Entire
Hole0.0 606.8 606.8 0.18 25
0.0 239.0 239.0 0.27 35Plus 239.0 283.0 44.0 0.11 18
Plus 283.0 299.0 16.0 0.22 46Plus 299.0 329.0 30.0 0.11 37
Plus 329.0 421.0 92.0 0.17 15
Plus 421.0 553.0 132.0 0.07 12
Plus 553.0 599.0 46.0 0.12 23
Plus 599.0 606.8 7.8 0.05 15
Drill Hole NBE003 Weighted Assay Results
From
(m)
To
(m)
Intercept
(m)
Copper
(%)
Moly
(ppm)
Entire
Hole0.0 719.9 719.9 0.17 25
0.0 4.0 4.0 0.02 21
Plus 4.0 38.0 34.0 0.24 9
Plus 38.0 48.1 10.1 0.09 17
Plus 48.1 115.5 67.4 0.32 53
Plus 115.5 131.6 16.1 0.06 70
Plus 131.6 278.2 146.6 0.25 63
Plus 278.2 301.0 22.8 0.09 32
Plus 301.0 395.0 94.0 0.20 23
Plus 395.0 453.0 58.0 0.12 2
Plus 453.0 503.0 50.0 0.07 1
Plus 503.0 561.0 58.0 0.10 2
Plus 561.0 669.0 108.0 0.07 2
Plus 669.0 719.9 50.9 0.19 5
Incl. 691.0 709.0 18.0 0.30 6
From
(m)
Drill Hole NBE004 Weighted Assay Results
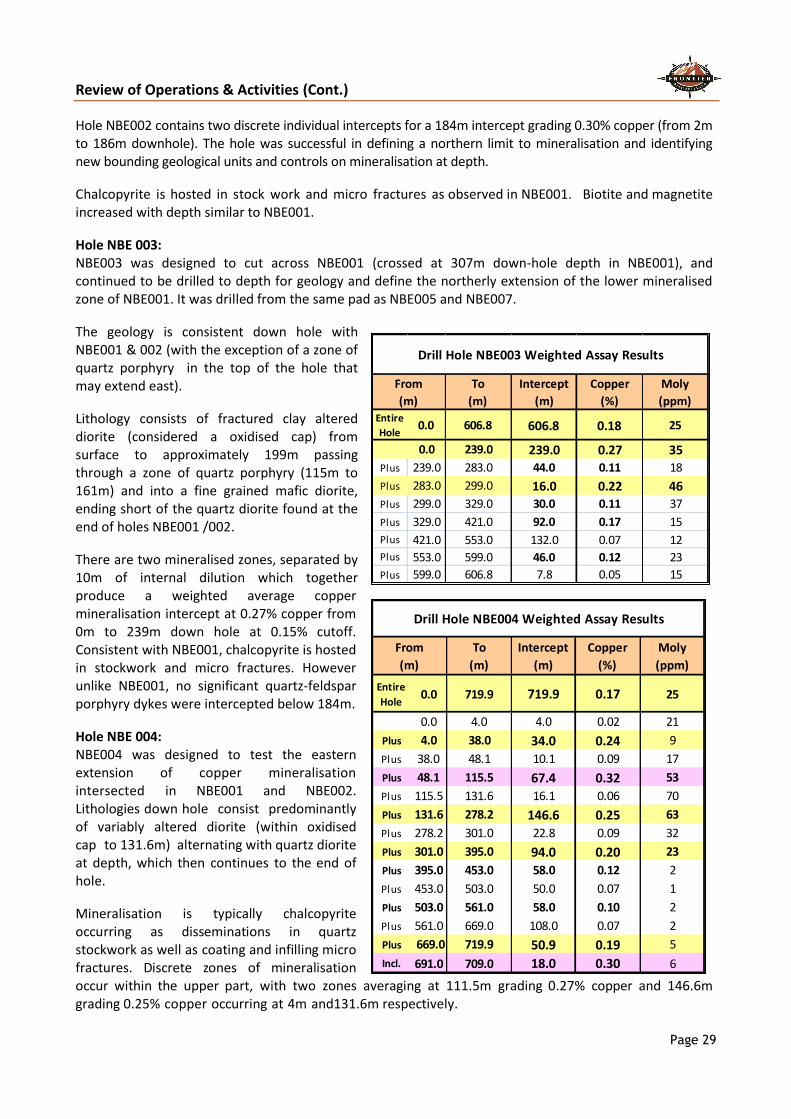
Hole NBE002 contains two discrete individual intercepts for a 184m intercept grading 0.30% copper (from 2m to 186m downhole). The hole was successful in defining a northern limit to mineralisation and identifying new bounding geological units and controls on mineralisation at depth.
Chalcopyrite is hosted in stock work and micro fractures as observed in NBE001. Biotite and magnetite increased with depth similar to NBE001.
Hole NBE 003:
NBE003 was designed to cut across NBE001 (crossed at 307m down-hole depth in NBE001), and continued to be drilled to depth for geology and define the northerly extension of the lower mineralised zone of NBE001. It was drilled from the same pad as NBE005 and NBE007.
The geology is consistent down hole with NBE001 & 002 (with the exception of a zone of quartz porphyry in the top of the hole that may extend east).
Lithology consists of fractured clay altered diorite (considered a oxidised cap) from surface to approximately 199m passing through a zone of quartz porphyry (115m to 161m) and into a fine grained mafic diorite, ending short of the quartz diorite found at the end of holes NBE001 /002.
There are two mineralised zones, separated by 10m of internal dilution which together produce a weighted average copper mineralisation intercept at 0.27% copper from 0m to 239m down hole at 0.15% cutoff. Consistent with NBE001, chalcopyrite is hosted in stockwork and micro fractures. However unlike NBE001, no significant quartz-feldspar porphyry dykes were intercepted below 184m.
Hole NBE 004:
NBE004 was designed to test the eastern extension of copper mineralisation intersected in NBE001 and NBE002. Lithologies down hole consist predominantly of variably altered diorite (within oxidised cap to 131.6m) alternating with quartz diorite at depth, which then continues to the end of hole.
Mineralisation is typically chalcopyrite occurring as disseminations in quartz stockwork as well as coating and infilling micro fractures. Discrete zones of mineralisation occur within the upper part, with two zones averaging at 111.5m grading 0.27% copper and 146.6m grading 0.25% copper occurring at 4m and131.6m respectively.
Review of Operations & Activities (Cont.)
Page 30
To
(m)
Intercept
(m)
Copper
(%)
Moly
(ppm)
Entire
Hole0.0 593.5 593.5 0.21 23
0.0 18.0 18.0 0.14 11
Plus 18.0 324.8 306.8 0.28 30
Incl. 36 50 14 0.49 5Plus 324.8 424.0 99.2 0.12 11
Plus 424.0 472.0 48.0 0.20 23Plus 472.0 510.0 38.0 0.09 11
Plus 510.0 524.0 14.0 0.20 20Plus 524.0 540.0 16.0 0.09 28
Plus 540.0 580.0 40.0 0.18 16Plus 580.0 590.0 10.0 0.12 19
Plus 590.0 593.5 3.5 0.23 4
From
(m)
Drill Hole NBE005 Weighted Assay Results
To
(m)
Intercept
(m)
Copper
(%)
Moly
(ppm)
Entire
Hole0.0 598.3 598.3 0.19 25
3.5 236.0 232.5 0.27 21
Incl. 16.0 38.0 22.0 0.35 19
and 86.0 150.0 64.0 0.34 21
Plus 236.0 308.0 72.0 0.07 15
Plus 308.0 528.0 220.0 0.14 25
incl. 356.0 396.0 40.0 0.19 24
Incl. 396.0 446.0 16.0 0.23 49
Plus 528.0 598.3 70.3 0.17 50
Incl. 581.0 592.0 11.0 0.24 117
Drill Hole NBE006 Weighted Assay Results
From
(m)
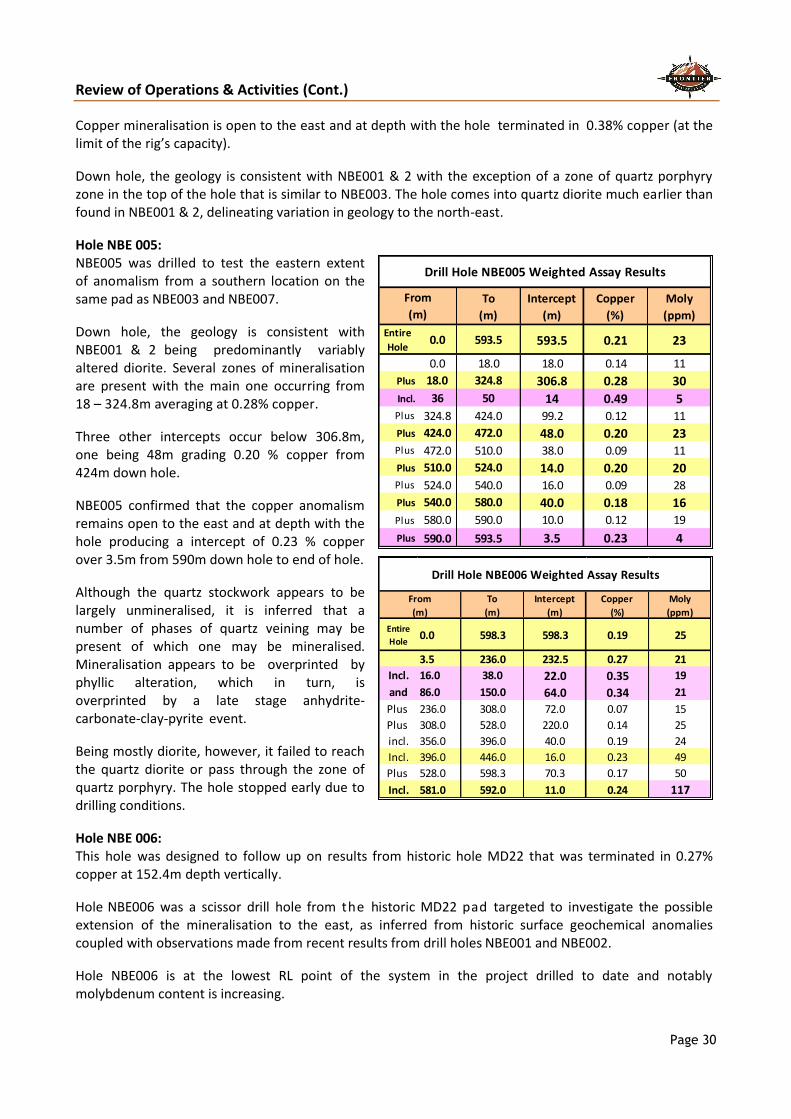
Copper mineralisation is open to the east and at depth with the hole terminated in 0.38% copper (at the limit of the rig’s capacity).
Down hole, the geology is consistent with NBE001 & 2 with the exception of a zone of quartz porphyry zone in the top of the hole that is similar to NBE003. The hole comes into quartz diorite much earlier than found in NBE001 & 2, delineating variation in geology to the north-east.
Hole NBE 005: NBE005 was drilled to test the eastern extent of anomalism from a southern location on the same pad as NBE003 and NBE007.
Down hole, the geology is consistent with NBE001 & 2 being predominantly variably altered diorite. Several zones of mineralisation are present with the main one occurring from 18 – 324.8m averaging at 0.28% copper.
Three other intercepts occur below 306.8m, one being 48m grading 0.20 % copper from 424m down hole.
NBE005 confirmed that the copper anomalism remains open to the east and at depth with the hole producing a intercept of 0.23 % copper over 3.5m from 590m down hole to end of hole.
Although the quartz stockwork appears to be largely unmineralised, it is inferred that a number of phases of quartz veining may be present of which one may be mineralised. Mineralisation appears to be overprinted by phyllic alteration, which in turn, is overprinted by a late stage anhydrite- carbonate-clay-pyrite event.
Being mostly diorite, however, it failed to reach the quartz diorite or pass through the zone of quartz porphyry. The hole stopped early due to drilling conditions.
Hole NBE 006:
This hole was designed to follow up on results from historic hole MD22 that was terminated in 0.27% copper at 152.4m depth vertically.
Hole NBE006 was a scissor drill hole from the historic MD22 pad targeted to investigate the possible extension of the mineralisation to the east, as inferred from historic surface geochemical anomalies coupled with observations made from recent results from drill holes NBE001 and NBE002.
Hole NBE006 is at the lowest RL point of the system in the project drilled to date and notably molybdenum content is increasing.

Review of Operations & Activities (Cont.)
Page 31
To
(m)
Intercept
(m)
Copper
(%)
Moly
(ppm)Entire
Hole0.0 602.7 602.7 0.17 11
0 138 138 0.23 13
Incl. 0.0 12.0 12.0 0.43 8
Plus 12.0 40.4 28.4 0.17 16
Plus 40.4 52.0 11.6 0.41 14
Plus 52.0 116.0 64.0 0.18 15
Plus 116.0 138.0 22.0 0.24 8
138.0 224.0 86.0 0.14 8
224.0 320.0 96.0 0.10 4
320.0 436.0 116.0 0.16 12
436.0 602.7 166.7 0.21 15
From
(m)
Drill Hole NBE007 Weighted Assay Results
The collar is located in the southeast and the consistent upper large copper intercepts (the first 200m+ in the holes) deliver a apparent continuous mineralisation length of 630m as by collar distance, and a length of ~760m at ~200m depth in the holes (as defined between NBE002 and NBE006). This is still open to the south and north, and perpendicularly to the East and West plus at depth.
Coring started from an oxidised, brecciated zone with dominant magnetite-pyrite- chalcopyrite in matrix that extends 50 metres from the surface. Minor barren andesitic to diorite dykes and sills cut through the extensive intrusive breccia zone locally. The dykes post-date mineralisation and locally destroy or degrade existing hydrothermal alteration and mineralisation.
The intrusive breccia zone consists of mineralised and unmineralised clasts of various composition and sizes. Quartz feldspar diorite, with associated porphyry clasts, is dominant with minor fine grained diorite and andesite. Mineralisation in the breccia is erratic and presumed to be associated with magnetite, as clasts and disseminations at lower levels are encouraging for continuing exploration.
Down hole, the geology is consistent with the other holes drilled at Esis. With the top of the hole being diorite passing into quartz porphyry into quartz diorite back into diorite, there are some minor un-mineralised crosscutting dykes present. The hole terminated 100m early due to drilling conditions. Copper mineralisation in the main intercept is in fractured clay altered diorite and intrusive breccias with varying amounts of magnetite, quartz, chalcopyrite and various alteration types.
Multiple mineralised zones are present; the upper part of the hole is defined by one zone, 232.5m grading 0.27% copper (from 3.5m). Below this main intercept there is a broad continuous zone of weaker mineralisation from 308m to EOH (averaging 0.15 % copper) and contains nine intercepts > 0.2 % copper.
Hole NBE 007: NBE007 was drilled on the same pad as NBE003 and NBE005 and was designed to test the historically identified quartz porphyry and encouraging surface grades to the south. Mineralisation occurs in multiple zones. This is the first hole with a moderate variation from the upper 200m strong mineralised zone as reported in holes NBE001 to NBE006. The variation consists of 4 discreet upper intercepts in the top 200m (contained within a 0.19 % copper broad weaker anomaly from surface to 236m). Also, present is a broad zone from 436m (averaging 0.21% copper) to EOH, that contains multiple discrete intercepts. The hole terminated 100m early due to drilling conditions.
The core is strongly weathered to 112m passing into fresh diorite with discrete zones of quartz porphyry and quartz diorite. Breccias – stock-work occurs in multiple instances and copper mineralization generally consists of chalcopyrite ± trace bornite from near surface; minor-trace molybdenite from 112m. Pyrrhotite is recorded as the dominant mineral from 555m. There are multiple small un-mineralised crosscutting dykes. Alteration is typically clay at surface passing to potassium feldspar with increasing biotite. Gypsum/anhydrite alteration is strong between 238 to 433m. From 524m strong quartz stock-working is pervasive.
Review of Operations & Activities (Cont.)
Page 32
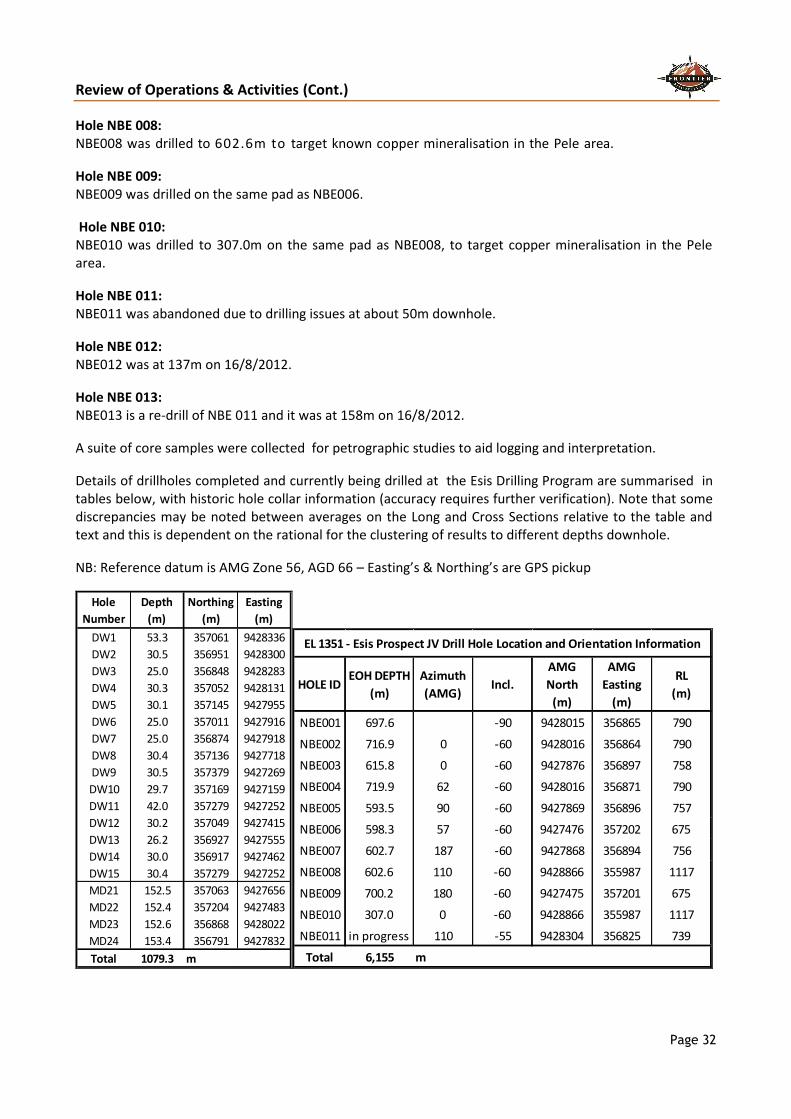
Hole NBE 008:
NBE008 was drilled to 602.6m to target known copper mineralisation in the Pele area.
Hole NBE 009:
NBE009 was drilled on the same pad as NBE006.
Hole NBE 010: NBE010 was drilled to 307.0m on the same pad as NBE008, to target copper mineralisation in the Pele area.
Hole NBE 011: NBE011 was abandoned due to drilling issues at about 50m downhole.
Hole NBE 012: NBE012 was at 137m on 16/8/2012.
Hole NBE 013: NBE013 is a re-drill of NBE 011 and it was at 158m on 16/8/2012.
A suite of core samples were collected for petrographic studies to aid logging and interpretation.
Details of drillholes completed and currently being drilled at the Esis Drilling Program are summarised in tables below, with historic hole collar information (accuracy requires further verification). Note that some discrepancies may be noted between averages on the Long and Cross Sections relative to the table and text and this is dependent on the rational for the clustering of results to different depths downhole.
NB: Reference datum is AMG Zone 56, AGD 66 – Easting’s & Northing’s are GPS pickup
Hole
Number
Depth
(m)
Northing
(m)
Easting
(m)
DW1 53.3 357061 9428336
DW2 30.5 356951 9428300
DW3 25.0 356848 9428283
DW4 30.3 357052 9428131
DW5 30.1 357145 9427955
DW6 25.0 357011 9427916
DW7 25.0 356874 9427918
DW8 30.4 357136 9427718
DW9 30.5 357379 9427269
DW10 29.7 357169 9427159
DW11 42.0 357279 9427252
DW12 30.2 357049 9427415
DW13 26.2 356927 9427555
DW14 30.0 356917 9427462
DW15 30.4 357279 9427252
MD21 152.5 357063 9427656
MD22 152.4 357204 9427483
MD23 152.6 356868 9428022
MD24 153.4 356791 9427832
Total 1079.3 m
HOLE IDEOH DEPTH
(m)
Azimuth
(AMG)Incl.
AMG
North
(m)
AMG
Easting
(m)
RL
(m)
NBE001 697.6 -90 9428015 356865 790
NBE002 716.9 0 -60 9428016 356864 790
NBE003 615.8 0 -60 9427876 356897 758
NBE004 719.9 62 -60 9428016 356871 790
NBE005 593.5 90 -60 9427869 356896 757
NBE006 598.3 57 -60 9427476 357202 675
NBE007 602.7 187 -60 9427868 356894 756
NBE008 602.6 110 -60 9428866 355987 1117
NBE009 700.2 180 -60 9427475 357201 675
NBE010 307.0 0 -60 9428866 355987 1117
NBE011 in progress 110 -55 9428304 356825 739
Total 6,155 m
EL 1351 - Esis Prospect JV Drill Hole Location and Orientation Information
Review of Operations & Activities (Cont.)
Page 33
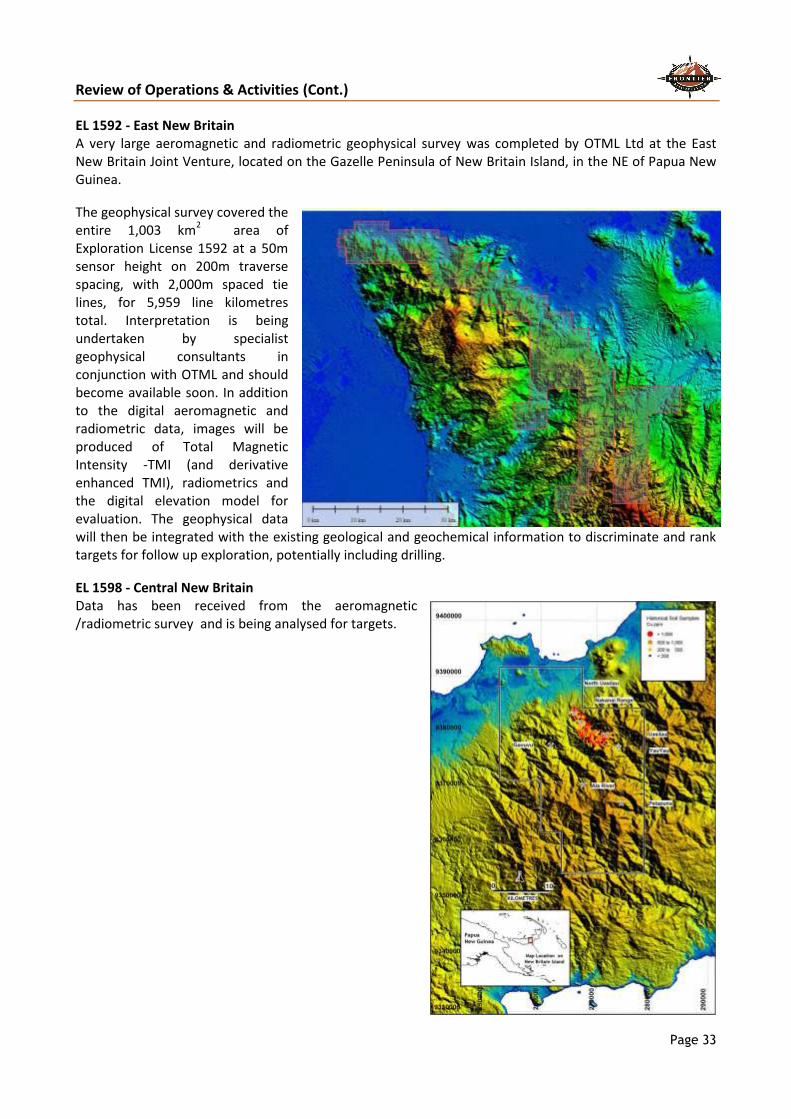
EL 1592 - East New Britain A very large aeromagnetic and radiometric geophysical survey was completed by OTML Ltd at the East New Britain Joint Venture, located on the Gazelle Peninsula of New Britain Island, in the NE of Papua New Guinea.
The geophysical survey covered the entire 1,003 km
2 area of
Exploration License 1592 at a 50m sensor height on 200m traverse spacing, with 2,000m spaced tie lines, for 5,959 line kilometres total. Interpretation is being undertaken by specialist geophysical consultants in conjunction with OTML and should become available soon. In addition to the digital aeromagnetic and radiometric data, images will be produced of Total Magnetic Intensity -TMI (and derivative enhanced TMI), radiometrics and the digital elevation model for evaluation. The geophysical data will then be integrated with the existing geological and geochemical information to discriminate and rank targets for follow up exploration, potentially including drilling.
EL 1598 - Central New Britain Data has been received from the aeromagnetic /radiometric survey and is being analysed for targets.
Review of Operations & Activities (Cont.)
Page 34
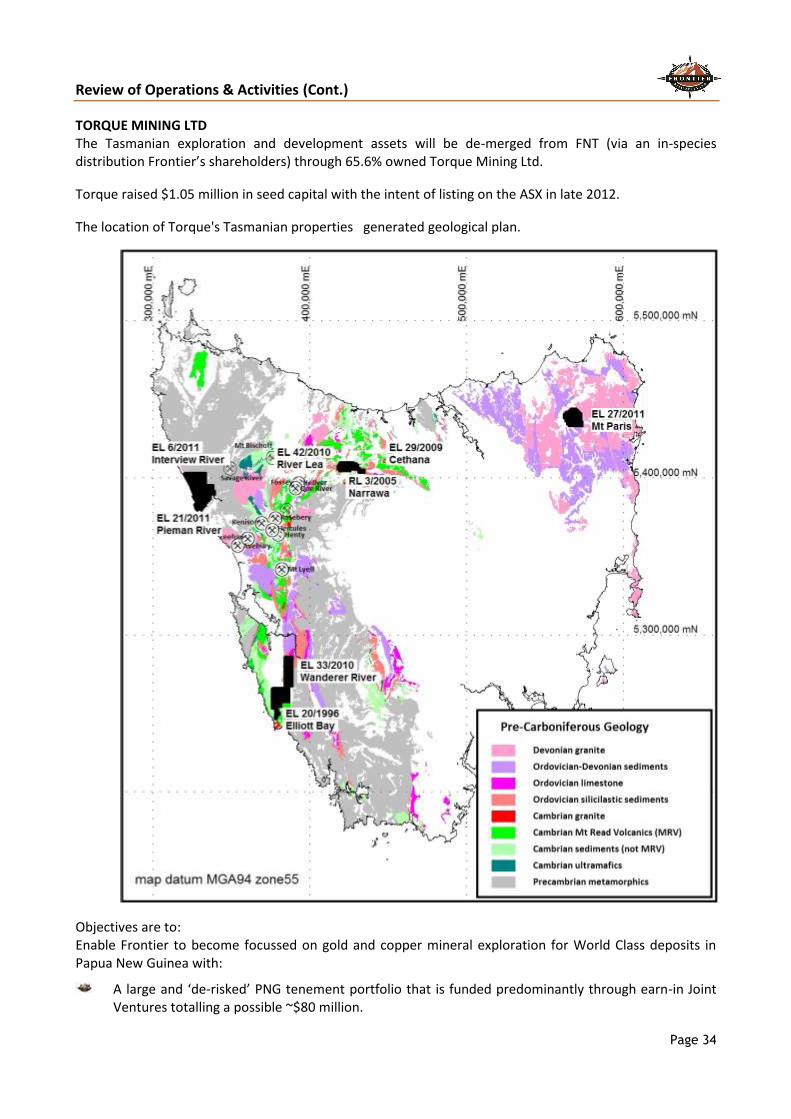
TORQUE MINING LTD The Tasmanian exploration and development assets will be de-merged from FNT (via an in-species distribution Frontier’s shareholders) through 65.6% owned Torque Mining Ltd.
Torque raised $1.05 million in seed capital with the intent of listing on the ASX in late 2012.
The location of Torque's Tasmanian properties generated geological plan.
Objectives are to: Enable Frontier to become focussed on gold and copper mineral exploration for World Class deposits in Papua New Guinea with:
A large and ‘de-risked’ PNG tenement portfolio that is funded predominantly through earn-in Joint Ventures totalling a possible ~$80 million.
Review of Operations & Activities (Cont.)
Page 35
A 100% owned Exploration Licence (Sudest), with excellent high grade gold potential.
Very low ongoing exploration and corporate costs relative to total exploration exposure.
Substantial possible share price leverage via exploration success on any of 8 diverse projects.
Enable Torque Mining Ltd to become a Tasmanian focussed mineral exploration and development company to:
Undertake systematic and thorough exploration of the highly prospective Moina Project for large Intrusive Related Gold Deposits.
Increase resources at Moina’s modest Stormont + Narrawa precious and base metal skarn deposits targeting recently defined 3D-IP anomalies and advance the deposits to production.
Leverage success from persistence, with the excellent exploration potential shown by the high-grade (40% Pb/Zn + high Ag) massive sulphide drill intersections at the SMRV Project.
Each company will be more able to cater to its respective strengths, investors and markets, with enhanced possibilities for share price appreciation via exploration and/or development success.
Frontier Resources will benefit through a modest vendor equity in Torque Mining and a 10% carried interest (to completion of bankable feasibility studies) in all tenements except the SMRV. And benefit Frontier's shareholders through an in-specie distribution of shares in Torque Mining.
$1.05 million was raised in seed capital in June 2012, at $0.05/share. A total of 20,940,000 shares were issued post year end and Torques total share capital is now 60,940,000. Frontier Resources Ltd own 40,000,000 shares and 30,000,000 shares will be distributed to FNT shareholders as an in-species distribution after receiving shareholder approval.
Managing Director - Bob McNeil subscribed for $300,000, Chairman - Peter McNeil subscribed for $100,000 and Torque and Frontier directors & employees subscribed for $110,000.
Strategy and Details Torque Mining Ltd has seven Exploration Licenses and Frontier Resources Ltd has eight granted Exploration Licenses and one Retention License (combined in four projects) in Tasmania and 8 granted Exploration Licenses in Papua New Guinea. Five exploration licenses in PNG are being funded by JV partner Ok Tedi Mining Ltd and two exploration licenses will be funded by Newcrest Mining Ltd. Frontier will focus its exploration on the recently granted 100% owned Sudest license and other reconnaissance Exploration licenses in New Britain (when they are granted). Frontier considers that an Initial Public Offering, with an in-specie distribution of shares to shareholders is the best course of action to realise the value of the Tasmanian projects. The reasons for the “spin off” can be summarised as follows:
Frontier has spent $8.6 million in Tasmania since 2002. Between 1994 and 2002 Frontier’s parent Macmin and its Joint Venture partners spent an additional $1.2 million (estimated).
Frontier’s market capitalisation is not reflected in and does not benefit from the Tasmanian Projects
even though the Moina Project is rated as a top priority project with high-grade gold and base metal resources in a diverse metallogenic province, and is a development ready project.
The Tasmanian projects do “not fit” with Frontier’s main focus of PNG or with Frontier’s PNG exploration and J/V’s with OK Tedi and Newcrest.
Review of Operations & Activities (Cont.)
Page 36
The Moina Project has many possible large, high-value drill ready targets. Initial testing of these
targets requires an optimum budget of $4 million to $5 million over two years – primarily drilling. Frontier would need to raise funds to support such a program if the “spin off” did not occur .
Frontier considers a “spin off” would provide the best benefit for shareholders (rather than a joint venture with another company). Effectively we create the company to be the Joint Venture partner.
It is planned (subject to shareholder and regulatory approval) to distribute approximately 30 million shares in Torque Mining Ltd (approximately 1 Torque share for about every 10 Frontier shares held that creates a marketable parcel- the final distribution figure will be announced at a later date) to shareholders. Frontier would also retain 10 million Torque Mining Ltd shares, plus a 10% carried interest to bankable feasibility in all projects except the SMRV. Frontier's Chairman/Managing Director, Peter McNeil (MSc.) will become the Non-executive Chairman of Torque Mining Ltd and Frontier Director Graham Fish will resign from its Board to join the Torque Board.
R.D (Bob) McNeil has been appointed Managing Director of Torque Mining and is managing the Initial Public Offering. Bob is a University of Tasmania geology graduate (MSc. and B.Sc. Hons.) with 53 years minerals exploration, mine development and corporate experience. He first explored in the SMRV project area in the Thirkell Hill Block in 1975 and has had various continuing associations to the present.
Grant MacDonald is Tasmanian Exploration Manager and supervises the Tasmanian exploration. Grant is also a University of Tasmania graduate B.Sc. (Hon), with more the 20 years of experience in Tasmanian exploration including with Beaconsfield Gold and Bass Resources
Torque’s strategy is to focus exploration and development primarily on the Moina Project, with lesser emphasis on the SMRV Project and the “grass roots” projects recently acquired by Frontier. In particular Torque’s program is as follows:
Moina Project Strategy: Complete feasibility on existing resources – develop mine and cash flow. Extend existing resources and “look alike” systems to existing resources by drilling targets defined by
already completed geochemistry and geophysical surveys. Drill test major geophysical targets for possible large gold and or tin/tungsten systems.
SMRV Project Strategy:
Drill test anomalies identified through a VTEM geophysical program. Drill down plunge from known drill intersections of high grade massive sulphides. Review gold potential (previous drill intersection of 3m of 17.5g/t). Seek J/V partner.
The Moina Project can be summarised as follows:
Torque controls almost all of a metallogenic district with gold/ bismuth/ tin/ tungsten/ molybdenum/ fluorite mineralisation in drill holes.
The Indicated Mineral Resource at the Stormont and Narrawa prospects together total 313,600 tonnes at 2.49 g/t gold plus credits in bismuth, silver, lead and zinc. Contained metal is 25,000 ounces gold + 126,000 ounces silver + 256 tonnes bismuth + 2311 tonnes lead + 1953 tonnes zinc.
Review of Operations & Activities (Cont.)
Page 37
Individual project resources are as follows:
Stormont - Indicated Mineral Resource of 150,800 tonnes at 2.89 g/t gold + 0.17 % bismuth for 14,000 ounces gold + 256 tonnes of bismuth.
Narrawa - Indicated Mineral Resource 162,764 tonnes at 2.11g/t gold + 1.42% lead + 1.20% zinc + 202.5g/t silver for 11,043 ounces gold + 2,311 tonnes lead + 1,953 tonnes zinc + 107,288 ounces silver.
- Inferred Mineral Resource of 46,574 tonnes at 2.07g/t gold + 0.98% lead + 0.81% zinc + 16.0g/t silver for 3,100 ounces gold + 456 tonnes lead + 377 tonnes zinc + 23,961 ounces silver.
Torque has recently upgraded the resources at Stormont from the Inferred to the Indicated category. Exceptional high near surface gold grades have been identified at Stormont including 7.3m at 23.5g/t,
17.6m at 10.80g/t, plus bismuth, lead, zinc and silver credits. Refer to previous ASX releases for details of all drill holes. The above grades are not representative of all holes.
Significant known deposits in the district owned by others or mined out include Australia’s and one of the world's largest undeveloped fluorite (plus gold and other metals) deposits, (Moina Fluorite Skarn), the Shepherd and Murphy Mine and Hugo Skarn.
Geophysical (3D Induced Polarisation, Aeromagnetics and Airborne Electromagnetics) and geochemical surveys completed or reviewed by Frontier have defined many drill ready targets – both extensions of existing/known mineralisation and possible previously unknown mineralisation beneath basalt cover or at depth related to the Dolcoath Granite.
The geological environment has potential for large and disseminated gold deposits and major tin and tungsten systems as well as additional medium sized deposits such as the resource above.
The SMRV project can be summarised as follows: 45km strike length of Mt Read Volcanics, host to World Class deposits, such as Mt Lyell, Rosebery and
Hellyer. Most exploration has to date been concentrated in one small area at Wart Hill with high grade silver,
lead, zinc, gold, in drill hole such as 0.75m at 28.6% zinc, 14.6% lead, 1.04g/t gold; 7.1m at 11.18% zinc, 5.58% lead and 1.48g/t gold. See previous ASX releases for all drill hole results. The above results are not representative of all holes.
High-grade surface outcrops such as 4m at 17.9% zinc + 10.2% lead + 132g/t silver + 0.6g/t gold and 3.0m at 21.9% zinc + 13.9% lead + 680g/t silver + 0.80g/t gold.
Most of the 45km long volcanic belt is relatively unexplored, partly due to the remote nature of some of the area.
A recent VTEM helicopter borne survey defined additional drill targets. Drilling will initially focus on possible down pitch extensions from the above high grade intersections
and the new VTEM targets.
Moina Project 3D Induced Polarisation Survey A 25 square kilometres Three Dimensional Induced Polarisation (3D-IP) Survey was successfully completed at the Moina Project in north central Tasmania in February 2012 and it produced chargeability and resistivity data extending from surface to approximately 500m depth.
The survey and was very successful, demonstrating that the known mineralisation at the Stormont and Narrawa Deposits occurs in higher conductivity zones. Thus by extrapolation there could also be other significant mineralisation beneath basalt cover or mineralisation that does not reach the present surface in the many other defined conductivity zones.

Review of Operations & Activities (Cont.)
Page 38
Several large chargeability anomalies were also demonstrated that could represent disseminated sulphides in the deeper sub-surface. Such disseminated sulphides may be associated with gold mineralisation, as at the historic Packetts Prospect, near Narrawa.
The data have demonstrated: “Look alike” anomalies/situations to the Stormont and Narrawa Deposits that have never been
explored beneath basalt cover; and Major anomalies that could represent large Intrusive Related Gold (Disseminated Sulphide) systems.
Possible extensions to the existing precious and base metal Indicated Resources at Stormont and Narrawa. The chargeability and resistivity (conductivity is the inverse of resistivity) data is computer processed to produce horizontal “slices” below surface every 50m and cross sections at either 100, 125 or 250m intervals.
Low resistivity (i.e. high conductivity) could reflect zones of more massive sulphides, high chargeability could reflect disseminated sulphides in a host rock (and more modest values could define smaller bodies of sulphides) and high resistivity could reflect silicification associated with quartz vein type deposits Other geological features such as carbonaceous zones, structures and saline water may also cause anomalies.
This was the largest, single 3D-IP Survey ever conducted in Tasmania to our knowledge.
The IP Survey had multiple objectives as follows:
1. To explore for extensions to existing resources at Stormont and Narrawa.
2. To define the chargeability, resistivity and conductivity characteristics of Stormont and Narrawa and apply such characteristics to similar anomalies defined by the survey throughout the Moina Project. Similar results could thus reflect gold deposits similar to Narrawa and Stormont, particularly if also supported by anomalous geochemistry and/or similar magnetic anomalism.
3. To explore for mineralised systems beneath the extensive basalt cover in the South of the Project area (which prevents geochemistry and prospecting to be effective exploration methods).
Review of Operations & Activities (Cont.)
Page 39
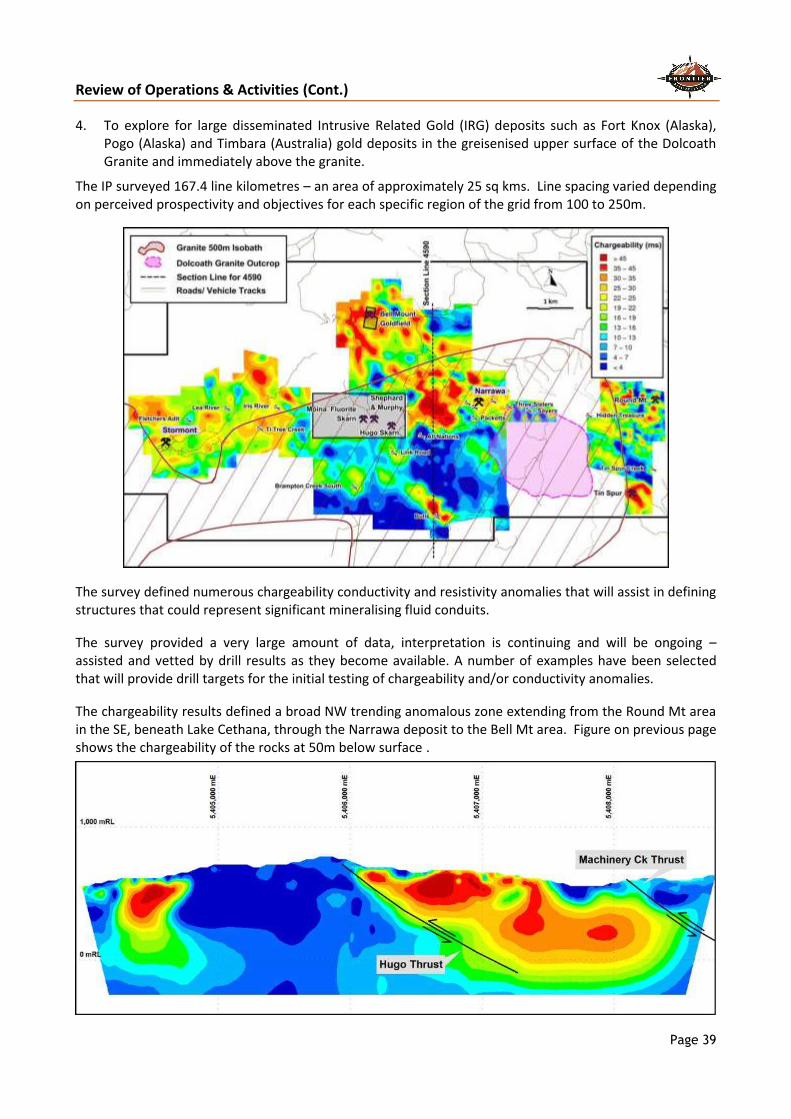
4. To explore for large disseminated Intrusive Related Gold (IRG) deposits such as Fort Knox (Alaska), Pogo (Alaska) and Timbara (Australia) gold deposits in the greisenised upper surface of the Dolcoath Granite and immediately above the granite.
The IP surveyed 167.4 line kilometres – an area of approximately 25 sq kms. Line spacing varied depending on perceived prospectivity and objectives for each specific region of the grid from 100 to 250m.
The survey defined numerous chargeability conductivity and resistivity anomalies that will assist in defining structures that could represent significant mineralising fluid conduits.
The survey provided a very large amount of data, interpretation is continuing and will be ongoing – assisted and vetted by drill results as they become available. A number of examples have been selected that will provide drill targets for the initial testing of chargeability and/or conductivity anomalies.
The chargeability results defined a broad NW trending anomalous zone extending from the Round Mt area in the SE, beneath Lake Cethana, through the Narrawa deposit to the Bell Mt area. Figure on previous page shows the chargeability of the rocks at 50m below surface .
Review of Operations & Activities (Cont.)
Page 40
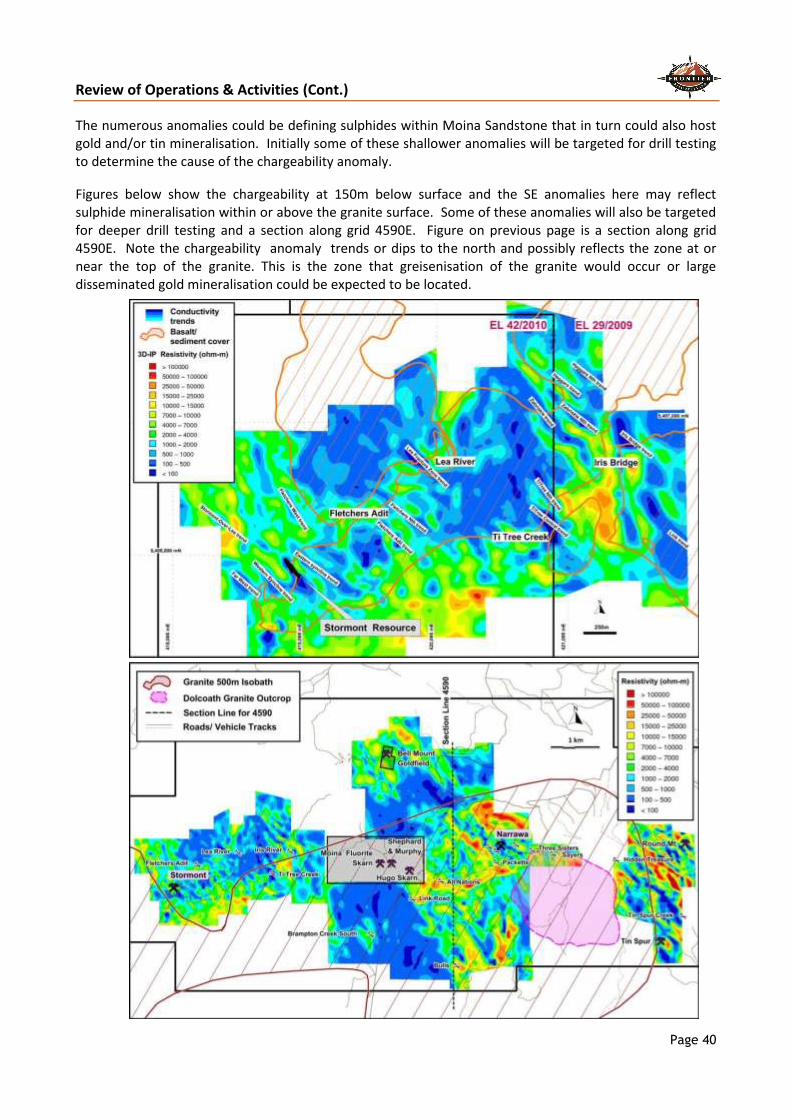
The numerous anomalies could be defining sulphides within Moina Sandstone that in turn could also host gold and/or tin mineralisation. Initially some of these shallower anomalies will be targeted for drill testing to determine the cause of the chargeability anomaly.
Figures below show the chargeability at 150m below surface and the SE anomalies here may reflect sulphide mineralisation within or above the granite surface. Some of these anomalies will also be targeted for deeper drill testing and a section along grid 4590E. Figure on previous page is a section along grid 4590E. Note the chargeability anomaly trends or dips to the north and possibly reflects the zone at or near the top of the granite. This is the zone that greisenisation of the granite would occur or large disseminated gold mineralisation could be expected to be located.

Review of Operations & Activities (Cont.)
Page 41
Resistivity/conductivity data defines Stormont mineralisation well one figure shows the regional conductivity (blue) at 50m below surface, and another figure shows the detailed conductivity (blue) in the Stormont area. Similar conductivity anomalies as indicated on Figures on previous page in the Stormont area will be drill tested. Many of these conductivity anomalies also have co-incident magnetic anomalies, indicating skarn mineralisation that further enhances these targets.
The Narrawa Project (Higgs, West Higgs, Narrawa Reward, NC4) conductivity anomalies, in association with gold in soil anomalies, have defined extensions to the mineralisation and adjacent new targets.
Review of Operations & Activities (Cont.)
Page 42
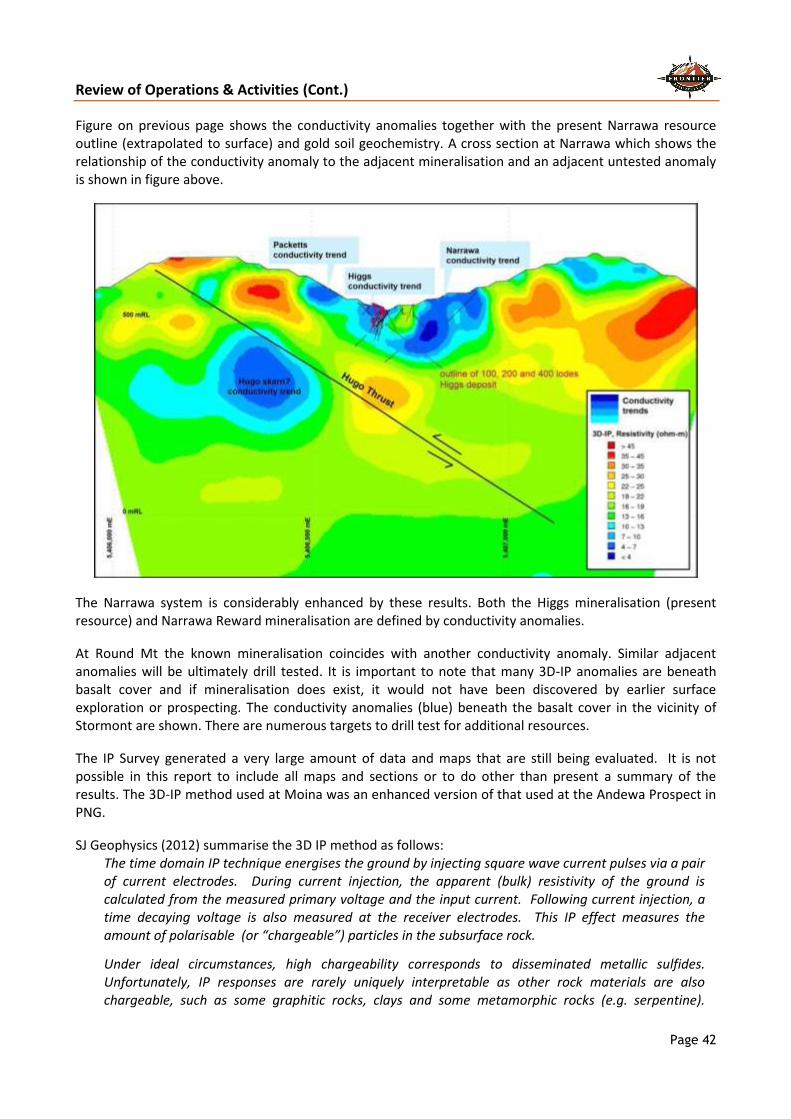
Figure on previous page shows the conductivity anomalies together with the present Narrawa resource outline (extrapolated to surface) and gold soil geochemistry. A cross section at Narrawa which shows the relationship of the conductivity anomaly to the adjacent mineralisation and an adjacent untested anomaly is shown in figure above.
The Narrawa system is considerably enhanced by these results. Both the Higgs mineralisation (present resource) and Narrawa Reward mineralisation are defined by conductivity anomalies.
At Round Mt the known mineralisation coincides with another conductivity anomaly. Similar adjacent anomalies will be ultimately drill tested. It is important to note that many 3D-IP anomalies are beneath basalt cover and if mineralisation does exist, it would not have been discovered by earlier surface exploration or prospecting. The conductivity anomalies (blue) beneath the basalt cover in the vicinity of Stormont are shown. There are numerous targets to drill test for additional resources.
The IP Survey generated a very large amount of data and maps that are still being evaluated. It is not possible in this report to include all maps and sections or to do other than present a summary of the results. The 3D-IP method used at Moina was an enhanced version of that used at the Andewa Prospect in PNG.
SJ Geophysics (2012) summarise the 3D IP method as follows: The time domain IP technique energises the ground by injecting square wave current pulses via a pair of current electrodes. During current injection, the apparent (bulk) resistivity of the ground is calculated from the measured primary voltage and the input current. Following current injection, a time decaying voltage is also measured at the receiver electrodes. This IP effect measures the amount of polarisable (or “chargeable”) particles in the subsurface rock.
Under ideal circumstances, high chargeability corresponds to disseminated metallic sulfides. Unfortunately, IP responses are rarely uniquely interpretable as other rock materials are also chargeable, such as some graphitic rocks, clays and some metamorphic rocks (e.g. serpentine).

Review of Operations & Activities (Cont.)
Page 43
Therefore, it is prudent from a geological perspective to incorporate other data sets to assist in interpretation.
IP and resistivity measurements are generally considered repeatable to within about five percent. However, changing field conditions, such as variable water content or electrode contact, reduce the overall repeatability. These measurements are influenced to a large degree by the rock materials near the surface or, more precisely, near the measurement electrodes. In the past, interpretation of a traditional IP pseudosection was often uncertain because strong responses located near the surface could mask a weaker one at depth. We attempt to overcome this uncertainty by employing geophysical inversion to better interpret the data.
Three-dimensional IP surveys have been designed to take advantage of recent advances in 3D inversion techniques. Unlike conventional 2DIP, the electrode arrays are not restricted to an inline geometry. Ideally, a 3DIP survey would consist of a random assortment of current injections and receiver dipoles, also of randomised azimuths. Unfortunately, logistical considerations usually prohibit a completely randomised approach.
In the standard 3DIP configuration, a receiver array was established along one survey line while current lines are located on two adjacent lines lying on either side of the receiver line. Current injections are performed sequentially at fixed increments (25, 50, 100 or 200m) along the current lines. By injecting current at multiple locations along current lines adjacent to receiver arrays, data acquisition rates are significantly improved over conventional surveys. Meanwhile, geophysical data are collected along a receiver array which consists of dipoles usually laid out along even intervals dictated partly by the receiver cable.
The Volterra system provides much more flexibility because each DABStix receiver records a single dipole, thus eliminating the need for specialised receiver cables and a centralised receiver control station. Dipoles can be oriented in any direction, can be of varying lengths, and completely avoid inaccessible areas if necessary.
Although more randomised than conventional 3DIP, most Volterra surveys still follow some form of cut lines, alternating receiver dipoles and current injections and deviating where necessary for geophysical or logistical purposes. In addition, cross-line receiver dipoles are often used to increase near-surface resolution and allow for larger spacing between lines. The specifics of each survey are customised before the survey starts and sometimes during the survey by the field geophysicist.
Stormont Gold – Bismuth Resource Upgraded The drilling program at the Stormont Deposit successfully upgraded the previous Inferred Resource (ASX Release 29/7/2009) to an Indicated Resource. A table belowable shows tonnes and grades of gold, bismuth and silver mineralisation estimated at various cut-off grades gold.
The Indicated Resource contains similar tonnages, grades and total contained gold and bismuth to the previous Inferred Resource, that was defined with 16 drill holes compared to 44 drill holes. This is an encouraging result suggesting the mineralisation is relatively consistent in grade and distribution.
The nearby Narrawa Indicated Resource contains 162,750 tonnes grading 2.11g/t gold + 20.5g/t silver + 1.42% lead + 1.20% zinc for 11,000ozs gold + 107,000ozs silver + significant credits in lead and zinc. In addition, Narrawa has an Inferred Resource of 47,000 tonnes grading 2.07g/t gold, for an additional 3,100 ounces of gold.
A conceptual mining study has recently been completed by a consultant Mining Engineer for the Stormont and nearby Narrawa Deposit’s combined resources containing 28,000 ounces of gold + significant base metal credits, to define a development path for these projects.

Review of Operations & Activities (Cont.)
Page 44
Drilling will continue at the Stormont and Narrawa Deposits to test and define adjacent and nearby gold/ bismuth skarn mineralisation and to further define the total extent of the gold, bismuth, silver and base metals.
The Stormont Indicated Resource is well defined by cohesive aeromagnetic and 3D-IP conductivity anomalies. There are many similar aeromagnetic and conductivity anomalies in the vicinity of Stormont that appear to be ‘look-a-likes’. Most of these are “hidden” beneath a thin veneer of post mineralisation basalt cover and have never been prospected or tested at all.
Stormont is a skarn style stratiform, replacement deposit located in the core and on the limbs of a shallowly plunging syncline (at its NE end). The deposit is located on or very near surface, is amenable to open pit mining, and ranges in stratiform thickness between 10 and 15m.
Gold
g/t
Silver
g/t
Bismuth
%
Gold
ounces
Silver
ounces
Bismuth
Tonnes
0.5 150,800 2.89 3.82 0.17 14,013 18,523 256
1.0 118,500 3.47 4.06 0.19 13,222 15,470 229
1.5 84,500 4.38 4.48 0.23 11,901 12,172 197
2.0 65,600 5.15 4.74 0.26 10,863 9,998 171
2.5 55,300 5.69 5.00 0.28 10,118 8,891 154
3.0 47,400 6.17 5.21 0.30 9,404 7,941 140
3.5 39,900 6.72 5.39 0.32 8,621 6,915 126
4.0 35,700 7.07 5.48 0.31 8,116 6,291 112
4.5 30,100 7.59 5.53 0.33 7,346 5,352 98
5.0 23,200 8.45 5.71 0.34 6,304 4,260 80
Cut Off
Grade Gold
g/t
Tonnes
Grade Contained Metal
Table 1: Stormont Indicated Resource Tonnes, Grades and Contained Metal at Various Cut-Off Grades
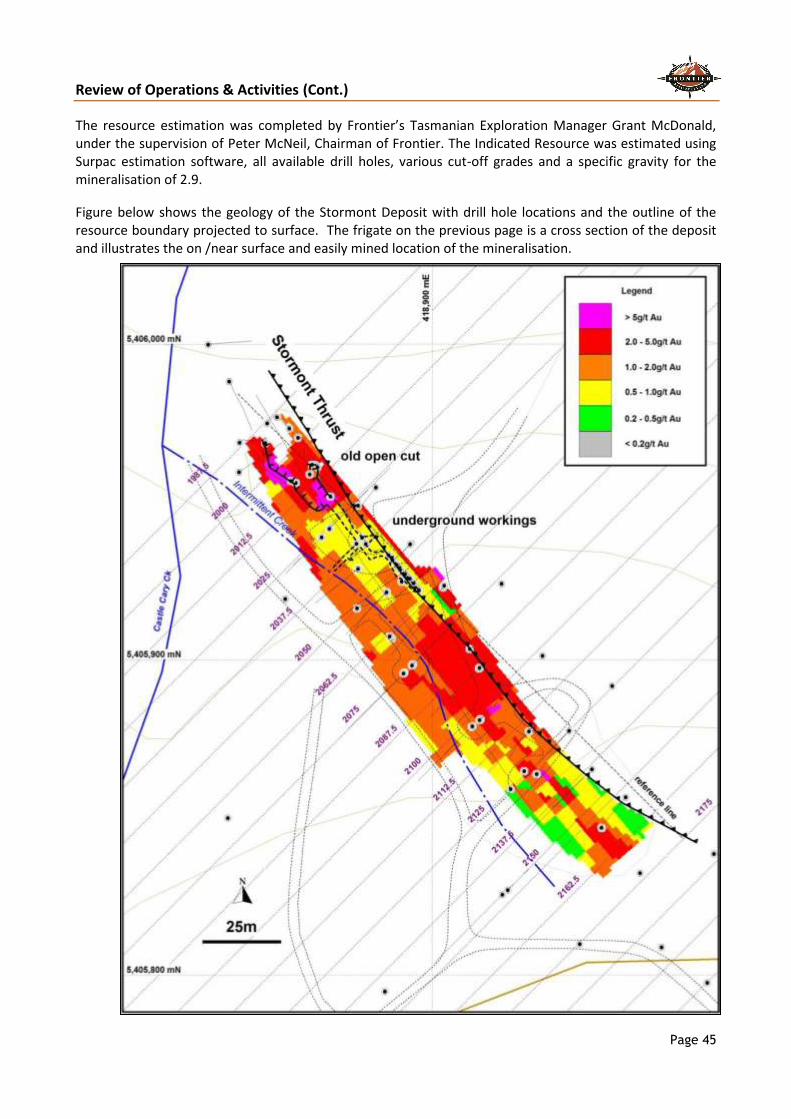
Review of Operations & Activities (Cont.)
Page 45
The resource estimation was completed by Frontier’s Tasmanian Exploration Manager Grant McDonald, under the supervision of Peter McNeil, Chairman of Frontier. The Indicated Resource was estimated using Surpac estimation software, all available drill holes, various cut-off grades and a specific gravity for the mineralisation of 2.9.
Figure below shows the geology of the Stormont Deposit with drill hole locations and the outline of the resource boundary projected to surface. The frigate on the previous page is a cross section of the deposit and illustrates the on /near surface and easily mined location of the mineralisation.

Review of Operations & Activities (Cont.)
Page 46
Hole_IDEasting
(AGD66)
Northing
(AGD66)
RL
(masl)
Depth
(m)
Azimuth
(true)Dip Type
SD1 418,890.3 5,405,925.0 629.4 145.0 266.7 -90 diamond
SD3 418,929.3 5,405,864.8 638.5 75.1 240.7 -90 diamond
SD34 418,925.0 5,405,859.2 639.2 49.0 0 -90 diamond
SD36 418,911.9 5,405,903.6 633.6 58.0 0 -90 diamond
SD39 418,876.1 5,405,916.5 629.1 61.5 74 -70 diamond
SFD001 418,864.7 5,405,938.8 626.9 38.4 225 -65 diamond
SFD002 418,864.8 5,405,939.0 626.9 18.0 225 -45 diamond
SFD003 418,867.5 5,405,942.0 626.9 33.6 45 -60 diamond
SFD004 418,867.2 5,405,941.7 627.0 38.6 45 -45 diamond
SFD005 418,893.9 5,405,898.8 631.7 31.0 45 -45 diamond
SFD006 418,893.6 5,405,898.4 631.8 33.3 0 -90 diamond
SFD007 418,891.1 5,405,896.0 631.8 36.0 225 -45 diamond
SFD008 418,890.9 5,405,895.8 631.8 22.6 225 -65 diamond
SFD009 418,915.5 5,405,881.3 635.5 26.9 45 -45 diamond
SFD010 418,915.1 5,405,881.0 635.5 47.3 45 -90 diamond
SFD011 418,915.3 5,405,881.2 635.5 18.0 45 -65 diamond
SFD012 418,912.7 5,405,878.9 635.4 34.4 225 -45 diamond
SFD013 418,912.8 5,405,879.1 635.3 30.1 225 -65 diamond
SFD014 418,924.3 5,405,827.3 644.5 59.7 45 -45 diamond
SFD17 418,885.5 5,405,921.7 629.3 33.0 224 -80 diamond
SFD18 418,885.5 5,405,921.6 629.4 30.0 224 -60 diamond
SFD19 418,885.4 5,405,921.4 629.3 28.5 224 -50 diamond
SFD20 418,914.9 5,405,897.4 634.5 34.5 225 -50 diamond
SFD21 418,915.1 5,405,897.6 634.5 34.2 225 -65 diamond
SFD22 418,933.3 5,405,863.9 638.9 21.4 39 -60 diamond
SFD23 418,876.6 5,405,929.2 628.6 26.0 231 -90 diamond
SFD24 418,876.2 5,405,928.8 628.3 25.0 231 -45 diamond
SFD25 418,876.4 5,405,929.0 628.4 23.9 231 -60 diamond
SFD26 418,887.2 5,405,906.9 629.9 20.5 0 -90 diamond
SFD27 418,903.4 5,405,923.1 630.7 35.9 215 -60 diamond
SFD28 418,903.7 5,405,923.5 630.7 39.5 215 -45 diamond
SFD29 418,903.8 5,405,923.6 630.9 33.9 215 -75 diamond
SFD30 418,893.4 5,405,937.0 629.0 35.0 225 -45 diamond
SFD33 418,943.6 5,405,877.6 637.7 31.5 223 -45 diamond
SFD35 418,886.4 5,405,908.2 629.9 33.7 47 -55 diamond
SFD36 418,954.0 5,405,846.8 643.5 37.5 225 -90 diamond
SFD39 418,961.6 5,405,856.5 643.4 27.0 225 -60 diamond
SFD41 418,882.0 5,405,954.8 628.5 12.7 218 -45.5 diamond
SFD42 418,930.8 5,405,877.4 636.5 25.5 225 -90 diamond
SFD43 418,930.8 5,405,877.4 636.5 26.7 225 -45 diamond
SFD44 418,930.8 5,405,877.4 636.5 25.1 225 -65 diamond
SFD45 418,861.0 5,405,959.0 617.5 6.5 0 -90 diamond
SFD46 418,950.8 5,405,865.3 641.3 39.0 225 -46 diamond
SFD47 418,950.8 5,405,865.4 641.3 36.0 225 -62 diamond
FRSTC01 418,838.7 5,405,969.0 618.0 11.3 52.2 4.2 channel
FRSTC02 418,846.9 5,405,968.9 616.0 2.5 229 72 channel
FRSTC03A 418,856.6 5,405,956.3 616.5 2.2 253.6 44 channel
FRSTC03B 418,855.0 5,405,956.8 618.0 5.8 253.6 channel
FRSTC04 418,895.8 5,405,922.1 617.4 1.3 219.7 0.3 channel
FRSTC06 418,850.6 5,405,977.1 617.7 5.5 133.8 -25 channel
FRSTC07 418,854.5 5,405,973.5 616.6 15.2 148.9 1.4 channel
FRSTC08 418,857.2 5,405,970.6 617.9 3.5 91.8 5.2 channel
FRSTC09 418,863.4 5,405,961.3 618.6 11.0 170.4 -4 channel
FRSTC10 418,861.8 5,405,962.0 619.1 0.7 95.8 -25.7 channel
FRSTC11 418,862.7 5,405,961.9 618.6 2.5 58.5 -9.4 channel
GFSTC01 418,867.6 5,405,951.9 617.0 19.0 147.1 0 channel
GFSTC02 418,877.7 5,405,938.9 617.0 5.0 67.4 0 channel
GFSTC03 418,878.9 5,405,936.8 617.0 24.0 150.1 0.83 channel
GFSTC04 418,875.9 5,405,937.0 617.0 12.5 226.7 0.96 channel
GFSTC05 418,890.6 5,405,927.0 618.6 7.1 134.0 21.6 channel
GFSTC06 418,895.8 5,405,922.1 617.6 1.3 219.7 30 channel
GFSTC07 418,894.1 5,405,924.4 618.4 1.5 225 37.5 channel
GFSTC08 418,892.9 5,405,925.9 618.4 1.3 225 42.5 channel
GFSTC09 418,891.4 5,405,927.3 618.4 1.3 225 27.6 channel
GFSTC10 418,889.9 5,405,928.6 618.4 1.3 225 18.6 channel
GFSTC11 418,888.6 5,405,930.2 618.3 1.3 225 21.5 channel
GFSTC12 418,887.4 5,405,931.8 618.3 1.3 225 34.12 channel
GFSTC13 418,886.1 5,405,933.3 618.1 1.3 225 25.7 channel
GFSTC15 418,838.7 5,405,969.0 618.0 35.7 52.2 4.3 channel
Table 4. Drill hole collar and orinatation information
Hole IDFrom
(m)
To
(m)
Length
(m)
Gold
(g/t)
Bismuth
( %)
Silver
(g/t)
SFD001 2.3 11.5 9.2 2.36 0.26 8.2
SFD002 4.0 10.0 6.0 2.88 0.64 17.8
SFD003 1.5 13.5 12.0 0.43 0.13 2.3
SFD004 1.7 13.0 11.3 3.38 0.31 6.2
incl . 8.0 11.0 3.0 11.30 0.31 6.0
SFD005 7.9 26.0 18.1 6.49 0.26 4.5
incl . 21.4 26.0 4.6 24.00 0.40 6.0
SFD006 1.8 19.3 17.5 1.46 0.08 2.5
SFD007 0.0 7.5 7.5 2.48 0.16 1.6
SFD008 0.0 9.0 9.0 1.88 0.08 1.3
SFD009 0.0 16.1 16.1 6.05 0.68 5.1
incl . 3.1 11.0 7.9 12.10 1.38 9.5
SFD010 0.0 24.5 24.5 0.45 0.01 1.1
SFD011 1.0 18.0 17.0 3.54 0.12 3.1
incl . 11.5 16.0 4.5 8.86 0.31 4.2
SFD012 4.8 16.1 11.3 0.09 0.00 0.2
SFD013 3.5 21.2 17.7 0.39 0.03 2.3
SFD014 27.7 32.0 4.3 0.21 0.02 2.2
SFD17 0.7 17.9 17.2 0.22 0.11 2.0
SFD18 1.1 18.0 17.0 0.44 0.13 2.6
SFD19 0.6 16.0 15.4 1.27 0.10 2.3
SFD20 0.5 28.0 27.5 4.83 0.06 2.7
incl . 4.5 18.0 13.5 8.34 0.11 4.6
and 22.4 28.0 5.7 2.76 0.04 1.1
SFD21 0.4 26.8 26.4 7.59 0.35 4.1
incl . 7.5 12.0 4.5 37.30 1.47 10.4
SFD22 6.7 15.0 8.3 5.14 0.09 0.1
incl . 12.5 15.0 2.5 13.40 0.11 0.0
SFD23 1.2 16.0 14.8 0.60 0.12 2.1
SFD24 1.5 13.5 12.0 5.58 0.19 5.5
incl . 10.5 13.5 3.0 11.50 0.60 12.5
SFD25 1.5 15.2 13.7 2.92 0.12 3.5
incl . 9.0 11.6 2.6 8.05 0.26 6.6
SFD26 0.3 18.0 17.7 0.43 0.01 0.9
SFD27 6.0 26.7 20.7 4.76 0.24 2.0
incl . 11.5 24.0 12.5 7.77 0.39 3.4
SFD28 5.8 30.0 24.2 0.74 0.32 3.7
SFD30 8.0 25.3 17.3 2.40 0.26 1.4
incl . 10.0 17.0 7.0 5.39 0.65 3.4
SFD33 10.0 26.8 16.8 8.02 0.50 5.2
incl . 14.0 18.0 4.0 18.60 1.00 9.5
and 23.1 25.3 2.2 25.80 1.73 14.0
SFD35 0.2 30.2 30.0 0.96 0.25 3.3
incl . 3.4 8.0 4.6 2.70 0.38 3.7
SFD36 13.5 25.5 12.0 0.60 0.08 0.8
SFD39 13.0 27.0 14.0 3.60 0.12 0.8
SFD41 9.1 12.7 3.6 0.18 0.00 0.8
SFD42 0.0 11.4 11.4 0.20 0.00 1.7
SFD43 0.5 20.3 19.8 1.04 0.13 2.1
SFD44 0.5 19.3 18.8 11.30 0.34 4.4
incl . 3.8 6.0 2.2 12.10 0.32 6.0
and 13.0 17.0 4.0 39.30 0.84 9.3
SFD45 0.6 4.0 3.5 1.42 0.13 2.7
SFD46 4.5 12.5 8.0 0.67 0.07 1.1
SFD46 22.5 29.4 6.9 0.05 0.04 0.6
SFD47 15.0 26.2 11.2 3.33 0.11 2.7
incl . 17.0 20.0 3.0 9.97 0.14 0.6
SD1 4.5 19.5 15.0 3.58 0.40 0.5
SD3 16.9 19 2.1 12.8 0.35 0.0
SD36 0.0 16.7 16.7 2.07 0.03 0.0
incl . 14.2 16.7 2.5 8.63 0.13 0.0
SD34 13.9 17.3 3.4 0.01 0.00 0.0
SD39 0.0 19.6 19.6 2.87 0.09 0.0
incl . 15.6 17.6 2.0 16.80 0.56 0.0
Table 2. Drill holes and assays used in the Indicated Resource estimation

Review of Operations & Activities (Cont.)
Page 47
Table 3.
Hole IDFrom
(m)
To
(m)
Length
(m)
Gold
(g/t)
Bismuth
( %)
Silver
(g/t)
FRSTC01 2.0 10.0 8.0 1.09 0.29 5.3
FRSTC02 0.0 2.5 2.5 2.20 0.33 5.6
FRSTC03A 0.0 2.2 2.2 2.95 0.34 7.8
FRSTC03B 0.0 5.8 5.8 4.21 0.16 4.9
FRSTC04 0.0 1.3 1.3 25.40 0.55 8.0
FRSTC06 2.0 5.0 3.0 1.55 0.22 3.3
FRSTC07 0.0 15.2 15.2 2.44 0.24 3.8
FRSTC08 0.0 3.5 3.5 1.49 0.04 2.3
FRSTC09 0.0 11.0 11.0 6.01 0.21 6.3
incl . 4.0 11.0 7.0 8.90 0.31 8.7
FRSTC10 0.0 0.7 0.7 5.65 0.04 2.0
FRSTC11 0.0 1.9 1.9 0.68 0.02 1.0
GFSTC01 0.0 19.0 19.0 10.00 0.77 4.2
incl . 0.0 10.0 10.0 15.50 0.59 4.8
GFSTC02 0.0 4.0 4.0 3.10 0.19 2.0
GFSTC03 0.0 24.0 24.0 10.10 0.52 6.5
GFSTC04 0.0 12.5 12.5 4.63 0.26 4.2
GFSTC05 0.0 7.0 7.0 46.90 1.10 11.7
GFSTC06 0.0 1.2 1.2 36.53 1.10 6.0
GFSTC07 0.0 1.2 1.2 36.47 0.53 5.0
GFSTC08 0.0 1.2 1.2 12.46 0.50 2.0
GFSTC09 0.0 1.2 1.2 6.29 0.24 3.0
GFSTC10 0.0 1.2 1.2 11.20 0.47 3.0
GFSTC11 0.0 1.2 1.2 8.48 0.25 7.0
GFSTC12 0.0 1.2 1.2 3.71 0.13 3.0
GFSTC13 0.0 1.2 1.2 3.44 0.07 2.0
GFSTC15 4.0 34.0 30.0 5.08 0.57 2.0
Channel samples/assays used in the Indicated Resource estimation.
Drill hole intersections used in the resource estimation are shown in table below.
The Inferred Resource estimation utilised 16 diamond drill holes and 18 channel samples. The present Indicated Resource utilised 44 drill holes and 25 channel samples or 28 extra diamond core drill holes and 7 extra saw cut channel samples. Table 4 shows co-ordinates and collar/ orientation details of each hole.
Channel sample intersections used in the resource estimation and hole collar information are shown in tables included in report.
SMRV Project Exploration resumed on the Elliott Bay (Wart Hill – EL 20/96) and Wanderer River (EL 33/10) exploration licenses in SW Tasmania, with a regional helicopter borne Time Domain Electromagnetic Geophysical Survey (VTEM).
The VTEM survey covered 140 km2 and is
intended to locate major, non-outcropping, sulphide systems which are thought to occur in this relatively unexplored part of the highly prospective Mt Read Volcanics in Western Tasmania.
Frontier has already proven that massive sulphides, with similar geologic characteristics to the major Roseberry zinc / lead / silver / gold / copper mine, occur in this 45 km long part of the Mt Read Volcanics. The Company's drilling in 2011 intersected very high grade mineralisation in two separate lenses at Wart Hill:
The VTEM geophysical survey was undertaken for two equally important reasons. To provide subsurface drilling targets that could represent extensions to known high grade polymetallic mineralisation at the Wart Hill Deposit (see ASX Release 7/6/2011) and perhaps more importantly to locate non outcropping major accumulations of massive sulphides in the Wanderer River EL along strike to the north.
The VTEM survey is being carried out by Geotech Airborne Pty Ltd and photographs of the survey are attached.
The system being used is the Geotech Versatile Time-Domain Electromagnetic (VTEM) geophysical system, comprising the following main instrumentation:
The VTEM Time Domain EM system for locating conductive anomalies and mapping earth resistivities. A high-sensitivity proton precession magnetometer for mapping geologic structure and lithology. A proton precession magnetometer base station for diurnal correction. A Radar altimeter with an accuracy of approximately 1 meter. A GPS Navigation System providing an
in-flight accuracy up to 3 meters

Review of Operations & Activities (Cont.)
Page 48
The total survey was approximately 955 line kilometres (line spacing’s of 150m). Data processing and mapping has been undertaken.
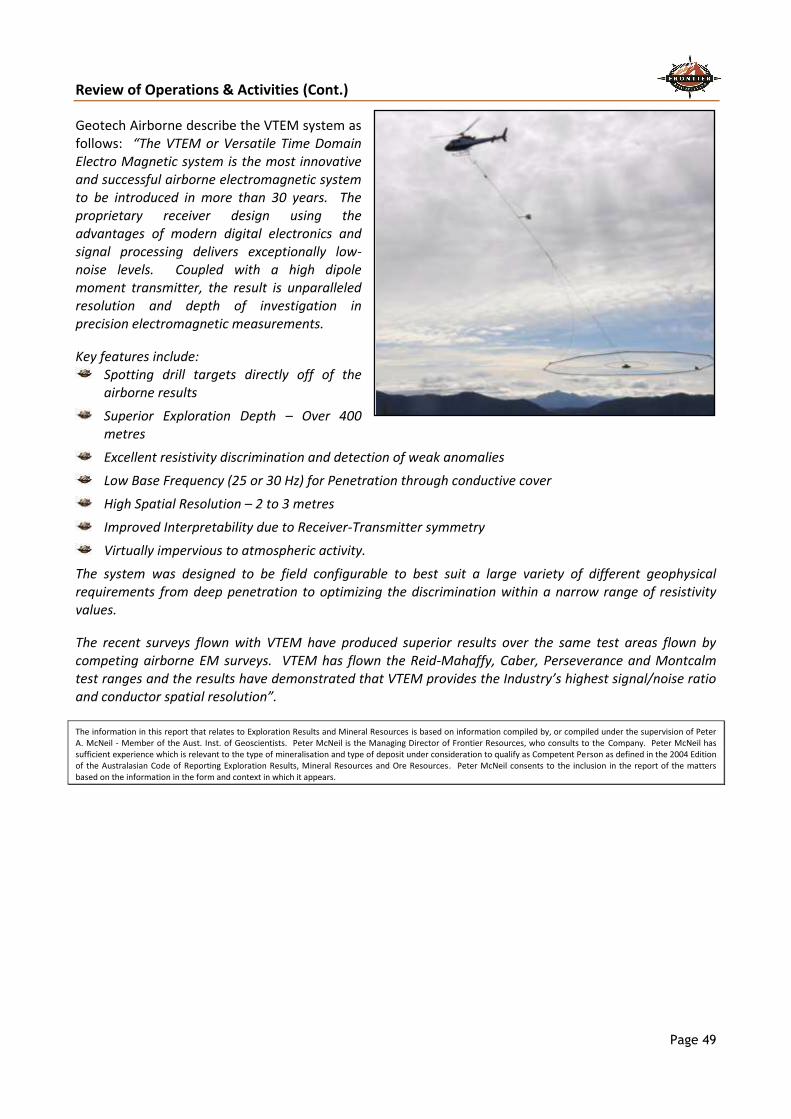
Review of Operations & Activities (Cont.)
Page 49
Geotech Airborne describe the VTEM system as follows: “The VTEM or Versatile Time Domain Electro Magnetic system is the most innovative and successful airborne electromagnetic system to be introduced in more than 30 years. The proprietary receiver design using the advantages of modern digital electronics and signal processing delivers exceptionally low-noise levels. Coupled with a high dipole moment transmitter, the result is unparalleled resolution and depth of investigation in precision electromagnetic measurements.
Key features include: Spotting drill targets directly off of the
airborne results
Superior Exploration Depth – Over 400 metres
Excellent resistivity discrimination and detection of weak anomalies
Low Base Frequency (25 or 30 Hz) for Penetration through conductive cover
High Spatial Resolution – 2 to 3 metres
Improved Interpretability due to Receiver-Transmitter symmetry
Virtually impervious to atmospheric activity.
The system was designed to be field configurable to best suit a large variety of different geophysical requirements from deep penetration to optimizing the discrimination within a narrow range of resistivity values.
The recent surveys flown with VTEM have produced superior results over the same test areas flown by competing airborne EM surveys. VTEM has flown the Reid-Mahaffy, Caber, Perseverance and Montcalm test ranges and the results have demonstrated that VTEM provides the Industry’s highest signal/noise ratio and conductor spatial resolution”.
The information in this report that relates to Exploration Results and Mineral Resources is based on information compiled by, or compiled under the supervision of Peter A. McNeil - Member of the Aust. Inst. of Geoscientists. Peter McNeil is the Managing Director of Frontier Resources, who consults to the Company. Peter McNeil has sufficient experience which is relevant to the type of mineralisation and type of deposit under consideration to qualify as Competent Person as defined in the 2004 Edition of the Australasian Code of Reporting Exploration Results, Mineral Resources and Ore Resources. Peter McNeil consents to the inclusion in the report of the matters based on the information in the form and context in which it appears.
DIRECTORS’ REPORT
Page 50
Your Directors present their report on the Group for the financial year ended 30 June 2012.
DIRECTORS
The following persons were Directors of Frontier Resources Ltd during the financial year and up to the date of
this report:
P.A. McNeil
G.J. Fish
W.J. Staude
H.D. Swain
PRINCIPAL ACTIVITIES
The principal activities of the Group during the financial year were exploration and evaluation of gold, silver
and other base metal projects in Papua New Guinea and Tasmania.
RESULTS AND DIVIDENDS
The consolidated loss of the Group after tax amounted to $8,646,056 (2011: $4,349,224). There were no
dividends paid or recommended during the financial year ended 30 June 2012.
The result of the Group was significantly affected by exploration expenditure of $5,312,109 (2011:
$3,208,349) expensed in accordance with the Group’s accounting policy regarding the capitalising or
expensing of exploration expenditure as outlined in Note 1 to the Financial Statements.
REVIEW OF OPERATIONS
During the financial year, the Group funded ongoing exploration and evaluation work on its exploration areas in
Tasmania and Papua New Guinea. Further information on the operations of the Group can be found in the
section titled “Managing Director’s Review of Operations and Activities” in this annual report.
SIGNIFICANT CHANGES IN THE STATE OF AFFAIRS
In the opinion of the Directors there were no significant changes in the state of affairs of the Group that
occurred during the financial year not otherwise disclosed in this report.
MATTERS SUBSEQUENT TO THE END OF THE FINANCIAL YEAR
Other than the events disclosed in note 21, there have been no other significant matters arising subsequent to
the end of the financial year.
LIKELY DEVELOPMENTS AND EXPECTED RESULTS
Likely future developments in the operations of the Group and the expected results of those operations in
subsequent financial years are:

DIRECTORS’ REPORT
Page 51
The Directors are pleased with exploration results during the financial year, however, they are conscious that
additional funding through equity, joint ventures or borrowings will be required to pursue the potential of
existing projects in the future.
ENVIRONMENTAL REGULATIONS
The Group is subject to significant environmental regulation in respect of its mineral exploration activities.
The Group has exploration and mining tenements in Papua New Guinea and in Tasmania, Australia. The Group
is not aware of any breach of environmental regulations during or since the end of the financial year.
The directors have considered the National Greenhouse and Energy Reporting Act 2007 (the NGER Act) which
introduces a single national reporting framework for the reporting and dissemination of information about the
greenhouse gas emissions, greenhouse gas projects, and energy use and production of corporations. At the
current stage of development, the directors have determined that the NGER Act will have no effect on the
company for the current, nor subsequent, financial years. The directors will reassess this position as and when
the need arises.

DIRECTORS’ REPORT
Page 52
INFORMATION ON DIRECTORS Particulars of
Directors’ interest in
shares and options of
Frontier Resources Ltd
Director and Experience Special
Responsibilities
Ordinary
Shares
Options
Peter A. McNeil
Chairman appointed 20th January 2010
Managing Director for 11 years.
Age 51. B.Sc., M.Sc. He has 30 years exploration experience in
Papua New Guinea, U.S.A., Canada and Australia, including
programs at the Lihir gold deposit and in the Goldfields and
Kimberley regions of Western Australia and Tasmania.
Peter has been associated with the discovery of a number of
orebodies including Nimary and Sunrise Dam in Western
Australia. Peter also held former Directorships (within the last 3
years) in Coppermoly Ltd, Macmin Silver Ltd and New Guinea
Gold Corp.
Member of
Planning &
Operations
Committee
9,131,194
5,000,000
Unlisted
Graham J. Fish
Non-Executive Director for 5 years and independent Non-
Executive Director for 7½ years. Age 73. He graduated B.Sc.
(Geology, Chemistry) in 1958, Dip. Ed. in 1961 and M.Ed. in 1980
from the University of Tasmania. He worked as a teacher of
Geology and Chemistry in Tasmanian Education Department
Colleges before promotion into administrative roles from 1973.
Graham has 37 years of management skills and extensive
experience in administration and education development in
Tasmania. He has a background in geology and has chaired
committees on both national and state school curriculum and
assessment boards.
He has delivered papers and written science and education
reports for UNESCO in Bangkok in 1983, and in Korea in 1988,
for the South Pacific in Fiji in 1995, for International
Conferences in Sydney in 1993 and New Zealand in 1994.
Graham has not held any other former Directorships within the
last 3 years.
Member of
Planning &
Operations
Committee
Member of Audit
Committee
741,457
2,500,000
Unlisted
DIRECTORS’ REPORT
Page 53
INFORMATION ON DIRECTORS Particulars of
Directors’ interest in
shares and options of
Frontier Resources Ltd
Director and Experience Special
Responsibilities
Ordinary
Shares
Options
Warren J. Staude
Non Executive Director for 10 years. Age 69. Has over 40 years
professional experience in the mining, exploration and
resource finance industries. He is a graduate of University of
Sydney (BSc), Macquarie University (MSc) and holds a Graduate
Diploma from the Securities Institute of Australia and is a
member of the Joint Ore Reserves Committee.
Warren has worked in Government, in industry, as a private
consultant and on the academic staff at Macquarie University.
He worked for the AMP Society's resource investment team, in
the stockbroking industry and GIO Australia Asset Management.
He brings your Company a wealth of experience in the
Australian financial markets.
Warren is currently a non-executive director of Central West
Gold NL, Malachite Resources Limited, Eagle Eye Metals
Limited, Excelsior Gold Limited and Aphrodite Gold Limited, all
ASX-listed companies. In the last 3 years Warren was a non-
executive director of Stonehenge Metals Limited.
Chairman of
Audit
Committee
1,048,618
3,000,000
Unlisted
Hugh David Swain
Non-Executive Director for 5 years. Age 75. Mr H David Swain,
B.Eng (Mining) 1962, M.Eng. (Civil) 1972 – University of Sheffield,
is a Mining/Civil Engineer with 48 years professional experience,
who has held senior management positions both operating and
technical including Mine Superintendent and Chief Mining
Engineer at Bougainville Copper, General Manager of Rossarden
Tin Mines and Executive Manager with Goldsworthy Iron.
David has worked as a consultant for 29 years and has completed
projects in Australasia, West Africa, SE Asia and China.
David is a Fellow of the AIMM and has presented and published
several papers on ore reserve estimation and other aspects of
mining engineering. He has not held any other former
Directorships within the last 3 years.
650,000
2,000,000
Unlisted
DIRECTORS’ REPORT
Page 54
COMPANY SECRETARY – QUALIFICATIONS & EXPERIENCE
Jay Stephenson – Appointed Company Secretary on 2 February 2008
Jay Stephenson holds a Master of Business Administration, is a Fellow of the Certified Practising Accountants,
Certified Management Accountant (Canada), Member of the Australian Institute of Company Directors and
Fellow of the Chartered Institute of Secretaries. Jay is currently Company Secretary for a number of ASX
listed resources and industrial companies.
Julia Beckett - Appointed Joint Company Secretary on 15 April 2011
Julia Beckett holds a Certificate in Governance Practice and Administration and is a Certificated Member of
Chartered Secretaries Australia. Julia has extensive project management experience in both public
institution and company administration, the past 4 years more specifically focusing on corporate governance
and compliance. She has been involved in business acquisitions, mergers, initial public offerings, capital
raisings as well as statutory and financial reporting.
DIRECTORS’ MEETINGS
The number of Directors’ meetings (including meetings of committees of Directors) and number of meetings
attended by each of the Directors of the Company during the financial year (and the number each Director
was entitled to attend):
Directors’ Meetings
Audit
Committee Meetings
Planning & Operations Committee Meetings
Number eligible to
attend
Number attended
Number eligible to
attend
Number attended
Number eligible to
attend
Number attended
P.A. McNeil G.J. Fish W.J. Staude H.D. Swain
4 4 4 4
4 4 4 4
- - - -
- - - -
3 3 - -
3 3 - -
REMUNERATION REPORT (Audited)
The information in this remuneration report has been audited as required by s308(3C) of the Corporations Act
2001. (a) Principles used to determine the nature and amount of remuneration
The objective of the Group’s executive reward framework is to ensure reward for performance is competitive
and appropriate for the results delivered. As there is no remuneration committee the role is assumed by the
full Board of Directors. The Board ensures that director and executive reward satisfies the following key
criteria for good reward governance practices:
competitiveness and reasonableness;
acceptability to shareholders;
transparency; and
capital management.

DIRECTORS’ REPORT
Page 55
REMUNERATION REPORT (Audited)
The information in this remuneration report has been audited as required by s308(3C) of the Corporations Act
2001. (a) Principles used to determine the nature and amount of remuneration
The objective of the Group’s executive reward framework is to ensure reward for performance is competitive
and appropriate for the results delivered. As there is no remuneration committee the role is assumed by the
full Board of Directors. The Board ensures that director and executive reward satisfies the following key
criteria for good reward governance practices:
competitiveness and reasonableness;
acceptability to shareholders;
transparency; and
capital management.
The Group has structured an executive remuneration framework that is market competitive and
complementary to the reward strategy of the organisation.
Alignment to shareholders’ interests:
has economic profit as a core component of plan design;
focuses on sustained growth in share price and delivering constant return on assets as well as focusing
the executive on key non-financial drivers of value;
attracts and retains high calibre executives;
rewards capability and experience;
reflects competitive reward for contribution to shareholder growth;
provides a clear structure for earning rewards; and
provides recognition for contribution.
Relationship between remuneration and Group performance
During the past year and since listing on 9 April 2003 the Group has generated losses because it is still
involved in mineral exploration, not in production.
Given that the remuneration is commercially reasonable / appropriate / benchmarked, the link between
remuneration, Group performance and shareholder wealth generation is tenuous, particularly in the
exploration stage of a minerals company. Since listing the Group has recorded significant losses as it carries
out exploration activities on its tenements, and no dividend has been paid. Share prices are subject to the
influence of international metal prices and market sentiment toward the sector, and increases or decreases
may occur quite independent of executive performance or remuneration. Share prices, largely unrelated to
profit and loss, have fluctuated between 1 cent and 42 cents during the last five years, and at 30 June 2012
the price was 7 cents.
Bonuses are paid to employees upon agreement by the Board. During the year, the Managing Director Peter
McNeil was paid a bonus of $110,000, Non-Executive Director Graham Fish was paid a bonus of $7,500, and
the Joint Company Secretary Jay Stephenson was paid a bonus of $11,000.
Non-Executive Directors
Fees and payments to Non-Executive Directors reflect their responsibilities and the demands placed on
individual Directors. Non-Executive Directors’ fees and payments are reviewed annually by the Board. The
Board seeks to ensure Non-Executive Directors’ fees and payments are appropriate and in line with the
market.
Directors’ fees
The current base remuneration was last reviewed with effect from January 2010. Directors’ fees are inclusive
of committee fees.

DIRECTORS’ REPORT
Page 56
REMUNERATION REPORT (continued)
Non-Executive Directors’ fees are determined within the Non-Executive Directors’ fee pool limit, which is
periodically recommended for approval by shareholders. The pool currently stands at $150,000 per annum for
Non-Executive Directors as approved at the Company’s Annual General Meeting on 25 November 2009.
Retirement allowances for Directors
The Company provides no retirement allowances for Non-Executive Directors.
Executive pay
The executive pay and reward framework has four components:
base pay and benefits;
short-term incentives;
long-term incentives through Directors options (refer Note 17); and
other remuneration such as superannuation.
The combination of these comprises the executive’s total remuneration.
Base pay
Structured as a total employment cost package which may be delivered as a mix of cash and prescribed non-
financial benefits at the executive’s discretion.
Executives are offered a competitive base pay that comprises the fixed component of pay and rewards. Base
pay for senior executives is reviewed annually by the Board to ensure the executive’s pay is competitive with
the market. An executive’s pay is also reviewed on promotion.
There are no guaranteed base pay increases fixed in any senior executives’ contracts.
Benefits
Executives receive no benefits outside of the base pay, options and superannuation disclosed in this report.
Retirement benefits
Other than statutory superannuation contributions, no retirement benefits are provided for executives except
statutory entitlements.
Short-term incentives
Key management personnel are entitled to short term incentives (STI’s) based on performance that is agreed
by the board from time to time.
Frontier Resources Ltd Employee Option Plan
Information on the Frontier Resources Ltd Employee Option Plan is set out in Note 17. Directors may not
participate in the Employee Option Plan. The Frontier Option Plan does not remove the at risk aspect of
options granted under the plan. The plan does not include any limitation of risk for option holders.
Performance Conditions
There are no performance conditions on remuneration other than options granted to Directors and those
issued under the Employee Option Plan are not vested until the employee or Director have been with the
Company for 12 months. In addition, the Board may from time to time pay a cash bonus to employees on the
achievement of agreed performance indicators.
(b) Other key management personnel
In addition to the Directors, the following persons also had authority for planning, directing and controlling
the activities of the Group, directly or indirectly, during the financial year:
Name Position Employer
Jay Stephenson Joint Company Secretary
and Chief Financial Officer Frontier Resources Ltd
Julia Beckett Joint Company Secretary Frontier Resources Ltd

DIRECTORS’ REPORT
Page 57
REMUNERATION REPORT (continued)
(c) Details of remuneration
Details of the nature and amount of each element of the emoluments of each of the key management
personnel of the Group for the year ended 30 June 2012 are set out in the following tables:
2012 Short-term employee benefits Post-employment
benefits
Share-based
payment
Total
$
Name
Cash
salary and
fees
$
Cash
bonus
$
Non-
Monetary
benefits
$
Super-
annuation
$
Retirement
benefits
$
Options*
$
Executive Director
P.A. McNeil 305,301 110,000 - - - 146,574 561,875
Non-Executive Directors
G.J. Fish 41,666 7,500 - 4,425 - 52,604 106,195
W.J. Staude 30,833 - - 2,775 - 52,604 86,212
H.D. Swain 37,241 - - - - 52,604 89,845
Other key management personnel
J. Beckett - - - - - 1,011 1,011
J. Stephenson 99,000 11,000 - - - 5,353 115,353
Total 514,041 128,500 - 7,200 - 310,750 960,491
2011
Short-term employee benefits
Post-employment
benefits
Share-based
payment
Total
$
Name
Cash
salary and
fees
$
Cash
bonus
$
Non-
Monetary
benefits
$
Super-
annuation
$
Retirement
benefits
$
Options*
$
Executive Director
P.A. McNeil 277,219 50,000 - - - 57,619 384,838
Non-Executive Directors
G.J. Fish 31,750 - - 2,858 - 28,809 63,417
W.J. Staude 30,000 - - 2,700 - 28,809 61,509
H.D. Swain 32,700 - - - - 28,809 61,509
Other key management personnel
J. Beckett - - - - - - -
P.S. McNeil 106,200 6,364 - - - 17,273 129,837
J. Stephenson 63,058 - - - - 4,318 67,376
Total 540,927 56,364 - 5,558 - 165,637 768,486
* Option value calculation using Black-Scholes Model.
# Remuneration that is performance based % is that percentage of remuneration that consisted of options.
The relative proportions of remuneration that are linked to performance and those that are fixed are as
follows: Fixed Remuneration At risk - STI At risk – LTI *
2012 2011 2012 2011 2012 2011
P.A. McNeil 54% 72% 20% 13% 26% 15%
G.J. Fish 43% 55% 7% - 50% 45%
W.J. Staude 39% 53% - - 61% 47%
H.D. Swain 41% 53% - - 59% 47%
J. Stephenson 85% 94% 10% - 5% 6%
* Long-term incentives reflect the value of remuneration consisting of options expensed during the year.
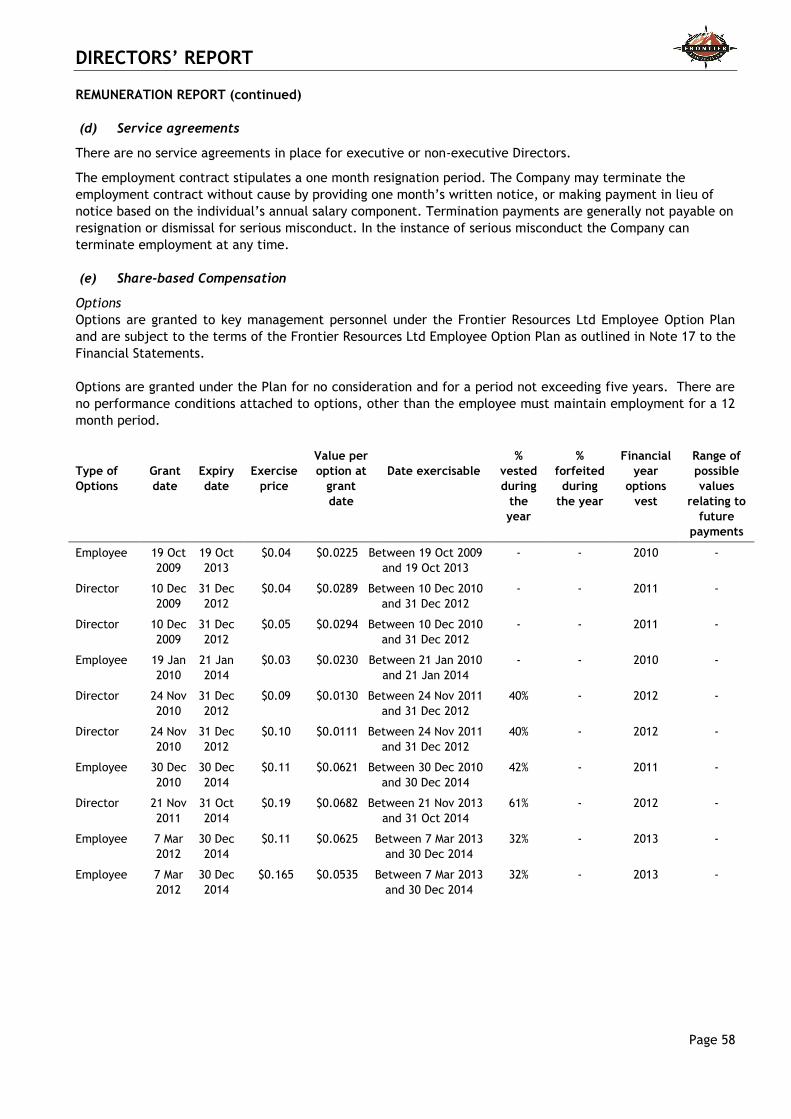
DIRECTORS’ REPORT
Page 58
REMUNERATION REPORT (continued)
(d) Service agreements
There are no service agreements in place for executive or non-executive Directors.
The employment contract stipulates a one month resignation period. The Company may terminate the
employment contract without cause by providing one month’s written notice, or making payment in lieu of
notice based on the individual’s annual salary component. Termination payments are generally not payable on
resignation or dismissal for serious misconduct. In the instance of serious misconduct the Company can
terminate employment at any time.
(e) Share-based Compensation
Options
Options are granted to key management personnel under the Frontier Resources Ltd Employee Option Plan
and are subject to the terms of the Frontier Resources Ltd Employee Option Plan as outlined in Note 17 to the
Financial Statements.
Options are granted under the Plan for no consideration and for a period not exceeding five years. There are
no performance conditions attached to options, other than the employee must maintain employment for a 12
month period.
Type of
Options
Grant
date
Expiry
date
Exercise
price
Value per
option at
grant
date
Date exercisable
%
vested
during
the
year
%
forfeited
during
the year
Financial
year
options
vest
Range of
possible
values
relating to
future
payments
Employee 19 Oct
2009
19 Oct
2013
$0.04 $0.0225 Between 19 Oct 2009
and 19 Oct 2013
- - 2010 -
Director 10 Dec
2009
31 Dec
2012
$0.04 $0.0289 Between 10 Dec 2010
and 31 Dec 2012
- - 2011 -
Director 10 Dec
2009
31 Dec
2012
$0.05 $0.0294 Between 10 Dec 2010
and 31 Dec 2012
- - 2011 -
Employee 19 Jan
2010
21 Jan
2014
$0.03 $0.0230 Between 21 Jan 2010
and 21 Jan 2014
- - 2010 -
Director 24 Nov
2010
31 Dec
2012
$0.09 $0.0130 Between 24 Nov 2011
and 31 Dec 2012
40% - 2012 -
Director 24 Nov
2010
31 Dec
2012
$0.10 $0.0111 Between 24 Nov 2011
and 31 Dec 2012
40% - 2012 -
Employee 30 Dec
2010
30 Dec
2014
$0.11 $0.0621 Between 30 Dec 2010
and 30 Dec 2014
42% - 2011 -
Director 21 Nov
2011
31 Oct
2014
$0.19 $0.0682 Between 21 Nov 2013
and 31 Oct 2014
61% - 2012 -
Employee 7 Mar
2012
30 Dec
2014
$0.11 $0.0625 Between 7 Mar 2013
and 30 Dec 2014
32% - 2013 -
Employee 7 Mar
2012
30 Dec
2014
$0.165 $0.0535 Between 7 Mar 2013
and 30 Dec 2014
32% - 2013 -

DIRECTORS’ REPORT
Page 59
REMUNERATION REPORT (continued)
Options granted under the Plan carry no dividend or voting rights. All options were provided at no cost to the
recipients. When exercisable, each option is convertible into one ordinary share of Frontier Resources Ltd.
Further information on the options is set out in Note 17 to the Financial Statements.
Details of options over ordinary shares in the Company provided as remuneration to each Director of Frontier
Resources Limited and each of the key management personnel of the consolidated group are set out below:
Name
Grant date
Total
number of
options
granted
Value of
options at
grant date
Number of
options
vested
during the
year
Number of
options
lapsed
during the
year
Value at
lapse date
Directors -
P.A. McNeil 10 Dec 2009 1,000,000 $28,900 - - -
10 Dec 2009 1,000,000 $29,400 - - -
24 Nov 2010 1,000,000 $28,900 1,000,000 - -
24 Nov 2010 1,000,000 $26,900 1,000,000 - -
21 Nov 2011 3,000,000 $204,600 - - -
G.J. Fish 10 Dec 2009 500,000 $14,450 - - -
10 Dec 2009 500,000 $14,700 - - -
24 Nov 2010 500,000 $14,450 500,000 - -
24 Nov 2010 500,000 $13,450 500,000 - -
21 Nov 2011 1,000,000 $68,200 - - -
W.J. Staude 10 Dec 2009 500,000 $14,450 - - -
10 Dec 2009 500,000 $14,700 - - -
24 Nov 2010 500,000 $14,450 500,000 - -
24 Nov 2010 500,000 $13,450 500,000 - -
21 Nov 2011 1,000,000 $68,200 - - -
H.D. Swain 10 Dec 2009 500,000 $14,450 - - -
10 Dec 2009 500,000 $14,700 - - -
24 Nov 2010 500,000 $14,450 500,000 - -
24 Nov 2010 500,000 $13,450 500,000 - -
21 Nov 2011 1,000,000 $68,200 - - -
Other key management personnel -
J. Beckett 7 Mar 2012 60,000 $3,210 - - -
J. Stephenson 30 Dec 2010 100,000 $6,409 100,000 - -
J. Stephenson 7 Mar 2012 60,000 $3,210 - - -
Refer to Note 17 for option balances held by key management personnel as at 30 June 2012 and 30 June 2011.
The assessed fair value at grant date of options granted to the individuals is allocated equally over the period
from grant date to vesting date, and the amount is included in the remuneration tables above. Fair values at
grant date are determined using a Black-Scholes option pricing model that takes into account the exercise
price, the term of the option, the impact of dilution, the share price at grant date and expected price
volatility of the underlying share, the expected dividend yield and the risk-free interest rate for the term of
the option.
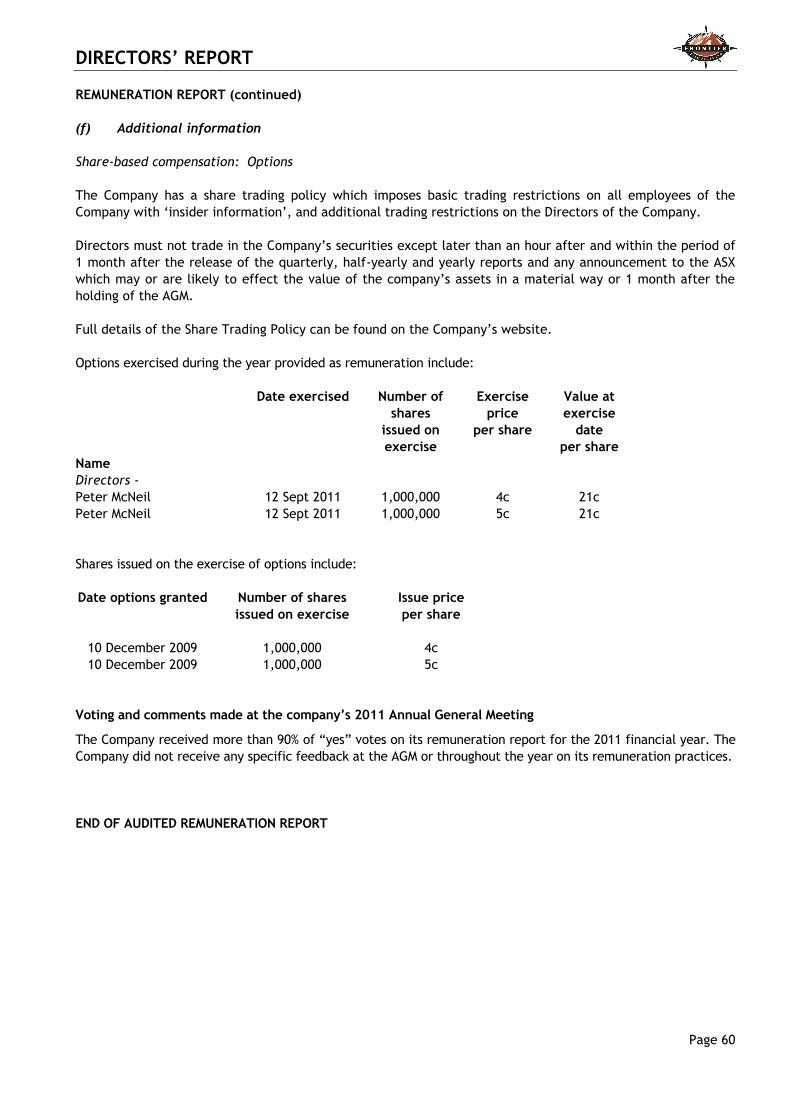
DIRECTORS’ REPORT
Page 60
REMUNERATION REPORT (continued)
(f) Additional information
Share-based compensation: Options
The Company has a share trading policy which imposes basic trading restrictions on all employees of the
Company with ‘insider information’, and additional trading restrictions on the Directors of the Company.
Directors must not trade in the Company’s securities except later than an hour after and within the period of
1 month after the release of the quarterly, half-yearly and yearly reports and any announcement to the ASX
which may or are likely to effect the value of the company’s assets in a material way or 1 month after the
holding of the AGM.
Full details of the Share Trading Policy can be found on the Company’s website.
Options exercised during the year provided as remuneration include:
Name
Date exercised Number of
shares
issued on
exercise
Exercise
price
per share
Value at
exercise
date
per share
Directors -
Peter McNeil 12 Sept 2011 1,000,000 4c 21c
Peter McNeil 12 Sept 2011 1,000,000 5c 21c
Shares issued on the exercise of options include:
Date options granted Number of shares
issued on exercise
Issue price
per share
10 December 2009 1,000,000 4c
10 December 2009 1,000,000 5c
Voting and comments made at the company’s 2011 Annual General Meeting
The Company received more than 90% of “yes” votes on its remuneration report for the 2011 financial year. The
Company did not receive any specific feedback at the AGM or throughout the year on its remuneration practices.
END OF AUDITED REMUNERATION REPORT

DIRECTORS’ REPORT
Page 61
LOANS TO DIRECTORS AND EXECUTIVES
No loans have been made to Directors of Frontier Resources Ltd and the specified executives of the Group,
including their personally-related entities.
SHARES UNDER OPTION
Unissued ordinary shares of Frontier Resources Ltd under option at the date of this report are as follows:
Date options granted Expiry date Issue price of shares Number under option
10 December 2009 31 Dec 2012 $0.04 500,000
10 December 2009 31 Dec 2012 $0.05 1,000,000
19 October 2009 19 Oct 2013 $0.04 200,000
24 November 2010 31 Dec 2012 $0.09 2,500,000
24 November 2010 31 Dec 2012 $0.10 2,500,000
30 December 2010 30 Dec 2014 $0.11 4,500,000
7 March 2012 30 Dec 2014 $0.11 2,320,000
7 March 2012 30 Dec 2014 $0.165 2,220,000
24 November 2011 31 Oct 2014 $0.19 6,000,000
21,740,000
No option holder has any right under the options to participate in any other share issue of the Company or of
any other entity.
SHARES ISSUED ON THE EXERCISE OF OPTIONS
During the financial year ended 30 June 2012, there were 2,000,000 ordinary shares of Frontier Resources Ltd
issued upon the exercise of options. 1,000,000 shares were issued at 4 cents, and 1,000,000 shares were
issued at 5 cents. No amounts are unpaid on any of these shares. None have been issued since the end of the
financial year.
INSURANCE OF OFFICERS
Since the end of the previous financial year the consolidated group has paid insurance premiums in respect of
directors' and officers' legal expenses and liability insurance. The policies prohibit disclosure of details of the
policies or the premiums paid. The Company has not otherwise, during or since the end of the year, except at
the extent permitted by law, indemnified or agreed to indemnify an officer or auditor of the company or any of
its controlled entities against a liability incurred as such an officer or auditor.
NON-AUDIT SERVICES
The Company may decide to employ the auditor on assignments additional to their statutory audit duties where
the auditor’s expertise and experience with the Company and/or the Consolidated Group are important.
Details of the amounts paid or payable to the auditor (BDO Audit (WA) Pty Ltd) for audit and non-audit services
provided during the year are set out below.
The Board of Directors has considered the position and, in accordance with the advice received from the Audit
Committee, is satisfied that the provision of the non-audit services is compatible with the general standard of
independence for auditors imposed by the Corporations Act 2001. The Directors are satisfied that the provision
of non-audit services by the auditor, as set out below, did not compromise the auditor independence
requirements of the Corporations Act 2001 for the following reasons:
All non-audit services have been reviewed by the Audit Committee to ensure they do not impact the
impartiality and objectivity of the auditor; and
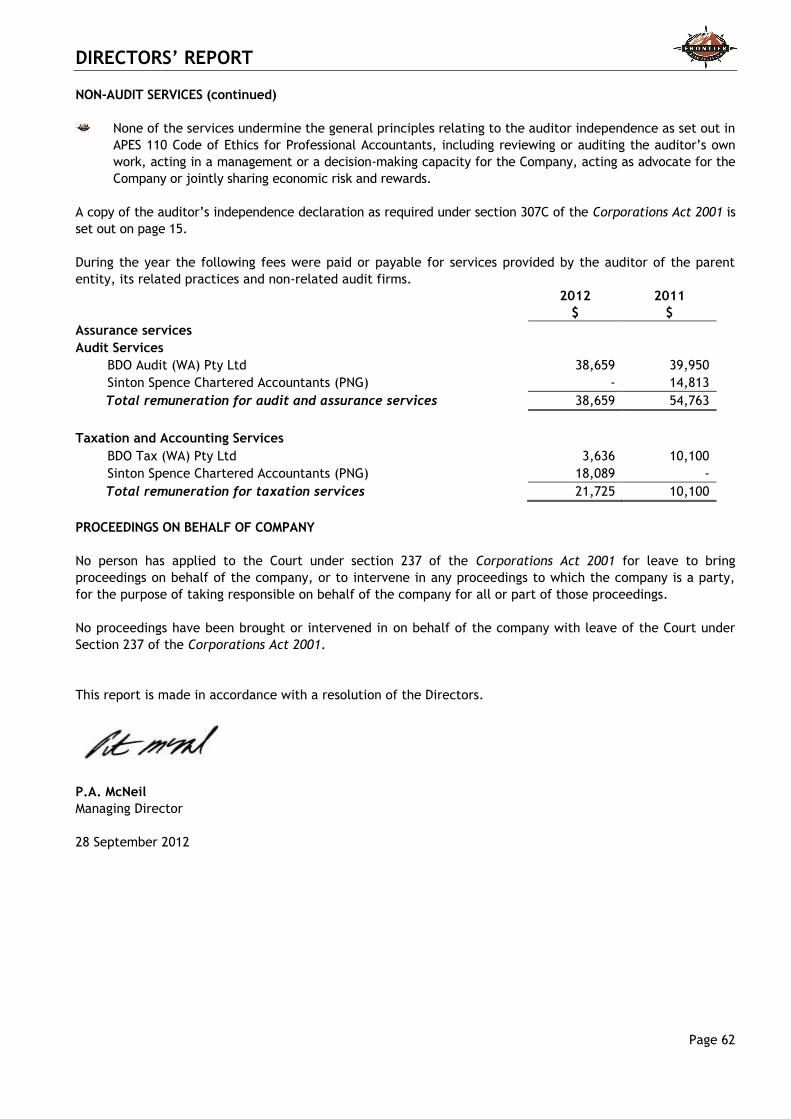
DIRECTORS’ REPORT
Page 62
NON-AUDIT SERVICES (continued)
None of the services undermine the general principles relating to the auditor independence as set out in
APES 110 Code of Ethics for Professional Accountants, including reviewing or auditing the auditor’s own
work, acting in a management or a decision-making capacity for the Company, acting as advocate for the
Company or jointly sharing economic risk and rewards.
A copy of the auditor’s independence declaration as required under section 307C of the Corporations Act 2001 is
set out on page 15.
During the year the following fees were paid or payable for services provided by the auditor of the parent
entity, its related practices and non-related audit firms.
2012
$
2011
$
Assurance services
Audit Services
BDO Audit (WA) Pty Ltd 38,659 39,950
Sinton Spence Chartered Accountants (PNG) - 14,813
Total remuneration for audit and assurance services 38,659 54,763
Taxation and Accounting Services
BDO Tax (WA) Pty Ltd 3,636 10,100
Sinton Spence Chartered Accountants (PNG) 18,089 -
Total remuneration for taxation services 21,725 10,100
PROCEEDINGS ON BEHALF OF COMPANY
No person has applied to the Court under section 237 of the Corporations Act 2001 for leave to bring
proceedings on behalf of the company, or to intervene in any proceedings to which the company is a party,
for the purpose of taking responsible on behalf of the company for all or part of those proceedings.
No proceedings have been brought or intervened in on behalf of the company with leave of the Court under
Section 237 of the Corporations Act 2001.
This report is made in accordance with a resolution of the Directors.
P.A. McNeil
Managing Director
28 September 2012

Tel: +8 6382 4600 Fax: +8 6382 4601 www.bdo.com.au
38 Station Street Subiaco, WA 6008 PO Box 700 West Perth WA 6872 Australia
BDO Audit (WA) Pty Ltd ABN 79 112 284 787 is a member of a national association of independent entities which are all members of BDO (Australia) Ltd ABN 77 050 110 275, an Australian company limited by guarantee. BDO Audit (WA) Pty Ltd and BDO (Australia) Ltd are members of BDO International Ltd, a UK company limited
by guarantee, and form part of the international BDO network of independent member firms. Liability limited by a scheme approved under Professional Standards
Legislation (other than for the acts or omissions of financial services licensees) in each State or Territory other than Tasmania. Page 63
28 September 2012 The Directors Frontier Resources Limited Level 4, 66 Kings Park Road West Perth, WA, 6005 Dear Sirs, DECLARATION OF INDEPENDENCE BY CHRIS BURTON TO THE DIRECTORS OF FRONTIER RESOURCES LIMITED As lead auditor of Frontier Resources Limited for the year ended 30 June 2012, I declare that, to the best of my knowledge and belief, there have been no contraventions of: • the auditor independence requirements of the Corporations Act 2001 in relation to the audit;
and
• any applicable code of professional conduct in relation to the audit. This declaration is in respect of Frontier Resources Limited and the entities it controlled during the period.
CHRIS BURTON Director BDO Audit (WA) Pty Ltd Perth, Western Australia

CORPORATE GOVERNANCE STATEMENT
Page 64
The Board of Directors of Frontier Resources Limited (“the Company”) is committed to maintaining high
standards of Corporate Governance. This statement outlines the main Corporate Governance practices that
where adopted or in place throughout the financial year, which comply with the ASX Corporate
Governance Council recommendations, unless otherwise stated.
PRINCIPLE 1: LAY SOLID FOUNDATIONS FOR MANAGEMENT AND OVERSIGHT
Recommendation 1.1: Companies should establish the functions reserved to the board and management.
The Board’s primary responsibility is to oversee the Company’s business activities and management for the
benefit of shareholders.
Its functions and responsibilities include:
Determining strategic and policy direction and monitoring performance against strategy.
Establishing goals and monitoring performance.
Identifying risk and opportunities for ensuring risk management systems are established and reviewed.
Approving and monitoring financial reports, capital management, and compliance.
Ensuring that policies and compliance systems consistent with the Company’s objectives and best
practice are in place and that the Company and its officers act legally, ethically and responsibly.
The Board is also governed by the Company’s constitution. The day to day management of the Company’s
affairs and implementation of corporate strategies and policy initiatives are formally delegated by the
Board to the Managing Director and senior executives.
Recommendation 1.2 Companies should disclose the process for evaluating the performance of senior
executives.
There are no formal processes for monitoring senior executive performance as the size of the Company
permits ongoing monitoring by the board of senior executive performance.
Recommendation 1.3 Provide the information indicated in the ASX Corporate Governance Council’s Guide
to Reporting on Principle 1.
The evaluation of performance of senior executives has taken place throughout the year.
PRINCIPLE 2: STRUCTURE THE BOARD TO ADD VALUE
Recommendation 2.1: A majority of the Board should be Independent Directors.
Given the Company’s background, nature and size of its business and the current stage of its development,
the Board is comprised of four directors, three of whom are non-executive and independent. The Board
believes that this is both appropriate and acceptable.
An independent director is a non-executive director who is not a member of management and who is free
of any business of other relationship that could materially interfere with – or could reasonably be
perceived to materially interfere with – the independent exercise of their judgement.
Recommendation 2.2: The Chairperson should be an Independent Director.
The Chairperson, Mr Peter McNeil is not independent, as set out above, but due to his experience and
expertise in areas the Company operates in, the Board considers he is suitably skilled to perform the role.
Recommendation 2.3: The roles of the chairperson and chief executive officer should not be exercised by
the same individual.
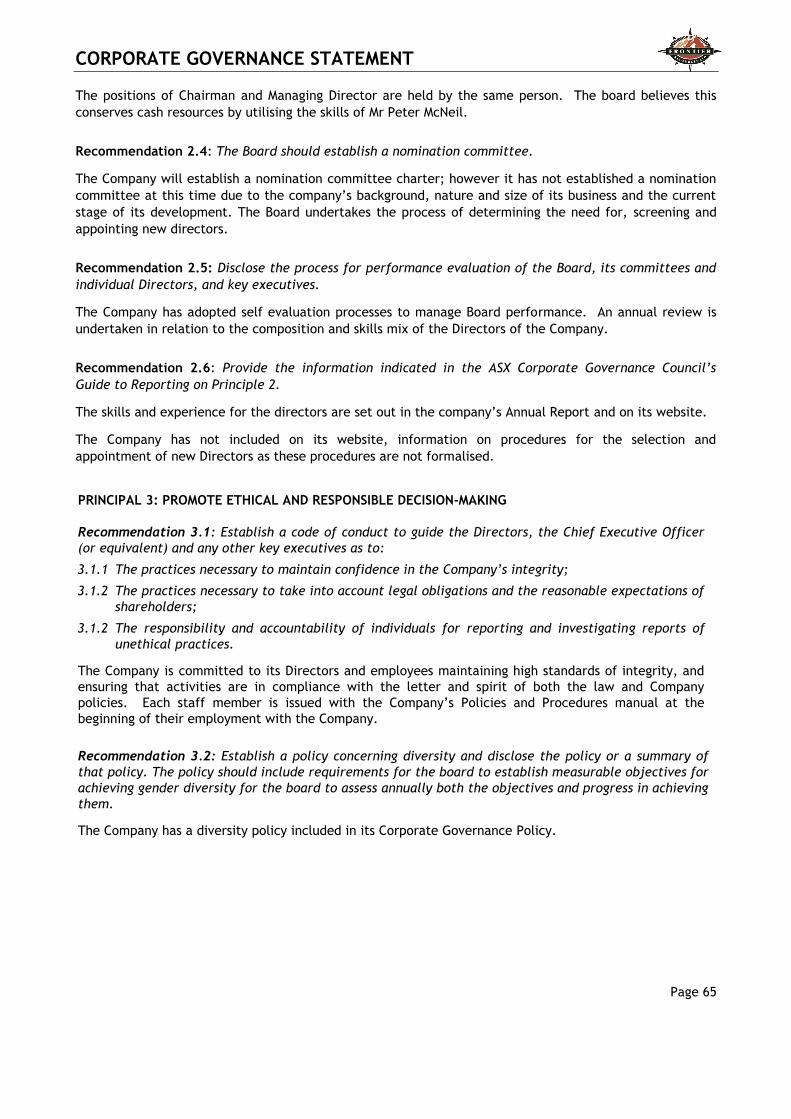
CORPORATE GOVERNANCE STATEMENT
Page 65
The positions of Chairman and Managing Director are held by the same person. The board believes this
conserves cash resources by utilising the skills of Mr Peter McNeil.
Recommendation 2.4: The Board should establish a nomination committee.
The Company will establish a nomination committee charter; however it has not established a nomination
committee at this time due to the company’s background, nature and size of its business and the current
stage of its development. The Board undertakes the process of determining the need for, screening and
appointing new directors.
Recommendation 2.5: Disclose the process for performance evaluation of the Board, its committees and
individual Directors, and key executives.
The Company has adopted self evaluation processes to manage Board performance. An annual review is
undertaken in relation to the composition and skills mix of the Directors of the Company.
Recommendation 2.6: Provide the information indicated in the ASX Corporate Governance Council’s
Guide to Reporting on Principle 2.
The skills and experience for the directors are set out in the company’s Annual Report and on its website.
The Company has not included on its website, information on procedures for the selection and
appointment of new Directors as these procedures are not formalised.
PRINCIPAL 3: PROMOTE ETHICAL AND RESPONSIBLE DECISION-MAKING
Recommendation 3.1: Establish a code of conduct to guide the Directors, the Chief Executive Officer
(or equivalent) and any other key executives as to:
3.1.1 The practices necessary to maintain confidence in the Company’s integrity;
3.1.2 The practices necessary to take into account legal obligations and the reasonable expectations of
shareholders;
3.1.2 The responsibility and accountability of individuals for reporting and investigating reports of
unethical practices.
The Company is committed to its Directors and employees maintaining high standards of integrity, and
ensuring that activities are in compliance with the letter and spirit of both the law and Company
policies. Each staff member is issued with the Company’s Policies and Procedures manual at the
beginning of their employment with the Company.
Recommendation 3.2: Establish a policy concerning diversity and disclose the policy or a summary of
that policy. The policy should include requirements for the board to establish measurable objectives for
achieving gender diversity for the board to assess annually both the objectives and progress in achieving
them.
The Company has a diversity policy included in its Corporate Governance Policy.

CORPORATE GOVERNANCE STATEMENT
Page 66
Recommendation 3.3: Disclose in each annual report the measurable objectives for achieving gender
diversity set by the board in accordance with the diversity policy and progress towards achieving them.
The Company believes that the promotion of diversity on boards, in senior management and within the
organisation generally broadens the pool for recruitment of high quality directors and employees; is
likely to support employee retention; through the inclusion of different perspectives, is likely to
encourage greater innovation; and is socially and economically responsible governance practice.
The Company is in compliance with the ASX Corporate Governance Council’s Principles &
Recommendations on Diversity. The Board of Directors is responsible for adopting and monitoring the
Company’s diversity policy. The policy sets out the beliefs and goals and strategies of the Company with
respect to diversity within the Company. Diversity within the Company means all the things that make
individuals different to one another including gender, ethnicity, religion, culture, language, sexual
orientation, disability and age. It involves a commitment to equality and to treating of one another with
respect.
The Company is dedicated to promoting a corporate culture that embraces diversity. The Company
believes that diversity begins with the recruitment and selection practices of its board and its staff.
Hiring of new employees and promotion of current employees are made on the bases of performance,
ability and attitude.
Recommendation 3.4: Disclose in each annual report the proportion of women employees in the whole
organisation, women in senior executive positions and women on the board.
Currently there are seven women employees and consultants in the whole organization, none of whom
are Key Management Personnel.
Recommendation 3.5: Provide the information indicated in the ASX Corporate Governance Council’s
Guide to Reporting on Principle 3.
A summary of both the Company’s Code of Conduct and its Share Trading Policy will be included on the
Company’s website.
PRINCIPLE 4: SAFEGUARD INTEGRITY IN FINANCIAL REPORTING
Recommendation 4.1: The Board should establish an audit committee.
The Company’s Audit Committee comprises Mr Fish and Mr Staude, who currently acts as an independent
chairperson. The Audit Committee currently consists of non-executive directors. The board considers this
to be acceptable due to the size of both the Company and the Board. Information on the qualifications of
the Directors on the Audit Committee and attendance at Audit Committee meetings are contained in the
Directors’ report.
Recommendation 4.2: Structure the Audit Committee so that it consists of:
Only non-executive directors
A majority of independent directors
An independent chairperson, who is not chairperson of the Board
At least 3 members
Refer to Recommendation 4.1

CORPORATE GOVERNANCE STATEMENT
Page 67
Recommendation 4.3: The Audit Committee should have a formal charter.
The Audit Committee operates in accordance with a formal charter. The main responsibilities of the
committee are to:
Review reports prepared by the external auditors and other consultants to ensure that, should a major
deficiencies or breakdowns in controls or procedures be identified, appropriate and prompt remedial
action is taken by management.
Liaising with the external auditors and ensuring that the annual statutory audit, half-year review are
conducted in an effective manner.
Reviewing internal controls and recommending enhancements.
Monitoring compliance with the Corporations Act 2001, Australian Stock Exchange Listing Rules and any
matters outstanding with auditors, taxation and other regulatory authorities and financial institutions.
Recommendation 4.4: Provide the information indicated in the ASX Corporate Governance Council’s
Guide to Reporting on Principle 4.
Refer to Recommendation 4.1
PRINCIPLE 5: MAKE TIMELY AND BALANCED DISCLOSURE
Recommendation 5.1: Establish written policies and procedure designed to ensure compliance with ASX
Listing Rules disclosure requirements and to ensure accountability at a senior management level for that
compliance.
The Company has a formal continuous disclosure policy. The policy requires all executives and Directors to
inform the Managing Director or in his absence the Company Secretary of any potentially material
information as soon as practical after they become aware of that information.
Information is material if it is likely that the information would influence investors who commonly acquire
securities on the ASX in deciding whether to buy, sell or hold the Company's securities.
Information need not be disclosed only if the ASX listing rules provide for non-disclosure.
The Managing Director is responsible for interpreting and monitoring the Company's disclosure policy and
where necessary informing the Board. The Company Secretary is responsible for all communications with
ASX.
Recommendation 5.2: Provide the information indicated in the ASX Corporate Governance Councils’
Guide to Reporting on Principle 5.
Disclosure is reviewed as a routine agenda item at each Board meeting.
PRINCIPLE 6: RESPECT THE RIGHTS OF SHAREHOLDERS
Recommendation 6.1: Design and disclose a communications strategy to promote effective
communication with shareholders and encourage effective participation at general meetings.
The Company is committed to dealing fairly, transparently and promptly with shareholders. The Board
aims to ensure that the shareholders are informed of all major developments.
The annual report is distributed to all shareholders who have specifically requested the document. In
addition, the Company makes all ASX announcements, details of shareholder meetings and financial
reports available of the Company’s website.

CORPORATE GOVERNANCE STATEMENT
Page 68
Half-year financial reports prepared in accordance with the requirements of Accounting Standards and the
Corporations Act 2001 are lodged with the Australian Securities and Investments Commission and the
Australian Securities Exchange. The financial reports are sent to any shareholder who requests them and
quarterly reports are submitted to the ASX under the requirements of the Exchange relating to mining
companies. Copies of the quarterly reports are sent to shareholders whenever sufficient new information in
the report warrants distribution.
Recommendation 6.2: Provide the information indicated in the ASX Corporate Governance Councils’
Guide to Reporting on Principle 6.
The Company effectively communicates with shareholders via ASX announcements and newsletters.
PRINCIPLE 7: RECOGNISE AND MANAGE RISK
Recommendation 7.1: The Board or appropriate committee should establish policies on risk oversight
and management of material business risks and disclose a summary of those policies.
The Board is responsible for the oversight of the Company’s risk management and control framework.
Responsibility for control and risk management is delegated to the appropriate level. The Risk Management
Policy is reviewed annually. A copy of the Risk Management Policy is available on the Company’s website.
Recommendation 7.2: The board should require management to design and implement the risk
management and internal control system to manage the company’s material business risks and report to
it on whether those risks are being managed effectively. The board should disclose that management has
reported to it as to the effectiveness of the company’s management of its material business risks.
The Company is not of size to allow this recommendation to be followed. The Board is responsible for the
design and implementation of risk management and internal control systems.
Recommendation 7.3: The board should disclose whether it has received assurance from the chief
executive officer (or equivalent) and the chief financial officer (or equivalent) that the declaration
provided in accordance with section 295A of the Corporations Act is founded on a system of risk
management and internal control and that the system is operating effectively in all material respects in
relation to the financial reporting risks.
The Company’s Managing Director and Chief Financial Officer provide this statement.
Recommendation 7.4: Provide the information indicated in the ASX Corporate Governance Council’s
Guide to reporting on Principle 7.
A description of the Company’s risk oversight and management policy and internal compliance and control
system is included on the Company’s website.
CORPORATE GOVERNANCE STATEMENT
Page 69
PRINCIPLE 8: REMUNERATE FAIRLY AND RESPONSIBLY
Recommendation 8.1: The Board should establish a remuneration committee.
The Company has a charter for a remuneration committee, however a committee has not been established at
this time. Given the small size of the board, the entire board performs the functions of the remuneration
committee.
Recommendation 8.2: Clearly distinguish the structure of non-executive Directors’ remuneration from
that of executives.
The Company outlines the structure of remuneration of non-executive Directors and executives of the
Company in the Remuneration report in the annual report.
Recommendation 8.3: Provide the information indicated in the ASX Corporate Governance Council’s
Guide to Reporting on Principle 8
Refer to Recommendation 8.1 in relation to the remuneration committee.
Refer to the Remuneration report in this Annual Report in relation to the superannuation payments to
directors. The Company does not have a superannuation scheme for its employees.
FINANCIAL REPORT – 30 JUNE 2012
Page 70
This financial report includes the consolidated financial statements and notes of Frontier Resources
Limited and its controlled entities (‘Consolidated Group’ or ‘Group’). The financial report is presented in
the Australian currency.
Frontier Resources Ltd is a company limited by shares, incorporated and domiciled in Australia. Its
principal place of business is:
Frontier Resources Ltd
120 Tranquil Place
STONEVILLE WA 6081
Its registered office is:
Frontier Resources Ltd
Level 4, 66 Kings Park Road
WEST PERTH WA 6005
A description of the nature of the Group’s operations and principal activities is included in the Letter from
the Managing Director and The Managing Director’s Review of Operations & Activities and in the Directors’
report.
The financial report was authorised for issue by the Directors on 28 September 2012. The Company has
the power to amend and reissue the financial report.
Through the use of the internet, we have ensured that our corporate reporting is timely, complete, and
available globally at minimum cost to the Company. All press releases, financial reports and other
information are available on our website: www.frontierresources.com.au.
For queries in relation to our reporting please call +61 8 9295 0388 or email [email protected].
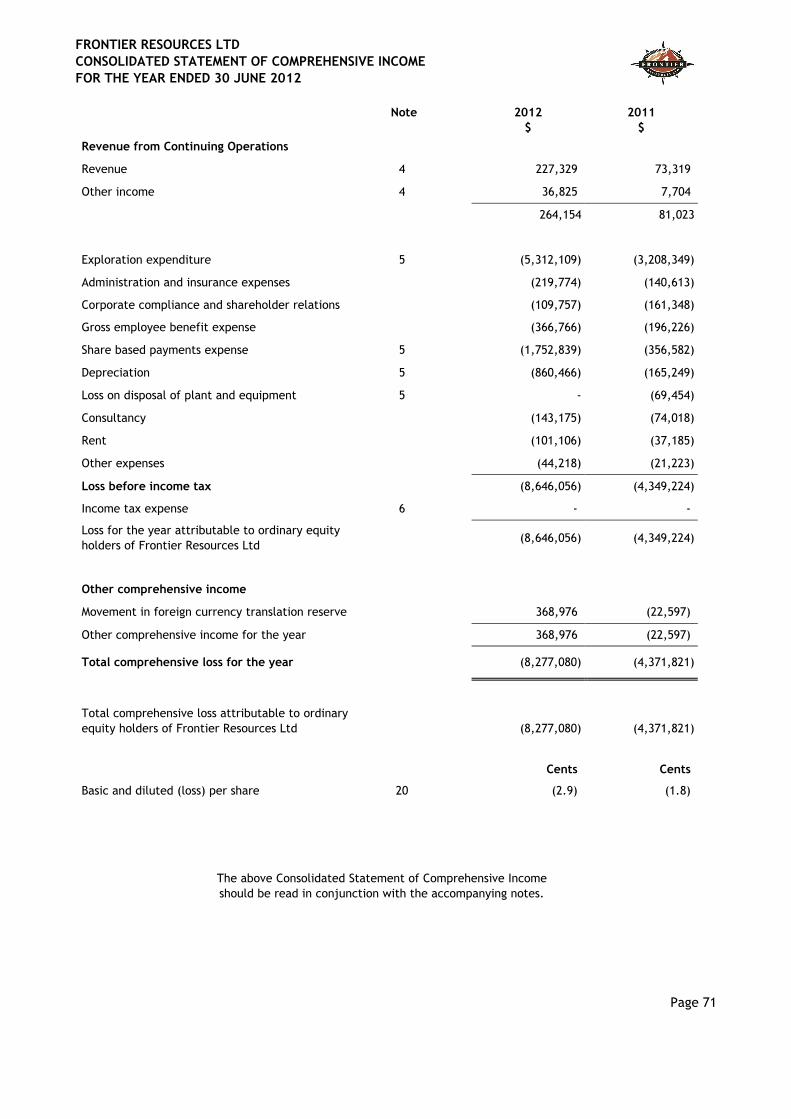
FRONTIER RESOURCES LTD
CONSOLIDATED STATEMENT OF COMPREHENSIVE INCOME
FOR THE YEAR ENDED 30 JUNE 2012
Page 71
Note 2012 2011
$ $
Revenue from Continuing Operations
Revenue 4 227,329 73,319
Other income 4 36,825 7,704
264,154 81,023
Exploration expenditure 5 (5,312,109) (3,208,349)
Administration and insurance expenses (219,774) (140,613)
Corporate compliance and shareholder relations (109,757) (161,348)
Gross employee benefit expense (366,766) (196,226)
Share based payments expense 5 (1,752,839) (356,582)
Depreciation 5 (860,466) (165,249)
Loss on disposal of plant and equipment 5 - (69,454)
Consultancy (143,175) (74,018)
Rent (101,106) (37,185)
Other expenses (44,218) (21,223)
Loss before income tax (8,646,056) (4,349,224)
Income tax expense 6 - -
Loss for the year attributable to ordinary equity
holders of Frontier Resources Ltd (8,646,056) (4,349,224)
Other comprehensive income
Movement in foreign currency translation reserve 368,976 (22,597)
Other comprehensive income for the year 368,976 (22,597)
Total comprehensive loss for the year (8,277,080) (4,371,821)
Total comprehensive loss attributable to ordinary
equity holders of Frontier Resources Ltd
(8,277,080)
(4,371,821)
Cents Cents
Basic and diluted (loss) per share 20 (2.9) (1.8)
The above Consolidated Statement of Comprehensive Income
should be read in conjunction with the accompanying notes.

FRONTIER RESOURCES LTD
CONSOLIDATED STATEMENT OF FINANCIAL POSITION
AS AT 30 JUNE 2012
Page 72
Notes 2012 2011
$ $
ASSETS
Current Assets
Cash and cash equivalents 7 2,862,050 8,287,285
Trade and other receivables 8 124,826 711,323
Total Current Assets 2,986,876 8,998,608
Non-Current Assets
Trade and other receivables 8 222,632 104,537
Plant and equipment 9 2,977,882 1,164,880
Exploration and evaluation expenditure 10 2,176,872 2,176,872
Total Non-Current Assets 5,377,386 3,446,289
Total Assets 8,364,262 12,444,897
LIABILITIES
Current Liabilities
Trade and other payables 11 837,409 209,838
Other liabilities 12 976,315 -
Total Current Liabilities 1,813,724 209,838
Total Liabilities 1,813,724 209,838
Net Assets 6,550,538 12,235,059
EQUITY
Contributed equity 13 31,338,457 30,498,737
Reserves 14 2,912,447 790,632
Accumulated losses 14 (27,700,366) (19,054,310)
Total Equity 6,550,538 12,235,059
The above Consolidated Statement of Financial Position
should be read in conjunction with the accompanying notes.

FRONTIER RESOURCES LTD
CONSOLIDATED STATEMENT OF CHANGES IN EQUITY
FOR THE YEAR ENDED 30 JUNE 2012
Page 73
Contributed
Equity
Accumulated
Losses
Share Based
Payment
Reserve
Foreign
Currency
Translation
Reserve
Total
$ $ $ $ $
Balance at 1 July 2010 18,452,527 (14,705,086) 894,880 (438,233) 4,204,088
Loss attributable to members of
parent entity - (4,349,224) - - (4,349,224)
Other comprehensive income - - - (22,597) (22,597)
Total comprehensive loss for the
year - (4,349,224) - (22,597) (4,371,821)
Transaction with owners,
directly in equity
Share based payments expense - - 356,582 - 356,582
Shares issued during the year, net
of costs 12,046,210 - - - 12,046,210
Balance at 30 June 2011 30,498,737 (19,054,310) 1,251,462 (460,830) 12,235,059
Balance at 1 July 2011 30,498,737 (19,054,310) 1,251,462 (460,830) 12,235,059
Loss attributable to ordinary
equity holders of Frontier
Resources Ltd
- (8,646,056) - - (8,646,056)
Other comprehensive income - - - 368,976 368,976
Total comprehensive loss for the
year - (8,646,056) - 368,976 (8,277,080)
Transaction with owners, in their
capacity as owners
Share based payments expense - - 1,752,839 - 1,752,839
Shares issued during the year, net
of costs 839,720 - - - 839,720
Balance at 30 June 2012 31,338,457 (27,700,366) 3,004,301 (91,854) 6,550,538
The above Consolidated Statement of Changes in Equity
should be read in conjunction with the accompanying notes.

FRONTIER RESOURCES LTD
CONSOLIDATED STATEMENT OF CASH FLOWS
FOR THE YEAR ENDED 30 JUNE 2012
Page 74
Note 2012 2011
$ $
Cash Flows From Operating Activities
Cash receipts from customers 52,228 44,777
Payments to suppliers and employees (985,114) (625,363)
Interest received 185,300 30,174
Joint Venture contributions for tenements 2,836,400 -
Payments to exploration expenditure (7,524,653) (2,934,311)
Net cash outflow from operating activities
by operating activities
23 (5,435,839) (3,484,723)
Cash Flows From Investing Activities
Payments for security deposits (116,325) (19,899)
Purchases of plant and equipment (1,826,002) (1,428,713)
Proceeds from sale of plant and equipment 141,959 -
Net cash inflow/(outflow) from investing activities (1,800,368) (1,448,612)
Cash Flows From Financing Activities
Proceeds from the issue of shares 839,720 12,046,210
Application funds received for shares to be issued in
subsidiary 976,315 -
Net cash inflow from financing activities 1,816,035 12,046,210
Net increase/(decrease) in cash and cash equivalents (5,420,172) 7,112,875
Cash at 1 July 8,287,285 1,197,008
Effect of exchange rates on cash holdings in foreign
currencies (5,063) (22,598)
Cash at 30 June 7 2,862,050 8,287,285
The above Consolidated Statement of Cash Flows
should be read in conjunction with the accompanying notes.
FRONTIER RESOURCES LTD & ITS CONTROLLED ENTITIES
NOTES TO THE FINANCIAL STATEMENTS
FOR THE YEAR ENDED 30 JUNE 2012
Page 75
NOTE 1 SUMMARY OF SIGNIFICANT ACCOUNTING POLICIES
The principal accounting policies adopted in the preparation of the financial report are set out below. These policies
have been consistently applied to all the years presented, unless otherwise stated. The financial report includes the
consolidated financial statements and notes of Frontier Resources and controlled entities (‘Consolidated Group’ or
‘Group).
Basis of preparation
This general purpose financial report has been prepared in accordance with Australian Accounting Standards and
Interpretations, other authoritative pronouncements of the Australian Accounting Standards Board and the Corporations
Act 2001.
Compliance with IFRS
These consolidated financial statements also comply with International Financial Reporting Standards (IFRS) as issued by
the International Accounting Standards Board (IASB).
Removal of Parent
Separate financial statements for Frontier Resources Limited as an individual entity are no longer presented as a
consequence of a change to the Corporation Act 2001. Financial information for Frontier Resources Limited as an
individual entity is included in note 23.
Historical cost convention
These financial statements have been prepared under the historical cost convention, as modified by the revaluation of
certain classes of plant and equipment.
Critical accounting estimates
The directors evaluate estimates and judgments incorporated into the financial statements based on historical knowledge
and best available current information. Estimates assume a reasonable expectation of future events and are based on
current trends and economic data, obtained both externally and within the Group. The areas involving a higher degree of
judgement or complexity, or areas where assumptions and estimates are significant to the financial statements are
disclosed in note 3.
(a) Principles of consolidation
(i) Subsidiaries
The consolidated financial statements incorporate the assets and liabilities of all subsidiaries of Frontier Resources Ltd
(''Company'' or ''parent entity'') as at 30 June each year, and the results of all subsidiaries for the year then ended.
Frontier Resources Ltd and its subsidiaries together are referred to in this financial report as the Group or the
consolidated group.
Subsidiaries are all those entities over which the Group has the power to govern the financial and operating policies,
generally accompanying a shareholding of more than one-half of the voting rights. The existence and effect of potential
voting rights that are currently exercisable or convertible are considered when assessing whether the Group controls
another entity.
Subsidiaries are fully consolidated from the date on which control is transferred to the Group. They are de-consolidated
from the date that control ceases. The purchase method of accounting is used to account for the acquisition of
subsidiaries by the Group.
Intercompany transactions, balances and unrealised gains on transactions between Group companies are eliminated.
Unrealised losses are also eliminated unless the transaction provides evidence of the impairment of the asset transferred.
Accounting policies of subsidiaries have been changed where necessary to ensure consistency with the policies adopted by
the Group.
FRONTIER RESOURCES LTD & ITS CONTROLLED ENTITIES
NOTES TO THE FINANCIAL STATEMENTS
FOR THE YEAR ENDED 30 JUNE 2012
Page 76
NOTE 1 SUMMARY OF SIGNIFICANT ACCOUNTING POLICIES (continued)
Non-controlling interests, being the equity in a subsidiary not attributable, directly or indirectly, to a parent, are shown
separately within the equity section of the consolidated statement of financial position and statement of comprehensive
income. The non-controlling interests in the net assets comprise their interests at the date of the original business
combination and their share of changes in equity since that date.
(ii) Joint ventures
The Group has entered into a joint venture agreement during the year. The exploration expenditure on the tenements
which are paid by the joint venture partner are netted off against the contribution received. There are no joint venture
assets recognised by the Group, while any funding by the joint venture partner which is received in advance of the
exploration expenditure incurred is shown as a liability on the consolidated statement of financial position.
(b) Exploration and evaluation expenditure
The Company has adopted a policy of writing off exploration and evaluation expenditure at the end of the period in
which it is incurred, unless a mineral resource has been estimated for the area of interest.
The Directors believe that this policy results in the carrying value of exploration expenditure more appropriately
reflecting the definition of an asset, being future benefits controlled by the consolidated group.
The ultimate recoupment of costs carried forward for exploration and evaluation phases is dependent on the successful
development and commercial exploitation or sale of the respective areas of interest.
All costs carried forward are in respect of areas of interest in the exploration and evaluation phases and accordingly,
production has not commenced.
Exploration and evaluation assets shall be assessed for impairment when facts and circumstances suggest that the
carrying amount of an exploration and evaluation asset may exceed its recoverable amount, in particular when
exploration for and evaluation of mineral resource in the specific area have not led to the discovery of commercially
viable quantities of mineral resources and the company has decided to discontinue such activities in the specific area.
(c) Income tax
The income tax expense (benefit) for the year comprises current income tax expense (income) and deferred tax expense
(income).
Current income tax expense charged to the profit or loss is the tax payable on taxable income calculated using applicable
income tax rates enacted, or substantially enacted, as at the end of the reporting period. Current tax liabilities (assets)
are therefore measured at the amounts expected to be paid to (recovered from) the relevant taxation authority.
Deferred income tax expense reflects movements in deferred tax asset and deferred tax liability balances during the year
as well as unused tax losses.
Current and deferred income tax expense (income) is charged or credited directly to equity instead of the profit or loss
when the tax relates to items that are credited or charged directly to equity.
Deferred tax assets and liabilities are ascertained based on temporary differences arising between the tax bases of assets
and liabilities and their carrying amounts in the financial statements. Deferred tax assets also result where amounts have
been fully expensed but future tax deductions are available. No deferred income tax will be recognised from the initial
recognition of an asset or liability, excluding a business combination, where there is no effect on accounting or taxable
profit or loss.
Deferred tax assets and liabilities are calculated at the tax rates that are expected to apply to the period when the asset
is realised or the liability is settled, based on tax rates enacted or substantively enacted at the end of the reporting
period. Their measurement also reflects the manner in which management expects to recover or settle the carrying
amount of the related asset or liability.
FRONTIER RESOURCES LTD & ITS CONTROLLED ENTITIES
NOTES TO THE FINANCIAL STATEMENTS
FOR THE YEAR ENDED 30 JUNE 2012
Page 77
NOTE 1 SUMMARY OF SIGNIFICANT ACCOUNTING POLICIES (continued)
Deferred tax assets relating to temporary differences and unused tax losses are recognised only to the extent that it is
probable that future taxable profit will be available against which the benefits of the deferred tax asset can be utilised.
Where temporary differences exist in relation to investments in subsidiaries, branches, associates, and joint ventures,
deferred tax assets and liabilities are not recognised where the timing of the reversal of the temporary difference can be
controlled and it is not probable that the reversal will occur in the foreseeable future.
Current tax assets and liabilities are offset where a legally enforceable right of set-off exists and it is intended that net
settlement or simultaneous realisation and settlement of the respective asset and liability will occur. Deferred tax assets
and liabilities are offset where a legally enforceable right of set-off exists, the deferred tax assets and liabilities relate to
income taxes levied by the same taxation authority on either the same taxable entity or different taxable entities where
it is intended that net settlement or simultaneous realisation and settlement of the respective asset and liability will
occur in future periods in which significant amounts of deferred tax assets or liabilities are expected to be recovered or
settled.
(d) Plant and equipment
All plant and equipment is stated at historical cost less depreciation. Historical cost includes expenditure that is directly
attributable to the acquisition of the items.
Subsequent costs are included in the asset’s carrying amount or recognised as a separate asset, as appropriate, only when
it is probable that future economic benefits associated with the item will flow to the Group and the cost of the
item can be measured reliably. All other repairs and maintenance are charged to the statement of comprehensive income
during the financial period in which they are incurred.
Items of plant and equipment are depreciated over their estimated useful lives. The diminishing balance method is used.
Assets are depreciated from the date of acquisition or, in respect of internally constructed assets, from the time an asset
is completed and held ready for use. Estimates of useful lives are made at the time of acquisition and varied as required.
Expected useful lives are: Plant and Equipment between 4 years and 7 years.
The assets’ residual values and useful lives are reviewed, and adjusted if appropriate, at each statement of financial
position date.
An asset’s carrying amount is written down immediately to its recoverable amount if the asset’s carrying amount is
greater than its estimated recoverable amount.
Gains and losses on disposals are determined by comparing proceeds with carrying amount. These are included in the
statement of comprehensive income.
(e) Employee benefits
(i) Wages and salaries, annual leave and sick leave
Liabilities for wages and salaries, including non-monetary benefits, annual leave and accumulating sick leave is expected
to be settled within 12 months of the reporting date are recognised in other payables in respect of employees’ services
up to the reporting date and are measured at the amounts expected to be paid when the liabilities are settled.
(ii) Long service leave
Any liability for employee benefits relating to long service leave represents the present value of the estimated future
cash outflows to be made by the employer resulting from employees' services provided up to the balance date.
(iii) Share-based payments
Share-based compensation benefits are provided to employees via the Frontier Resources Ltd Employee Option Plan.
Information relating to this Plan is set out in note 17.
FRONTIER RESOURCES LTD & ITS CONTROLLED ENTITIES
NOTES TO THE FINANCIAL STATEMENTS
FOR THE YEAR ENDED 30 JUNE 2012
Page 78
NOTE 1 SUMMARY OF SIGNIFICANT ACCOUNTING POLICIES (continued)
The fair value of options granted under the Frontier Resources Ltd Employee Option Plan is recognised as an employee
benefit expense with a corresponding increase in equity (share-based payments reserve). The fair value is measured at
grant date and recognised over the period during which the employees become unconditionally entitled to the options.
The fair value at grant date is determined using a Black-Scholes option pricing model that takes into account the exercise
price, the term of the option, the vesting and performance criteria, the impact of dilution, the non-tradeable nature of
the option, the share price at grant date and expected price volatility of the underlying share, the expected dividend
yield and the risk-free interest rate for the term of the option.
The fair value of the options granted excludes the impact of any non-market vesting conditions (for example, profitability
and sales growth targets). Non-market vesting conditions are included in assumptions about the number of options that
are expected to become exercisable. At each statement of financial position date, the entity revises its estimate of the
number of options that are expected to become exercisable. The employee benefit expense recognised each period takes
into account the most recent estimate.
The market value of shares issued to employees for no cash consideration under the employee share scheme is recognised
as an employee benefits expense with a corresponding increase in equity when the employees become entitled to the
shares.
(f) Cash and cash equivalents
For statement of cash flows presentation purposes, cash and cash equivalents includes cash on hand, deposits held at call
with financial institutions, other short-term, highly liquid investments with original maturities of three months or less
that are readily convertible to known amounts of cash and which are subject to an insignificant risk of changes in value,
and bank overdrafts. Bank overdrafts are shown within borrowings in current liabilities on the statement of financial
position.
(g) Revenue recognition
Revenue is measured at the fair value of the consideration received or receivable. Amounts disclosed as revenue are net
of returns, trade allowances and duties and taxes paid.
(i) Interest income
Interest income is recognised on a time proportion basis using the effective interest method. When a receivable is
impaired, the Group reduces the carrying amount to its recoverable amount, being the estimated future cash flow
discounted at the original effective interest rate of the instrument, and continues unwinding the discount as interest
income. Interest income on impaired loans is recognised using the original effective interest rate.
(h) Goods and Services Tax (GST)
Revenues, expenses and assets are recognised net of the amount of associated GST, unless the GST incurred is not
recoverable from the taxation authority. In this case it is recognised as part of the cost of acquisition of the asset or as
part of the expense.
Receivables and payables are stated inclusive of the amount of GST receivable or payable. The net amount of GST
recoverable from, or payable to, the taxation authority is included with other receivables or payables in the statement of
financial position.
Cash flows are presented on a gross basis. The GST components of cash flows arising from investing or financing activities
which are recoverable from, or payable to the taxation authority, are presented as operating cash flow.
(i) Financial Instruments
Initial recognition and measurement
Financial instruments, incorporating financial assets and financial liabilities, are recognised when the entity becomes a
party to the contractual provisions of the instrument. Trade date accounting is adopted for financial assets that are
delivered within timeframes established by marketplace convention.
FRONTIER RESOURCES LTD & ITS CONTROLLED ENTITIES
NOTES TO THE FINANCIAL STATEMENTS
FOR THE YEAR ENDED 30 JUNE 2012
Page 79
NOTE 1 SUMMARY OF SIGNIFICANT ACCOUNTING POLICIES (continued)
Financial instruments are initially measured at fair value plus transactions costs where the instrument is not classified as
at fair value through profit or loss. Transaction costs related to instruments classified as at fair value through profit or
loss are expensed to profit or loss immediately. Financial instruments are classified and measured as set out below.
The Group does not designate any interests in subsidiaries, associates or joint venture entities as being subject to the
requirements of accounting standards specifically applicable to financial instruments.
Loans and receivables
Loans and receivables are non-derivative financial assets with fixed or determinable payments that are not quoted in an
active market and are initially recognized at fair value and subsequently measured at amortised cost.
Loans and receivables are included in current assets, except for those which are not expected to mature within 12
months after the end of the reporting period. (All other loans and receivables are classified as non-current assets.)
Financial liabilities
Non-derivative financial liabilities (excluding financial guarantees) are initially recognized at fair value and subsequently
measured at amortised cost.
Fair value
Fair value is determined based on current bid prices for all quoted investments. Valuation techniques are applied to
determine the fair value for all unlisted securities, including recent arm’s length transactions, reference to similar
instruments and option pricing models.
Impairment
At each reporting date, the Group assesses whether there is objective evidence that a financial instrument has been
impaired. In the case of available-for sale financial instruments, a prolonged decline in the value of the instrument is
considered to determine whether an impairment has arisen. Impairment losses are recognised in the statement of
comprehensive income.
Derecognition
Financial assets are derecognised where the contractual rights to cash flow expires or the asset is transferred to another
party whereby the entity no longer has any significant continuing involvement in the risks and benefits associated with
the asset. Financial liabilities are derecognised where the related obligations are either discharged, cancelled or
expired. The difference between the carrying value of the financial liability extinguished or transferred to another party
and the fair value of consideration paid, including the transfer of non-cash assets or liabilities assumed, is recognised in
profit or loss.
(j) Earnings per share
(i) Basic earnings per share
Basic earnings per share is calculated by dividing the profit after tax attributable to equity holders of the company,
excluding any costs of servicing equity other than ordinary shares, by the weighted average number of ordinary shares
outstanding during the financial year.
(ii) Diluted earnings per share
Potential shares as a result of options outstanding at the end of the year are not dilutive and therefore have not been
included in the calculation of diluted earnings per share.
(k) Impairment of assets
Assets are reviewed for impairment whenever events or changes in circumstances indicate that the carrying amount may
not be recoverable. An impairment loss is recognised for the amount by which the asset’s carrying amount exceeds its
recoverable amount. The recoverable amount is the higher of an asset’s fair value less costs to sell and value in use. For
the purposes of assessing impairment, assets are grouped at the lowest levels for which there are separately identifiable
cash inflows which are largely independent of the cash inflows from other assets or groups of assets (cash-generating
units). Non-financial assets other than goodwill that suffered impairment are reviewed for possible reversal of the
impairment at each reporting date.

FRONTIER RESOURCES LTD & ITS CONTROLLED ENTITIES
NOTES TO THE FINANCIAL STATEMENTS
FOR THE YEAR ENDED 30 JUNE 2012
Page 80
NOTE 1 SUMMARY OF SIGNIFICANT ACCOUNTING POLICIES (continued)
(l) Provisions
Provisions are recognised when the Group has a legal or constructive obligation, as a result of past events, for which it is
probable that an outflow of economic benefits will results and that outflow can be reliably measured.
(m) Borrowing costs
Borrowing costs directly attributable to the acquisition, construction or production of assets that necessarily take a
substantial period of time to prepare for their intended use or sale, are added to the cost of those assets, until such time
as the assets are substantially ready for their intended use or sale.
All other borrowing costs are recognised in income in the period in which they are incurred.
(n) Foreign currency transactions and balances
The functional currency of each of the group’s entities is measured using the currency of the primary economic
environment in which that entity operates. The consolidated financial statements are presented in Australian dollars
which is the parent entity’s functional and presentation currency.
Transaction and balances
Foreign currency transactions are translated into functional currency using the exchange rates prevailing at the date of
the transaction. Foreign currency monetary items are translated at the year-end exchange rate. Non-monetary items
measured at historical cost continue to be carried at the exchange rate at the date of the transaction. Non-monetary
items measured at fair value are reported at the exchange rate at the date when fair values were determined.
Exchange differences arising on the translation of monetary items are recognised in the statement of comprehensive
income, except where deferred in equity as a qualifying cash flow or net investment hedge.
Exchange differences arising on the translation of non-monetary items are recognised directly in equity to the extent that
the gain or loss is directly recognised in equity, otherwise the exchange difference is recognised in the statement of
comprehensive income.
Group companies
The financial results and position of foreign operations whose functional currency is different from the group’s
presentation currency are translated as follows:
Assets and liabilities are translated at year-end exchange rates prevailing at that reporting date;
Income and expenses are translated at average exchange rates for the period; and
Share capital and retained earnings are translated at the exchange rates prevailing at the date of the
transaction.
Exchange differences arising on translation of foreign operations are transferred directly to the group’s foreign currency
translation reserve in the statement of financial position. These differences are recognised in the statement of
comprehensive income in the period in which the operation is disposed.
(o) Segment Reporting
Operating segments are reported in a manner consistent with the internal reporting provided to the chief operating
decision maker. The chief operating decision maker, who is responsible for allocating resources and assessing
performance of the operating segments, has been identified as the Board of Directors.
(p) Comparative Figures
Where required by Accounting Standards comparative figures have been adjusted to conform with changes in presentation
for the current financial year.
FRONTIER RESOURCES LTD & ITS CONTROLLED ENTITIES
NOTES TO THE FINANCIAL STATEMENTS
FOR THE YEAR ENDED 30 JUNE 2012
Page 81
NOTE 1 SUMMARY OF SIGNIFICANT ACCOUNTING POLICIES (continued)
(q) New Accounting Standards for Application in Future Periods (cont.)
The AASB has issued new and amended accounting standards and interpretations that have mandatory application dates
for future reporting periods. The Group has decided against early adoption of these standards. A discussion of those
future requirements and their impact on the Group follows:
AASB 9: Financial Instruments (issued December 2009 and amended December 2010)
Applicable for annual reporting periods commencing on or after 1 January 2015.
Amends the requirements for classification and measurement of financial assets. The available-for-sale and held-
to-maturity categories of financial assets in AASB 139 have been eliminated.
AASB 9 requires that gains or losses on financial liabilities measured at fair value are recognised in profit or loss,
except that the effects of changes in the liability’s credit risk are recognised in other comprehensive income.
Adoption of AASB 9 is only mandatory for the year ending 30 June 2016. The Group has not yet made an
assessment of the impact of these amendments.
AASB 10: Consolidated Financial Statements (issued August 2011)
Applicable for annual reporting periods commencing on or after 1 January 2013.
Introduces a single ‘control model’ for all entities, including special purpose entities (SPEs), whereby all of the
following conditions must be present:
- Power over investee (whether or not power used in practice).
- Exposure, or rights, to variable returns from investee.
- Ability to use power over investee to affect the entity’s returns from investee.
- Introduces the concept of ‘defacto’ control for entities with less than 50% ownership interest in an entity, but
which have a large shareholding compared to other shareholders. This could result in more instances of
control and more entities being consolidated.
When this standard is first adopted for the year ended 30 June 2014, there will be no impact on transactions and
balances recognised in the financial statements because the Group does not have any special purpose entities.
The Group does not have ’defacto’ control of any entities with less than 50% ownership in an entity.
AASB 11: Joint Arrangements (issued August 2011)
Applicable for annual reporting periods commencing on or after 1 January 2013.
Joint arrangements will be classified as either ‘joint operations’ (where parties with joint control have rights to
assets and obligations for liabilities) or ‘joint ventures’ (where parties with joint control have rights to the net
assets of the arrangement).
When this standard is first adopted for the year ended 30 June 2014, there will be no impact on transactions and
balances recognised in the financial statements because the Group has not entered into any joint arrangements.
AASB 12: Disclosure of Interests in Other Entities (issued August 2011)
Applicable for annual reporting periods commencing on or after 1 January 2013.
Combines existing disclosures from AASB 127 Consolidated and Separate Financial Statements, AASB 128
Investments in Associates and AASB 131 Interests in Joint Ventures. Introduces new disclosure requirements for
interests in associates and joint arrangements, as well as new requirements for unconsolidated structured entities.
As this is a disclosure standard only, there will be no impact on amounts recognised in the financial statements.
However, additional disclosures will be required for interests in associates and joint arrangements, as well as for
unconsolidated structured entities.

FRONTIER RESOURCES LTD & ITS CONTROLLED ENTITIES
NOTES TO THE FINANCIAL STATEMENTS
FOR THE YEAR ENDED 30 JUNE 2012
Page 82
NOTE 1 SUMMARY OF SIGNIFICANT ACCOUNTING POLICIES (continued)
(r) New Accounting Standards for Application in Future Periods (cont.)
AASB 13: Fair Value Measurement (issued September 2011)
Applicable for annual reporting periods commencing on or after 1 January 2013.
AASB 13 establishes a single framework for measuring fair value of financial and non-financial items recognised at
fair value in the statement of financial position or disclosed in the notes to the financial statements.
Additional disclosures required for items measured at fair value in the statement of financial position, as well as
items merely disclosed at fair value in the notes to the financial statements
Extensive additional disclosures are required for items measured at fair value that are ‘level 3’ valuations in the
fair value hierarchy that are not financial instruments.
When this standard is first adopted for the year ended 30 June 2014, additional disclosures will be required about
fair values.
AASB 119: Employee Benefits (issued September 2011)
Applicable for annual reporting periods commencing on or after 1 January 2013.
Employee benefits expected to be settled (as opposed to due to be settled under current standards) wholly within
12 months after the end of the reporting period are short-term benefits, and therefore not discounted when
calculating leave liabilities. Annual leave not expected to be used wholly within 12 months of end of reporting
period will in future by discounted when calculating leave liability.
When this standard is first adopted for the year ended 30 June 2014, annual leave liabilities will be recalculated
on 1 July 2012 as long-term benefits where they are not expected to be settled wholly within 12 months after the
end of the reporting period. This will result in a reduction of the annual leave liabilities recognised on 1 July
2012, and a corresponding increase in retained earnings at that date.
AASB 2010-8: Amendments to AASB 112 – Deferred Tax: Recovery of Underlying Assets
Applicable for annual reporting periods commencing on or after 1 January 2012.
For investment property measured using the fair value model, deferred tax assets and liabilities will be calculated
on the basis of a rebuttable presumption that the carrying amount of the investment property will be recovered
through sale.
As the Group does not have any investment property measured using the fair value model, there will be no impact
on the financial statements when these amendments are first adopted.
AASB 2011-4: Amendments to AASB 124 to Remove Individual Key Management Personnel Disclosure Requirements
(issued July 2011)
Applicable for annual reporting periods commencing on or after 1 July 2013.
These amendments remove individual key management personnel (KMP) disclosure requirements from AASB 124 to
eliminate duplicated information required under the Corporation Act 2001.
When this standard is first adopted for the year ended 30 June 2014, the Group will show reduced disclosures
under the Key Management Personnel note to the financial statements.
AASB 2011-9: Amendments to AASB 101 Presentation of Items of Other Comprehensive Income (issued Sept. 2011)
Applicable for annual reporting periods commencing on or after 1 July 2012.
- One statement of comprehensive income to be referred to as ‘statement of profit or loss and other
comprehensive income’.
- Two statements to be referred to as ‘statement of profit or loss’ and ‘statement of other comprehensive
income’.
- OCI items must be grouped together into two sections: those that could subsequently be reclassified into
profit or loss, and those that cannot.

FRONTIER RESOURCES LTD & ITS CONTROLLED ENTITIES
NOTES TO THE FINANCIAL STATEMENTS
FOR THE YEAR ENDED 30 JUNE 2012
Page 83
NOTE 1 SUMMARY OF SIGNIFICANT ACCOUNTING POLICIES (continued)
(q) New Accounting Standards for Application in Future Periods (cont.)
When this standard is first adopted for the year ended 30 June 2013, there will be no impact on amounts
recognized for transactions and balances for 30 June 2013 and comparatives.
Interpretation 20: Stripping Costs in the Production Phase of a Surface Mine (issued November 2011)
Applicable for annual reporting periods commencing on or after 1 January 2013.
Clarifies that costs of removing minewaste materials (overburden) to gain access to mineral ore deposits during the
production phase of a mine must be capitalised as inventories under AASB 102 Inventories if the benefits from
stripping activity are realised in the form of inventory produced. Otherwise, if stripping activity provides
improved access to the ore, stripping costs must be capitalized as a non-current, stripping activity asset if certain
recognition criteria are met.
As the Group does not operate a surface mine, there will be no impact on the financial statements when this
interpretation is first adopted.
AASB 2012-5: Annual Improvements to Australian Accounting Standards 2009-2011 Cycle (issued June 2012)
Applicable for annual reporting periods commencing on or after 1 January 2013.
These include non-urgent but necessary changes to IFRSs (IAS 1, IAS 16 and IAS 32).
When this standard is first adopted for the year ended 30 June 2013, there will be no material impact.
IFRS: Mandatory Effective Date of IFRS 9 and Transition Disclosures (issued December 2011)
Applicable for annual reporting periods commencing on or after 1 January 2015.
Entities are no longer required to restate comparatives on first time adoption. Instead, additional disclosures on
the effects of transition are required.
As comparatives are no longer required to be restated, there will be no impact on amounts recognized in financial
statements. However, additional disclosures will be required on transition, including the quantitative effects of
reclassifying financial assets on transition.
The Group does not anticipate the early adoption of any of the above Australian Accounting Standards.
NOTE 2 FINANCIAL RISK MANAGEMENT
The Group's activities expose it to a variety of financial risks; market risk (including foreign exchange risk and interest
rate risk), credit risk and liquidity risk. The Group's overall risk management program focuses on the unpredictability of
financial markets and seeks to minimise potential adverse effects on the financial performance of the Group. The Group
is engaged in mineral exploration and evaluation, and does not currently sell product and derives only limited revenue
from interest earned.
Risk management is carried out by the board as a whole and no formal risk management policy has been adopted but is in
the process of development.
(a) Market risk
(i) Foreign exchange risk
Foreign exchange risk arises when future commercial transactions and recognised assets and liabilities are denominated in
a currency that is not the entity’s functional currency.
The Group operates internationally and is exposed to foreign exchange risk arising from currency exposures to the PNG
Kina. Since the Group has not yet commenced mining operations or to sell products the exposure is limited to the
movement in loan accounts between the Parent and the Subsidiaries located in Papua New Guinea.

FRONTIER RESOURCES LTD & ITS CONTROLLED ENTITIES
NOTES TO THE FINANCIAL STATEMENTS
FOR THE YEAR ENDED 30 JUNE 2012
Page 84
NOTE 2 FINANCIAL RISK MANAGEMENT (continued)
The Group limits its foreign currency risk by limiting funds held in overseas bank accounts and paying its creditors
promptly. The Group’s exposure to foreign currency risk on PNG Kina, translated into Australian Dollars at 30 June, was
as follows:
2012 2012 2011 2011
AUD Kina AUD Kina
Foreign currency assets and liabilities
Cash and cash equivalents 6,412 12,677 - -
Trade and other receivables 77,429 153,076 36,607 85,602
Intercompany loans payable (14,318,108) (28,306,900) (8,821,148) (20,627,372)
Trade and other payables (69,918) (138,228) (106,407) (248,821)
(ii) Interest rate risk
From time to time the Group has significant interest bearing assets, but they are as a result of the timing of equity raising
and capital expenditure rather than a reliance on interest income. Exposure to interest rates is limited to the cash and
cash equivalents balances.
The Group’s exposure to interest rate risk, which is the risk that a financial instrument’s value will fluctuate as a result
of changes in market interest rates, and the effective weighted average interest rate for each class of financial assets
and financial liabilities comprises:
2012 Floating
Interest Rate
Non-interest
bearing
Total
$ $ $
Financial assets
Cash and cash equivalents 2,862,050 - 2,862,050
Trade and other receivables - 124,826 124,826
2,862,050 124,826 2,986,876
Weighted average interest rate 5.2%
Financial liabilities
Trade and other payables - 837,409 837,409
- 837,409 837,409
Net financial assets 2,862,050 (712,583) 2,149,467
2011 Floating
Interest Rate
Non-interest
bearing
Total
$ $ $
Financial assets
Cash and cash equivalents 8,287,285 - 8,287,285
Trade and other receivables - 673,820 673,820
8,287,285 673,820 8,961,105
Weighted average interest rate 3.0%
Financial liabilities
Trade and other payables - 209,838 209,838
- 209,838 209,838
Net financial assets 8,287,285 463,982 8,751,267
FRONTIER RESOURCES LTD & ITS CONTROLLED ENTITIES
NOTES TO THE FINANCIAL STATEMENTS
FOR THE YEAR ENDED 30 JUNE 2012
Page 85
NOTE 2 FINANCIAL RISK MANAGEMENT (continued)
Sensitivity analysis
The following table illustrates sensitivities of the Group’s exposure to changes in interest rates. The table indicates the
impact on how profit reported at balance date would have been affected by changes in the interest rate risk variable that
management considers to be reasonably possible.
2012
$
2011
$
Net financial assets subject to variable interest rates 2,862,050 8,287,285
Increase in profits resulting from a 1% pa increase in
variable interest rates
28,620 82,873
Decrease in profits resulting from a 1% pa decrease in
variable interest rates
(28,620) (82,873)
Net Fair Value
Cash and cash equivalents, trade and other receivables, and trade and other payables are short-term investments in nature
whose carrying value is equivalent to fair value.
(b) Credit risk
Credit risk exposure represents the extent of credit related losses that the Group may be subject to on amounts to be
received from financial assets. Credit risk arises principally from trade and other receivables including inter company
loans and cash. The objective of the Group is to minimise the risk of loss from credit risk. Although revenue from
operations is minimal, the Group trades only with creditworthy third parties. In addition, receivable balances are
monitored on an ongoing basis with the result that the Group’s exposure to bad debts is insignificant. Credit terms are
generally 30 days from the invoice date. The Group has no concentrations of credit risk, other than holding all its cash
with Westpac Bank. The Group’s maximum credit risk exposure is limited to the carrying value of its financial assets as
indicated on the statement of financial position, which has not changed materially from the prior year.
Receivables include $4,967 loaned to Quintessential Resources Limited, a related Company under AASB 124 para 9(b(vi).
Receivables also include $222,632 in bonds, primarily mines department deposits.
Credit risk exposures
Credit risks related to balances with bank and other financial institutions is managed by the Board in accordance with
Board policy. Such policy requires that surplus funds are only invested with counterparties with a Standard and Poor’s
rating of at least AA-. Cash is held with Westpac Banking Corporation, which is AA Rated.
The maximum exposure to credit risk is as follows:
2012
$
2011
$
Current Assets:
Cash and cash equivalents 2,862,050 8,287,285
Trade and other receivables 124,826 711,323
Non-Current Assets:
Trade and other receivables 222,632 104,537
3,209,508 9,103,145
(c) Liquidity risk
Liquidity risk arises from the possibility that the Group might encounter difficulty in settling its debts or otherwise
meeting its obligations related to financial liabilities.
FRONTIER RESOURCES LTD & ITS CONTROLLED ENTITIES
NOTES TO THE FINANCIAL STATEMENTS
FOR THE YEAR ENDED 30 JUNE 2012
Page 86
NOTE 2 FINANCIAL RISK MANAGEMENT (continued)
The Group manages liquidity risk by continuously monitoring forecast and actual cash flows and ensuring sufficient cash
and marketable securities are available to meet the current and future commitments of the Group. Due to the nature of
the Group’s activities, being mineral exploration, the Group does not have ready access to credit facilities, with the
primary source of funding being equity raisings. The Board of Directors constantly monitor the state of equity markets in
conjunction with the Group’s current and future funding requirements, with a view to initiating appropriate capital
raisings as required. Any surplus funds are invested with major financial institutions.
The Group’s current financial assets and liabilities are summarised as follows:
2012
$
2011
$
Cash and cash equivalents 2,862,050 8,287,285
Trade and other receivables 124,826 711,323
Trade and other payables (784,965) (209,838)
2,201,911 8,788,770
Included in current payables is the amount of $623,856 joint venture funding received in advance. Joint Venture funds
are received each quarter for spending during the next three months.
The remaining financial liabilities of the Group are confined to trade and other payables as disclosed in the statement of
financial position. All trade and other payables are non-interest bearing and due within 30 days from the reporting date.
The contractual amounts payable are equal to the carrying amounts in the accounts.
NOTE 3 CRITICAL ACCOUNTING ESTIMATES AND JUDGEMENTS
Judgements, estimates and assumptions are continually evaluated and are based on historical experience and other
factors, including expectations of future events that are believed to be reasonable under the circumstances. The Group
makes assumptions concerning the future. All judgments, estimates and assumptions made are believed to be reasonable
based on the most current set of circumstances available to management. The resulting accounting estimates will, by
definition, seldom equal the related actual results. The judgments, estimates and assumptions that have a significant
risk of causing a material adjustment to the carrying amounts and assets and liabilities within the next financial year are
discussed below.
(a) Impairment of assets
The Group assesses impairment at each reporting date by evaluating conditions specific to the Group that may lead to
impairment of assets. Where an impairment trigger exists, the recoverable amount of the asset is determined. Value-in-
use calculations performed in assessing recoverable amounts incorporate a number of key estimates.
The Board has reviewed its statement of financial position at 30 June 2012 and determined that no impairment is
required for this financial year.
(b) Exploration and evaluation expenditure
Exploration and Evaluation costs are carried forward where a JORC inferred resource has been established for the area of
interest. Refer to accounting policy stated in note 1(b).
(c) Share based payments
The Group measures the cost of equity settled transactions with employees by reference to the fair value of equity
instruments at the date at which they are granted. The fair value is determined by an external valuer using a Black-
Scholes option pricing model, using the assumptions detailed in Note 17.
FRONTIER RESOURCES LTD & ITS CONTROLLED ENTITIES
NOTES TO THE FINANCIAL STATEMENTS
FOR THE YEAR ENDED 30 JUNE 2012
Page 87
NOTE 4 REVENUE 2012
$
2011
$
From continuing operations
Administration fee income 37,847 -
Drilling contract income - 13,910
Other sundry income 4,182 29,235
Other revenue
Interest – unrelated parties 185,300 30,174
Total Revenue 227,329 73,319
Other Income
Gain on disposal of plant and equipment 36,825 7,704
Total Other Income 36,825 7,704
NOTE 5 EXPENSES AND SIGNIFICANT ITEMS 2012
$
2011
$
Depreciation of Plant & equipment 860,466 165,249
Superannuation expense 89,482 33,733
Significant Items
Exploration and evaluation expenditure 5,312,109 3,208,349
Loss on disposal of plant and equipment - 69,454
Share-based payments expense 1,752,839 356,582
NOTE 6 INCOME TAX 2012
$
2011
$
(a) Numerical reconciliation of income tax expense to prima
facie tax payable / (tax loss)
Profit (loss) from continuing operations before income tax expense (8,646,056) (4,349,224)
Tax at Australian tax rate of 30% (2011: 30%) and Papua New Guinea
tax rate of 30% (2011: 30%) (2,593,817) (1,304,767)
Tax effect of amounts which are not deductible (taxable) in
calculating taxable income:
Other non - deductible 187,157 4,676
Share based payments expense 525,852 106,974
Previously unrecognised tax losses now recognised to reduce CTE
xpense (62,843) -
Deferred tax asset not brought to account 1,943,651 1,193,117
Income tax expense - -
(b) Tax losses
Unused tax losses for which no deferred tax asset has
been recognised 15,541,186 23,017,807
Potential tax benefit @ 30%
4,622,356 6,905,342
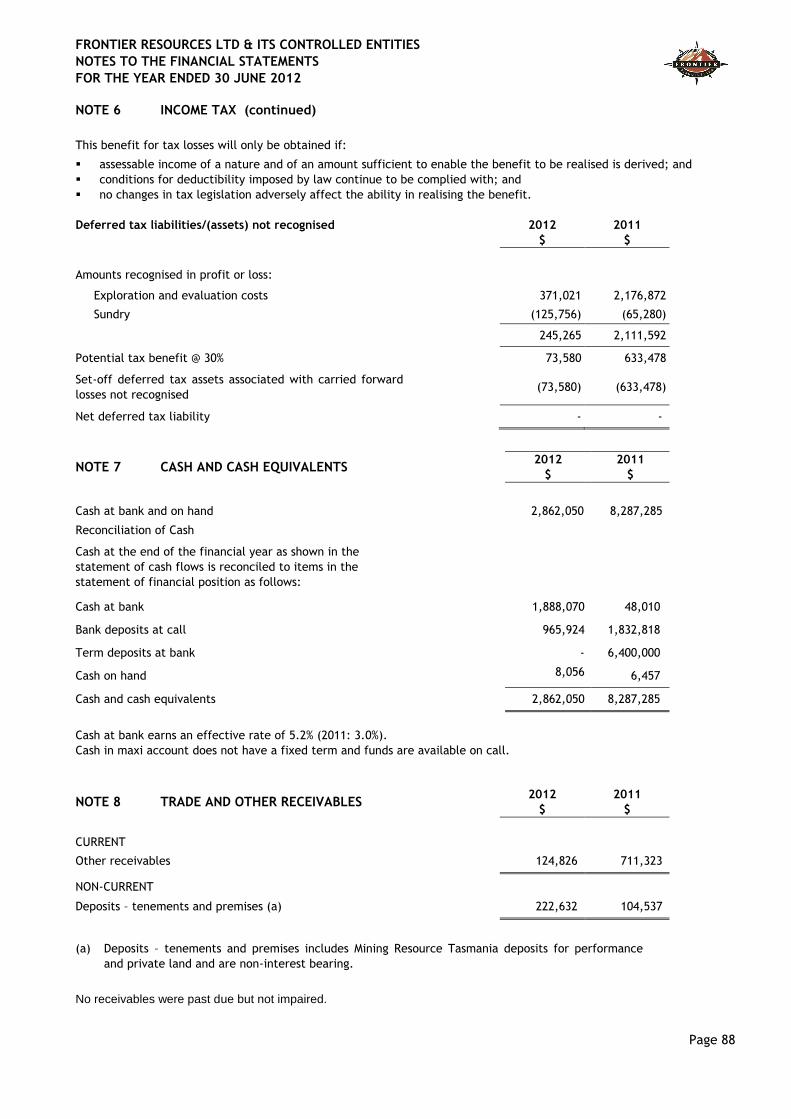
FRONTIER RESOURCES LTD & ITS CONTROLLED ENTITIES
NOTES TO THE FINANCIAL STATEMENTS
FOR THE YEAR ENDED 30 JUNE 2012
Page 88
NOTE 6 INCOME TAX (continued)
This benefit for tax losses will only be obtained if:
assessable income of a nature and of an amount sufficient to enable the benefit to be realised is derived; and
conditions for deductibility imposed by law continue to be complied with; and
no changes in tax legislation adversely affect the ability in realising the benefit.
(c) Deferred tax liabilities/(assets) not recognised
2012
$
2011
$
Amounts recognised in profit or loss:
Exploration and evaluation costs 371,021 2,176,872
Sundry (125,756) (65,280)
245,265 2,111,592
Potential tax benefit @ 30% 73,580 633,478
Set-off deferred tax assets associated with carried forward
losses not recognised (73,580) (633,478)
Net deferred tax liability - -
NOTE 7 CASH AND CASH EQUIVALENTS 2012
$
2011
$
Cash at bank and on hand 2,862,050 8,287,285
Reconciliation of Cash
Cash at the end of the financial year as shown in the
statement of cash flows is reconciled to items in the
statement of financial position as follows:
Cash at bank 1,888,070 48,010
Bank deposits at call 965,924 1,832,818
Term deposits at bank - 6,400,000
Cash on hand 8,056
6,457
Cash and cash equivalents 2,862,050 8,287,285
Cash at bank earns an effective rate of 5.2% (2011: 3.0%).
Cash in maxi account does not have a fixed term and funds are available on call.
NOTE 8 TRADE AND OTHER RECEIVABLES 2012
$
2011
$
CURRENT
Other receivables 124,826 711,323
NON-CURRENT
Deposits – tenements and premises (a) 222,632 104,537
(a) Deposits – tenements and premises includes Mining Resource Tasmania deposits for performance
and private land and are non-interest bearing.
No receivables were past due but not impaired.
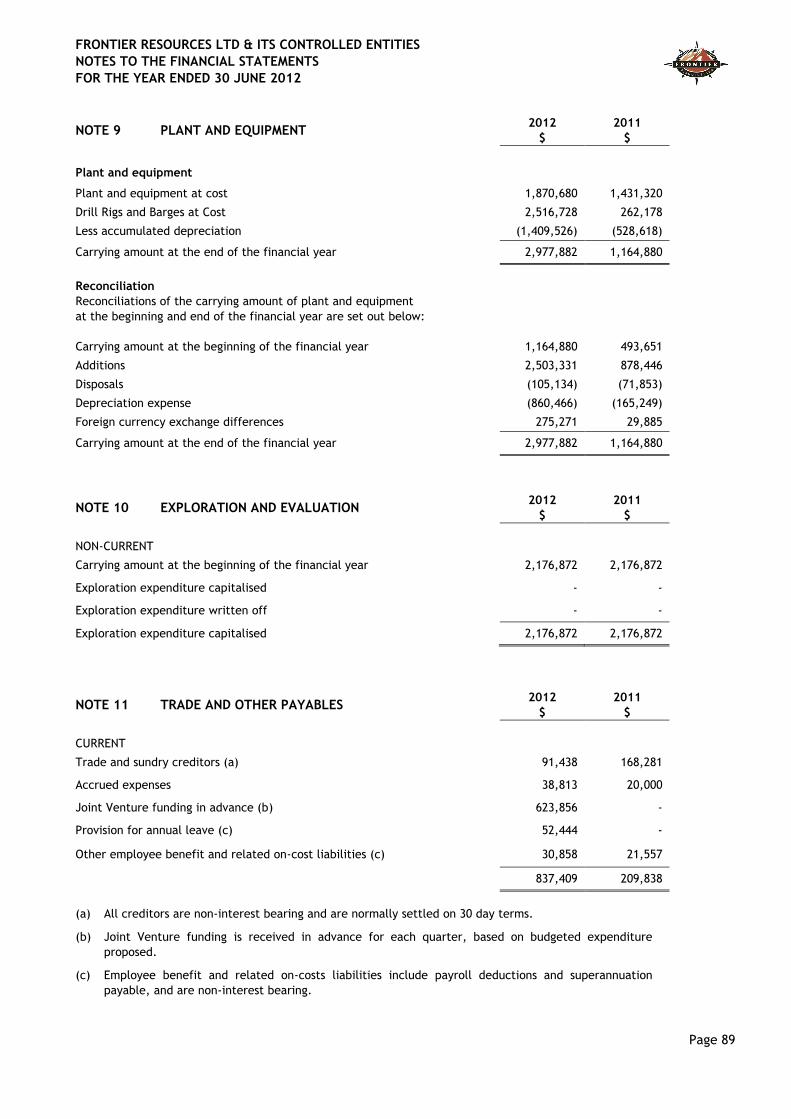
FRONTIER RESOURCES LTD & ITS CONTROLLED ENTITIES
NOTES TO THE FINANCIAL STATEMENTS
FOR THE YEAR ENDED 30 JUNE 2012
Page 89
NOTE 9 PLANT AND EQUIPMENT 2012
$
2011
$
Plant and equipment
Plant and equipment at cost 1,870,680 1,431,320
Drill Rigs and Barges at Cost 2,516,728 262,178
Less accumulated depreciation (1,409,526) (528,618)
Carrying amount at the end of the financial year 2,977,882 1,164,880
Reconciliation
Reconciliations of the carrying amount of plant and equipment
at the beginning and end of the financial year are set out below:
Carrying amount at the beginning of the financial year 1,164,880 493,651
Additions 2,503,331 878,446
Disposals (105,134) (71,853)
Depreciation expense (860,466) (165,249)
Foreign currency exchange differences 275,271 29,885
Carrying amount at the end of the financial year 2,977,882 1,164,880
NOTE 10 EXPLORATION AND EVALUATION 2012
$
2011
$
NON-CURRENT
Carrying amount at the beginning of the financial year 2,176,872 2,176,872
Exploration expenditure capitalised - -
Exploration expenditure written off - -
Exploration expenditure capitalised 2,176,872 2,176,872
NOTE 11 TRADE AND OTHER PAYABLES 2012
$
2011
$
CURRENT
Trade and sundry creditors (a) 91,438 168,281
Accrued expenses 38,813 20,000
Joint Venture funding in advance (b) 623,856 -
Provision for annual leave (c) 52,444 -
Other employee benefit and related on-cost liabilities (c) 30,858 21,557
837,409 209,838
(a) All creditors are non-interest bearing and are normally settled on 30 day terms.
(b) Joint Venture funding is received in advance for each quarter, based on budgeted expenditure
proposed.
(c) Employee benefit and related on-costs liabilities include payroll deductions and superannuation
payable, and are non-interest bearing.
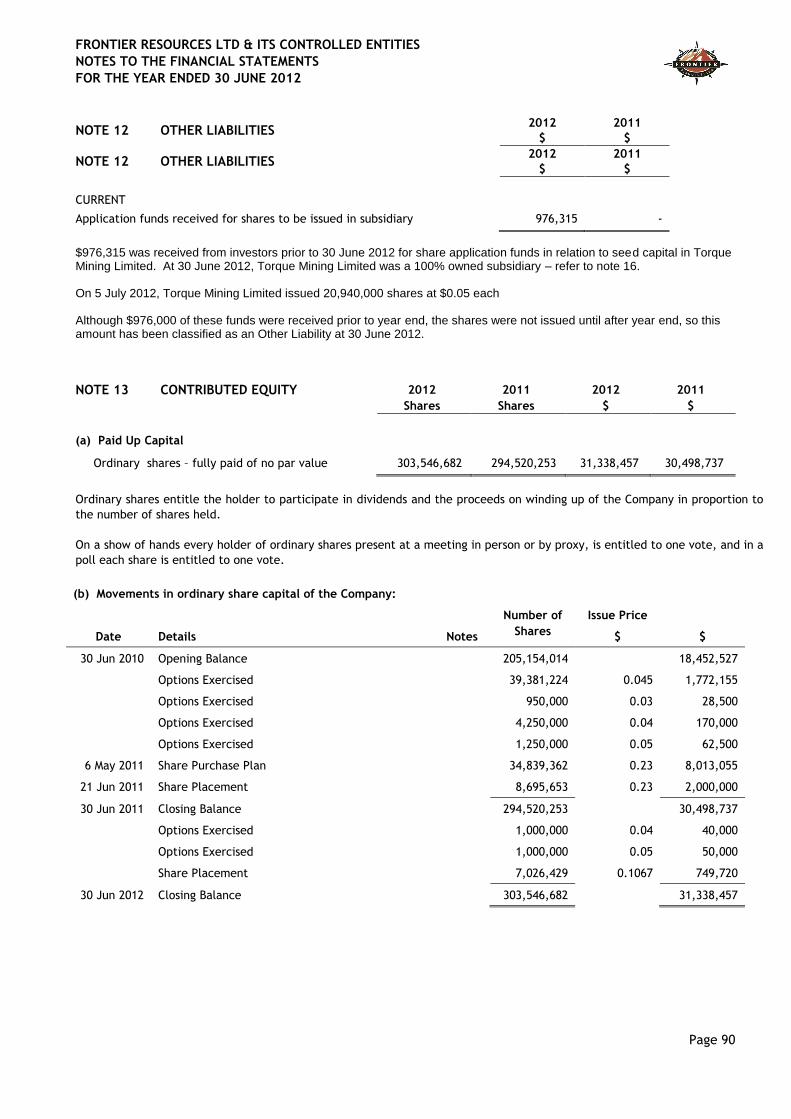
FRONTIER RESOURCES LTD & ITS CONTROLLED ENTITIES
NOTES TO THE FINANCIAL STATEMENTS
FOR THE YEAR ENDED 30 JUNE 2012
Page 90
NOTE 12 OTHER LIABILITIES 2012
$
2011
$
NOTE 12 OTHER LIABILITIES 2012
$
2011
$
CURRENT
Application funds received for shares to be issued in subsidiary 976,315 -
$976,315 was received from investors prior to 30 June 2012 for share application funds in relation to seed capital in Torque Mining Limited. At 30 June 2012, Torque Mining Limited was a 100% owned subsidiary – refer to note 16. On 5 July 2012, Torque Mining Limited issued 20,940,000 shares at $0.05 each Although $976,000 of these funds were received prior to year end, the shares were not issued until after year end, so this amount has been classified as an Other Liability at 30 June 2012.
NOTE 13 CONTRIBUTED EQUITY 2012 2011 2012 2011
Shares Shares $ $
(a) Paid Up Capital
Ordinary shares – fully paid of no par value 303,546,682 294,520,253 31,338,457 30,498,737
Ordinary shares entitle the holder to participate in dividends and the proceeds on winding up of the Company in proportion to
the number of shares held.
On a show of hands every holder of ordinary shares present at a meeting in person or by proxy, is entitled to one vote, and in a
poll each share is entitled to one vote.
(b) Movements in ordinary share capital of the Company:
Date
Details
Notes
Number of
Shares
Issue Price
$
$
30 Jun 2010 Opening Balance 205,154,014 18,452,527
Options Exercised 39,381,224 0.045 1,772,155
Options Exercised 950,000 0.03 28,500
Options Exercised 4,250,000 0.04 170,000
Options Exercised 1,250,000 0.05 62,500
6 May 2011 Share Purchase Plan 34,839,362 0.23 8,013,055
21 Jun 2011 Share Placement 8,695,653 0.23 2,000,000
30 Jun 2011 Closing Balance 294,520,253 30,498,737
Options Exercised 1,000,000 0.04 40,000
Options Exercised 1,000,000 0.05 50,000
Share Placement 7,026,429 0.1067 749,720
30 Jun 2012 Closing Balance 303,546,682 31,338,457

FRONTIER RESOURCES LTD & ITS CONTROLLED ENTITIES
NOTES TO THE FINANCIAL STATEMENTS
FOR THE YEAR ENDED 30 JUNE 2012
Page 91
NOTE 13 CONTRIBUTED EQUITY (continued)
(c) Options
No. of Options
2012 2011
The number of unissued ordinary shares relating to options not exercised at year end:
- Non-transferable options exercisable on or before 31 December 2012 at 4 cents 500,000 1,500,000
- Non-transferable options exercisable on or before 31 December 2012 at 5 cents 1,000,000 2,000,000
- Non-transferable options exercisable on or before 19 October 2013 at 4 cents 200,000 200,000
- Non-transferable options exercisable on or before 31 December 2012 at 9 cents 2,500,000 2,500,000
- Non-transferable options exercisable on or before 31 December 2012 at 10 cents 2,500,000 2,500,000
- Non-transferable options exercisable on or before 21 January 2014 at 3 cents 4,500,000 4,500,000
- Non-transferable options exercisable on or before 31 October 2014 at 19 cents 6,000,000 -
- Non-transferable options exercisable on or before 30 December 2014 at 11 cents 2,320,000 -
- Non-transferable options exercisable on or before 30 December 2014 at 16.5
cents 2,220,000 -
21,740,000 13,200,000
(d) Option Issues
During the financial year the Company made the following options issues:
Date
Details
Number of
Options
Exercise
Price Expiry Date
24 Nov 2011 Non-transferable Directors’ Options 6,000,000 $0.19 31 Oct 2012
5 July 2011 Non-transferable Employees’ Options 6,900,000 $0.22 30 Jun 2015
5 July 2011 Non-transferable Employees’ Options 3,300,000 $0.25 30 Jun 2015
7 Mar 2012 Non-transferable Employees’ Options 2,320,000 $0.11 30 Dec 2014
7 Mar 2012 Non-transferable Employees’ Options 2,220,000 $0.165 30 Dec 2014
(e) Option Exercise
During the financial year 2,000,000 options were exercised. Refer to Note 17.
(f) Option Expiry
During the financial year no options expired.
(g) Option Cancellation and Lapse
During the financial year the options issued on 5 July 2011 were cancelled and replaced with the options issued on 7
March 2012.
(h) Capital Management
The Group’s objectives when managing capital are to safeguard their ability to continue as a going concern, so that
they may continue to provide returns for shareholders and benefits for other stakeholders.
The capital structure of the Group consists of equity attributable to equity holders of the parent comprising issued
capital, reserves and accumulative losses.
Due to the nature of the Group’s activities, being mineral exploration, the Group does not have ready access to
credit facilities, with the primary source of funding being equity raisings. Therefore, the focus of the Group’s capital
risk management is the current working capital position against the requirements of the Group to meet exploration
programmes and corporate overheads. The Group’s strategy is to ensure appropriate liquidity is maintained to meet
anticipated operating requirements, with a view to initiating appropriate capital raisings as required.
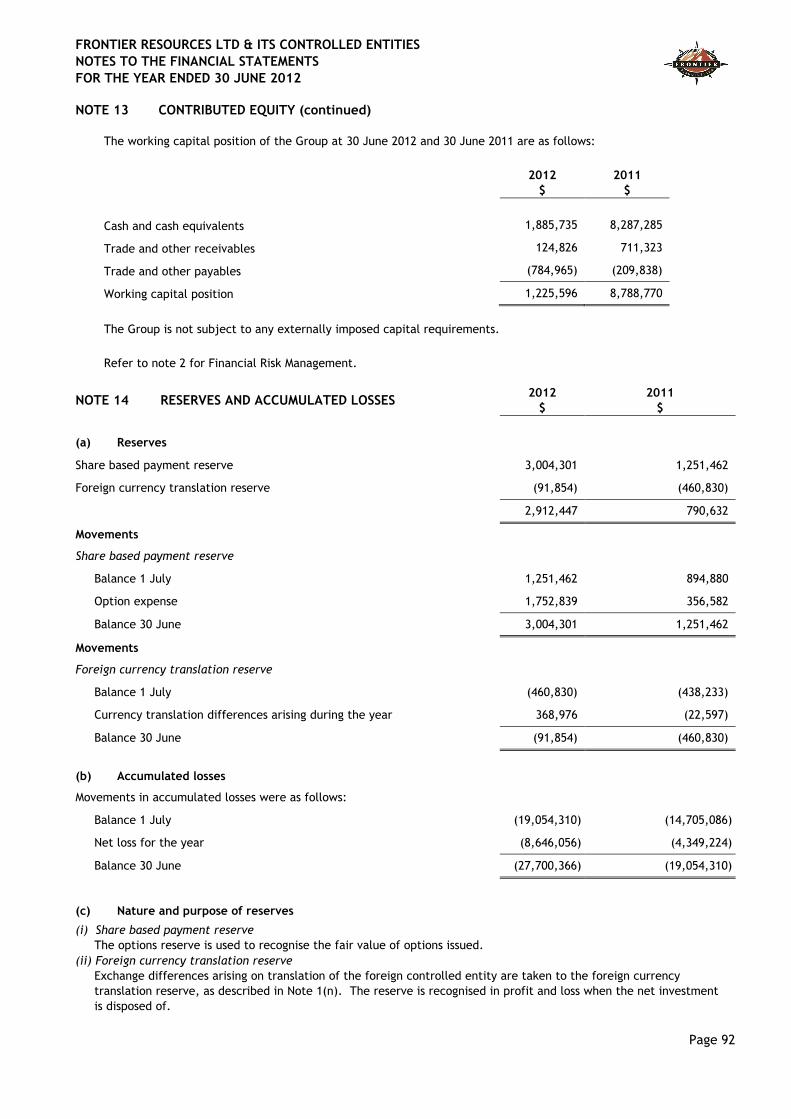
FRONTIER RESOURCES LTD & ITS CONTROLLED ENTITIES
NOTES TO THE FINANCIAL STATEMENTS
FOR THE YEAR ENDED 30 JUNE 2012
Page 92
NOTE 13 CONTRIBUTED EQUITY (continued)
The working capital position of the Group at 30 June 2012 and 30 June 2011 are as follows:
2012
$
2011
$
Cash and cash equivalents 1,885,735 8,287,285
Trade and other receivables 124,826 711,323
Trade and other payables (784,965) (209,838)
Working capital position 1,225,596 8,788,770
The Group is not subject to any externally imposed capital requirements.
Refer to note 2 for Financial Risk Management.
NOTE 14 RESERVES AND ACCUMULATED LOSSES 2012
$
2011
$
(a) Reserves
Share based payment reserve 3,004,301 1,251,462
Foreign currency translation reserve (91,854) (460,830)
2,912,447 790,632
Movements
Share based payment reserve
Balance 1 July 1,251,462 894,880
Option expense 1,752,839 356,582
Balance 30 June 3,004,301 1,251,462
Movements
Foreign currency translation reserve
Balance 1 July (460,830) (438,233)
Currency translation differences arising during the year 368,976 (22,597)
Balance 30 June (91,854) (460,830)
(b) Accumulated losses
Movements in accumulated losses were as follows:
Balance 1 July (19,054,310) (14,705,086)
Net loss for the year (8,646,056) (4,349,224)
Balance 30 June (27,700,366) (19,054,310)
(c) Nature and purpose of reserves
(i) Share based payment reserve
The options reserve is used to recognise the fair value of options issued.
(ii) Foreign currency translation reserve
Exchange differences arising on translation of the foreign controlled entity are taken to the foreign currency
translation reserve, as described in Note 1(n). The reserve is recognised in profit and loss when the net investment
is disposed of.
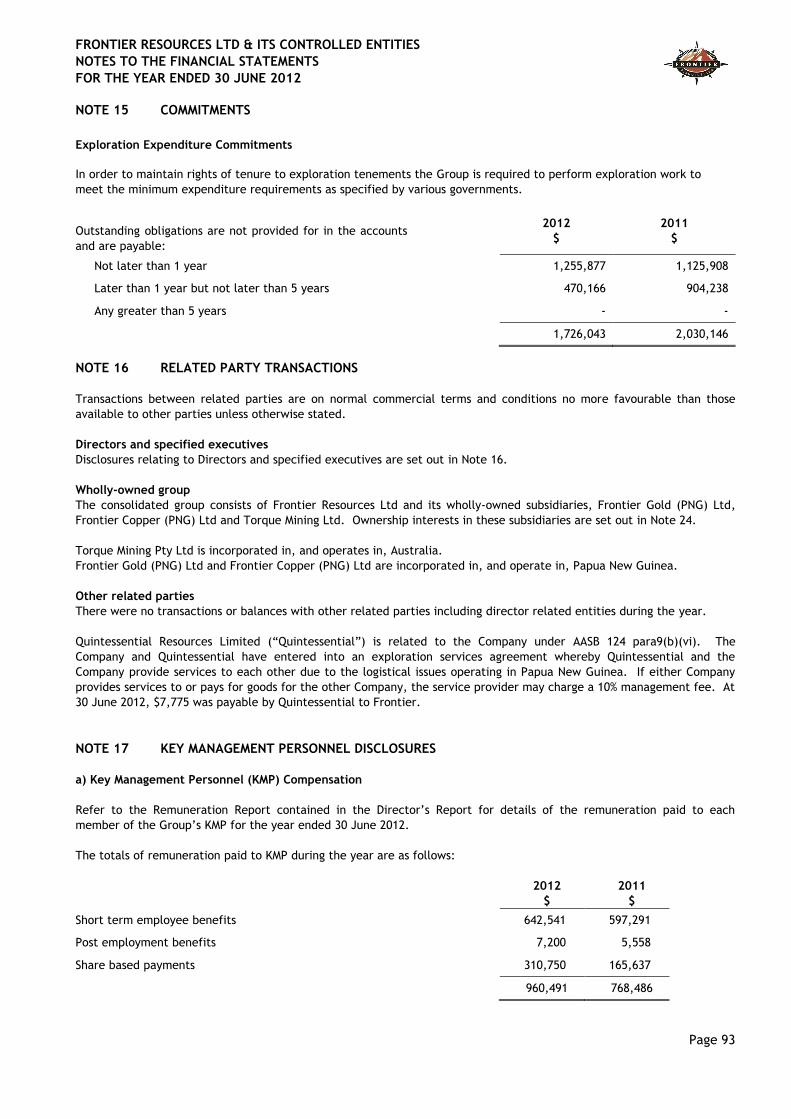
FRONTIER RESOURCES LTD & ITS CONTROLLED ENTITIES
NOTES TO THE FINANCIAL STATEMENTS
FOR THE YEAR ENDED 30 JUNE 2012
Page 93
NOTE 15 COMMITMENTS
Exploration Expenditure Commitments
In order to maintain rights of tenure to exploration tenements the Group is required to perform exploration work to
meet the minimum expenditure requirements as specified by various governments.
Outstanding obligations are not provided for in the accounts
and are payable:
2012
$
2011
$
Not later than 1 year 1,255,877 1,125,908
Later than 1 year but not later than 5 years 470,166 904,238
Any greater than 5 years - -
1,726,043 2,030,146
NOTE 16 RELATED PARTY TRANSACTIONS
Transactions between related parties are on normal commercial terms and conditions no more favourable than those
available to other parties unless otherwise stated.
Directors and specified executives
Disclosures relating to Directors and specified executives are set out in Note 16.
Wholly-owned group
The consolidated group consists of Frontier Resources Ltd and its wholly-owned subsidiaries, Frontier Gold (PNG) Ltd,
Frontier Copper (PNG) Ltd and Torque Mining Ltd. Ownership interests in these subsidiaries are set out in Note 24.
Torque Mining Pty Ltd is incorporated in, and operates in, Australia.
Frontier Gold (PNG) Ltd and Frontier Copper (PNG) Ltd are incorporated in, and operate in, Papua New Guinea.
Other related parties
There were no transactions or balances with other related parties including director related entities during the year.
Quintessential Resources Limited (“Quintessential”) is related to the Company under AASB 124 para9(b)(vi). The
Company and Quintessential have entered into an exploration services agreement whereby Quintessential and the
Company provide services to each other due to the logistical issues operating in Papua New Guinea. If either Company
provides services to or pays for goods for the other Company, the service provider may charge a 10% management fee. At
30 June 2012, $7,775 was payable by Quintessential to Frontier.
NOTE 17 KEY MANAGEMENT PERSONNEL DISCLOSURES
a) Key Management Personnel (KMP) Compensation
Refer to the Remuneration Report contained in the Director’s Report for details of the remuneration paid to each
member of the Group’s KMP for the year ended 30 June 2012.
The totals of remuneration paid to KMP during the year are as follows:
2012
$
2011
$
Short term employee benefits 642,541 597,291
Post employment benefits 7,200 5,558
Share based payments 310,750 165,637
960,491 768,486

FRONTIER RESOURCES LTD & ITS CONTROLLED ENTITIES
NOTES TO THE FINANCIAL STATEMENTS
FOR THE YEAR ENDED 30 JUNE 2012
Page 94
NOTE 17 KEY MANAGEMENT PERSONNEL DISCLOSURES (continued)
(b) Equity Instrument disclosures relating to KMP
(i) Options provided as remuneration and shares issued on exercise of such options
Details of options over ordinary shares in the Company provided as remuneration and shares issued on the exercise of
such options, together with terms and conditions of the options, can be found in the Remuneration Report.
(ii) Option holdings
The number of options over ordinary shares held by each KMP of the Group during the financial year is as follows:
2012
Name
Balance at
the start of
the year
Granted
during the
year as
remuneration
Exercised
during the
year
Other
changes
during the
year
Balance at
the end of
the year
Vested and
exercisable at
the end of
the year
Directors -
Peter McNeil 4,000,000 3,000,000 (2,000,000) - 5,000,000 2,000,000
Graham Fish 1,500,000 1,000,000 - - 2,500,000 1,500,000
Warren Staude 2,000,000 1,000,000 - - 3,000,000 2,000,000
David Swain 1,000,000 1,000,000 - - 2,000,000 1,000,000
Other key management personnel -
Julia Becket - 60,000 - - 60,000 -
Jay Stephenson 100,000 60,000 - - 160,000 100,000
Total 8,600,000 6,120,000 (2,000,000) - 12,720,000 6,600,000
2011
Name
Balance at
the start of
the year
Granted
during the
year as
remuneration
Exercised
during the
year
Other
changes
during the
year
Balance at
the end of
the year
Vested and
exercisable at
the end of
the year
Directors -
Peter McNeil 3,404,764 2,000,000 (1,404,764) - 4,000,000 -
Graham Fish 2,142,856 1,000,000 (1,642,856) - 1,500,000 500,000
Warren Staude 1,811,112 1,000,000 (811,112) - 2,000,000 1,000,000
David Swain 1,000,000 1,000,000 (1,000,000) - 1,000,000 -
Other key management personnel -
Julia Becket - - - - - -
Paige McNeil 981,112 400,000 (981,112) - 400,000 400,000
Jay Stephenson - 100,000 - - 100,000 100,000
Total 9,339,844 5,500,000 (5,839,844) - 9,000,000 2,000,000
** Other changes during the year include other acquisitions and disposals by directors and their related parties.
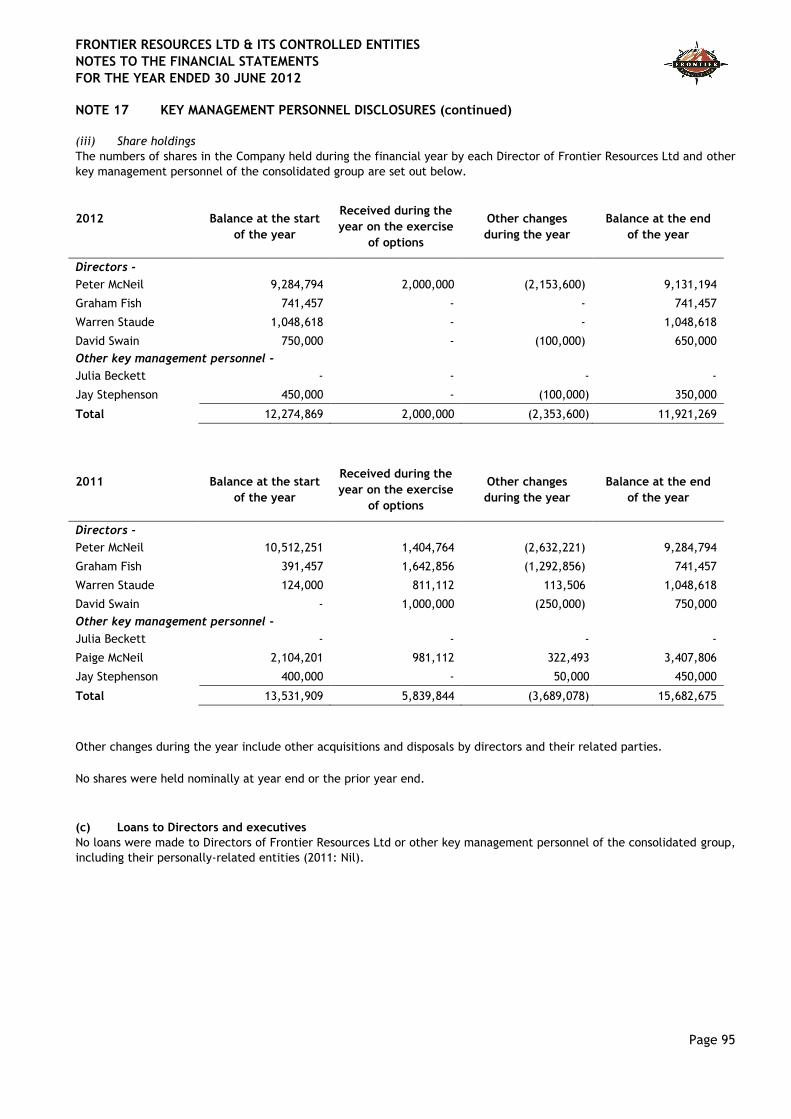
FRONTIER RESOURCES LTD & ITS CONTROLLED ENTITIES
NOTES TO THE FINANCIAL STATEMENTS
FOR THE YEAR ENDED 30 JUNE 2012
Page 95
NOTE 17 KEY MANAGEMENT PERSONNEL DISCLOSURES (continued)
(iii) Share holdings
The numbers of shares in the Company held during the financial year by each Director of Frontier Resources Ltd and other
key management personnel of the consolidated group are set out below.
2012
Balance at the start
of the year
Received during the
year on the exercise
of options
Other changes
during the year
Balance at the end
of the year
Directors -
Peter McNeil 9,284,794 2,000,000 (2,153,600) 9,131,194
Graham Fish 741,457 - - 741,457
Warren Staude 1,048,618 - - 1,048,618
David Swain 750,000 - (100,000) 650,000
Other key management personnel -
Julia Beckett - - - -
Jay Stephenson 450,000 - (100,000) 350,000
Total 12,274,869 2,000,000 (2,353,600) 11,921,269
2011
Balance at the start
of the year
Received during the
year on the exercise
of options
Other changes
during the year
Balance at the end
of the year
Directors -
Peter McNeil 10,512,251 1,404,764 (2,632,221) 9,284,794
Graham Fish 391,457 1,642,856 (1,292,856) 741,457
Warren Staude 124,000 811,112 113,506 1,048,618
David Swain - 1,000,000 (250,000) 750,000
Other key management personnel -
Julia Beckett - - - -
Paige McNeil 2,104,201 981,112 322,493 3,407,806
Jay Stephenson 400,000 - 50,000 450,000
Total 13,531,909 5,839,844 (3,689,078) 15,682,675
Other changes during the year include other acquisitions and disposals by directors and their related parties.
No shares were held nominally at year end or the prior year end.
(c) Loans to Directors and executives
No loans were made to Directors of Frontier Resources Ltd or other key management personnel of the consolidated group,
including their personally-related entities (2011: Nil).
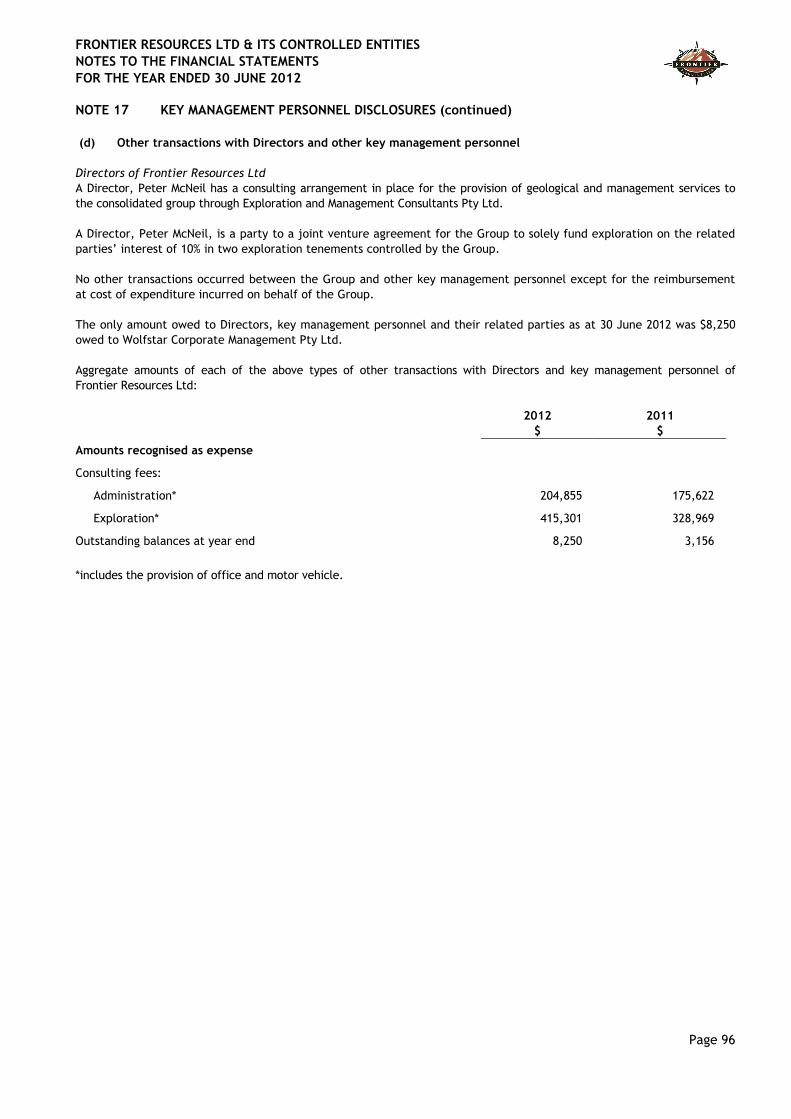
FRONTIER RESOURCES LTD & ITS CONTROLLED ENTITIES
NOTES TO THE FINANCIAL STATEMENTS
FOR THE YEAR ENDED 30 JUNE 2012
Page 96
NOTE 17 KEY MANAGEMENT PERSONNEL DISCLOSURES (continued)
(d) Other transactions with Directors and other key management personnel
Directors of Frontier Resources Ltd
A Director, Peter McNeil has a consulting arrangement in place for the provision of geological and management services to
the consolidated group through Exploration and Management Consultants Pty Ltd.
A Director, Peter McNeil, is a party to a joint venture agreement for the Group to solely fund exploration on the related
parties’ interest of 10% in two exploration tenements controlled by the Group.
No other transactions occurred between the Group and other key management personnel except for the reimbursement
at cost of expenditure incurred on behalf of the Group.
The only amount owed to Directors, key management personnel and their related parties as at 30 June 2012 was $8,250
owed to Wolfstar Corporate Management Pty Ltd.
Aggregate amounts of each of the above types of other transactions with Directors and key management personnel of
Frontier Resources Ltd:
2012
$
2011
$
Amounts recognised as expense
Consulting fees:
Administration* 204,855 175,622
Exploration* 415,301 328,969
Outstanding balances at year end 8,250 3,156
*includes the provision of office and motor vehicle.
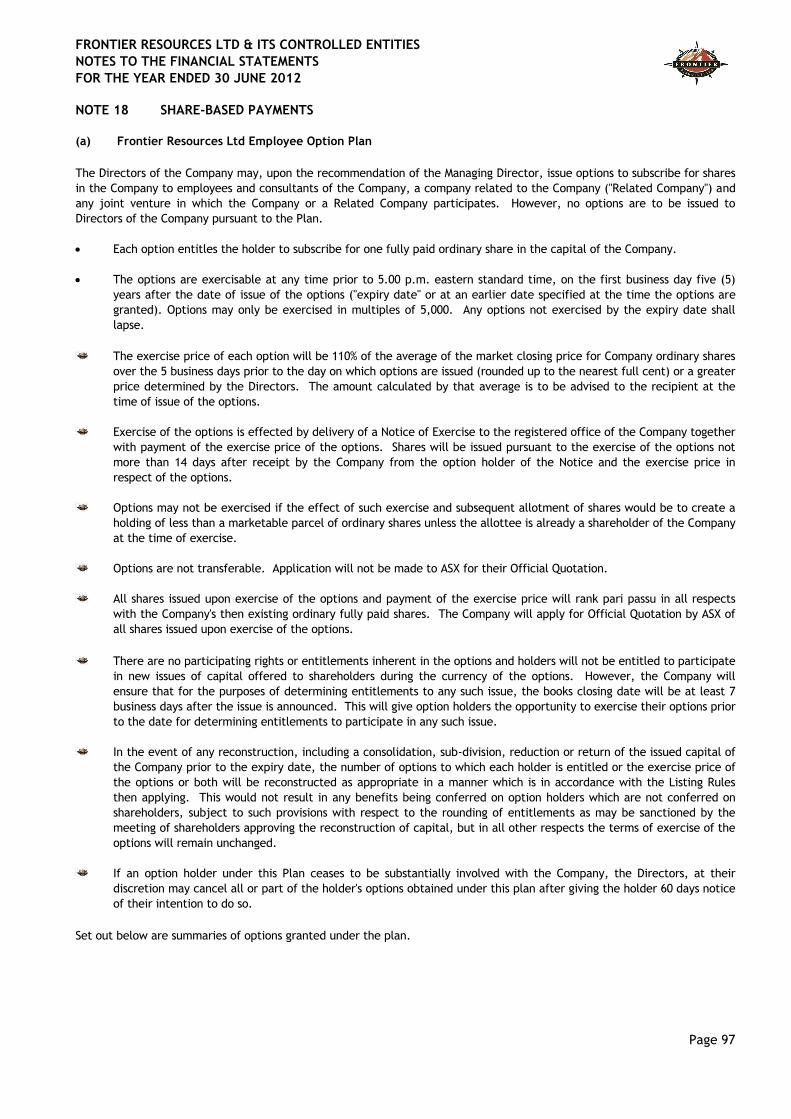
FRONTIER RESOURCES LTD & ITS CONTROLLED ENTITIES
NOTES TO THE FINANCIAL STATEMENTS
FOR THE YEAR ENDED 30 JUNE 2012
Page 97
NOTE 18 SHARE-BASED PAYMENTS
(a) Frontier Resources Ltd Employee Option Plan
The Directors of the Company may, upon the recommendation of the Managing Director, issue options to subscribe for shares
in the Company to employees and consultants of the Company, a company related to the Company ("Related Company") and
any joint venture in which the Company or a Related Company participates. However, no options are to be issued to
Directors of the Company pursuant to the Plan.
Each option entitles the holder to subscribe for one fully paid ordinary share in the capital of the Company.
The options are exercisable at any time prior to 5.00 p.m. eastern standard time, on the first business day five (5)
years after the date of issue of the options ("expiry date" or at an earlier date specified at the time the options are
granted). Options may only be exercised in multiples of 5,000. Any options not exercised by the expiry date shall
lapse.
The exercise price of each option will be 110% of the average of the market closing price for Company ordinary shares
over the 5 business days prior to the day on which options are issued (rounded up to the nearest full cent) or a greater
price determined by the Directors. The amount calculated by that average is to be advised to the recipient at the
time of issue of the options.
Exercise of the options is effected by delivery of a Notice of Exercise to the registered office of the Company together
with payment of the exercise price of the options. Shares will be issued pursuant to the exercise of the options not
more than 14 days after receipt by the Company from the option holder of the Notice and the exercise price in
respect of the options.
Options may not be exercised if the effect of such exercise and subsequent allotment of shares would be to create a
holding of less than a marketable parcel of ordinary shares unless the allottee is already a shareholder of the Company
at the time of exercise.
Options are not transferable. Application will not be made to ASX for their Official Quotation.
All shares issued upon exercise of the options and payment of the exercise price will rank pari passu in all respects
with the Company's then existing ordinary fully paid shares. The Company will apply for Official Quotation by ASX of
all shares issued upon exercise of the options.
There are no participating rights or entitlements inherent in the options and holders will not be entitled to participate
in new issues of capital offered to shareholders during the currency of the options. However, the Company will
ensure that for the purposes of determining entitlements to any such issue, the books closing date will be at least 7
business days after the issue is announced. This will give option holders the opportunity to exercise their options prior
to the date for determining entitlements to participate in any such issue.
In the event of any reconstruction, including a consolidation, sub-division, reduction or return of the issued capital of
the Company prior to the expiry date, the number of options to which each holder is entitled or the exercise price of
the options or both will be reconstructed as appropriate in a manner which is in accordance with the Listing Rules
then applying. This would not result in any benefits being conferred on option holders which are not conferred on
shareholders, subject to such provisions with respect to the rounding of entitlements as may be sanctioned by the
meeting of shareholders approving the reconstruction of capital, but in all other respects the terms of exercise of the
options will remain unchanged.
If an option holder under this Plan ceases to be substantially involved with the Company, the Directors, at their
discretion may cancel all or part of the holder's options obtained under this plan after giving the holder 60 days notice
of their intention to do so.
Set out below are summaries of options granted under the plan.

FRONTIER RESOURCES LTD & ITS CONTROLLED ENTITIES
NOTES TO THE FINANCIAL STATEMENTS
FOR THE YEAR ENDED 30 JUNE 2012
Page 98
NOTE 18 SHARE-BASED PAYMENTS (continued)
Grant Date Expiry Date Exercise
Price
Balance at
start of
the year
Issued
during the
year
Exercised
during the
year
Cancelled
during the
year
Balance at
end of the
year
Number Number Number Number Number
2012
19 Oct 2009 19 Oct 2013 $0.04 200,000 - - - 200,000
25 Nov 2009 31 Dec 2012 $0.04 1,500,000 - (1,000,000) - 500,000
25 Nov 2009 31 Dec 2012 $0.05 2,000,000 - (1,000,000) - 1,000,000
24 Nov 2010 31 Dec 2012 $0.09 2,500,000 - - - 2,500,000
24 Nov 2010 31 Dec 2012 $0.10 2,500,000 - - - 2,500,000
30 Dec 2010 30 Dec 2014 $0.11 4,500,000 - - - 4,500,000
5 Jul 2011 30 Jun 2015 $0.22 - 6,900,000 - (6,900,000) -
5 Jul 2011 30 Jun 2015 $0.25 - 3,300,000 - (3,300,000) -
21 Nov 2011 31 Oct 2014 $0.19 - 6,000,000 - - 6,000,000
7 Mar 2012 30 Dec 2014 $0.11 - 2,320,000 - - 2,320,000
7 Mar 2012 30 Dec 2014 $0.165 - 2,220,000 - - 2,220,000
13,200,000 20,740,000 (2,000,000) (10,200,000) 21,740,000
Weighted average remaining contracted life of options (Years) 1.85 Years
Weighted average exercise price $0.129
2011
20 Oct 2006 20 Oct 2011 $0.14 180,000 - - (180,000) -
19 Oct 2007 19 Oct 2010 $0.16 270,000 - - (270,000) -
23 Nov 2007 30 Nov 2010 $0.20 3,200,000 - - (3,200,000) -
11 Dec 2007 11 Dec 2010 $0.15 100,000 - - (100,000) -
19 Oct 2009 19 Oct 2013 $0.04 1,825,000 - (1,625,000) - 200,000
25 Nov 2009 31 Dec 2012 $0.04 3,250,000 - (2,500,000) - 750,000
25 Nov 2009 31 Dec 2012 $0.05 3,250,000 - (500,000) - 2,750,000
19 Jan 2010 21 Jan 2014 $0.03 950,000 - (950,000) - -
24 Nov 2010 31 Dec 2012 $0.09 - 2,500,000 - - 2,500,000
24 Nov 2010 31 Dec 2012 $0.10 - 2,500,000 - - 2,500,000
30 Dec 2010 30 Dec 2014 $0.11 - 4,500,000 - - 4,500,000
13,025,000 9,500,000 (5,575,000) (3,750,000) 13,200,000
Weighted average remaining contracted life of options 0.87 Years
Weighted average exercise price $0.050
All options at the end of the year were vested and exercisable.
Fair values at grant date are determined using a Black-Scholes option pricing model that takes into account the
exercise price, the term of the option, the impact of dilution, the share price at grant date and expected price
volatility of the underlying share, the expected dividend yield and the risk-free interest rate for the term of the
option.
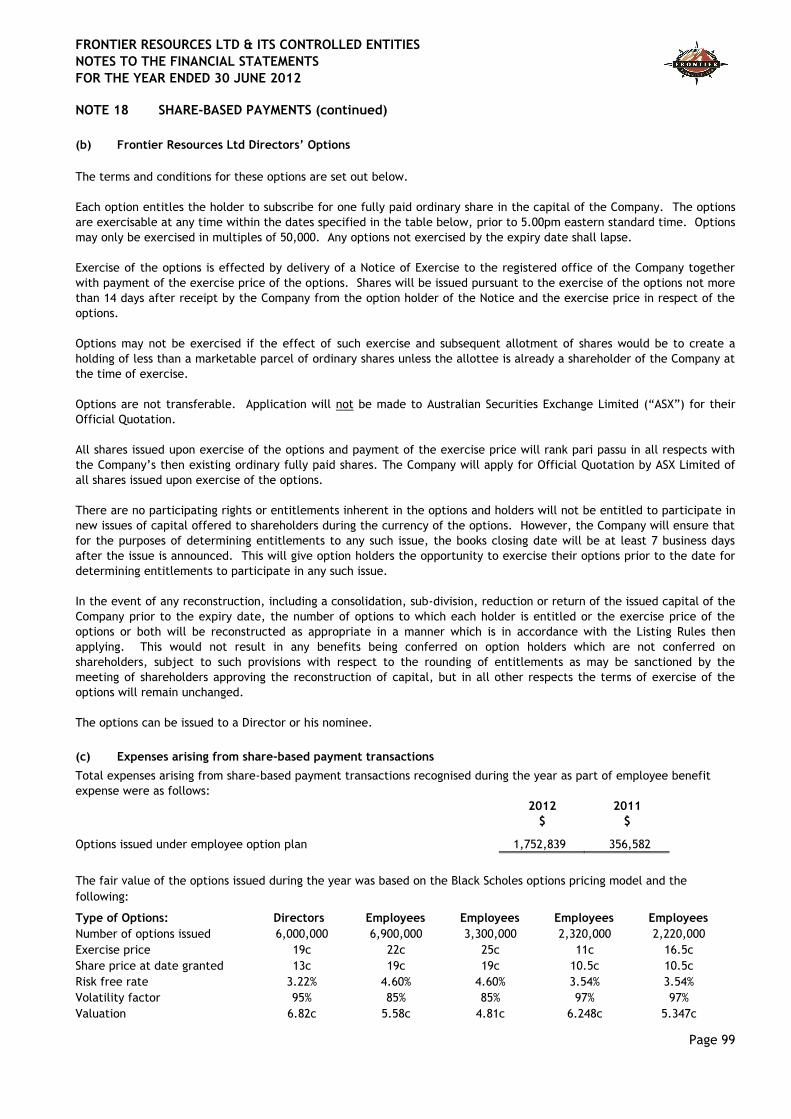
FRONTIER RESOURCES LTD & ITS CONTROLLED ENTITIES
NOTES TO THE FINANCIAL STATEMENTS
FOR THE YEAR ENDED 30 JUNE 2012
Page 99
NOTE 18 SHARE-BASED PAYMENTS (continued)
(b) Frontier Resources Ltd Directors’ Options
The terms and conditions for these options are set out below.
Each option entitles the holder to subscribe for one fully paid ordinary share in the capital of the Company. The options
are exercisable at any time within the dates specified in the table below, prior to 5.00pm eastern standard time. Options
may only be exercised in multiples of 50,000. Any options not exercised by the expiry date shall lapse.
Exercise of the options is effected by delivery of a Notice of Exercise to the registered office of the Company together
with payment of the exercise price of the options. Shares will be issued pursuant to the exercise of the options not more
than 14 days after receipt by the Company from the option holder of the Notice and the exercise price in respect of the
options.
Options may not be exercised if the effect of such exercise and subsequent allotment of shares would be to create a
holding of less than a marketable parcel of ordinary shares unless the allottee is already a shareholder of the Company at
the time of exercise.
Options are not transferable. Application will not be made to Australian Securities Exchange Limited (“ASX”) for their
Official Quotation.
All shares issued upon exercise of the options and payment of the exercise price will rank pari passu in all respects with
the Company’s then existing ordinary fully paid shares. The Company will apply for Official Quotation by ASX Limited of
all shares issued upon exercise of the options.
There are no participating rights or entitlements inherent in the options and holders will not be entitled to participate in
new issues of capital offered to shareholders during the currency of the options. However, the Company will ensure that
for the purposes of determining entitlements to any such issue, the books closing date will be at least 7 business days
after the issue is announced. This will give option holders the opportunity to exercise their options prior to the date for
determining entitlements to participate in any such issue.
In the event of any reconstruction, including a consolidation, sub-division, reduction or return of the issued capital of the
Company prior to the expiry date, the number of options to which each holder is entitled or the exercise price of the
options or both will be reconstructed as appropriate in a manner which is in accordance with the Listing Rules then
applying. This would not result in any benefits being conferred on option holders which are not conferred on
shareholders, subject to such provisions with respect to the rounding of entitlements as may be sanctioned by the
meeting of shareholders approving the reconstruction of capital, but in all other respects the terms of exercise of the
options will remain unchanged.
The options can be issued to a Director or his nominee.
(c) Expenses arising from share-based payment transactions
Total expenses arising from share-based payment transactions recognised during the year as part of employee benefit
expense were as follows:
2012
$
2011
$
Options issued under employee option plan 1,752,839 356,582
The fair value of the options issued during the year was based on the Black Scholes options pricing model and the
following:
Type of Options: Directors Employees Employees Employees Employees
Number of options issued 6,000,000 6,900,000 3,300,000 2,320,000 2,220,000
Exercise price 19c 22c 25c 11c 16.5c
Share price at date granted 13c 19c 19c 10.5c 10.5c
Risk free rate 3.22% 4.60% 4.60% 3.54% 3.54%
Volatility factor 95% 85% 85% 97% 97%
Valuation 6.82c 5.58c 4.81c 6.248c 5.347c
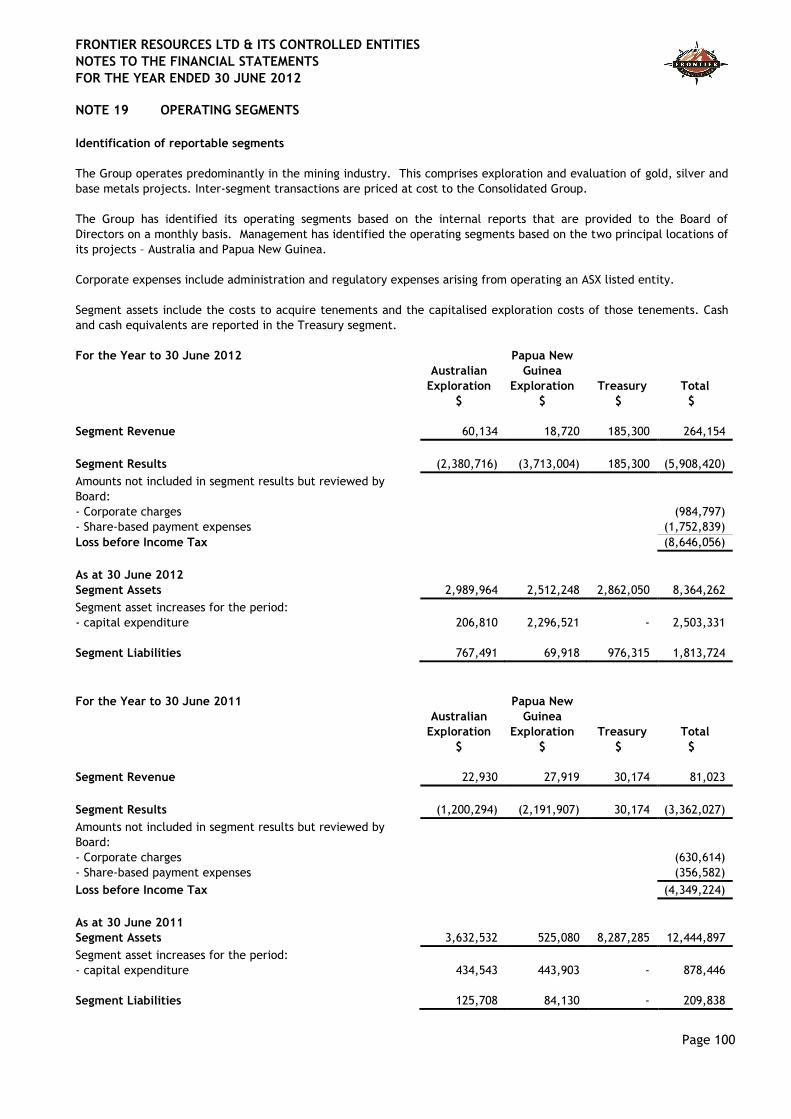
FRONTIER RESOURCES LTD & ITS CONTROLLED ENTITIES
NOTES TO THE FINANCIAL STATEMENTS
FOR THE YEAR ENDED 30 JUNE 2012
Page 100
NOTE 19 OPERATING SEGMENTS
Identification of reportable segments
The Group operates predominantly in the mining industry. This comprises exploration and evaluation of gold, silver and
base metals projects. Inter-segment transactions are priced at cost to the Consolidated Group.
The Group has identified its operating segments based on the internal reports that are provided to the Board of
Directors on a monthly basis. Management has identified the operating segments based on the two principal locations of
its projects – Australia and Papua New Guinea.
Corporate expenses include administration and regulatory expenses arising from operating an ASX listed entity.
Segment assets include the costs to acquire tenements and the capitalised exploration costs of those tenements. Cash
and cash equivalents are reported in the Treasury segment.
For the Year to 30 June 2012
Australian
Exploration
Papua New
Guinea
Exploration
Treasury
Total
$
$ $
$
Segment Revenue 60,134 18,720 185,300 264,154
Segment Results (2,380,716) (3,713,004) 185,300 (5,908,420)
Amounts not included in segment results but reviewed by
Board:
- Corporate charges (984,797)
- Share-based payment expenses (1,752,839)
Loss before Income Tax (8,646,056)
As at 30 June 2012
Segment Assets 2,989,964 2,512,248 2,862,050 8,364,262
Segment asset increases for the period:
- capital expenditure 206,810 2,296,521 - 2,503,331
Segment Liabilities 767,491 69,918 976,315 1,813,724
For the Year to 30 June 2011
Australian
Exploration
Papua New
Guinea
Exploration
Treasury
Total
$ $ $
$
Segment Revenue 22,930 27,919 30,174 81,023
Segment Results (1,200,294) (2,191,907) 30,174 (3,362,027)
Amounts not included in segment results but reviewed by
Board:
- Corporate charges (630,614)
- Share-based payment expenses (356,582)
Loss before Income Tax (4,349,224)
As at 30 June 2011
Segment Assets 3,632,532 525,080 8,287,285 12,444,897
Segment asset increases for the period:
- capital expenditure 434,543 443,903 - 878,446
Segment Liabilities 125,708 84,130 - 209,838
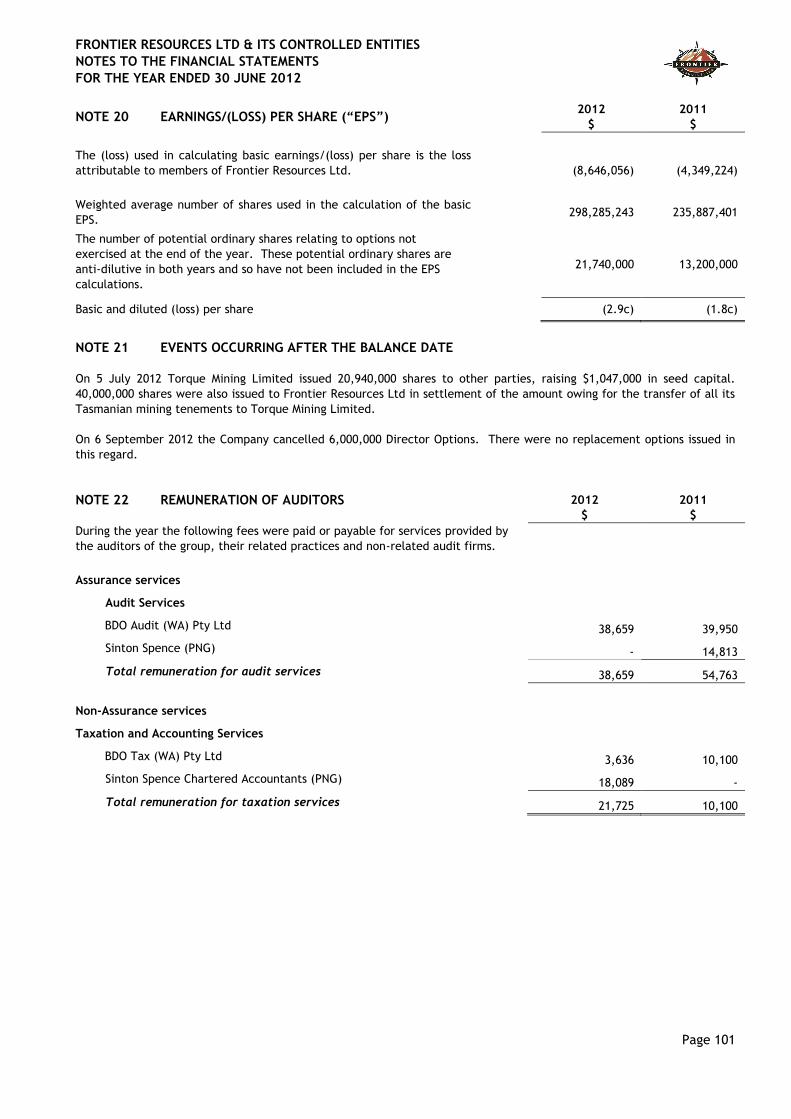
FRONTIER RESOURCES LTD & ITS CONTROLLED ENTITIES
NOTES TO THE FINANCIAL STATEMENTS
FOR THE YEAR ENDED 30 JUNE 2012
Page 101
NOTE 20 EARNINGS/(LOSS) PER SHARE (“EPS”) 2012
$
2011
$
The (loss) used in calculating basic earnings/(loss) per share is the loss
attributable to members of Frontier Resources Ltd.
(8,646,056) (4,349,224)
Weighted average number of shares used in the calculation of the basic
EPS. 298,285,243 235,887,401
The number of potential ordinary shares relating to options not
exercised at the end of the year. These potential ordinary shares are
anti-dilutive in both years and so have not been included in the EPS
calculations.
21,740,000 13,200,000
Basic and diluted (loss) per share (2.9c) (1.8c)
NOTE 21 EVENTS OCCURRING AFTER THE BALANCE DATE
On 5 July 2012 Torque Mining Limited issued 20,940,000 shares to other parties, raising $1,047,000 in seed capital.
40,000,000 shares were also issued to Frontier Resources Ltd in settlement of the amount owing for the transfer of all its
Tasmanian mining tenements to Torque Mining Limited.
On 6 September 2012 the Company cancelled 6,000,000 Director Options. There were no replacement options issued in
this regard.
NOTE 22 REMUNERATION OF AUDITORS
2012
$
2011
$
During the year the following fees were paid or payable for services provided by
the auditors of the group, their related practices and non-related audit firms.
Assurance services
Audit Services
BDO Audit (WA) Pty Ltd 38,659 39,950
Sinton Spence (PNG) - 14,813
Total remuneration for audit services 38,659 54,763
Non-Assurance services
Taxation and Accounting Services
BDO Tax (WA) Pty Ltd 3,636 10,100
Sinton Spence Chartered Accountants (PNG) 18,089 -
Total remuneration for taxation services 21,725 10,100

FRONTIER RESOURCES LTD & ITS CONTROLLED ENTITIES
NOTES TO THE FINANCIAL STATEMENTS
FOR THE YEAR ENDED 30 JUNE 2012
Page 102
NOTE 23 RECONCILIATION OF LOSS AFTER
INCOME TAX TO NET CASH INFLOW
FROM OPERATING ACTIVITIES
2012
$
2011
$
(a) Reconciliation of operating loss after income tax to the
net cash flow from operations:
Operating loss after income tax (8,646,056) (4,349,224)
Adjustment for non cash items:
- (Gain)/Loss on disposal of fixed assets (36,825) 61,750
- Depreciation expense 860,466 165,249
- Non-cash employee benefits expense – share-based
payments 1,752,839 356,582
- Net exchange differences - (30,113)
Change in operating assets and liabilities:
- Trade and other payables and provisions 627,571 168,013
- Trade and other receivables 6,166 143,020
Net cash outflow from operating activities (5,435,839) (3,484,723)
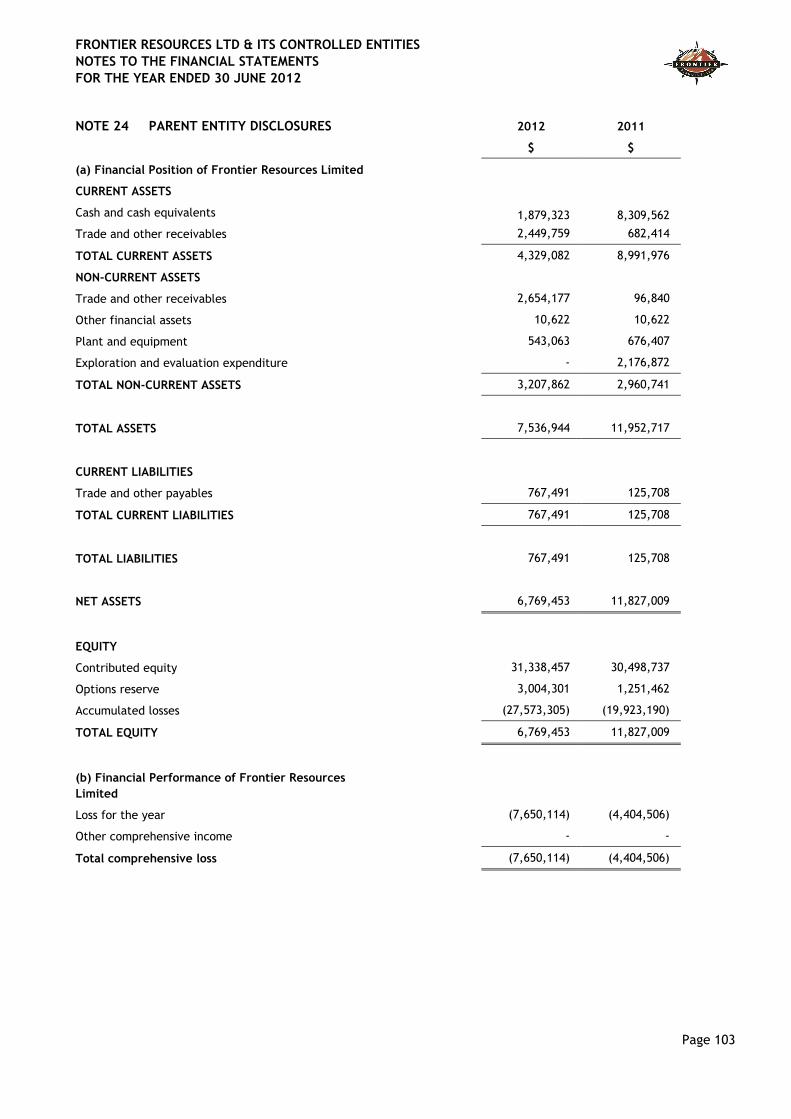
FRONTIER RESOURCES LTD & ITS CONTROLLED ENTITIES
NOTES TO THE FINANCIAL STATEMENTS
FOR THE YEAR ENDED 30 JUNE 2012
Page 103
NOTE 24 PARENT ENTITY DISCLOSURES 2012
$
2011
$
(a) Financial Position of Frontier Resources Limited
CURRENT ASSETS
Cash and cash equivalents 1,879,323 8,309,562
Trade and other receivables 2,449,759 682,414
TOTAL CURRENT ASSETS 4,329,082 8,991,976
NON-CURRENT ASSETS
Trade and other receivables 2,654,177 96,840
Other financial assets 10,622 10,622
Plant and equipment 543,063 676,407
Exploration and evaluation expenditure - 2,176,872
TOTAL NON-CURRENT ASSETS 3,207,862 2,960,741
TOTAL ASSETS 7,536,944 11,952,717
CURRENT LIABILITIES
Trade and other payables 767,491 125,708
TOTAL CURRENT LIABILITIES 767,491 125,708
TOTAL LIABILITIES 767,491 125,708
NET ASSETS 6,769,453 11,827,009
EQUITY
Contributed equity 31,338,457 30,498,737
Options reserve 3,004,301 1,251,462
Accumulated losses (27,573,305) (19,923,190)
TOTAL EQUITY 6,769,453 11,827,009
(b) Financial Performance of Frontier Resources
Limited
Loss for the year (7,650,114) (4,404,506)
Other comprehensive income - -
Total comprehensive loss (7,650,114) (4,404,506)

FRONTIER RESOURCES LTD & ITS CONTROLLED ENTITIES
NOTES TO THE FINANCIAL STATEMENTS
FOR THE YEAR ENDED 30 JUNE 2012
Page 104
NOTE 24 PARENT ENTITY DISCLOSURES (continued)
(c) Guarantees entered into by Frontier Resources Limited to the debts of its subsidiaries
There are no guarantees entered into by Frontier Resources Limited for the debts of its subsidiaries as at 30 June
2012 (2011: none).
(d) Contingent liabilities of Frontier Resources Limited
There are no contingent liabilities as at 30 June 2012 (2011: none).
(e) Commitments Frontier Resources Limited
Exploration Expenditure Commitments
2012
$
2011
$
In order to maintain rights of tenure to exploration tenements
the group is required to perform exploration work to meet the
minimum expenditure requirements as specified by various
governments.
Outstanding obligations are not provided for in the accounts and
are payable:
Not longer than 1 year - 776,667
Longer than 1 year and not longer than 5 years - 690,417
Longer than 5 years - -
Total - 1,467,084
NOTE 25 SUBSIDIARIES
Name of Entity Country of
Incorporation Class of Shares
Equity Holding
2012 2011
% %
Frontier Gold (PNG) Ltd Papua New Guinea Ordinary 100 100
Frontier Copper (PNG) Ltd Papua New Guinea Ordinary 100 100
Frontrunner Exploration PNG Ltd Papua New Guinea Ordinary 100 -
Torque Mining Ltd Australia Ordinary 100 -
NOTE 26 NON-CASH FINANCING AND INVESTING ACTIVITIES
There were no such activities during the year (2011: nil).
NOTE 27 CONTINGENT LIABILITIES
The Group had no contingent liabilities at 30 June 2012.
NOTE 28 DIVIDENDS
There were no dividends paid or recommended during the financial year ended 30 June 2012.

DIRECTORS’ DECLARATION
Page 105
The directors of the company declare that:
1. The financial statements, comprising the statement of comprehensive income, statement of financial
position, statement of cash flows, statement of changes in equity and accompanying notes, are in
accordance with the Corporations Act 2001 and:
a. comply with Accounting Standards and the Corporations Regulations 2001, and other mandatory
professional reporting requirements; and
b. give a true and fair view of the financial position as at 30 June 2012 and of the performance of
the year ended on that date of the consolidated group.
2. In the directors’ opinion, there are reasonable grounds to believe that the company will be able to pay
its debts as and when they become due and payable.
3. In the directors’ opinion, the financial statements and notes are prepared in compliance with
International Financial Reporting Standards and interpretations adopted by the International Accounting
Standards Board.
4. The remuneration disclosures included in pages 6 to 12 within the directors’ report (as part of the
audited Remuneration Report), for the year ended 30 June 2012, comply with section 300A of the
Corporations Act 2001.
5. The directors have been given the declarations by the chief executive officer and chief financial officer
required by section 295A.
This declaration is made in accordance with a resolution of the Board of Directors and is signed for and on behalf
of the directors by:
P.A. McNeil
Managing Director
28 September 2012
Tel: +8 6382 4600 Fax: +8 6382 4601 www.bdo.com.au
38 Station Street Subiaco, WA 6008 PO Box 700 West Perth WA 6872 Australia
BDO Audit (WA) Pty Ltd ABN 79 112 284 787 is a member of a national association of independent entities which are all members of BDO (Australia) Ltd ABN 77 050 110 275, an Australian company limited by guarantee. BDO Audit (WA) Pty Ltd and BDO (Australia) Ltd are members of BDO International Ltd, a UK company limited by guarantee, and form part of the international BDO network of independent member firms. Liability limited by a scheme approved under Professional Standards
Legislation (other than for the acts or omissions of financial services licensees) in each State or Territory other than Tasmania. Page 106
INDEPENDENT AUDITOR’S REPORT TO THE MEMBERS OF FRONTIER RESOURCES LIMITED
Report on the Financial Report We have audited the accompanying financial report of Frontier Resources Limited, which comprises the consolidated statement of financial position as at 30 June 2012, the consolidated statement of comprehensive income, the consolidated statement of changes in equity and the consolidated statement of cash flows for the year then ended, notes comprising a summary of significant accounting policies and other explanatory information, and the directors’ declaration of the consolidated entity comprising the company and the entities it controlled at the year’s end or from time to time during the financial year. Directors’ Responsibility for the Financial Report The directors of the Company are responsible for the preparation of the financial report that gives a true and fair view in accordance with Australian Accounting Standards and the Corporations Act 2001 and for such internal control as the directors determine is necessary to enable the preparation of the financial report that gives a true and fair view and is free from material misstatement, whether due to fraud or error. In Note 1, the directors also state, in accordance with Accounting Standard AASB 101 Presentation of Financial Statements, that the financial statements comply with International Financial Reporting Standards. Auditor’s Responsibility Our responsibility is to express an opinion on the financial report based on our audit. We conducted our audit in accordance with Australian Auditing Standards. Those standards require that we comply with relevant ethical requirements relating to audit engagements and plan and perform the audit to obtain reasonable assurance about whether the financial report is free from material misstatement. An audit involves performing procedures to obtain audit evidence about the amounts and disclosures in the financial report. The procedures selected depend on the auditor’s judgement, including the assessment of the risks of material misstatement of the financial report, whether due to fraud or error. In making those risk assessments, the auditor considers internal control relevant to the Company’s preparation of the financial report that gives a true and fair view in order to design audit procedures that are appropriate in the circumstances, but not for the purpose of expressing an opinion on the effectiveness of the Company’s internal control. An audit also includes evaluating the appropriateness of accounting policies used and the reasonableness of accounting estimates made by the directors, as well as evaluating the overall presentation of the financial report. We believe that the audit evidence we have obtained is sufficient and appropriate to provide a basis for our audit opinion. Independence In conducting our audit, we have complied with the independence requirements of the Corporations Act 2001. We confirm that the independence declaration required by the Corporations Act 2001, which has been given to the directors of Frontier Resources Limited, would be in the same terms if given to the directors as at the time of this auditor’s report.

Page 107
Basis for Qualified Opinion As at 30 June 2012 property, plant and equipment to the value of $2,008,696.67 as disclosed in Note 9 in relation to the Group’s drill rigs were held in a remote location in Papua New Guinea. Access to the location of these assets is limited. As a result of this we have been unable to obtain sufficient assurance over the physical existence and condition of these assets. Accordingly, we are unable to and do not express any assurance in respect of the existence and the recoverability of these items of property, plant and equipment for the year ended 30 June 2012. Consequently we were unable to determine whether any adjustments to property, plant and equipment in the consolidated statement of financial position or expenses in the statement of comprehensive income were necessary. Qualified Opinion In our opinion, except for the possible effects of the matter described in the Basis for Qualified Opinion paragraph: (a) the financial report of Frontier Resources Limited is in accordance with the Corporations Act
2001, including: (i) giving a true and fair view of the consolidated entity’s financial position as at 30 June
2012 and of its performance for the year ended on that date; and (ii) complying with Australian Accounting Standards and the Corporations Regulations 2001;
and (b) the financial report also complies with International Financial Reporting Standards as disclosed
in Note 1. Report on the Remuneration Report We have audited the Remuneration Report included in the directors’ report for the year ended 30 June 2012. The directors of the company are responsible for the preparation and presentation of the Remuneration Report in accordance with section 300A of the Corporations Act 2001. Our responsibility is to express an opinion on the Remuneration Report, based on our audit conducted in accordance with Australian Auditing Standards. Opinion In our opinion, the Remuneration Report of Frontier Resources Limited for the year ended 30 June 2012 complies with section 300A of the Corporations Act 2001. BDO Audit (WA) Pty Ltd
CHRIS BURTON
Director
Perth, Western Australia Dated this 28th day of September 2012.

SCHEDULE OF TENEMENTS
Page 108
FRONTIER RESOURCES LIMITED TENEMENTS
TENEMENT SCHEDULE
Tenement Name & Number Status Ownership
PAPUA NEW GUINEA
Andewa EL 1345 Granted Exploration Licence 100% Frontier
Likuruanga EL 1351 Granted Exploration Licence
Frontier 100% OTML earning right to
80.1% participating interest by
spending US$12M within 6 years
Bulago EL 1595 Granted Exploration Licence
Frontier 100% OTML earning 58%
participating interest by spending
US$12M within 6 years
Leonard Schultz EL 1597 Granted Exploration Licence
Frontier 100% OTML earning 58%
participating interest by spending
US$12M within 6 years
East New Britain EL1592 Granted Exploration Licence
Frontier 100% OTML earning right to
80.1% participating interest by
spending US$12M within 6 years
Central New
Britain EL 1598 Granted Exploration Licence
Frontier 100% OTML earning right to
80.1% participating interest by
spending US$12M within 6 years
Sudest ELA 1594 Exploration Licence Application 100% Frontier
Mt Schrader ELA 1951 Exploration Licence Application 100% Frontier
Whiteman Range ELA 2047 Exploration Licence Application 100% Frontier
Kaka River ELA 2057 Exploration Licence Application 100% Frontier
Mt Nakanai ELA 2058 Exploration Licence Application 100% Frontier
TASMANIA
Rocky River ELA
22/2011 Exploration Licence Application 100% Frontier
Tonganah ELA 3/2011 Exploration Licence Application 100% Frontier
TORQUE MINING LIMITED TENEMENTS
TASMANIA
Cethana EL 29/2009 Granted Exploration Licence 10% Frontier 90% Torque
River Lea EL 42/2010 Granted Exploration Licence 10% Frontier 90% Torque
Elliott Bay EL 20/1996 Granted Exploration Licence 10% Frontier 80% Torque 10% Exploration & Management Consultants Pty Ltd
Wanderer River EL 33/2010 Granted Exploration Licence 10% Frontier 80% Torque 10% Exploration & Management Consultants Pty Ltd
Interview River EL 6/2011 Exploration Licence Application 10% Frontier 90% Torque
Narrawa Creek RL 3/2005 Retention Licence 10% Frontier 90% Torque
Mt Paris ELA
27/2011 Exploration Licence Application 10% Frontier 90% Torque
Pieman River ELA
21/2011 Exploration Licence Application 10% Frontier 90% Torque
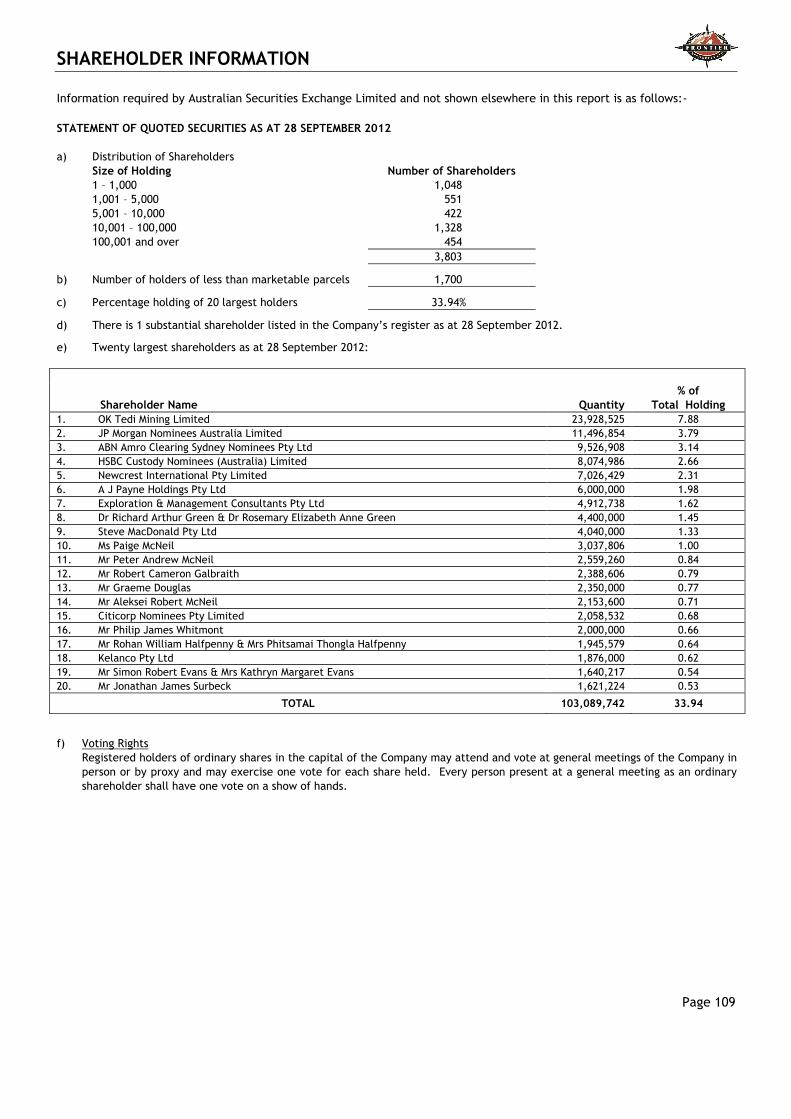
SHAREHOLDER INFORMATION
Page 109
Information required by Australian Securities Exchange Limited and not shown elsewhere in this report is as follows:-
STATEMENT OF QUOTED SECURITIES AS AT 28 SEPTEMBER 2012
a)
Distribution of Shareholders
Size of Holding Number of Shareholders
1 – 1,000 1,048
1,001 – 5,000 551
5,001 – 10,000 422
10,001 – 100,000 1,328
100,001 and over 454
3,803
b) Number of holders of less than marketable parcels 1,700
c) Percentage holding of 20 largest holders 33.94%
d) There is 1 substantial shareholder listed in the Company’s register as at 28 September 2012.
e) Twenty largest shareholders as at 28 September 2012:
Shareholder Name
Quantity
% of
Total Holding
1. OK Tedi Mining Limited 23,928,525 7.88
2. JP Morgan Nominees Australia Limited 11,496,854 3.79
3. ABN Amro Clearing Sydney Nominees Pty Ltd 9,526,908 3.14
4. HSBC Custody Nominees (Australia) Limited 8,074,986 2.66
5. Newcrest International Pty Limited 7,026,429 2.31
6. A J Payne Holdings Pty Ltd 6,000,000 1.98
7. Exploration & Management Consultants Pty Ltd 4,912,738 1.62
8. Dr Richard Arthur Green & Dr Rosemary Elizabeth Anne Green 4,400,000 1.45
9. Steve MacDonald Pty Ltd 4,040,000 1.33
10. Ms Paige McNeil 3,037,806 1.00
11. Mr Peter Andrew McNeil 2,559,260 0.84
12. Mr Robert Cameron Galbraith 2,388,606 0.79
13. Mr Graeme Douglas 2,350,000 0.77
14. Mr Aleksei Robert McNeil 2,153,600 0.71
15. Citicorp Nominees Pty Limited 2,058,532 0.68
16. Mr Philip James Whitmont 2,000,000 0.66
17. Mr Rohan William Halfpenny & Mrs Phitsamai Thongla Halfpenny 1,945,579 0.64
18. Kelanco Pty Ltd 1,876,000 0.62
19. Mr Simon Robert Evans & Mrs Kathryn Margaret Evans 1,640,217 0.54
20. Mr Jonathan James Surbeck 1,621,224 0.53
TOTAL 103,089,742 33.94
f) Voting Rights
Registered holders of ordinary shares in the capital of the Company may attend and vote at general meetings of the Company in
person or by proxy and may exercise one vote for each share held. Every person present at a general meeting as an ordinary
shareholder shall have one vote on a show of hands.