© Nuffield Foundation 2012 Nuffield Free-Standing Mathematics Activity Exponential rates of change.
9
© Nuffield Foundation 2012 Nuffield Free- Standing Mathematics Activity Exponential rates of change
-
Upload
frank-lynch -
Category
Documents
-
view
218 -
download
1
Transcript of © Nuffield Foundation 2012 Nuffield Free-Standing Mathematics Activity Exponential rates of change.
© Nuffield Foundation 2012
Nuffield Free-Standing Mathematics Activity
Exponential rates of change
© Nuffield Foundation 2010
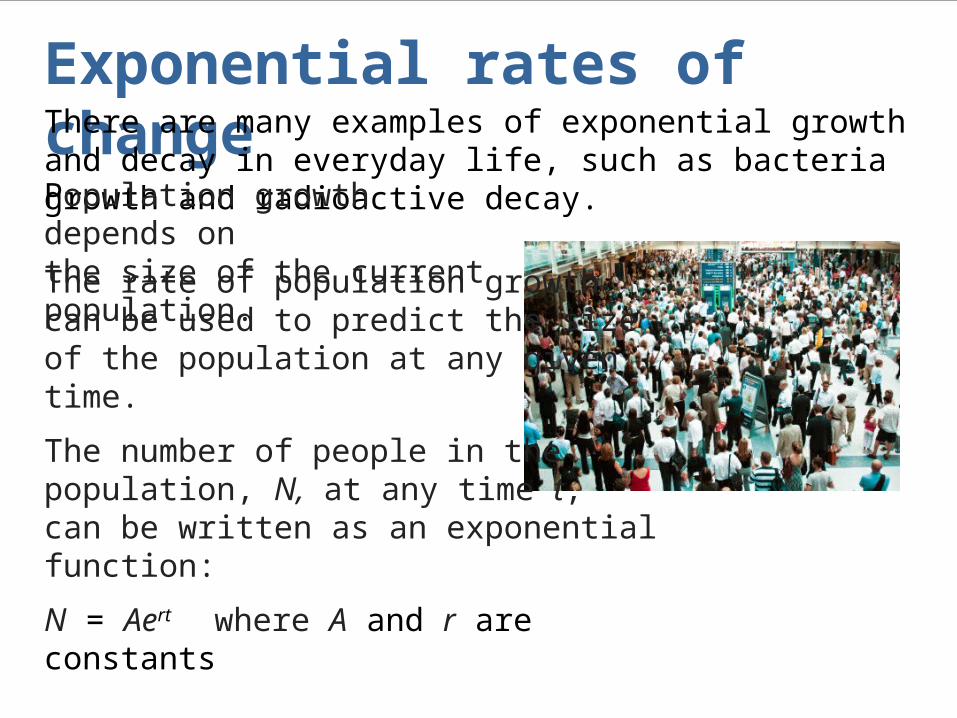
Exponential rates of changeThere are many examples of exponential growth and decay in everyday life, such as bacteria growth and radioactive decay.
Population growth depends on the size of the current population.
The rate of population growth can be used to predict the size of the population at any given time.
The number of people in the population, N, at any time t, can be written as an exponential function:
N = Aert where A and r are constants
© Nuffield Foundation 2010
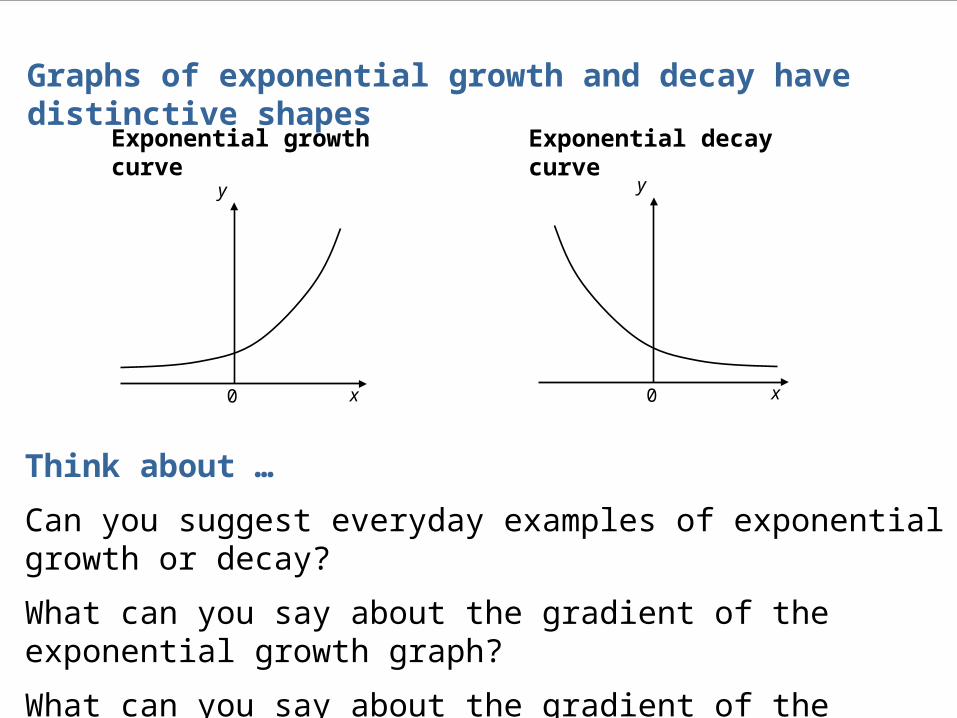
Graphs of exponential growth and decay have distinctive shapes
x
y
0
Exponential growth curve
x
y
0
Exponential decay curve
Think about …
Can you suggest everyday examples of exponential growth or decay?
What can you say about the gradient of the exponential growth graph?
What can you say about the gradient of the exponential decay graph?
© Nuffield Foundation 2010
P
Q
h
aha ff
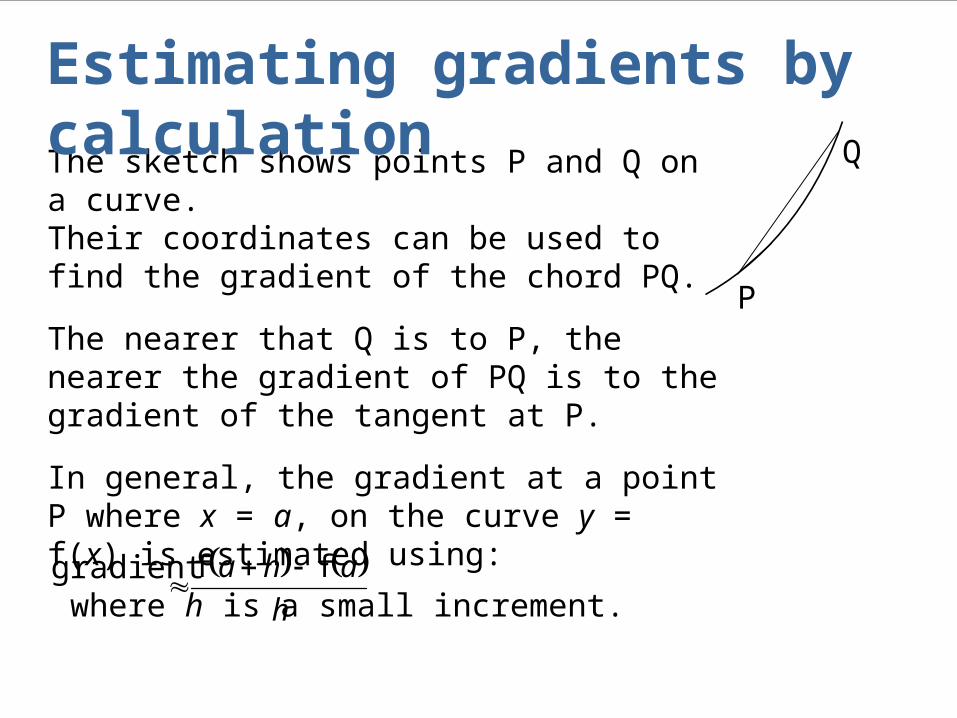
The sketch shows points P and Q on a curve. Their coordinates can be used to find the gradient of the chord PQ.
The nearer that Q is to P, the nearer the gradient of PQ is to the gradient of the tangent at P.
In general, the gradient at a point P where x = a, on the curve y = f(x) is estimated using:
gradient where h is a small increment.
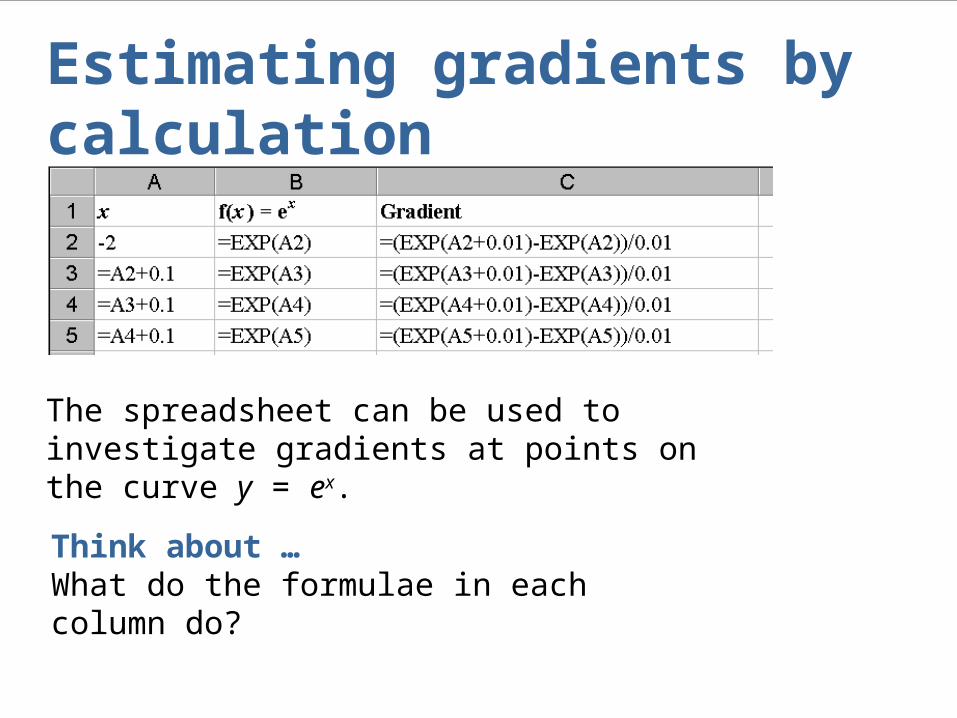
Estimating gradients by calculation
© Nuffield Foundation 2010
The spreadsheet can be used to investigate gradients at points on the curve y = ex.
Think about …What do the formulae in each column do?
Estimating gradients by calculation
© Nuffield Foundation 2010
Exponential rates of change
© Nuffield Foundation 2010
Exponential rates of change
© Nuffield Foundation 2010
Exponential rates of change
Reflect on your work
• Compare the two methods you have used for finding the gradients of exponential functions. What are their advantages and disadvantages?
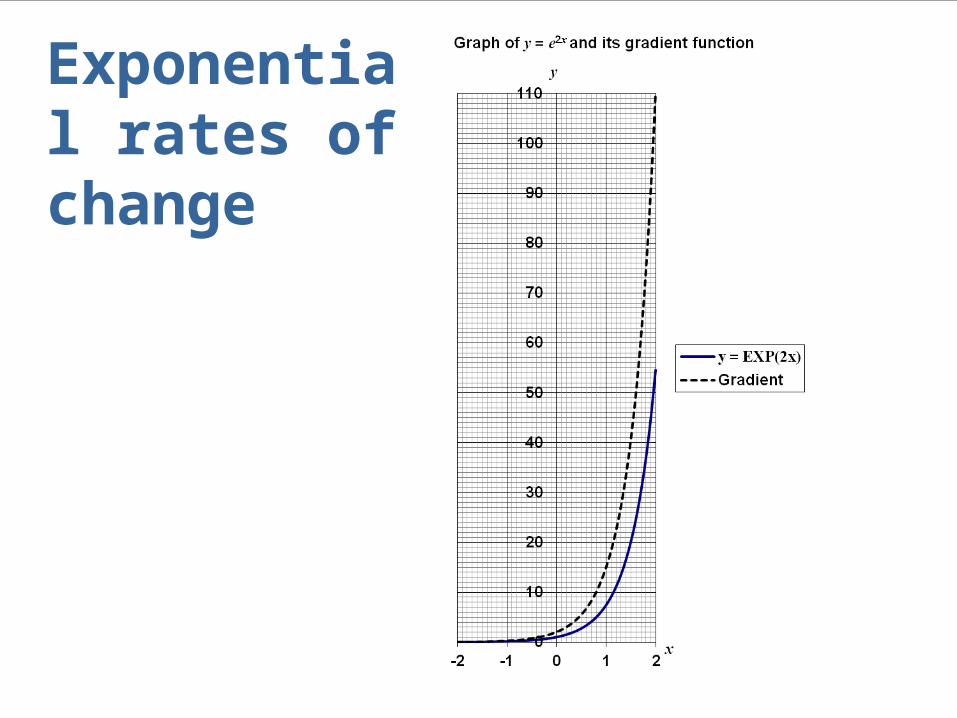
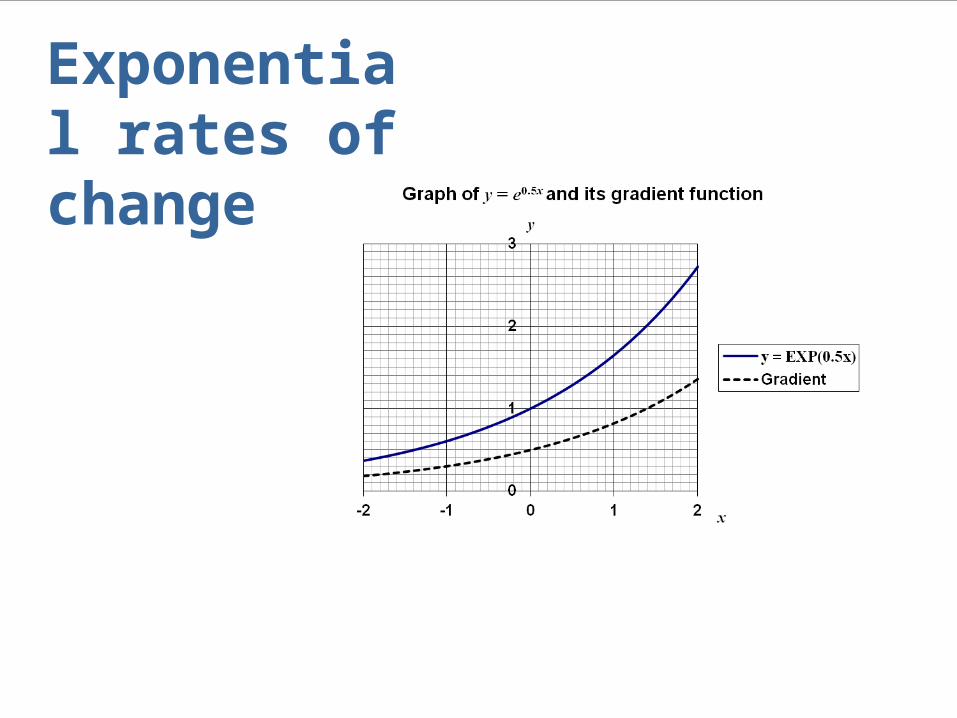
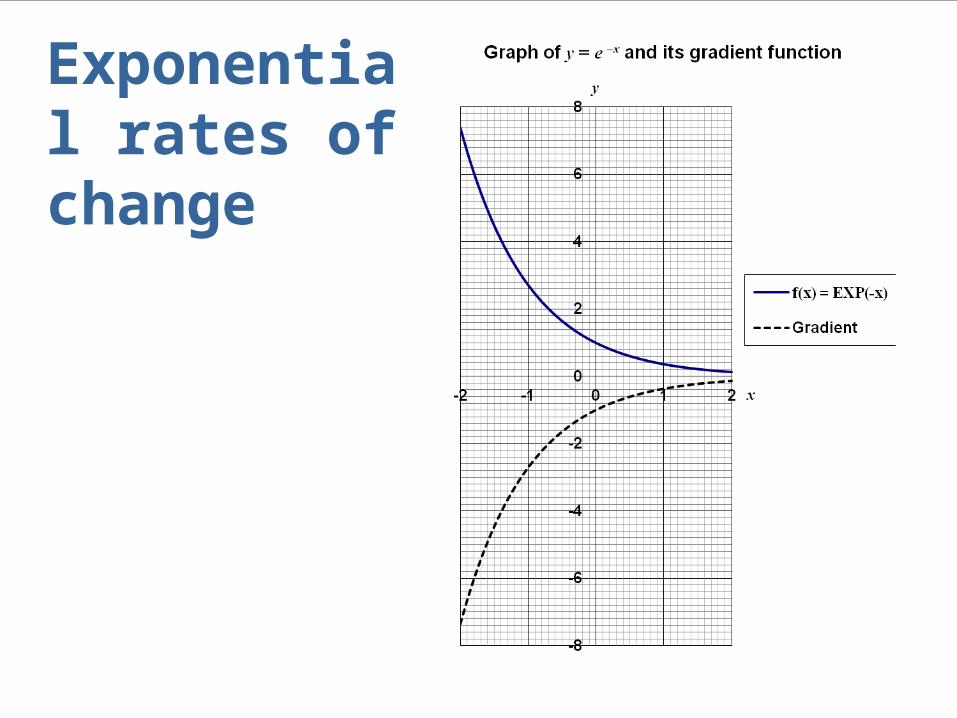
• What can you say in general about the gradient function of y = ekx?
© Nuffield Foundation 2012