© Nuffield Foundation 2011 Nuffield Free-Standing Mathematics Activity Larks and owls.
9
© Nuffield Foundation 2011 Nuffield Free-Standing Mathematics Activity Larks and owls
-
Upload
trevor-smith -
Category
Documents
-
view
221 -
download
0
Transcript of © Nuffield Foundation 2011 Nuffield Free-Standing Mathematics Activity Larks and owls.
© Nuffield Foundation 2011
Nuffield Free-Standing Mathematics Activity
Larks and owls
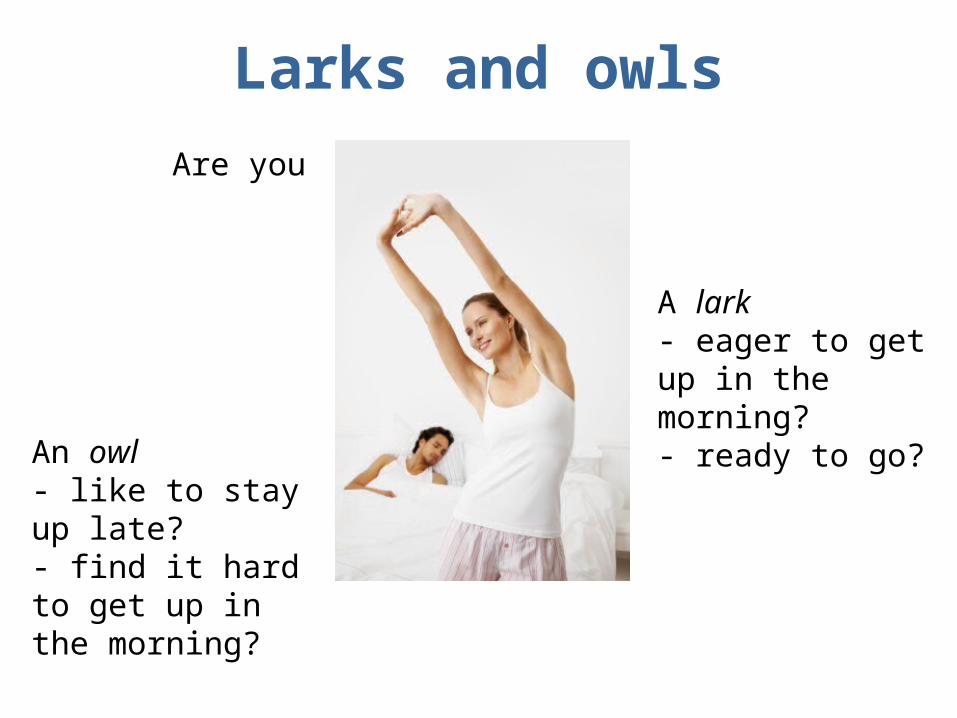
Larks and owlsAre you
An owl- like to stay up late?- find it hard to get up in the morning?
A lark- eager to get up in the morning?- ready to go?
Larks and owls
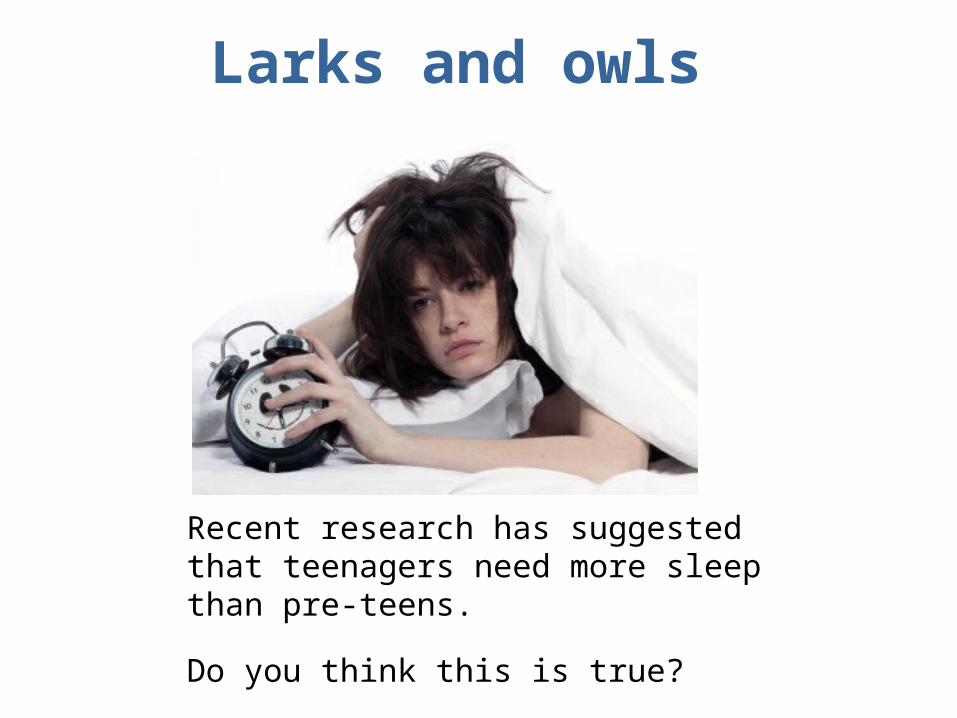
Recent research has suggested that teenagers need more sleep than pre-teens.
Do you think this is true?
Larks and owlsWhat questions could we ask?
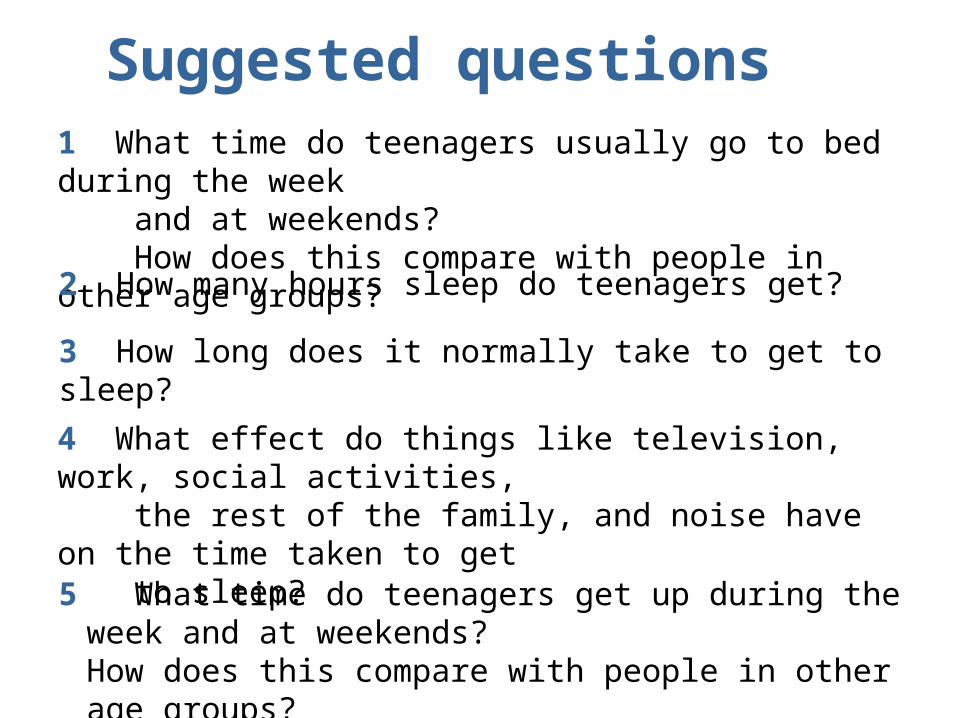
Suggested questions 1 What time do teenagers usually go to bed during the week and at weekends? How does this compare with people in other age groups?
2 How many hours sleep do teenagers get?
4 What effect do things like television, work, social activities, the rest of the family, and noise have on the time taken to get to sleep?
3 How long does it normally take to get to sleep?
5 What time do teenagers get up during the week and at weekends?How does this compare with people in other age groups?
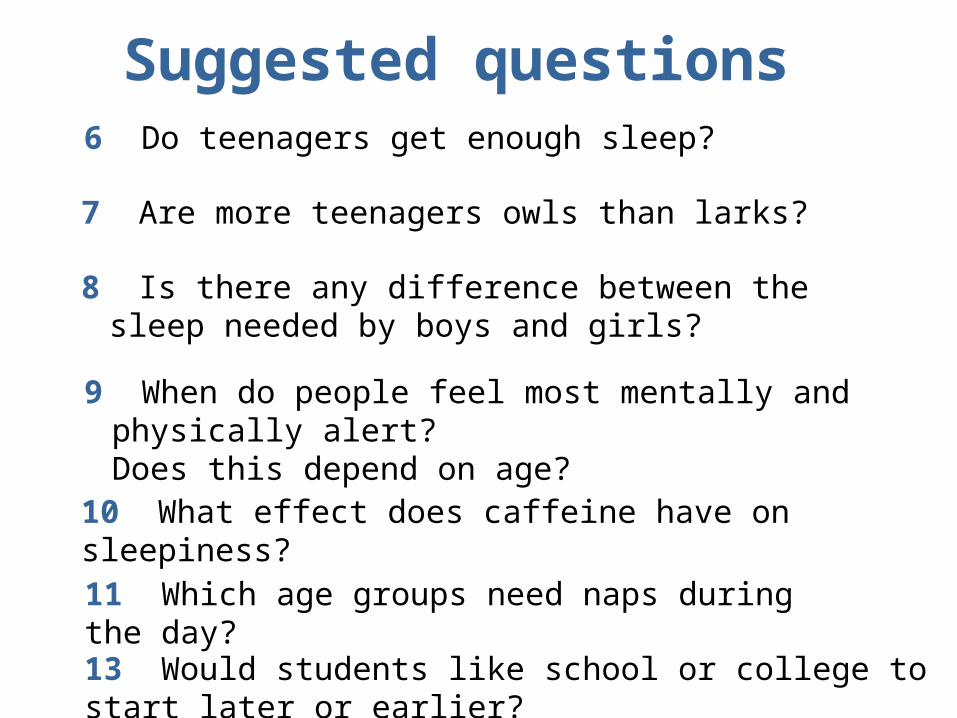
Suggested questions6 Do teenagers get enough sleep?
7 Are more teenagers owls than larks?
9 When do people feel most mentally and physically alert? Does this depend on age?
8 Is there any difference between the sleep needed by boys and girls?
10 What effect does caffeine have on sleepiness?
11 Which age groups need naps during the day?
13 Would students like school or college to start later or earlier?
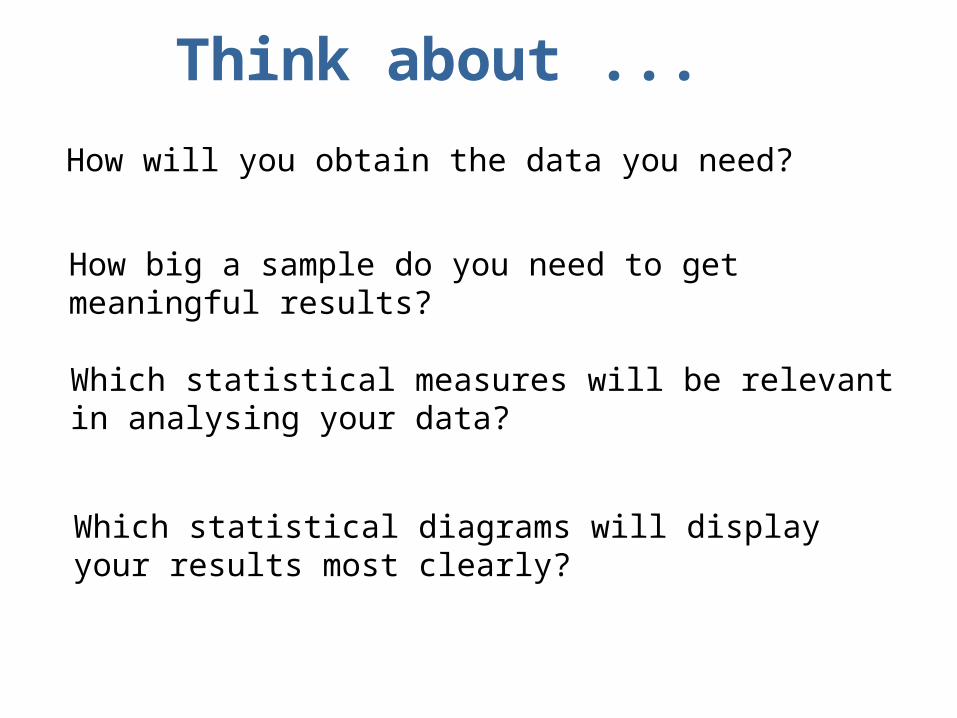
Think about ...
How will you obtain the data you need?
How big a sample do you need to get meaningful results?
Which statistical measures will be relevant in analysing your data?
Which statistical diagrams will display your results most clearly?
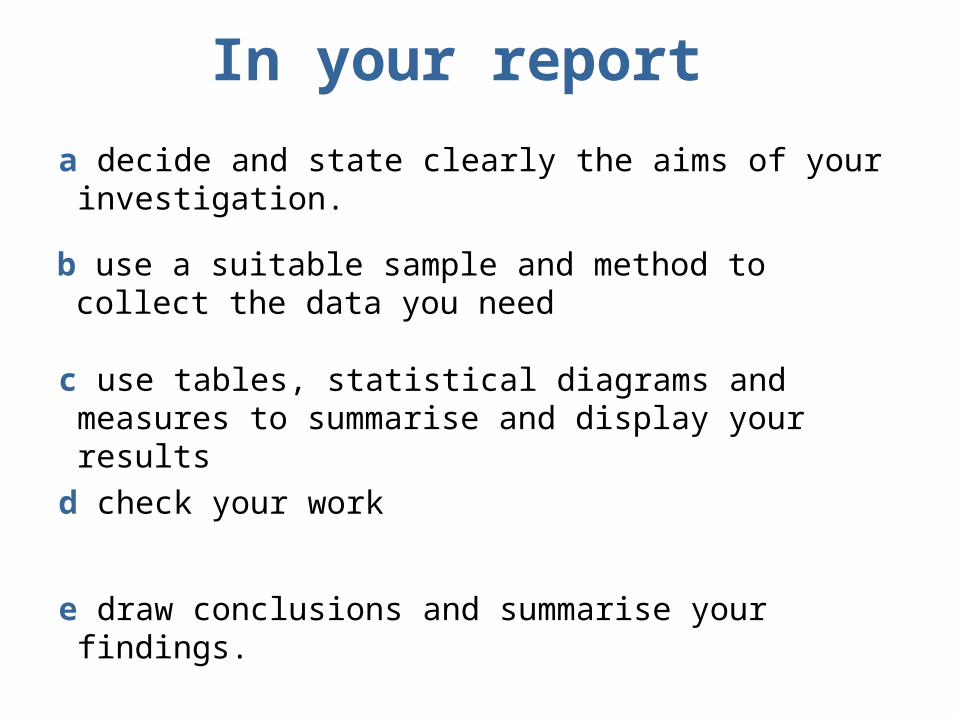
In your report
a decide and state clearly the aims of your investigation.
b use a suitable sample and method to collect the data you need
c use tables, statistical diagrams and measures to summarise and display your results
d check your work
e draw conclusions and summarise your findings.
At the end of the activity
Larks and owls
How reliable were the data you found?
Would any other method of displaying the data have been clearer for someone reading your report?
Were your calculations the most appropriate ones?
What conclusions did you come to?