No legal meaning Privately offered, professionally managed pooled investment vehicles. Interests in...
45
HEDGE FUNDS
-
Upload
toby-shurtliff -
Category
Documents
-
view
215 -
download
0
Transcript of No legal meaning Privately offered, professionally managed pooled investment vehicles. Interests in...

HEDGE FUNDS

DEFINITIONS
No legal meaning Privately offered, professionally
managed pooled investment vehicles. Interests in these funds are sold in private offerings primarily to “qualified purchasers”
Aim to deliver positive returns under all market conditions while reducing risk and preserving capital
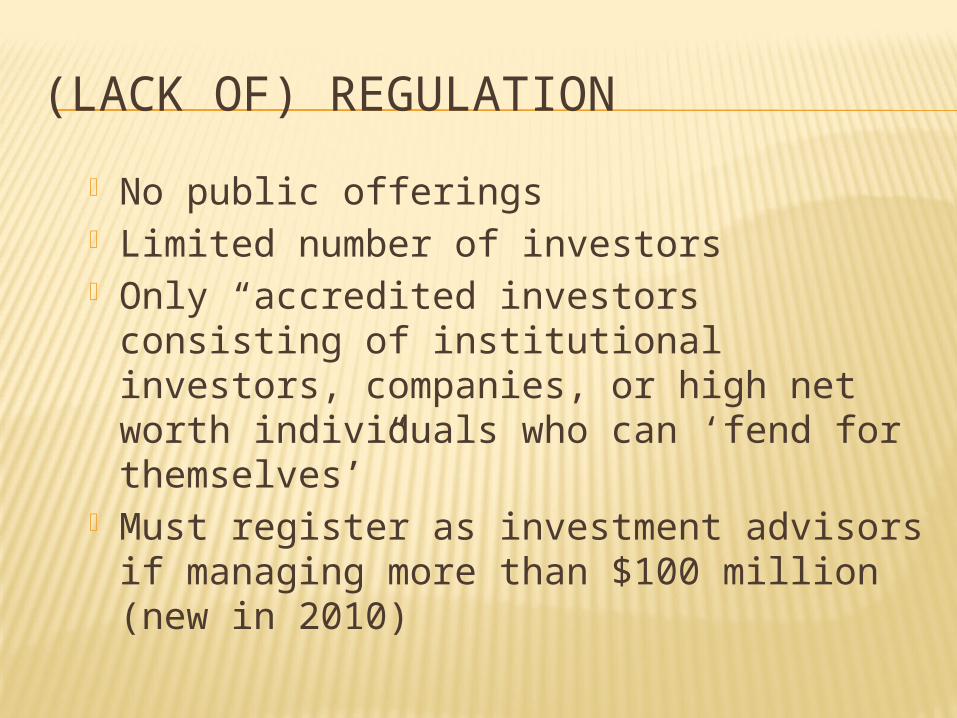
DEFINITIONS
A subset of alternative investments that incorporate all investment strategies run with an orientation to producing primarily absolute returns using largely marketable securities
A private and largely unregistered investment pool that employs sophisticated hedging and arbitrage techniques to trade in the corporate equity and bond markets

DEFINITION
“Hedge funds are investment pools that are relatively unconstrained in what they do. They are relatively unregulated (for now), charge very high fees, will not necessarily give you your money back when you want it, and will generally not tell you what they do. They are supposed to make money all the time, and when they fail at this, their investors redeem and go to someone else who has recently been making money. Every three or four years, they deliver a one-in-a-hundred-year flood.”

HISTORY The first hedge fund was set up by Alfred
W. Jones 1949 Used short sales, leverage and fees Converted from general partnership to limited
partnership in 1952 Publicized in 1966 in article in Fortune
magazine Growth from 1986-1993 and following
collapse of tech bubble in 2002 Hedge funds did relatively well in 2000 - 2002

CURRENTLY
Size has been doubling almost every two years
Approximately 9,000 active funds $2 Trillion under management Account for 30% of all U.S. fixed-
income trading 80% for distressed debt and high-yield
derivatives

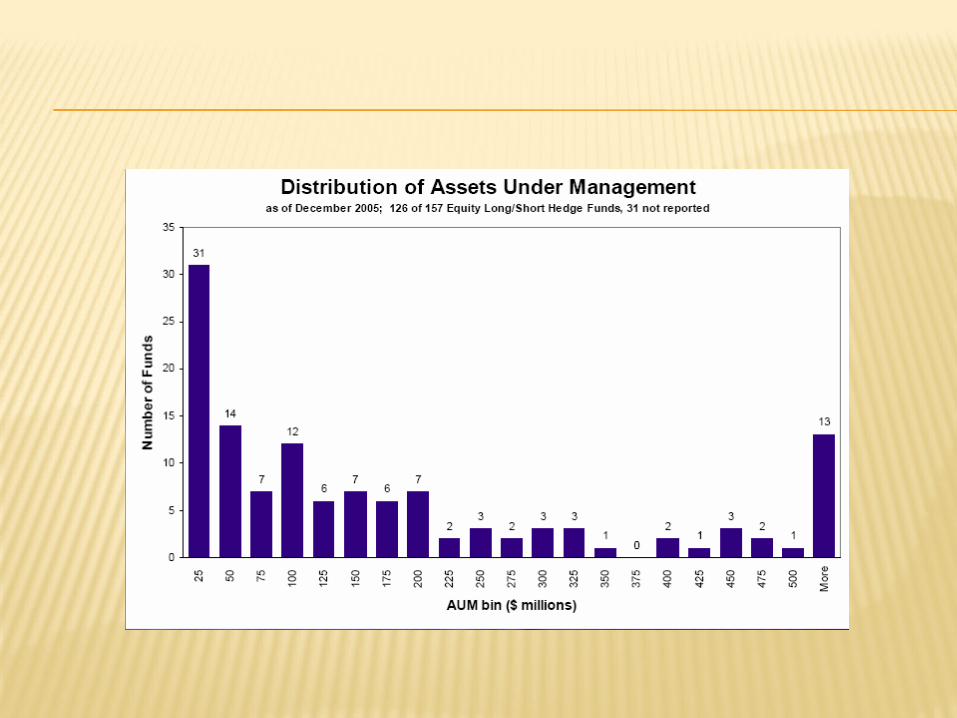
(LACK OF) REGULATION
No public offerings Limited number of investors Only “accredited investors consisting of
institutional investors, companies, or high net worth individuals who can ‘fend for themselves’”
Must register as investment advisors if managing more than $100 million (new in 2010)
(LACK OF) REGULATION Not required to disclose their
holdings to investors Not required to report investment
results Allowed to advertise only within last
2 years Limited partners must have already
formed a relationship with the general partner
Allowed to use leverage Usually 2:1 to 10:1 LTCM was at least 25:1 (perhaps more)

STRUCTURE
Limited Partnership or Offshore Corporation
Collection of funds (feeder funds) Each fund designed to optimize taxes for a
group of investors Offshore fund for foreign investors and
onshore fund for U.S.-taxed investors

HEDGE FUND LOCATION
Location Percent Assets
Cayman Islands 35%
United States 32%
British Virgin Islands 8%
Bermuda 8%
Bahamas 4%
Luxembourg 3%
Asia 4%

FEATURES
Manager usually has high percentage of his/her assets invested in fund
Current trend towards more institutions investing in hedge funds Proportion of institutions to individuals is
increasing Popular with endowments


ASSET CLASS ALLOCATION BY INSTITUTIONAL INVESTORSAsset Class Percent Allocation
Equity 51%
Fixed Income 17%
Real Estate 4%
Hedge Funds 15%
Private Equity 3.2%
Venture Capital 3.5%
Natural Resources 3%
Source: NACUBO Endowment Study

INVESTMENT STRATEGIES Convertible Arbitrage
Hedged investing in convertible securities. Typically long convertible bonds and short stock.
Merger Arbitrage Going long on an acquisition after the
announcement if price doesn’t go up to full offer price and fund manager believes merger will occur or believes a higher price will be offered
Long/Short Going long on underpriced security and short on
overpriced security in an industry Dedicated Short Strategy
Net short position (usually equities) but not necessarily purely short

INVESTMENT STRATEGIES (CONTINUTED)
Statistical Arbitrage Perceived statistical mispricing of one or more
securities according to some quantitative model. Event Driven
Looks to profit from a mispricing in situations such as mergers, acquisitions, restructuring, or bankruptcy
Fixed Income Arbitrage Attempts to profit from relative mispricing in
related fixed-income securities. For example – on-the-run vs. off-the-run government bonds
Market Neutral Strategy Make money on a mispricing whether the market
goes up or goes down. Done through the use of a zero-beta portfolio

MARKET NEUTRAL STRATEGY
You think a stock (or portfolio) is underpriced
But you also think the market might drop
You want to capture the underpricing without subjecting yourself to the risk of your position losing value along with the market
You need to separate the stock-specific bet from the effects of the market
CAPTURING POSITIVE ALPHA
This is called any of the following: Pure Play Alpha Transfer Portable Alpha Creating a market-neutral portfolio
The key is to eliminate the market (systematic) risk
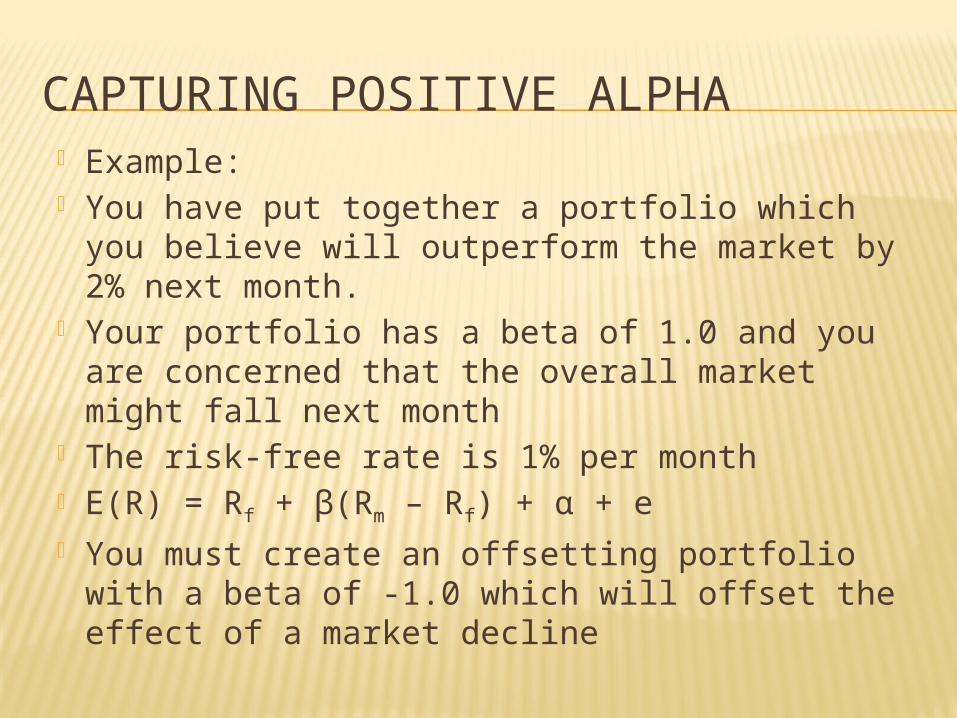
CAPTURING POSITIVE ALPHA Example: You have put together a portfolio which you
believe will outperform the market by 2% next month.
Your portfolio has a beta of 1.0 and you are concerned that the overall market might fall next month
The risk-free rate is 1% per month E(R) = Rf + β(Rm – Rf) + α + e You must create an offsetting portfolio with a
beta of -1.0 which will offset the effect of a market decline

CAPTURING POSITIVE ALPHA
You can create a portfolio with a negative beta by: Selling S&P 500 futures contracts Purchasing puts on S&P 500 contracts Shorting a SPDR ETF
Each of these creates a beta of -1.0. You can adjust this beta by borrowing or
lending at Rf

CAPTURING POSITIVE ALPHA
You now have a total position with a beta of zero (your investing portfolio with a beta of 1 plus the offsetting portfolio with a beta of -1)
E(R) = Rf + β(Rm – Rf) + α + e Your return will be the 1% risk-free rate,
the 2% alpha (if you were correct) and any undiversified unique risk that remains (expected value of zero)

CAPTURING POSITIVE ALPHA

STRATEGY ALLOCATION
Strategy Assets ($bln) Percent Assets Number Funds
Long/Short Equity Hedge
282 35% 1148
Event Driven 38.6 18% 316
Other 40.7 9% 316
Fixed Income Arbitrage
38.6 18% 166
Global Macro 32.6 8% 146
Emerging Markets 31.7 7% 168
Market Neutral 26.8 6% 212
Convertible Arbitrage
22.2 5% 124
Dedicated Short 1.2 -- 17
Source: Lipper/Tass
INVESTMENT PERFORMANCE
Very difficult to gauge for certain Voluntary disclosure Survivorship bias
Must be Risk-Adjusted Normal risk adjustments don’t always
apply Often a strong systemic (sector) risk

INVESTMENT PERFORMANCE
January 1995 – April 2006 Study Pre-fee annualized return of 12.72% Fee of 3.74% Alpha of 3.04%
January 1994 – July 2009 Study Credit Suisse/Tremont Hedge Fund Index
Average return of 8.93%; Stand Dev of 8% S&P 500
Average return of 6.46%; Stand Dev of 15.5%

INVESTMENT PERFORMANCE
A few large firms have tended to have significant positive returns Renaissance Medallion Fund
3-year annual compound return of 62.8% in 2007-2009

TOP HEDGE FUNDS AS OF 10/07
Ranked by Average Annual Return for prior 3 years
RAB Special Situations Fund 47.69% The Children’s Investment Fund 44.27% Highland CDO Opportunity Fund 43.98% BTR Global Opportunity Fund, Class D 43.42% SR Phoenicia Fund 43.10% Atticus European Fund 40.76% Gradient European Fund A 39.18%

INVESTMENT PERFORMANCE

RETURNS BY STYLE

FEES AND COMPENSATION
Management Fee of 1% - 2% of assets under management (median is 1.5%)
Incentive Fee of 20% of profits above a benchmark May be T-bill rate May be zero
Some may be higher 5% mgmt. fee and 44% of profits for
Renaissance Medallion

LIQUIDITY ISSUES Mutual Funds must redeem shares on
demand Mutual Funds must calculate NAV daily ETFs are actively traded on exchanges Hedge Funds often invest in illiquid assets
that cannot be easily priced due to infrequent trading
Models (estimates) are often used to value assets Mark-to-Model Leads to positive serial correlation in returns

LIQUIDITY ISSUES Hedge Funds will not necessarily
allow withdrawals on demand Usually specific times (quarterly) when
investors can withdraw funds Often a lock-up period of up to two years
Minimum Investment of $250,000 or more
Limited number of investors and dollars Due to diseconomies of scale Managers want long-term investors

ACCREDITED INVESTORS Individuals with a net worth of at least
$1 million or Earned at least $200,000 each year for
the past two years $300,000 with spouse if married Expect to earn the same amount this year
Institutional investors with at least $25 million in investments
A family-owned company with at least $5 million in investments

FUND OF FUNDS Allows for diversification among Hedge
Funds Fund manager is responsible for due
dilligence of various hedge funds Allows for smaller investments and greater
liquidity Additional fee of approx. 1% About 15% of all hedge fund assets
managed through fund of funds About 25% of hedge funds are actually
funds of funds

RISKS
“Fat Tails” – High positive returns, but also a possibility to lose everything like LTCM Extremely unlikely in mutual fund
Lack of liquidity Lack of information for investors High Leverage Difficult to evaluate performance

SKEWED TO THE LEFT
CS F B/T re m on t Em e rg in g M a rke ts In de x : F e b rua ry 1994 - Ju ne 2005Returns Histogram
Return
NumberCS F B/T re m on t Em e rg in g M a rke ts In de x : F e b rua ry 1994 - Ju ne 2005
Returns Histogram
-24.0% 18.0%-22.0% -20.0% -18.0% -16.0% -14.0% -12.0% -10.0% -8.0% -6.0% -4.0% -2.0% 0.0% 2.0% 4.0% 6.0% 8.0% 10.0% 12.0% 14.0% 16.0%
0
30
2
4
6
8
10
12
14
16
18
20
22
24
26
28

HIGHEST-EARNING HEDGE FUND MANAGERS IN 2007
John Paulson, Paulson & Co. $3 billion+ Philip Falcone, Harbinger Capital Partners $1.5-$2
billion Jim Simons, Renaissance Technologies $1 billion Steven A. Cohen, SAC Capital Advisors $1 billion Ken Griffin, Citadel Investment Group $1-$1.5
billion Chris Hohn, The Children’s Investment Fund $800-
$900 million Noam Gottesman, GLG Partners $700-$800
million
LONG-TERM CAPITAL MANAGEMENT
Created in 1993 by John Meriwether Former head of Salomon Brothers’ bond
traders Nobel Prize in Economics winners on
Board Myron Scholes Robert Merton
Primarily used fixed income arbitrage Looked for relative mispricing in
government debt Double alpha approach for expected
convergence

LONG-TERM CAPITAL MANAGEMENT Looked for small mispricings (small gains)
that it could magnify with leverage Debt-to-equity ratio of 25/1
$5 billion in equity and $125 billion in debt August 1998
Russia defaulted on some bonds Instead of converging, bets diverged LTCM needed to post margin Investors began withdrawing money

LONG-TERM CAPITAL MANAGEMENT
Managers still believed in their models but faced a liquidity crisis
September 1998 Federal Reserve Bank of NY organized a
rescue 14 large commercial banks and securities
firms $3.6 billion in capital 90 percent ownership of LTCM
BERNARD MADOFF Former chairman of NASDAQ Madoff Securities
Hedge fund began in 1980s Largest Ponzi Scheme ever Investors lost approximately $50 billion Delivered consistent returns of 1.0% - 1.5%
per month Stated that portfolio selection methods were
too complex for others to understand Targeted charities and foundations
Long-term investors

BERNARD MADOFF 2000 – 2001: Harry Markopolos and
Erin Arvedlund each suspected fraud when they examined the fund’s performance WSJ decided not to pursue story that it was
a fraud SEC was alerted but did nothing
December 2008: Cash shortage forces Madoff to turn himself in