· National Institute of Public Finance and Policy comprising Ashish Aggarwal, Sanhita Sapatnekar...
103
Report of the Committee to recommend measures for curbing mis-selling and rationalising distribution incentives in financial products Ministry of Finance Government of India August 2015
Transcript of · National Institute of Public Finance and Policy comprising Ashish Aggarwal, Sanhita Sapatnekar...
Report of the Committee to recommend measures for curbing
mis-selling and rationalising distribution incentives in financial products
Ministry of Finance Government of India
August 2015


Contents
Executive Summary 9
1 The market . . . . . . . . . . . . . . . . . . . . . . . . . . . . . . . . . . . . . . . . . . . . . . . 15
1.1 Financial products 16
1.2 Distribution of financial products 18
1.3 The focus of this report 20
2 Mis-selling . . . . . . . . . . . . . . . . . . . . . . . . . . . . . . . . . . . . . . . . . . . . . . . 23
2.1 The role of the agent 24
2.2 Incentives for selling 252.2.1 Case 1: Regular premium paying products . . . . . . . . . . . . . . . . . . . . . . 272.2.2 Case 2: One-time premium paying products . . . . . . . . . . . . . . . . . . . . . 29
2.3 Do commissions influence sales? 292.3.1 Commissions and mis-selling in mutual funds . . . . . . . . . . . . . . . . . . . . . 312.3.2 Commissions and mis-selling in insurance . . . . . . . . . . . . . . . . . . . . . . . . 332.3.3 Commissions and low sales in ETFs and NPS . . . . . . . . . . . . . . . . . . . . . . 36
2.4 The role of poor disclosures in mis-selling 36
3 Policy response . . . . . . . . . . . . . . . . . . . . . . . . . . . . . . . . . . . . . . . . . 41
3.1 Changes in commissions 42
3.2 Changes in agent responsibilities 43
3.3 Changes related to disclosures 44
3.4 Changes in the product structure 45

6
3.5 Aligning penal power across regulators 45
3.6 Judicial pronouncements 46
3.7 Policy reports 47
3.8 The Indian Financial Code 48
4 What is missing? . . . . . . . . . . . . . . . . . . . . . . . . . . . . . . . . . . . . . . . . . 49
4.1 The challenge of composite products 50
4.2 Regulatory arbitrage 514.2.1 Investment regulation . . . . . . . . . . . . . . . . . . . . . . . . . . . . . . . . . . . . . . . . 524.2.2 Tax treatment . . . . . . . . . . . . . . . . . . . . . . . . . . . . . . . . . . . . . . . . . . . . . . . 524.2.3 Financial inclusion . . . . . . . . . . . . . . . . . . . . . . . . . . . . . . . . . . . . . . . . . . . . 524.2.4 Multiplicity of regulations . . . . . . . . . . . . . . . . . . . . . . . . . . . . . . . . . . . . . . 53
5 Policy choices for India . . . . . . . . . . . . . . . . . . . . . . . . . . . . . . . . . 55
6 Recommendations . . . . . . . . . . . . . . . . . . . . . . . . . . . . . . . . . . . . . 59
6.1 Broad principles 60
6.2 Product specific recommendations 636.2.1 Mutual Funds . . . . . . . . . . . . . . . . . . . . . . . . . . . . . . . . . . . . . . . . . . . . . . . . 636.2.2 Insurance: Unit Linked Insurance Plans . . . . . . . . . . . . . . . . . . . . . . . . . . 656.2.3 Insurance: Traditional Life Insurance Policy . . . . . . . . . . . . . . . . . . . . . . . 676.2.4 NPS . . . . . . . . . . . . . . . . . . . . . . . . . . . . . . . . . . . . . . . . . . . . . . . . . . . . . . . . 71
Annexure A: In house sales by banks 73
Annexure B: Costs 75
Annexure C: International experience 85
Annexure D: Example of disclosure form 95
Annexure E: Benefit Illustration in the UK 97
Annexure F: List of consultations 99
Acknowledgement
In the world of retail finance, most advisors provide financial advice and sell financialproducts. Financial advisors don’t charge the consumers for advice. They make theirmoney from sale of financial products. This could place the advisors at a conflict andthe consumers at a disadvantage. This situation gets aggravated as norms applicableto similar products, including those related to sales incentives vary due to them beingcovered by different regulators. The remit of the Committee was essentially to suggestmeasures to raise the balance in favour of the consumer.
This daunting mandate became less challenging as the Committee comprised of renownedmembers with decades of relevant industry experience and knowledge of financial in-vestment products. I am extremely grateful to the Committee Members for having put inso much of their time and effort in the deliberations and the drafting of the report.
The Committee felt it imperative to consult a cross section of industry and consumerpractitioners as part of the work process. It acknowledges the intellectual and practicalinsights provided by representatives from Securities and Exchange Board of India (SEBI),Insurance Regulatory and Development Authority of India (IRDAI), Pension FundRegulatory and Development Authority (PFRDA) and practitioners in life insurance andmutual fund industry. The Committee benefited immensely from its interactions withvarious industry bodies of financial intermediaries including the Association of MutualFunds of India (AMFI) and Financial Intermediaries Association of India (FIAI).
The Committee is grateful to all of them who accepted our invite and frankly sharedtheir views. The full list of consultations is annexed to this Report. Special mention ismade for Sanjeev Pujari, SBI Life Insurance, for providing innumerable clarificationson insurance related aspects.
Vidhi Centre for Legal Policy provided valuable inputs on regulations and judicialprecedents on mis-selling of financial products in India.
The Committee acknowledges with great satisfaction the interactions with the team at

8
the ministry of finance comprising Manoj Joshi, Anupam Mishra and Abinash Dash.
Last but not the least, the Committee would like to thank the team of Consultants at theNational Institute of Public Finance and Policy comprising Ashish Aggarwal, SanhitaSapatnekar and Rachna Sharma, and Renuka Sane at the Indian Statistical Institute,Delhi, for research support.
New Delhi7 August 2015 Sumit Bose
Executive summary
Background
Regulating the financial sector is a tightrope walk in any jurisdiction, but more so in acountry like India. On one hand, loose regulations can result in fraud or mis-selling asfirms use regulatory arbitrage and a soft regulatory regime to maximise their profits atthe cost of investor. On the other hand, a very tight regulatory regime has the potential tostifle innovation, and consequently the deepening of financial markets in the economy.
One of the big challenges in the Indian context has been the weaning of the householdfrom real assets such as gold and real estate, both of which are used as insurance andinvestment vehicles, towards formal sector finance. In the pre liberalisation era, with anabsence of a large middle class and a state run economy, the two state monopolies, theLife Insurance Corporation of India (LIC) and the Unit Trust of India (UTI), were perhapssufficient to provide the Indian household a safe vehicle to channelise savings intoinvestments. Relatively low rates of return, as long as they were safe, were acceptable tothe household in the nascent stage of the Indian financial market. The role of regulationwas limited since the government was the vendor. As a consequence, there was littlefocus on evaluating sales incentives, product structures and disclosures. However, overthe decades as the market grew both in terms of demand for and supply of financialproducts, there was a need for changing the rules of the game.
Two other factors led to the need to bring about a change in the way the financial systemwas managed. The opening up of the market to private players meant that there wasneed for a set of rules by which the private and state firms could do their business. Also,market linked products needed a different mindset than a public monopoly mindsetwhere the government decided every economic variable in the system - not just interestrates but even the price at which an Initial Public Offering (IPO) could come to themarket.
The need for a change in rules is obvious when one considers the evolution of the
10
financial system from hundis to a modern stock exchange.1 While verbal and personalrelationships were adequate to run an efficient system of hundis, these obviously did notwork for stock exchanges.
Modernisation of the stock markets have often followed large scams. The modernisationof the Indian mutual fund industry came in the wake of the UTI crisis and the implodingof the US 64 pool. Several lessons have since been learnt in terms of what attributes amodern financial product should have and what regulation should and should not do.
Modern financial products should be such that costs and benefits are clearly visible tothe buyer. Costs should sit in one place under a common head and that cost head musthave a regulatory cap. Within that cap, the firms should be free to manage costs andprofits. The buyer should be able to clearly understand the contract. Market linkedproducts should declare a benchmark that must reflect the investment mandate of theproduct. Market linked products must be portable to allow investors to move from lessefficient fund managers to more efficient ones. Incentive structures should be such thatthe problem of asymmetric information is solved. Once these ground rules are in place,the regulator should be able to catch the errant driver jumping the red signal.
Consumer protection in finance has taken centre stage post the 2008 global financialcrisis - which was essentially a mis-selling episode at a massive scale. Unsuitable loanswere sold to consumers and the assets on the books of the mortgage companies andbanks were further resold to institutions. When consumers defaulted, the entire systemcollapsed. In India too, we have witnessed mis-selling across various financial products.
Household finance is now a rapidly growing academic discipline. The overwhelmingevidence from household finance points towards agents maximising their own income atthe cost of selling unsuitable financial products to households. It is well documentedthat non-transparent product structures encourage mis-selling by agents and advisors.Corroborating this work are the learnings from a new field of economics - BehavioralEconomics - which prove that an average human being is not predisposed to takingrational decisions in finance, with emotions, anchoring and loss aversion driving investorbehaviour. There is increasing evidence to show that a move to a seller-beware market isthe road ahead in financial regulation. The proposed Indian Financial Code (IFC) that isin various stages of implementation, too envisages a seller beware market.
In the current stage of the Indian market, seller beware would perhaps have very highregulatory costs that might slow down the pace of the deepening and widening ofthe financialisation of the Indian economy. One way to reduce the regulatory costis to reduce the potential of mis-selling by ensuring clean product structures, clearbenchmarks and by aligning incentives of the manufacturer, seller and buyer to theoutcomes that households derive from the purchase of the financial product.
An additional problem in the Indian market is the multiplicity of financial sector regula-tors with overlapping products and regulatory cracks. Overlapping products betweenregulators causes firms to gravitate towards markets with relatively weaker regulatory
1Technically, a Hundi is an unconditional order in writing made by a person directing another to paya certain sum of money to a person named in the order. For more details, see: http://web.archive.org/web/20131126010531/http://rbi.org.in/scripts/ms_hundies.aspx
11
oversight and poorer standards on consumer protection.
The IFC envisages a two regulator structure – with the Reserve Bank of India (RBI)and the Financial Authority (FA). A pre-requisite for a unified financial sector regulatorwould be the removal of arbitrage in product structures, costs and incentives acrossproducts in the system. Not only will this remove the skew in the market, but wouldalso prepare the ground for better consumer protection through the proposed FinancialRedress Agency (FRA). The report of this Committee needs to be seen in the largercontext of a deep change in the Indian financial sector regulation to get it ready forthe job of taking India from a $2 trillion economy to a $20 trillion one in the comingdecades.
Mandate
Given this background, the mandate of the Committee, as laid out in the terms of refer-ence, was to study the prevailing incentive structure among various financial investmentproducts taking into account the historical evolution of such a structure in India andglobally and also the differential nature of the product itself with a view to
M1 Address the issue of providing level playing field in the commission / incentivestructure of financial products;
M2 Suggest policy measures such that differential regulatory norms do not favour anyparticular financial product and prevent mis-selling;
M3 Address issues with respect to hidden costs and identical financial products underdifferent regulatory jurisdiction; and
M4 Rationalise the incentive structure across financial products.
Work process of the committee
The Committee held twelve meetings between December 2014 and July 2015 and Dr.Manju Puri attended the meetings through skype. In its very first meeting, the Committeedecided to limit its focus to examine financial products where the degree of responsibilitywith which such products are sold to the retail consumer was a matter of concern. Theseproducts were generally those (i) which did not offer assured returns and/ or (ii) hadhigh and more importantly, non transparent cost structures. These are, what are called,push products.
This narrowed down the focus to insurance, mutual fund and pension products. As acorollary, products like bank deposits, public provident fund, post office small savingsgot excluded from the review. The reason for excluding them was not only that theywere essentially pull products but also that returns on these products were relativelypredictable. More importantly these products did not have opaque, high or misalignedcost structures.
The Committee studied the current scenario of the retail financial sector in detail. Itdrew on international experience, as well as the Financial Sector Legislative Reforms
12
Commissions (FSLRC) recommendations on consumer protection, financial regula-tory architecture, financial inclusion and market development. It also reviewed theapproach taken by the Financial Stability and Development Council (FSDC) to imple-ment FSLRC’s principles relating to regulatory governance, transparency and improvedoperational efficiency that do not require legislative action.
The Committee followed a consultative approach by hearing the concerns of the stake-holders in the retail financial sector, including regulators, product providers, distributors,and actuaries. The complete list is provided in Annexure F. These guided the formulationof the recommendations.
Broad recommendations
Financial sector reform is an ongoing process. It must be remembered that due tohistorical reasons, certain products in the industry may have lagged behind the reformsthat other parts of the market have embraced. Given this, certain product categorieshave a larger focus in the eyes of the Committee so that they are brought to par with therest of the market. The endeavour of the Committee is to ensure that there are no darkpatches in the industry or product category that lead to mis-selling and investor anguishresulting in loss of trust in the financial sector.
The Committee believes that consumer interests will be served by more transparent dis-closures that enable consumers to understand products, compare them, and consequentlychoose those that serve their interests.
It is commonly recognised that tax breaks and assured returns work as pull strategies.This can be seen from the pull towards taxable bank deposits. What is perhaps notcommonly recognised is that presence of assured returns and/or tax breaks can in fact,make the product more susceptible to irresponsible sales where the products also haveopaque or mis aligned cost structures as well as opaque benefits, as can be seen in sometraditional insurance products.
The recommendations of the Committee are in two parts (described in detail in Section6). The first part, outlines the broad principles that should be applicable to any retailfinancial product. These are sub-divided into recommendations on product structure,costs and commissions and disclosures, followed by generic recommendations. Part twodeals with recommendations for specific products. The Committee suggests that theregulators frame a time-bound road map to implement the recommendations.
The spirit behind the recommendations is the idea that customers must be treated fairly.Firms must understand the spirit behind the recommendations in order to implementthese in a holistic manner. The summary of recommendations is as follows:
1. Regulation of financial products must be seen in terms of the product functionand not form. These functions (for the purpose of this committee) are: Insurance,Investment and Annuity.
2. The lead regulator, according to function, should fix the rules of the game. Inbundled products, the lead regulator for the function of the sub-part must fix rules
13
of the game.3. Investment products and investment components of bundled products should have
no upfront commissions.4. All investment products, and investment portions of bundled products, should
move to an Assets Under Management (AUM) based trail model.5. Upfront commissions on pure insurance products and pure risk portions of bundled
products should be allowed, and should be decided by the lead regulator sincepure risk is a difficult product to sell.
6. Financial products should have flexible exit options. The cost of exit must belimited. The current rules as decided by Securities and Exchange Board of India(SEBI) for mutual funds and Insurance Regulatory and Development Authorityof India (IRDAI) for Unit Linked Insurance Plans (ULIP)s are robust. The sameprinciples should govern surrender and lapse costs in traditional plans, and formthe basis for future products as they are innovated by the industry.
7. The costs of surrender for each product should be reasonable. After deduction ofcosts, the remaining money should belong to the exiting investors.
8. Lapsation profits, or profits from exit charges, if any, should not accrue or bebooked by product providers.
9. At the point of sale, returns should be clearly disclosed and should be a functionof the amount invested. Returns in bundled products should be shown on theinvested amount.
10. At the point of sale a one page disclosure form that both the customer and theseller sign off on should be included. The disclosures should be in a manner thatan average customer can understand what the product costs, what the benefits areand for how long should the customer hold the product.
11. On-going disclosure should show historical returns as an average annual numberbased on the Internal Rate of Return (IRR) of the product. The norms of thisdisclosure for investment products should follow the rules set by the lead regulator.
12. Machine readable disclosures enable creation of web-based tools and mobile appsthat help consumers make smarter choices in the marketplace and as such alldisclosures should be machine readable. Machine readable does not mean softcopy. Machine readable is when data can be processed by a computer for furtheranalysis and interpretation. Comma Separated Values (CSV) is a basic example ofmachine readable.
13. For similar products, there should be a similar structure with regard to service tax,stamp duty and rural and social sector norms.
14. Similar products should have a similar free look-in period.15. Regulators should create a common distributor (including employees of corporate
agents) regulation. Each regulator may add rules specific to products regulated bythem.
16. Regulators should create a single registry of all distributors. Anybody facingthe customer should be registered. The registry should identify each individualdistributor with a unique number. The registry should have the past history ofregulator actions and awards for each individual distributor. Strict penalties shouldbe defined for distributors who are not registered.


1 — The market
Indian financial markets have been through two distinct phases. The first was that ofnationalisation starting from the 1950s, and the second of privatisation starting fromthe 1990s. In the early 1950s, avenues for investment were limited. Retail investorscould choose between bank deposits, and postal savings schemes. Provident funds andpension schemes were only available to individuals employed in firms with more than 20employees, or to civil servants. In that environment, the LIC and UTI, were crucial forchanneling household savings into investments. Composite products which combinedinsurance with long-term savings vehicles were the entry level products for a nascentmarket.
In the 1990s, several reforms took place in Indian financial markets. The first major stepsincluded setting up of SEBI, the securities market regulator; National Stock Exchange(NSE), a modern stock exchange that introduced real time screen based trading thatbroke the broker cartels and introduced transparency and lower costs in the system,and National Securities Depository Limited (NSDL) an electronic depository. In themid 1990s the Indian mutual fund market was opened up to competition breaking themonopoly of the UTI. But real reform in the industry came post the UTI crisis wherethe non mark to market pools of UTI were dismantled. The early 2000s saw the openingof the insurance sector to private players after the formation of the regulator, the IRDAI,in 1999.
The trajectory of pension reforms was different from that of mutual funds and insurance.In 2000, the Old Age Social and Income and Security (OASIS) report submitted to theMinistry of Social Justice and Empowerment, established the thinking about the needto design an individual account defined contribution pension system for the large massof excluded workers. At the same time, concerns on the expenditures on civil servantspensions were rising. This led to the formation of the NPS, which was made mandatoryto new recruits to civil servants from January 2004, and opened up to all retail consumersin 2009.
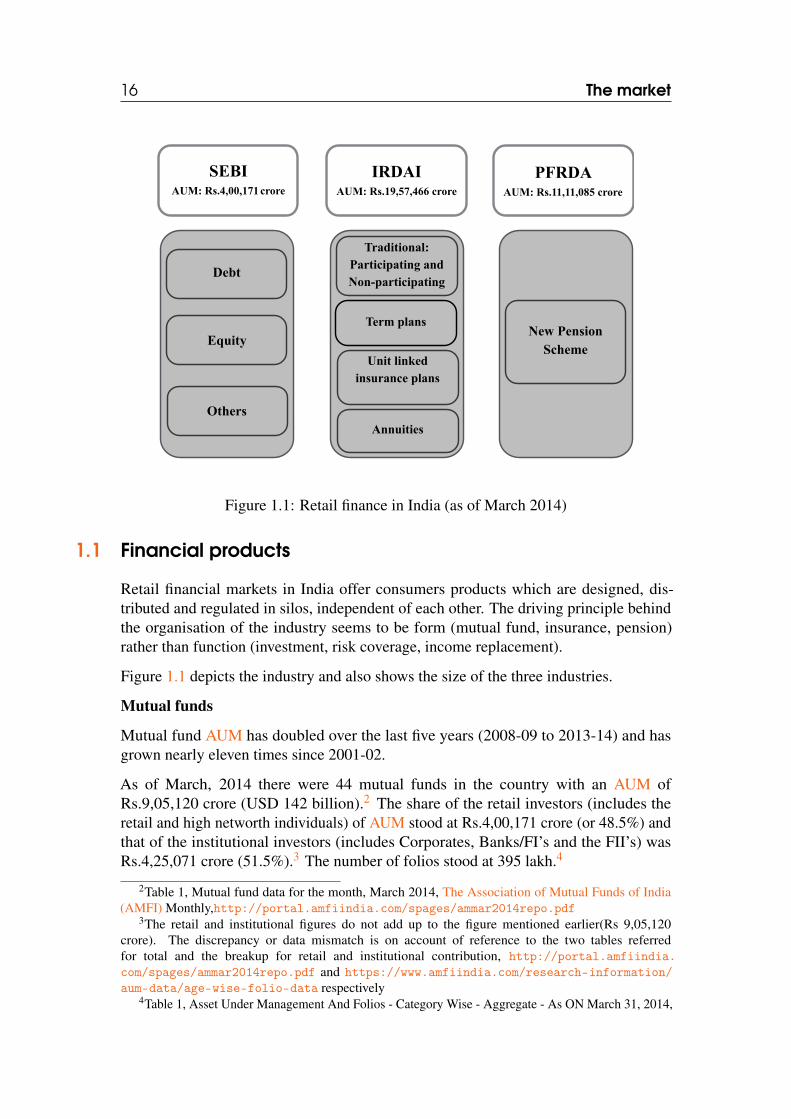
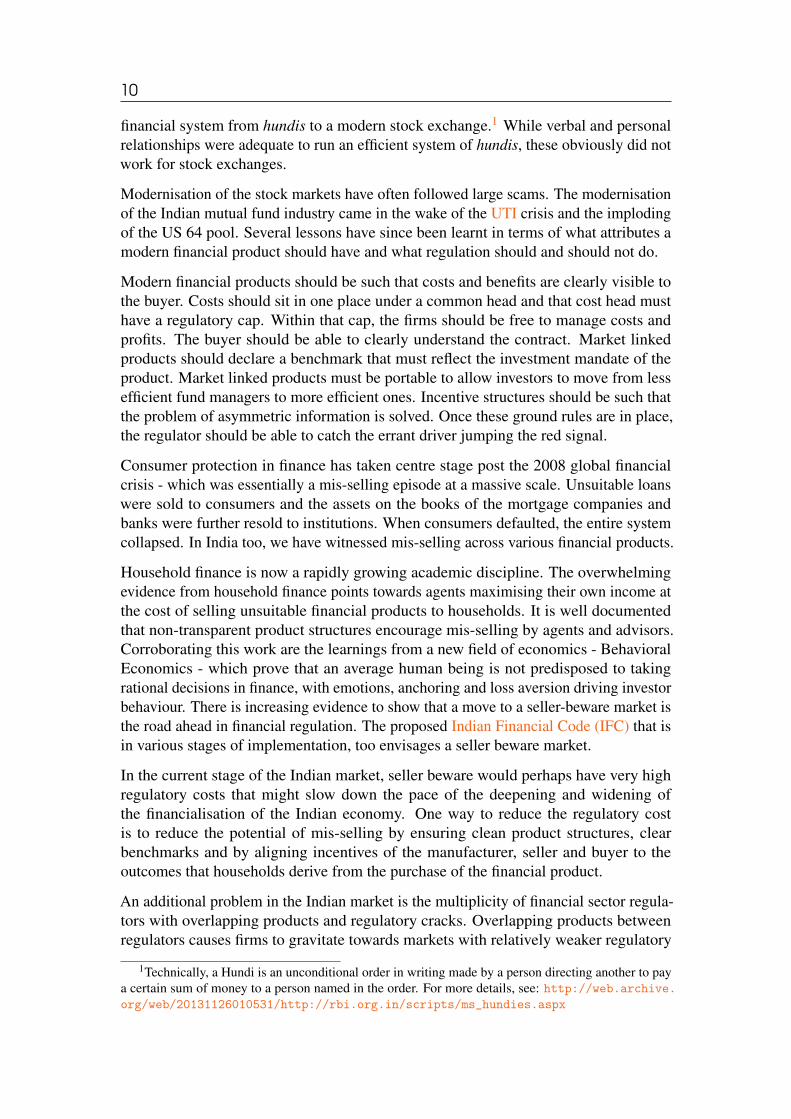
16 The market
SEBI AUM: Rs.4,00,171 crore
IRDAI AUM: Rs.19,57,466 crore
PFRDA AUM: Rs.11,11,085 crore
Debt
Equity
Others
Traditional: Participating and Non-participating
Unit linked insurance plans
Annuities
New Pension Scheme
Term plans
Figure 1.1: Retail finance in India (as of March 2014)
1.1 Financial products
Retail financial markets in India offer consumers products which are designed, dis-tributed and regulated in silos, independent of each other. The driving principle behindthe organisation of the industry seems to be form (mutual fund, insurance, pension)rather than function (investment, risk coverage, income replacement).
Figure 1.1 depicts the industry and also shows the size of the three industries.
Mutual funds
Mutual fund AUM has doubled over the last five years (2008-09 to 2013-14) and hasgrown nearly eleven times since 2001-02.
As of March, 2014 there were 44 mutual funds in the country with an AUM ofRs.9,05,120 crore (USD 142 billion).2 The share of the retail investors (includes theretail and high networth individuals) of AUM stood at Rs.4,00,171 crore (or 48.5%) andthat of the institutional investors (includes Corporates, Banks/FI’s and the FII’s) wasRs.4,25,071 crore (51.5%).3 The number of folios stood at 395 lakh.4
2Table 1, Mutual fund data for the month, March 2014, The Association of Mutual Funds of India(AMFI) Monthly,http://portal.amfiindia.com/spages/ammar2014repo.pdf
3The retail and institutional figures do not add up to the figure mentioned earlier(Rs 9,05,120crore). The discrepancy or data mismatch is on account of reference to the two tables referredfor total and the breakup for retail and institutional contribution, http://portal.amfiindia.com/spages/ammar2014repo.pdf and https://www.amfiindia.com/research-information/aum-data/age-wise-folio-data respectively
4Table 1, Asset Under Management And Folios - Category Wise - Aggregate - As ON March 31, 2014,
17
AMFI, the industry body, classifies the schemes as money market, gilt, debt oriented,equity oriented, balanced and ETFs (gold and non-gold). The largest share of the AUM,at 56 percent was of debt oriented schemes (Rs.4,60,671 crore) while equity orientedschemes accounted for 23 percent of the AUM (Rs.1,91,107 crore).5
The latest available mutual fund data shows that the AUM has risen significantly, toRs.19,94,985 crore (USD 192 billion) by May 2015, the share of income funds hasbecome 43 percent, while that of equity funds, has become 30 percent.6
Life insurance
The life insurance market has more than doubled in AUM and in sum assured during thelast five years (2008-09 to 2013-14). The AUM in 2013-14 stands over eight times itssize in 2001-02.
As of March 2014, the market comprised of 24 life insurance companies and 28 generalinsurance companies, and one national reinsurer.7
The four main products sold by the life insurance industry include: i) traditional en-dowment plans8, ii) ULIPs which gained popularity in the early 2000s, iii) pure terminsurance and iv) annuity/pension plans. The first two are composite products i.e. thereis an investment component over the insurance component. Pure term insurance has noinvestment component. Pension plans, or deferred annuities, may have an investmentcomponent. A fifth kind of product, called the Index Linked Insurance Product (ILIP),where returns are linked to the 10-year government bonds or equity indices such asSensex or Nifty has not been sold in the last two years.9
Traditional plans are of two varieties: participating and non-participating. Participatingpolicies have both guaranteed (sum assured) and non-guaranteed benefits (the part ofthe profits shared by the companies that is earned from the policy pool fund). Non-participating policies provide only the guaranteed benefits when the policy matures(maturity benefit) or the death benefit in case the policy holder dies before the end oftenure of the policy. The premium payment for these policies can be single i.e. premiumis paid only once, or recurring i.e. premium is paid over the tenure of the product.
In the insurance sector, the AUM is classified under (i) life fund, (ii) ULIP fund and(iii) pension & general annuity & group fund. The sum assured is the minimum amountpayable to the nominee/dependent on the death of the life assured, or to the policy holderat maturity. As on March 2014, the AUM with life insurance companies, including itspension funds, stood at Rs.19,57,466 crore (USD 315 billion). This includes the lifefund at Rs.12,88,225 crore (USD 204 billion), pension & general annuity & group fundat Rs.3,37,579 crore (USD 54 billion) and ULIP fund at Rs.3,31,661 crore (USD 52
https://www.amfiindia.com/research-information/aum-data/age-wise-folio-data5Table 4, Mutual fund Data for the month, March 2014, AMFI Monthly, http://portal.
amfiindia.com/spages/ammar2014repo.pdf6http://portal.amfiindia.com/spages/ammay2015repo.pdf7Page 8, Annual Report, 2013-14, IRDAI8These are also refereed to as non-linked plans9This seems to be a reaction to regulations on the ILIPs in 2013. These are discussed in Chapter 3
18 The market
billion).10 The sum assured on individual business stood at Rs. 67,96,602 crore (USD1.1 trillion).11 The number of in-force insurance policies stood at approximately 33.54crore.12
Pensions
Pension markets consist of the accumulation phase in which contributions are investedin long-term fund management products, and the decumulation phase in which totalaccumulations over working life are drawn-down using annuity products. In India, theformer is relatively better developed.13
The retirement market is fragmented across (i) mandatory Employees Provident FundOrganisation (EPFO) and NPS, (ii) private sector NPS, (iii) NPS Lite (co-contributorypension for low income workers) and (iv) pension products sold by life insurancecompanies.
Over the last five years, till March 2015, the NPS has seen its assets jump seventeentimes and subscriber base grow by nearly eleven times.
The total retirement assets in India as on March 2014 stood at Rs.11,11,085 crore14
A large share of the voluntary pension market today sits with the insurance sector asdescribed in the earlier paragraph. As of March 2014, the total NPS assets stood atRs.48,136 crore (USD 7.8 billion) while that of EPFO were Rs.2,07,686 crore (USD33.5 billion).15
As of May 2015, five years after opening to the public, the private sector NPS stood atRs.6,443 crore (USD 1 billion) with just over 4,71,117 customers.16
The draw-down, or annuity market is less developed. The annuity products are manu-factured by the insurance companies. NPS uses seven of these insurance companies asannuity providers for its pension scheme.
1.2 Distribution of financial products
Financial products are sold by an army of distributors. These distributors are eitheragents, which include individuals or corporations such as banks, and brokers. Agents(individual or corporate) are remunerated directly by the product provider and this couldoften lead them to represent the interest of the product provider. Brokers, on the otherhand, represent customers and have fiduciary responsibilities towards their customers
10Table I.48, Investments of Life Insurers: Fund Wise, Annual Report 2013-14, IRDAI11Summary of Indian Life Insurance Sector, page 3, Handbook of Indian Insurance Statistics, 2013-14,
IRDAI12Source: Life Council of India.13This is one of the reasons the Committee has focused more on investment products.14The total retirement assets is sum of the investment corpus of Provident fund (Rs. 5,17,685 crore) &
Pension Fund (Rs. 2,07,686 crore)of EPFO, the Pension fund of LIC (Rs. 3,37,579 crore) and the NPScorpus (Rs. 48,136 crore) (USD 180 billion).
15Source: Table on the Investment Corpus in the Summary of Statistical Abstract (2013-14). http://www.epfindia.com/epfbrief.html
16Pension Bulletin, May 2015, Pension Fund Regulatory and Development Authority (PFRDA).
19
but are compensated by the manufacturer. When a customer interfaces with a distributor,it is unlikely that the customer is aware, or made aware of whether the intermediary isan agent or a broker, and what that implies for the customer. Anecdotes suggest that thecustomer is likely to believe what the distributor, most often the agent, says not fullyrealising that the agent is actually serving the interest of the company.
Traditionally, individual agents have been the major distribution channel for the sale ofboth, mutual funds and insurance. In recent times, corporate agents, especially privatesector banks, have come to play an increasingly important role in distribution. Thisis especially true in the case of private sector insurance companies, which unlike theLIC, are increasingly utilising the corporate agent model. Thus, 15.6 percent of the totalinsurance premium in 2013-14 came from banks as opposed to 5.6 percent in 2006-07.17
Similarly, in the case of mutual funds, banks – and private banks, in particular – havecome to dominate distribution with over 30 percent AUM share.18
The NPS distributor is known as the Point of Presence (PoP), and is completely separatefrom the product manufacturer i.e. pension fund manager. The PoP is remuneratedupfront through customer investments, and not by the fund manager.19 This makes thePoP neither an agent nor a broker.
In the case of mutual funds, an agent may sell products of more than one manufacturer.An insurance agent can distribute products of only one manufacturer. An insurancebroker can sell products of multiple insurers. Till recently banks were not permitted toact as brokers. This debate was settled with the Government announcement in Budget of2013-14 to permit the banks to act as brokers and IRDAI making the requisite regulationsthereafter. RBI also formalised this recently through the notification dated January 15,2015.20 Banks, however, can choose to be either agents or brokers, and have largelychosen to be agents without any fiduciary responsibility.
A new development in the mutual fund and insurance markets has been the sale ofproducts directly through company websites. For example, the number of policies issuedby insurance companies through direct selling has increased from 0.31 percent of totalpolicies issued in 2006-07 to 1.7 percent in 2013-14, and the premium from directselling has increased from 0.39 percent of total premium in 2006-07 to 3.09 percent in2013-14.21 In the case of mutual funds as well, the direct channel now accounts for morethan 30 percent of the AUM. However, it seems to be more popular with corporate andinstitutional clients, than with retail investors who still seem to prefer to invest throughdistributors.22
17Source: Table 4, Channel Wise Individual New Business Performance Of Life Insurers, Handbookon Indian Insurance Statistics 2013-14.
18KPMG and CII, Indian Mutual Fund Industry: The Future in a Dynamic Environment Outlook for2015, KPMG and CII Report, June 2009.
19See Ajay Shah, “Indian pension reform: A sustainable and scalable approach”, in: Managingglobalisation: Lessons from China and India, ed. by David A. Kelly, Ramkishen S. Rajan, and GillianH. L. Goh, World Scientific, 2006, chap. 7 for a detailed description of the NPS.
20http://rbidocs.rbi.org.in/rdocs/notification/PDFs/IBROKIN150115.pdf21Source: Table 4, Individual New Business Performance of Life Insurers - Channel Wise, IRDAI
Handbook on Indian Insurance Statistics 2013-1422Indian Financial Distribution Industry at the cusp: Vision 2020, FIAI-CRISIL report on Indian
Financial Distribution Industry, March 2015.
20 The market
At the same time, the number of registered mutual fund distributors has significantlyfallen from 92,500 as of March 2010 to approximately 40,000 active distributors as onMarch 2104. The number of insurance agents have also seen a significant drop fromapproximately 29 lakh insurance agents and 2,930 corporate agents as on March 2009 to22 lakh insurance agents and 689 corporate agents as on March 2014.23
1.3 The focus of this report
The saving rate in India is high, notwithstanding concerns about a decline in recentyears. In 1990 the gross domestic saving rate in India was about 22.8 percent of GrossDomestic Product (GDP). By 2012-13, this had become 30 percent of GDP.24 Thesesavings, however, do not translate to financial assets. For example, gross domesticsavings of the household sector were 22 percent of GDP in 2012-13, of which savings inphysical assets such as gold and real estate were 15 percent of GDP, while savings infinancial assets were only 7 percent of GDP.
Only 3.4 percent of gross financial savings were invested in mutual funds, 17.3 percent inlife insurance funds, and 11.7 percent in provident and pension funds.25 While insurancefunds account for the largest share of household savings between the three markets,their penetration (measured as ratio of premium to GDP) was only about 3.9 percent in2013.26
Why might this be so? Low access to finance cannot have one simple answer. Andyet, one factor that can potentially explain the reluctance of households to engage infinancial markets is low trust. This may come from poor financial literacy, as limitedunderstanding leads to low trust. It may also come from the poor record of retailfinance in serving the interests of the customers. Given a level of financial literacyand understanding of markets, instances of mis-selling can prove to be detrimental toparticipation.
There is reason to believe that this might be the case. The limited investments inretail finance have been accompanied by several allegations of mis-selling, at the pointof sale, or during the product cycle, or sometimes both. Typical complaints includecustomers not been given correct information about products, not shown the full array ofproducts, not told the exact amount of their contributions that will be diverted towardscommissions and costs, not made clear about the exact contract that they are signinginto, and made to churn their portfolios without any apparent benefit to them. Reportedfines by regulators and convictions by courts for mis-selling may be low, but that doesnot take away from the problem.
This has been a cause for concern not only because of the losses borne by consumersbut also because such instances, as discussed earlier, can erode trust in markets, and
23Source: Table 28: Number of Individual Agents of Life Insurers & Table 29: Number of CorporateAgents of Life Insurers, Handbook on Indian Insurance Statistics 2013-14.
24Source: Table II.3, Gross Domestic Savings: Sector-wise, Annual Report, Reserve Bank of India,2014
25Source: Table II.2, Financial Saving of the Household Sector, Annual Report, RBI 2014.26Source: Table I.7, Insurance Penetration and Density in India, Annual Report, IRDAI, 2013-14.

21
adversely impact participation. Households savings are important from the point of viewof providing much needed funds for productive investment, and our inability to tap intothese savings can prove to be expensive for economic growth.
Against this background of high savings rates, low savings in financial assets, andalleged mis-selling of financial products this report studies the evidence on mis-selling,and makes recommendations for reform. These recommendations should be seen as abaseline hygiene reform, across product structures, incentives and disclosures similar tothe stock market reforms in India in the early 1990s.

2 — Mis-selling
A recurring complaint about the three investment products, insurance, mutual funds andpensions has been their inability to increase their reach to Indian households. Related tothis has been that the sale of these products is fraught with mis-selling.27
What do these alleged mis-selling practices imply? A dictionary definition of mis-sellingis, “the practice of a salesperson misrepresenting or misleading an investor about thecharacteristics of a product or service”.28 An example is where a salesperson suggeststhe purchase of one product without showing the array of products that a customercould potentially purchase. This is especially pertinent in the case of banks in Indiawho are seen to have a high concentration of in-house sales to their Asset ManagementCompanies (AMC)s (See Annexure A for details.) Other instances include a salespersonnot disclosing features of the product that are material to the investor getting a benefitout of the product, mis-representing the returns that can be earned on a product andhiding the costs and commissions. Another common problem is that of rebates whereagents lure customers to buy products by passing part of their commission to customers.
What is important to remember is that in all these cases, the optimal choice of productfor a customer would have been different (sometimes opposite) of what has actually beenrecommended to a customer. Examples include telling customers to buy a particularmutual fund (when cheaper options are available), saying that a ULIP product woulddouble their money (when there is no such guarantee possible in a market linked product),claiming that a traditional insurance product gives them returns of more than 100 percent(failing to mention that this return is a percent of sum assured and not the actual amountinvested), suggesting an elderly person to buy a market linked insurance policy (whenbearing market risk is not recommended at all, and where life insurance may not beneeded at that age).
27The evidence on mis-selling is described in detail in section 2.328This definition has been taken from Investopedia. See http://www.investopedia.com/terms/
m/misselling.asp
24 Mis-selling
Mis-selling is thus related to the “suitability” of products. One could argue that mis-selling has come to mean that the product sold is not suitable given the customerscircumstances and investment goals. In fact, a Joint Committee at the Bank for Interna-tional Settlements (BIS) has defined suitability and mis-selling as, the degree to whichthe product or service offered by the intermediary matches the retail client’s financialsituation, investment objectives, level of risk tolerance, financial need, knowledge andexperience. The term disclosure refers to any requirement that the firm disclose infor-mation to the retail client that could be material to the investment decision. In a sense,disclosure is intended to assist the retail client in making his/her decision, but is quitedistinct from the requirement on a firm to make a determination of whether a particularproduct is suitable for the client. The term “mis-selling” generally refers to the situationwhere the firm sells a product to a client that is not suitable for that client, whether or nota recommendation is made.29 We must remember that, in itself, a financial product (thatadheres to basics of transparency and costs) is not good or bad. It is in the unsuitablesale that there is a problem.
Regulatory regimes sometimes take it upon themselves to “approve” or “reject” products.While this is useful, it may lead to a situation when such “approved” products tick allthe regulatory boxes but get sold in a manner that constitutes a mis-sale. The buy-inof the regulator in approving the product now makes it a regulatory failure rather thana firm malpractice making redress almost impossible. The regulator now becomesan incumbent to the market and is reluctant to see instances of mis-selling as realeven though there may be enough anecdotal evidence to point to a systemic failure ofgovernance.
But, let’s stay with the sales process for the moment. The first question that one has toanswer is who is doing the selling? And why is selling fraught with such problems?What evidence do we have?
2.1 The role of the agent
The link between product providers and customers is the distributor or the advisor. In theearly days, this was an individual agent, who was a trusted figure in the community, andwould use her stature to convince people of the need to invest. Ties with the communityensured that transactions were in the best interest of the customers. The agents rolein educating customers, doing risk evaluation and primary underwriting, long termservicing and claims assistance were emphasised by the life insurance representatives.30
With the proliferation of new products and market participants, the form of the individualagent also began to change.
As markets acquired scale, community ties began to get replaced with anonymity. Thismeant that the individual agent was often, though not always, a stranger. Informal tiesthat bound the agent to the customer began to loosen. If a customer later complained
29Basel Committee on Banking Supervision, Customer suitability in the retail sale of financial productsand services, tech. rep., Bank for International Settlements, Apr. 2008.
30Submission by life insurance representatives on insurance intermediation/agent remuneration.
25
of mis-selling, the agent would often pass the buck to the product provider. Corporateentities such as banks also began to distribute financial products.
The current distribution market thus has two features. First, the agent has looser ties tothe community than before. Second, the agent gets paid, usually by the product providermainly in the form of an upfront commission. Or in the case of an employee, like ina bank, has her bonus linked to meeting sales targets. This has meant that agents donot have to focus on serving the customer, but on meeting volume based targets. In theolden days, the agent may have lost her reputation, but in this new world order, the agentdoes not have much to lose if the trust with the customer gets broken.
In a competitive environment, the agents who recommend better products would getmore customers, and the market would weed out those who are either not able to providegood advice, or willfully provide bad advice. Even though market forces would replacecommunity ties, competition would ensure that good behaviour would prevail.
This logic begins to fail when the customer is ignorant about financial products, and doesnot see the outcome for many years to give feedback. The customer also does not pay thedistributor directly, the distributor therefore has no incentive to service the customer. Thedistributors incentive is to maximise her income by selling the product that provides thehighest commission (or get the sales-linked performance bonus), regardless of whetherit is in the interest of the customer. This gets exacerbated when mis-selling is hard toprove because the sale process is verbal and undocumented and the regulatory regimetakes a view that it is a buyer-beware market. Even if a mis-sale has been proved, thepenalty is minuscule making this a market that is geared towards failure.
2.2 Incentives for selling
At this point, it is important to remember that we are not in a pull market. Financialproducts are still sold than bought, and distributors play an important role. Why wouldan agent sell one product over another? Since remuneration comes only from the sale ofthe product, the answer must lie in the remuneration structure.
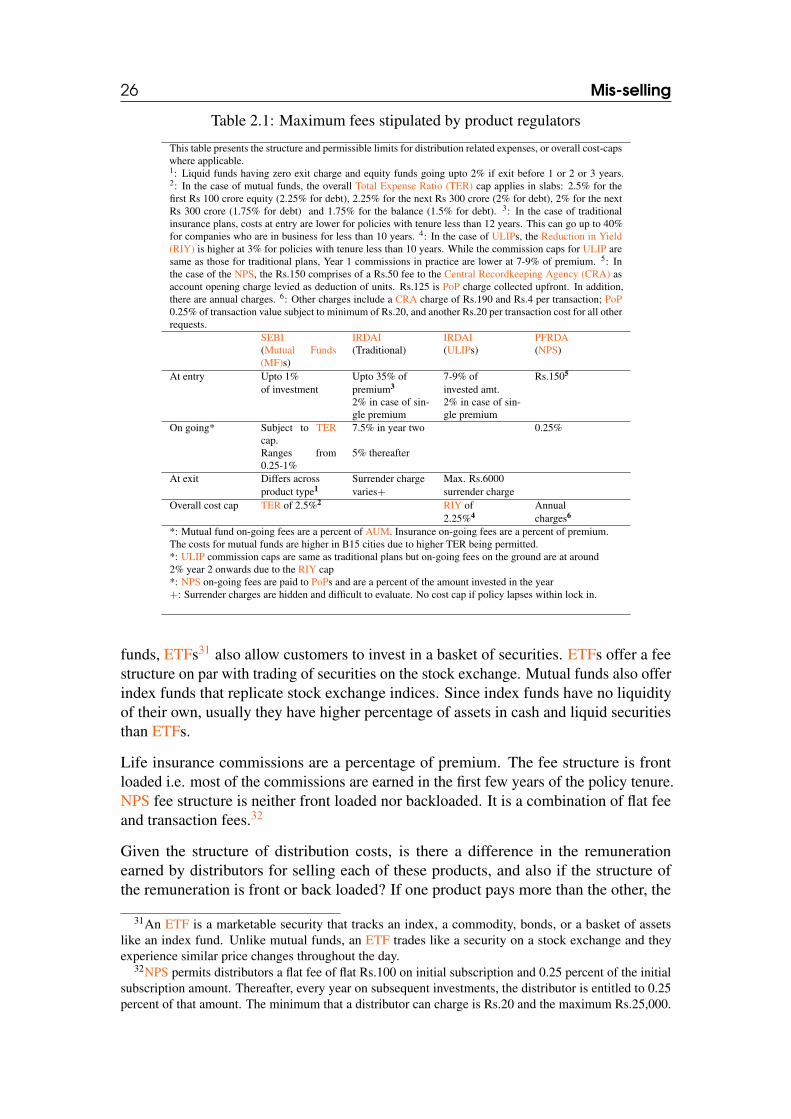
Costs are levied at one or more of the three points: on entry, on going and at exit. Entrycosts can be broken down into a transaction charge and seller commissions. On goingcosts comprise fund management, administrative, mortality, and profits. Exit costsinclude surrender charges and exit loads. Regulators stipulate the kind of fee and themaximum amount that may be paid under each of the heads. In some cases, expenses arerequired to be under an overall cost cap, whereas in some cases there are individual capson each component without an over-riding cost cap. Table 2.1 presents the structure ofthe charges, as well as permissible amounts, for the three investment products. A moredetailed table on costs across different products is presented in the Appendix.
Mutual fund fees comprise of upfront commissions, and AUM based trails. The feestructure is back loaded i.e. a distributors earnings increase as the AUM of the fundgrows. Upfront commissions are not paid by the invested amount but are upfrontedtrails i.e. these are paid out of the capital or profits of the AMC. In addition to mutual
26 Mis-selling
Table 2.1: Maximum fees stipulated by product regulators
This table presents the structure and permissible limits for distribution related expenses, or overall cost-capswhere applicable.1: Liquid funds having zero exit charge and equity funds going upto 2% if exit before 1 or 2 or 3 years.2: In the case of mutual funds, the overall Total Expense Ratio (TER) cap applies in slabs: 2.5% for thefirst Rs 100 crore equity (2.25% for debt), 2.25% for the next Rs 300 crore (2% for debt), 2% for the nextRs 300 crore (1.75% for debt) and 1.75% for the balance (1.5% for debt). 3: In the case of traditionalinsurance plans, costs at entry are lower for policies with tenure less than 12 years. This can go up to 40%for companies who are in business for less than 10 years. 4: In the case of ULIPs, the Reduction in Yield(RIY) is higher at 3% for policies with tenure less than 10 years. While the commission caps for ULIP aresame as those for traditional plans, Year 1 commissions in practice are lower at 7-9% of premium. 5: Inthe case of the NPS, the Rs.150 comprises of a Rs.50 fee to the Central Recordkeeping Agency (CRA) asaccount opening charge levied as deduction of units. Rs.125 is PoP charge collected upfront. In addition,there are annual charges. 6: Other charges include a CRA charge of Rs.190 and Rs.4 per transaction; PoP0.25% of transaction value subject to minimum of Rs.20, and another Rs.20 per transaction cost for all otherrequests.
SEBI IRDAI IRDAI PFRDA(Mutual Funds(MF)s)
(Traditional) (ULIPs) (NPS)
At entry Upto 1% Upto 35% of 7-9% of Rs.1505
of investment premium3 invested amt.2% in case of sin-gle premium
2% in case of sin-gle premium
On going* Subject to TERcap.
7.5% in year two 0.25%
Ranges from0.25-1%
5% thereafter
At exit Differs across Surrender charge Max. Rs.6000product type1 varies+ surrender charge
Overall cost cap TER of 2.5%2 RIY of Annual2.25%4 charges6
*: Mutual fund on-going fees are a percent of AUM. Insurance on-going fees are a percent of premium.The costs for mutual funds are higher in B15 cities due to higher TER being permitted.*: ULIP commission caps are same as traditional plans but on-going fees on the ground are at around2% year 2 onwards due to the RIY cap*: NPS on-going fees are paid to PoPs and are a percent of the amount invested in the year+: Surrender charges are hidden and difficult to evaluate. No cost cap if policy lapses within lock in.
funds, ETFs31 also allow customers to invest in a basket of securities. ETFs offer a feestructure on par with trading of securities on the stock exchange. Mutual funds also offerindex funds that replicate stock exchange indices. Since index funds have no liquidityof their own, usually they have higher percentage of assets in cash and liquid securitiesthan ETFs.
Life insurance commissions are a percentage of premium. The fee structure is frontloaded i.e. most of the commissions are earned in the first few years of the policy tenure.NPS fee structure is neither front loaded nor backloaded. It is a combination of flat feeand transaction fees.32
Given the structure of distribution costs, is there a difference in the remunerationearned by distributors for selling each of these products, and also if the structure ofthe remuneration is front or back loaded? If one product pays more than the other, the
31An ETF is a marketable security that tracks an index, a commodity, bonds, or a basket of assetslike an index fund. Unlike mutual funds, an ETF trades like a security on a stock exchange and theyexperience similar price changes throughout the day.
32NPS permits distributors a flat fee of flat Rs.100 on initial subscription and 0.25 percent of the initialsubscription amount. Thereafter, every year on subsequent investments, the distributor is entitled to 0.25percent of that amount. The minimum that a distributor can charge is Rs.20 and the maximum Rs.25,000.
27
distributor is likely to sell that product. If one product not only pays more than the other,but also pays upfront, then that product appears more lucrative. Thus, the quantumof payment, and the timing of payment are likely to influence distributors to sell oneproduct over another. We evaluate if this is indeed the case.
2.2.1 Case 1: Regular premium paying products
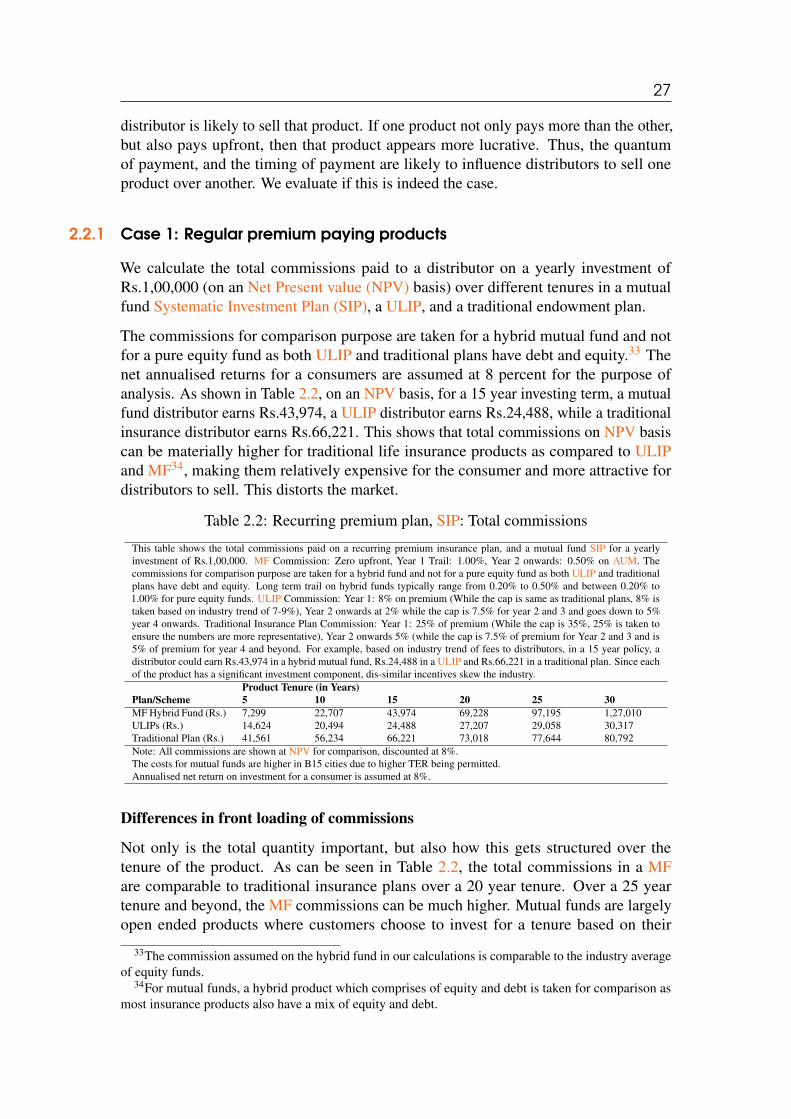
We calculate the total commissions paid to a distributor on a yearly investment ofRs.1,00,000 (on an Net Present value (NPV) basis) over different tenures in a mutualfund Systematic Investment Plan (SIP), a ULIP, and a traditional endowment plan.
The commissions for comparison purpose are taken for a hybrid mutual fund and notfor a pure equity fund as both ULIP and traditional plans have debt and equity.33 Thenet annualised returns for a consumers are assumed at 8 percent for the purpose ofanalysis. As shown in Table 2.2, on an NPV basis, for a 15 year investing term, a mutualfund distributor earns Rs.43,974, a ULIP distributor earns Rs.24,488, while a traditionalinsurance distributor earns Rs.66,221. This shows that total commissions on NPV basiscan be materially higher for traditional life insurance products as compared to ULIPand MF34, making them relatively expensive for the consumer and more attractive fordistributors to sell. This distorts the market.
Table 2.2: Recurring premium plan, SIP: Total commissions
This table shows the total commissions paid on a recurring premium insurance plan, and a mutual fund SIP for a yearlyinvestment of Rs.1,00,000. MF Commission: Zero upfront, Year 1 Trail: 1.00%, Year 2 onwards: 0.50% on AUM. Thecommissions for comparison purpose are taken for a hybrid fund and not for a pure equity fund as both ULIP and traditionalplans have debt and equity. Long term trail on hybrid funds typically range from 0.20% to 0.50% and between 0.20% to1.00% for pure equity funds. ULIP Commission: Year 1: 8% on premium (While the cap is same as traditional plans, 8% istaken based on industry trend of 7-9%), Year 2 onwards at 2% while the cap is 7.5% for year 2 and 3 and goes down to 5%year 4 onwards. Traditional Insurance Plan Commission: Year 1: 25% of premium (While the cap is 35%, 25% is taken toensure the numbers are more representative), Year 2 onwards 5% (while the cap is 7.5% of premium for Year 2 and 3 and is5% of premium for year 4 and beyond. For example, based on industry trend of fees to distributors, in a 15 year policy, adistributor could earn Rs.43,974 in a hybrid mutual fund, Rs.24,488 in a ULIP and Rs.66,221 in a traditional plan. Since eachof the product has a significant investment component, dis-similar incentives skew the industry.
Product Tenure (in Years)Plan/Scheme 5 10 15 20 25 30MF Hybrid Fund (Rs.) 7,299 22,707 43,974 69,228 97,195 1,27,010ULIPs (Rs.) 14,624 20,494 24,488 27,207 29,058 30,317Traditional Plan (Rs.) 41,561 56,234 66,221 73,018 77,644 80,792Note: All commissions are shown at NPV for comparison, discounted at 8%.The costs for mutual funds are higher in B15 cities due to higher TER being permitted.Annualised net return on investment for a consumer is assumed at 8%.
Differences in front loading of commissions
Not only is the total quantity important, but also how this gets structured over thetenure of the product. As can be seen in Table 2.2, the total commissions in a MFare comparable to traditional insurance plans over a 20 year tenure. Over a 25 yeartenure and beyond, the MF commissions can be much higher. Mutual funds are largelyopen ended products where customers choose to invest for a tenure based on their
33The commission assumed on the hybrid fund in our calculations is comparable to the industry averageof equity funds.
34For mutual funds, a hybrid product which comprises of equity and debt is taken for comparison asmost insurance products also have a mix of equity and debt.
28 Mis-selling
specific investment goals and exit the product at nil or relatively low exit fee. In the caseof insurance, customers choose their product tenure upfront and have relatively highsurrender costs, specially the traditional plans. In both cases, customers need to stayinvested for their chosen tenure to benefit from the products. Given this, it is importantthat the incentives of the distributor who sells these products are as closely aligned tothe goals of the customer. If a distributor earns most of her commission upfront she isunlikely to have interest in selling products which are suitable for the customer over thelong term in a long-tenure product. A front loaded incentive and cost structure typicallyleads to perverse incentives for mis-selling which impacts the customer persistency.35
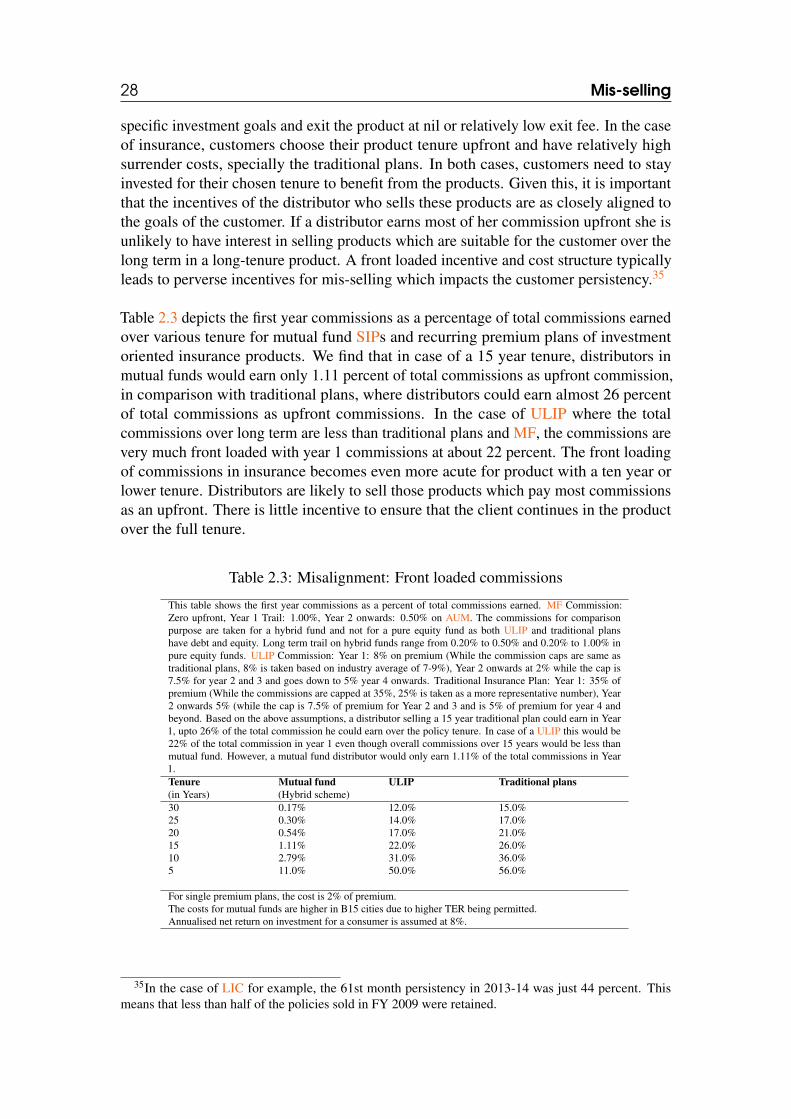
Table 2.3 depicts the first year commissions as a percentage of total commissions earnedover various tenure for mutual fund SIPs and recurring premium plans of investmentoriented insurance products. We find that in case of a 15 year tenure, distributors inmutual funds would earn only 1.11 percent of total commissions as upfront commission,in comparison with traditional plans, where distributors could earn almost 26 percentof total commissions as upfront commissions. In the case of ULIP where the totalcommissions over long term are less than traditional plans and MF, the commissions arevery much front loaded with year 1 commissions at about 22 percent. The front loadingof commissions in insurance becomes even more acute for product with a ten year orlower tenure. Distributors are likely to sell those products which pay most commissionsas an upfront. There is little incentive to ensure that the client continues in the productover the full tenure.
Table 2.3: Misalignment: Front loaded commissions
This table shows the first year commissions as a percent of total commissions earned. MF Commission:Zero upfront, Year 1 Trail: 1.00%, Year 2 onwards: 0.50% on AUM. The commissions for comparisonpurpose are taken for a hybrid fund and not for a pure equity fund as both ULIP and traditional planshave debt and equity. Long term trail on hybrid funds range from 0.20% to 0.50% and 0.20% to 1.00% inpure equity funds. ULIP Commission: Year 1: 8% on premium (While the commission caps are same astraditional plans, 8% is taken based on industry average of 7-9%), Year 2 onwards at 2% while the cap is7.5% for year 2 and 3 and goes down to 5% year 4 onwards. Traditional Insurance Plan: Year 1: 35% ofpremium (While the commissions are capped at 35%, 25% is taken as a more representative number), Year2 onwards 5% (while the cap is 7.5% of premium for Year 2 and 3 and is 5% of premium for year 4 andbeyond. Based on the above assumptions, a distributor selling a 15 year traditional plan could earn in Year1, upto 26% of the total commission he could earn over the policy tenure. In case of a ULIP this would be22% of the total commission in year 1 even though overall commissions over 15 years would be less thanmutual fund. However, a mutual fund distributor would only earn 1.11% of the total commissions in Year1.Tenure(in Years)
Mutual fund(Hybrid scheme)
ULIP Traditional plans
30 0.17% 12.0% 15.0%25 0.30% 14.0% 17.0%20 0.54% 17.0% 21.0%15 1.11% 22.0% 26.0%10 2.79% 31.0% 36.0%5 11.0% 50.0% 56.0%
For single premium plans, the cost is 2% of premium.The costs for mutual funds are higher in B15 cities due to higher TER being permitted.Annualised net return on investment for a consumer is assumed at 8%.
35In the case of LIC for example, the 61st month persistency in 2013-14 was just 44 percent. Thismeans that less than half of the policies sold in FY 2009 were retained.
29
2.2.2 Case 2: One-time premium paying products
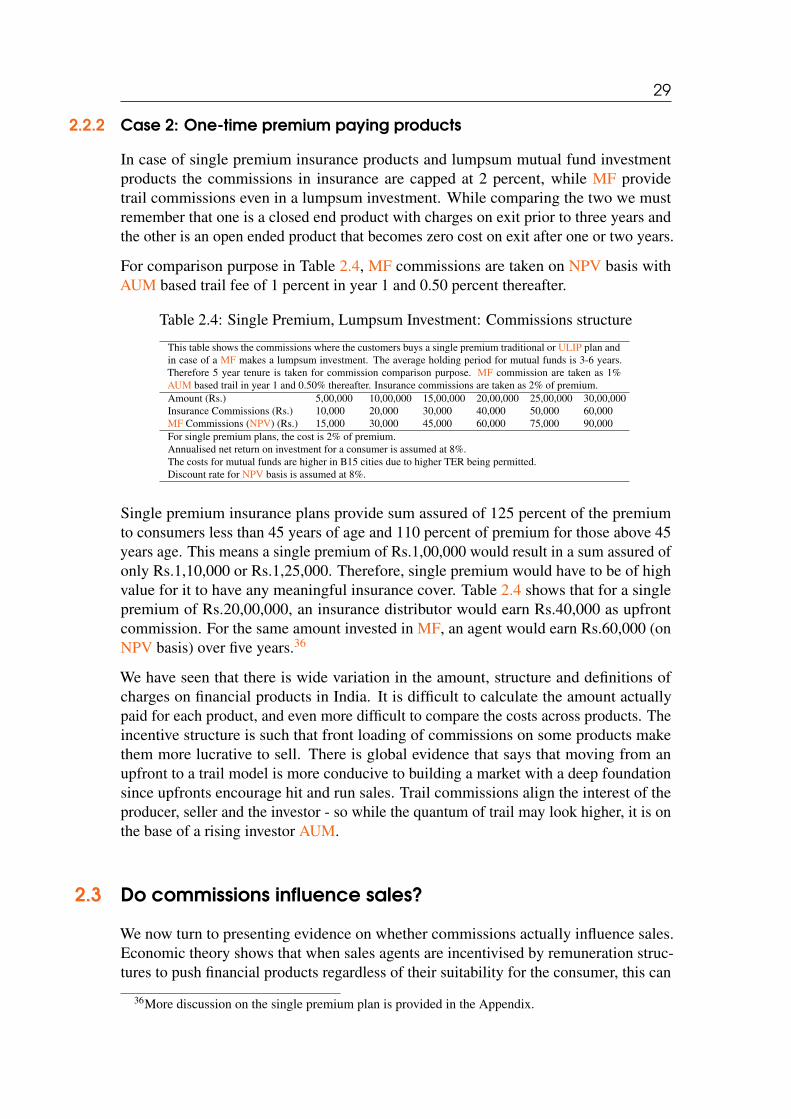
In case of single premium insurance products and lumpsum mutual fund investmentproducts the commissions in insurance are capped at 2 percent, while MF providetrail commissions even in a lumpsum investment. While comparing the two we mustremember that one is a closed end product with charges on exit prior to three years andthe other is an open ended product that becomes zero cost on exit after one or two years.
For comparison purpose in Table 2.4, MF commissions are taken on NPV basis withAUM based trail fee of 1 percent in year 1 and 0.50 percent thereafter.
Table 2.4: Single Premium, Lumpsum Investment: Commissions structure
This table shows the commissions where the customers buys a single premium traditional or ULIP plan andin case of a MF makes a lumpsum investment. The average holding period for mutual funds is 3-6 years.Therefore 5 year tenure is taken for commission comparison purpose. MF commission are taken as 1%AUM based trail in year 1 and 0.50% thereafter. Insurance commissions are taken as 2% of premium.Amount (Rs.) 5,00,000 10,00,000 15,00,000 20,00,000 25,00,000 30,00,000Insurance Commissions (Rs.) 10,000 20,000 30,000 40,000 50,000 60,000MF Commissions (NPV) (Rs.) 15,000 30,000 45,000 60,000 75,000 90,000For single premium plans, the cost is 2% of premium.Annualised net return on investment for a consumer is assumed at 8%.The costs for mutual funds are higher in B15 cities due to higher TER being permitted.Discount rate for NPV basis is assumed at 8%.
Single premium insurance plans provide sum assured of 125 percent of the premiumto consumers less than 45 years of age and 110 percent of premium for those above 45years age. This means a single premium of Rs.1,00,000 would result in a sum assured ofonly Rs.1,10,000 or Rs.1,25,000. Therefore, single premium would have to be of highvalue for it to have any meaningful insurance cover. Table 2.4 shows that for a singlepremium of Rs.20,00,000, an insurance distributor would earn Rs.40,000 as upfrontcommission. For the same amount invested in MF, an agent would earn Rs.60,000 (onNPV basis) over five years.36
We have seen that there is wide variation in the amount, structure and definitions ofcharges on financial products in India. It is difficult to calculate the amount actuallypaid for each product, and even more difficult to compare the costs across products. Theincentive structure is such that front loading of commissions on some products makethem more lucrative to sell. There is global evidence that says that moving from anupfront to a trail model is more conducive to building a market with a deep foundationsince upfronts encourage hit and run sales. Trail commissions align the interest of theproducer, seller and the investor - so while the quantum of trail may look higher, it is onthe base of a rising investor AUM.
2.3 Do commissions influence sales?
We now turn to presenting evidence on whether commissions actually influence sales.Economic theory shows that when sales agents are incentivised by remuneration struc-tures to push financial products regardless of their suitability for the consumer, this can
36More discussion on the single premium plan is provided in the Appendix.
30 Mis-selling
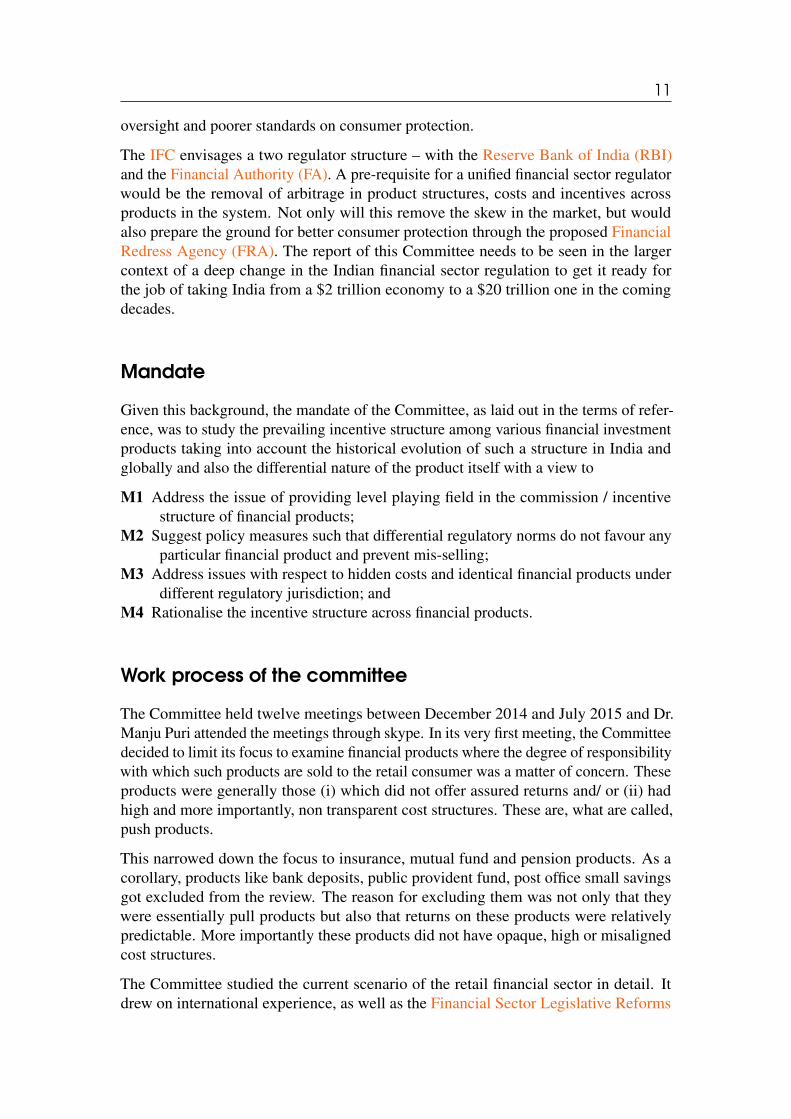
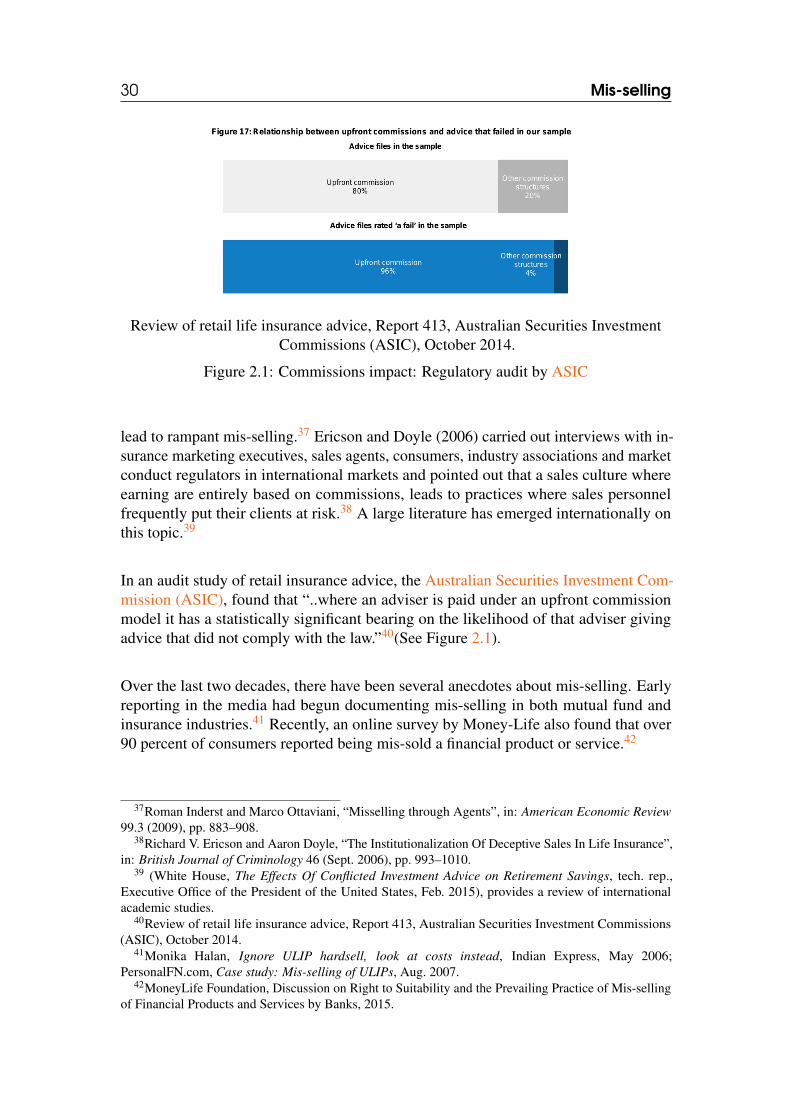
Review of retail life insurance advice, Report 413, Australian Securities InvestmentCommissions (ASIC), October 2014.
Figure 2.1: Commissions impact: Regulatory audit by ASIC
lead to rampant mis-selling.37 Ericson and Doyle (2006) carried out interviews with in-surance marketing executives, sales agents, consumers, industry associations and marketconduct regulators in international markets and pointed out that a sales culture whereearning are entirely based on commissions, leads to practices where sales personnelfrequently put their clients at risk.38 A large literature has emerged internationally onthis topic.39
In an audit study of retail insurance advice, the Australian Securities Investment Com-mission (ASIC), found that “..where an adviser is paid under an upfront commissionmodel it has a statistically significant bearing on the likelihood of that adviser givingadvice that did not comply with the law.”40(See Figure 2.1).
Over the last two decades, there have been several anecdotes about mis-selling. Earlyreporting in the media had begun documenting mis-selling in both mutual fund andinsurance industries.41 Recently, an online survey by Money-Life also found that over90 percent of consumers reported being mis-sold a financial product or service.42
37Roman Inderst and Marco Ottaviani, “Misselling through Agents”, in: American Economic Review99.3 (2009), pp. 883–908.
38Richard V. Ericson and Aaron Doyle, “The Institutionalization Of Deceptive Sales In Life Insurance”,in: British Journal of Criminology 46 (Sept. 2006), pp. 993–1010.
39 (White House, The Effects Of Conflicted Investment Advice on Retirement Savings, tech. rep.,Executive Office of the President of the United States, Feb. 2015), provides a review of internationalacademic studies.
40Review of retail life insurance advice, Report 413, Australian Securities Investment Commissions(ASIC), October 2014.
41Monika Halan, Ignore ULIP hardsell, look at costs instead, Indian Express, May 2006;PersonalFN.com, Case study: Mis-selling of ULIPs, Aug. 2007.
42MoneyLife Foundation, Discussion on Right to Suitability and the Prevailing Practice of Mis-sellingof Financial Products and Services by Banks, 2015.
31
2.3.1 Commissions and mis-selling in mutual funds
Till about five years ago, the industry was substantially focused on institutional investorssuch as banks corporates. For example, as late as March 2009, retail participationconstituted only about 20 percent of the total AUM. By March 2015, this was about 48percent of the total AUM. The increase occurred because the industry realised that itneeded to focus on retail customers to get more sticky and remunerative assets.
In this period of limited retail participation, there were several instances of mis-selling.Up until 2006, mutual funds could charge investors money up to 6 percent of the moneycollected in a New Fund Offer (NFO). If an NFO collected Rs.1,000 crore, the mutualfund could deduct Rs.60 crore from investors’ money over the next five years. In 2005-06, the NFO charge netted the industry Rs.2,281 crore (this would be recovered overfive years). This was in addition to the 2.25 percent of the invested amount as a frontload and the expense ratio of around 2 percent.
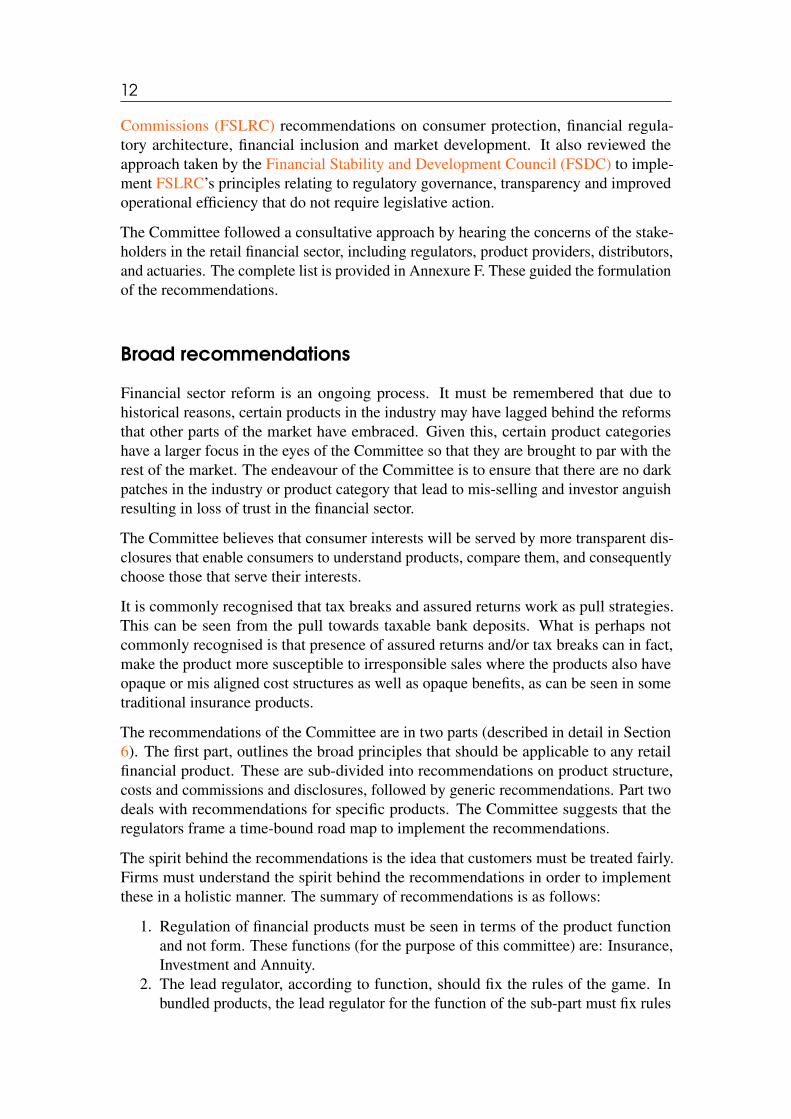
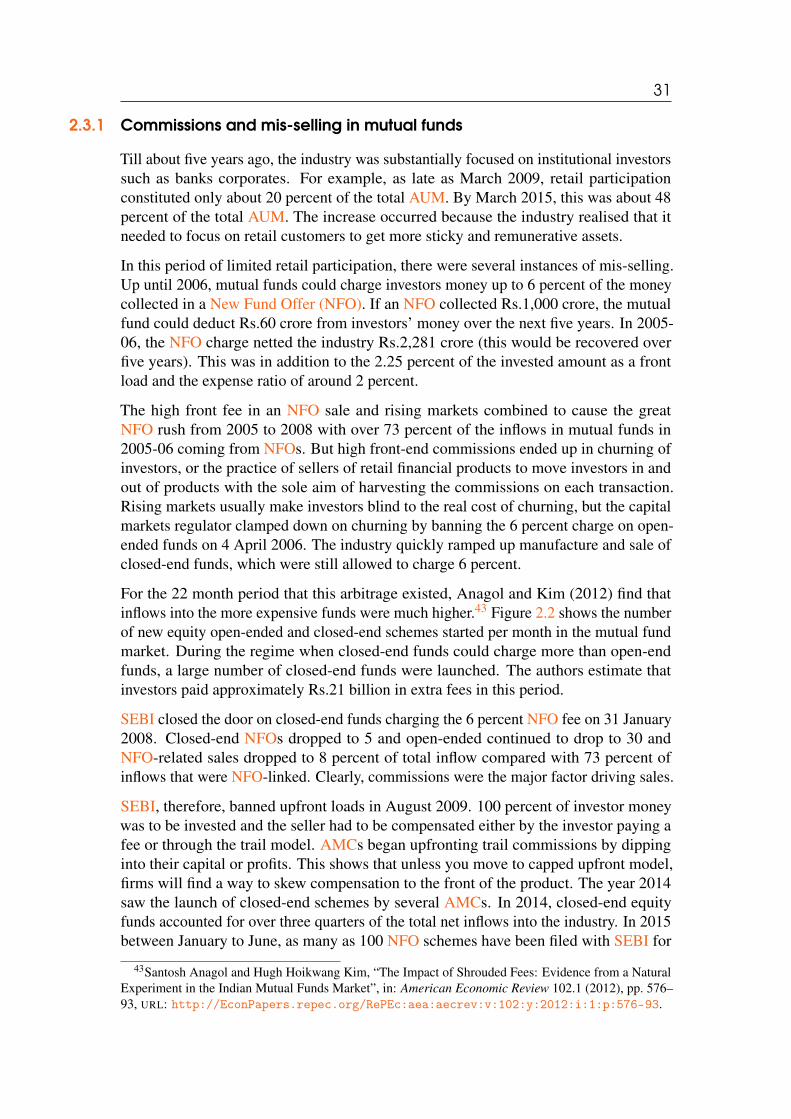
The high front fee in an NFO sale and rising markets combined to cause the greatNFO rush from 2005 to 2008 with over 73 percent of the inflows in mutual funds in2005-06 coming from NFOs. But high front-end commissions ended up in churning ofinvestors, or the practice of sellers of retail financial products to move investors in andout of products with the sole aim of harvesting the commissions on each transaction.Rising markets usually make investors blind to the real cost of churning, but the capitalmarkets regulator clamped down on churning by banning the 6 percent charge on open-ended funds on 4 April 2006. The industry quickly ramped up manufacture and sale ofclosed-end funds, which were still allowed to charge 6 percent.
For the 22 month period that this arbitrage existed, Anagol and Kim (2012) find thatinflows into the more expensive funds were much higher.43 Figure 2.2 shows the numberof new equity open-ended and closed-end schemes started per month in the mutual fundmarket. During the regime when closed-end funds could charge more than open-endfunds, a large number of closed-end funds were launched. The authors estimate thatinvestors paid approximately Rs.21 billion in extra fees in this period.
SEBI closed the door on closed-end funds charging the 6 percent NFO fee on 31 January2008. Closed-end NFOs dropped to 5 and open-ended continued to drop to 30 andNFO-related sales dropped to 8 percent of total inflow compared with 73 percent ofinflows that were NFO-linked. Clearly, commissions were the major factor driving sales.
SEBI, therefore, banned upfront loads in August 2009. 100 percent of investor moneywas to be invested and the seller had to be compensated either by the investor paying afee or through the trail model. AMCs began upfronting trail commissions by dippinginto their capital or profits. This shows that unless you move to capped upfront model,firms will find a way to skew compensation to the front of the product. The year 2014saw the launch of closed-end schemes by several AMCs. In 2014, closed-end equityfunds accounted for over three quarters of the total net inflows into the industry. In 2015between January to June, as many as 100 NFO schemes have been filed with SEBI for
43Santosh Anagol and Hugh Hoikwang Kim, “The Impact of Shrouded Fees: Evidence from a NaturalExperiment in the Indian Mutual Funds Market”, in: American Economic Review 102.1 (2012), pp. 576–93, URL: http://EconPapers.repec.org/RePEc:aea:aecrev:v:102:y:2012:i:1:p:576-93.
32 Mis-selling
Anagol and Kim (2012)
Figure 2.2: Commissions impact: Mutual funds
approval. AMCs started “upfronting” the three-year and five-year trail commission thatshould have come at the end of each year to the first year, resulting in upfronts of ashigh as 7 percent or 8 percent. Instead of getting induced into buying into a pedigreedscheme with at least five years of performance history behind it, investors got sold newschemes with no track record. Worse, it encouraged even good advisers into churning apart of their client’s portfolio. SEBI leaned on the industry association AMFI that hasnow put a cap of 1 percent on the upfronting of the trail commission.
The various changes in regulatory norms by SEBI have gone in the broad directionof removing front end incentives that have proved to skew sales. The distributor andadvisors are settling down into a full trail industry. The AUM of the equity part of themutual fund industry (equity is the retail part of the fund industry) has continued to growdespite the squeeze on incentives upfront.
The industry saw a 24 percent growth in assets between May 2014 and May 2015. Therewere concerns that the growth had only been focused on top 15 metro towns sinceinception. This made SEBI allow higher commissions for increasing the reach in smallertowns. Thus, while the total growth has been 24 percent, growth in AUM from B15cities between May 2014 and May 2015 has been 54 percent, while that in the T15cities has been 18 percent.44 This has led to concerns that this growth is on accountof mis-selling especially given the fact that higher commissions can lead to aggressivesales in lesser financial literate towns. This needs to be investigated in more detail bythe regulator.
44Industry Trends, AMFI. https://www.amfiindia.com/Themes/Theme1/downloads/home/industry-trends-may-2015.pdf
33
2.3.2 Commissions and mis-selling in insurance
Until 2001, the life insurance industry in India was a state-owned monopoly enterprise,the LIC. The original rationale for offering non-linked policies was that such investmentsin addition to the pure life component could be used to fund any changes in the futurecosts of the insurance product arising out of changes in mortality or fees for otherreasons. However, non-linked policies were popular with investors because they gaveinvestors some access to long-term investment opportunities unlike the annuities or theterm policies. Furthermore, there were no competing fund management avenues at thetime that offered guaranteed returns.
Investors funded the policy once or twice a year in the expectation of getting a lumpsum return in 15-20 years, or getting periodic returns after 10-15 years of funding thepolicy. In addition, these insurance products had attractive tax benefits, both as beingeligible for tax benefits during investment, and after, with proceeds of the investmentand final withdrawals being tax exempt.
After 1999, when the insurance regulator, IRDAI was set up, and the insurance industrywas privatised in 2000, there were two significant changes in the market for insurancecustomers. The first was the entry of the ULIP, an investment linked insurance policy,where a large fraction of the premium was invested as in a mutual fund product witha small insurance pay-out in the case of death. The second was that national levelcorporate agents and banks, which were not regulated for their insurance services,became important distributors of insurance products. The AUM attributable to ULIPsgrew at 534.82 percent between 2003 and 2004, and at 92 percent between 2009 and2010. These were significantly higher growth rates when compared to growth rate in thesales of the traditional insurance products, which grew at 16 percent.
Anecdotal evidence suggests that investors bought the equity-linked ULIP assumingthat they were buying a three-year guaranteed product that would double their money.The regulation on a three-year lock in period which allowed companies to keep theentire value of the policy if surrendered within three years, left very little incentive tothe insurance companies to promote follow-on premium payments from their customers.The rule on front-loaded commissions, which were as high as 40 percent45 in the firstyear, incentivised agents to sell products that earned them the highest pay-off. The taxbenefits made this product even more attractive. When the product did not provide the(falsely) promised returns, a lot of customers stopped paying, and lost money as alsoin other financial products. This was reflected in the spike in the lapsation in insurancepolicies after the introduction of ULIPs in India. Halan, Sane, and Thomas (2014) findthat investors lost more than a trillion rupees from mis-selling over the 2005-2012 periodon account of these mis-sales.46
Though there were no court cases filed by the investors, the government and the regulatortook note of the media reports and letters written to the Ministry of Finance to change
45Maximum commission of 40 percent in the first year is for insurers in the first 10 years of businessand for the other insurers it is 35 percent.
46Monika Halan, Renuka Sane, and Susan Thomas, “The case of the missing billions: estimating lossesto customers due to mis-sold life insurance policies”, in: Journal of Economic Policy Reform 17.4 (2014).
34 Mis-selling
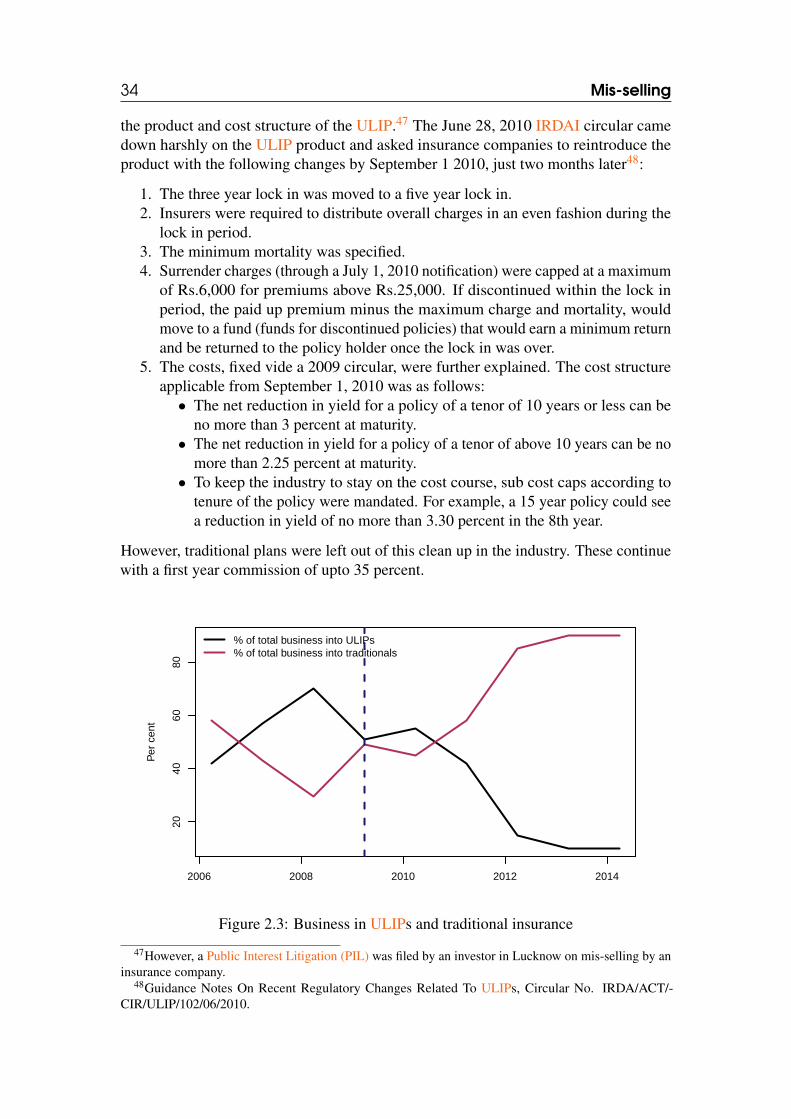
the product and cost structure of the ULIP.47 The June 28, 2010 IRDAI circular camedown harshly on the ULIP product and asked insurance companies to reintroduce theproduct with the following changes by September 1 2010, just two months later48:
1. The three year lock in was moved to a five year lock in.2. Insurers were required to distribute overall charges in an even fashion during the
lock in period.3. The minimum mortality was specified.4. Surrender charges (through a July 1, 2010 notification) were capped at a maximum
of Rs.6,000 for premiums above Rs.25,000. If discontinued within the lock inperiod, the paid up premium minus the maximum charge and mortality, wouldmove to a fund (funds for discontinued policies) that would earn a minimum returnand be returned to the policy holder once the lock in was over.
5. The costs, fixed vide a 2009 circular, were further explained. The cost structureapplicable from September 1, 2010 was as follows:
• The net reduction in yield for a policy of a tenor of 10 years or less can beno more than 3 percent at maturity.
• The net reduction in yield for a policy of a tenor of above 10 years can be nomore than 2.25 percent at maturity.
• To keep the industry to stay on the cost course, sub cost caps according totenure of the policy were mandated. For example, a 15 year policy could seea reduction in yield of no more than 3.30 percent in the 8th year.
However, traditional plans were left out of this clean up in the industry. These continuewith a first year commission of upto 35 percent.
2006 2008 2010 2012 2014
2040
6080
Per
cen
t
% of total business into ULIPs% of total business into traditionals
Figure 2.3: Business in ULIPs and traditional insurance
47However, a Public Interest Litigation (PIL) was filed by an investor in Lucknow on mis-selling by aninsurance company.
48Guidance Notes On Recent Regulatory Changes Related To ULIPs, Circular No. IRDA/ACT/-CIR/ULIP/102/06/2010.
35
Insurance sales immediately moved towards traditional plans that continued to payhigh commissions.49 This is reflected in Figure 2.3. This is also reflected throughan audit study of insurance agents carried out by Anagol, Cole, and Sarkar (2012).50
They find that insurance agents overwhelmingly recommend products which providehigh commissions to the agent and are unsuitable for the customers. This is greater forcustomers who appear to be less financially literate.
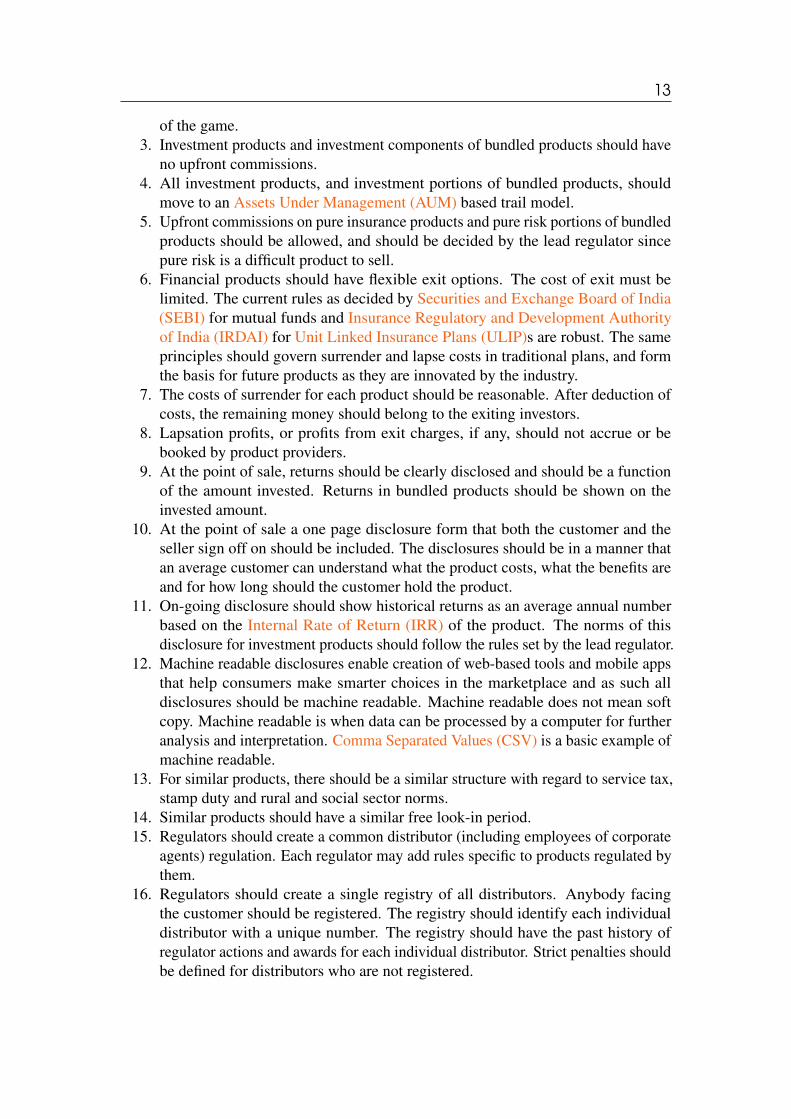
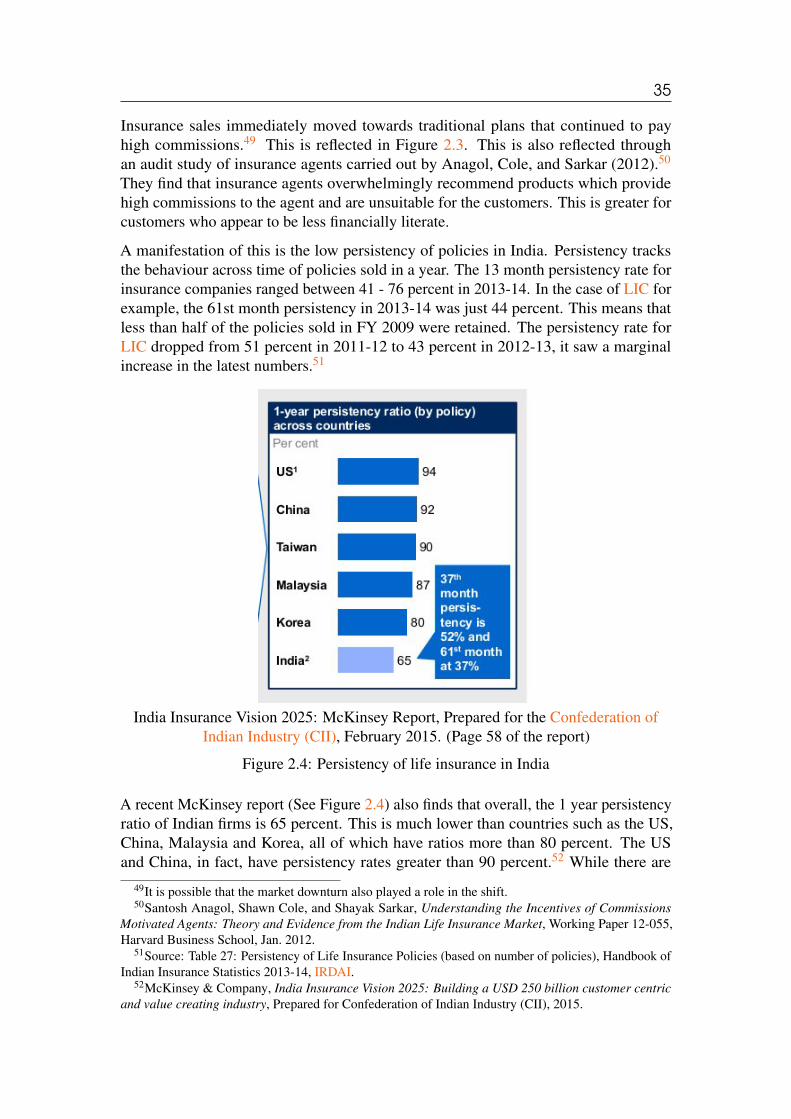
A manifestation of this is the low persistency of policies in India. Persistency tracksthe behaviour across time of policies sold in a year. The 13 month persistency rate forinsurance companies ranged between 41 - 76 percent in 2013-14. In the case of LIC forexample, the 61st month persistency in 2013-14 was just 44 percent. This means thatless than half of the policies sold in FY 2009 were retained. The persistency rate forLIC dropped from 51 percent in 2011-12 to 43 percent in 2012-13, it saw a marginalincrease in the latest numbers.51
India Insurance Vision 2025: McKinsey Report, Prepared for the Confederation ofIndian Industry (CII), February 2015. (Page 58 of the report)
Figure 2.4: Persistency of life insurance in India
A recent McKinsey report (See Figure 2.4) also finds that overall, the 1 year persistencyratio of Indian firms is 65 percent. This is much lower than countries such as the US,China, Malaysia and Korea, all of which have ratios more than 80 percent. The USand China, in fact, have persistency rates greater than 90 percent.52 While there are
49It is possible that the market downturn also played a role in the shift.50Santosh Anagol, Shawn Cole, and Shayak Sarkar, Understanding the Incentives of Commissions
Motivated Agents: Theory and Evidence from the Indian Life Insurance Market, Working Paper 12-055,Harvard Business School, Jan. 2012.
51Source: Table 27: Persistency of Life Insurance Policies (based on number of policies), Handbook ofIndian Insurance Statistics 2013-14, IRDAI.
52McKinsey & Company, India Insurance Vision 2025: Building a USD 250 billion customer centricand value creating industry, Prepared for Confederation of Indian Industry (CII), 2015.
36 Mis-selling
aspects such as income disruption for various reasons including failure of monsoons, orintermittent incomes which impact persistency, the report also says that mis-selling andpoor service by agents accounts for the poor performance. Another reason according tothe insurance industry for low persistency is the rural mandate on insurance as well asthe high rate of inflation over the last decade.53
2.3.3 Commissions and low sales in ETFs and NPS
In a world of high incentives, similar products with low incentives end up being ata significant disadvantage. ETFs and index funds are relatively low cost investmentproducts and offer returns comparable with their actively managed counterparts inthe mutual fund space. In fact, ETFs have several advantages over traditional mutualfunds, such as lower expense ratios, trading flexibility, tax efficiency, transparency, andexposure to diverse asset classes. While industry AUM data on index funds is not readilyavailable the ETF AUM at Rs.14,705 crore, is a small fraction of the total mutual fundAUM at about less than 2 percent. Gold ETFs comprise half of the total ETF assets.54
Similarly, it could be argued that one of the reasons that the private sector NPS markethas failed to take off is that banks and other distributors find it profitable to nudge thecustomer towards insurance plans that pay higher front end commissions or mutual fundschemes which comes with asset based trail fees.
2.4 The role of poor disclosures in mis-selling
When an agent, motivated by high powered incentives, tries to sell financial products,disclosure documents of the product should ideally guide the investor towards choosingthe product that is most suitable. Financial sector regulators in India, come to a jointview in 201355 that consumers must be provided with fair disclosure of information thatis required to make an informed transactional decision. Appropriate disclosures need tobe made both before the consumer enters into a financial contract and on a continuingbasis.
Today, mutual funds are required to disclose total commission and expenses paid todistributors, distributor-wise gross inflows (indicating whether the distributor is anassociate or group company of the sponsor(s) of the mutual fund), net inflows, averageassets under management and ratio of AUM to gross inflows on their respective websiteon an yearly basis. Insurance has its own requirements. The IRDAI mandates a standardon public disclosures by insurance companies with a view to strengthen the corporategovernance and market discipline of the insurers. Inspite of this, returns and costs arenot disclosed in a consistent manner by all insurance companies, and also relative to
53Rural mandates are discussed in Section 4.54Source:Table 4 : Mutual fund data for month of March 2015, AMFI monthly http://portal.
amfiindia.com/spages/ammar2015repo.pdf558th meeting of FSDC October 24, 2013standard on public disclosures by insurance companies
http://finmin.nic.in/fsdc/Press_release_8th_meeting_FSDC.pdf
37
mutual fund products. This makes it difficult for customers to understand the products,or compare similar products sometimes even between the same regulatory domains.
The Committee studied the benefit illustration of life insurance, mutual funds and NPS.The disclosures in the traditional plans of insurance particularly offer a greater scope forimprovement so as to provide greater transparency and clarity to the target customer. Ananalysis of issues arising from disclosures in a non linked participating plan and nonlinked non participating plan are illustrated below:
Non linked participating planWe begin with an example of a product with the following characteristics
• Annual Basic Premium: Rs.2,881 (exclusive of taxes)• Sum Assured: Rs.1,00,000• Age of joining as per benefit illustration: 30• Product term: 35 years.• Benefit illustrations provided based on 4 percent and 8 percent return.• Returns provided in the form of “bonus”.• Illustrations also provide detailed table with possible surrender values and death
benefit at various stages of the policy along with the benefit payable• The illustrations are only for 35 year tenure for a 30 year old.
From these illustrations, it is difficult to understand:
• That on maturity after 35 years, based on the 8 percent return illustration, theactual yield on premiums net of mortality cost would be 5.3 percent (or 2.4 percentbased on 4 percent return).
• That bonus is not an extra payment being made. In a participating plan, these arethe only returns a customer can expect to get.
• In case of premature exit during the policy tenure, the customer would not earnany return and instead lose a part of her principal. This is despite the fact that atable with surrender values illustrations is presented.
Legitimate returns when called bonus create a skew in the minds of investors. Thepractice of providing returns in the form of bonus is not an appropriate disclosure.
Insurance companies provide the surrender value illustration to the consumer as partof their disclosure tables. However, this does not reveal the full impact on consumer’snet return on account of the surrender charges. Table 2.5 illustrates the net yield on theinvestment (premiums after allocating mortality charges)56 in case of premature exit andon maturity for a 35 year tenure policy.
As the surrender value is less than the total premiums paid, it implies that the consumerdoes not get the guaranteed additions or bonus accrued till date as the same is payableonly on maturity or death. This fact is not obvious from illustrations provided.
56As mortality charges are not disclosed separately in a insurance plan which combines investment andinsurance, mortality charges are taken at Rs 3.00 per thousand for a 30 year old for 35 years (derived frommortality charges for a standalone term insurance plan by the same company). They are derived froma standalone term insurance product where the cost for a 30 year old for 25 year tenure is Rs 1.96 perthousand.

38 Mis-selling
Table 2.5: Annualised Net Yield in Case of Premature ExitThis table shows the net yield on premiums (net of mortality cost) in case of a premature exit for a 35 year tenure policy withan annual premium of Rs.2,881 and a sum assured of Rs.1,00,000. The customer age on joining is 30 years. For example,based on the above scenario, in case of surrender after 25 year at customer would have earned a net negative yield of -0.1percent on her investmentAt end of Tenure(in Years)
At 4% Returns At 8% Returns
5 -27.2% -23.5%10 -9.7% -6.3%15 -4.8% -2.6%20 -2.5% -0.9%25 -1.3% -0.1%30 -0.4% 0.6%35 2.4% 5.3%
What is actually required is a disclosure on (i) the annualised net returns earned byconsumer where returns are calculated on investments, ii) annualised net returns in caseof premature exit along with the surrender value; and (ii) the loss of the guaranteedadditions or bonus (based on whether it is a non participating or participating plan) forall the years in case of premature exit. Only when these disclosures are also made willthe customer be able to evaluate the product in its totality. These disclosures should thusbecome clear and central. A similar product sold in the United Kingdom (UK) requiresdisclosure of the reduction in investment growth rate after leaving out the cost of lifecover. This reduction is shown for scenarios covering surrender in early years as well asin later years of the policy tenure. This disclosure form is shown in Annexure E.
An identical investment product such as a mutual fund, when it illustrates returns, say ata similar 8 percent to the consumer, reflects these returns net of all its costs (Net AssetValue (NAV) is arrived at after costs) and the yield for the customer is therefore same.The only deduction that can happen from the NAV is on account of exit loads which areapplicable on pre-mature exit and are pegged as a percentage of the investment corpusand converge to about 1 percent in most cases.
Non linked non participating planAn analysis of issues arising from disclosures in a non linked participating non linkednon participating plan are illustrated below: Here the disclosures provide
• Annual premium: Rs.1,23,125 (exclusive of taxes)• Premium paying term: 5 years• Age of joining: 35• Policy tenure: 15 years• Sum assured is Rs.5,00,000 and the guaranteed maturity benefit is Rs.11,00,000.• The maturity benefit is stated as 220 percent of sum assured• Returns are provided as guaranteed additions at 8 percent of the sum assured.
From these illustrations, it is difficult to understand:
• That the net yield on premiums (net of mortality charges) over the policy tenure of15 years would be 4.71percent and not 8 percent. The mortality costs are taken atRs. 2.05 per thousand for a 35 year old male from the same company’s standaloneterm insurance plan.
• That the returns and maturity benefit when pegged to sum assured rather than

39
investment are misleading as sum assured is a function of mortality cost and notinvestment or rate of return. The guaranteed additions as a percentage of sumassured at 8 percent give an impression that this investment is generating 8 percentreturns.
• That the policy tenure is 15 years but the entire premium is collected over theinitial five years. However, the surrender value for the consumer, even after 5years is only 50 percent and starts growing beyond 55 percent in year 8.
These illustrations point out that returns expressed as percentage must refer to the rateof return on investment as is understood in case of bank deposits or mutual funds.Higher premium in initial years also places greater possibility of lapse in the initial years.Collecting higher premiums in initial years also allows higher commissions to be paid toagents and higher costs to be allocated for expenses.

3 — Policy response
The overwhelming evidence on mis-selling leads to a natural question: What actionshave regulators taken so far to address the problem? Before we study the Indian response,it would be useful to understand the thinking of regulators across the world on similarissues.
The demand for better regulation of financial product distribution has grown strongerafter the 2008 financial crisis. While a large focus of these discussions is the mortgageand credit market, especially in the United States of America (USA), the need forregulating distribution of other financial products is also well accepted. Reforms in eachcountry are always a function of the condition of financial markets at the time of reform.For example, markets in the USA are fragmented, similar to that in India. The reformsin distribution in the USA have thus reflected this nature of the markets. While theUSA has moved towards bringing consumer issues under a single Consumer FinancialProtection Bureau (CFPB), its success in doing so has been limited.
The two countries to have undergone the largest overhaul of their markets are the UKand Australia. Both function under a model where regulation is designed according tofunction i.e. prudential regulation and consumer protection, and not by product. Thisstructure of the market is itself a result of the problems faced by these economies inearly decades.
In the UK, the Financial Conduct Authority (FCA) oversees the distribution of financialproducts, while in Australia it is the ASIC. Both countries have moved away from acommissions based model of distribution, towards a fee-for-advice model. This has beenaccompanied by strong suitability requirements i.e. advisors have a duty to sell productsthat are suitable to customer requirements, making it imperative for them to understandcustomers situation and act in the interest of the customer. Reforms in the USA, UK,Australia, European Union (EU) and South Africa are described in Annexure C.
It is important to point out that in many of these markets, investment is often mandatorythrough retirement plans, and the penetration of investment products is also higher than

42 Policy response
in India. Agents play an important role in educating the customer about modern financeas well as financial products. To impose a blanket ban on commissions, therefore, maynot be the optimal response for a transition economy like India, as is the regulatorsstance today.
So how have Indian regulators responded in the form of policy changes that shouldprevent mis-selling? We describe the main reforms in the mutual fund and insurancemarkets in the past decade that directly address the problem described earlier. Thesehave consisted of changes in rules on commissions, changes in responsibilities of agents,changes in disclosures, changes in product structure itself, and aligning penal poweracross regulators
3.1 Changes in commissions
The first reform on distributor incentives was the ban on entry loads of mutual fundsby SEBI in 2009. This was done with a view to empower the investors in deciding thecommission paid to distributors in accordance with the level of service received, andto bring about more transparency in payment of commissions and to incentivise longterm investment.57 This led to a huge furore with the industry claiming that it wouldlose out to other products, and the entry load would result in the death of the industry.However, this has not been the case. The industry has largely turned itself around, andre-organised to a trail-based model where the incentive of the distributor gets alignedwith that of the customer. SEBI has required AMCs to provide direct plans with lowerTER for investments not routed through intermediaries. A recent proposal by AMFI hassuggested a commission of 1% upfront to be followed by all AMCs.
Similar rule change on ULIPs were brought about by the IRDAI in 2009. The IRDAImandated that the cap on charges will be based on the difference between gross and netyields of any product. For insurance contracts which are of a tenor of less than or equalto 10 years duration, the difference between gross and net yields cannot be more than300 basis points. Of these, fund management charges cannot exceed 150 basis points.For contracts whose tenor is more than 10 years, the difference between gross and netyields cannot exceed 225 basis points, of which the fund management charges cannotexceed 125 basis points.58 Further changes to the ULIP product structure were made in2011.59 resulting in a major clean up of the product.
The commissions structure of the traditional endowment product has not undergone anychange. Today, this product earns the highest commission, and as described in earliersections, has become popular once again. The Insurance Laws Amendment Act, 2015has led to the removal of the ceiling of 40 percent on the maximum commission, fee orremuneration. IRDAI now has the power to lay down the structure of commission/bro-kerage for intermediaries as well as the power to determine the expenses of management
57SEBI, Mutual Funds- Empowering investors through transparency in payment of commission andload structure, SEBI/IMD/CIR No. 4/ 168230/09, June 2009.
58IRDA, Unit linked products - Cap on charges, Circular No: 20/IRDA/Actl/ULIP/09-10, July 2009.59IRDA, Annual Report, 2010-11, 2011.
43
which can be incurred by insurers. This may lead the regulator to lower commissions onthese products in the near future.
Another recent policy response related to commissions pertains to using claw backs as atool to curb mis-selling, mainly in open ended products. Claw backs allow for upfrontcommissions to be recouped from the agent in case the consumer exits partially or fullyfrom the product before a predefined tenure. AMFI’s code of conduct requires agents torefund to mutual funds, incentives/ commissions which are subject to claw back as perSEBI regulations. With effect from January 1, 2013, all upfront commissions paid todistributors are liable to complete and/ or proportionate clawback in case a consumerswitches from a Regular Plan (agent sold plan) to a Direct Plan (offered directly by themutual fund). The concept of claw back has also been extended by SEBI to additionaldistribution expenses permitted on account of inflows from beyond the top 15 cities.These are subject to clawback if such investments are redeemed within one year fromthe date of investment.
3.2 Changes in agent responsibilities
In September 2011, SEBI released a concept paper for regulating investment advisers,where it separated the role of an adviser from that of a distributor.60 SEBI’s proposalincluded the formation of a Self Regulating Organisation (SRO) which will regulateadvisers who will charge clients for advise on various products. These advisers willnot be remunerated by product providers. The Securities and Exchange Board of India(Investment Advisers) Regulations, 2013 were notified in January 2013.61
SEBI also put in place the Employee Unique Identification Number (EUIN), which is analphanumeric code assigned to each individual advising/selling to the customer. Thisnumber stays with this individual as he moves jobs. This number can be used to trackeach sale back to the person who was credited with the sale. This makes it possible tohold agents responsible for their sales.
In 2011, the IRDAI issued guidelines to enhance the persistence of life insurancepolicies.62 The new guidelines mandated a persistence of 50 percent for agency renewalstill the financial year 2014-15, and 75 percent persistence after that.63 By requiringagents to achieve at least a 50 percent persistency rate, it was hoped that agents wouldbe more circumspect in how they sold the policy, and in following-up with consumersabout their premium payments. However, in February 2014, the IRDAI passed a newguideline64 which allowed for renewal of agent licenses without regard to the persistency
60For more details, refer to SEBI, Concept Paper on Regulation of Investment Advisors, Concept Paper,Securities and Exchange Board of India, 2011.
61SEBI, Securities and Exchange Board of India (Investment Advisers) Regulations, 2013, tech. rep.No. LAD-NRO/GN/2012-13/31/1778, SEBI, 2013.
62Section 14(2) of the IRDA Act, 1999.63IRDAI Journal, August 2011, Page 12.64Guideline: IRDA/Life/GDL/057/02/2014, http://www.irda.gov.in/ADMINCMS/cms/
whatsNew_Layout.aspx?page=PageNo2207&flag=1
44 Policy response
record of the agents. From July 1, 2014, all life insurance companies will have their owncompany specific persistency criterion for renewal of individual and corporate agents.
3.3 Changes related to disclosures
In order to enhance transparency and improve the quality of the disclosures, SEBI hasintroduced many rules on mutual fund advertising and disclosures over the years.
The AUM from different categories of schemes such as equity schemes, debt schemes,and others, AUM from B-15 cities, contribution of sponsor and its associates in AUMof schemes of their mutual fund, AUM garnered through sponsor group/ non-sponsorgroup distributors are required to be disclosed on monthly basis on respective website ofAMCs and on consolidated basis on website of AMFI.65
When advertising scheme returns, AMCs have to show point to point returns on astandard investment of Rs.10,000 in addition to Compounded Annual Growth Rate(CAGR) returns (if the scheme has been in existence for more than 3 years).66 This wasdone to give a more complete standardised picture of fund performance.
Further, AMCs have to show the 12 month returns (as many 12 month period as possible)since inception for the last 3 years along with the benchmark returns.
To standardise the advertising rule for scheme returns, SEBI has mandated fund housesto show the scheme’s performance against a broad index like Sensex or Nifty (for equityschemes) and 10 year Government of India (GOI) security (for long term debt funds)and 1 year Treasury bill returns for short term debt funds.
While advertising the performance of a particular fund, AMCs have to also show theperformance of all other schemes managed by the fund manager of that particularscheme. If the fund manager is managing more than six schemes, then AMCs haveto mention the total number of schemes managed by the fund manager along with theperformance data of three top and three bottom performing schemes.
In 2013, SEBI came out with another rule called scheme labelling. To depict the level ofrisk involved in mutual funds, AMCs are required to put colour code boxes in all schemesaccording to the objective of the scheme. AMCs are supposed to put colour codes inall their advertisement materials, front page of initial offering application forms, KeyInformation Memorandum (KIM), Scheme Information Document (SID)s and commonapplication forms. In April, 2015, colour codes were replaced by a new “Riskometer”which would more appropriately depict the level of risk in any specific scheme.67
65Press Release: http://www.sebi.gov.in/cms/sebi_data/pdffiles/27383_t.pdf66This is as per information compiled on www.cafemutual.com67SEBI Circular on Product Labeling in Mutual Funds, CIR/IMD/DF/4/2015, April 30, 2015, http:
//www.sebi.gov.in/cms/sebi_data/attachdocs/1430388883147.pdf
45
3.4 Changes in the product structure
One of the biggest changes to product structures (including disclosures) has been theregulations regarding index linked insurance plans ULIPs and Variable Linked Product(VIP)s)68 and non linked insurance plans69 by the IRDAI. These included regulations oncharges, reduction in yield, discontinuance terms, surrender value, partial withdrawals,top-ups among others. Most importantly, these regulations required a separation ofassets i.e. they required the insurer to earmark assets for each VIP on the linked platformseparately, disclose the policy account value on a daily basis and do a daily disclosureof the NAV of ULIPs. The regulations for linked products also suggested that insurersand the life council move towards independent ratings of ULIPs. In case of VIP on thenon linked platform, insurer were required to earmark assets for each VIP separately,disclose the policy account value on a daily basis and compute and disclose the RIY.
3.5 Aligning penal power across regulators
The levels of penalties and regulatory action on penalties in the past has varied fromregulator to regulator creating different regulatory regimes. In the last two years 2013-15,some thinking has gone into aligning penalties and the penal powers of SEBI, IRDAIand PFRDA.
PFRDA Act, 2013 being a new legislation came in with strong penal provisions. SEBI’spenal powers were last upgraded through the Securities Laws(Amendment) Act, 2014.The antiquated penal powers of IRDAI were also finally revised through the recentInsurance Laws (Amendment) Act, 2015, in a move to align them with the powers ofSEBI and PFRDA. This is illustrated by two examples. First, IRDAI has the powerto remove the managerial persons of the insurance companies in case its affairs werebeing managed to the detriment of the interest of the policyholders. However, in casethe order of IRDAI were contravened, till recently, the penalty was limited to Rs.250per day of the contravention. This has now been brought in line with SEBI’s powersand the revised penalty is one lakh rupees for each day during which such contraventioncontinues or one crore rupees, whichever is less. Second, rebating of commissions is aknown practice is life insurance. Section 41 of the Insurance Act, 1938 forbids any kindof rebating. However, the maximum penalty for rebating was only Rs.500 which hasrecently been increased to rupees ten lakhs.
SEBI can levy penalties of Rs.1,00,000 per day or penalties upto rupees one crore onmutual fund for failure to comply with the regulations.70
68Insurance Regulatory and Development Authority (Linked Insurance Products) Regulations, 201369Insurance Regulatory and Development Authority (Non-Linked Insurance Products) Regulations,
201370Section 15D, Securities and Exchange Board of India Act, 1992, as amended by the Securities
Laws(Amendment) Act, 2014
46 Policy response
3.6 Judicial pronouncements
The courts in India regard mis-selling to be a major concern in the financial sector.71 Inrelation to financial products, courts and tribunals have discussed mis-selling in a varietyof cases although in many of such cases, the term mis-selling has not been used to referto the practice of deceiving consumers through non-disclosure or mis-representation. Inthis regard, different principles of law (typically consumer protection and contract) havebeen utilized to provide relief to the customer against mis-selling.
Mis-selling claims are typically based on violation of Consumer Protection Act (CPA)or regulations issued by the relevant regulator. In a recent 2014 decision (Virendra PalKapoor v. Union of India), the court held the insurance company liable under the IRDAI(Protection of Policyholders’ Interest) Regulations, 2002 for misrepresentation of thereturns under policy and directed the IRDAI to re-examine each and every insurancepolicy of the insurance company to ensure adherence to the guidelines laid down by thecourt in the said case.
Mis-selling in the form of alteration of fundamental attributes of a mutual fund schemewithout the consent of the participant, non-disclosure and unsuitability of the schemehave been held by Indian courts/ tribunals to be in violation of the applicable regulationssuch as SEBI (Prohibition of Fraudulent and Unfair Trade Practices relating to Secu-rities Market) Regulations, 2003 and the IRDA (Protection of Policyholders Interest)Regulations, 2002 and relief has been granted to the consumer.
Consumer cases on mis-selling have been based on allegations of fraud, misrepresen-tation and unreasonableness of contracts involving financial products. For instance,the Madras High Court while stressing on the requirement of good faith in insurancecontracts has held that suppression of material facts relating to an insurance policy isa violation of the contractual requirement of consensus ad idem (agreeing to the samething in the same sense) between the parties.
Mis-selling also manifests in the form of adhesion contracts where consumers do nothave the right to bargain the terms and conditions of the contract. Adhesion contractshave been considered as an unfair trade practice under the CPA, since there is a lack ofdisclosure and also an information asymmetry between the consumers and the sellers.In various cases, the courts have considered unilateral change of terms and conditions asan unfair trade practice and have given relief to the consumer.
Indian courts have developed various safeguards against mis-selling in an attempt to offera favourable judicial environment to the consumers. These include non-enforcementof exemption clauses favoring the company/intermediary and usage of the principle ofcontra proferentum (sales contracts favoring the seller to be interpreted in favor of thebuyer).
71We thank Vidhi Centre For Legal Policy for inputs on this section.
47
3.7 Policy reports
Besides actions by regulators, there have also been initiatives to think through theproblem in its entirety. One of the more recent efforts was the Committee on InvestorAwareness and Protection set up by the High-Level Coordination Committee on FinancialMarkets (HLCCFM) to strengthen the ongoing efforts for imparting financial educationand promoting investor protection which submitted its report in March 2010.
The Committee’s view was that problems in distribution led to lack of faith about marketlinked products among Indian households, which further led to low participation. Itemphasised the importance of a trustworthy, regulated retail intermediation industry,with common minimum standards to facilitate the transition to greater household partici-pation in financial markets. The Committee was the first to treat the sale of commissionsbased products as advice.72 The other aspect studied in great detail by the committeewas investor education. It believed that investor protection and investor education wouldnot work in isolation, and needed to be thought of together.
Sahoo and Sane (2011) describe the main recommendations of the committee. They areas follows:
1. All retail financial products to go no load by April 2011;2. All financial advisers to undergo a minimum knowledge-linked training program, and
selling of more complicated products to require a higher level of education ;3. All financial advisers to be governed by a code of ethics that is standard across products
and organisations;4. All products to abide by a disclosure template which will display the most important
terms and conditions of the products, and the amount an adviser earns from the sale andmaintenance of the product;
5. The sales process to be documented, along with customer profiling that took place beforea product was sold;
6. A common interface for grievance redress; and7. Financial literacy modules for Advisers, School students, Post Class XII students, and
other such entities to be developed by the Financial Literacy arm. The Financial Literacyarm to be the focal point for all financial literacy initiatives in the country.
8. Setting up of the Financial Well-Being Board of India (FINWEB). The goal of the organ-isation would be to bring order to the adviser market and building a financially literatecommunity. It will consist of two arms: one SRO arm that will be responsible for bringingadvisers under one common standard, and a Financial Literacy arm that will work onpromoting financial literacy.
The report tabled in 2010 was released to the public only in 2014. While none of therecommendations got formally implemented, regulators made several changes on thebasis of the recommendations. In fact, while the committee was debating the issue ofbanning upfront commissions, SEBI announced them in August 2009. IRDAI announcedchanges in the product structure of ULIPs in 2010 that drastically reduced upfronts from40 per cent to an average of about 9 percent. The draft IFC also credits its consumerprotection approach to the report.
72See section 3.3, Committee on Investor Awareness and Protection, Minimum Common Standards forFinancial Advisers and Financial Education, A Consultation Paper, Chaired by D. Swarup, ChairmanPFRDA, Government of India, 2010.
48 Policy response
3.8 The Indian Financial Code
The most important change in consumer finance has been the draft IFC which proposesto bring in wide-sweeping reforms in the legal and regulatory framework for the Indianfinancial sector.73 Three design features of the IFC are particularly relevant from thepoint of view of the problems outlined so far.74
1. The IFC envisages two super regulators, the FA and the RBI. The functions ofthe IRDAI, SEBI and PFRDA will be subsumed under the FA. This will directlyaddress the problems of regulatory arbitrage discussed earlier.
2. Under the IFC, consumer protection is considered as one of the core functions ofregulation. The draft IFC creates the following legislative rights for all consumersof financial services:
(a) The right to expect professional diligence from financial service providers.(b) Protection against unfair contract terms and unfair conduct.(c) Right that the financial service provider shall maintain the confidentiality of
the information provided by the consumer.(d) Right to get fair disclosure from the financial service provider.(e) Right to a dispute settlement system that must be maintained by the financial
service provider.These promise to bring in a legal and regulatory framework for consumer protec-tion in a way that has not been done before.
3. The IFC envisages the setting up of a FRA which will accepts complaints regardingall financial services. The FRA will mediate disputes and in the event of failure ofthe mediation, order the merits of the dispute through a process of adjudication.
The IFC gives certain rights and protections to retail consumers. Retail consumers areindividuals and small organisations. It recognises that market failures resulting frominformation asymmetries and bargaining power differences are accentuated for suchconsumers. Moreover, such consumers also face enormous coordination challenges,because it is usually very difficult for a large number of small value consumers toinfluence a financial service provider to do the right thing in their interest.
The substantive provisions of the IFC will only take effect when the law is enacted.However, the Ministry of Finance (MoF) and all the regulators agencies have decidedto adopt the non-legislative elements of the draft IFC articulated in the Handbook onadoption of governance enhancing and non-legislative elements of the draft IFC. Aportal is being designed whereby regulators will be required to reveal if they have metwith specific Handbook requirements. The process to bring forward in time the gains ofthe IFC has already been set in motion. The Government also announced the Task Forceon FRA (FRA) to lay down the road map for setting up the FRA.75
73This is the result the FSLRC under the chairmanship of Justice Srikrishna. See Justice B. N.Srikrishna, Financial Sector Legislative Reforms Commission, vol. I and II, Ministry of Finance, Mar.2013.
74See Ila Patnaik and Ajay Shah, Reforming India’s Financial System, tech. rep., Carnegie Endowmentfor International Peace, Jan. 2014, for an introduction to the IFC.
75DEA, Task Force on Financial Redress Agency, Office Order No 16/3/2013-FSLRC (Part I), FSLRCDivison, Department of Economic Affairs, Ministry of Finance, Government of India, May 2015.
4 — What is missing?
The policy response by regulators most of the times has been incremental. It appearsthat regulators have responded to each crisis at a time. This has meant that the policychanges do not add up to a comprehensive and internally consistent strategy for consumerprotection. For example, though the regulations and circulars discuss the concept ofmis-selling and have prescribed guidelines to curb it, the term mis-selling has beendefined only by the SEBI in the SEBI (Prohibition of Fraudulent and Unfair TradePractices relating to Securities Market) Regulations, 2003.
One example where problems remain unaddressed is the mis-selling through the bankingchannel. The RBI has made some recent moves towards publishing a charter of consumerrights76, but these have yet to be translated into changes on the ground. In severalcases the regulators have not gone the whole distance. For instance, the provisions ofthe IRDA (Non-Linked Product) Regulations, 2013 and the IRDA (Linked) ProductRegulations, 2013 are yet to be extended to traditional endowment (participating andnon-participating) plans as well. As of date, there has been no move towards imposingproduct suitability obligations, or increases in the legal liabilities on companies for mis-sale of products by their agents. Reported instances of the regulator taking cognisanceof mis-selling and penalising the company/intermediaries have also been low and thepenalty meted out is paltry (on a case to case complaint basis).
Finally, regulatory changes also do not address the heart of the problem i.e. mis-alignment of incentives for agents that distribute products as well as differences indisclosures across different regulatory domains. We discuss them below.
Issues in commissions As described earlier, large differences in the cost structures oftraditional insurance plans vis-a-vis mutual funds and vis-a-vis ULIPs remain.This has meant that the sale of insurance products is far more lucrative relative tothe sale of ULIPs or mutual funds. Similarly ETFs and NPS get ignored by retailadvisors.
76https://www.rbi.org.in/scripts/BS_PressReleaseDisplay.aspx?prid=32667
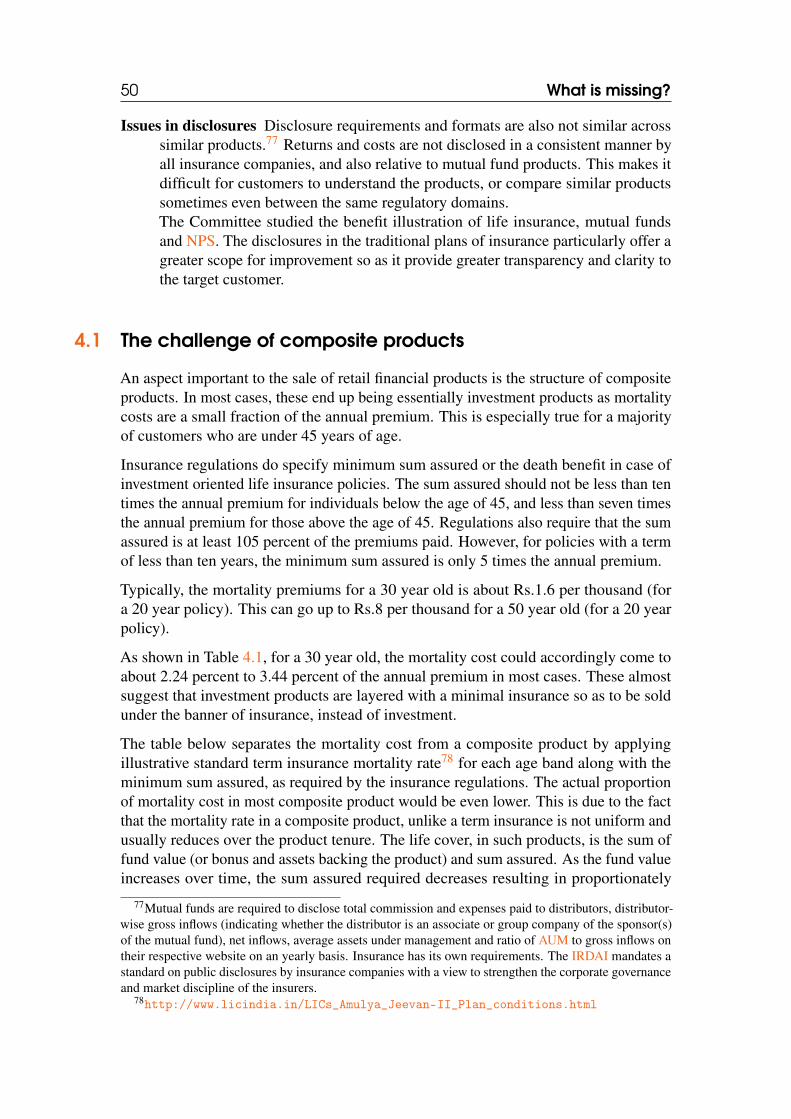
50 What is missing?
Issues in disclosures Disclosure requirements and formats are also not similar acrosssimilar products.77 Returns and costs are not disclosed in a consistent manner byall insurance companies, and also relative to mutual fund products. This makes itdifficult for customers to understand the products, or compare similar productssometimes even between the same regulatory domains.The Committee studied the benefit illustration of life insurance, mutual fundsand NPS. The disclosures in the traditional plans of insurance particularly offer agreater scope for improvement so as it provide greater transparency and clarity tothe target customer.
4.1 The challenge of composite products
An aspect important to the sale of retail financial products is the structure of compositeproducts. In most cases, these end up being essentially investment products as mortalitycosts are a small fraction of the annual premium. This is especially true for a majorityof customers who are under 45 years of age.
Insurance regulations do specify minimum sum assured or the death benefit in case ofinvestment oriented life insurance policies. The sum assured should not be less than tentimes the annual premium for individuals below the age of 45, and less than seven timesthe annual premium for those above the age of 45. Regulations also require that the sumassured is at least 105 percent of the premiums paid. However, for policies with a termof less than ten years, the minimum sum assured is only 5 times the annual premium.
Typically, the mortality premiums for a 30 year old is about Rs.1.6 per thousand (fora 20 year policy). This can go up to Rs.8 per thousand for a 50 year old (for a 20 yearpolicy).
As shown in Table 4.1, for a 30 year old, the mortality cost could accordingly come toabout 2.24 percent to 3.44 percent of the annual premium in most cases. These almostsuggest that investment products are layered with a minimal insurance so as to be soldunder the banner of insurance, instead of investment.
The table below separates the mortality cost from a composite product by applyingillustrative standard term insurance mortality rate78 for each age band along with theminimum sum assured, as required by the insurance regulations. The actual proportionof mortality cost in most composite product would be even lower. This is due to the factthat the mortality rate in a composite product, unlike a term insurance is not uniform andusually reduces over the product tenure. The life cover, in such products, is the sum offund value (or bonus and assets backing the product) and sum assured. As the fund valueincreases over time, the sum assured required decreases resulting in proportionately
77Mutual funds are required to disclose total commission and expenses paid to distributors, distributor-wise gross inflows (indicating whether the distributor is an associate or group company of the sponsor(s)of the mutual fund), net inflows, average assets under management and ratio of AUM to gross inflows ontheir respective website on an yearly basis. Insurance has its own requirements. The IRDAI mandates astandard on public disclosures by insurance companies with a view to strengthen the corporate governanceand market discipline of the insurers.
78http://www.licindia.in/LICs_Amulya_Jeevan-II_Plan_conditions.html
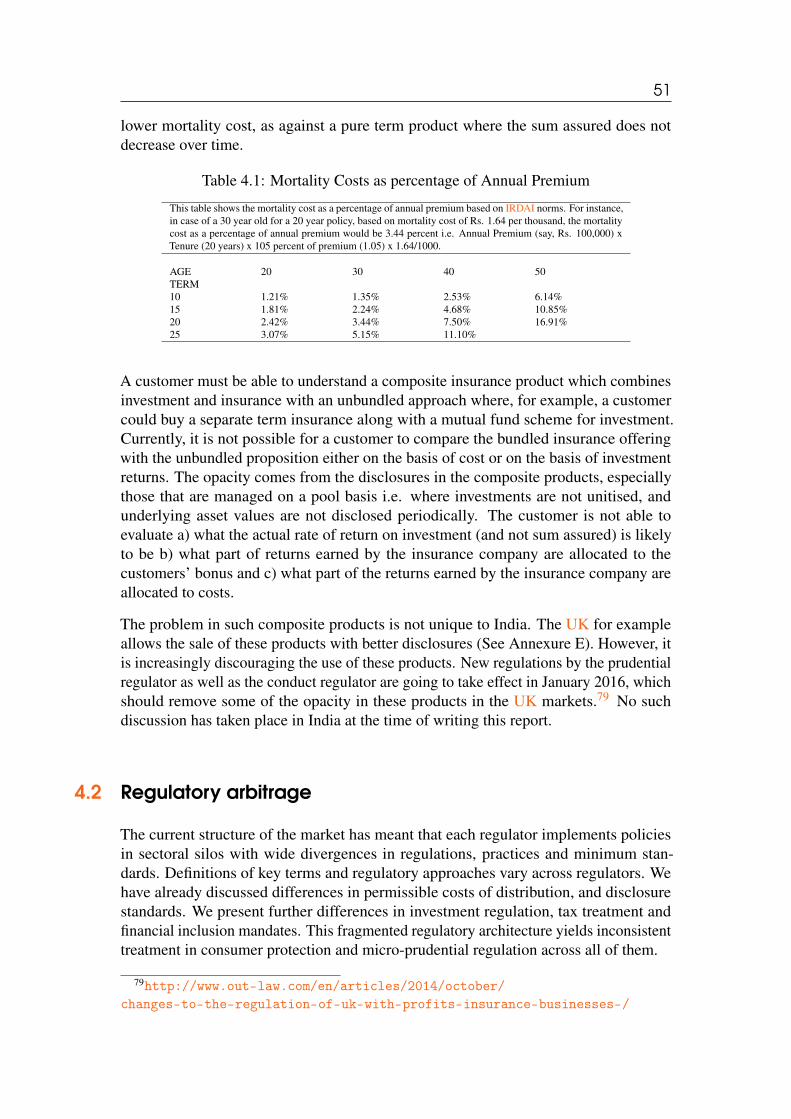
51
lower mortality cost, as against a pure term product where the sum assured does notdecrease over time.
Table 4.1: Mortality Costs as percentage of Annual Premium
This table shows the mortality cost as a percentage of annual premium based on IRDAI norms. For instance,in case of a 30 year old for a 20 year policy, based on mortality cost of Rs. 1.64 per thousand, the mortalitycost as a percentage of annual premium would be 3.44 percent i.e. Annual Premium (say, Rs. 100,000) xTenure (20 years) x 105 percent of premium (1.05) x 1.64/1000.
AGE 20 30 40 50TERM10 1.21% 1.35% 2.53% 6.14%15 1.81% 2.24% 4.68% 10.85%20 2.42% 3.44% 7.50% 16.91%25 3.07% 5.15% 11.10%
A customer must be able to understand a composite insurance product which combinesinvestment and insurance with an unbundled approach where, for example, a customercould buy a separate term insurance along with a mutual fund scheme for investment.Currently, it is not possible for a customer to compare the bundled insurance offeringwith the unbundled proposition either on the basis of cost or on the basis of investmentreturns. The opacity comes from the disclosures in the composite products, especiallythose that are managed on a pool basis i.e. where investments are not unitised, andunderlying asset values are not disclosed periodically. The customer is not able toevaluate a) what the actual rate of return on investment (and not sum assured) is likelyto be b) what part of returns earned by the insurance company are allocated to thecustomers’ bonus and c) what part of the returns earned by the insurance company areallocated to costs.
The problem in such composite products is not unique to India. The UK for exampleallows the sale of these products with better disclosures (See Annexure E). However, itis increasingly discouraging the use of these products. New regulations by the prudentialregulator as well as the conduct regulator are going to take effect in January 2016, whichshould remove some of the opacity in these products in the UK markets.79 No suchdiscussion has taken place in India at the time of writing this report.
4.2 Regulatory arbitrage
The current structure of the market has meant that each regulator implements policiesin sectoral silos with wide divergences in regulations, practices and minimum stan-dards. Definitions of key terms and regulatory approaches vary across regulators. Wehave already discussed differences in permissible costs of distribution, and disclosurestandards. We present further differences in investment regulation, tax treatment andfinancial inclusion mandates. This fragmented regulatory architecture yields inconsistenttreatment in consumer protection and micro-prudential regulation across all of them.
79http://www.out-law.com/en/articles/2014/october/changes-to-the-regulation-of-uk-with-profits-insurance-businesses-/
52 What is missing?
4.2.1 Investment regulation
One crucial area of divergence is investment regulation. Regulatory norms do notprescribe the investment pattern for mutual funds. Instead, they specify norms fordiversification for different type of funds.80 Investments by insurance companies aresubject to a prescriptive model with a substantial portion of funds channeled intogovernment related investments. Rules require traditional endowment plans to invest notless than 50 percent of the fund in government securities or other approved securities, ofwhich not less than 25 percent of the fund should be invested in government securities.The investment norms differ for non linked life business, pension and annuity plans andULIP plans.81 The investment guidelines for NPS for private citizens allow investmentin government securities (asset class G), corporate bonds (asset class C) and equities(asset class E) in various proportions (subject to condition that investment in equitycannot exceed 50 percent of the investible funds).
Fragmentation on investment guidelines has led to a loss of scale and scope that could beavailable from a seamless financial market with all its attendant benefits of minimisingthe intermediation cost. To illustrate, the AUM managed by life insurance companies is165 percent of the AUM of mutual fund industry. The assets under the nascent NPS arealready touching 63 percent of the AUM of the mutual fund industry.
4.2.2 Tax treatment
The other area of difference is the tax treatment of investment products. The IncomeTax Act, 1962 allows for certain tax deductions at the point of entry, during holding,and at exit (which differs based exit at maturity or premature withdrawal). These taxdeductions are not applied consistently across all types of products and, as a result,similar products have to compete under very different tax regimes. In the case of NPSfor example, there is a requirement that the deduction cannot exceed 10 percent of theemployee salary in the previous year.82 The tax-deductibility of employer contributionsis restricted to 10 percent of the employee’s salary in the case of the NPS.83 This is aninferior tax treatment when compared to other recognised funds where the employer’scontribution is exempt from tax up to a limit of 12 percent of the employee’s salary.84
4.2.3 Financial inclusion
Concern for financial inclusion has manifested itself in the form of tax-sponsoredschemes, as well as policy mandates for industry players.
The most recent efforts include seeding bank accounts, providing credit linked insurance,and pension accounts to low income workers through government led initiatives. The
80To illustrate, in an equity fund, the investment in equity shares or equity-related securities of a singlecompany must not exceed 10 percent of the net assets of the scheme. Mutual funds are also not permittedto advance any loans.
81IRDA (Investment)(Fourth Amendment)Regulations 200882Section 80CCD(1), IT Act.83Section 80CCD(2), IT Act.84Rule 6, Part A, Schedule IV, IT Act.

53
Pradhan Mantri Jan Dhan Yojana (PMJDY) aims to provide bank account to everyhousehold in the country and make basic banking services facilities.85 Life and accidentinsurance coverage rides on these bank accounts through the Pradhan Mantri JeevanJyoti Bima Yojana (PMJJBY) and Pradhan Mantri Suraksha Bima Yojana (PMSBY).86
Pension initiatives include the NPS-Lite and the recent Atal Pension Yojana (APY).87
While the government has begun subsidised programs, regulators response over the lastseveral decades has been to mandate regulated entities to reach out to “underserved”areas. The differences between SEBI and IRDAI are significant.
SEBI does not mandate financial inclusion obligations but it has been initiating stepsto encourage mutual funds to deepen the markets beyond the top 15 cities. This hasbeen done by relaxing the norms on expenses and commissions for business generatedbeyond the top 15 cities. Mutual funds are also required to annually set apart at least 2basis points on daily net assets within the maximum limit of TER for financial literacyand investor education.88 Mutual funds are required to disclose in the half yearly trusteereport to SEBI regarding the investor education and awareness initiatives undertaken.
IRDAI, on the other hand, has responded by rural mandates, requiring insurers tounderwrite 25 percent policies in the rural sector. IRDAI’s focus to develop the ruralmarkets began as early as 2002 when it first developed rural and social sector obligationnorms requiring insurers to achieve percentage of polices to be sold in rural areas, andnumber of lives to be covered in the social sector.89 This is seen by the insurance industryto create additional cost structures for the industry which impacts their profitability andcompetitiveness, especially, if other sectors, primarily mutual funds, do not have thesame policy compulsions. It is also not clear whether the new insurance programs,PMJJBY and PMSBY, will impose additional costs on insurance companies.
The concern about financial exclusion has been an over-riding feature of policy in theretail finance sector. Cost-benefit analysis of such policies should be undertaken on anon-going basis.
4.2.4 Multiplicity of regulations
Another factor that makes it difficult to resolve the issue the multiplicity of regulations,in the form of regulations, circulars, notifications, guidelines and orders issued by eachsectoral regulator. This has created a general environment of confusion and perhapscontributed to uncertainty in respect of the legal status of their applicability to thefinancial institutions, banks and the intermediaries (advisers and distributors). Forexample, though the regulations and circulars discuss the concept of mis-selling andhave prescribed guidelines to curb it, the term mis-selling has been defined only bythe SEBI in the SEBI (Prohibition of Fraudulent and Unfair Trade Practices relating to
85See PMJDY website for details: http://www.pmjdy.gov.in/86See PMJJBY website http://financialservices.gov.in/PMJJBY.asp and PMSBY website
http://financialservices.gov.in/PMSBY.asp for details.87See URL:http://financialservices.gov.in/APY.asp for details.88Regulation 52 of the Regulations for investor education and awareness initiatives.89See IRDA (Obligations of Insurers to Rural and Social Sector) Regulations, 2002.

54 What is missing?
Securities Market) Regulations, 2003).
Distributors often get regulated by more than one regulator. This creates confusion as towhich regulator actually has oversight on the sales process. Similarly, there are multipleforums that have jurisdiction over mis-selling and consumer protection matters and theapplicable forum depends on the financial product mis-sold. These forums have differentcapacities and processes. Redress capacities at different regulators have also evolveddifferently.

5 — Policy choices for India
Easy access to adequate capital, both long and short term, is one of the key driversof economic growth.90 A crucial part of this process is the conversion of long-termhousehold savings into investment, thereby providing funds for productive business. Onone hand, household savings in India are almost 20 percent of GDP91 On the other, firmsconsistently report being credit constrained.92 Given the importance of retail financialmarkets in facilitating the flow of funds between households and firms, and the specificmandate93 of the Committee, the policy goals as follows:
1. To create an environment of competitive pressure on industry: Competitive pres-sure should enable the development of large scale distribution networks that areable to service across India. Such an increase in capacity should also drive downoverall costs of reaching to households. The Committee believes that the twoimportant aspects towards such a market include:
• Elimination of regulatory arbitrage• Elimination of hidden charges and fees
2. To create an incentive compatible compensation structure: Overall costs donot ensure that customers are sold the most appropriate products. Ultimately,the compensation structure should create incentives for intermediaries to enrollcustomers into those plans that best meet their needs. This will also generate trust
90Ross Levine, “Finance and Growth: Theory and Evidence”, in: Handbook of Economic Growth,ed. by Philippe Aghion and Steven N. Durlauf, Amsterdam: Elsevier, 2005, pp. 865–934; Michael D.Bordo and Peter L. Rousseau, “Historical evidence on the finance-trade-growth nexus”, in: Journal ofBanking & Finance 36.4 (Apr. 2012), pp. 1236–1243.
91RBI, Reserve Bank of India Annual Report, tech. rep., Reserve Bank of India, 2014.92Abhijit Banerjee and Esther Duflo, “Do Firms Want to Borrow More? Testing Credit Constraints
Using a Directed Lending Program”, in: The Review of Economic Studies 81.2 (2014), pp. 572–607.93As described earlier, the mandate of the committee is to a) Address the issue of providing level
playing field in the commission / incentive structure of financial products, b) Suggest policy measures suchthat differential regulatory norms do not favour any particular financial product and prevent mis-selling, c)Address issues with respect to hidden costs and identical financial products under different regulatoryjurisdiction; and d) Rationalise the incentive structure across financial products.
56 Policy choices for India
in the market that is important for continued household participation.
The Committee considered three potential regulatory solutions. These are as follows:
Complete ban on all kinds of commissions The Committee deliberated on the sug-gestion of a complete ban on commissions. This is especially pertinent becauseseveral economies such as the UK, EU and Australia have already banned com-missions, especially upfront commissions on the sale of retail financial products.94
While it was agreed that commissions can influence distributors to not act in theinterest of the customer, it was also felt that commissions play an important role inincentivising the distributors to seek new customers. The agents role in educatingcustomers, doing risk evaluation and primary underwriting, long term servicingand claims assistance were emphasised by the life insurance representatives.95
Considering the low access of financial markets, it was felt that this was animportant function that could not be ignored. These views were also stronglyexpressed by the association of insurance and mutual fund distributors to theCommittee. For example, the Financial Intermediaries Association of India (FIAI)expects that financial distributors will play a critical role for channelization ofsavings in proper asset classes for long term wealth creation, and a no-commissionsworld will make it difficult for intermediaries to function.96
The Indian market also suffers from a lack of a market for advice. Retail customersare not accustomed to paying for holistic advice. A body of financial advisorscapable on advising on the entire portfolio of products is also not available. It was,therefore, felt that a complete ban on commissions in such an environment wouldbe counter-productive.
Complete freedom on commissions and rules on disclosures This would be accom-panied by a) regulations that mandate improved disclosure, and b) Regulationsthat increase penalties on mis-sales.The Committee also considered leaving the determination of the commissionsentirely to the market. In this scenario, market players would be free to determinethe amount as well as the type of commission they pay to intermediaries. Therecommendations would only concern themselves with mandating improved dis-closure, and designing increased penalties on mis-sales. In this set-up, improveddisclosure would help decision making by customers, and increased penaltieswould serve as a deterrent. This would generate incentive compatible behaviour,and further competition may drive costs down.There are, however, two problems with this approach. First, research on disclosurehas shown ambivalent effects. For disclosure to influence decisions, it has to be aneye-opener. The format has to be simple that product features become salient. Thisis often hard to achieve. Sometimes, mandatory disclosures can have unintendedconsequences. Loewenstein et. al. (2011) find that under a regime of mandatorydisclosures, advisors seem to be more comfortable giving biased advice.97
94Details of reform in UK, EU, Australia and South Africa are discussed in the Appendix95Submission by life insurance representatives on insurance intermediation/agent remuneration.96Submission by FIAI, 24 March, 201597Loewenstein et. al., The Limits of Transparency: Pitfalls and Potential of Disclosing Conflicts of
Interest, tech. rep., Papers and Proceedings, American Economic Review, 2011.
57
Second, the design of penalties is also non-trivial. Firms have to be worried aboutthe probability of getting caught, and conditional on being caught, suffer largerdamages. Thus there have to be continuous inspections with low fines, or fewerinspections but high damages. But this pre-supposes an enforcement capacity thatis difficult to put in place immediately. Liabilities may not be enough to make itprofitable for high-road firms to separate from low-road firms and offer low-costproducts.Ultimately, the combination of competition with disclosures and penalties requiresthat some firms will have an incentive to distribute low cost products, and this willgenerate pressure on other firms to follow suit. The danger is that compensationstructure is an industry-wide problem, making it difficult for one player to changethe system. The problem of hidden costs of similar products under differentjurisdictions also does not get addressed in this framework. It was therefore feltthat leaving the compensation structure entirely upto the industry was also not aviable solution.
Remove arbitrage and align incentives The starting point for discussions on the sug-gestion for a dynamic, and fair financial system for households is the belief thatcertain compensation structures are inherently unreasonable. A compensationstructure that does not link intermediary remuneration to the well-being of theclient will ultimately fail in serving the interest of the consumer. Similarly, disclo-sures and penalties on mis-sales by themselves will not align with improved choiceand increased consumer welfare. The Committee arrived at a view that what wasrequired was rationalisation of commissions and disclosures mandates across allfinancial products, such that products become comparable (on the demand side),and provide reasonable and comparable remuneration (on the supply side).

6 — Recommendations
Financial sector reform is an ongoing process. It must be remembered that due tohistorical reasons, certain products in the industry may have lagged behind the reformsthat other parts of the market have embraced. Given this, certain product categorieshave a larger focus in the eyes of the Committee so that they are brought to par with therest of the market. The endeavour of the Committee is to ensure that there are no darkpatches in the industry or product category that lead to mis-selling and investor anguishresulting in loss of trust in the financial sector.
The Committee believes that consumer interests will be served by more transparent dis-closures that enable consumers to understand products, compare them, and consequentlychoose those that serve their interests.
It is commonly recognised that tax breaks and assured returns work as pull strategies.Presence of even one of these works. This can be seen from the pull towards taxablebank deposits. What is perhaps not commonly recognised is that presence of assuredreturns and/or tax breaks can in fact, make the product more susceptible to irresponsiblesales where the products also have opaque or mis aligned cost structures as well asopaque benefits, as can be seen in some traditional insurance products.
The recommendations of the Committee are in two parts. The first part (Section 6.1),described below, outlines the broad principles that should be applicable to any retailfinancial product. These are sub-divided into recommendations on Product features,Costs and commissions and Disclosures, followed by Generic recommendations. Parttwo (Section 6.2) deals with recommendations for specific products such that the Termsof Reference are served.
60 Recommendations
6.1 Broad principles
Product structure
1. Retail financial products must have product structures that allow costs and benefitsto be easily understood by a retail investor.
2. Costs for similar functions across product categories should be the same. Thereare three basic functions that a financial product serves - protection, investmentand annuity. In the investment function, the mark-to-market products must followthe cost structure decided by the capital market regulator. The non mark-to-marketproducts must follow the cost structures of other deposit-like products such asbank deposits.
3. In all products, including closed-end and open ended products, other than pensionproducts, the choice of withdrawal should remain with the investor. The regulatorshould determine a surrender cost that the investor may bear in such products. Thecost of surrender should be reasonable. The remaining money should belong tothe exiting investors.
4. Cool-off periods for similar products should be the same. Care should be takenthat there should be no opportunity for non-naive investors to use the cool-offperiod to target a market movement.
5. Claw backs should be similar for similar products.6. Tax regimes should be the same for similar products.
Costs and commissions
1. In bundled products cost caps should be fixed for each function. All costs withinthe function should collapse under one head. In addition, there should be anoverall cost cap to the bundled product. This cost structure should be clearlydisclosed.
2. The system of incentives should align the interest of the three parts of the market -the manufacturer, the advisor/distributor and the customer.
3. Upfront commissions in investment products and investment portion of bundledproducts skew seller behaviour and cause mis-selling and churning. These shouldbe phased out completely.
4. Upfront commissions for pure mortality should continue since selling pure lifecover is relatively difficult.
5. Special incentives may be given to the distributors when they have to reach out toa specific segment of the population under any mandatory provision (for example,insurance in rural areas)
6. For investment products, and investment portion of bundled products, commissionsshould move to an all trail model. These should be either level or declining.
7. Regulators should be harsh on manufacturers that are found to be violating thespirit of the cost recommendations by hiding costs paid to the distributors underother heads such as marketing or business promotion. Very stiff penalties and lossof license for repeated offences should be put in place.
61
Disclosures
1. Product disclosure should be such that a customer can very clearly understandwhat it costs (easier to do once the costs of each function are disclosed) and whatthe benefits are.
2. Returns should be disclosed as a function of investment and should disclose theIRR of the product. Returns should not be pegged to a third number. For example,returns should not be shown as a percentage of sum assured. NAV should reflectthe value of investment which would allow the consumers to take the point topoint NAV and arrive at net investment returns.
3. How much of the invested amount goes to work and how much is cut as a costshould be clearly disclosed in a manner that is understandable by a retail investor.
4. For a closed-end product with a defined tenure, the customer should be madeaware of the consequences of a mid-way exit from the product. As an example,if a 15-year endowment plan is discontinued in year 8, the disclosure materialshould clearly show what money will return to the investor after such a period. Ina 5-year closed-end mutual fund, the investor should clearly be told that a midwayexit in year 3 is possible only through the secondary market where the NAV isalways lower.
5. Machine readable disclosures enable creation of web-based tools and mobile appsthat help consumers make smarter choices in the marketplace and as such alldisclosures should be machine readable. Machine readable does not mean softcopy. Machine readable is when data can be processed by a computer for furtheranalysis and interpretation. CSV is a basic example of machine readable.
6. All disclosures should be made available in multiple ways – on company websites,as feed to industry analysts that process the data, to advisors, sellers and consumerprotection and financial literacy agencies.
7. The product provider and the distributor should ensure that they have built andimplemented sufficient processes and systems to ensure that proper disclosuresare actually made. The checks should be stronger for vulnerable categories suchas senior citizens. The product providers should add a second layer of in-houseapproval before a sale is concluded for such customers. The product providersshould be required to provide details of the same to their regulator on a periodicbasis.
8. To focus on such disclosures and its format that can be easily understood by aretail investor (compared to the present unreadable information memorandum/offerdocument), a single-page Distributor-Investor Form should be mandated, whichin bold states the key features of the product, its suitability and costs. The formshould be in a machine readable format so that these can be easily databased forfuture reference, audit and analysis. For each sale, this form should be madeavailable to the investor and a copy be available with the distributor, which may beinspected by the regulator when need be. These forms should be made availableto the investor in the language preferred by her. Both the buyer and seller shouldsign on this form. An indicative form is shown in Annexure D. This is all themore important given the rising sales of mutual funds, for example, in the lesserliterate B15 cities.
9. The regulators may also consider mandating a “Personal Illustration” format
62 Recommendations
which the product provider/distributor should give to the customers. An indicativeformat (used by LIC, UK) is shown in Annexure E.
10. The monthly/periodic statements sent by AMCs to the investors showing currentNAV of the investment should show gross NAV, head-wise expenses charged tothe investor and the net NAV.
Generic recommendations
1. Going forward, in order to bring uniformity and proper oversight, the functionshould decide the regulatory framework. This means that, IRDAI and PFRDAshould harmonise their investment regulatory function with that of the lead in-vestment regulator SEBI. IRDAI should take the lead on insurance and annuityfunction. With a base uniformity founded on function, IRDAI and PFRDA shouldhave additional regulations related to the function only to the extent they are nec-essary for the specific needs of products regulated by them. For instance, in caseof IRDAI and PFRDA, these could be on account of products being closed-endand of longer tenure.
2. In order to ensure that differential regulatory norms do not favour any particularfinancial product, the redress available to consumers should be of same highquality across the sector regulators to ensure consumers of products under aparticular regulator are not placed at a disadvantage.
3. Enforcement should be strengthened around manufacturers over payment of com-missions and fees over and above the prescribed limit to the distributors.
4. Personal information of the consumer should be protected.5. Regulators should require financial service providers to follow norms related to
suitability, documentation of the sales process and independent audit process forthe same.
6. In case there are additional services provided to the customer, these should bearticulated clearly. Charges, if any, on this account should be under the overallcost cap that is fixed by the regulator.
7. For similar products, there should be a similar structure with regard to Service Tax,Stamp Duty and rural and social sector norms. Like in the case of ApplicationsSupported by Blocked Amount (ASBA) for retail investors in IPO markets, mutualfund NFOs should also have an ASBA process.
8. Financial products are advised products since average people are not able tomake the needed calculations involving real return, time value of money, taximpact and the IRR. Over the long term, Indian markets should be guided to anadvisory model where customers seek advisors, and remunerate them directly forholistic portfolio advice, plus the Over the Counter (OTC) model where customerspurchase products over the counter without any intermediation. In this world,product provider led commissions will not be permissible, and advisors willfunction under a regime of higher fiduciary standards.
9. Banks are fast emerging as major distributor of financial products. Banks andother institutions tend to over-sell (and as a result could often mis-sell) productsbelonging to their group companies. The regulators may consider putting addi-tional disclosures requirements on banks where they are explicitly required to
63
disclose (i) the products that originate from their group companies as such and (ii)the comparable products as comparison when selling products originating fromtheir group companies. Each of the regulators should regulate the distributors forproducts which are under their mandate. For example, SEBI should regulate thebanks directly for distribution of products regulated by it.
10. There is an urgent need to bring the distributors, and their sales employees (andsub brokers), under a regulatory framework. (SEBI has recently issued regulationsfor advisors but no regulations exist for distributors). All distributors, acrossregulators, along with their sales employees, should be assigned a unique numberso that monitoring, surveillance and enforcement becomes unified and simpler.They should be subjected to detailed regulations incorporating rules, educationalqualifications, entrance exams, code of conduct etc. There should be a combineddatabase of all distributors across all financial products. The sector regulator canimpose additional conditions on their distributors. Also, the database of customersof the distributors should be available for inspection by the regulators and forcustomers who are shopping for a distributor.
11. Ultimately, proper product selection would improve and mis-selling would declineif investors become more financially literate. The Government should step up itsefforts to improve financial literacy among Indian households. One area of focusshould be a powerful, multi-lingual financial education website. Additionally,as has been proven, investor education seminars being conducted by severalbodies and companies are very ineffective, and the focus should therefore shift tofinancial education in schools, colleges and places of employment. Each of theregulators should implement a system of impact assessment of financial literacyactions. These should not be judged based on number of programs conducted orattendance.
12. Tax benefits should be given on function and not form. Since the governmentwants to encourage insurance penetration, tax breaks should be given on pure riskmortality and the treatment of the investment part should be harmonised acrossthe different forms of the product across regulators.
13. Despite tax breaks for insurance, pure insurance products are not promoted. Whileonline sales have helped informed customers purchase these products, insurancefor purely protection purpose needs to be mass scaled. This would require greatereffort in rural areas and for this all possible tools including financial literacy andawareness campaigns and special distribution incentives should be considered.
6.2 Product specific recommendations
6.2.1 Mutual Funds
Rules on selling and commissions in the mutual fund industry have been under a focusedregulatory eye for just under a decade. In 2006, when the new issue related expensesof 6 per cent were removed on open ended funds to more recently when the marketregulator nudged the industry association to stop upfronting of trail commissions in2015, there has been a consistent road on which the regulator has traveled. In terms ofproduct structure, mutual funds now have all costs that sit under one head - the annual
64 Recommendations
expense ratio. Costs are fungible under this head with the market free to price variouscosts as it deems fit. Investors find it easy to compare across products to search for thecheapest fund, other things being equal. Machine readability of disclosures and the datafeed that AMCs give to third party analysts allow sellers, advisors and retail investors tocompare across products across various attributes such as asset allocation, costs, returns,risk and portfolios.
Product structure
1. The benchmarks should be made more relevant than they are today. Schemesshould be periodically tested to see if the asset allocation is conforming to thebenchmarks chosen.
2. Similar schemes from the same fund house should be removed. Some of thesewere launched in the NFO boom to harvest the 6 per cent marketing cost. Suchduplicate funds should be merged with others in the same fund house since theyconfuse investors.
3. The regulator should ensure that the mutual funds are true to label. This meansthat the investment mandate in the information memorandum should be reflectedin the active portfolio of the fund.
4. The regulator should consider measures to encourage retail participation in ETFs.5. The regulator should put in place a free look policy and define the period for
which it will hold.
Costs and commissions
1. The cost caps within a overall TER should not be fungible.2. Upfronting of commissions should be totally removed. There is a current cap of
1 per cent that comes from the fund house capital or profits. This too should beremoved.
3. Distribution commissions should only be paid as level or reducing AUM basedtrail. In the case of lumpsum investment, or upon termination of a systematicinvestment plan, the trail commission should be declining (or nil after a specifiedperiod of time).
4. The extra commission in B15 should be removed and a level playing field becreated in the country. Manufacturers and distributors should on their own tapsuch unexplored markets to increase their sales and market share.
5. No category of mutual funds should be exempt from the zero upfront (when it isput in place).
6. Distributors should not be paid advance commissions by dipping into futureexpenses, their own profit or capital.
7. Competition has not reduced costs much below the expense ratio that was fixedwhen the AUM of the industry was much lower. The regulator should lower thecost caps as the AUM rises over time.
65
Disclosures
1. On no account should sales of new fund offers happen pitching the product as a“cheap” product that the investor is getting “at par” value of Rs.10. The regulatorshould impose heavy costs on distributors reported as doing this.
2. The past returns of the scheme being sold, along with the benchmark returns,should be disclosed to the investor at the time of sale. Customers should bedisclosed a range of past returns appropriate to the product tenure and shouldinclude returns of last 6 months and annualised returns since inception, and 2 yearrests thereafter.
3. Trail commissions on mutual funds should be disclosed at the time of sale.4. Disclaimer presently talks of a scheme’s performance being subject to market risks.
Customers should be informed that in addition to market risk, the performance isalso subject to fund house/manager’s competence.
5. Any change in scheme fund manager should be disclosed to all investors.6. The AUM rankings published by the AMCs on their websites, Information Memo-
randum etc. are presently combined for all products, thereby giving a misleadingpicture. For retail products, the AUM rankings should be shown only for the retailAUM.
6.2.2 Insurance: Unit Linked Insurance Plans
The ULIP product came to limelight in India in 200198 as the first consequence ofprivate sector being allowed into insurance. New insurance companies with foreigntie-ups wanted to bring the improved version of the old insurance policy – the traditionalendowment policy – as a transparent and market-linked investment vehicle bundled witha crust of life cover. But the reform went only half way and a product was allowed intothe market that was linked to the market, but in all other manner of costs and productstructure was still using the traditional policy rules. This led to widespread mis-sellingof the ULIP and the regulator came down heavily on the product in 2010 putting in placevery strict cost caps and rules around what can be deducted from the investor’s moneyon lapsation and surrender.
The post 2010 ULIP is a much better product as compared to the pre-2010 product. Itshould be remembered that the endeavour of this Committee is to make the productsas useful and transparent for the consumer as possible so that the regulatory cost ofensuring compliance is minimised. The following recommendations aim to take forwardthe reform that IRDAI began in 2010 on the ULIP product in a manner that aligns similarproducts across regulatory domains.
Product structure
1. Mortality and investment should be bifurcated. For the investor, this would meana clear understanding of what part of the premium goes to service the life coverand what part of the premium goes to work as an investment.
98The first ULIP was launched in India in 1971 by UTI
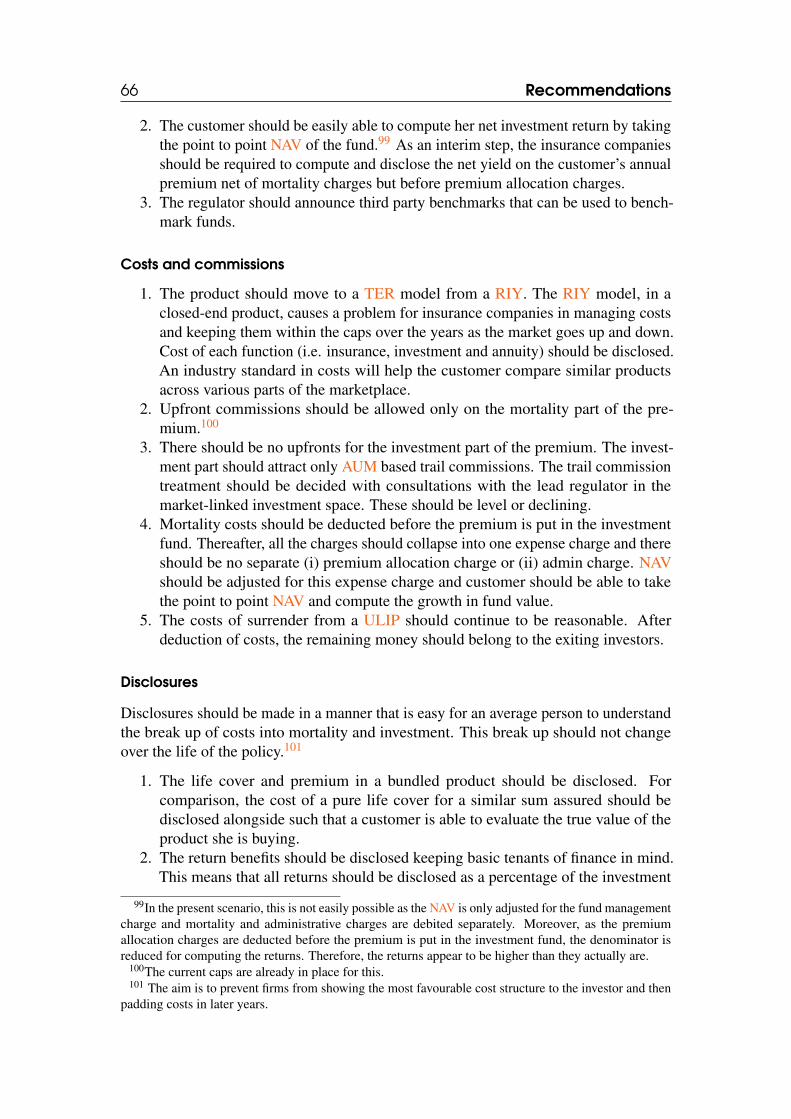
66 Recommendations
2. The customer should be easily able to compute her net investment return by takingthe point to point NAV of the fund.99 As an interim step, the insurance companiesshould be required to compute and disclose the net yield on the customer’s annualpremium net of mortality charges but before premium allocation charges.
3. The regulator should announce third party benchmarks that can be used to bench-mark funds.
Costs and commissions
1. The product should move to a TER model from a RIY. The RIY model, in aclosed-end product, causes a problem for insurance companies in managing costsand keeping them within the caps over the years as the market goes up and down.Cost of each function (i.e. insurance, investment and annuity) should be disclosed.An industry standard in costs will help the customer compare similar productsacross various parts of the marketplace.
2. Upfront commissions should be allowed only on the mortality part of the pre-mium.100
3. There should be no upfronts for the investment part of the premium. The invest-ment part should attract only AUM based trail commissions. The trail commissiontreatment should be decided with consultations with the lead regulator in themarket-linked investment space. These should be level or declining.
4. Mortality costs should be deducted before the premium is put in the investmentfund. Thereafter, all the charges should collapse into one expense charge and thereshould be no separate (i) premium allocation charge or (ii) admin charge. NAVshould be adjusted for this expense charge and customer should be able to takethe point to point NAV and compute the growth in fund value.
5. The costs of surrender from a ULIP should continue to be reasonable. Afterdeduction of costs, the remaining money should belong to the exiting investors.
Disclosures
Disclosures should be made in a manner that is easy for an average person to understandthe break up of costs into mortality and investment. This break up should not changeover the life of the policy.101
1. The life cover and premium in a bundled product should be disclosed. Forcomparison, the cost of a pure life cover for a similar sum assured should bedisclosed alongside such that a customer is able to evaluate the true value of theproduct she is buying.
2. The return benefits should be disclosed keeping basic tenants of finance in mind.This means that all returns should be disclosed as a percentage of the investment
99In the present scenario, this is not easily possible as the NAV is only adjusted for the fund managementcharge and mortality and administrative charges are debited separately. Moreover, as the premiumallocation charges are deducted before the premium is put in the investment fund, the denominator isreduced for computing the returns. Therefore, the returns appear to be higher than they actually are.
100The current caps are already in place for this.101 The aim is to prevent firms from showing the most favourable cost structure to the investor and then
padding costs in later years.
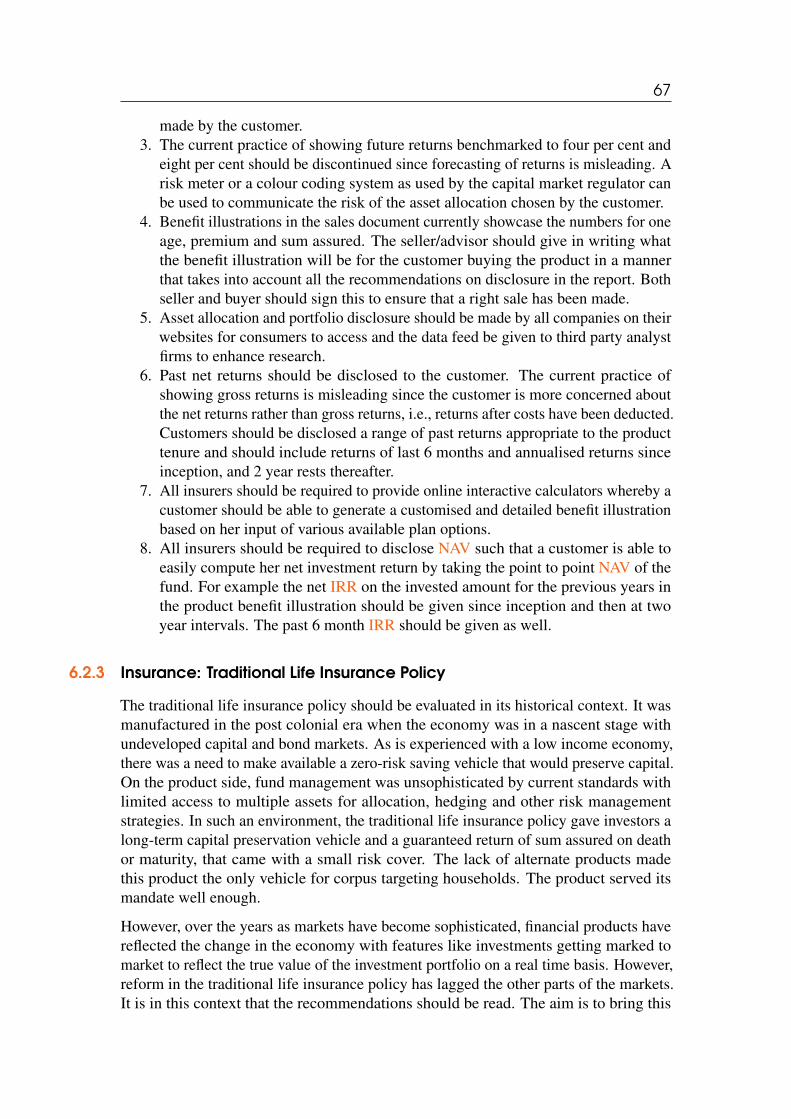
67
made by the customer.3. The current practice of showing future returns benchmarked to four per cent and
eight per cent should be discontinued since forecasting of returns is misleading. Arisk meter or a colour coding system as used by the capital market regulator canbe used to communicate the risk of the asset allocation chosen by the customer.
4. Benefit illustrations in the sales document currently showcase the numbers for oneage, premium and sum assured. The seller/advisor should give in writing whatthe benefit illustration will be for the customer buying the product in a mannerthat takes into account all the recommendations on disclosure in the report. Bothseller and buyer should sign this to ensure that a right sale has been made.
5. Asset allocation and portfolio disclosure should be made by all companies on theirwebsites for consumers to access and the data feed be given to third party analystfirms to enhance research.
6. Past net returns should be disclosed to the customer. The current practice ofshowing gross returns is misleading since the customer is more concerned aboutthe net returns rather than gross returns, i.e., returns after costs have been deducted.Customers should be disclosed a range of past returns appropriate to the producttenure and should include returns of last 6 months and annualised returns sinceinception, and 2 year rests thereafter.
7. All insurers should be required to provide online interactive calculators whereby acustomer should be able to generate a customised and detailed benefit illustrationbased on her input of various available plan options.
8. All insurers should be required to disclose NAV such that a customer is able toeasily compute her net investment return by taking the point to point NAV of thefund. For example the net IRR on the invested amount for the previous years inthe product benefit illustration should be given since inception and then at twoyear intervals. The past 6 month IRR should be given as well.
6.2.3 Insurance: Traditional Life Insurance Policy
The traditional life insurance policy should be evaluated in its historical context. It wasmanufactured in the post colonial era when the economy was in a nascent stage withundeveloped capital and bond markets. As is experienced with a low income economy,there was a need to make available a zero-risk saving vehicle that would preserve capital.On the product side, fund management was unsophisticated by current standards withlimited access to multiple assets for allocation, hedging and other risk managementstrategies. In such an environment, the traditional life insurance policy gave investors along-term capital preservation vehicle and a guaranteed return of sum assured on deathor maturity, that came with a small risk cover. The lack of alternate products madethis product the only vehicle for corpus targeting households. The product served itsmandate well enough.
However, over the years as markets have become sophisticated, financial products havereflected the change in the economy with features like investments getting marked tomarket to reflect the true value of the investment portfolio on a real time basis. However,reform in the traditional life insurance policy has lagged the other parts of the markets.It is in this context that the recommendations should be read. The aim is to bring this
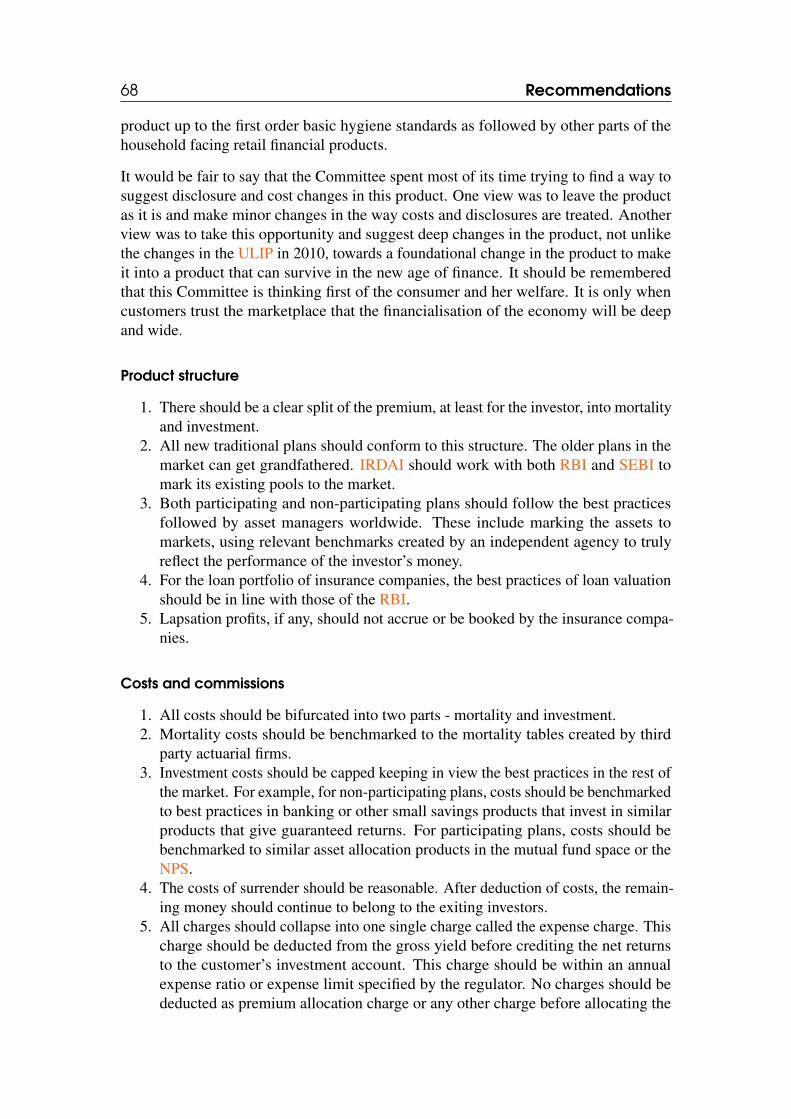
68 Recommendations
product up to the first order basic hygiene standards as followed by other parts of thehousehold facing retail financial products.
It would be fair to say that the Committee spent most of its time trying to find a way tosuggest disclosure and cost changes in this product. One view was to leave the productas it is and make minor changes in the way costs and disclosures are treated. Anotherview was to take this opportunity and suggest deep changes in the product, not unlikethe changes in the ULIP in 2010, towards a foundational change in the product to makeit into a product that can survive in the new age of finance. It should be rememberedthat this Committee is thinking first of the consumer and her welfare. It is only whencustomers trust the marketplace that the financialisation of the economy will be deepand wide.
Product structure
1. There should be a clear split of the premium, at least for the investor, into mortalityand investment.
2. All new traditional plans should conform to this structure. The older plans in themarket can get grandfathered. IRDAI should work with both RBI and SEBI tomark its existing pools to the market.
3. Both participating and non-participating plans should follow the best practicesfollowed by asset managers worldwide. These include marking the assets tomarkets, using relevant benchmarks created by an independent agency to trulyreflect the performance of the investor’s money.
4. For the loan portfolio of insurance companies, the best practices of loan valuationshould be in line with those of the RBI.
5. Lapsation profits, if any, should not accrue or be booked by the insurance compa-nies.
Costs and commissions
1. All costs should be bifurcated into two parts - mortality and investment.2. Mortality costs should be benchmarked to the mortality tables created by third
party actuarial firms.3. Investment costs should be capped keeping in view the best practices in the rest of
the market. For example, for non-participating plans, costs should be benchmarkedto best practices in banking or other small savings products that invest in similarproducts that give guaranteed returns. For participating plans, costs should bebenchmarked to similar asset allocation products in the mutual fund space or theNPS.
4. The costs of surrender should be reasonable. After deduction of costs, the remain-ing money should continue to belong to the exiting investors.
5. All charges should collapse into one single charge called the expense charge. Thischarge should be deducted from the gross yield before crediting the net returnsto the customer’s investment account. This charge should be within an annualexpense ratio or expense limit specified by the regulator. No charges should bededucted as premium allocation charge or any other charge before allocating the
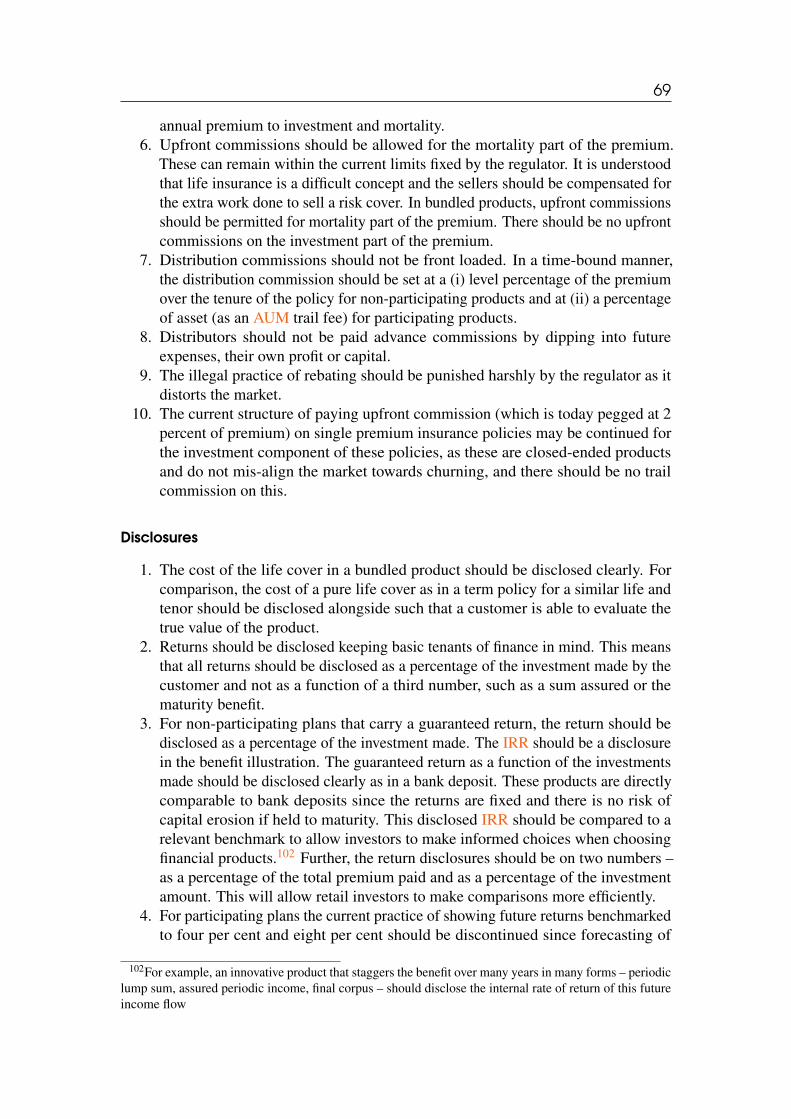
69
annual premium to investment and mortality.6. Upfront commissions should be allowed for the mortality part of the premium.
These can remain within the current limits fixed by the regulator. It is understoodthat life insurance is a difficult concept and the sellers should be compensated forthe extra work done to sell a risk cover. In bundled products, upfront commissionsshould be permitted for mortality part of the premium. There should be no upfrontcommissions on the investment part of the premium.
7. Distribution commissions should not be front loaded. In a time-bound manner,the distribution commission should be set at a (i) level percentage of the premiumover the tenure of the policy for non-participating products and at (ii) a percentageof asset (as an AUM trail fee) for participating products.
8. Distributors should not be paid advance commissions by dipping into futureexpenses, their own profit or capital.
9. The illegal practice of rebating should be punished harshly by the regulator as itdistorts the market.
10. The current structure of paying upfront commission (which is today pegged at 2percent of premium) on single premium insurance policies may be continued forthe investment component of these policies, as these are closed-ended productsand do not mis-align the market towards churning, and there should be no trailcommission on this.
Disclosures
1. The cost of the life cover in a bundled product should be disclosed clearly. Forcomparison, the cost of a pure life cover as in a term policy for a similar life andtenor should be disclosed alongside such that a customer is able to evaluate thetrue value of the product.
2. Returns should be disclosed keeping basic tenants of finance in mind. This meansthat all returns should be disclosed as a percentage of the investment made by thecustomer and not as a function of a third number, such as a sum assured or thematurity benefit.
3. For non-participating plans that carry a guaranteed return, the return should bedisclosed as a percentage of the investment made. The IRR should be a disclosurein the benefit illustration. The guaranteed return as a function of the investmentsmade should be disclosed clearly as in a bank deposit. These products are directlycomparable to bank deposits since the returns are fixed and there is no risk ofcapital erosion if held to maturity. This disclosed IRR should be compared to arelevant benchmark to allow investors to make informed choices when choosingfinancial products.102 Further, the return disclosures should be on two numbers –as a percentage of the total premium paid and as a percentage of the investmentamount. This will allow retail investors to make comparisons more efficiently.
4. For participating plans the current practice of showing future returns benchmarkedto four per cent and eight per cent should be discontinued since forecasting of
102For example, an innovative product that staggers the benefit over many years in many forms – periodiclump sum, assured periodic income, final corpus – should disclose the internal rate of return of this futureincome flow
70 Recommendations
returns is misleading. A risk meter or a colour coding system as used by the capitalmarket regulator can be used to communicate the risk of the asset allocation chosenby the customer.
5. Participating plans should show benefits as a function of the invested amountrather than as a function of any other number. An indicative disclosure is:For participating plans, give the net IRR for the previous years in the productbenefit illustration of a participating product. Companies without a 10/15 yearhistory should give returns for the oldest possible period. For example, if acompany has a policy history of 8 years, then the returns should be shown for 5and 8 years. For a company with a 5 year history, returns should be shown for 2and 5 years. For example:
(a) A standard life 30 year old with a 10 year product that matured in the lastfinancial year (say, FY 15) got a net return of XX% (YY, ZZ) (Note, that YYstands for the IRR for the FY before last (FY14), while ZZ stands for theIRR for the FY two years before last (FY13))
(b) A standard 30 year old with a 15 year product that matured in the lastfinancial year got a net return of xx% (YY, ZZ)
(c) A standard 40 year old with a 10 year product that matured in the lastfinancial year got a net return of xx% (YY, ZZ)
(d) A standard 40 year old with a 15 year product that matured in the lastfinancial year got a net return of xx% (YY, ZZ)
6. Benefit illustrations in the sale document currently showcase the numbers for oneage, premium and sum assured. The seller/advisor should give in writing whatthe benefit illustration will be for the customer buying the product in a mannerthat takes into account all the recommendations on disclosure in the report. Bothseller and buyer should sign this to ensure that a right sale has been made.
7. Asset allocation and portfolio disclosure should be made by all companies on theirwebsites for consumers to access and the data feed be given to third party analystfirms to enhance research.
8. The current industry practice of using the word bonus to indicate return is mislead-ing. The word bonus103 is defined104 as an extra amount of money that is added toa payment, especially to somebody’s ages or salary as a reward such as a Diwalibonus. Disclosures should use the word net return instead.105 Changing the waywe call something has an impact on the way we think about it.
9. Customers should know very clearly the consequence of exiting a closed-endproduct earlier than maturity. The disclosure sheet should show the value of theentire premium paid at annual rests for products of a five year tenor, at two yearrests for products upto 10 years tenor and at five year rests for all products ofmore than 10 year tenor. For example, for a 15 year policy with a premium payingterm of 5 years and a premium of Rs.1 lakh a year, the value of Rs.1 lakh if the
103The additional sum that the policyholder will get during the term of the insurance plan or at maturityof the plan, provided he has paid all premium amounts due for a specified minimum number of years.Bonus is the amount added to the basic sum assured under a with-profit life insurance policy.
104Oxford Advanced Learner’s Dictionary.105SEBI changed the nomenclature of the new mutual fund offers from IPO to NFO in June 2005 to
better communicate the difference between a mutual fund and a direct stock listing. this happened afterAMCs misled investors by a high octane marketing push that popularised an IPO at par.
71
person exits in year 5 and 10 should be disclosed. As another example, for a 10year product with a premium paying term of 10 years and an annual premium ofRs.1 lakh, the value in hand should be shown for exit in year 2, 4, 6 and 8. Theregulator should take harsh action if firms are found deliberately obfuscating thisdisclosure with the aim to enjoy lapsation profits or high surrender charges.
10. Since the space on the suggested disclosure sheet is limited, insurance companiesshould provide online calculators so that customers can better understand theconsequence of exits across each year.
6.2.4 NPS
The NPS has grown in size owing to central and state government participation. Therecord of the NPS in attracting private retail customers has been very limited. Whilethis is a cause for concern, it is the Committees view that the product and commissionsstructure on the NPS should not deviate from what was intended in the original NPSdesign.106 The NPS participation will catch up when the incentive structure in othersectors is rationalised, and more efforts are made to improve participation throughwholesale channels. The following recommendations should be seen as reforms for thegrowth of NPS.
Product structure
1. PFRDA should enable digital/ online transactions for all customer facing processesof NPS including account opening. Consumers should be able to transact onlineand over mobile apps irrespective of the PoP.
2. The rules and the processes for a customer to unfreeze her NPS account shouldbe made simple and the customer should have an option to unfreeze her accountinstantly by paying the required fees online on the CRA or PoP portal. Customerswho do not have access to the internet should be able to contact the CRA or PoPtelephonically to find out the requisite fee. Once the fee is deposited, the accountshould be unfrozen automatically.
3. PFRDA should consider further developing the annuity options for NPS customersalong with suitable disclosure norms for the same.
Costs and commissions
1. No change is suggested in the NPS incentive architecture of distribution incentivesbeing delinked from product providers. This is already aligned with consumerinterest.
2. AUM based commissions should be introduced for the PoPs for the private sector(all retail contributions) NPS. These should not be introduced for nodal officesfor government employees for whom NPS is mandatory or for employers whofacilitate their employees to participate in the scheme. The same should beaccounted by CRA consistent with the NPS architecture.
106See the OASIS Committee Report for details.
Annex A: In house sales
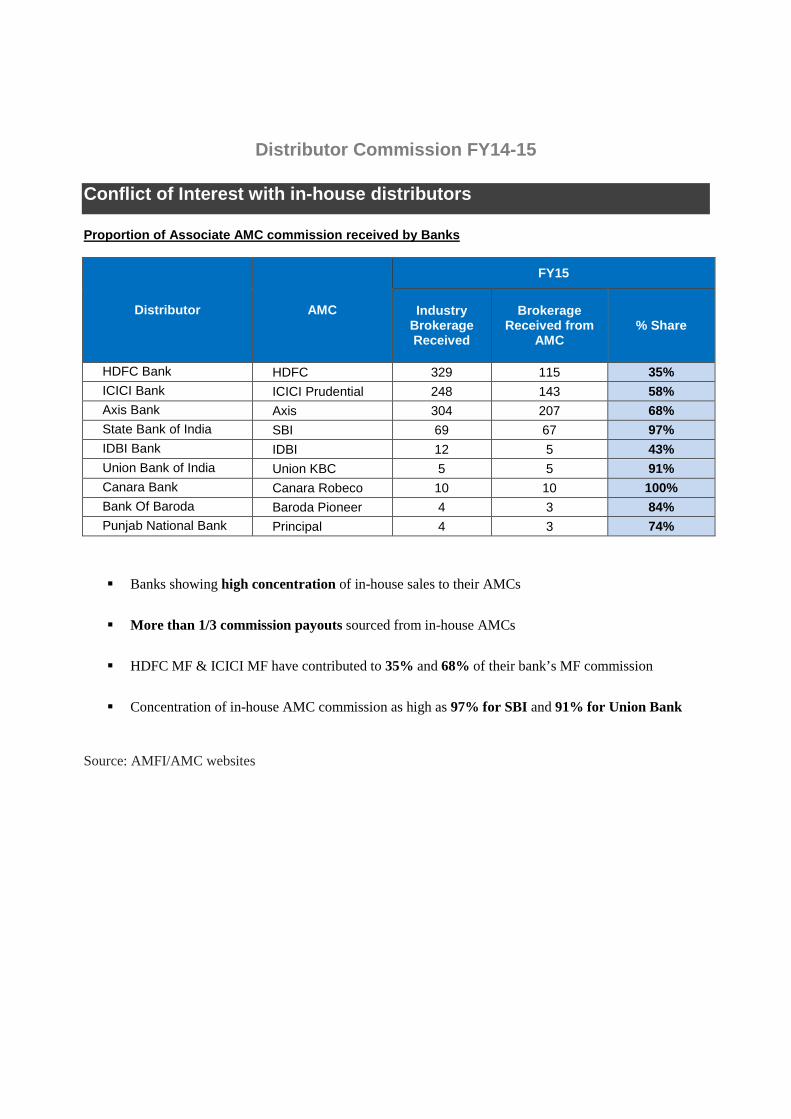
Distributor Commission FY14-15
Conflict of Interest with in-house distributors
Proportion of Associate AMC commission received by Banks
Distributor AMC
FY15
Industry Brokerage Received
Brokerage Received from
AMC % Share
HDFC Bank HDFC 329 115 35% ICICI Bank ICICI Prudential 248 143 58% Axis Bank Axis 304 207 68% State Bank of India SBI 69 67 97% IDBI Bank IDBI 12 5 43% Union Bank of India Union KBC 5 5 91% Canara Bank Canara Robeco 10 10 100% Bank Of Baroda Baroda Pioneer 4 3 84% Punjab National Bank Principal 4 3 74%
Banks showing high concentration of in-house sales to their AMCs
More than 1/3 commission payouts sourced from in-house AMCs
HDFC MF & ICICI MF have contributed to 35% and 68% of their bank’s MF commission
Concentration of in-house AMC commission as high as 97% for SBI and 91% for Union Bank
Source: AMFI/AMC websites
Annex B: Costs

Sn. Category Products Type Investment Return Manufacturer's:cost/:charges Commission Industry:Commission Maximum:Commission Exit:Charges/:Costs Product:Structure Payment:Plan
1 InvestmentEquity/Hybri:d/Debt:Mutual:Funds
Closed:Ended Market:Linked Variable
Refer:Note:4:for:cost:cap:details.:In:case:of:direct:plans:the:costs:for:consumers:are:lower:as:no:distribution:cost:is:charged:on:plans:sold:as:Direct.
Back:Loaded AUM:Trail:0.1%:to:1%
Most:MF:charge:exit:load:for:withdrawal:within:one:year.:This:is:a:percentage:of:AUM:and:usually:ranges:between:0:to:2:percent.:The:exit:load:charged,:if:any,:after:the:commencement:of:the:SEBI:(Mutual:Funds):(Second:Amendment):Regulations,:2012,:shall:be:credited::::::::::to:the:scheme
Lock:in:for:3W5:years.:Rest:same:as:Sn.1
Lumpsum/:SIP
2 InvestmentEquity/Hybri:d/Debt:Mutual:Funds
Open:Ended Market:Linked Variable Same:as:above Back:Loaded Same Same
NAV:based,:NAV:is:net:of:expenses,:Exit:load:as:%:of:AUM.:Total:Expenses:capped:as:TER.:Exit:load:flows:back:to:investment.:Upfront:commission:not:booked:to:Scheme.:Trail:based:commission.
Lumpsum/:SIP
3Investment:B15:cities
Equity/Hybri:d/Debt:Mutual:Funds
Open/:Closed:Ended
Market:Linked VariableAddoitional:expenses:as:per:note:5.
Back:LoadedAdditional:commission:can:be:paid.:No:cap:of:1%:upfront:commission
SameProduct:structure:is:same:as:mutual:funds:sold:in:T15.
Lumpsum/:SIP
4 Investment ETF Open:Ended Market:Linked Variable
in:case:of:an:index:fund:scheme:or:exchange:traded:fund,:the:total:expenses:of:the:scheme:including:the:investment:and:advisory:fees:shall:not:exceed:one:and:one:half:percent:(1.5%):of:the:daily:net:assets;
No:Commissions
Investor:pays:a:commission:to:the:broker:(same:as:purchasing:securities).This:is:usually:around:0.50%:of:the:traded:value.
As:per:the:SEBI:Rule:no:broker:can:charge:more:than:brokerage:of:2.5%:of:total:traded:value.
NoneNo:Exit:Load.:No:investment:Management.
Lumpsum/:SIP
Commissions:are:same:for:Lumpsum:and:SIP:investment.:There:is:no:entry:load:for:any:of:these:products.:A:transaction:charge:of:Rs:100:is:allowed:for:investors:investing:more:than:Rs:10,000:and:Rs:150:for:first:time:investors:investing:more:than:Rs:10,000.:ETFs:and:direct:plans:in:mutual:funds:do:not:have:this:charge.The:commissions:have:to:be:within:the:TER.:Additional:expenses::for:investments:arising:from:select:cities.i):Equity::0.30%:ii):Debt:::0.20%.
Overview of Mutual Fund Products

Sn. Category Products Type Investment Return Manufacturer's:cost/:charges Commission Industry:Commission Maximum:Commission Exit:Charges/:Costs Relapse:Costs Product:Structure Payment:Plan
1
InsuranceTerm:Insurance
Closed:Ended
NA NA Front:Loaded25%:in:Y1,:5%thereafter
NoneRegular:Premium:Paying:Term
2 Micro:InsuranceTerm:Insurance
Closed:Ended
NA NA Front:Loaded20%:every:year:(10%:for:single:premium)
NoneRegular:Premium:Paying:Term
3Investment:+:Insurance
ULIPClosed:Ended
Market:Linked
Variable
Costs:are:capped:as:RIY.Refer:note:2.:Within:the:RIY,:the:insurers:can:charge:premium:allocation:charges,:policy:admin:charges:and:fund:management:charges.Fund:management:is:capped:at:1.35%:of:the:fund:value.
Front:LoadedY1:U:8U10%,:Y2onwards:2U5%
2%:of:the:Single:Premium.:For:non:single:premium:policies:refer:note:1.
Surrender:charges:are:a:percentage:of:the:annual:premium:or:fund:value:and:are:capped:at:a:maximum:of:Rs.:6000:for:surrender:in:year:1:and:decrease:for:every:year:thereafter,:becoming:nil:after:
Refer:note:10.
NAV:based,:NAV:is:not:net:of:all:expenses.:Mortality:and:Policy/:Admin:Charges:are:levied:by:cancellation:of:units.:Premium:Allocation:charge:is:deducted:before:the:savings:are:shown:into:the:investment:fund:account.:Total:Expense:capped:as:RIY.::TER:not:disclosed.:The:IRDAI:product:Regulations:allows:the:following:to:be:excluded:from:the:calculation:of:net:yield::(i):mortality:&:morbidity:charges:(ii):extra:premium:due:to:health:impairment:etc.:(iii):rider:premium:(iv):service:tax:on:charges:any:explicit:cost:of:guarantee.:About:90U95%:of:the:premium:goes:towards:investment:portion.
Regular:Premium:Paying:Term
4Investment:+:Insurance
Non:Linked:NonUPar:Plans
Closed:Ended
Pooled Variable Refer:note:3 Front:Loaded
Single:premium:policies::2%.:For:others::25%:in:Y1,::Y2::10/5%,5%:thereafter
2%:of:the:Single:Premium.:For:non:single:premium:policies:refer:note:1.
Surrender:charges:are:embedded:in:surender:value:and:are:not:a:separate:charge.:Refer:note:8:&:9:for:minimum:surrender:value:for:single:premium:and:nonUsingle:premium:policies.
Fixed&Return&Or&Guaranteed&Savings&Products:&Based:on:Pooled:Investment.:Returns:are:called:Guaranteed:Additions:and:are:specified:as:amount:per:thousand:or:percentage:of:sum:assured.:No:NAV:concept.:Charges:are:not:capped.:Returns:declared:annually.High:Upfront:commission.:Regular:commission:as:a:percentage:of:premium.:TER:not:disclosed.:Net:Investment:Returns:Not:disclosed.:About:90U95%:of:the:premium:goes:towards:investment:portion.:Variable&Insurance&Products:Based:on:pooled:investments.:Return:or:additions:credited:to:the:policy:account:annually:or:more:frequently:as:a:percentage:of:the:policy:account.:Charges:are:capped:by:RIY:in:a:manner:similar:to:ULIPs.:No:NAV:concept.:TER:not:disclosed.::About:90U95%:of:the:premium:goes:towards:investment:portion.
Regular:Premium:Paying:Term
5
Micro:Insurance+:Investment
Non:Linked:Plans
Closed:Ended
NA NA Front:Loaded 20%
Micro:Insurance,:the:max.:sum:assured:is:capped:at:Rs:200,000:for:Term:Insurance:and:other:Life:Insurance:Products.:The:annual:premium:is:capped:at:Rs:6,000:for:non:linkeded:Variable:Insurance:plans.:RIY:is:specified:for:nonUlinked:Variable:Insurance:plans.:TER:not:disclosed.:Net:Investment:Returns:Not:disclosed.:About:90U95%:of:the:premium:goes:towards:investment:portion:for:the:savings:products.
Regular:Premium:Paying:Term
6Investment:+:Insurance
Non:Linked:Par:Plans
Closed:Ended
Pooled Variable Refer:note:3 Front:Loaded
Single:premium:policies::2%.:For:others::25%:in:Y1,::Y2::10/5%,5%:thereafter
2%:of:the:Single:Premium.:For:non:single:premium:policies:refer:note:1.
Surrender:charges:are:embedded:in:surender:value:and:are:not:a:separate:charge.:Refer:note:8:&:9:for:minimum:surrender:value:for:single:premium:and:nonUsingle:
Regular:Premium:Paying:Term
7Micro:Insurance+:Investment
Non:Linked:Plans
Closed:Ended
NA Front:Loaded20%:every:year:(10%:for:single:premium)
20%:every:year:(10%:for:single:premium)
Regular:Premium:Paying:Term
2%:of:the:Single:Premium.:For:non:single:premium:policies:refer:note:1.:For:Micro:Insurance:20%:every:year:(10%:for:single:premium)
Risk:Cover.:No:investment
Based:on:Pooled:Investment.:Returns:are:not:fixed,:declared:as:Bonus.:No:NAV:concept.:Charges:are:not:capped.:Returns:declared:annually.:High:Upfront:commission.:Regular:commission:as:a:percentage:of:premium.::TER:not:disclosed.:Net:Investment:Returns:Not:disclosed.:About:90U95%:of:the:premium:goes:towards:investment:portion.
Overview of Insurance Products

Sn. Category Products Type Investment Return Manufacturer's:cost/:charges Commission Industry:Commission Maximum:Commission Exit:Charges/:Costs Product:Structure Payment:Plan
1 Investment NPS:(Tier:II) Closed:Ended Market:LinkedVariable:Returns
Refer:note:6:for:fund:management:charges:and:note:11:for:intermediation:charges.
Not:Front:Loaded:or:Back:Loaded
0.25%:of:contributionTransaction:charges:of:Rs:20:would:apply.:Refer:note:11:for:details.
NAV:based,:NAV:is:net:of:fund:management:expenses,:Withdrawal:is:permitted.:Minimum:account:balance:is:specified.:All:other:charges:related:to:CRA:and:POP:charged:as:deduction:of:units:or:collected:from:customer:directly.:TER:not:disclosed.
Anytime
2 Pension NPS:(Tier:I) Closed:Ended Market:LinkedVariable:Returns.
Refer:note:6:for:fund:management:charges:and:note:11:for:intermediation:charges.
Not:Front:Loaded:or:Back:Loaded
Flat:fee:+:0.25%:of:contribution
Premature:exit:not:applicable:except:in:special:cases.:Transaction:charges:of:Rs:20:would:apply.:Refer:note:11:for:details:on:charges.
NAV:based,:NAV:is:net:of:fund:management:expenses,:No:Exit:other:than:death:or:maturity.::All:other:charges:related:to:CRA:and:POP:charged:as:deduction:of:units:or:collected:from:customer:directly.:Minimum:annual:investment:is:required.:Fees:and:Commissions:are:flat:fee:and:as:%:of:premium.:TER:not:disclosed.
Anytime
CRA:and:POP:Charges:comprise:of:flat:fees:and:POP:also:get:0.25%:of:contribution.:Refer:to:note:11:for:details.
Overview of NPS

Sn. Category Products Provider/4Regulator Investment Return Commission Industry4Commission Maximum4Commission Product4Structure Payment4Plan
1 Investment Deposits Banks/4RBI Closed4Ended Fixed Fixed NA0.5%4to41%.4Incentive4is4only4for4agents4doing4door4to4door4collection.4Incentive4for4staff4can4be4provided.
Returns4are4fixed4and4are4net4of4all4charges.4Lower4rate,4Charges4applicable4in4case4of4premature4exit
Recurring4Deposit4/4One4Time
2 Investment Postal4deposits Govt.4Schemes Closed4Ended Fixed Fixed NATerm4Deposits,4MIS,4KVP,44Senior4Citizen4Scheme40.5%
Returns4are4fixed4and4are4net4of4all4charges.4Lower4rate,4Charges4applicable4in4case4of4premature4exit.4NSC4does4not4permit4premature4exit.4Maximum4investment4in4a4MIS4is4Rs.44.54lakh4in4a4single4account.
Recurring4Deposit4/4One4Time
3 Investment PPF Govt.4Schemes Closed4Ended Fixed Fixed NAPPF4agents4VVV41%4of4deposit4if4amounts4are4deposited44through44the44agent.
Returns4are4fixed4and4net4of4all4charges.4Lock4in4restrictions,4minimum4annual4investment4apply.
Anytime
4 Investment NSC Govt.4Schemes Closed4Ended Fixed Fixed NA Agents4VVV41%, No4Premature4Exit. One4Time
5Investment4+4Insurance
Postal4Life4Insurance
Govt.4Schemes Closed4Ended Variable Variable Front4LoadedFront4Loaded.4PLI4VVV41st4Year40.25%4of4Sum4assured.42%4of4premium4on4renewal.4RPLI4VVV41st4Year410%4of4Premium,42.5%4on4renewal
Maximum4sum4assured4is4Rs4504lakhs.Regular4Premium4Paying4Term/4Single4Premium/4Limited4Premium4Paying4Term
Overview of Government Schemes and Bank Deposits
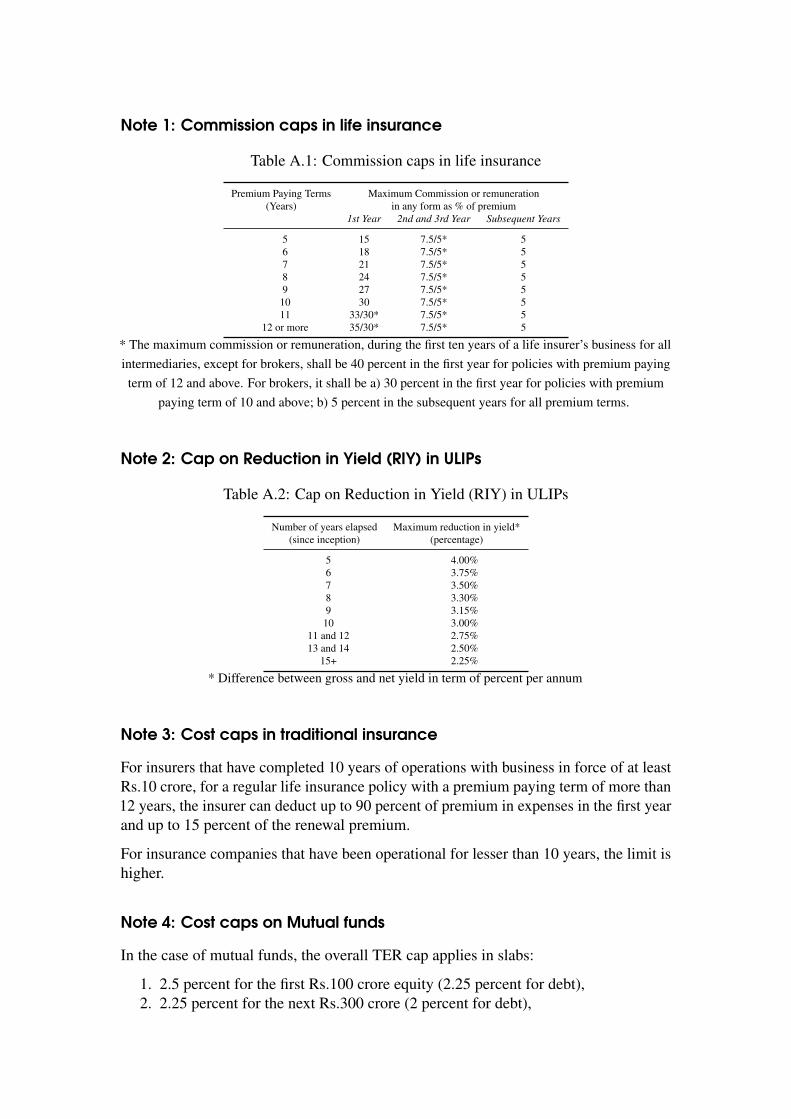
Note 1: Commission caps in life insurance
Table A.1: Commission caps in life insurance
Premium Paying Terms Maximum Commission or remuneration(Years) in any form as % of premium
1st Year 2nd and 3rd Year Subsequent Years
5 15 7.5/5* 56 18 7.5/5* 57 21 7.5/5* 58 24 7.5/5* 59 27 7.5/5* 5
10 30 7.5/5* 511 33/30* 7.5/5* 5
12 or more 35/30* 7.5/5* 5
* The maximum commission or remuneration, during the first ten years of a life insurer’s business for allintermediaries, except for brokers, shall be 40 percent in the first year for policies with premium payingterm of 12 and above. For brokers, it shall be a) 30 percent in the first year for policies with premium
paying term of 10 and above; b) 5 percent in the subsequent years for all premium terms.
Note 2: Cap on Reduction in Yield (RIY) in ULIPs
Table A.2: Cap on Reduction in Yield (RIY) in ULIPs
Number of years elapsed Maximum reduction in yield*(since inception) (percentage)
5 4.00%6 3.75%7 3.50%8 3.30%9 3.15%
10 3.00%11 and 12 2.75%13 and 14 2.50%
15+ 2.25%
* Difference between gross and net yield in term of percent per annum
Note 3: Cost caps in traditional insurance
For insurers that have completed 10 years of operations with business in force of at leastRs.10 crore, for a regular life insurance policy with a premium paying term of more than12 years, the insurer can deduct up to 90 percent of premium in expenses in the first yearand up to 15 percent of the renewal premium.
For insurance companies that have been operational for lesser than 10 years, the limit ishigher.
Note 4: Cost caps on Mutual funds
In the case of mutual funds, the overall TER cap applies in slabs:
1. 2.5 percent for the first Rs.100 crore equity (2.25 percent for debt),2. 2.25 percent for the next Rs.300 crore (2 percent for debt),

3. 2 percent for the next Rs.300 crore (1.75 percent for debt) and4. 1.75 percent for the balance (1.5 percent for debt).5. In respect of a scheme investing in bonds such recurring expenses shall be lesser
by at least 0.25 per cent of the daily net assets outstanding in each financial year.
Note 5: Additional Expenses permitted to MF for distribution in B15 cities
Additional expenses not exceeding of 0.30 per cent of daily net assets, if the new inflowsfrom B15 are at least:
1. 30 per cent of gross new inflows in the scheme, or;2. 15 per cent of the average AUM (year to date) of the scheme, whichever is higher:
If inflows from such cities is less than as specified above, such expenses on daily netassets of the scheme shall be charged on proportionate basis.
The expenses charged under this clause shall be utilised for distribution expenses incurredfor bringing inflows from such cities.
The amount incurred as expense on account of inflows from such cities shall be creditedback to the scheme in case the said inflows are redeemed within a period of one yearfrom the date of investment.
Note 6: AUM based cost caps on NPS
1. Private Sector in NPS: 0.01 percent of AUM pa.2. NPS Schemes for Govt.: 0.0102 percent pf AUM pa.3. NPS Lite: 0.0102 percent pa.
CRA and POP Charges are outside of the PFM charge and comprise of flat fees and POPalso get 0.25 percent of contribution.
Note 7: Discontinuation Charges
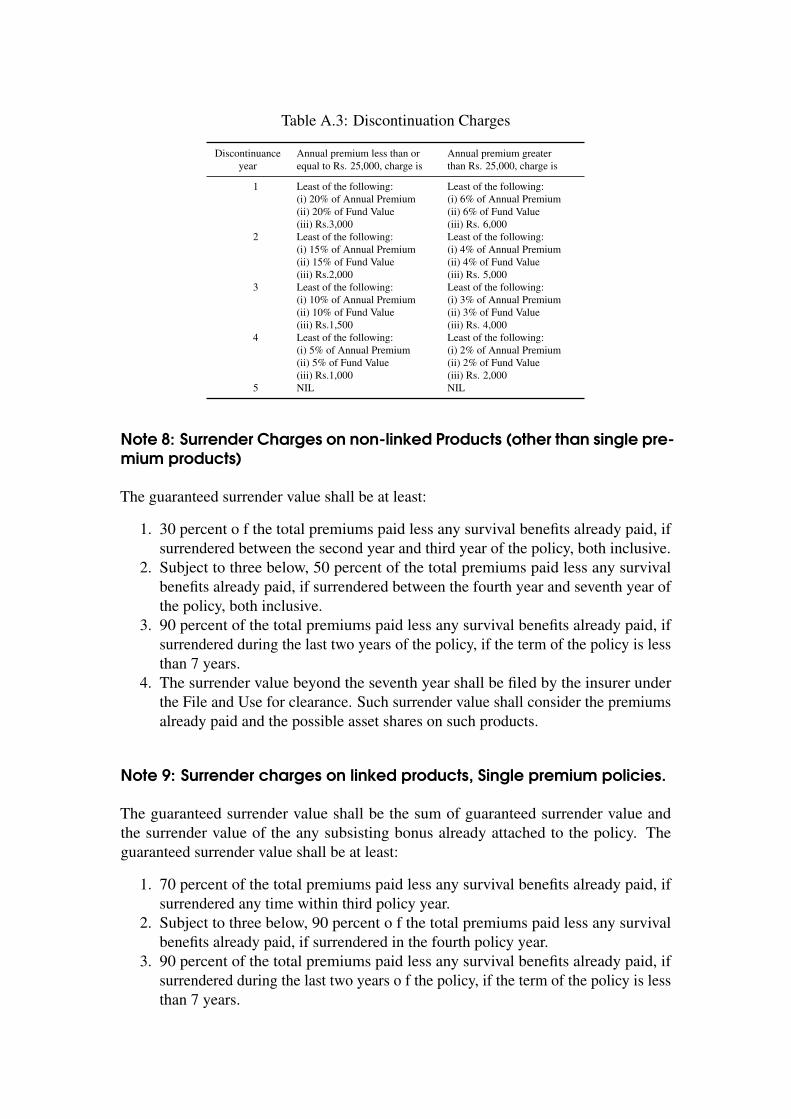
Table A.3: Discontinuation Charges
Discontinuance Annual premium less than or Annual premium greateryear equal to Rs. 25,000, charge is than Rs. 25,000, charge is
1 Least of the following: Least of the following:(i) 20% of Annual Premium (i) 6% of Annual Premium(ii) 20% of Fund Value (ii) 6% of Fund Value(iii) Rs.3,000 (iii) Rs. 6,000
2 Least of the following: Least of the following:(i) 15% of Annual Premium (i) 4% of Annual Premium(ii) 15% of Fund Value (ii) 4% of Fund Value(iii) Rs.2,000 (iii) Rs. 5,000
3 Least of the following: Least of the following:(i) 10% of Annual Premium (i) 3% of Annual Premium(ii) 10% of Fund Value (ii) 3% of Fund Value(iii) Rs.1,500 (iii) Rs. 4,000
4 Least of the following: Least of the following:(i) 5% of Annual Premium (i) 2% of Annual Premium(ii) 5% of Fund Value (ii) 2% of Fund Value(iii) Rs.1,000 (iii) Rs. 2,000
5 NIL NIL
Note 8: Surrender Charges on non-linked Products (other than single pre-mium products)
The guaranteed surrender value shall be at least:
1. 30 percent o f the total premiums paid less any survival benefits already paid, ifsurrendered between the second year and third year of the policy, both inclusive.
2. Subject to three below, 50 percent of the total premiums paid less any survivalbenefits already paid, if surrendered between the fourth year and seventh year ofthe policy, both inclusive.
3. 90 percent of the total premiums paid less any survival benefits already paid, ifsurrendered during the last two years of the policy, if the term of the policy is lessthan 7 years.
4. The surrender value beyond the seventh year shall be filed by the insurer underthe File and Use for clearance. Such surrender value shall consider the premiumsalready paid and the possible asset shares on such products.
Note 9: Surrender charges on linked products, Single premium policies.
The guaranteed surrender value shall be the sum of guaranteed surrender value andthe surrender value of the any subsisting bonus already attached to the policy. Theguaranteed surrender value shall be at least:
1. 70 percent of the total premiums paid less any survival benefits already paid, ifsurrendered any time within third policy year.
2. Subject to three below, 90 percent o f the total premiums paid less any survivalbenefits already paid, if surrendered in the fourth policy year.
3. 90 percent of the total premiums paid less any survival benefits already paid, ifsurrendered during the last two years o f the policy, if the term of the policy is lessthan 7 years.
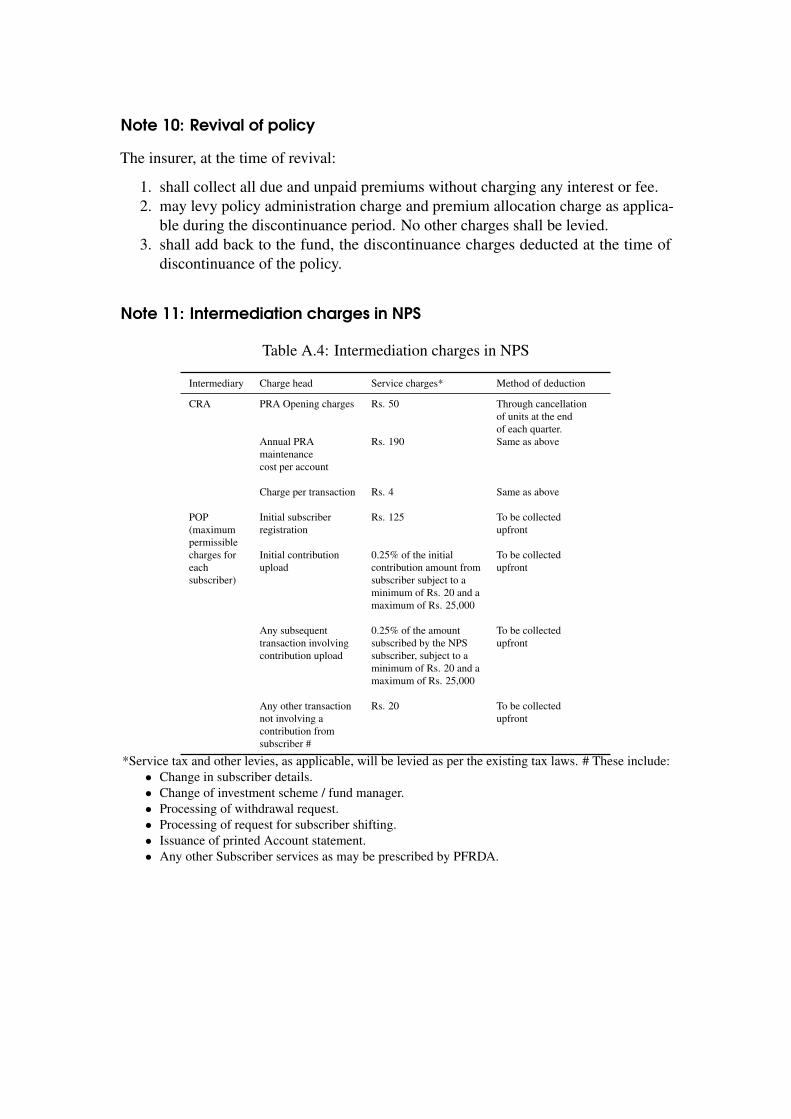
Note 10: Revival of policy
The insurer, at the time of revival:
1. shall collect all due and unpaid premiums without charging any interest or fee.2. may levy policy administration charge and premium allocation charge as applica-
ble during the discontinuance period. No other charges shall be levied.3. shall add back to the fund, the discontinuance charges deducted at the time of
discontinuance of the policy.
Note 11: Intermediation charges in NPS
Table A.4: Intermediation charges in NPS
Intermediary Charge head Service charges* Method of deduction
CRA PRA Opening charges Rs. 50 Through cancellationof units at the endof each quarter.
Annual PRA Rs. 190 Same as abovemaintenancecost per account
Charge per transaction Rs. 4 Same as above
POP Initial subscriber Rs. 125 To be collected(maximum registration upfrontpermissiblecharges for Initial contribution 0.25% of the initial To be collectedeach upload contribution amount from upfrontsubscriber) subscriber subject to a
minimum of Rs. 20 and amaximum of Rs. 25,000
Any subsequent 0.25% of the amount To be collectedtransaction involving subscribed by the NPS upfrontcontribution upload subscriber, subject to a
minimum of Rs. 20 and amaximum of Rs. 25,000
Any other transaction Rs. 20 To be collectednot involving a upfrontcontribution fromsubscriber #
*Service tax and other levies, as applicable, will be levied as per the existing tax laws. # These include:• Change in subscriber details.• Change of investment scheme / fund manager.• Processing of withdrawal request.• Processing of request for subscriber shifting.• Issuance of printed Account statement.• Any other Subscriber services as may be prescribed by PFRDA.


Annex C: International experience
International evidence
USA
The USA does not have a single agency to oversee and regulate the entire spectrum ofconsumer finance products. Advisors are regulated at the state or federal level. If anadvisor functions only in one state, regulations of that particular state apply. However,the federal Investment Advisors Act of 1940 applies if the advisor functions:107
1. In more than one state;2. In one state but has assets under management of not less than US$25 million; or3. Is an advisor to a company registered under Title 1 of the Act
Advisors to hedge funds and private equity funds were outside its purview of theInvestment Advisors Act of 1940.108 In 2010, the Dodd–Frank Wall Street Reform andConsumer Protection Act was passed in an attempt to bridge this regulatory gap.
The latest effort to address the problem of multiple authorities overseeing advisors isthe Bureau of Consumer Financial Protection109 within the Federal Reserve, which wasestablished under the Dodd–Frank Wall Street Reform and Consumer Protection Actto regulate products such as credit; deposits; on-line banking; property purchases; andfinancial advisory services. The Bureau aims to:
1. Educate customers against defensive practices;2. Enforce federal consumer financial laws and restrict unfair, deceptive or abusive
practices; and3. Study consumers, providers and markets.
While the Bureau’s first task is to solve the problems in the mortgage market, the Bureauis eventually expected to turn its attention to other consumer finance products. TheBureau’s focus is on regulating disclosure and ensuring transparency in the products thatare sold to the customer. In addition, the Bureau aims to promote financial literacy toenable customers to make better choices in the financial products space.
A recent debate in the US in the distribution space has been sparked by the report on theimpact of conflicted advice on the roll over of retirement savings of Americans from401(k) plans to Individual Retirement Accounts.110 The report points out that the rollover to IRAs is often motivated by advice which gains to earn larger fees from thisswitch, and results in investment losses to customers.
107For more details, refer to Section 203A of The Investment Advisors Act of 1940.108Advisors to private funds were not required to register with the SEC because of an exemption that
applied to advisors with fewer than 15 clients. This exemption counted each fund as a client, as opposedto each investor in a fund. As a result, some advisors remained outside of regulatory oversight even if theywere managing large sums of money for the benefit of hundreds of investors.
109http://www.consumerfinance.gov/110White House, see n. 39.
UK
The most important reform in the UK with regards to financial intermediaries is the RetailDistribution Review (RDR), which was launched by the Financial Services Authority(FSA) in June 2006 to scrutinize the way in which financial products were sold and howadvice was provided to retail customers. The specific aim of the RDR was identifyingand addressing the root causes of the persistent problems in the retail investment market(across banks, life insurers, financial advisors, building societies and fund managers).
The FSA identified the following five themes to be addressed by the review. These were:
• Sustainability of the distribution sector• Impact of incentives• Professionalism and reputation• Consumer access to financial products and services• Regulatory barriers and enablers
Post consultation, the FSA identified three measures that they regarded as fundamentalto delivering the desired market outcomes, and were implemented on 31 December2012.111 The RDR has three main components:
1. Advisor charging;2. Disclosing advice services; and3. Professionalism.
The RDR requires all advisor firms offering investment advice to retail consumers tointroduce advisor charging, where retail investment products include pensions; annu-ities; bonds; ETFs; and collective investments. As a result, advisors are now paid bycustomers instead of being paid by commissions from the product providers in returnfor recommending their products. The new advisor charging rules mean that all firmsthat give retail investment advice (such as banks, independent financial advisors, wealthmanagers, stockbrokers and product providers on their own products) have to:
• Set their own charging structure;• Have a charging structure based on the level of service they provide;• Disclose charges to clients upfront, using some form of price list or tariff; and• Deliver an ongoing service when an ongoing fee is levied, unless the product is a
regular payment product.
For non-advise services, advisors can choose whether they will be paid by commissionsor through the advisor charging agreement. However, services related to personalrecommendations (i.e. advice, such as arranging the execution of a transaction orconducting administrative tasks associated with the transaction) must be subject to theadvisor charging agreements.
The RDR also addressed the role of platforms in the intermediation of investmentproducts. Platforms serve two main goals in the retail investment market: administrationand distribution. The current charging of an annual management fee of 150 bp is splitinto 75 bp for the fund manager and a rebate of 75 bp. This rebate is then again split
111FSA, “Consultation Paper 09/18, Distribution of retail investments: Delivering the RDR”, in: (2009).

into a typical advisor commission of 40-50 bp and a platform charge of 30-50 bp. Themain elements of platforms under the RDR are:
• All commissions and fees must be disclosed to the client;• Cash rebates will not be allowed but rather will be rebates of the fund manager’s
commission in the form of additional shares or units, which can be passed to theconsumer;
• Platforms have to act to the clients’ best interest;• Communication has to be in defined quality;• Platforms can facilitate Advisor Charging payments but need to follow rules as
product providers do, as well as client instructions; and• Payments to the advisor can be made from client’s cash account at the platform.
In many respects the longer-term effects of the RDR are yet to become clear, but theevidence from the first stage of the review is positive. There are encouraging signs thatthe RDR is on track to deliver its objectives.112 In particular, removing commissionpaid by providers to advisors and platforms has reduced product bias from advisorrecommendations. This is reflected in a decline in the sale of products which paid highercommissions before the RDR was implemented. It has also made it easier for customersand advisors to compare platforms, increasing competitive pressure and significantlyreducing Direct-to-Consumer (D2C) platform charges.
Product prices have fallen by at least the amounts paid in commission before the RDRwas implemented, and some product prices have fallen even further. This is due inpart to the introduction of simpler products and funds (which have a lower chargeand advisors) and platforms exerting more competitive pressure on providers, withplatforms increasingly able to negotiate lower product costs. Removing commissionsalso means that providers who sold lower or no commission products before the RDRwas implemented are now competing on a more equal basis. Advisor charging is likelyto have increased since the RDR was implemented, at least for some consumers. Alonger-term review of prices will bring greater clarity on the effect of the RDR on thetotal cost of investment.
Most advisors are now qualified to the new minimum standards, and there has been anincrease in the number of advisors going beyond these minimum standards. The increasein qualifications (along with greater focus on provision of ongoing advice services)indicate positive steps towards increasing professionalism in the advice market.
Overall, firms appear slightly better placed to deliver on their long-term commitments,with average revenues and profitability of advisory firms having both increased. The costto firms of complying with the RDR has been in line with or lower than expectations,with ongoing costs largely absorbed into business as usual costs by the industry.
The FCA has, two years since the RDR was implemented, commenced the first phaseof its post-implementation review. The review is being undertaken by external con-sultants, Europe Economics, in order to ensure independence. Phase one of the post-implementation review addressed the extent to which the RDR is on course to deliver its
112FCA, “Post-implementation review of the RDR - Phase 1”, in: (December, 2014).
original aims, and to flag any immediate issues.113 Phase two of the post-implementationreview will be published in 2017.
Australia
Australia is one of the first countries to have separated prudential and distributionregulation, and has a dedicated regulator for customer protection called the ASIC.114 Thelegal framework for regulating advisors under ASIC is guided by the Corporations Act2001 and regulatory guides provided by ASIC. Detailed definitions of what constitutesa financial product and financial service are given, where financial product advice isdefined to be a financial service. All personal advice must comply with rules, i.e. the“suitability” rule or “reasonable basis for advice” rule, which require the advisor tounderstand clients’ personal circumstances, and ensure the appropriateness of advice.
Financial advisors must hold a Australian Financial Services Licence (AFSL), andcomply with the disclosure requirements. These include providing:
1. A Financial Services Guide to each retail client;2. A detailed statement of advice that sets out the advice and the basis on which it
was provided;3. All information on remuneration (and other benefits) the advisor (or a related
entity) may receive; and4. Information on any relationship of the advisor that may have influenced the
particular advice.
Advisors also have to meet certain training and competency requirements.
However, regulatory gaps and flaws in the distribution structure have resulted in financialscandals. In particular, existing remuneration arrangements has distorted incentivesof product suppliers. Fee-for-service advisors are paid directly by the customer, andcommissions; bonuses; and soft-dollar incentives financed by the product providers con-tinue to exist. As customer-based and provider-based fees both exist, most remunerationstill comes from the product provider, and development of a customer-focused marketfor advise has been diluted. These issues were emphasized during the global financialcrisis, and after sever financial scandals (such as the Storm Financial scandal), Australiaconducted a review with the aim of reforming the financial product distribution systemin 2008.
This resulted in the Future of Financial Advice (FOFA) package. The FOFA reformsfocus on improving the quality of financial advice and expanding the availability ofmore affordable forms of advice. The key proposals of FOFA include:
• Banning of up-front and trailing commissions;• Banning of volume based payments;
113See Europe Economics, Retail Distribution Review Post Implementation Review, tech. rep., 2014,URL: http://www.fca.org.uk/static/documents/research/rdr-post-implementation-review-europe-economics.pdf, for findings from phase one.
114See http://www.asic.gov.au for details

• Banning of soft-dollar benefits115;• Setting up a statutory best interest duty for financial advisors;• An opt-in scheme whereby clients will have to agree to paying fees to advisors
every two years;• Providing the option of “scaled advise” instead of “holistic advise”; and• A compensation scheme whereby clients will have to be compensated for bad/un-
suitable advice.116
Australia has also ensured, unlike under the UK RDR, that there is no provision to allowfor “tied-agents”.
EU
The EU established a group on Packaged Retail Investment Products (PRIPs) in 2009,under its Markets in Financial Instruments Directive (MiFID) Implementing Directive.The focus of this group was on pre-contractual product disclosures and rules on salespractices. The European Commission committed itself to developing a new, horizontallegislative approach in these two areas, drawing on the best of existing requirements butapplying these to all relevant products and sales channels. The aim was to achieve aconsistent and coherent overall approach.117 The key proposals include:
• Harmonised requirements for disclosure across retail investment products. Thisincludes requirements for disclosures to be fair, and clear, using plain languageand a short format; and
• Sales requirements.
After the publishing of this report, the debate in the EU was between a) banningcommissions for all advisors versus just independent advisors, b) focusing only onenhancing disclosures without banning third party inducements.
The MiFID II proposals in 2012 retained the notion of independent advice, leavingopen the possibility that commissions could be paid to non-independent advice. In2014, the European Securities and Markets Authority (ESMA), published its final reporton the MiFID II.118 These cover a wide range of topics including investment advice,commissions, complaints handling, product governance, and transparency. There areextensive product governance requirements on both manufacturers and distributorsof investment products. One of these is to identify a “target market” at the time ofproduct development. Distributors need to understand this market, and make their ownassessment of the appropriate “target market” for each product. The document alsoproposes strict rules aound inducements, include commissions.
115This is defined as any benefit received by a financial planning firm, its representatives or associates,other than basic monetary commissions or direct client advice fees.
116For more details see Review of compensation arrangements for consumers of financial services.117EU, Packaged Retail Investment Products: Issues for discussion, PRIPs Workshop, Brussels, Oct.
2009.118ESMA, ESMA’s Technical Advice to the Commission on MiFID II and MiFIR, Final Report ESMA
/2014/1569, European Securities and Markets Authority, Dec. 2014.
The report is now with the European Commission, which is likely to draft and adoptDelegated Acts using these recommendations. These are likely to come into forcewithin three to nine months, if accepted without any objections by the EU Parliament orCouncil.119
South Africa
The National Treasury of South Africa launched a formal review of the financial regula-tory system in 2007. The scope of this review was expanded in 2008 after the globalfinancial crisis and, in 2011, the National Treasury published a report entitled A SaferFinancial Sector to serve South Africa Better,120 to address the recession resulting fromthe crisis. The report reviewed the key challenges in South Africa’s financial sector, andset out a new framework with the following four objectives at its core:
1. Financial stability;2. Consumer protection and market conduct;3. Expanding access through financial inclusion; and4. Combating financial crime.
As part of the proposal on how to achieve these objectives, a ‘twin peak’ model wasproposed, with separate prudential and market conduct regulators.
The Financial Services Board (FSB) (an independant institution aimed at overseeingthe non-banking financial services industry in South Africa) is guided by the FinancialAdvisory and Intermediary Services Act (FAIS Act), and is responsible for supervisingfinancial advisory and intermediary activities in the financial services sector.
The FAIS Act made progress in raising intermediary professionalism, improving dis-closure to clients and mitigating certain conflicts of interest. However, poor customeroutcomes and mis-selling of financial products persisted. As a result, the FSB initiatedthe RDR.121
The RDR describes the current landscape in South Africa from the following threeperspectives:
1. Types of service provided by intermediaries;2. Types of relationships between intermediaries and product suppliers; and3. Types of remuneration earned for the services concerned.
Key findings and current regulation structure
The key findings of the RDR can be grouped into under two categories.
119http://blogs.deloitte.co.uk/financialservices/2015/01/mifid-ii.html120Republic of South Africa National Treasury, A Safer Financial Sector to serve South Africa Better,
2011-02-23, URL: http://www.treasury.gov.za/documents/national%20budget/2011/A%20safer%20financial%20sector%20to%20serve%20South%20Africa%20better.pdf.
121See Financial Services Board, Retail Distribution Review 2014, 2014, URL: http : / / www .moneymarketing.co.za/files/2014/11/FSB-7-Nov-RDR-paper.pdf, for details.
1. Advice and non-advice models
There is a clear distinction between advice and non-advice distribution models.Though the term “Advice” is defined in law, non-advice distribution activitiescome under the wider definition of “intermediary services”.
Execution only product sales (referred to as non-advised product sales) should fallwithin this definition of “intermdiary services”, though differences in interpreta-tion have resulted in some execution only models being designed to fall outsidethe regulatory net.
2. Commissions
The current commission based system (applied mainly to the insurance sector)requires full disclosure of commission to the customer. The maximum amount ofcommission payable (expressed as a percentage of the premium payable) and theway it is paid are both regulated.
The insurer pays commissions directly to the intermediary, which is then recoveredthrough expense charges built into the insurance premium calculation i.e. they arenot deducted directly from the premiums or from the policy value, but recoveredindirectly over the life of the policy.
Commission are either paid:
(a) Up front when the policy is entered into (life risk insurance policies);(b) On an ongoing basis as premiums are received (general insurance, called
short-term insurance in South Africa); or(c) Partially up front and partially on an ongoing basis (investment policies sold
by life insurers).
For non-insurance investment products, intermediaries are remunerated throughadvice fees authorised by the customer that are deducted directly from the valueof the investment. Full disclosure of these fees to the customer is required, andthese fees are either:
(a) Up front in the case of lump sum single investments; or(b) On an ongoing basis in the case of ongoing instalment (usually structured as
a percentage of the investment value from time to time).
Proposed regulatory reforms
The RDR approaches the current landscape in South Africa from three perspectives.
1. Services provided by intermediaries.
The RDR proposes defining the following three types of advice:

(a) Financial planning (advice on structuring and arranging a customer’s finan-cial resources to meet goals);
(b) Up-front product advice (a recommendation on the suitability of a productto the identified needs of the customer); and
(c) Ongoing product advice (a recommendation on changes to product solutionsduring the life of a product, in response to changing market conditions orcustomer needs).
The RDR then sets proposed standards for each of these, including intermediarydisclosure requirements and steps for mitigating and managing certain conflicts ofinterest.
2. Relationships between intermediaries and product suppliers.
In line with defining the types of advice that can be offered to a customer, theRDR proposes the following definitions of types of advisers:
(a) Independent Financial Advisors (IFAs);(b) Multi-tied advisers; and(c) Tied advisers.
The RDR proposes that an adviser qualifies as an IFA by meeting criteria relatingto:
(a) The choice of product and product supplier; and(b) Being free from product supplier influence.
A tied adviser has a relationship with a product supplier that restricts the ad-viser to providing advice only in relation to the products of that product supplier.An adviser that is not tied and does not meet the IFA criteria is a multi-tied adviser.
Standards for product suppliers’ responsibilities are proposed for each type ofadviser, with the product supplier taking full responsibility for the advice providedby its tied advisers. In the case of multi-ties advisers, product suppliers andmulti-tied advisers are to share responsibility for the quality of advice providedto their shared customers. Standards are also proposed for a product supplier’sresponsibility for non-advice sales.
3. Remuneration earned for the services concerned.
Among the proposals relating to remuneration, the most notable is the one banningcommissions for all investment products, stating that:
“product suppliers will be prohibited from paying any form of remuneration tointermediaries in respect of investment products, and from including any costs as-

sociated with intermediary remuneration in product charging structures, whetherin the form of ongoing charges or early termination charges. Intermediarieswill correspondingly be prohibited from earning any form of remuneration inrespect of investment products other than advice fees agreed with the customer, inaccordance with the applicable requirements for such fees.”122
122See FSB, see n. 121, for details.

Annex D: Disclosure form

Serial No.
DITRIBUTOR-INVESTOR MUTUAL FUND DISCLOSURE FORM
--------------------------------------------------------------------- Asset Management Company Details: Name: Year of Establishment: Net Worth: (Regulatory requirement: 50 Cr) Scheme Details: Scheme Name: Scheme Type : NFO/Existing Scheme Open Ended/Close Ended
If Existing Scheme Current NAV: Number of folios: Scheme AUM (in Cr):
Asset mix(Equity/Debt/Gold---- in percentage terms): Benchmark: Riskometer: Past Returns Since Inception: CAGR Absolute Return Scheme Return (%) Benchmark Return (%) (Past performance is not necessarily indicative of future results)
Investor Profile & Investment Details Investment Horizon or Scheme works best if held for: Investor’s Existing Asset Allocation (in percentage terms): Equity: Debt: Gold: Others: Investor Risk Profile: (High/Medium/Low) Investment Amount Upfront: Periodic: If this investment is being made by first selling off another mutual fund scheme held by the investor, specify reasons for the same: Total Expenses(TER) charged to the Investor < .5% < 0.5% to 1% < 1% to 1.5% < 1.5% to 2% >2%
Time of Investment : Annual (Trail Commission) : Exit Load: Any Other Expense : Signatures: Distributor’s Person Investor Date:
Distributor’s (Firm/Entity) Name: Distributor’s Person’s Name: EUIN: Investor’s Name: Date of Birth:
Annex E: UK benefit illustration
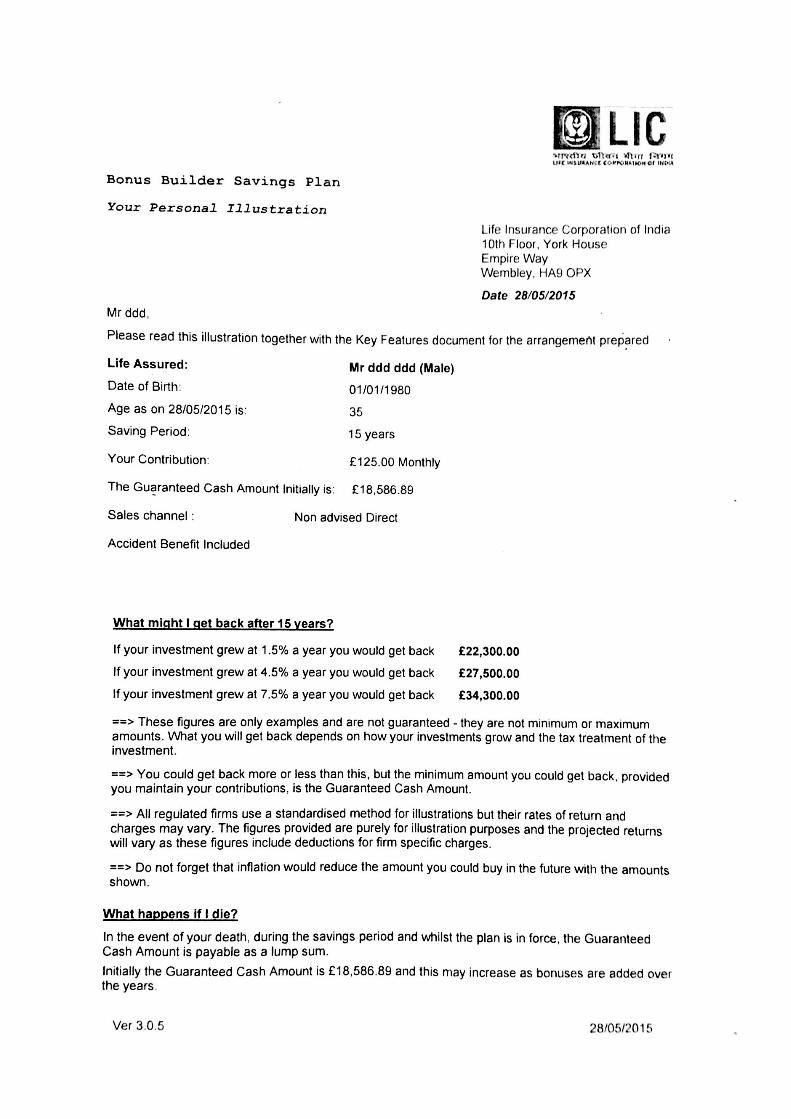

Annex F: List of consultations

The Committee met the following people for its consultations
• Second meeting, 23rd January 2015– Shri Parag Basu, CGM SEBI– Shri Vimal Bhatter, AGM, SEBI– Ms Meena Kumari, Head of Department (Actuarial), IRDA– Ms Sumeet Kaur Kapoor, GM, PFRDA, NPS Trust– Shri V.K. Sharma, MD, LIC of India– Shri Leo Puri, MD, UTI AMC– Mr Suraj Kaley, Group President (Sales & Marketing), UTI-AMC
• Third meeting, 24th March 2015– Shri B.N. Chary, Life Insurance Agents Federation of India– Shri. Gurpreet Singh, Financial Intermediaries Association of India (FIAI)– Shri Vishal Kapoor, Financial Intermediaries Association of India (FIAI)– Shri Rajesh Kumar Gupta, National Federation of Field Workers of India– Shri Satish Menon, Geojit BNP Paribas– Shri Vijay Bhushan, ANMI– Shri Naresh Tejwani, ANMI– Shri Sohan Lal Kadel, Insurance Brokers Association of India
• Sixth meeting, 16 April, 2015– Shri Sandeep Batra, ED, ICICI Prudential– Shri Sanjeev Pujari, ED, SBI Life Insurance– Ms Madhuri Kulkarni, Chief (Actuarial), LIC– Shri P.K Arora, Appointed (Actuary), LIC– Ms Pourima Gupte, WTM, Actuary, IRDA
• Seventh meeting, 22 April, 2015– Shri A. Balasubramanian, AMFI– Shri H. Bindal, AMFI Board Member– Shri Balkrishna Kini, Deputy Chief Executive, AMFI

Bibliography
America, United States of, Dodd–Frank Wall Street Reform and Consumer ProtectionAct, 2010, URL: http://www.gpo.gov/fdsys/pkg/PLAW-111publ203/html/PLAW-111publ203.htm.
Anagol, Santosh, Shawn Cole, and Shayak Sarkar, Understanding the Incentives ofCommissions Motivated Agents: Theory and Evidence from the Indian Life InsuranceMarket, Working Paper 12-055, Harvard Business School, Jan. 2012.
Anagol, Santosh and Hugh Hoikwang Kim, “The Impact of Shrouded Fees: Evidencefrom a Natural Experiment in the Indian Mutual Funds Market”, in: American Eco-nomic Review 102.1 (2012), pp. 576–93, URL: http://EconPapers.repec.org/RePEc:aea:aecrev:v:102:y:2012:i:1:p:576-93.
Australia, Commonwealth of, Corporations Act 2001, 2001, URL: http : / / www .austlii.edu.au/au/legis/cth/consol_act/ca2001172/.
Banerjee, Abhijit and Esther Duflo, “Do Firms Want to Borrow More? Testing CreditConstraints Using a Directed Lending Program”, in: The Review of Economic Studies81.2 (2014), pp. 572–607.
Basel Committee on Banking Supervision, Customer suitability in the retail sale offinancial products and services, tech. rep., Bank for International Settlements, Apr.2008.
Board, Financial Services, Retail Distribution Review 2014, 2014, URL: http://www.moneymarketing.co.za/files/2014/11/FSB-7-Nov-RDR-paper.pdf.
Bordo, Michael D. and Peter L. Rousseau, “Historical evidence on the finance-trade-growth nexus”, in: Journal of Banking & Finance 36.4 (Apr. 2012), pp. 1236–1243.
Committee on Investor Awareness and Protection, Minimum Common Standards forFinancial Advisers and Financial Education, A Consultation Paper, Chaired by D.Swarup, Chairman PFRDA, Government of India, 2010.
DEA, Task Force on Financial Redress Agency, Office Order No 16/3/2013-FSLRC(Part I), FSLRC Divison, Department of Economic Affairs, Ministry of Finance,Government of India, May 2015.
Ericson, Richard V. and Aaron Doyle, “The Institutionalization Of Deceptive Sales InLife Insurance”, in: British Journal of Criminology 46 (Sept. 2006), pp. 993–1010.
ESMA, ESMA’s Technical Advice to the Commission on MiFID II and MiFIR, FinalReport ESMA /2014/1569, European Securities and Markets Authority, Dec. 2014.
EU, Packaged Retail Investment Products: Issues for discussion, PRIPs Workshop,Brussels, Oct. 2009.
Europe Economics, Retail Distribution Review Post Implementation Review, tech. rep.,2014, URL: http://www.fca.org.uk/static/documents/research/rdr-post-implementation-review-europe-economics.pdf.
FCA, “Post-implementation review of the RDR - Phase 1”, in: (December, 2014).FSA, “Consultation Paper 09/18, Distribution of retail investments: Delivering the RDR”,
in: (2009).Halan, Monika, Ignore ULIP hardsell, look at costs instead, Indian Express, May 2006.Halan, Monika, Renuka Sane, and Susan Thomas, “The case of the missing billions:
estimating losses to customers due to mis-sold life insurance policies”, in: Journal ofEconomic Policy Reform 17.4 (2014).
Inderst, Roman and Marco Ottaviani, “Misselling through Agents”, in: American Eco-nomic Review 99.3 (2009), pp. 883–908.
India, Government of, Income Tax Act, 1962, 1961, URL: http://www.incometaxindia.gov.in/Pages/acts/income-tax-act.aspx.
IRDA, Annual Report, 2010-11, 2011.– Unit linked products - Cap on charges, Circular No: 20/IRDA/Actl/ULIP/09-10, July
2009.John, Richard S., Review of compensation arrangements for consumers of financial ser-
vices, Statutory Compensation Review, Future of Financial Advice, Commonwealthof Australia, 2011.
KPMG and CII, Indian Mutual Fund Industry: The Future in a Dynamic EnvironmentOutlook for 2015, KPMG and CII Report, June 2009.
Levine, Ross, “Finance and Growth: Theory and Evidence”, in: Handbook of EconomicGrowth, ed. by Philippe Aghion and Steven N. Durlauf, Amsterdam: Elsevier, 2005,pp. 865–934.
Loewenstein et. al., The Limits of Transparency: Pitfalls and Potential of DisclosingConflicts of Interest, tech. rep., Papers and Proceedings, American Economic Review,2011.
McKinsey & Company, India Insurance Vision 2025: Building a USD 250 billioncustomer centric and value creating industry, Prepared for Confederation of IndianIndustry (CII), 2015.
National Treasury, Republic of South Africa, A Safer Financial Sector to serve SouthAfrica Better, 2011-02-23, URL: http://www.treasury.gov.za/documents/national%20budget/2011/A%20safer%20financial%20sector%20to%20serve%20South%20Africa%20better.pdf.
Patnaik, Ila and Ajay Shah, Reforming India’s Financial System, tech. rep., CarnegieEndowment for International Peace, Jan. 2014.
PersonalFN.com, Case study: Mis-selling of ULIPs, Aug. 2007.RBI, Reserve Bank of India Annual Report, tech. rep., Reserve Bank of India, 2014.

Sahoo, M. S. and Renuka Sane, A regulatory approach to financial product advice anddistribution, Working Paper WP-2011-029, IGIDR, Nov. 2011.
SEBI, Concept Paper on Regulation of Investment Advisors, Concept Paper, Securitiesand Exchange Board of India, 2011.
– Mutual Funds- Empowering investors through transparency in payment of commissionand load structure, SEBI/IMD/CIR No. 4/ 168230/09, June 2009.
– Securities and Exchange Board of India (Investment Advisers) Regulations, 2013,tech. rep. No. LAD-NRO/GN/2012-13/31/1778, SEBI, 2013.
Securities and Exchange Commission, Investment Advisors Act of 1940, 1940, URL:https://www.sec.gov/about/laws/iaa40.pdf.
Shah, Ajay, “Indian pension reform: A sustainable and scalable approach”, in: Managingglobalisation: Lessons from China and India, ed. by David A. Kelly, Ramkishen S.Rajan, and Gillian H. L. Goh, World Scientific, 2006, chap. 7.
Srikrishna, Justice B. N., Financial Sector Legislative Reforms Commission, vol. I andII, Ministry of Finance, Mar. 2013.
White House, The Effects Of Conflicted Investment Advice on Retirement Savings, tech.rep., Executive Office of the President of the United States, Feb. 2015.