-NAL=NEJC BKN =J@ NAOLKJ@EJC PK BKK@ =J@ … · i PREFACE The proposal to develop a Response...
93
5 H V S R Q V H $ Q D O \ V L V 5 H V S R Q V H , P S O H P H Q W D W L R Q 0 R Q L W R U L Q J D Q G ( Y D O X D W L R Q 5 H V S R Q V H 3 O D Q Q L Q J 5 H V S R Q V H 2 S W L R Q V , G H Q W L I L F D W L R Q 6 L W X D W L R Q $ Q D O \ V L V & X U U H Q W )RUHFDV W H G 5 H V S R Q V H 2 S W L R Q V 6 F U H H Q L Q J
Transcript of -NAL=NEJC BKN =J@ NAOLKJ@EJC PK BKK@ =J@ … · i PREFACE The proposal to develop a Response...

I19
94
E/1
/12
.10

A RESPONSE ANALYSIS FRAMEWORK FOR
FOOD AND NUTRITION SECURITY INTERVENTIONS
AT INTER-CLUSTER AND CLUSTER LEVEL
Drawing on work done in relation to the IPC (version 1.1)
and the IASC Cluster System in Somalia
A Facilitation Guide
Food and Agriculture Organization of the United Nations
Rome, 2011

2
2
The designations employed and the presentation of material in this information product do not imply
the expression of any opinion whatsoever on the part of the Food and Agriculture Organization of the
United Nations (FAO) concerning the legal or development status of any country, territory, city or area
or of its authorities, or concerning the delimitation of its frontiers or boundaries. The mention of
specific companies or products of manufacturers, whether or not these have been patented, does not
imply that these have been endorsed or recommended by FAO in preference to others of a similar
nature that are not mentioned. The views expressed in this information product are those of the
author(s) and do not necessarily reflect the views of FAO.
All rights reserved. FAO encourages the reproduction and dissemination of material in this information
product. Non-commercial uses will be authorized free of charge, upon request. Reproduction for
resale or other commercial purposes, including educational purposes, may incur fees. Applications for
permission to reproduce or disseminate FAO copyright materials, and all queries concerning rights and
licences, should be addressed by e-mail to [email protected] or to the Chief, Publishing Policy and
Support Branch, Office of Knowledge Exchange, Research and Extension, FAO, Viale delle Terme di
Caracalla, 00153 Rome, Italy.
© FAO 2011

i
PREFACE
The proposal to develop a Response Analysis Framework (RAF) for food
security in emergencies was grounded in the understanding that whilst
situation analysis of food security has improved in recent years (through
initiatives such as World Food Program’s (WFP) Strengthening Emergency
Needs Assessment Capacity (SENAC) project and the Integrated Phase
Classification (IPC)), this has not been systematically translated into more
appropriate and justified responses to food security problems. Globally, a
number of reviews have recognised the gap that exists in the link between
food security situation and forecast analysis and programming.
Response analysis processes were a focus of The Re-thinking Food Security
Forum (Rome April 2008). The Forum brought together INGOs, WFP and
FAO, who highlighted the need for response analysis processes to be
inclusive, and for interventions to be informed by a full review of options.
In 2009, consultations held at DG ECHO on Capacity Building Policy and
the Future of Thematic Funding confirmed that information systems such
as IPC, SENAC, Humanitarian Health and Nutrition Tracking Service (HNTS),
market analysis, do “not yet include improved response analysis for
programming support”1 ECHO observed that “There is an inadequate link
between food security analysis and response...”.
It was in reaction to this that the Food and Agriculture Organization of the
United Nations (FAO) developed a project designed to try and address this
link. The result was an 18-month ECHO funded project entitled
“Developing a Response Analysis Framework for Food Security
Emergencies”. This facilitation guide is one of the products of that project,
and is one of a pair of guides aimed at different audiences. For a full list of
products produced by the project, readers are encouraged to visit the FAO
and Emergencies website http://www.fao.org/emergencies and scroll
down the right-hand column to Response Analysis, where copies of all
documents and products can be downloaded.
1 “Follow-up of Consultation on DG ECHO Capacity Building Policy and the Future of
Thematic Funding” – 25 April 2008.

ii
CAVEAT
This document is the product of a relatively short development and testing
period in one country plus a certain degree of global level discussion and
read-across from a similar piloting process conducted in Indonesia during
2010. Much of the first half of the document is based on experience in
building from IPC version 1.1 in Somalia. However, the IPC itself is
undergoing significant change and version 2 is expected to be published by
the middle of 2011. Because of these factors, this facilitation guide should
be viewed as one stage in a process which will (funding permitting)
continue to evolve. It is clear that the RAF will require significant further
testing, development and validation in other contexts.
With these issues in mind, all comments on the document and the
approach are welcomed and should be sent to:

iii
ACKNOWLEDGEMENTS
The development of the Response Analysis Framework (RAF) for Food and
Nutrition Security was a participatory process involving a number of
individuals and agencies operating at global level and in Somalia and
Indonesia.
In the case of Somalia, we would like to express our thanks to the following:
FAO Somalia OIC, Graham Farmer and later Luca Alinovi for their support
and insights. FSNAU CTA Grainne Moloney, Technical Manager Tamara
Nanitashvili, Nutrition Manager Ahono Busili, and Senior Analysts –
Abdirizak Mohamed Nur, Ahmed Nur, Abdiaziz Moalim, Abdi Roble, Ahmed
Jezira , Mohamed Asseir, and other field analysts and nutrition team
members for sharing information, and participating in lengthy discussions
with us in August – September 2010. We appreciate the inputs and support
of the former Agriculture and Livelihoods Cluster Chair Andrea Berlofa,
Cluster Support Officers Habon Hussein and Agnes Shihemi, and Cluster
Task Force members for their contributions, feedback and support in
applying/testing the RAF in the context of the Cluster Response Planning
process for the 2011 CAP. The head of OCHA Somalia, Kiki Ghebo and
OCHA’s Leith Baker deserve special thanks for their encouragement and
support for fast-tracking the development and testing of the RAF tool.
Thanks go to the Nutrition Cluster Chair and Nutrition Cluster task force
members for their feedback. We very much appreciated the inputs of Simon
Renk, Marc Prost, and Regis Chapman of WFP Somalia and Valerie Ceylon
and Fabio Bedini of WFP Rome for their helpful verbal and written feedback
and regular discussions. We would also like to thank the different persons in
FAO, UNICEF, WFP, OCHA, SCUK, CRS, World Vision, Oxfam, Trocaíre, and a
number of local NGOs which we interacted with through direct visits and in
cluster meetings, for sharing information and providing feedback and
comments.
Suleiman Mohamed (Head of the Somalia Response Analysis Support Team -
RAST) and Neil Marsland (RAF Project Manager)
with contributions from
John O’Dea (RAST Nutritionist)
Nairobi and Rome, February 2011.

v
TABLE OF CONTENTS
PREFACE ................................................................................................ i
ACKNOWLEDGEMENTS ........................................................................ iii
TABLE OF CONTENTS ............................................................................. v
SECTION 1: INTRODUCTION TO THE RESPONSE ANALYSIS FRAMEWORK
AND THE FACILITATION GUIDE .............................................................. 1
1.1. About the Facilitation Guide ................................................................. 1
1.2. Purpose of the Facilitation Guide ......................................................... 1
1.3. Potential Users and Uses of the Facilitation Guide .............................. 2
1.4. Scope of the Guide ................................................................................ 2
SECTION 2: OVERVIEW OF RESPONSE ANALYSIS AND THE RESPONSE
ANALYSIS FRAMEWORK ........................................................................ 7
2.1 Introduction .......................................................................................... 7
2.2. What should a response analysis framework consist of? ..................... 8
2.3. Core Stages of the Response Analysis Framework (RAF) ................... 11
SECTION 3: RAF STAGE 1- REVIEW / STRENGTHENING OF SITUATION
ANALYSIS AND FORECASTING ............................................................. 19
3.1 Introduction ........................................................................................ 20
3.2 Building from IPC Phase classification information ............................ 22
3.3 Forecasting and Scenario Analysis ...................................................... 39
SECTION 4: RAF STAGE 2 - RESPONSE OPTIONS IDENTIFICATION .......... 45
4.1. Response Objectives Formulation ...................................................... 46
4.2. Identifying Potential Response Options ............................................. 47

vi
SECTION 5: RAF STAGE 3 - SELECTING APPROPRIATE AND FEASIBLE
RESPONSE OPTIONS ............................................................................ 53
5.1. Introduction ........................................................................................ 54
5.2 Principles, Process and Stages of the Response Analysis Matrix (RAM) . 54
5.3 RAM Stage 1: Security / access criteria for conflict / civil insecurity .. 60
5.4 RAM Stage 2: Appropriateness and feasibility criteria ....................... 62
5.4.1 Sensitivity to Disruption score ................................................. 62
5.4.2 Core Criteria of the RAM .......................................................... 65
5.4.3 Additional RAM criteria ............................................................ 80
5.4.4 Tabulating the RAM scores ....................................................... 83
5.5 RAM Decision Tree .............................................................................. 84
SECTION 6: DESCRIPTION OF ANNEXES ................................................ 89

vii
SECTION 1
INTRODUCTION TO THE RESPONSE ANALYSIS
FRAMEWORK AND THE FACILITATION GUIDE
1
SECTION 1: INTRODUCTION TO THE RESPONSE ANALYSIS
FRAMEWORK AND THE FACILITATION GUIDE
1.1. About the Facilitation Guide
The Response Analysis Framework (RAF) – A Facilitation Guide was
developed in Somalia and draws heavily on the information from and
experiences of agencies in Somalia. Somalia faces a protracted crisis
situation, but has strong food security information and early warning
systems. Additionally the existence of the cluster architecture provided a
good setting for the development and testing of a response analysis
framework which could then be replicable to other similar protracted
crisis situations. The foundation of the Response Analysis Framework is
the information generated through situation analysis and the IPC. The
Framework was designed to dovetail with the IPC information that is
routinely generated, in order to further improve the link between
situation analysis and responses, particularly in emergency and protracted
crisis situations.
The guide is divided into one introductory section, and Sections 2, 3, 4
and 5, which take the user through the process of carrying out response
analysis and identifying appropriate and feasible response options. There
are a number of annexes which are included in the accompanying CD. A
short description of what is contained in each annex is provided Section 6.
1.2. Purpose of the Facilitation Guide
The purpose of this guide is to provide facilitators with easy-to-use steps
on how to facilitate response analysis sessions using the Response Analysis
Framework. The RAF provides a framework, process and tools that are
aimed at providing guidance for improved response planning process in
food and nutrition security related emergencies.
The guide explains how the Response Analysis Framework can be applied.
It is intended to be used by agencies and clusters (or other multi-agency

2
emergency programming fora) which have an interest in strengthening the
link between situation analysis and action in a transparent systematic
fashion. It is not a training manual as such, but it does contain sufficient
detail to be used to guide the facilitation of a response analysis process.
1.3. Potential Users and Uses of the Facilitation Guide
Potential users of this facilitation guide include facilitators and trainers of
agency and cluster staff engaged in providing food and nutrition security
information for decision making. Program specialists and project
managers, who are charged with the responsibility of guiding the
processes of formulating interventions can also use the RAF. Other users
include:
• Food and nutrition security situation analysts (such as those in food
and nutrition security information units) in order to improve the
presentation of situation analysis information;
• Cluster support officers and review committees of food and nutrition
security related clusters (e.g. Agriculture and Livelihoods, Food
Assistance and Nutrition Clusters). Ideally, these users will have some
knowledge on the basic concepts of food security and livelihoods
analysis, early warning and nutrition programming.
The RAF can be used in a number of response planning processes,
including emergency and protracted crisis situations, such as those
addressed in the CAP processes. It can also be used in transition and
recovery contexts. The current RAF presented in this document is ideal for
emergency and protracted crisis situations, but it can be adapted to work
well in non-emergency contexts.
1.4. Scope of the Guide
The Response Analysis Framework (RAF) is not a situation analysis tool and
does not provide guidance on carrying out assessments or the analysis of
assessment data to present the current or projected severity and
magnitude of the food and nutrition security situations. This is the role of

3
situation analysis. The RAF is not also response planning as this is the role
of agencies that carry out interventions. The RAF plays a facilitation role to
link the results of the situation analysis with response planning, and it
does this by providing systematic steps for revising and checking situation
analysis and providing intermediate steps in identifying entry points for
responses as well as criteria for screening response options so that
response planners can come up with an ‘acceptable’ array of responses.
Due to the need to keep situation analysis insulated from response
identification, often a disconnect is created between situation analysis and
response planners. The RAF aims to fill this space and the facilitation guide
provides the steps in achieving this aim.

5
SECTION 2
OVERVIEW OF RESPONSE ANALYSIS AND THE
RESPONSE ANALYSIS FRAMEWORK
7
SECTION 2: OVERVIEW OF RESPONSE ANALYSIS AND THE
RESPONSE ANALYSIS FRAMEWORK
This section provides the conceptual framework and a summary of response analysis and the Response Analysis (RAF) process. It provides facilitators with general introduction to response analysis and the Response Analysis Framework (RAF), and provides tips for communicating the key messages to those involved in the response analysis process. After reviewing this section, facilitators will have a good understanding of the concept of response analysis, and the principles and process of the Response Analysis Framework being discussed in this Guide, and will be able to communicate this to trainees and / or those involved in response analysis processes.
2.1 Introduction
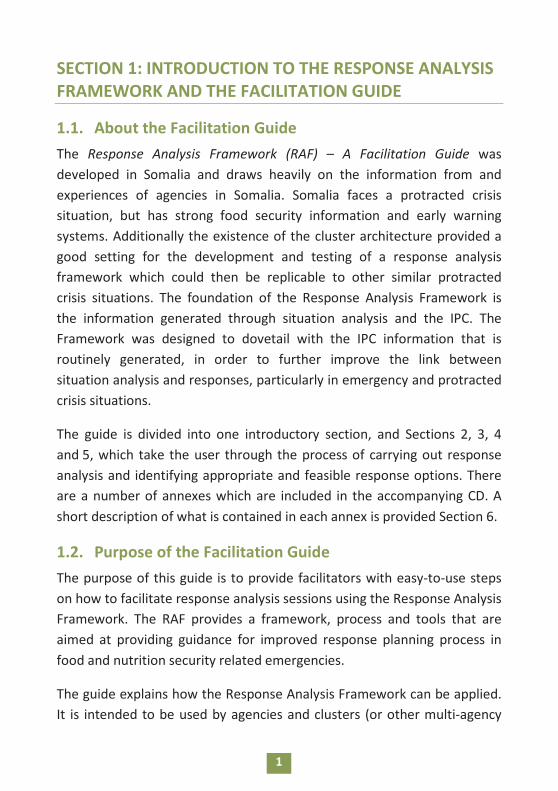
Conceptually, response analysis is situated between situation analysis and
response planning, as described in figure 1 below:
Figure 1: Conceptual Overview of Response Analysis
Adapted from IPC Technical Manual Version 1.1
In Figure 1, there are two parts to response analysis, potential response
options identification and response options screening. The diagram
indicates that there is an overlap between response options identification
Response
Analysis Response
Implementation
Monitoring and Evaluation
Response Planning
Response Options
Identification
Situation Analysis
Current + Forecasted
Response Options Screening

8
and situation analysis and between response options screening and
planning. This signifies the fact that the roots of response analysis are in
situation analysis and the fruits in response planning. The diagram also
indicates that monitoring and evaluation information is a core ingredient
for response analysis: only by learning from past experiences can current
and future responses be improved.
It should be noted that this relationship applies across different kinds of
emergencies. In the context of sudden onset emergency situations, the
situation analysis – response analysis – response planning relationship
should take place within the framework of contingency planning. In slow
onset crises, response analysis should be woven into early warning so that
the latter is not just a process of predicting outcomes, but also a way of
prioritising and screening response. In complex emergencies, response
analysis should be part of periodic assessment and planning processes (for
example the annual CAP Process). In all kinds of emergencies, response
analysis should take place periodically, fed by situation analysis and M&E
information and taking place before during and after different kinds of
shocks.
2.2. What should a response analysis framework consist of?
A framework for response analysis must provide a way of linking situation
analysis with response planning, conceptually, analytically and in terms of
process - given prevailing institutional architecture. It must do this in a
way that builds on existing processes, tools and frameworks and not re-
invents them. It should avoid bias, foster dialogue and ensure an
acceptable level of analytical rigour so that response options pass tests of
appropriateness and feasibility.
The conceptual space for a Response Analysis Framework is as depicted
and explained in relation to Figure 1.

9
The analytical aspects of the framework derive from the tools and
techniques that it offers to turn the concepts into reality (in terms of
feasible and appropriate response options). One aspect of this is to
provide a “response analysis lens” to information gathered through
situation analysis (current situation) and also forecasts and scenario
planning (future situation). What this means is looking at food and
nutrition security assessments with the questions: “what does this
information tell me about the most appropriate and feasible responses for
particular population groups over particular timeframes and geographical
areas?” and “where are the gaps in information?” In response to this
second question, the analytical part of the framework should also provide
tools which may be used to “plug gaps” in situation analysis.
The analytical aspect of the framework must also be able to give guidance
on the selection and screening of response options. This means it should
provide a technique or techniques for ensuring that the analysis of
response options is done in such a way that only options passing minimum
tests of feasibility and appropriateness graduate into the response
planning process.
The process elements of the Framework are perhaps the most important
of all. “Process” means the way in which the analytical tools and
techniques are applied in particular contexts. There are many examples of
sound technical tools and approaches failing to reach their objectives
because they were not applied in appropriate ways. Whatever the
institutional context, the application of the framework should be done in
such a way that ensures the following qualities:
• Bringing the right people together: The process of response analysis
must involve people with different perspectives and competencies. The
two core elements are people with food and nutrition security analysis
skills and people with programming skills and responsibilities.
Depending on circumstances it would also be necessary to involve
different organisations, and include different sectors (government,

10
donors, NGOs, UN agencies, private sector, CBOs). Multi-agency and
multi-sectoral involvement is important in order to bring out the
complementary nature of response options and also to reduce bias in
options analysis (this is a very important point). In addition, it is vital
that the mix of people contains those with good local knowledge of the
geographic areas being discussed.
• Bringing the right information together at the right time: There must
be a common platform of information in order to inform the response
analysis process. This may come from a variety of sources but should
cover a number of minimum bases. Table 1 in Section 3 (pg. 21)
provides examples of some of the information necessary from situation
analysis. This is just a sub-set of what is required. Other aspects will be
more operational such as 3W matrices (i.e. “who” does “what”, and
“where”); agency and government policy and programming
frameworks; inter-agency planning and appeal frameworks and donor
strategies.
• Adapting to existing planning frameworks and timetables and not
inventing new ones: The Framework needs to be applied in a way that
adds value to existing processes, not replaces them. It may indicate
areas where existing planning arrangements are weak or need to be
connected, but should not rely on such connections to be made. Key
processes will include contingency planning, cluster response planning
(inside or outside CAPs) as well as agency specific planning.
• Fostering consensus – with rigour: The Framework should be applied
in a way that encourages debate and ultimately consensus on potential
responses. The way in which this is done should be rigorous and
evidence based. Although there will be a variety of opinions and
perspectives, systematic biases need to be guarded against at all costs.
This can be achieved only by bringing together the right people (checks
and balances) and the right information at the right time (see above)
AND by ensuring that the RAF process is well facilitated.

11
2.3. Core Stages of the Response Analysis Framework (RAF)
Consisting of a conceptual underpinning, analytical tools and key process
elements, the Response Analysis Framework (RAF) is an attempt to meet
the various requirements set out in the previous section. The RAF has its
‘’roots’’ in situation analysis and its “fruits” in the identification of feasible
and appropriate response options. Analytically, it consists of the following
core steps:
Stage 1: Summarising and/or strengthening situation analysis (1a) and
forecasting (1b).
Stage 2: Formulating objectives for responses and Listing of relevant
response options.
Stage 3: Response options screening.
Each of these steps should be conducted in a way that respects the four
qualities or principles listed in the previous section:
• Bringing the right people together;
• Bringing the right information together at the right time;
• Adapting to and not replacing existing information systems and
planning frameworks;
• Fostering consensus - with rigour.
Stage 1(a) - Situation Analysis: In this stage, the RAF shows what different
aspects of situation analysis mean for response and provides guidance on
how to “plug gaps ” in situation analysis if required.
Situation analysis establishes parameters such as severity, magnitude and
depth of the food insecurity and malnutrition conditions among a given
population group at a specified time. A good situation analysis should spell
out the severity and magnitude of food and nutrition insecurity of defined
population groups over a specified period of time as well as spelling out

12
why these groups are food and nutrition insecure (problem analysis). In
addition, an understanding of vulnerability should be a part of situation
analysis. Vulnerability helps to describe the likelihood of future food and
nutrition insecurity.
Stage 1(b) - Forecasting and Scenario Building: In this stage, the RAF is
designed to help guide thinking on the implications of future situations for
food and nutrition security response. It is not the job of response analysis
to undertake scenario analysis and forecasting, but rather to tease out the
implications of this for response planning. If forecasting has not been
done, then the RAF provides some guidance on how this could / should be
done.
Forecasting is an essential part of preparing for response analysis. This is
because response implementation (interventions) almost invariably takes
place sometime after situation assessment and analysis are done. So food
security and nutrition conditions for the period of intervention have to be
estimated in order to plan responses.
Stage 1 of the RAF is best applied at inter-cluster level, with technical
support from food and nutrition security analysts. It is particularly
important that the clusters involved in food and nutrition security are
involved in the problem analysis part of this stage so that there can be a
shared understanding of the different causes of food and nutrition
insecurity. This will help lay a good platform for more coordinated
response between clusters. The key clusters involved would include
Agriculture / Agriculture and Livelihoods; Food Security; Food Assistance;
Nutrition; WASH.
Stage 2 - Response Options Identification: Stage 2 of the RAF marks the
transition from situation analysis to response analysis. This step is divided
into two parts. The first part is the formulation of response objectives.
Once developed, these objectives provide the platform for formulation
and listing of response options in line with the objectives. The

13
development of objectives is informed by the outputs of stages 1 and 2 of
the RAF and also the nature of the planning framework within which the
RAF is situated. This might be a one year framework (as in the case of
Cluster Response Plans in the CAP) or a two to three year framework (as in
the case of strategic plans or Plans of Action) or a longer time horizon
(e.g. a five year plan). For the RAF, it is important that the objectives are as
Specific, Measurable, Attainable, Relevant and Time bound (SMART) as
possible. Making objectives SMART helps to frame the second part of this
step, which is the listing of relevant response options.
Only response options that pass the test of relevance should be listed at
this point. Relevance is defined in relation to the problems (problem tree
and problem matrix); vulnerabilities and forecasts; and the objective itself.
Stage 2 of the RAF may also be applied at Inter-cluster level, but can also
be applied at cluster level. The advantage of an Inter-Cluster setting is that
this will enhance the chances of complementarity and coherence between
response objectives of different clusters in relation to food security and
nutrition.
Stage 3 - Response Options Analysis and Screening: The final stage of the
RAF consists of applying the response options analysis criteria and
conditions to the response options listed in stage 2. The tools used are the
Response Options Analysis Matrix (RAM) and a decision tree. The RAM is
designed to be used to generate debate and ultimately consensus around
the appropriateness and feasibility of different response options in
meeting objectives. It is not a substitute for proper response planning, but
rather is intended to highlight the strengths and weaknesses of responses,
weeding out those which are weak or ill-conceived including those which
whilst appearing technically sound in principle, might be entirely
unrealistic in the local context. There are three processes in this step:
Step 1: Access - The first part of this stage is to assess physical access to
the area in which the option will take place using the security/access

14
criterion. This is an essential first check in the RAM process for complex
emergencies, where conflict and civil insecurity complicate the
frequently occurring natural and other disasters such as drought,
flooding, market disruptions.
Step 2: The RAM appropriateness and feasibility criteria – The RAM
proceeds by requiring its users to score response options against a
range of criteria designed to judge appropriateness and feasibility. This
stage of the RAM is meant to be used iteratively to arrive at an agreed
score against each criterion and as a way to develop tips or guidelines
for subsequent planning or project design processes. This is a critical
point which will be explained more fully in the relevant section below.
A key criterion in the RAM is the “Do No Harm” principle. The scoring
of each response option against each criterion should be arrived at
through a consensus process involving program specialists with
knowledge of the institutional and geographical landscape of the
intervention area.
Step 3: Here, a simple decision tree is used to screen the various
response options. The final output of the RAM is a set of options which
have passed minimum tests of appropriateness, feasibility and do no
harm. Part or all of this set can then be fed into a proper response
planning process which will include detailed design and budgeting
questions outside of the scope of response analysis and the RAF.
This stage of the RAF is more suited to the cluster level. In the Somalia
context, it worked well with a small group (around 10 persons) drawn
from agencies which were part of one cluster (the Agriculture and
Livelihoods cluster). This cluster review committee applied stage 3 of the
RAF to help formulate a cluster response plan.

15
Figure 2 summarises the Response Analysis Framework and process.
Figure 2: The RAF Process
SMART objective formulation +
Narrative for objective wording
Identification of Response Options
Response Options Analysis and Screening
Problem and Cause analysis Severity and Magnitude information
Risk and Scenario Analysis (Forecasting) for a specific period
(the planning horizon)
Stage 1b: Forecasting
Stage 2: Response Identification
Stage 3: Response Options Analysis
Vulnerability analysis
Stage 1a: Situation analysis

16
� Overview of the Response Analysis Framework: Tips for facilitators
Conceptual Issues: Draw the Response Analysis diagram on a flip chart or
put it on a ppt slide and spend some time explaining to trainees /
Response Analysts the relationship between the different boxes in
different circumstances and the place of response analysis.
Key Learning objective: To understand that response analysis is a
distinct stage in the project or programme cycle.
Analytical issues: Ask trainees/ Response Analysts what kinds of
information is needed from food security and nutrition information
sources to inform response and why? List these down on a flip chart. Are
these sources normally available? Who provides them, where do they
come from?
Key Learning objective: To understand the information requirements
sources and uses in response analysis.
Process issues:Ask trainees / Response Analysts what would they see as
the key characteristics of a process of response analysis; who should be
involved? When? What are the desirable characteristics of the process?
List these on a flip chart and discuss. Compare with the principles listed
above.
Key learning objective: To understand the key steps, procedures,
participants and roles in conducting response analysis.
Understanding the RAF: Use / Adapt Handout attached at Annex 1. This
can be made into a PowerPoint presentation if required.
Key Learning Objective: To gain an overview of the RAF.

17
SECTION 3
RAF STAGE 1
- REVIEW / STRENGTHENING OF SITUATION
ANALYSIS AND FORECASTING

19
SECTION 3: RAF STAGE 1- REVIEW / STRENGTHENING OF
SITUATION ANALYSIS AND FORECASTING
About this section
The objective of this section is to give guidance on how to facilitate a review of available situation analysis and needs analysis information using a response analysis lens. It is tailored to situations in which the current version of the IPC is a key food security information source. More specifically, Section 3 of this guide presents the steps in carrying out:
• A review of food and nutrition security situation analysis, and establishing problem-cause relationships;
• A review of vulnerability profiles and establishing vulnerability levels/scores;
• Guidance on forecasting and developing scenarios. Who should be involved in this part of the RAF?
• Food security and nutrition analysts – field and non-field level;
• Field-based key informants (where possible);
• Agency/Cluster members engaged in program planning/implementation;
• Government and non-government agency partners;
• Facilitator(s).
Response Analysis
Response Implementation
Monitoring and Evaluation
Response Planning
Response Options
Identification
Situation Analysis
Current + Forecasted
Response Options Screening

20
3.1 Introduction
Situation analysis establishes parameters such as severity, magnitude and
depth of food and nutrition insecurity conditions of a given population
group over a specified time period. A good situation analysis would
answer the following questions, among others:
• Who are food insecure and/or nutrition insecure? (numbers, types of
populations);
• Where are the food insecure and/or nutrition insecure?;
• What is the severity and magnitude of the food insecurity / nutrition
insecurity?;
• When is there food and nutrition insecurity? (normally expressed as
periods within a given year);
• Why is there food and nutrition insecurity? i.e. what are the different
causes of the situation(s) faced?
Most situation analyses include a forecasted situation analysis as well –
that is they look at not just the current situation but the forecasted
situation over a future period. The degree to which and how this is done
depends on the purpose of the analysis. Forecasts are extremely
important for early warning. As noted above, situation analysis should also
establish not only the current/projected problems but also the causes of
these problems. How detailed the problem-cause analysis is depends on
the purpose of the analysis. For example, if situation analysis is for
emergency/humanitarian purposes, it is more likely to identify only food
insecurity/malnutrition outcomes and immediate causes, and less likely to
identify underlying causes.
All of this information is relevant for response formulation as indicated in
Table 1.

21
Table 1: Relevance of Situation Analysis for Response Formulation
Situation Analysis questions
Relevance for response formulation
Who is affected by the food and nutrition insecurity?
TARGETING - Knowing who is obviously a key ingredient in targeting. Which person(s) or group(s) needs to be targeted for the response? Is the affected group in a specific geographic area, or spread out over a wide area?
How severe is the problem (severity and magnitude of a problem)
SCALE AND URGENCY OF RESPONSE - Understanding severity helps guide the nature and scale of responses. Is the situation very severe and widespread therefore calls for large scale emergency interventions?, or it is not as severe and therefore non-emergency measures are more appropriate?
When is there food and nutrition insecurity?
TIMING OF RESPONSE - At what times of the year do (a) hunger; and (b) malnutrition normally peak? (seasonality). This will help in understanding the appropriate timing of different kinds of responses.
Why is there food and nutrition insecurity?
OVERALL STRATEGY - Understanding causes of current food and nutrition security outcomes is normally the most important ingredient in deciding on what problems should be focused on when formulating responses. The problems may be proximate, underlying or structural causes.
What is the likelihood of future food and nutrition insecurity?
OVERALL STRATEGY - Understanding how the situation in the future may differ from the current situation is important as responses take place in the future. Thus any possible or expected changes to current conditions need to be considered.
As satisfactory answers to all of the above questions are important for
response analysis, the first stage of the RAF consists of: (a) reviewing the
existing information to see if it answers the questions adequately; and
(b) offering some tools with may “plug the gaps” where information is
missing.

22
3.2 Building from IPC Phase classification information
The following section indicates how a response analysis lens can be
applied to IPC or similar phase classification information. It should be
noted that this section draws on experience with the current version of
the IPC as applied in Somalia. Certain adjustments may need to be made in
applying the guidance to the next version of the IPC once this is rolled-out.
RAF Stage 1, Step 1 - Compiling Situation Analysis Information – Severity
and Magnitude:
(i) Check to see if there has been a compilation of information
generated through situation analysis. Has an assessment been carried
out to answer the key questions posed in the introduction above? Or
is there a regular monitoring system which generates regular
information? In the case of Somalia, the FSNAU situation analysis
results in an IPC phase classification, and a nutrition situation
classification. Another example is FEWS NET which gathers and
analyzes information on food security using a variety of ways and its
situation analysis is summarized using a FEWS NET severity scale –
similar to the IPC. See Figure 3(a) and 3(b) on pages 24-25 for
presentations of these two approaches.
(ii) Examine the situation analysis information further to identify who,
where, what, when and why there is food insecurity/malnutrition.
This information helps to further explain the information presented in
the graphic in Figures 3(a) and 3(b). The map provides the geographic
area; you’ll need to identify the livelihood group, wealth groups, or
any other population groups within the geographic area that are
identified as facing food insecurity or malnutrition.
(iii) Establish how severe the problem is - severity and magnitude of a
problem - For each of the livelihood group indicate how severe the
current/projected food insecurity is. This is based on the situation
analysis and presented in the IPC or other severity scale summaries.

23
(iv) Clearly understand what the nature of the food insecurity is - what
are the outcomes/manifestations?
Points (i) – (iv) may be summarized as in Table 2 below.
Table 2: Summarizing Points (i) – (iv)
Livelihood Group/ Population Group
Most severe food security
situation2
Socio-economic group affected and percentage
nature/manifestations of the food insecurity
Example (livelihood zones in Somalia ): Juba Riverine, Lower Juba, Somalia.
Example: Humanitarian Emergency (IPC notation).
All of Poor and Middle Wealth Group (about 60% of population).
Food access below minimum entitlement; dietary diversity <3 food groups; low coping strategies.
....
....
2 This may cover a specified time into the future as well as the current period. For
example, the IPC classification is “current and projected”, where “projected” is
6 months after the “current”.

24
Figure 3: Presentation of Situation Analysis Summary – severity/phase
classification example
Fig.3(a) FSNAU Food Security Situation (IPC) – Current and Projected July-Dec 2010
Source: FAO/FSNAU Somalia

25
Fig.3(b) FEWS NET Estimated Food Security Conditions – Oct-Dec 2010
Source: FEWS NET Somalia

26
RAF Stage 1, Step 1 - Summary: Arranging and tabulating severity and
Magnitude information for each population group of interest is the first
building block necessary for response analysis. It provides a platform for
targeting and in gaining a first idea of the likely urgency of intervention.
RAF Stage 1, Step 2 - Carrying out problem analysis: Having compiled
information in Step 1, there is a need to answer the questions: Why are
people food insecure and/or malnourished?” What are the immediate
causes of the observed outcomes? What are the underlying causes? What
about the structural issues? A clear understanding of causes of the
situation is important to develop appropriate responses. This is true
whether one is dealing with an emergency situation in which responses
are more likely focused in addressing current/projected outcomes and
proximate causes; or a non-emergency situation in which there is probably
more emphasis on underlying and structural causes, or a mix of these
situations.
In carrying out situation analysis agencies often do not undertake a
systematic cause analysis (or a problem-cause analysis). This absence is a
major factor contributing to the disconnect between situation analysis and
responses.
The IPC templates 2 and 33 are an initial step to identify immediate and
underlying causes of food security problems but have some limitations in
linking to responses. For examples of how these templates have been
used by FSNAU-Somalia, see www.fsnau.org.
A problem-cause analysis can be done using problem trees. The problem
tree begins with identifying the core problem. This could be a food access
deficit and /or a malnutrition problem. The tree then “grows” downwards,
through identification of proximate or immediate causes of the core
3 Please see IPC Manual Version 1.1. www.ipcinfo.org. The latest version may not be
have these templates.

27
problem, underlying causes and structural or basic causes. In addition, the
tree may also “grow” upwards to identify effects or outcomes.
It should be noted that it is not necessary to conduct problem trees for
each livelihood group / zone for each response analysis exercise. Once a
problem tree and associated problem matrix has been constructed for a
particular livelihood zone, then all that is required is that it is reviewed
and adjusted as required in subsequent response planning processes. The
section that follows therefore should be viewed as a kind of baseline
exercise.
� Constructing a cause-effect problem tree: Tips for facilitators
1) Indicate the livelihood group (affected group), their
geographic/admin area; the socioeconomic group(s) that is/are
affected; and the proportion of the population they comprise (as
done in Stage 1, Step 1 (ii) above).
2) Identify the food and nutrition insecurity outcomes under the
following headings: Food Availability, Food Access; Food Utilization;
Malnutrition and Mortality (put each on a different card);
3) Identify the severity of each food insecurity/malnutrition outcome
and indicate this in the same card – e.g. Malnutrition (GAM=critical);
Food Access (below entitlement, key limiting factor); food availability
(not a key limiting factor); utilization i.e. water/fuel/intra-household
distribution, etc–(e.g. severe water shortage);
4) One outcome at a time, discuss with the participants, what the
immediate cause(s) of each of the observed outcome is. Just write down
each cause and place the card under the relevant ‘outcomes’ card;
5) Subsequently, discuss what the causes of each of these causes are
and put each down on a card and place below the relevant
effect/outcome. Also each cause must be a direct cause of the effect
that is right above it. Do not skip steps. An example of a causal chain
is as follows: food access problem – caused by failed own crop

28
production – caused by moisture stress – caused by below normal
rains... Another example; Malnutrition(critical GAM levels) – caused
by inadequate dietary intake – caused by poor income levels – caused
by lack of sufficient livestock to sell - caused by livestock depletion –
caused by stress sales of livestock/lack of pasture and water/diseases
– caused by consecutive droughts;
6) Arrange the cards and generate the problem tree, which should look
something like as shown in Figure 4. Notice that whereas the food
access measure is at the outcome level for food security, it is an
immediate cause for malnutrition.
Figure 4 is an actual problem tree created for a livelihood zone in Somalia.
The exercise was part of the response analysis activity done in support of
the CAP 2011 Cluster Response Planning work for Somalia.
� Converting a problem tree into a problem matrix: Tips for facilitators
It is recommended that after a problem tree has been constructed, the
results are tabulated in problem matrices, one for nutrition and one for
food security. The reason for doing this is mainly for ease of reference, as
problem trees may appear quite complex and be difficult to follow.
1) For simplicity the problem matrix will have just four columns; the first
has the Outcomes, the second, Proximate causes, the third
Underlying causes (all layers of underlying causes included in one
column); and finally a column on structural issues/basic causes.
2) Note that due to the fact that outcomes are different for malnutrition
and food security (with, for example, the food access outcomes being
a cause for malnutrition), it is a good idea to separate the Problem
Matrix into two – one presenting the food security cause analysis and
the other the nutrition/mortality cause analysis. See Tables 3 (a) and
3(b).
3) Underlying causes are grouped and placed against the relevant
proximate cause that they affect.

29
29
Fig
ure
4:
Pro
ble
m T
ree
– a
So
ma
lia
ex
am
ple
Low household food
access
Death
Malnutrition
Low/poor individual
food utilization
Disease
Low food availability
Poor care
practices
Poor environmental
sanitation
Low im
munization rates & lack
of proper treatment
Disrupted
livelihoods
Reduced
incomes
Market
supp
lies
limited
Restricted
Labo
ur
movem
ents
Restricted
food
supp
lies by
conflicting
grou
ps
Increa
sed labo
ur
compe
tition from
IDPs
Reduced
access to
social support
Low HH level
crop production
Heavy work
burdens for
caregivers
Poor KAPS
Poor health provision
(Lack of health facilities)
Flood
ed
lands
Poor irrigation
infrastructure and
siltation of water
catchm
ents
Pests and
diseases
Inad
equa
te
Gen
der relations
Low rates of
male an
d female
education
Lack of
prod
uctive
inpu
ts
Hea
vy
rains
Deg
rade
d river banks
No know
ledg
e or
incentives to
rep
air
infrastructure
Absen
ce of
form
al edu
cation
system
Deg
rade
d trad
ition
al
know
ledg
e system
s
Absen
ce of com
munity
or state based
extension system
s
Con
flict betwee
n different arm
ed
grou
ps
Increa
sed
displacemen
t of
IDPs
Failure of state institutions
Reduced
food aid
supp
lies
Deforestation
and erosion
Poverty
Outcomes
Immediate
Causes/Food
availability
outcomes
Underlying
Causes
Structural
Causes

30
Table 3: Problem Matrix Example
Table 3a: Malnutrition Problem Matrix
Outcome Immediate Cause
Proximate Causes
Underlying Causes Structural Causes
Example: GAM levels are Critical
Food based (poor/low individual food utilization)
• Poor care practices
• Heavy time burden for caregivers
• Inadequate gender relations
• Low rates of male and female education
(same as for food access and availability)
• Absence of formal education
• Failure of state institutions
• Failure of state institutions
• Low household food access
• (see under food access)
Health based (high disease prevalence)
• Poor care practices
• Heavy time burden for caregivers
• Inadequate gender relations
• Low rates of male and female education
• Poor environmental sanitation
• Poor Knowledge Attitudes Practices (KAPs)
• Poor provision of health and medical services
• Low immunization & inadequate treatment
• Poor Knowledge Attitudes Practices (KAPs)
• Poor provision of health and medical services

31
Table 3b: Food Security Problem Matrix
Food Security Outcomes
Proximate Causes
Underlying Causes Structural Causes
Examples: Food Access: (food entitlement deficit at household level)
• Market supplies limited
• Restricted food supplies due to conflict
• Poverty
• Failure of State Institutions
• Degraded traditional knowledge systems and community organization structures
• Poor access to formal education systems
• Failure of state institutions
• Reduced incomes
• Restricted labour movements
• Reduced unskilled labour opportunities due to competition from IDPs
• Increased IDP numbers
• Reduced social support
• Low household level food crop production;
• Flooded farmlands
• Heavy rains
• Degraded irrigation infra-structure and silted water catchments
• Pest and diseases
• Inadequate access to productive inputs
• Gender relations
• Poor knowledge and skills for production and lack of extension services
Food Availability “ “ “ “ “ “
Household Food Utilization
“ “ “ “ “ “
From Problem Matrix to Critical Pathways: Applying the Pareto Principle4
The third step in the problem analysis stage is to apply what is called the
Pareto Principle. This states that only a few causal streams that lead to a
problem are responsible for the bulk of the problem (Juran and Gryna,
1988). Examples of this would include the statement that “90% of
repeated violent crimes are caused by 5% of the population,” or “80% of
the yield reduction is caused by two major plant pests.” This principle
is well established in fields such as manufacturing and assembly,
4 This paragraph and the term “Pareto Principle” is drawn from the CARE Project Design
Handbook, Richard Caldwell, TANGO International.

32
administrative and support services, and marketing. It is also relevant to
emergency food security and nutrition and should be used to make sure
that the most critical pathways are identified during design.
� How to apply the Pareto Principle: Tips for facilitators
• The task here is to take a problem tree or problem matrix and try and
ascertain for a given population group and outcome if there is one
particular causal chain that is more important than another. This
should be done with key informants drawing on existing data.
How to do it:
a) Using the food security problem matrix (Table 3b) a relevant
question would be: “Which of the three immediate causes of food
insecurity at household level are most important for the population
group in question? (a) low food availability on local markets;
(b) reduced incomes or; (c) low production of food at household
level?”
b) One useful tool in this regard is pair-wise ranking. Here the three
options are compared against each other in pairs and through a
process of elimination the most important option is identified. For
background information on pair-wise ranking see:
http://web2.concordia.ca/Quality/tools/18pairwise.pdf
c) Once this has been done, move on to the next level down in the
matrix and ask the same question and use pair wise ranking to help
in the decision.

33
Let us assume that the result of the pair wise ranking has revealed the
following:
Problem: Household food insecurity
Immediate causes:
Rank 1: low production of food at household level
Rank 2: reduced incomes
Rank 3: low food availability on local markets
Underlying causes of low food production at household level
Rank 1: Crop pests and diseases
Rank 2: Inadequate access to productive inputs
Rank 3: Poor knowledge and skills
Underlying causes of reduced incomes
Rank 1: Reduced unskilled labour opportunities
Rank 2: Restricted labour movements
Rank 3: Reduced social support (social capital)
Underlying causes of low food availability on local markets
Rank 1: Low production in the area
Rank 2: Low supplies from outside the area
Rank 3: -
Structural causes of Pests and Diseases
Rank 1: Degraded traditional knowledge systems and community
organisation services
Thus the pair-wise ranking has identified a critical path which consists of:
Household food insecurity caused by low production of food at household
level caused by crop pests and diseases caused by degraded traditional
knowledge systems and community organisation services.

34
This path then becomes a priority for response options identification. This
does not mean that the other causal pathways should not be addressed,
but rather that addressing these will not have such a large impact on the
core problem as the critical path.
RAF Stage 1, Step 2 - Summary: A sound problem analysis is the second
building block necessary for response analysis. If it does not exist as part
of the situation analysis, the RAF offers a three part process: development
of problem trees, conversion of the trees to problem matrices and then
applying the Pareto Principle to try and identify key critical pathways. It
should be noted that it may not be necessary to construct a problem tree
each time a response analysis process is conducted. It all depends on
circumstances. It may be the case that existing situation analysis already
contains a good causal analysis. In protracted crises, where there have
been no significant new shocks, it may suffice to review existing problem
trees and to re-apply the Pareto Principle. Conversely, in cases where
there have been significant shocks or other changes it may be necessary to
reconstruct the problem analysis to take account of the changed
circumstances.
RAF Stage 1, Step 3 - Understanding Vulnerability and Risk:
The objective of this exercise is to obtain vulnerability scores/ranking for each population group being discussed (i.e. for each livelihood zone, administrative zone, or any other unit of analysis); Materials/people needed include:
• Vulnerability profiles (e.g. HEA baselines/profiles, CVSVA) which include the kinds of hazards the population groups are exposed to;
• Timelines showing the frequency of hazard occurrence (these may need to be created), and – if available – historical phase classifications.
The participation of key informants, situation analysts, and program people are all necessary in this discussion.

35
In any given situation, some population groups are more vulnerable than
others to the impact of particular hazards (be they man made or natural).
This is important as two different population groups which are shown to
be suffering from the same degree of food and nutrition insecurity at a
given moment of time may have different degrees of vulnerability to
future shocks. This fact has implications for the design of appropriate
responses – which would be different for the two groups in question.
In order to tease out these differences, it is necessary to undertake some
degree of vulnerability analysis.
� Conducting vulnerability analysis using IPC information as a starting
point: Tips for facilitators
The basic idea here is to reach consensus on a vulnerability- risk score for
each population group of interest. This will normally be the population
group used to classify a particular geographical area. The way in which this
is done is qualitative, relying on a mixture of key informant opinion and
secondary data. The key variables of interest are:
• Hazard information: frequency and severity of different kinds of shocks
and hazards over a given historical time-period. It is recommended that
the time period is at least 5 years and preferably 10 years plus.
• Ability to cope information: Historical levels of poverty / assets.
Frequency and type of coping strategies, historical data on food
security outcomes, nutrition, morbidity and mortality outcomes.
On the basis of the available hazard information an “exposure to hazard”
score is given ranging from 1 = very little historical exposure to 5 =
extremely high historical exposure. Similarly, on the basis of poverty,
coping strategy and historical outcome data, an “ability to cope” score is
derived ranging from 1 = very able to cope to 5 = highly unable to cope.

36
These two scores are then multiplied together to derive an overall
vulnerability - risk score ranging from 1 to 25.
If there is historical phase classification information (as is the case in
Somalia and a few other countries), this can also be tabulated to provide
further information upon which an overall idea of vulnerability can be based.
Table 4 illustrates the results of a vulnerability scoring exercise undertaken
for one livelihood zone in Somalia in 2010.
Table 4: Vulnerability Matrix - A Somalia Example
Column 1 Col.2 Column 3 Column 4
Column 5
Livelihood Group
Pop Size
June – Dec 2010 Phase Classification
Past Classifications
Vulnerability - Risk Score
A: Exposure to hazard (5=high, 1=low)
B: Ability to cope 5=low; 1=high)
C: Risk Score - AxB. 1=best; 25=worst
Hawd Pastoralists (Hiran)
30,126 100% poor and 50% middle wealth groups facing HE 50% of middle also facing AFLC
5/11 facing HE. All immediate past; 2/11 – AFLC; 4/11 – BFI.
Score = 3 Drought, conflict, livestock disease, market restrictions
Score = 4 Assets stripped over several seasons; limited ability to sell more livestock
3 x 4 = 12
..
Key:
Vulnerability – risk score of 1 – 9 = low risk
Vulnerability – risk score of 10 – 16 = moderate risk
Vulnerability – risk score of 17 – 25 = high risk
HE = Humanitarian Emergency
AFLC = Acute Food and Livelihood Crisis
BFI = Borderline food insecure

37
Explanation:
Table 4 indicates the vulnerability of the Hawd Pastoralist group to shocks
which would affect food and nutritional security. The current phase
classification of this group is HE (phase 4) as indicated in column 3.
Column 4 indicates past phase classifications for this group. In five of
eleven seasons since 2006, this group was classified as being in HE, and all
of these five seasons were in the immediate past (i.e. 2008 – 2010). Before
2008, the group was classified as being either in AFLC or BFI. The fact that
the group has experienced five consecutive seasons of HE makes it likely
that they have suffered significant asset depletion and are therefore more
vulnerable to shocks than before 2008. This picture is corroborated by the
column 5 (b) which is derived from key informant opinion. This column
indicates a very low ability to cope (4 out of a possible 5) due to asset
depletion. The final piece of information is contained in column 5(a) which
gives an idea of likely future hazards. This indicates that drought, conflict,
disease and market conditions are likely to cloud the future outlook for
this pastoral group. The combination of exposure to hazards and
vulnerability results in an overall vulnerability – risk score of 12 out of a
possible 25. This indicates that this group are at moderate risk of
increased food and nutrition insecurity in the near future.
Why conduct vulnerability- risk analysis?
Although “rough and ready” the qualitative vulnerability analysis
conducted above can be a useful addition to the severity and magnitude
picture derived from the IPC analysis. When combined with an
understanding of current food security or malnutrition status, vulnerability
analysis indicates certain general directions for response. This analysis will
be sharpened by a fuller understanding of the risk of hazards occurring in
future – which is explained in more detail in the next section on
forecasting. Table 5 below, indicates how the combination of vulnerability
and current food security status can give a general guide to relevant
responses.

38
Table 5: Vulnerability / Severity Matrix for response planning
Current Food Security Status
Vulnerability of population in Area of Analysis (e.g. livelihood zone)
High vulnerability Low vulnerability
Humanitarian Emergency / Extremely food insecure
Description: Population is both extremely food insecure and highly vulnerable to future shocks (which would probably cause death or severe suffering) Implication for response: Immediate and high priority to humanitarian/emergency interventions but must address underlying causes also to avoid the current emergency from getting more protracted.
Description: A large shock has driven a previously food secure population into temporary crisis, however asset base remains relatively intact. Implication for response: Prioritize emergency support to address current crisis and probably early recovery.
Food Secure
Description: Population is currently food secure (e.g. due to an exceptionally good harvest) but successive poor seasons have left it vulnerable to future shocks). Implication for response: Prioritize strengthening resilience /disaster risk reduction. This is the window of opportunity to strengthen coping ability to deal better with future shocks.
Description: Sufficient levels of assets combined with current food security means that these households are not likely to be food insecure. Implication for response : Increase incomes through growth promoting interventions which build on existing assets -
RAF Stage 1, Step 3 - Summary: A vulnerability Analysis is the third
building block necessary for response analysis. If ready-made information
is not available, the RAF offers a Vulnerability Matrix which consists of
assigning vulnerability scores (derived through consultations with experts,
and references to secondary information) to different population
groups/areas. When combined with an understanding of current food
security status it gives some general directions for response.

39
3.3 Forecasting and Scenario Analysis
RAF Stage 1, Step 4: Forecasting can be defined as: a calculation or
estimate of future events. In relation to food and nutrition security
outcomes, the calculation or estimate is done in relation to things which
will influence the outcomes. These things may be to do with the weather,
or the likelihood of a policy change or any number of factors which could
have an effect on food and nutrition security outcomes in the future. In
order to estimate the impact of these events, it is necessary to know (a)
how much influence an event would have were it to occur and (b) the
likelihood / risk / probability of it occurring.
The fact that some sort of forecast is done is important for response
analysis, this is because response implementation (interventions) almost
invariably takes place sometime after the assessment and analysis are
done. Therefore food and nutrition security conditions for the period of
intervention have to be forecasted in order properly to design responses
that are appropriate to address the conditions that are estimated to exist
at that future period.
In Somalia FSNAU’s IPC analysis incorporates forecasts; while FEWS NET’s
global food security outlook development also involves carrying out
similar forecasts to come up with the estimated most-likely food security
conditions for a future period. IPC phase classifications will normally
include a forecast for an “imminent” period – this is usually 6 months from
the actual time of the analysis. What is important for response analysis
however is the actual response planning period and this may or may not
overlap with the period of forecast by FEWS NET or the IPC5. In such cases,
it is necessary to undertake some additional form of forecast or scenario
setting. The following guidance is intended to assist in forecasting in such
situations.
5 This is the case for example in Somalia where the FSNAU IPC post – Gu season analysis
covers a period from June to December, yet this analysis is used as a basis for the CAP
which runs from January to December of the following year.
40
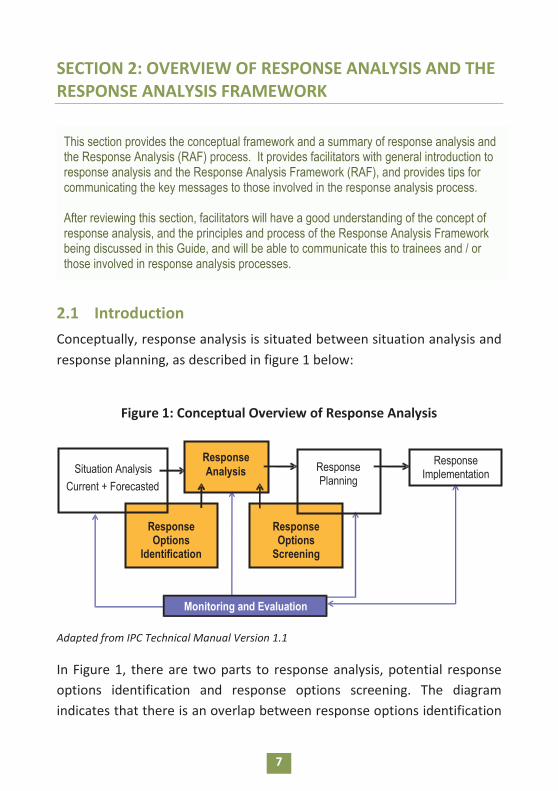
� Forecasting food security and nutrition outcomes to overlap with
the response planning period: Tips for facilitators
Starting Question: Has there been an attempt to define food and nutrition
security outcomes which relate to the response planning period?
If no then the following steps should be taken to arrive at this.
If yes, the process of defining the outcomes should be screened against
the following steps – to make sure that they (the outcomes) were
arrived at using a logical process.
Step (a): Brainstorm on factors or events which could affect
current food and nutrition security outcomes within the planning
period;
Step (b): What is the probability of occurrence of these events
(draw on specialized forecasts and projections, e.g. climate
forecasts as required)? These include events that can have both
positive and negative impacts. Positive events will help improve
the outcomes while negative events/hazards may worsen the
outcomes. The probability of the event occurring should be
labeled “high”, “medium” or “low”.
Step (c): Estimate the impacts of the high and medium
probability events and processes on the food security/nutrition
outcomes during the projected period/period of analysis. This
should be recorded as “food and nutrition security outcomes
better than current” or “food and nutrition security outcomes
worse than present”.
Estimates of impact will derive from knowledge, experience and
evidence, where available. In the case of adverse events (such as
La Nina) the results of the vulnerability analysis undertaken

41
earlier will give a clue as to whether the population can take
action that will be sufficient to mitigate the effects of the event
(adverse event). The less vulnerable the population group is to
hazards, the less likely the hazards will cause deterioration in the
food security/malnutrition outcomes.
The results of the 3 steps can be tabulated in a forecasting table,
an example of which is given in Table 6 overleaf.

42
Table 6: Summarizing the forecasting process - example
Current Phase:
.............................................................................................................................................
Livelihood Group and Wealth Group and numbers of People:
.............................................................................................................................................
Planning Period (Start and Finish):
.............................................................................................................................................
Step (a) Step (b) Step (c) Notes
What events are expected that could modify outcomes (i.e. either numbers and / or phase)?
Probability of occurrence of these events - High, Medium or Low
Forecasted Outcomes, - Better, worse or the same as current
• Drought • High • Worse • High probability of La Nina drought means that food production will be reduced and prices increased
• Crop and pest disease outbreak
• Medium • Worse • Conditions for an increase in locust activity are good
• Change in government food subsidy policy: increase coverage and subsidy
• Low • Better • The probability is low, but if it occurred it could be enough to counterbalance effects of drought

43
SECTION 4
RAF STAGE 2
- RESPONSE OPTIONS IDENTIFICATION

45
SECTION 4: RAF STAGE 2 - RESPONSE OPTIONS
IDENTIFICATION
The objective of this section is to take the user through the steps required to:
• Formulate response objectives – identifying entry points from the severity and magnitude, causality, vulnerability and forecasting information to identify objectives;
• Listing of potential response options.
Materials and resources required – same as for previous section. Who is involved – situation analysts (food security and nutrition); programme/response implementers (such as cluster member agency representatives, cluster support staff, field project staff (where possible); relevant government department staff and if possible donor representatives.
Section 3 of this RAF facilitation guide marks the transition from food and
nutrition security situation analysis to response options analysis. This step
is divided into two parts. The first part is the formulation of response
objectives. Once developed, these objectives provide the platform for the
second part: the identification of relevant response options.
Response Analysis
Response Implementation
Monitoring and Evaluation
Response Planning
Response Options
Identification
Situation Analysis
Current + Forecasted
Response Options Screening

46
4.1. Response Objectives Formulation
The way in which response objectives are formulated is informed by
information on:
• Severity and magnitude of food and nutrition insecurity for which
groups, when and where?;
• Causes of current observed food security and nutrition outcomes;
• Vulnerability to future food and nutrition insecurity;
• Forecast changes in current food security and nutrition status.
Combined with:
• Policy framework;
• Knowledge of the planning horizon (start and finish).
� Steps in Formulating Response Objectives: Tips for facilitators
Step 1: The first task in this part of the RAF is to convert the core
problem or limiting factor identified in the problem analysis into
an objective. This is a standard technique employed when
developing a logical framework. It consists of simply inverting the
language of a problem so that it becomes an objective. Thus if
the problem analysis has identified that the key limiting factor to
household food insecurity is food access, then the objective
would become: “To increase access to food”
Step 2: The next step is to make the objective SMART. This is achieved
by looking at the severity and magnitude information, the
problem analysis, the vulnerability analysis and the forecasting
and combining these with the planning horizon. Thus to continue
the current example: suppose that the Risk analysis indicates

47
that there is a high risk that the food security of the target
population group would be compromised in the event of rainfall
failure. In addition, suppose that the forecast indicates that there
is a possibility of a la Nina event in the last quarter of 2010 which
would, if it occurred, probably result in below average rainfall.
Finally, suppose that we are dealing with a one year planning
horizon: January–December 2011.
Step 3: Write the objective - All of this information will influence how
the narrative version of the objective “To increase access to
food” can be made SMART6. In this case, one possibility for the
SMART objective would be “To provide adequate access to food
for 70% of those classified as facing food security emergency up
to 6 months after the impact of the la Nina event”.
4.2. Identifying Potential Response Options
Once the SMART objective has been formulated, it then becomes possible
to list response options that are relevant to the objective, i.e. potentially
appropriate response options.
In Section 3, Table 3b tabulates the problem-cause analysis for one
livelihood zone in Somalia. In this example, the proximate causes of low
food access are:
• Reduced incomes;
• Low household level food crop production; and
• Low food availability on local markets.
6 It will also have a bearing on the risks and assumptions which are attached to the
SMART objective – though these are also influenced by the choice of response options.

48
Underlying these three proximate causes are three branches of underlying
causes, which are in turn underpinned by a number of structural factors.
The choice of response options to address these problems should be
informed by the planning framework, meaning that different levels of
problem outcomes and causes receive different levels of emphasis in
different planning frameworks. For example, a CAP process may be more
likely to focus more on the outcomes and proximate causes, and some
underlying causes, whereas a longer term planning framework could focus
more on the underlying and structural causes. However, whatever the
planning landscape, if the problem analysis indicates that different levels
of problems are linked and depend on each other then the response
analysis process should cover all relevant problems – although they may
be addressed by different institutions and over different timeframes.
Returning to the current example, the response options selected should
be those which are relevant to address the problems of reduced incomes
and/or low household level food production and /or low food availability
on the market for a certain proportion of the population. The options
selected should reasonably be expected to demonstrate some impact
within the planning framework. In the case of the CAP this would be one
year. With this in mind, some potential response options are as given in
Table 7.

49
Table 7: Identification of entry points and possible responses
– some examples
Problems to be addressed - Entry point Potential/relevant Option
Proximate cause (reduced incomes) Cash distributions
Proximate cause (reduced incomes) and underlying causes (flooding due to degraded river banks and / or poor state of road infrastructure - through public works schemes)
Cash for work
Outcome and proximate cause (low food crop production and low food availability)
Food aid
Outcome; proximate cause (low food crop production) and underlying causes (flooding due to degraded river banks and / or poor state of road infrastructure - through public works schemes)
Food for work
Underlying causes (land cultivation and productivity reduced)
Distribution of productive inputs
Underlying cause (degraded irrigation structures and silted water catchments)
Public works contracting
Underlying cause (pest and diseases) Integrated Pest Management
Underlying cause (pests and diseases) Distribution of pesticides and herbicides
Underlying cause (Poor knowledge and skills) Participatory agricultural extension

51
SECTION 5
RAF STAGE 3
- SELECTING APPROPRIATE AND FEASIBLE
RESPONSE OPTIONS

53
SECTION 5: RAF STAGE 3 - SELECTING APPROPRIATE AND
FEASIBLE RESPONSE OPTIONS
After identifying all potential and relevant response options, it is now time to screen those response options against appropriateness and feasibility criteria. This sub-section will take you through these steps. The Response Options Analysis Matrix (RAM), which constitutes a set of criteria and scoring system, is the main tool used for this section.
Materials needed
• SMART objectives
• The list of relevant response options (at livelihood level, district level, or any other relevant unit of analysis level)
• Key criteria to be scored
• VIPP cards and blu tac.
Participation
• Agency/Cluster members engaged in program planning/implementation;
• Government and non-government agency partners;
• Field and Non Field Food security and nutrition analysts (optional – could act as informants);
• Field-based key informants- as informants (where possible);
• Facilitator(s).
Response Analysis
Response Implementation
Monitoring and Evaluation
Response Planning
Response Options
Identification
Situation Analysis
Current + Forecasted
Response Options Screening

54
5.1. Introduction
The final Stage of the RAF consists of applying the Response Analysis
Matrix (RAM) tool to response options (like those listed in sub-section
4.2.). The RAM uses a 1 to 5 scoring system to make judgements about the
suitability or otherwise of certain responses in relation to certain criteria.
The RAM proceeds by requiring its users to score response options against
a range of criteria designed to judge the appropriateness and feasibility of
given response options. Options are then screened against the “Do No
Harm” principle and appropriateness and feasibility decision rules.
The final output of the RAM is a set of response options which have
passed initial tests of appropriateness, feasibility and do no harm. Each
one of these options could then be fed into a proper response planning
process which will include detailed design and budgeting questions
outside of the scope of response analysis and the RAF. The following
section describes the RAM and how to use it.
5.2 Principles, Process and Stages of the Response Analysis
Matrix (RAM)
The RAM has been designed with four main principles in mind:
1. Consensus: First and foremost, the RAM is a tool designed to generate
debate, questioning and ultimately consensus around key
characteristics of different response options. It can be used in an
interagency context or by one individual agency, and, as for all the
tools in the RAF, it can be used in development or emergency settings.
2. Rigour: As much as possible, the RAM draws on current best practice in
terms of criteria for judging the appropriateness and feasibility of
response options in relation to objectives. A scoring system is used to
allow judgments to be made in a transparent and comparable manner.

55
3. Iteration: The RAM is designed in such a way that the response analyst
is encouraged to think about ways of improving the scores under
particular criteria for a given response option. How can an option be
made more timely? Or how can scale up take place more quickly? (or
can it take place more quickly?). Through such questioning and debate
amongst response analysts, different response options can be critiqued
and more efficient ways of implementation may be found. After each
response option, a template is provided which allows key assumptions
and design issues to be recorded (see Table 8(iii) on pg. 59).
4. Flexibility: Whist certain elements of the RAM are constant across
situations, a degree of flexibility is built in to allow the tool to be
adapted as necessary.
Core process elements of the RAM
In order for the RAM to work properly, it is important that steps be taken
to reduce biases in its use. This is easiest to do in multi stakeholder
settings (e.g. in multi or single cluster planning processes or other
interagency planning mechanisms). Here, the involvement of different
agencies with different agendas and competencies creates good
opportunities for checks and balances, though this will need to be
managed by coordinating bodies (e.g. OCHA, cluster chairs). When used in
a single agency context, extra care needs to be taken to ensure that the
RAM is not used in a supply driven sense.
Stages of the RAM
There are two main variants of the RAM, one for situations in which there
are conflict / civil insecurity issues, and one for peaceful situations. In the
former variant, the RAM is administered in four stages (see below),
whereas in the latter there are three stages (see stages II – IV).

56
Stage I:
Conflict/civil insecurity/access category scores: This score relates to the
intervention area such as the Livelihood Zone
Stage II (a) and (b):
Appropriateness and Feasibility criteria. This is the main part of the RAM.
Here, different aspects of each response option are evaluated and scored.
Part (a) of this stage consists of applying certain “core” criteria, whereas in
part (b) other criteria may be applied, depending on circumstances.
Stage III:
Here, a simple decision tree is used to screen the various response
options. The final output of the RAM is a set of options which have passed
minimum tests of appropriateness, feasibility and do no harm. One,
several, or all of these options could then be fed into a proper response
planning process as required. Such a process will include detailed design
and budgeting questions outside of the scope of response analysis and the
RAF.
A slightly abridged version of a RAM is given in Table 8(i), (ii) and (iii) below.
A full version can be found in Annex 5 in the accompanying CD Rom.

5
7
Ta
ble
8:
Ex
am
ple
of
a R
esp
on
se A
na
lysi
s M
atr
ix
(i)
Co
nfl
ict/
civ
il i
nse
curi
ty c
ate
go
ry s
core
s:
Con
flict categ
ory
score
CRITERIA
If Score = 5, e
xclude/Avoid.
If 4, 3, o
r 2, con
sider
resilience of response to
conflict (column 8 of
criteria).
If 1, then
colum
n 4 is
irrelevant.
Guida
nce: Con
flict situation - Sha
de as
approp
riate
Widespread conflict (curren
t ong
oing and protracted)
5 If Score = 5, shad
e code
– Dark Red
.
Episodic conflict (sporadic/interm
itten
t conflict in parts or all of the
operation area
) 4
If Score = 4, shad
e code
– Brig
ht red
.
Localized conflict (conflict contained in parts of the op
eration area
3 If Score = 3, shad
e code
– Orange
.
Tension/potential conflict (no conflict, b
ut predisposing factors
exist)
2 If Score = 2, shad
e code
– Yellow .
No conflict now
and no pred
isposing factors to conflict exist
1 If Score = 1, shad
e code
– Green .

5
8
(ii)
RA
M M
atr
ix:
1 2
3 4
5 6
7 8
9 10
Objective
Objectively
Verifiable
Indicator (OVI)
Response Options
Conflict
Sensitivity
Tech.
Approp.
Timeliness Capacity “Do no
harm
”?
Budget
issues
Overall
∑(4-9).
Address outcomes and immediate causes
To
Reduce
GAM
Rates in
both
Haw
d and
Addun
pastoral
livelihood
zones
GAM Rates in
HAWD and
Addun reduced
to 15%
or
below by end
of Decem
ber
2011
• Supplem
entary feed
ing for children un
der 5;
• Vitamin A and Iron sup
plem
entation and
fortification and de
worming;
• Outpatient therap
eutic feeding;
• Distribute water purification tablets an
d demonstrate th
eir use;
• Breast fee
ding counselling and hygiene,
food and
sanitation training;
• Operational research on fe
male work
burden
; • W
ASH cluster interventions (access to
potable water and prope
r sanitation);
4 2 3 2 3 3 N/A
1 1 1 1 1 2 1
1 1 1 1 3 5 N/A
1 2 2 2-3
3-4
3 1
1 1 1 1 1 1 N/A
4 2 3 1 2-3
1 N/A
12
9 11
8.5
13.5
15
N/A

5
9
(iii
) K
ey
ass
um
pti
on
s a
nd
de
sig
n i
ssu
es
tha
t w
ill
imp
rov
e s
core
s*
Objective:To Red
uce GAM Rates in both Haw
d an
d Add
un pastoral livelihoo
d zone
s.
OVI:GAM Rates in HAWD and
Add
un red
uced
to 15% or be
low by en
d of Decem
ber 20
11.
Option:Con
duct sup
plem
entary fe
eding in order to
improve food
intake amon
g un
der 5 children.
Criterion
Key assumptions and design issues
Sen
sitivity to
disruption from
con
flict
App
ropriatene
ss
Timeliness
Techn
ical/logistical cap
acity to
carry ou
t the
activity
Proba
bility of adverse im
pacts?
Finan
cial cost (in relation to available
budg
et)G
overna
nce
* T
his
te
mp
late
sh
ou
ld b
e u
sed
fo
r a
ll o
pti
on
s li
ste
d.
Th
e r
est
of
this
se
ctio
n w
il e
xpla
in h
ow
th
e v
ari
ou
s p
art
s o
f th
e R
AM
are
fil
led
in
.

60
5.3 RAM Stage 1: Security / access criteria for conflict / civil
insecurity
In these situations, the RAM is used to first indicate the extent and degree of
conflict and the implications for humanitarian access. In order to do this, a
civil insecurity scale is used as shown in Table 9:
Table 9: Guidance on scoring against security / access criteria
Conflict category Score CRITERIA for conflict category score: If Score = 5 (i.e. war) then consider avoiding the area; If Score = 4, 3, or 2, then go to the next step, i.e. screen by using the “Sensitivity to disruption from conflict” criteria (Column 4 in the RAM – see Table 8(ii) on pg.58). If Score = 1, then no need to use the above criteria, i.e. Do not use Column 4 in Table 8(ii).
Widespread high-level conflict (current ongoing and protracted)
5
Episodic conflict (sporadic/intermittent conflict in parts or all of the operation area)
4
Localized conflict (conflict contained in parts of the operation area
3
Tension/potential conflict (no conflict, but predisposing factors exist)
2
No conflict now and no predisposing factors to conflict exist
1
Flag security access situation by shading livelihood zone name in the RAM title accordingly
If Score = 5, shade code – Dark Red .
If Score = 4, shade code – Bright red .
If Score = 3, shade code – Orange .
If Score = 2, shade code – Yellow .
If Score = 1, shade code – Green .
This initial part of the RAM is not related to any particular response option,
but rather the geographical area in which the option is to be implemented.
Five categories are given ranging from “Widespread high-level conflict
(current ongoing and protracted)” to “No conflict now and no predisposing
factors to conflict exist”. In order to make judgements about the security
situation a number of sources of information may be used, ranging from
latest UN, government and NGO security reports and forecasts to knowledge
of key informants. As in all parts of the RAM, it is important that a consensus

61
is reached on the security phase7. Experience in Somalia indicates that that
local knowledge of actors on the ground is highly important in this exercise.
The scoring system is designed to act as a first screen for responding to a
food security/ nutrition situation. A score of 5 indicates high and widespread
levels of civil insecurity, or war situation, which makes humanitarian activity
extremely dangerous. Scores of 4, 3, or 2 indicate that insecurity exists to
varying degrees, but not as bad as the case of a 5 score. This means that
more opportunities exist for more kinds of responses to succeed. A score of
1 indicates a peaceful situation. When used in the context of Somalia in
August 2010, Mogadishu was given a score of 4 by humanitarian actors8, on
the basis that in recent years, conflict has not been continuous and when
occurring, tends to be confined to particular districts rather than having a
widespread effect. During this time project implementation has been
possible for some agencies in some districts.
The programming implications of a score of 4, 3 or 2 are highly agency and
intervention specific. The existence of conflict may receive a relatively higher
or lower importance depending on the urgency of a particular humanitarian
intervention and the degree of risk an agency is prepared to consider in order
to implement interventions.
7 Apart from the fact that the higher the phase the higher the number, the RAM security
phases are not related to the security phases used by the UN, although each phase
classification will move in the same direction of course.
8 Inter-cluster response analysis workshop, Nairobi 23 – 24 August 2010.

62
5.4 RAM Stage 2: Appropriateness and feasibility criteria
The criteria set used to screen response options may vary from one response
situation to another, although it is possible to find a number of “core” criteria
that are common across different situations. In the RAF, three distinct criteria
types are listed: (i) sensitivity to disruption criteria (for conflict situations); (ii)
common criteria, which could be used for a wide range of response types and
frameworks; and (iii) Other criteria, which could be more applicable in
transition/development situations9.
5.4.1 Sensitivity to Disruption score
If the area based security / access score (see Section 5.3 above) is a 4, 3 or a
2, then the sensitivity to disruption score comes in. Here, RAM participants
are required to go through a number of questions which are specific to the
type of intervention, answering yes or no. Each “yes” answer scores one
point which each “no” answer scores zero points.
These so-called “binary questions” are as follows:
1. Is geographical diffusion (population coverage) a requirement for success?
yes (1) = exposed, no (0) = not exposed. Some projects work within a
confined area, which can be more easily selected for ease of operation
and security. Others (e.g. animal vaccination programmes) need to be
carried out over a very wide area and within a certain period. Everywhere
needs to be included and excluding some localities due to insecurity may
compromise the success of the programme. Additionally the activity may
require extended supply lines or cold chain, which can be highly sensitive
to any disruption or delay.
2. Can the response option be stopped and started easily with minimal loss of
effectiveness? Yes (0) = resilient, no (1) = susceptible. In the event of a
security incident, can the project be easily stopped, then re-started,
9 Defining different criteria sets for response options analysis in different processes and
levels is an area that requires further work.

63
without compromising its success? Certain types of intervention can be
stopped and started repeatedly without loss of effectiveness. An example
of this could be a borehole drilling programme; as long as the boreholes
are drilled by a certain end date, stopping and starting operations will not
be important. In contrast, projects that have a high “process element” –
for example training interventions - may be quite badly affected if there
are repeated stops and starts.
3. Is the implementation of the response option time sensitive? Yes (1) =
exposed, no (0) = not exposed. This relates to the extent to which the
response option has to be implemented within a specific time period in
order to have an impact. A classic example of such an intervention would
be a seed distribution which has to take place just before the planting
season. If the planting season is missed, then the intervention will not be
effective. As a rule of thumb, only those options which can be
implemented at any time of the year with little or no impact on
effectiveness would score a zero here.
4. Length of gestation period – This is a slightly different question: What is
the length of the gestation period for the response option? i.e. the time
elapsed between start of implementation and impact: Longer (1) =
exposed; Shorter (0) = not exposed. The longer the period, the greater the
chances of being affected. A shorter intervention has a chance of
completion before insecurity can have any damaging effect, or it has a
higher chance of not coinciding with the insecurity event than an
intervention with a longer gestation period10
.
5. What is the number of person days necessary for delivery? Many (1) =
exposed, few (0) = not exposed - The longer staff are in the field in a
conflict affected area, the greater the risk of being affected. This criterion
10 In the Somalia pilot, any response option which required 25% or more of the length of the
planning period from start of implementation to impact (e.g. 3 months in the case of a one
year planning timeframe) was deemed to be exposed.

64
is highly situation specific and relies on common sense. Certain types of
response options normally require a higher number of person days than
others.
6. Does the response option involve the transport of or implementation with
highly visible and / or high value assets? Visibility/value of asset: High = 1,
low = 0 - Valuable assets may attract the attention of armed groups,
particularly if they are also highly visible. Are such assets central to the
work of the project and its success? This criterion also relies on common
sense. Certain types of response option involve transport and / or
distribution of assets that are readily tradable by armed groups.
After going through this process, each response option will have a score
ranging from 0 to 6, where 0 is highly insensitive to conflict and 6 is
extremely sensitive to conflict.
� Tips for facilitators
When scoring the response option against the sensitivity to disruption from
insecurity criteria, first score each of the issues to be considered (sub-criteria)
on a 0-1 basis. Then add up these scores to get an overall score for the
criterion. A quick table can be used to organize the thoughts in order to score
this criteria (see example in Table 10):
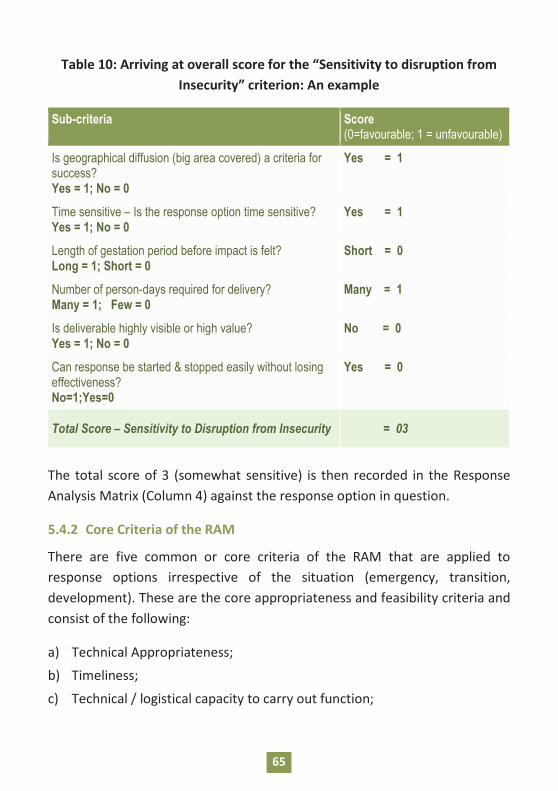
65
Table 10: Arriving at overall score for the “Sensitivity to disruption from
Insecurity” criterion: An example
Sub-criteria Score (0=favourable; 1 = unfavourable)
Is geographical diffusion (big area covered) a criteria for success? Yes = 1; No = 0
Yes = 1
Time sensitive – Is the response option time sensitive? Yes = 1; No = 0
Yes = 1
Length of gestation period before impact is felt? Long = 1; Short = 0
Short = 0
Number of person-days required for delivery? Many = 1; Few = 0
Many = 1
Is deliverable highly visible or high value? Yes = 1; No = 0
No = 0
Can response be started & stopped easily without losing effectiveness? No=1;Yes=0
Yes = 0
Total Score – Sensitivity to Disruption from Insecurity = 03
The total score of 3 (somewhat sensitive) is then recorded in the Response
Analysis Matrix (Column 4) against the response option in question.
5.4.2 Core Criteria of the RAM
There are five common or core criteria of the RAM that are applied to
response options irrespective of the situation (emergency, transition,
development). These are the core appropriateness and feasibility criteria and
consist of the following:
a) Technical Appropriateness;
b) Timeliness;
c) Technical / logistical capacity to carry out function;

66
d) Probability of adverse impacts;
e) Budgetary issues.
a) Technical appropriateness
Refers to whether the response option is “fit for purpose”. This is irrespective
of the fact of it being very expensive, or whether or not there is capacity to
deliver it. This consideration has received a lot of attention in the literature
and there are several sources of information for particular types of
interventions. Key sources include the following:
• “Missing the Point: An analysis of Food Insecurity Interventions in the
Great Lakes”.
(http://www.odi.org.uk/resources/download/363.pdf)
• The Livestock Emergency Guidelines and Standards (LEGS).
(www.livestock-emergency.net)
• The Market Information and Food Insecurity Response Analysis
(MIFIRA)Tool.
(http://www.springerlink.com/content/20t80w3656428335/fulltext.pdf)
• The Emergency Market Mapping and Assessment (EMMA) tool.
(http://fex.ennonline.net/35/emergency.aspx)
• “When disaster strikes; A Guide to Assessing Seed System Security”.
(http://www.ciat.cgiar.org/work/Africa/Documents/sssa_manual_ciat.pdf)
• The Emergency Food Security Assessment Handbook (2nd
edition), WFP
(2009).
(http://www.wfp.org/food-security/guidelines)
These publications are drawn on and referenced in the following section and
should be used in conjunction with “rough and ready “criteria listed under
the tips for facilitators section below.
67
For the purposes of response analysis, judgments regarding technical
appropriateness can only be made in a general sense and are no substitute
for detailed technical appraisals of particular interventions. The idea here is
to use some simple questions and criteria as an initial screening, so that
obviously inappropriate response options can be weeded out. In addition, the
questions serve as prompts for gathering of more information: If the question
cannot be answered then this means that there is insufficient information
upon which to make a judgment regarding appropriateness. As such, it is
incumbent upon the response analyst to request that the required
information is collected.
As for all the remaining criteria in the RAM, technical appropriateness is given
a score ranging from 1 – 5. The meanings of the scores in this case are as
follows:
1 = Definitely appropriate.
2 = Balance of the evidence suggests that option is probably appropriate.
3 = Evidence is mixed.
4 = Balance of the evidence suggests that option is probably inappropriate.
5 = Definitely inappropriate.
� Tips for facilitators
Past implementation experience and evaluation findings are important inputs
in deciding technical appropriateness. In addition:
The following guidelines can be used to help the scoring process in relation to
the following types of interventions:
i. Free food distributions;
ii. Food or cash?;
iii. Seed protection rations;
vii. Supplementary feeding centres;
viii. Cooking lessons;
ix. Demonstration gardens;

68
iv. Food for work;
v. Cash for work;
vi. Seeds and tools distributions;
x. Road reconstruction;
Livestock interventions.
(Sources: Levine and Chastre (2004); WFP EFSA (2009); CARE/ Cornell MIFIRA (2010) LEGS 2009, Sperling
2008).
i. Free food is technically appropriate when:
1. Targeted households lack access to food, and
2. There is a lack of availability of food on local markets and inelastic supply
(thus income support is ineffective in helping to increase access to food
through the market), and
3. Alternative ways of helping people get access to food would either take
too long or might not be practical or reliable.
ii. Food and / or cash – how to decide which is technically appropriate?:
As a starting point, use simple guideline below. For more detailed
guidance refer to WFP EFSA guidelines, or MIFIRA framework:
Is appropriate food available in sufficient quantities in the local markets?
If No: Can other markets provide it quickly without a spike in prices?
If Yes: Consider cash*
Yes: Consider cash intervention*
No: Consider food assistance
* This assumes that people have physical access to the market. This may not be the case
e.g. for elderly and handicapped / labour constrained hhs. In these cases a mixture of
food and cash may be more appropriate. It also assumes that cash is not diverted
away from food (perhaps due to gender issues – i.e. men controlling cash
expenditures).

69
iii. Seed protection ration is technically appropriate when:
1. There is a lack of access to food at household level, and
2. There are grounds for believing that without the ration people would be
forced to eat their seeds and would still not have anything to plant, or
more broadly
3. There are grounds for thinking that they would be unable to plant their
seeds properly because they needed to work for cash to meet food
needs.
iv. Food for work is technically appropriate when:
1. Targeted households lack access to food, and
2. There is lack of availability of food and inelastic supply, and
3. Targeted households have labour potential that is not currently used or
only poorly paid, and
4. Security and access permit implementation.
v. Cash for work is technically appropriate when:
1. Targeted households have surplus labour, and
2. Access to food for some households is lacking, and
3. Food is generally available for those with purchasing power, and
4. The risk of inflationary pressure is low / a depressed economy needs a
cash injection, and
5. Security and access permit implementation.
vi. Seeds and tools distributions11
are technically appropriate when:
1. Targeted households lack seeds and tools, and
2. There is a general lack of availability of seeds or tools of the right quality
in local markets, and
11 The same arguments apply for seed only distributions.

70
3. This lack is limiting production and food security, and
4. The type of seeds and tools which are being proposed for distribution
are locally appropriate.
vii. Seed vouchers12
are technically appropriate when:
1. Targeted households lack seeds, and
2. The lack of seeds is limiting production and food security, and
3. Seeds of the right quality are available in local markets; and
4. Targeted household do not have sufficient purchasing power to afford
seeds.
viii. Supplementary feeding centres are technically appropriate when:
1. Children’s’ malnutrition is caused by an individual lack of access to food
of sufficient quality and quantity, and
2. The food quality of the SFC ration is the correct one for the child, and
3. There is reason to believe that the food given is actually consumed by
the child.
viii. Cooking lessons and improved food modification/processing/
preservation techniques are technically appropriate when:
1. Dietary diversity or low bioavailability of nutrient s are main causes of
child’s malnutrition, or
2. Households have access to alternative food, and
3. Maternal or community ignorance is the reason for these alternatives
not being taken up.
12 For further information on response analysis for emergency seed interventions see “When
Disaster Strikes: A Guide to Assessing Seed System Security”, Sperling 2008 (pp 49 – 56).

71
ix. Demonstration gardens are technically appropriate when:
1. Micronutrient malnutrition is caused by lack of vegetables, and
2. Households have at their disposal land available for vegetable
production, and
3. Households have surplus time for tending these gardens, and
4. Households do not use their land and labour for vegetables (or use them
inefficiently) because of ignorance, and
5. Any vegetables grown will (at least in part) be fed to children.
x. Road reconstruction is technically appropriate when:
The existing poor state of roads:
1. Affects access to markets (and humanitarian aid), and
2. Market access is a factor in food security, or
3. Affects security both on and off the road, and
4. Affects the cost of access (in money and time) to essential basic services.
xi. Livestock Interventions
In the case of livestock, the LEGS Participatory Response Identification Matrix
(PRIM) is an excellent tool for a rapid screening of the appropriateness of
different kinds of livestock interventions in different kinds of emergencies
(full details of the tool can be found in the LEGS manual pp 23 – 31). By way
of illustration, three types of emergencies are covered in the LEGS manual:
• Rapid onset (earthquake) – illustrated in Table a.
• Slow onset (drought) – illustrated in Table b.
• Complex emergency (drought with conflict) – illustrated in Table c.

72
These three examples and the further detail contained in Annex VII13
are
sufficient for the purposes of the RAM14
.
Table a: Rapid onset (earthquake)
Technical Interventions
Livelihoods objectives Emergency phases
Rapid assistance
Protect assets
Rebuild assets
Immediate aftermath
Early recovery
Recovery
Destocking n/a n/a n/a
Vet. services ** ***** *****
Feed ** ***** *****
Water * * *
Shelter *** *** ***
Provision of livestock
n/a n/a *****
Key:
Scoring against livelihoods objectives:
***** = significant benefits / highly appropriate
**** = benefits / appropriate
**** = some benefits
** = a few benefits
* = very little benefit
n/a = not appropriate
13 Annex VIII reproduces table 2.1 from the LEGS which relates technical response options to
different kinds of livelihood objectives.
14 The following text and tables are taken verbatim from the LEGS manual pp 26 – 31.
Emergency phases: = appropriate timing
for the intervention.

73
Notes:
• Accelerated off-take cannot provide rapid assistance to crisis – affected
households since in this particular case the normal market system is not
operating.
• Veterinary interventions could provide both rapid assistance (by helping
to keep alive those animals that have survived the disaster) in the
immediate aftermath, and make a significant contribution to protecting
and rebuilding livestock assets in the early recovery and recovery phases.
• The provision of feed may also contribute to protecting and rebuilding
these livestock assets, although it may not be of much rapid assistance. If
there is advance warning of the earthquake, some measures may be taken
to stockpile feed (and water).
• The provision of water may provide some small benefit depending on the
effect of the earthquake on existing water supplies.
• Shelter-related interventions may contribute to both rapid assistance and
protecting and re-building assets, depending on the type of livestock kept
and their shelter needs. If sufficient warning is given, shelter provisions for
livestock may help save their lives in an alarm phase (e.g. by moving them
out of buildings that may collapse into open spaces). In the immediate
aftermath and early recovery phases, the provision of warm and / or dry
shelter for affected animals can make a significant contribution to the
protecting and rebuilding of assets.
• In terms of rebuilding assets, restocking may make a significant
contribution, helping those who have lost stock to begin to recover some
livestock assets. This can only take place in the recovery phase however.

74
Table b: Slow onset (drought)
Technical Interventions
Livelihoods objectives Emergency phases
Rapid assistance
Protect assets
Rebuild assets
Alert Alarm Emergency Recovery
Destocking ***** *** **
Vet. services (*) ***** ****
Feed (*) *** ****
Water (*) *** ****
Shelter n/a n/a n/a
Provision of livestock
n/a n/a *****
Key:
Scoring against livelihoods objectives:
***** = significant benefits / highly appropriate
**** = benefits / appropriate
**** = some benefits
** = a few benefits
* = very little benefit
n/a = not appropriate
Notes:
• A slow onset drought in Africa shows a very different pattern of
interventions and timings compared to an earthquake. In the alert and
alarm phases, accelerated off-take and make a significant contribution to
providing rapid assistance to affected families through the provision of
cash which can be used to support the family and to a certain extent to
protecting assets (to the extent that the remaining livestock have less
competition for scarce resources, and also that some of the cash
Emergency phases: = appropriate timing for the intervention.
75
generated may be used for animal health and feed for the remaining
livestock). If the timing of the intervention is left until the emergency
phase, then accelerated off-take may no longer be possible because the
condition of the animals is too poor. In this case, slaughter destocking
(shown by the dotted arrow) can provide rapid assistance to affected
households.
• In this example, the drought is in the early stages (alert / alarm) and hence
the preference would be for accelerated off-take rather than slaughter de-
stocking, as the former places cash in the hands of the livestock owners
and encourages market processes.
• Animal health interventions, which may be carried out during all phases of
a drought, can have a significant impact on protecting and rebuilding
livestock assets through preventing death and disease in the heard and
strengthening livestock resistance to drought.
• The provision of feed and water during the alarm and emergency phases
of a drought can help to protect the remaining livestock assets and rebuild
the herd for the future.
• In this particular example, the provision of shelter is not appropriate.
• In the recovery phase, the provision of livestock (“restocking”) can make a
significant contribution to rebuilding livestock assets.

76
Table c: Complex emergency (slow onset drought with conflict)
Technical Interventions
Livelihoods objectives Emergency phases
Rapid assistance
Protect assets
Rebuild assets
Alert Alarm Emergency Recovery
Destocking *** * *
Vet. services (*) ***** ****
Feed (*) ***** *****
Water (*) ** **
Shelter *** *** ***
Provision of livestock
n/a n/a *****
Key:
Scoring against livelihoods objectives:
***** = significant benefits / highly appropriate
**** = benefits / appropriate
**** = some benefits
** = a few benefits
* = very little benefit
n/a = not appropriate
Notes:
• Comparing this matrix with the drought example, most of the
interventions remain appropriate and have the potential for significant
benefits to the affected communities, such as vet services, feed, water
and provision of livestock
• However, accelerated livestock off-take is not appropriate in this conflict
situation, since market systems and infrastructure are severely disrupted.
Emergency phases: = appropriate timing for the intervention.

77
Slaughter destocking could be possible, depending on the operational
constraints under which agencies are working.
• Feed provision has the potential to help protect and rebuild livestock
assets, particularly for communities who may be confined to camps and
not able to take their stock to pasture. Similarly water provision for
livestock which cannot be taken to the usual water sources because of
insecurity may help to protect and rebuild livestock assets.
• Shelter or enclosures for livestock, not relevant in the context of the
drought example, may become an important issue because of
displacement and insecurity (for example the danger of looting).
• All these interventions depend upon the ability of agencies to operate
within the conflict situation.
b) Timeliness
The key criterion here is what is the likelihood of the intervention achieving
significant impact within the time period (as defined by the objective and the
planning horizon). For this criterion, the Response analyst should also use
local knowledge of the area, timing and institution(s) involved in the
implementation of the intervention. Thus this criterion is not merely related
to the type of intervention, but also the operational and contextual
environment in which it will be implemented. When reviewing this criterion a
number of supporting materials may come in handy. These include a seasonal
calendar for the area and results of past evaluations and experiences.
The scoring is as follows:
1 = Impact within the timeframe very likely.
2 = Impact within the timeframe likely.
3 = Impact within the timeframe questionable.
4 = Impact within the timeframe somewhat unlikely.
5 = Impact within the timeframe highly unlikely.

78
� Tips for Facilitators
• Reference to monitoring and evaluation results and past experience in
implementing similar projects in the past are useful in estimating project
timeliness.
• When scoring, it is helpful to split the response option into phases in order
to estimate, based on experience, the length of time each stage will take.
Estimate timings for, for example, resource mobilization, set-up, delivery
of materials; initial outputs and intermediate results; as well as eventual
impacts.
c) Technical/logistical capacity to carry out function
The feasibility of implementing an intervention and the likelihood of it having
an impact may be related to the technical / logistical capacity to carry out the
response. The absence of capacity at sufficient scale to achieve required
impact in a given geographical area / in relation to a particular population
group / in a particular timeframe may not be important IF such capacity can
be scaled up quickly. If scaling up is difficult then it does become important.
Capacity issues may be highly location, time and agency specific, requiring
local knowledge to make informed judgments. A 3W matrix (who? what?
where?) which indicates which agencies are operational in a given area is
very useful when scoring response options against this criterion. Evaluation
results would also be useful to determine if agencies in the 3W matrix
successfully implemented similar responses in the past.
The scoring for this criterion is as follows:
1 = Capacity currently exists at sufficient scale for required impact.
2 = Capacity exists at lower than sufficient scale and can be scaled up quickly.
3 = Capacity does not exist at all but could be scaled up.
4 = Capacity exists but scaling up is difficult.
5 = Capacity does not exist and establishment would be difficult.

79
d) Probability of adverse impacts (“Do No Harm”)
This answers the question: will the intervention have a negative impact on
the intended target group or other groups. “Doing no harm” is a core
humanitarian principle. Harm in this case can refer to a range of negative
consequences including potential for creating/exacerbating conflict,
environmental harm, potential for exacerbating inequalities and injustices,
and potential for creating dependency, etc. A careful examination of the
situation analysis, including socio-political and environmental situation is very
important in making informed judgements regarding if the response option
will do more harm than good. Again, past experience in the same or similar
area will be very useful in making such a judgement.
The scoring is as follows:
1 = Very low probability of any adverse impacts.
2 = Low probability of adverse impacts.
3 = Probability of negative impacts for some population groups is 50:50.
4 = On balance likely to have unacceptable negative impact(s).
5 = Highly likely to have unacceptable negative impact(s).
e) Budgetary issues in relation to likely available resources
Are budgetary issues likely to compromise the implementation of the
response option? This may or may not be related to the actual financial cost
of the option. For example, it might be the case that the availability of funds
for a particular type of programme are restricted due perhaps to a policy
decision on the part of donors or government. Actual financial cost could be
an issue in cases where, for example, difficult terrain makes mounting a
response option very expensive. This issue may pose a bigger problem for
certain options (e.g. those requiring a lot of road transport of materials) than
others which are more service oriented – e.g. training. Local knowledge of
particular areas, characteristics of different interventions as well as
budgetary issues will be useful here.

80
The scoring is as follows:
1 = No evidence to suggest that budgetary restrictions will compromise the
likelihood of funding or the performance of this response option.
2 = Budgetary issues have a slight possibility of adversely affecting funding
and / or performance.
3 = Some likelihood.
4 = Quite likely.
5 = Budget restrictions will make this response option unlikely.
5.4.3 Additional RAM criteria
In theory, a number of additional criteria can be added to the RAM
depending on circumstance and the planning framework. Three additional
criteria are explained here although others are possible.
• Ability to monitor and evaluate.
• Sustainability.
• Compliance with rights and obligations.
f) Ability to monitor and evaluate
In situations where humanitarian or development actors are under pressure
to demonstrate impact, or at least the possibility of measuring impact, the
ability to monitor and evaluate interventions becomes important. This is the
case in Somalia for example.
Several issues may influence the ability to monitor and evaluate particular
interventions. Some of these relate to the other criteria, for example the
security situation. Other considerations would include: the geographical
spread of the intervention and whether implementing partners are able to
give reliable monitoring information.

81
This in turn may affect the quality of monitoring. The level of access may
allow only ‘presence monitoring’. In the case of food aid deliveries, this may
allow sufficient checks on the quantities of food aid distributions at various
stages in delivery and to determine whether the correct number and type of
beneficiaries receive distributions.
Conversely, if food assistance is targeted to households with vulnerable
children, it would be necessary to observe intra-household distribution in
order to ensure that food is actually being given to the children. Monitoring
in this instance requires a higher qualitative element in terms of dedicated
time and observation. Where community awareness-raising (as in cooking
lessons, or counselling on infant and young child feeding practices) is an
essential project component, this would also require careful and detailed
monitoring to establish impact.
The scoring is as follows:
1 = Strong evidence to suggest that adequate process and impact
monitoring will be undertaken.
2 = Strong evidence that adequate process monitoring will be undertaken
and some evidence that impact monitoring will be undertaken.
3 = Some evidence that process monitoring will be undertaken.
4 = Probability of monitoring being possible or taking place is low.
5 = Highly unlikely that any monitoring will be possible.
g) Sustainability
A response is considered sustainable if it has the ability to maintain its
effectiveness after external donor funding has been discontinued, with
minimal negative impacts. This criterion becomes increasingly important as
the acute phase of an emergency is over and there is movement towards a
recovery, transition and development.

82
The scoring is as follows:
1 = Process and impact can easily continue at the same level into the
foreseeable future without any need for external input (goods / money
/ services).
2 = Process and impact can continue after first implementation at a
reduced but sustained level without any need for external input.
3 = Process and impact will continue if there is occasional external input.
4 = The continuation of process and impact will require frequent external
input.
5 = The activity cannot continue to have an impact after first
implementation unless there is active and substantial external input in
subsequent periods.
h) Compliance with Rights and Obligations
Citizens have a right to be heard and have their views taken into account in
decisions that affect them. What is the likelihood that the citizens targeted by
the response option will have rights in relation to it?
Use the following criteria and scores:
5 = No consultation at all.
4 = Populations contacted to provide information.
3 = Populations consulted on implementation modalities of response
option.
2 = Populations fully involved in design of and implementation modalities of
response option.
1 = Populations involved in design, management and implementation
modalities.
State and NGO providers have an obligation to be accountable, transparent
and responsive to the grievances and needs of the populations. To judge the

83
degree to which providers of response actions are meeting their obligations
to their citizens and clients use the following criteria:
5 = Completely unaccountable, unresponsive and not transparent.
4 = Accountability in relation to actions which impinge or affect the physical
safety of target populations.
3 = Consultation mechanisms set up for articulation of grievances are
operational for some issues.
2 = Consultation mechanisms are set up and compensation arrangements
are operational.
1 = Guaranteed, local level fora for airing of views of the population
and monitor able and enforceable mechanisms for ensuring
responsiveness to views.
5.4.4 Tabulating the RAM scores
After all the various appropriateness and feasibility criteria have been applied
to the various response options, each option will have individual scores in
relation to given criteria and also an “overall” score, as indicated in Table 8(ii)
on pg. 58.
When filling in the matrix it is important to remember that:
(a) the various scores for each option should have been arrived at through a
thorough process of discussion and use of the scoring system. An important
part of this is the iterative exploration of ways that individual scores for
particular response options under particular criteria can be changed (vis. one
of the principles (#3) of the RAM listed on above). Through this process,
response analysts explore different modalities for particular response options
so that the lowest scores for each individual criterion can be achieved. The
results of this should be recorded for each response option using the
template provided in Table 8(iii) on pg. 59.

84
and
(b) the most important part of the scoring system is NOT the “overall” score.
This will come into play only in quite specific circumstances (see below). The
most important issue with the scoring is the score per criterion. This will
determine the outcome of stage III of the RAM, which excludes certain
options. Only in stage IV, is there a possibility of individual scores coming into
play.
5.5 RAM Decision Tree
This decision rules are presented in Figure 5 below:
1. If after iteration a given response option still scores a “5” on any of the
criteria then it should be excluded as it is inappropriate and/or not
feasible.
2. For all remaining options: If any score a “4” in relation to the possibility
of adverse effects criterion, then they should also be excluded as they
are deemed to be likely to have unacceptable negative consequences.
3. Any other options scoring a “4” on any of the other criteria should not
be preferred unless there are compelling arguments to the contrary (e.g.
they have very low scores in relation to all other criteria).
4. Finally, and only if necessary (due e.g. to budget restrictions), further
discrimination between options would be possible making use of the
total score column.

85
Figure 5: RAM Decision Tree
Does the response option score “5” in any of the
columns?
If yes,
EXCLUDE
If no, does the response option score “4” in relation to the “”do no harm” criterion?
If no, then the response option passes the “do no
harm” test.
If yes then the option
should be excluded.
Does the response option score “4” in any of the
columns?
If yes, then the option should not be preferred.
If no, then the option meets the minimum standards of
appropriateness and feasibility.
If necessary due to resource or capacity constraints, discrimination on the basis of total scores may be
considered.

87
SECTION 6
DESCRIPTION OF ANNEXES

89
SECTION 6: DESCRIPTION OF ANNEXES
This short section gives details of the annexes contained in the accompanying
CD Rom.
Annex I: Handout on the Response Analysis Framework
This is a reproduction of some text contained in Section 2 of this Guide. It
gives a short explanation of the Response Analysis Framework, and is suitable
for distribution as part of facilitation to those who will be using the RAF.
Annex II: Response Analysis Framework (RAF) – Value Added to the IPC and
CAP 2011 Development Process in Somalia
This annex describes how the Somalia Response Analysis Support Team
(RAST) integrated its activities and support into existing processes for food
security analysis and response in the context of the 2011 CAP for Somalia.
The table clearly shows at which points the RAF added value to ongoing
processes. It may serve as a model for further applications of the RAF in
Somalia or elsewhere.
Annex III: Inter-Cluster Workshop Report
This workshop report presents the activities and results of the Inter-cluster
response analysis workshop, implemented by the Response Analysis Support
Team (RAST) on 23 – 24 August 2010. The event brought together cluster
members from the Agriculture and Livelihoods, Food Assistance and Nutrition
clusters representing different UN agencies, international NGOs and INGOs.
Objectives and Outputs:
The workshop had three objectives:
• Facilitate the development of cluster response plans for the 2011 CAP
using a process of response analysis,
• To test and refine a draft Response Analysis Framework
• To help lay the ground for a sustainable application of the Framework as
an integral part of cluster activities.

90
The main intended output from the workshop, was an agreed analysis of
response options for at least five high priority Livelihood Zones of Somalia. By
the end of the workshop, this output had been partially achieved in that
response options had been formulated for eight Livelihood Zones and fully
analysed in three of those.
Annex IV: Facilitation guide for CAP Response Options Analysis Workshop
for Agricultural Livelihoods, Food Assistance and Nutrition Clusters
This facilitation guide was used in the context of the Inter-cluster Workshop
held in Nairobi in August 2010. It can be used and adapted in subsequent
exercises in Somalia and elsewhere.
Annex V: Example of the Response Analysis Matrix (RAM)
An example of a (hypothetical) fully completed RAM used for training
purposes. The RAM relates to food, nutrition and livelihood interventions for
the Hawd and Addun Pastoral Livelihood Zone, and is tailored to the 2011
CAP planning framework (January – December 2011).
Annex VI: RAST Applied Research Brief 1: Food and Agriculture Based
Routes to Nutrition: Implications for Interventions in Somalia
This brief reviews evidence on the efficacy of agriculture based routes to
nutrition, and draws out the implications for programming in Somalia. It
concludes that there are broadly three groups of agricultural activities which
can be used to influence nutrition within the Somali context:
a) Horticulture
b) Milk
c) Livestock
In addition, vouchers explicitly linked to increased agricultural production /
marketing in target areas also offer possibilities.

91
Annex VII: RAST Applied Research Brief 2: Non - Agriculture Based Routes to
Nutrition in Emergencies: Implications for Interventions in Somalia
This is a companion to the Applied Research Brief 1. It investigates non-
agricultural intervention types falling into the following categories:
1) Direct food based transfers (general food rations; food for work; and
school feeding).
2) Cash.
3) Management of acute malnutrition (Outpatient therapeutic feeding;
supplementary feeing – targeted and blanket).
4) Management of micronutrient malnutrition (micronutrient
supplementation; food fortification; vouchers; home based fortification
products; and public health measures [deworming]).
5) Behaviour Change.
6) Public Health.
For each intervention type, the brief discusses: key issues; strengths and
weakness and lessons learned as these apply to Somalia; suitability for
different areas and livelihood zones in Somalia.
Annex VIII:LEGS Livelihood Objectives and Technical Options
This consists of a table which clearly relates different livelihood objectives
(e.g. “protect the key livelihood assets of crisis-affected communities”) to
different technical response options, noting implications and issues.

I19
94
E/1
/12
.10