· Meenaxi Saini,a Yogeshwar Masirkar,a Ritu Varshney,b Partha Royb and Kalyan K. Sadhu*a ... The...
14
S1 Fluorogen-free Aggregation Induced NIR Emission from Gold Nanoparticles Meenaxi Saini, a Yogeshwar Masirkar, a Ritu Varshney, b Partha Roy b and Kalyan K. Sadhu* a a Department of Chemistry, Indian Institute of Technology Roorkee, Roorkee 247667, Uttarakhand, India b Department of Biotechnology, Indian Institute of Technology Roorkee, Roorkee 247667, Uttarakhand, India Supporting Information Experimental Section S2-S5 Supporting Figures S6-S13 Supporting Tables and References S14 Electronic Supplementary Material (ESI) for Chemical Communications. This journal is © The Royal Society of Chemistry 2017
Transcript of · Meenaxi Saini,a Yogeshwar Masirkar,a Ritu Varshney,b Partha Royb and Kalyan K. Sadhu*a ... The...

S1
Fluorogen-free Aggregation Induced NIR Emission from Gold Nanoparticles
Meenaxi Saini,a Yogeshwar Masirkar,
a Ritu Varshney,
b Partha Roy
b and Kalyan K. Sadhu*
a
aDepartment of Chemistry, Indian Institute of Technology Roorkee, Roorkee 247667,
Uttarakhand, India bDepartment of Biotechnology, Indian Institute of Technology Roorkee, Roorkee 247667,
Uttarakhand, India
Supporting Information
Experimental Section S2-S5
Supporting Figures S6-S13
Supporting Tables and References S14
Electronic Supplementary Material (ESI) for Chemical Communications.This journal is © The Royal Society of Chemistry 2017

S2
Experimental detail
Materials
For the gold nanoparticles, the chemicals gold (ш) chloride trihydrate was purchased from
Sigma-Aldrich, trisodium citrate dihydrate was purchased from Merck Chemicals, EDTA
disodium salt dihydrate was purchased from HIMEDIA and sodium borohydride was
purchased from Thomas Baker. All glassware were cleaned with aqua regia (mixture of 1:3
volume ratios of HNO3 and HCl) and rinsed with millipore water prior to use. TEM images
of the biological cells were recorded in Sophisticated Analytical Instrument Facility-DST at
AIIMS, New Delhi. Fluorescence imaging experiments were carried out in Advanced Center
for Material Science of IIT Kanpur.
Synthesis of Au-1
23.6 mg (0.05 mmol) of Gold (III) chloride trihydrate was dissolved in 200 mL of millipore
water and boiled under reflux condenser with constant stirring. Then 20.5 mg (0.07 mmol) of
trisodium citrate dihydrate was dissolved in 1.8 mL of millipore water and added to refluxing
solution. After the addition, initially the solution was dark violet which quickly changed to
red. The reaction was allowed to continue for 30 min. The final gold nanoparticles were
cooled to room temperature.
Synthesis of Au-2ar
23.6 mg (0.05 mmol) of Gold (III) chloride trihydrate was dissolved in 200 mL of millipore
water and boiled under reflux condenser with constant stirring. Then 20.5 mg (0.07 mmol) of
trisodium citrate dihydrate was dissolved in 1.8 mL of millipore water and added to refluxing
solution. After the addition, initially the solution was dark violet which quickly changed to
red. The reaction was allowed to continue for 30 min. The final gold nanoparticles were
cooled to room temperature. Then 20 mL of 100 time diluted aqua regia was added to the
solution and stirred for 30 min.
Synthesis of Au-3ar
20 mg (0.05 mmol) of Gold (III) chloride trihydrate was dissolved in 200 mL of Millipore
water and boiled under reflux condenser with constant stirring. Then 6.4 mg (0.02 mmol) of
trisodium citrate dihydrate was dissolved in 640 µL of millipore water and added to refluxing
solution. After the addition, initially the solution was dark violet which quickly changed to
red. The reaction was allowed to continue for 30 min. The final gold nanoparticles were
cooled to room temperature. Then 200 µL of aqua regia was added to the solution and stirred
for 30 min. The red solution changed to blue within 24 h.
Synthesis of Au-4
23.6 mg (0.05 mmol) of Gold (III) chloride trihydrate was dissolved in 200 mL of Millipore
water and boiled under reflux condenser with constant stirring. Then 57 mg (0.2 mmol) of
trisodium citrate dihydrate was dissolved in 1.8 mL of millipore water and added to refluxing
solution. After the addition, initially the solution was dark violet which quickly changed to
red. The Reaction was allowed to continue for 30 min. The final gold nanoparticles were
cooled to room temperature.

S3
Synthesis of Au-5
23.6 mg (0.05 mmol) Gold (III) chloride trihydrate was dissolved in 250 mL of Millipore
water and then 50 µL aliquots of freshly prepared 0.1 M sodium borohydride (NaBH4) were
added at room temperature to the slowly mixing solution of gold until a stable red-colored
colloid was observed (1250 µL NaBH4), and the reaction was left for 24 h at room
temperature.
Synthesis of Au-6
23.6 mg (0.05 mmol) of Gold (III) chloride trihydrate was dissolved in 5 mL of Millipore
water and the solution were well mixed into 1 mL of disodium ethylenediaminetetraacetate
(Na2H2EDTA, 0.025 mmol) at room temperature, followed by an adjustment of the pH of the
mixture solution at 5.1 with aqueous solution of NaOH (0.1 M). The volume of the mixture
solutions was adjusted to 50 mL with water, followed by 1 min vigorous mixing. The mixture
solution remained yellowish during mixing. Subsequently, the resulting mixture was very
rapidly poured into 250 mL of boiling Millipore water under vigorous stirring, followed by
further 2 h boiling and then cooled down to room temperature.
Transmission Electron Microscopy (TEM)
The TEM images of gold nanoparticles were performed using FEI, Technai G2 20 S-TWIN.
ImageJ software was used to analyze the average diameter. Selective Area Diffraction (SAD)
images were also captured by the same instrument. Gold nanoparticles were placed in carbon
coated copper grids with 200 mesh obtained from Icon Analytical.
Absorption spectroscopy
Absorbance measurement was characterized using UV-Vis spectrometer (UV-1601,
Shimadzu) within 400-800 nm wavelength range. The path length was 1 cm for all the
measurements.
Calculation of molarity of gold nanoparticle solutions
Absorbance spectrum is used to calculate the concentration of gold nanoparticle solution.
First the ratio of Aspr/A450 is calculated and then concentration is calculated according to the
equation available in literature.S1
NIR Luminescence spectroscopy
Gold nanoparticle solutions were characterized by luminescence using FLS-980 Edinburgh
Instrument. The luminescence measurement of gold nanoparticle solution was taken over
800-1500 nm. Excitation and emission band width of equipment were kept at 15.01 nm.
NIR Absolute quantum yield measurement
Absolute QY measurement was performed using FLS-980 Edinburgh Instrument. For the
sample preparation, 15-40% absorption of the light was considered as ideal for the
measurements. Excitation and emission band widths of the equipment were kept at 12 and 0.2
nm respectively and the maximum signal level was kept within 1 M cps. All the scans were

S4
repeated thrice by the instrument for comparison. The sample was compared with millipore
water as blank within the range 550 nm to 1500 nm.
Fluorescence measurement
Fluorescence of fluorescein was measured using Synergy Micro plate Reader (BIOTEK
USA) Instrument, within the range of 470-700 nm with ex = 435 nm. Excitation and
emission band width of equipment were kept at 16.0 nm.
Relative quantum yield measurement
Fluorescein was dissolved in acetic acid to obtain 10 mM stock solution; this was then diluted
to the desired final concentrations by gold nanoparticle solutions. The fluorescence quantum
yield of fluorescein was esitmated by addition of diluted aqua regia, using a fluorescence
standard, fluorescein in pH 4 (Q = 0.18)S2
as a reference for comparison.
Absorbance kinetics measurement
The kinetic studies of aggregation process due to aqua regia addition was monitored using
Synergy Micro plate Reader (BIOTEK USA) Instrument, at 650 nm with an interval of 2 s.
The slope of the initial rate has been plotted against the amount of aqua regia. The fitting of
straight line follow R2 = 0.99.
Fluorescence life time measurement
Fluorescence decay of fluorescein was estimated using TCSPC system from Horiba Jobin
Yvon FluoroHub Instrument, with ex = 435 nm and em = 520 nm. Data analysis was
performed with DAS6 software. The decay time data were analyzed using a sum exponential,
employing a nonlinear least-squares reconvolution analysis.S3
Average fluorescence lifetimes
were calculated as Bii with normalized Bi. The radiative and nonradiative decay rate
constants are calculated according to the equations available in literature.S4
DLS measurement
The hydrodynamic diameters of the gold nanoparticles were measured using a Zetasizer Nano
ZS90 (Malvern Instruments). DTS applications 7.03 software was used to analyze the data.
All sizes reported here were based on intensity average. For each sample, three DLS
measurements were conducted with a fixed 11 runs and each run lasts 10 s.
Field Emission Scanning Electron Microscope (FE-SEM)
The FE-SEM (Carl ZEISS Ultra plus Gemini, Germany) was employed to analyze the
morphological aggregation features where all the samples were prepared by drop casting the
solution in silicon wafers at 30 kV. Experimental detail with HepG2 cell
Cell Viability assay
To check the cell viability MTT assay was carried out. 5 103 HepG2 cells suspended in 200
L of medium were plated in 96-well plates (Corning, NY, USA) and grown under normal

S5
conditions. GNP solution at 0.5 nM concentration was added to the monolayer in triplicates
for 1, 4 and 12 h. Cultures were then assayed by the addition of 20 L of 10 mg/mL MTT and
incubating it for another 4 h at 37 ºC. The MTT containing medium was then aspirated and
100 µL of DMSO was added to solubilise the water insoluble formazon. The absorbances of
the lysates were determined on FLUO star optima microplate reader (BMG Labtech,
Germany) at 570 nm.
To elucidate the mode of translocation of NPs in nucleus, ivermectin and importazole were
used to inhibit importin /- and importin -mediated nuclear import respectively. Briefly, 5
104 HepG2 cells were seeded onto each coverslips in 6 well plate and incubated for 24 h in
CO2 incubator at standard conditions. Thereafter, cells were pre-incubated with or without 25
M ivermectin or 50 M importazole for 1 h and further co-administered with 25 M
ivermectin or 50 M importazole with 0.5 nM of NPs for next 1 hr. After incubation, cells
were washed with PBS thrice and fixed with 4% formaldehyde. Thereafter, cells were
counterstained with DAPI and slides were prepared for fluorescence microscopy.
Statistical analysis
Data are specified as mean ± standard deviation (SD) of triplicate independent experiments
and statistically evaluated using one way ANOVA and followed by Tukey post hoc test using
Graph Pad Prism 6 (Graph Pad Software, San Diego, CA, USA). A p-value of less than 0.05
was considered to be statistically significant.
Fluorescence Microscopy
Fluorescence microscopic images of cells were captured using Carl Zeiss LSM780
fluorescence microscope. Images were obtained via a high resolution peltier cooled
monochrome camera with F set 20 wide field camera modes and 1.8 times magnification. The
rhodamine filter and long pass red filter were used for excitation and emission purpose
respectively. TV mode in ZEN software was used to acquire images.
Transmission Electron Microscopy in cells
Cells were treated with gold nanoparticles at 0.5 nM concentration for different time duration
i.e. 1, 4 and 12 hours. After respective incubation, treated cells were fixed in 2%
paraformaldehyde and 2.5% glutaraldehyde in 0.1 M phosphate buffered saline (pH 7.4). The
cells were then post fixed with 1% OsO4 in Sorensen phosphate buffer (0.05 M Sorensen
phosphate buffer, 0.25 M glucose, 1% OsO4) for 1 h followed by washing with distilled water
twice and further pre-staining with solution of 2% uranyl acetate for 12 h, according to the
Standardized protocol developed by ‘Sophisticated Analytical Instrument Facility’ of AIIMS,
New Delhi, India. The cells were then finally analyzed by FEI, Technai 200 KV TEM.
Images were analyzed by Si-Viewer Olympus soft imaging solution (Olympus, USA).

S6
Supporting Figures
Figure S1. SAD (left) and TEM (right) image of Au-1.
Figure S2. Absorbance spectra of Au-1 due to addition of diluted hydrochloric acid (left) and
diluted nitric acid (right).
Figure S3. Luminescence spectra of Au-1 due to addition of 100 time diluted hydrochloric
acid (left) and nitric acid (right).
S7
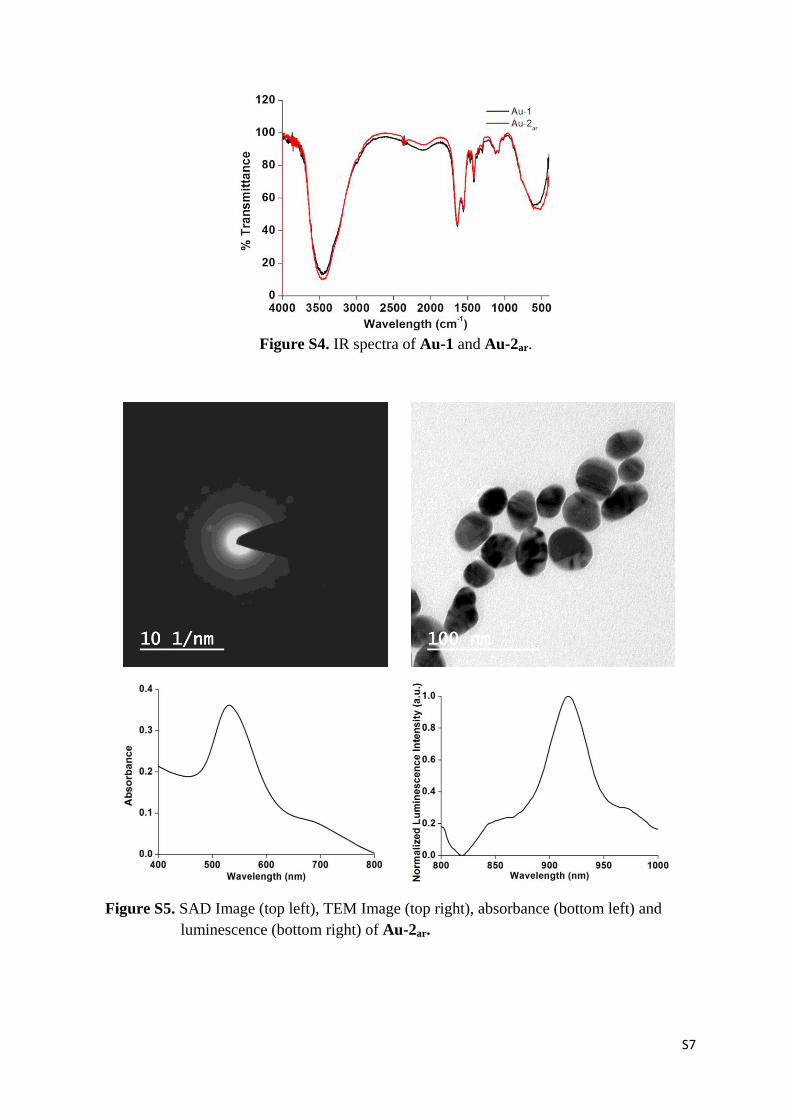
Figure S4. IR spectra of Au-1 and Au-2ar.
Figure S5. SAD Image (top left), TEM Image (top right), absorbance (bottom left) and
luminescence (bottom right) of Au-2ar.

S8
Figure S6. SAD (left) and TEM (right) Images of Au-3ar.
Figure S7. Luminescence of Au-3ar with and without 645 nm and 850 nm filters.
Figure S8. Stokes shift of Au-3ar for excitation wavelength within 520 nm to 775 nm.
S9
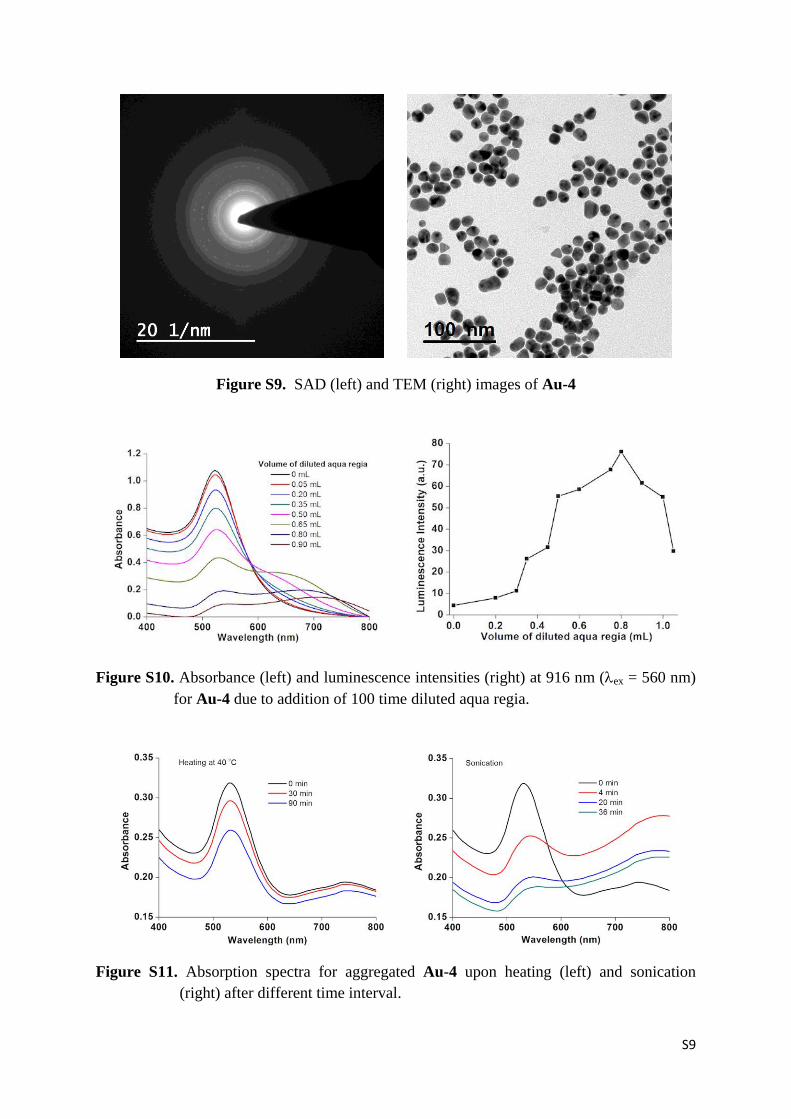
Figure S9. SAD (left) and TEM (right) images of Au-4
Figure S10. Absorbance (left) and luminescence intensities (right) at 916 nm (ex = 560 nm)
for Au-4 due to addition of 100 time diluted aqua regia.
Figure S11. Absorption spectra for aggregated Au-4 upon heating (left) and sonication
(right) after different time interval.

S10
Figure S12. Absorbance kinetics at 650 nm (left) due to aggregation of Au-4 due to addition
of 100 time diluted aqua regia and pseudo first order rate (R2 > 0.99, right figure)
with respect to the concentration of aqua regia addition.
Figure S13. Absorbance of Au-5 (left) and Au-6 (right), monitored during addition of 100
time diluted aqua regia.
Figure S14. Change in emission intensities of Au-5 (left) and Au-6 (right) at 916 nm (ex =
560 nm) due to addition of 100 time diluted aqua regia.

S11
Figure S15. SAD and TEM Images for Au-5 (top left and top right) and Au-6 (bottom left
and bottom right).
Figure S16. Change in the fluorescence of fluorescein in presence of Au-4 due to addition of
100 time diluted aqua regia.

S12
Figure S17. Fluorescence decay plot of fluorescein in presence of Au-4 and treatment with
different amount of diluted aqua regia.
Figure S18. Change in fluorescence of fluorescein (ex = 435 nm) in presence of (left) Au-5
and (right) Au-6, during addition of diluted aqua regia.
Figure S19. Fluorescence microscopic images of fixed human liver carcinoma HepG2 cells
without any probe treatment. The cells were excited at 550-575 nm and
emissions were monitored with long pass red filter.

S13
Figure S20. TEM images of fixed human liver carcinoma HepG2 cells (A) without any probe
treatment and (B) after the treatment of Au-3ar (0.5 nM) for 1 h.
Figure S21. Fluorescence microscopic images of nanoparticles treated fixed human liver
carcinoma HepG2 cells with and without ivermectin. The cells were excited at
standard DAPI excitation and 550-575 nm for NIR imaging and emissions were
monitored with standard DAPI filter and long pass red filter for NIR imaging.

S14
Supporting Table
Table S1. Summary of diameters along major and minor axis of different nanoparticles Au1-
Au6.
Gold Nanoparticle Axis Average diameter (nm)
Au-1 Major 39.58 (±7.5)
Minor 29.56 (±4.8)
Au-2ar Major 32.79 (±6.6)
Minor 25.35 (±3.0)
Au-3ar Major 58 (±13)
Minor 40 (±5.0)
Au-4 16.5(±2.0)
Au-5 Major 30.11(±7.6)
Minor 23.56(±5.5)
Au-6 Major 54.91(±19)
Minor 37(±8.7)
Table S2. Fluorescence life-time data for fluorescein in Au-4 and during addition of diluted
aqua regia.
Treatment of diluted
aqua regia to
fluorescein in Au-4
Quantum
Yield
Average
excited state
life-time (ns)
Rate constant for
radiative decay
(× 109 s˗1
)
Rate constant for
nonradiative decay
(× 109 s˗1
)
Control
(fluorescein only)
0.18 3.14 0.32 1.46
0.00 mL aqua regia 0.008 0.19 5.29 656.08
0.25 mL aqua regia 0.04 0.80 1.26 30.12
0.50 mL aqua regia 0.14 1.14 0.87 5.37
0.75 mL aqua regia 0.16 2.16 0.46 2.44
Supporting References
S1. W. Haiss, N. T. K. Thanh, J. Aveyard and D. G. Fernig, Anal. Chem. 2007, 79, 4215-
4221.
S2. R. Sjöback, J. Nygren and M. Kubista, Spectrochim. Acta Part A 1995, 51, L7-L21.
S3. G. Hungerford, A. Allison, D. McLoskey, M. K. Kuimova, G. Yahioglu, K. Suhling, J.
Phys. Chem. B 2009, 113, 12067–12074.
S4. J. R. Lakowicz, Principles of Fluorescence Spectroscopy, 3rd ed. Springer Science +
Business Media, LLC, 2006.


![[XLS] · Web view12 B HARDWAR SOCIETY NEAR RAMJI MANDIR KASHIBA ROAD, RANIP AHMEDABAD 00000000000000P20999 ARVINDBHAI MANILAL UPADHYAYA KESHAVLAL 1206 YOGESHWAR NAGAR NEAR GAYATRINAGAR](https://static.fdocuments.us/doc/165x107/5b3168857f8b9a2c328c7929/xls-web-view12-b-hardwar-society-near-ramji-mandir-kashiba-road-ranip-ahmedabad.jpg)