· Leading consumer goods company of branded products Peruvian based with operations in Argentina,...
29
Transcript of · Leading consumer goods company of branded products Peruvian based with operations in Argentina,...


Leading consumer
goods company of
branded products
Peruvian based with operations in Argentina, Colombia, Ecuador
and Chile; and exports to more than 23 countries
Second largest Andean Consumer Goods Company. Market leader
in all categories in Peru
25% of revenue generated outside Peru
Quoted in the Peruvian stock exchange; ranked as a top corporate
governance company
4 Business Units
focused on 3
core businesses
Manufacture and distribution:
Financial performance
2011 Revenue: S/.4,256MM
CAGR (2005-2011): 14.6%
Debt to EBITDA ratio of 0.93
ROE: 18.1%
Bond rating:
AA+ (PE) by Apoyo & Asociados (May 2011)
AA+ (PE) by Pacific Credit Rating (October 2011)
Consumer Goods
Peru Andean Region & C.America
Mercosur
Region
Industrial
Products
Animal
Nutrition
106 family brands in 16 different categories2 brands for fish and
shrimp feed14 brands directed to
the food industry
Consumer Goods Industrial
Products
Animal
Nutrition
Peru International Market
Consumer Goods
Peru Andean Region & C.America
Mercosur
Region
Industrial
Products
Animal
Nutrition
106 family brands in 16 different categories2 brands for fish and
shrimp feed14 brands directed to
the food industry

Transformational Changes
Results
Aggressive Growth
Strong Competitive Position
Cost Efficient Operations
Cashflow Generation for Expansion
Solid Market Shares in Core Categories
International Expansion
Higher Returns
Consumer & Market Oriented
Leading brands & Diversified Portfolio
Higher Value Added Products
Strong Distribution Network
Commodity Consolidation
Use of Economies of Scale
Low Cost of Production
New Product Development Process
Aggressive M&A strategy

Growth through M&As and Integration
Peruvian Market Consolidation International Expansion
Acquisition Merger Acquisitions
S/.605MM (US$80MM) in Revenue in 1995 S/.4,256MM (US$1,579MM) in Revenue (2011)
Planta de detergentes
Industrias Pacocha
La Fabril
Consorcio Distribuidor
Alicorp S.A.A
1996 1995 1997 2008 2010
Molinera del Perú
2011
CIPPSA Consorcio de
Alimentos Fabril Pacífico
2007 2006 2005 2004 2012

• Edible Oil
• Margarine
• Mayonnaise / Sauces
• Cookies & Crackers
• Pasta
• Juices (Powder)
• Baking Flour (household)
• Jello
• Pet Food
• Laundry Soap
• Laundry Detergent
• Flour
• Pre-mix
• Edible Oil
• Shortenings
• Shrimp Feed
• Fish Feed
• Pasta
• Sauces
• Cookies & Crackers
• Juices (Powder)
• Ice Cream
• Pet Food
• Hair Care
• Personal care soap
• Softeners
• Laundry Detergent
• Laundry Soap
• Laundry Detergent
• Soap
• Hair Care
• Softeners
• Deodorant
• Pasta
• Cookies & Crakers
2011
Consumer Goods
Peru Andean Region
& Central America
Mercosur
Region
63%
% of Total 2011 EBITDA 62% 31%
7%
7%
7% 30%
Revenue: S/. 4,256 MM (US$1,579MM)
EBITDA: S/. 551.7MM (US$204.6MM)
Industrial Products
Animal Nutrition
% of Total 2011 Revenue 30% 30% 8%

Market Share per Volume for the period May - June, 2012
Category Brands Market Share Position
Source: Kantar World Panel
(1) Internal Source
(2) CCR Audit
#1 96% Mayonnaise
#1 76% Laundry Soap
#1 70% Animal Nutrition (1)
#1 63% Margarines
#1 65% Juice (Powder)
Edible Oil #1 55%
#1 54% Laundry Detergent
#1 51% Industrial Baking Flour Inca
#1 44% Pasta
#1 35% Pet Food (2)
#1 31% Cookies & Crackers (1)
Competitors
Locals
Molinos Río de la Plata

GDP & PRIVATE CONSUMPTION1/2
(% YoY change)
1. In real terms
2. 2012 Figure is estimate
Source: BCR, APOYO Consultoría
CONSUMER GOODS INDUSTRY1/2
(% YoY change)
1. In real terms
2. 2012 Figure is estimate
Source: Produce, APOYO Consultoría
0.0
1.0
2.0
3.0
4.0
5.0
6.0
7.0
8.0
9.0
10.0
2007 2008 2009 2010 2011 2012
Private Consumption GDP

URBAN PERU: POPULATION DISTRIBUTION BY SOCIOECONOMIC LEVEL
& PRODUCT INNOVATION
(2010)
Inca
Source: IPSOS Apoyo
LIMA
22
35
31
13
8
25
38
29
URBAN
PROVINCES
9
20
28
43
PERU TOTAL
PREMIUM MAINSTREAM VALUE
E D C A/B E D C A/B E D C A/B E D C A/B

Iquitos
ORIENTE 240 clientes
Piura
Chiclayo
Trujillo
Huaraz
Huacho
Lima
Chincha
Ica Ayacucho
Arequipa
Tacna
Juliaca
Cusco
Huancayo Tarma
Hu á nuco
Tarapoto
Pucallpa
Iquitos
Piura
Chiclayo
Trujillo
Huaraz
Huacho
Lima
Chincha
Ica Ayacucho
Arequipa
Tacna
Juliaca
Cusco
Huancayo Tarma
Hu á nuco
Tarapoto
Pucallpa
National distribution coverage through:
• 27 exclusive distributors
• 100% of wholesalers and supermarkets
• Food Service distribution system
• 12 warehouses nationwide
• 25 sale offices
• 9 manufacturing facilities
• Logistics in the 4 most important ports of
Peru
Exclusive
Distributors Sale offices Industrial plants Warehouses
TOTAL 200,000
clients

42 48
17 6
25
21
29
8
Peru Market Alicorp Peru
Wholesalers Modern Channel Exclusive Distribution B2B Mom & Pop Other
2011
MARKET STRUCTURE & REVENUES PER DISTRIBUTION CHANNEL
Source: Kantar Worldpanel, Apoyo Consultoría, CCR Audit
(In %)
33
5142 48
13
5 17 6
24 25
19 21
39
29
10 8
Peru Market Alicorp Peru Peru Market Alicorp Peru
Wholesalers Modern Channel Exclusive Distribution B2B Mom & Pop Other
7% 30% Alicorp’s Share in Modern
Channel
per category
Edible Oil:
Pastas:
Detergents:
Cookies & Crackers:
Mayonnaise:
32.6%
33.2%
42.6%
16.0%
83.4%
EXPENSE DISTRIBUTION REVENUE STREAM

Long-Term Target: 50% of Total
Revenue
14.2%
15.6%
46.7%
Consumer
Goods Argentina
Ecuador
Colombia
Chile
Bolivia
Haiti
Animal Nutrition
Colombia
Ecuador
Guatemala
Honduras
Nicaragua
China
Industrial Products
Canada
U.S.A.
Bolivia
Ecuador
(YoY % Change)
REVENUE GROWTH
Foreign Revenue: S/.1,045.7M (US$387.9MM) 2011
( 25% of Total Revenue )
( 18.5% growth over 2009 )
CAGR 37.3% (2006-2011)
Colombia6%
Haiti3%
Honduras3%
Argentina39%
Canada12%
EEUU4%
Others11%
Ecuador22%
New acquisition:

Market Share per Volume
# 2 27%
6%
# 2 18%
# 3 LIMZUL
# 9 3%
4% # 6
23% # 2
14% # 2
4% # 4
15% # 3
5% # 4
Category Brands Position
Argentina (1)
Ecuador (2)
Colombia (3)
Laundry Detergent (OND’11)
Personal Care Soap (OND’11)
Hair Care (OND’ 11)
Pasta (MA’12)
Pet Food (MA’12)
Juice (Powder) (ND’11)
Hair Care (MA’12)
2% # 7 Cookies (JJ’11)
Pet Food
Baby Hair Care
Cookies & Crackers (OND’11)
Mayonnaise (MJ’11)
Pound Cakes (4) (S’11)
Pasta (Dry) (4)
Juice (4)
2% # 6
11%
5%
7%
Market Share
32% # 1 Animal Nutrition
Source: (1) Household Panel KWP Argentina
(2) Source: IPSA Audit
(3) Nielsen Audi
(4) Internal Source
Competitors
GNCH

Chile
One industrial plant in the Chiloe Island
Direct sales to final client
Most of clients located in surrounding areas
Specialized sales force in the aquaculture business
and in constant contact with the client
Colombia
Nation-wide distribution network
1 industrial plant
Plan to increase critical mass and coverage
Ecuador
Nation-wide distribution through local distributors
Strong wholesaler and retailer distribution
Plan to increase participation in wholesale market
Animal Nutrition plant under construction
Peru
National distribution coverage
27 exclusive distributors
13 warehouses nationwide
25 sales offices
16 industrial plants
Argentina
Own nation-wide distribution network
Strong presence in rural areas
5 industrial plants in Buenos Aires
Plan to increase presence in super markets
Iquitos
Piura
ChiclayoTarapoto
Huanuco
TarmaHuancayo
Lima
IcaAyacucho
Cusco
Arequipa
Juliaca
Tacna
Pucallpa
Trujillo
Huaraz
Chincha
Huacho
Our operational, distribution and sales platform
Exclusive Distributors
Warehouses Sale Offices
National Distribution Coverage Regional Distribution Platform
15

International Peru Industrial Products
Animal Nutrition
Consumer Goods
Corporate
Unit
Marketing
Supply Chain
Finance
HR
Matrix Organizational
Structure
Increasing Consumer
& Customer Value
By Geographic
Area By Category
Business Unit
Business Partners

CATEGORY
BR
AN
D
EQ
UIT
Y
DIVERSIFIED PORTFOLIO
Clear strategy to diversify towards the HPC markets
Other Categories include: Omega, and Animal Nutrition
PRODUCT DIVERSIFICATION
2007 2008 2009 2010 2011
Alicorp Total Revenues (US$MM)
900 1,253 1,233 1,332 1,579
(% of Total Revenues)
83% 83% 82%
69% 68%
7% 8% 9%
11% 11%
10% 9% 9%21% 20%
2006 2007 2008 2009 2010
Food Others Categories Home & Personal Care
57% 54% 53%45% 43%
34% 37% 38%
34% 37%
10% 9% 9%21% 20%
2006 2007 2008 2009 2010
Food Mix Others Categories Personal & Home Care
Ideal Metro
Cristalino Sao
Bell’s
Edible Oil Pastas
Don Maximo
Anita
Marco Polo GN
Sayón Cogorno
Ariel
Ace
Magia Blanca Sapolio
Ña Pancha
Patito
Invicto
INCA
Santa Rosa
Victoria
Las Mercedes
Cogorno
Don Angelo Anita
Molitalia
Laundry
Detergent
Industrial
Baking Flour
Deleite
100
220
0
100 represents the national average.
Perceptor and IPSOS Apoyo Survey Methodology: 1,500 Households in
Lima + 12.
Brand equity is defined by drivers such as: performance, value equation,
quality, brand leadership, brand recognition, emotional attachment,
health and safety, taste, other variables.
83% 82%
69% 68% 69%
8% 9%
11% 11% 11%
9% 9%21% 20% 20%
2007 2008 2009 2010 2011
Food Mix Other Categories Home & Personal Care

Consumer Product
Goods
Industrial Products and
Animal Nutrition
2011 RevenuesS/. 635MM 417MM 417MM 293MM 614MM 321MM
Weight in Sales 14.9% 9.8% 9.8% 6.9% 14.4% 7.5%
Revenue CAGR 2005-2011 8.1% 8.4% 43.1% 17.8% 8.8% 19.6%
Market CAGR 2005-2010 (1)
12.3% 9.6% 16.7% 9.2% 7.4% N/A
2011 Growth
- Revenues: 13.7% - Volume: 1.8%
(1) Market CAGRs for Edible Oil, Pastas, Laundry Detergents, Cookies and Industrial
Flours consider Peru’s market growth per category. Source: MINAG, PRODUCE, INEI, Euromonitor, SNI
Kantar World Panel, CCR Audit.
13.8% 14.3%
21.3% 20.2%
9.4%
25.4%
-9.7%
5.5%
17.6%15.0%
-4.6%
22.0%
Edible Oil Pastas Laundry Detergent Cookies &Crackers
Industrial Baking Flour Animal Nutrition
MAIN CATEGORIESGROWTH PER CATEGORY (2010-2011)
Sales Growth Volume Growth

PERU & INTERNATIONAL GROWTH
(Millions of Soles) (Millions of Soles)
GROWTH BY BUSINESS LINE
Consumer Product Goods
Industrial Products
Animal Nutrition
2005 67.7% 26.5% 5.8%
2011 62.5% 30.0% 7.5%
Peru
International
2005 91.9% 8.1%
2011 75.4% 24.6%
1,277501 109
1,887
2,670
1,277 321
4,268
Consumer Product Goods
Industrial Products Animal Nutrition Consolidated
2005 2011
CAGR 2005-2011:
13.1%
CAGR 2005-2011:
16.9% CAGR 2005-2011:
19.6%
CAGR 2005-2011:
Revenues: 14.6%
EBITDA: 15.2%
1,277501 109
1,887
2,670
1,277 321
4,268
Consumer Product Goods
Industrial Products Animal Nutrition Consolidated
2005 2011
CAGR 2005-2011:
13.1%
CAGR 2005-2011:
16.9% CAGR 2005-2011:
19.6%
CAGR 2005-2011:
Revenues: 14.6%
EBITDA: 15.2%
1,277501 109
1,887
2,658
1,277 321
4,256
Consumer Product Goods
Industrial Products Animal Nutrition Consolidated
2005 2011
CAGR 2005-2011:
13.0%
CAGR 2005-2011:
16.9% CAGR 2005-2011:
19.6%
CAGR 2005-2011:
14.5%
1,735
152
1,887
3,210
1,046
4,256
Peru International Consolidated
CAGR 2005-2011:
10.8%
CAGR 2005-2011:
37.9%
CAGR 2005-2011:
14.5%

OVERALL RESULTS (Millions of Soles)
OVERALL RESULTS (Millions of Soles)
LAST 5 QUARTERS (Millions of Soles)
11.9%
LAST 5 QUARTERS (Millions of Soles)
Sales Gross Margin
EBITDA EBITDA Margin
878 883
993 998 985
33.9% 32.1% 32.0% 31.9%29.7%
0%
10%
20%
30%
40%
50%
60%
70%
80%
0
1,000
1Q 10 2Q 10 3Q 10 4Q 10 1Q 11
LAST 5Q SALES & GROSS MARGIN
Sales Gross Margin
149136
168 167
136
16.9% 15.4% 17.0% 16.7%13.8%
0.0%
30.0%
60.0%
0
100
200
1Q 10 2Q 10 3Q 10 4Q 10 1Q 11
EBITDA & EBITDA MARGIN
EBITDA EBITDA Margin
CAGR 2010-Last 12M:
6.9%
27.5%
27.3%
CAGR 2010-Last 12M:
0.1%

CAPEX (Million of Soles / as a % of Total Revenues)
2.7%
SG&A/Marketing (as % of Total Revenues)
DEBT & DEBT/EBITDA RATIO (Million of Soles)
2.3% 2.5%
1.4%
0
CURRENT RATIO & LEVERAGE

EARNINGS PER SHARE (Soles)
EARNINGS PER SHARE (Soles)
ROIC & ROE DIVIDENDS PER SHARE & DIVIDEND
YIELD
0.0491
0.1112
0.1287
0.1700
1.7%
7.8%4.7%
2.7%
0.00%
5.00%
10.00%
15.00%
20.00%
25.00%
30.00%
35.00%
40.00%
45.00%
50.00%
0.0000
0.2000
2007 2008 2009 2010
DIVIDENDS PER SHARE &DIVIDEND YIELD
Dividends per Share Dividends Yield
1 ROIC is defined as Operating Profit minus Profit Sharing and Current Income Tax expense
divided by Working Capital plus Net Fixed Assets plus Other Net Operating Assets.
Where:
-Working capital excludes debt, other accounts (without financial costs), and Current Assets
available for sale.
-Net fixed assets exclude non operating fixed assets.
-Other net operating assets include software and brands. 2ROE is defined as the Net Earnings divided by average Last 12-Month Shareholders’ Equity.
CAGR 2007-2011:
40.3%
CAGR 2010-Last 12M:
8.92%

As of May 31, 2012
FINANCIAL METRICS 2008
(As of Dec 31) 2009
(As of Dec 31) 2010
(As of Dec 31) 2011
(As of Dec 31) 2008-2011 Growth %
1H11 1H12 1H11-1H12 Growth %
Stock Price (S/.) 1.43 2.75 6.30 6.00 +320% 5.40 7.00 +29.6%
IGBVL 7,049 14,167 23,375 19,473 176% 18,879 20,207 +7.0%
Market Cap (MM US$) 386 806 1,900 1,885 +389% 1,664 2,220 +33.4%
EBITDA Multiple 5.81 5.12 10.74 10.02 +72.5% 10.05 11.62 +15.6%
Daily average trading volume 166,973 408,255 325,837 340,729 +104.1% 424,565 224,710 -47.1%
P/E Ratio 14.74 10.66 18.92 15.50 +5.2% 16.53 22.20 +34.3%
Romero's Group
45%
AFP's32%
Others13%
Inv. & Mutual Funds10%

VALUATION
Common Shares Outs. (MM) Stock Price (as of Oct. 17th, 2012) Investment Shares Out. (MM) Stock Price (as of Oct. 17th, 2012) Market Capitalization Net Debt (2011) Firm Value
EBITDA (2011) Firm Value / EBITDA
847
$2.81
7 $1.67
$149 MM
$205 MM
$2,391 MM
$2,540 MM
12.41x
EPS (Common) : S/. 0.39 P/E (Common) : 18.59 Dividend Yield : 2.65%
Stock Price (as of Oct. 17th, 2012) January 2009=100:
• ALICORC1:
• ALICORI1:
• IGBVL:
COVERAGE
• BCP
• Inteligo
• HSBC
• Kallpa Securities
• Larrain Vial
• BBVA
•BTGPactual
Peru
Peru
USA
Peru
Chile
Peru
USA
8.30
7.52
8.50
7.65
6.90
7.15
8.20
Firm Country
Source: Bloomberg
Target
Price S/. Date
Aug. 12
May. 12
Mar. 12
Aug. 11
Jun. 12
May. 12
July 12
Recommendation
Buy
Buy
Overweigh
Neutral
Maintain
Neutral
Buy
502
410
286
AVERAGE STOCK PRICE
(S/.)
2009 2011 2012 2010
*As of October 17th

34.6%31.3%
9.8% 12.9%11.3% 11.1%
S/. 64,771
S/. 103,099
0
0
0
0
0
1
1
1
1
1
1
1
1
1
1
2
10,000
30,000
50,000
70,000
90,000
110,000
130,000
150,000
2005 2010
Food at Home Food away from home
Other goods and services Total
652.1
925.7
0
100
200
300
400
500
600
700
800
900
1,000
2005 2010
Alicorp Peru Revenues
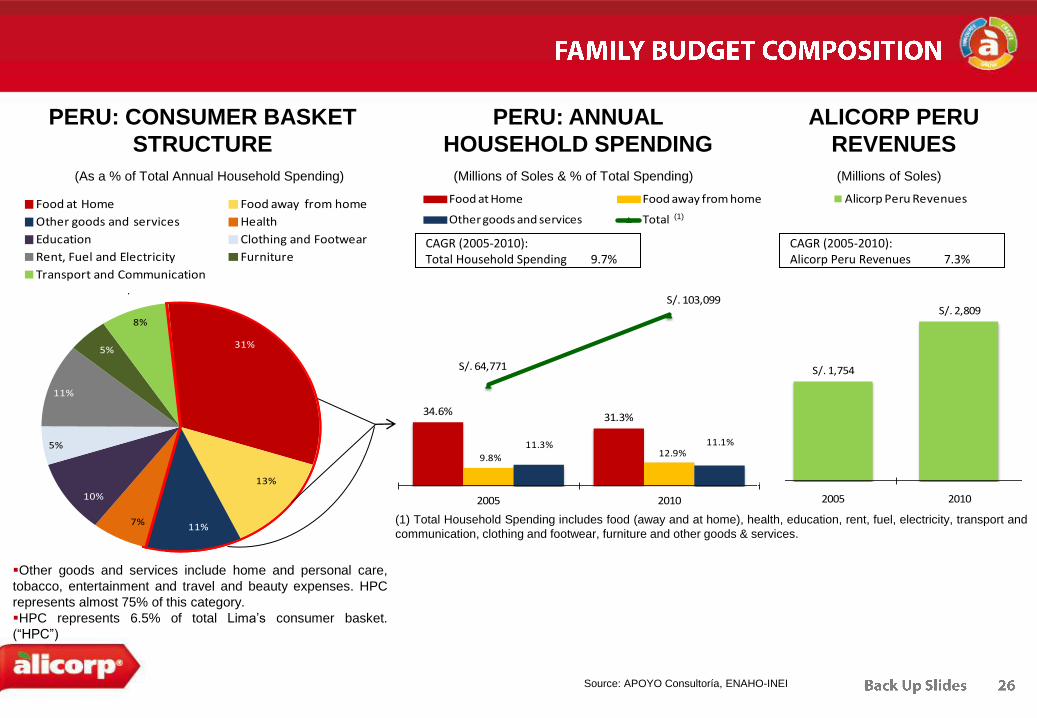
PERU: ANNUAL
HOUSEHOLD SPENDING
(Millions of Soles & % of Total Spending)
PERU: CONSUMER BASKET
STRUCTURE
Other goods and services include home and personal care,
tobacco, entertainment and travel and beauty expenses. HPC
represents almost 75% of this category.
HPC represents 6.5% of total Lima’s consumer basket.
(“HPC”)
(As a % of Total Annual Household Spending)
Source: APOYO Consultoría, ENAHO-INEI
CAGR (2005-2010): Total Household Spending 9.7%
31%
13%
11%7%
10%
5%
11%
5%
8%
Food at Home Food away from home
Other goods and services Health
Education Clothing and Footwear
Rent, Fuel and Electricity Furniture
Transport and Communication
31%
13%
11%7%
10%
5%
11%
5%
8%
Food at Home Food away from home
Other goods and services Health
Education Clothing and Footwear
Rent, Fuel and Electricity Furniture
Transport and Communication
ALICORP PERU
REVENUES
(Millions of Soles)
(1)
34.6%31.3%
9.8% 12.9%11.3% 11.1%
S/. 64,771
S/. 103,099
0
0
0
0
0
1
1
1
1
1
1
1
1
1
1
2
0
20,000
40,000
60,000
80,000
100,000
120,000
2005 2010
Food at Home Food away from home
Other goods and services Total
652.1
925.7
0
100
200
300
400
500
600
700
800
900
1,000
2005 2010
Alicorp Peru Revenues
CAGR (2005-2010): Alicorp Peru Revenues 7.3%
(1) Total Household Spending includes food (away and at home), health, education, rent, fuel, electricity, transport and
communication, clothing and footwear, furniture and other goods & services.
S/. 1,754
S/. 2,809
0
500
1,000
1,500
2,000
2,500
3,000
2005 2010
Alicorp Peru Revenues
S/. 1,754
S/. 2,809
0
500
1,000
1,500
2,000
2,500
3,000
2005 2010
Alicorp Peru Revenues

Industrial Flour Edible Oil Pastas Laundry Detergent Cookies & Crackers
2005 2010 2005 2010 2005 2010 2005 2010 2005 2010
Participation (% of Total Volume)
28% 37% 64% 62% 46% 46% 14% 53% 27% 41%
Market Share 60% 55% 48% 53% 45% 45% 25% 41% 22% 33%
ALICORP PERU vs MARKET
(Main Categories) (Thousands to MTs)
CAGR (2005-2010) Alicorp Peru (Volume) Market (Volume)
119 148113 125
17 36 1050
285
406
6790 165
199
56 71 67117
749
685
1 2 3 4 5 6 7 8 9 10 11 12 13 14
Alicorp Peru Other players
Edible Oil Pastas Cookies & Crackers Laundry Detergent Flour
2005 2010 2005 2010 2005 2010 2005 2010 2005 2010
119 148 113 125 17 36 10 50
285406
6790 165
199
56 71 67 117
749
685
1 2 3 4 5 6 7 8 9 10 11 12 13 14
Alicorp Peru Other players
Edible Oil Pastas Cookies & Crackers Laundry Detergent Flour
2005 2010 2005 2010 2005 2010 2005 2010 2005 20102005 2010
Industrial Flour
7.3% 1.1%
4.5% 5.1%
119 148 113 125 17 36 10 50
285406
6790 165
199
56 71 67 117
749
685
1 2 3 4 5 6 7 8 9 10 11 12 13 14
Alicorp Peru Other players
Edible Oil Pastas Cookies & Crackers Laundry Detergent Flour
2005 2010 2005 2010 2005 2010 2005 2010 2005 20102005 2010
Edible Oil
119 148 113 125 17 36 10 50
285406
6790 165
199
56 71 67 117
749
685
1 2 3 4 5 6 7 8 9 10 11 12 13 14
Alicorp Peru Other players
Edible Oil Pastas Cookies & Crackers Laundry Detergent Flour
2005 2010 2005 2010 2005 2010 2005 2010 2005 20102005 2010
Pastas
2.1% 3.1%
119 148 113 125 17 36 10 50
285406
6790 165
199
56 71 67 117
749
685
1 2 3 4 5 6 7 8 9 10 11 12 13 14
Alicorp Peru Other players
Edible Oil Pastas Cookies & Crackers Laundry Detergent Flour
2005 2010 2005 2010 2005 2010 2005 2010 2005 20102005 2010
Laundry Detergent
36.6% 16.7%
119 148 113 125 17 36 10 50
285406
6790 165
199
56 71 67 117
749
685
1 2 3 4 5 6 7 8 9 10 11 12 13 14
Alicorp Peru Other players
Edible Oil Pastas Cookies & Crackers Laundry Detergent Flour
2005 2010 2005 2010 2005 2010 2005 2010 2005 20102005 2010
Cookies & Crackers
16.8% 7.9%
Mature Categories Growth Categories
1 2 2 2 1
1. Industrial Flour and Cookies & Crackers shares were estimated from imports (Source: Produce)
2. Edible Oil, Pastas and Laundry Detergent ere estimated from polls (Source: Kantar).
Poll Methodology: 3,000 homes from Lima and 13 provinces. Deviation +/- 1.6%
Source: MINAG, PRODUCE, INEI, Euromonitor, SNI
Kantar World Panel, CCR Audit.

1,034
1,180
317 332
PRECIO AC SOYA CIF PERU (PRECIO ARGENTINA + FLETE)
Soybean CFR Wheat CFR
COMMODITY EXPOSURE
Source: Reuters
(US$ x MT)
(YoY: T10 vs. T11)
2009 2010 2011 2012
Soya CFR Trigo CFR
70.7% YoY 49.5% YoY 4.8% YoY -6.4% YoY
50.3% YoY 58.0% YoY 14.1% YoY -8.6% YoY
Gross Margin:1Q11: 28.1%
GM 2Q1127.3%
GM 3Q11:27.8%
GM 4Q11: 27.1%
-12.9% YoY
-2.0% YoY
GM 1Q12: 26.8%
GM 2Q12: 27.5%
-3.9% YoY
8.6% YoY

-2.2% YoY -2.7% YoY -0.5% YoY
-3.79% YoY -4.75% YoY -2.87% YoY
2.80 2.80
2.75 2.77
2.70 2.67 2.67
Fuente: SBS
J F M A M J J A S O N D J F M A M J
26% 35% 18% 187% 38% 54% 38% 42% 43% 31% 16% 18% 0 % 0% 0% 0% -24% 20%
2011 2012
% hedging
(In MM of US$ & S/. / US$)
2011: FOREIGN EXCHANGE HEDGING STRATEGY AND EXCHANGE RATE
PERFORMANCE
58
43
84
-8
55
70
8088 87
80 79
102
15 15 15 1521
3830
37 38
25
1318
J F M A M J J A S O N D
USD Exposure Total Hedging
Average Exchange Rate
Average Exchange Rate