مواقع اعضاء هيئة التدريس | KSU Faculty€¦ · Applied Mechanical Engineering...
25
Basics of Engineering Basics of Engineering Basics of Engineering Basics of Engineering Measurements Measurements Measurements Measurements (AGE (AGE (AGE (AGE 2340 2340 2340 2340) ) ) ) Dr. Nasser Mohamed Shelil Dr. Nasser Mohamed Shelil Dr. Nasser Mohamed Shelil Dr. Nasser Mohamed Shelil B.Sc. & M.Sc. , Suez Canal University; PhD, Cardiff University/UK Assistant Professor, Mechanical Engineering Dept., College of Applied Engineering, King Saud University Applied Mechanical Engineering Program Basics of Engineering Measurements Basics of Engineering Measurements Basics of Engineering Measurements Basics of Engineering Measurements Chapter 2 Uncertainty Uncertainty Uncertainty Uncertainty Chapter 2: Calibration & Uncertainty Analysis 2
Transcript of مواقع اعضاء هيئة التدريس | KSU Faculty€¦ · Applied Mechanical Engineering...

Basics of Engineering Basics of Engineering Basics of Engineering Basics of Engineering
MeasurementsMeasurementsMeasurementsMeasurements
(AGE (AGE (AGE (AGE 2340234023402340) ) ) )
Dr. Nasser Mohamed ShelilDr. Nasser Mohamed ShelilDr. Nasser Mohamed ShelilDr. Nasser Mohamed Shelil
B.Sc. & M.Sc. , Suez Canal University; PhD, Cardiff University/UK
Assistant Professor, Mechanical Engineering Dept., College of Applied Engineering, King Saud University
Applied Mechanical Engineering Program
Basics of Engineering MeasurementsBasics of Engineering MeasurementsBasics of Engineering MeasurementsBasics of Engineering Measurements
Chapter 2
Uncertainty Uncertainty Uncertainty Uncertainty
Chapter 2:
Calibration & Uncertainty Analysis
2
Applied Mechanical Engineering Program
Basics of Engineering MeasurementsBasics of Engineering MeasurementsBasics of Engineering MeasurementsBasics of Engineering Measurements
Chapter 2
Uncertainty Uncertainty Uncertainty Uncertainty
Basic Terminology of Measurement
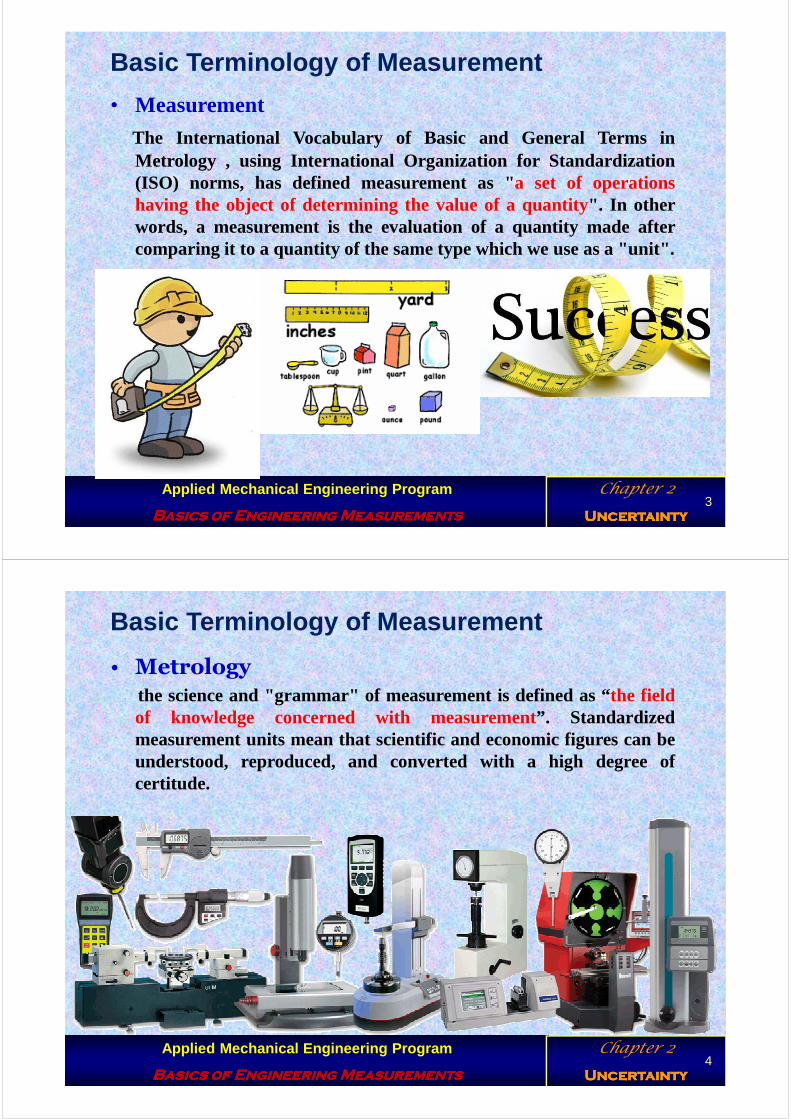
• MeasurementThe International Vocabulary of Basic and General Terms inMetrology , using International Organization for Standard ization(ISO) norms, has defined measurement as "a set of operationshaving the object of determining the value of a quantity". In otherwords, a measurement is the evaluation of a quantity made aftercomparing it to a quantity of the same type which we use as a "unit".
3
Applied Mechanical Engineering Program
Basics of Engineering MeasurementsBasics of Engineering MeasurementsBasics of Engineering MeasurementsBasics of Engineering Measurements
Chapter 2
Uncertainty Uncertainty Uncertainty Uncertainty
Basic Terminology of Measurement
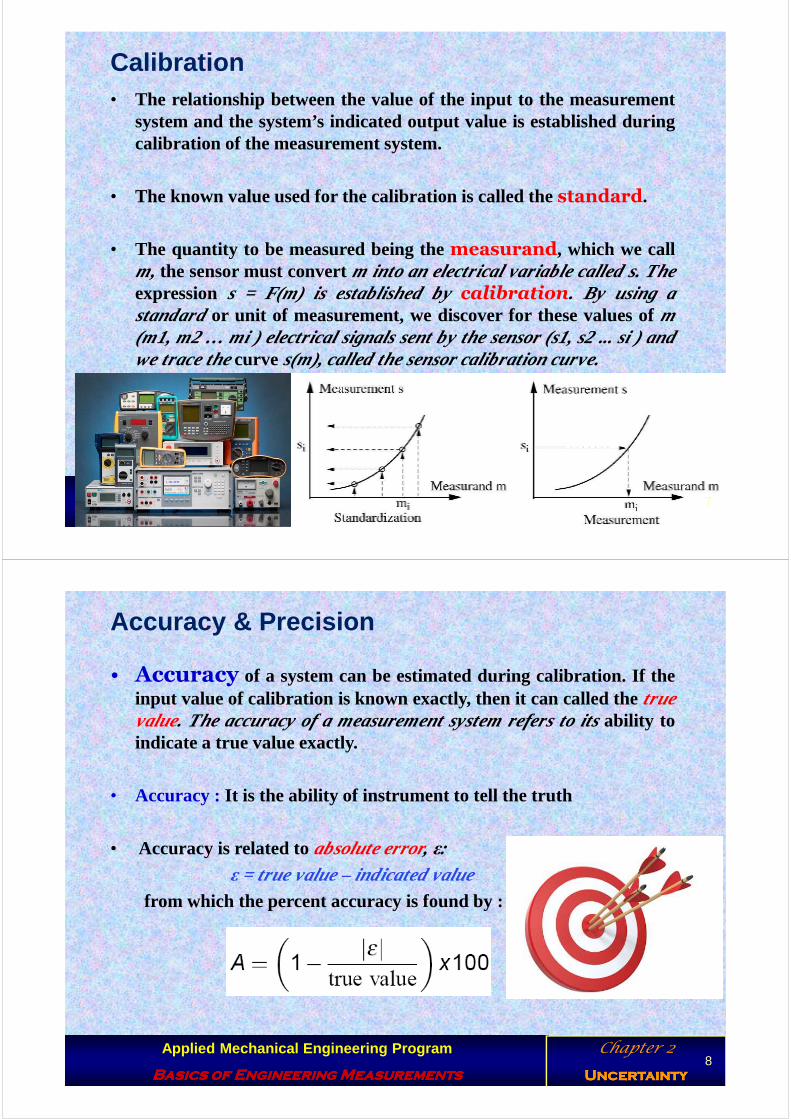
• Metrology
the science and "grammar" of measurement is defined as “the fieldof knowledge concerned with measurement”. Standardizedmeasurement units mean that scientific and economic figures can beunderstood, reproduced, and converted with a high degree ofcertitude.
4

Applied Mechanical Engineering Program
Basics of Engineering MeasurementsBasics of Engineering MeasurementsBasics of Engineering MeasurementsBasics of Engineering Measurements
Chapter 2
Uncertainty Uncertainty Uncertainty Uncertainty
• Instrumentation
refers to a group of permanent systems which help us measureobjects. In this sense, instruments and systems of measurementconstitute the "tools" of measurement and metrology.
Basic Terminology of Measurement
5
Applied Mechanical Engineering Program
Basics of Engineering MeasurementsBasics of Engineering MeasurementsBasics of Engineering MeasurementsBasics of Engineering Measurements
Chapter 2
Uncertainty Uncertainty Uncertainty Uncertainty
• Load Effects
� measurement operations may require connection or without contact.� This linking of an instrument to an object or site of investigation
means that atransfer of energy and/or information termed " a loadeffect" takes place.
� An example of this is shown by the insertion of a measuring probeinto a cup of tea which takes some heat from the tea, leading toadifference between the "true“ value and the value to be measured.
Basic Terminology of Measurement
6
Applied Mechanical Engineering Program
Basics of Engineering MeasurementsBasics of Engineering MeasurementsBasics of Engineering MeasurementsBasics of Engineering Measurements
Chapter 2
Uncertainty Uncertainty Uncertainty Uncertainty
• The relationship between the value of the input to the measurementsystem and the system’s indicated output value is established duringcalibration of the measurement system.
• The known value used for the calibration is called the standard.
• The quantity to be measured being themeasurand, which we callm, the sensor must convertm into an electrical variable called s. Theexpression s = F(m) is established bycalibration. By using astandardor unit of measurement, we discover for these values ofm(m1, m2 … mi ) electrical signals sent by the sensor (s1, s2 ...si ) andwe trace thecurve s(m), called the sensor calibration curve.
Calibration
7
Applied Mechanical Engineering Program
Basics of Engineering MeasurementsBasics of Engineering MeasurementsBasics of Engineering MeasurementsBasics of Engineering Measurements
Chapter 2
Uncertainty Uncertainty Uncertainty Uncertainty
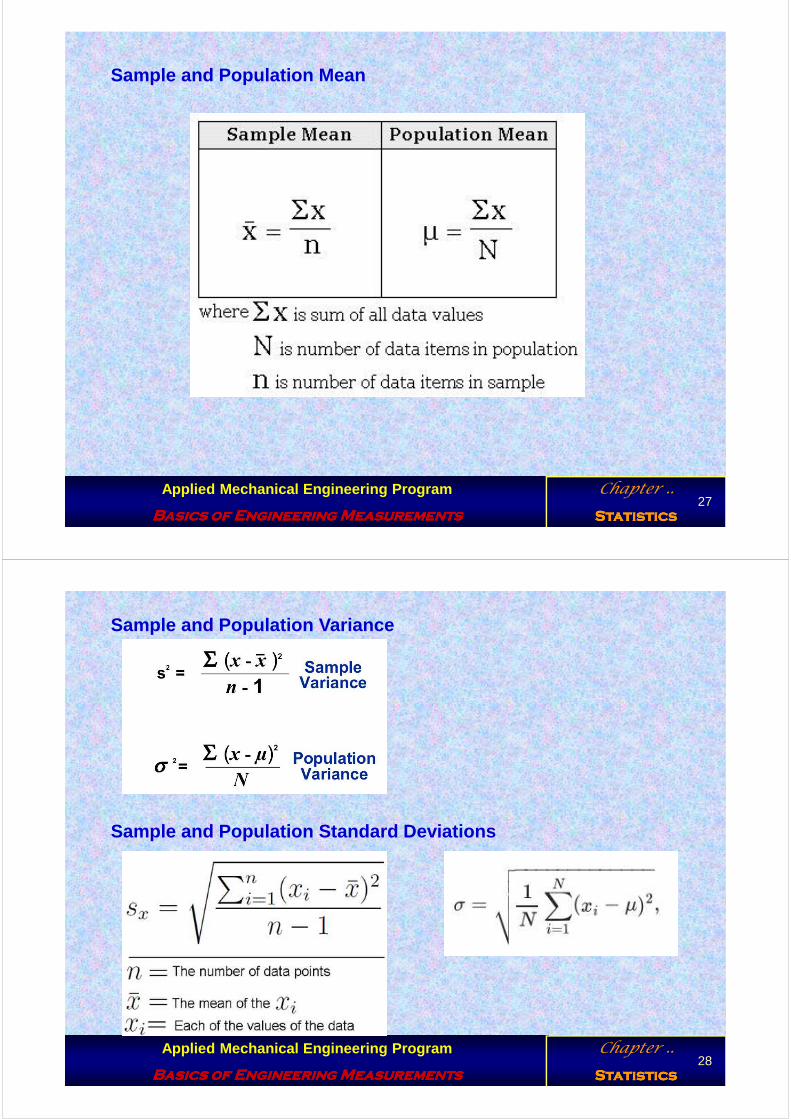
Accuracy & Precision
• Accuracy of a system can be estimated during calibration. If theinput value of calibration is known exactly, then it can called thetruevalue. The accuracy of a measurement system refers to itsability toindicate a true value exactly.
• Accuracy : It is the ability of instrument to tell the truth
• Accuracy is related toabsolute error, ε:ε = true value – indicated value
from which the percent accuracy is found by :
8
Applied Mechanical Engineering Program
Basics of Engineering MeasurementsBasics of Engineering MeasurementsBasics of Engineering MeasurementsBasics of Engineering Measurements
Chapter 2
Uncertainty Uncertainty Uncertainty Uncertainty
Accuracy & Precision
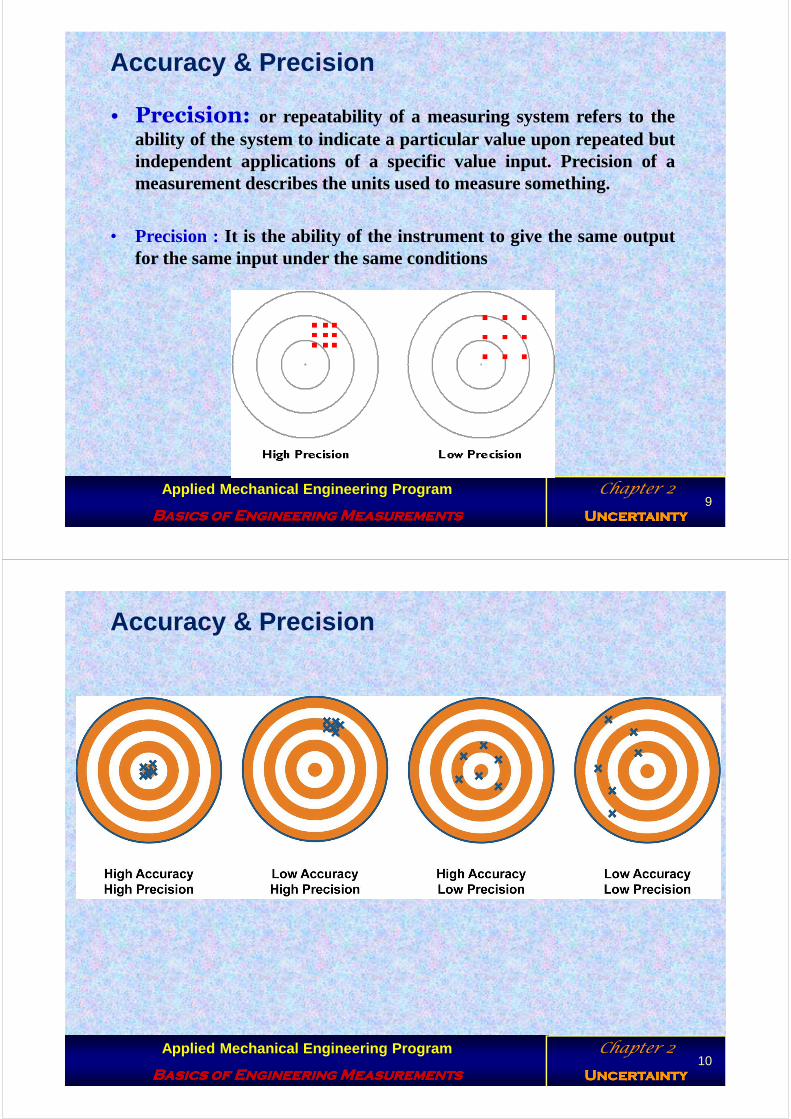
• Precision: or repeatability of a measuring system refers to theability of the system to indicate a particular value upon repeated butindependent applications of a specific value input. Precision of ameasurement describes the units used to measure something.
• Precision : It is the ability of the instrument to give the same outputfor the same input under the same conditions
9
Applied Mechanical Engineering Program
Basics of Engineering MeasurementsBasics of Engineering MeasurementsBasics of Engineering MeasurementsBasics of Engineering Measurements
Chapter 2
Uncertainty Uncertainty Uncertainty Uncertainty
Accuracy & Precision
10

Applied Mechanical Engineering Program
Basics of Engineering MeasurementsBasics of Engineering MeasurementsBasics of Engineering MeasurementsBasics of Engineering Measurements
Chapter 2
Uncertainty Uncertainty Uncertainty Uncertainty
Precision Example: How long is the pencil?
• It is impossible to make a perfectly precise measurement.• Accuracy can be improved up to but not beyond the precision ofthe
instrument by calibration.
11
Applied Mechanical Engineering Program
Basics of Engineering MeasurementsBasics of Engineering MeasurementsBasics of Engineering MeasurementsBasics of Engineering Measurements
Chapter 2
Uncertainty Uncertainty Uncertainty Uncertainty
Term Used in Instrument Rating
• Resolution: The smallest increment of change in the measuredvalue that can be determined from the instrument’s readout scale.The resolution is often on the same order as the precision; sometimesit is smaller.
• Sensitivity: The change of an instrument’s output per unitchange in the measured quantity. Typically, an instrument withhigher sensitivity will have also finer resolution, betterprecision, andhigher accuracy.
• Range: The proper procedure for calibration is to apply knowninputs ranging from the minimum to the maximum values for whichthe measurement system is to be used. These limits the operatingrange of the system.
12

Applied Mechanical Engineering Program
Basics of Engineering MeasurementsBasics of Engineering MeasurementsBasics of Engineering MeasurementsBasics of Engineering Measurements
Chapter 2
Uncertainty Uncertainty Uncertainty Uncertainty
Error Classifications
� 1. Systematic, Fixed or Bias Errors:
– Insidious in nature, exist unnoticed unless deliberately searched.
– Repeated readings to be in error by the same amount.
– Not susceptible to statistical analysis.
• Calibration errors
• Certain consistently recurring human error
• Technique error
• Uncorrected loading error
• Limitations of system resolution
13
Applied Mechanical Engineering Program
Basics of Engineering MeasurementsBasics of Engineering MeasurementsBasics of Engineering MeasurementsBasics of Engineering Measurements
Chapter 2
Uncertainty Uncertainty Uncertainty Uncertainty
Error Classifications
� 2. Precision or Random Errors:
– Distinguished by their lack of consistency. Usually (not always) follow a certain statistical distribution.
– In many instances very difficult to distinguish from bias errors.
• Error stemming from environmental variations
• Certain type of human error
• Error resulting from variations in definition.
14

Applied Mechanical Engineering Program
Basics of Engineering MeasurementsBasics of Engineering MeasurementsBasics of Engineering MeasurementsBasics of Engineering Measurements
Chapter 2
Uncertainty Uncertainty Uncertainty Uncertainty
� 3. Illegitimate Errors
Illegitimate Errors are simply mistakes on the part of experimenter.
– Can be eliminated through the exercise of care and repetition ofthe measurement.
• Blunders and mistakes
• Computational errors
• Chaotic errors.
Error Classifications
15
Applied Mechanical Engineering Program
Basics of Engineering MeasurementsBasics of Engineering MeasurementsBasics of Engineering MeasurementsBasics of Engineering Measurements
Chapter 2
Uncertainty Uncertainty Uncertainty Uncertainty 16

Applied Mechanical Engineering Program
Basics of Engineering MeasurementsBasics of Engineering MeasurementsBasics of Engineering MeasurementsBasics of Engineering Measurements
Chapter 2
Uncertainty Uncertainty Uncertainty Uncertainty
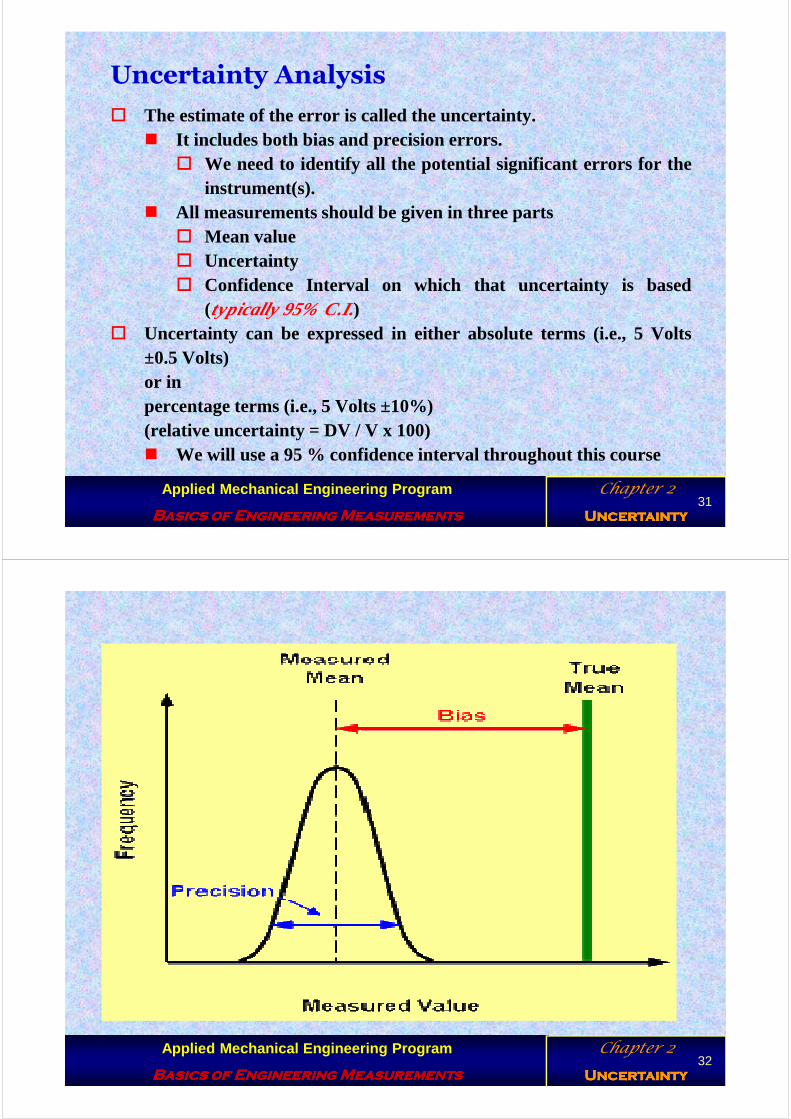
Bias & Precision Errors
• Bias (Systematic) Error
� is the difference between the average value in a series of repeatedcalibration measurements and the true value.
� Systematic error causes an offset between the mean value of the data set and its true value
� systematic error = average value - true value
• Precision Error ( Random error )
� is a measure of the random variation found during repeatedmeasurements.
� random error = reading - average of readings
� Random error causes a random variation in measured values found during repeated measurements of a variable
� Both random and systematic errors affect a system’s accuracy.
17
Applied Mechanical Engineering Program
Basics of Engineering MeasurementsBasics of Engineering MeasurementsBasics of Engineering MeasurementsBasics of Engineering Measurements
Chapter 2
Uncertainty Uncertainty Uncertainty Uncertainty 18

Applied Mechanical Engineering Program
Basics of Engineering MeasurementsBasics of Engineering MeasurementsBasics of Engineering MeasurementsBasics of Engineering Measurements
Chapter 2
Uncertainty Uncertainty Uncertainty Uncertainty
Effects of precision and bias errors on calibration readings
Bias & Precision Errors
19
Applied Mechanical Engineering Program
Basics of Engineering MeasurementsBasics of Engineering MeasurementsBasics of Engineering MeasurementsBasics of Engineering Measurements
Chapter 2
Uncertainty Uncertainty Uncertainty Uncertainty 20

Applied Mechanical Engineering Program
Basics of Engineering MeasurementsBasics of Engineering MeasurementsBasics of Engineering MeasurementsBasics of Engineering Measurements
Chapter 2
Uncertainty Uncertainty Uncertainty Uncertainty 21
Applied Mechanical Engineering Program
Basics of Engineering MeasurementsBasics of Engineering MeasurementsBasics of Engineering MeasurementsBasics of Engineering Measurements
Chapter 2
Uncertainty Uncertainty Uncertainty Uncertainty
Uncertainty
� The uncertainty is a numerical estimate of the possible range of the error in a measurement.
� In any measurement, the error is not known exactly since the true value is rarely known exactly.
� that the error is within certain bounds, a plus or minus range of the indicated reading
22

Applied Mechanical Engineering Program
Basics of Engineering MeasurementsBasics of Engineering MeasurementsBasics of Engineering MeasurementsBasics of Engineering Measurements
Chapter 2
Uncertainty Uncertainty Uncertainty Uncertainty
Simplified Error Estimation
23
Applied Mechanical Engineering Program
Basics of Engineering MeasurementsBasics of Engineering MeasurementsBasics of Engineering MeasurementsBasics of Engineering Measurements
Chapter ..
Statistics Statistics Statistics Statistics
Statistics
Population & Sample
24

Applied Mechanical Engineering Program
Basics of Engineering MeasurementsBasics of Engineering MeasurementsBasics of Engineering MeasurementsBasics of Engineering Measurements
Chapter ..
Statistics Statistics Statistics Statistics
ΣΣΣΣ denotes the addition of a set of values
x is the variable usually used to represent the individual data values
n represents the number of data values in a sample
N represents the number of data values in a population
Notation
25
Applied Mechanical Engineering Program
Basics of Engineering MeasurementsBasics of Engineering MeasurementsBasics of Engineering MeasurementsBasics of Engineering Measurements
Chapter ..
Statistics Statistics Statistics Statistics
Mean (Average): the number obtained by adding the values and dividing the total by the number of values.
Median: the middle value when the original data values are arranged in order of increasing (or decreasing) magnitude.
Variance: It is the expectation of the squared deviation of a random variable from its mean
Standard Deviation: a measure of variation of the scores about the mean (average deviation from the mean)
Definitions
26
Applied Mechanical Engineering Program
Basics of Engineering MeasurementsBasics of Engineering MeasurementsBasics of Engineering MeasurementsBasics of Engineering Measurements
Chapter ..
Statistics Statistics Statistics Statistics
Sample and Population Mean
27
Applied Mechanical Engineering Program
Basics of Engineering MeasurementsBasics of Engineering MeasurementsBasics of Engineering MeasurementsBasics of Engineering Measurements
Chapter ..
Statistics Statistics Statistics Statistics
Sample and Population Variance
Sample and Population Standard Deviations
28

Applied Mechanical Engineering Program
Basics of Engineering MeasurementsBasics of Engineering MeasurementsBasics of Engineering MeasurementsBasics of Engineering Measurements
Chapter ..
Statistics Statistics Statistics Statistics
The normal distribution is a continuous probability distribution that has a bell-shaped probability density function, known as the Gaussian function, or informally, the bell curve.
Normal Distribution
29
Applied Mechanical Engineering Program
Basics of Engineering MeasurementsBasics of Engineering MeasurementsBasics of Engineering MeasurementsBasics of Engineering Measurements
Chapter ..
Statistics Statistics Statistics Statistics 30
Applied Mechanical Engineering Program
Basics of Engineering MeasurementsBasics of Engineering MeasurementsBasics of Engineering MeasurementsBasics of Engineering Measurements
Chapter 2
Uncertainty Uncertainty Uncertainty Uncertainty
� The estimate of the error is called the uncertainty.� It includes both bias and precision errors.
� We need to identify all the potential significant errors for theinstrument(s).
� All measurements should be given in three parts� Mean value� Uncertainty� Confidence Interval on which that uncertainty is based
(typically 95% C.I.)� Uncertainty can be expressed in either absolute terms (i.e., 5 Volts
±0.5 Volts)or inpercentage terms (i.e., 5 Volts ±10%)(relative uncertainty = DV / V x 100)� We will use a 95 % confidence interval throughout this course
Uncertainty Analysis
31
Applied Mechanical Engineering Program
Basics of Engineering MeasurementsBasics of Engineering MeasurementsBasics of Engineering MeasurementsBasics of Engineering Measurements
Chapter 2
Uncertainty Uncertainty Uncertainty Uncertainty 32

Applied Mechanical Engineering Program
Basics of Engineering MeasurementsBasics of Engineering MeasurementsBasics of Engineering MeasurementsBasics of Engineering Measurements
Chapter 2
Uncertainty Uncertainty Uncertainty Uncertainty
Calculation of bias Uncertainty
� Manufacturers’ Specifications
� If you can’t do better, you may take it from the manufacturer’s specs.
� Accuracy - %FS, %reading, offset, or some combination (e.g., 0.1% reading + 0.15 counts)
� Unless you can identify otherwise, assume that these are at a 95% confidence interval
� Independent Calibration
� May be deduced from the calibration process
33
Applied Mechanical Engineering Program
Basics of Engineering MeasurementsBasics of Engineering MeasurementsBasics of Engineering MeasurementsBasics of Engineering Measurements
Chapter 2
Uncertainty Uncertainty Uncertainty Uncertainty
Calculation of precision Uncertainty
� Use Statistics to Estimate Random Uncertainty� Mean: the sum of measurement values divided by the number of
measurements.
� Deviation: the difference between a single result and the mean ofmany results.
� Standard Deviation: the smaller standard deviation is the moreprecise data� Large sample size
� Small sample size (n<30)Slightly larger value
x =1
Nxi
i =1
N
∑
xxd ii −=
σ =1
nxi − x ( )2∑
1
2
σs =1
n−1xi − x ( )∑
2
1
2
34

Applied Mechanical Engineering Program
Basics of Engineering MeasurementsBasics of Engineering MeasurementsBasics of Engineering MeasurementsBasics of Engineering Measurements
Chapter 2
Uncertainty Uncertainty Uncertainty Uncertainty
The precision uncertainty has to be calculated by estimating mean of thesample reading and standard deviation of the sample.Let xm be the mean and Sx be the standard deviation of the sample forwhich n repetitions were made.
Then the precision uncertainty will be given by : Up = ± � �
�,�
�
Each of the individual measurement variables (X1, X2,…,XK) is subject to Several precision errors.
The bias limits for each of these elemental sources are combined in some manner to obtain the overall bias limit (UP1, UP2,…, UPK) for each variable.
Calculation of precision Uncertainty
35
Applied Mechanical Engineering Program
Basics of Engineering MeasurementsBasics of Engineering MeasurementsBasics of Engineering MeasurementsBasics of Engineering Measurements
Chapter 2
Uncertainty Uncertainty Uncertainty Uncertainty
Calculation of precision Uncertainty
n
s1-n /2,αtX ±
How to calculate : Up = ± � ��
,�
�
By using T – distribution:
n = number of samplesνννν = n – 1 = degree of freedomα = 1 – c , c: is the confidence
sx = σs =1
n−1xi − x ( )∑
2
1
2
36

Applied Mechanical Engineering Program
Basics of Engineering MeasurementsBasics of Engineering MeasurementsBasics of Engineering MeasurementsBasics of Engineering Measurements
Chapter 2
Uncertainty Uncertainty Uncertainty Uncertainty
Distribution of errors on repeated measurements.
37
Applied Mechanical Engineering Program
Basics of Engineering MeasurementsBasics of Engineering MeasurementsBasics of Engineering MeasurementsBasics of Engineering Measurements
Chapter 2
Uncertainty Uncertainty Uncertainty Uncertainty
Student t-distribution (small sample sizes)
� The t-distribution was formulated by W.S. Gosset, a scientist in theGuinness brewery in Ireland, who published his formulation in1908 under the pen name (pseudonym) “Student.”
� The t-distribution looks very much like the Gaussian distribution,bell shaped, symmetric and centered about the mean. The primarydifference is that it has stronger tails, indicating a lowerprobabilityof being within an interval. The variability depends on the samplesize, n.
� With a confidence interval of c%
� Where αααα=1-c and νννν=n-1 (Degrees of Freedom)
Don’t apply blindly - you may have better information about thepopulation than you think.
ntxX
ntx ss σσ
νανα ,2/,2/ +<<−
38
Applied Mechanical Engineering Program
Basics of Engineering MeasurementsBasics of Engineering MeasurementsBasics of Engineering MeasurementsBasics of Engineering Measurements
Chapter 2
Uncertainty Uncertainty Uncertainty Uncertainty 39
Applied Mechanical Engineering Program
Basics of Engineering MeasurementsBasics of Engineering MeasurementsBasics of Engineering MeasurementsBasics of Engineering Measurements
Chapter 2
Uncertainty Uncertainty Uncertainty Uncertainty
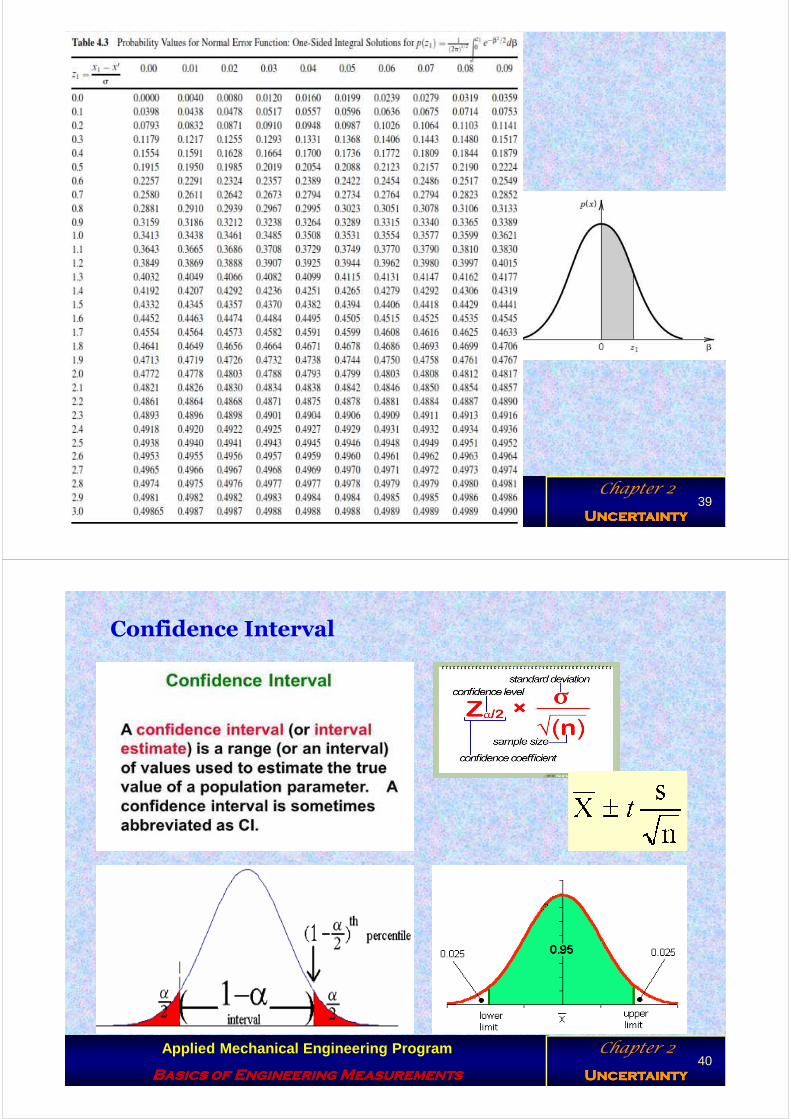
Confidence Interval
40

Applied Mechanical Engineering Program
Basics of Engineering MeasurementsBasics of Engineering MeasurementsBasics of Engineering MeasurementsBasics of Engineering Measurements
Chapter 2
Uncertainty Uncertainty Uncertainty Uncertainty
Use Z-distributionIf the population standard
deviation is known or the sample is greater than 30.
Use t-distributionIf the population standard
deviation is unknown and the sample is less than 30 and normally distributed.
41
Applied Mechanical Engineering Program
Basics of Engineering MeasurementsBasics of Engineering MeasurementsBasics of Engineering MeasurementsBasics of Engineering Measurements
Chapter 2
Uncertainty Uncertainty Uncertainty Uncertainty 42

Applied Mechanical Engineering Program
Basics of Engineering MeasurementsBasics of Engineering MeasurementsBasics of Engineering MeasurementsBasics of Engineering Measurements
Chapter 2
Uncertainty Uncertainty Uncertainty Uncertainty
Student t-distribution
� Example: t-distribution� Sample data
� n = 21� Degrees of Freedom = n-1 = 20
� Desire 95% Confidence Interval
� αααα = 1 - c = 0.05� αααα/2 = 0.025
� Student t-distribution chart� t=2.086
Reading Number Volts, mv
1 5.30
2 5.73
3 6.77
4 5.26
5 4.33
6 5.45
7 6.09
8 5.64
9 5.81
10 5.75
11 5.42
12 5.31
13 5.86
14 5.70
15 4.91
16 6.02
17 6.25
18 4.99
19 5.61
20 5.81
21 5.60
Mean 5.60
Standard dev. 0.51
Variance 0.2643
Applied Mechanical Engineering Program
Basics of Engineering MeasurementsBasics of Engineering MeasurementsBasics of Engineering MeasurementsBasics of Engineering Measurements
Chapter 2
Uncertainty Uncertainty Uncertainty Uncertainty 44

Applied Mechanical Engineering Program
Basics of Engineering MeasurementsBasics of Engineering MeasurementsBasics of Engineering MeasurementsBasics of Engineering Measurements
Chapter 2
Uncertainty Uncertainty Uncertainty Uncertainty
Propagation of Uncertainty
• Uncertainty is based on a careful specification of theuncertainties in the various primary experimentalmeasurements.
• If result R = R(x1,x2, ···,xn) is a given function ofindependentvariablesx1,x2, ···,xn; and w1,w2, ···,wn are theassociateduncertainties, then uncertainty of the resultwR isgiven by:
45
Applied Mechanical Engineering Program
Basics of Engineering MeasurementsBasics of Engineering MeasurementsBasics of Engineering MeasurementsBasics of Engineering Measurements
Chapter 2
Uncertainty Uncertainty Uncertainty Uncertainty
The bias uncertainty UB is given by manufacturer. Usually a formula for the calculation is given in the catalogue.
Each of the individual measurement variables (X1, X2,…,XK) is subject to Several bias and precision errors.
The bias error :UB= (UB1, UB2,…, UBk )
The precision error :
UP= (UP1, UP2,…, UPk )
Propagation of Uncertainty
46

Applied Mechanical Engineering Program
Basics of Engineering MeasurementsBasics of Engineering MeasurementsBasics of Engineering MeasurementsBasics of Engineering Measurements
Chapter 2
Uncertainty Uncertainty Uncertainty Uncertainty
Calculation of bias Uncertainty
1- For measurement variable X this is given by:
UB= (UB12+ UB2
2+…+ UBk2 )1/2
2- The next step in the procedure is to apply uncertainty analysis to determine how the bias limits UB= (UB1, UB2,…, UBk ) for the individual variables propagate through the data reduction equation to form the bias limit U B for the experimental result. The data reduction equation is taken to be of the form :
R=R(X1, X2,…,XK)The bias Uncertainty is :
47
Applied Mechanical Engineering Program
Basics of Engineering MeasurementsBasics of Engineering MeasurementsBasics of Engineering MeasurementsBasics of Engineering Measurements
Chapter 2
Uncertainty Uncertainty Uncertainty Uncertainty
1- For measurement variable X, Then, the overall precision limit UP is given by the
UP= (UP12+ UP2
2+…+ UPk2 )1/2
2- The next step in the procedure is to apply uncertainty analysis to determine how the bias limits UP= (UP1, UP2,…, UPk ) for the individual variables propagate through the data reduction equation. The data reduction equation is taken to be of the form :
R=R(X1, X2,…,XK)
the 95% precision limit for the experimental result UP is found from the uncertainty analysis expression
Calculation of precision Uncertainty
48
Applied Mechanical Engineering Program
Basics of Engineering MeasurementsBasics of Engineering MeasurementsBasics of Engineering MeasurementsBasics of Engineering Measurements
Chapter 2
Uncertainty Uncertainty Uncertainty Uncertainty
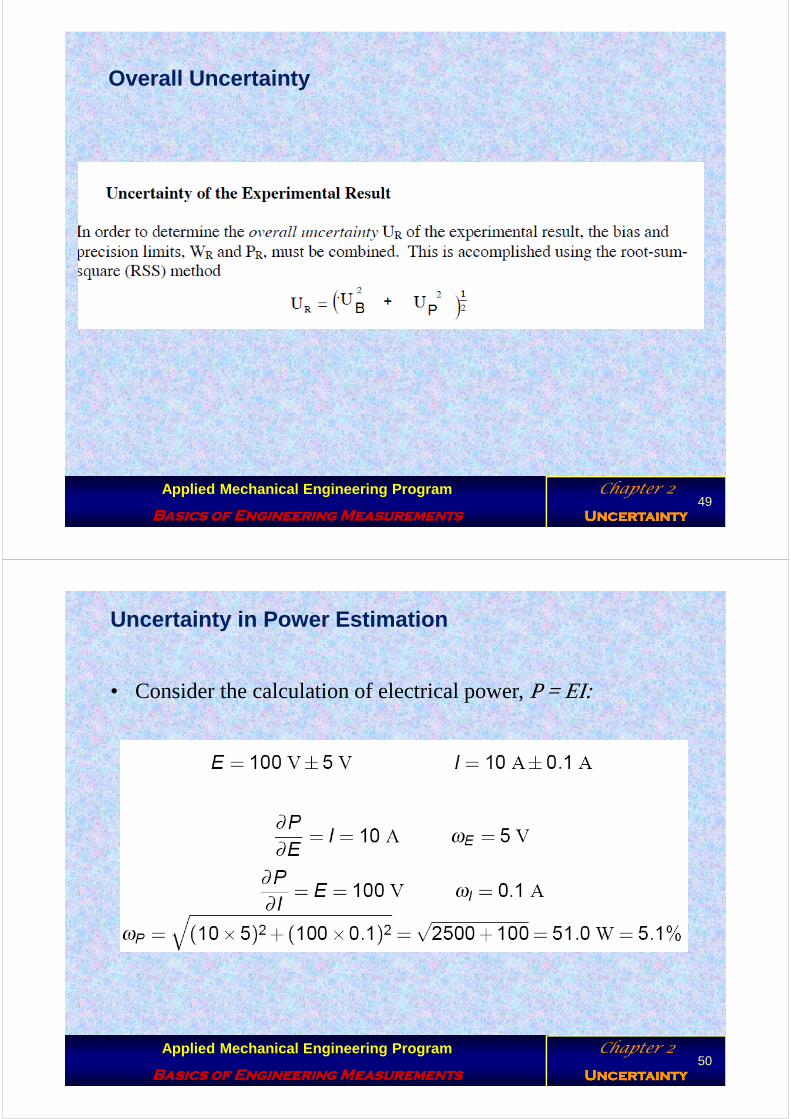
Overall Uncertainty
49
Applied Mechanical Engineering Program
Basics of Engineering MeasurementsBasics of Engineering MeasurementsBasics of Engineering MeasurementsBasics of Engineering Measurements
Chapter 2
Uncertainty Uncertainty Uncertainty Uncertainty
Uncertainty in Power Estimation
• Consider the calculation of electrical power,P = EI:
50


![[PPT]Slide 1 - مواقع اعضاء هيئة التدريس | KSU Facultyfac.ksu.edu.sa/sites/default/files/Schiffman_CB10_PPT_04.ppt · Web viewCHAPTER FOUR Consumer Motivation](https://static.fdocuments.us/doc/165x107/5aa53f8b7f8b9a1d728cdc87/pptslide-1-ksu-viewchapter-four.jpg)