istina.msu.ru · J. Costamagna, F. M. Rabagliati, B. L. Rivas Macromolecular Complexes Vol. 304 J....
133
Transcript of istina.msu.ru · J. Costamagna, F. M. Rabagliati, B. L. Rivas Macromolecular Complexes Vol. 304 J....
Macromolecular Symposia | 316
Molecular Mobility and Order inPolymer Systems
Selected Contributions from:The 7th International Symposiumon Molecular Mobility and Order inPolymer SystemsSt. Petersburg, RussiaJune 6 – 10, 2011
Symposium Editors:Anatoly Darinskii(Russian Academy of Science,St. Petersburg, Russia)
Macromolecular Symposia Related Titles
J. Costamagna, F. M. Rabagliati, B. L. Rivas
Macromolecular Complexes
Vol. 304
J. M. Guenet
Polymer-Solvent Complexes andIntercalates POLYSOLVAT-8
Vol. 303
H. U. Moritz, W. Pauer
Polymer Reaction Engineering – 10thInternational Workshop
Vol. 302
G. Camino, A. Frache, D. Tabuani
Eurofillers
Vol. 301
J. C. Pinto
Brazilian Polymer Congress
Vol. 299–300
W. Mormann
POLYCHAR-18 World Forum onAdvanced Materials
Vol. 298
Macromolecular Symposia Vol. 316
Molecular Mobility and OrderinPolymerSystems
Selected Contributions from:The 7th International Symposiumon Molecular Mobility and Order inPolymer SystemsSt. Petersburg, RussiaJune 6 – 10, 2011
Symposium Editors:Anatoly Darinskii(Russian Academy of Science,St. Petersburg, Russia)
� 2012 WILEY-VCH Verlag GmbH & Co. KGaA
Weinheim
iv || Masthead
Full text and further information: www.ms-journal.de
Executive Advisory Board:
Editors (all Macromolecular Journals):M. Antonietti, Golm, Germany
C. Barner-Kowollik, Karlsruhe, Germany
Fo
pe
fr
110
PO
Se
Prin
Typ
Prin
Bind
� 2
Wei
Kirsten Severing
Stefan Spiegel
D. L. Kaplan, Medford, USA
Managing Editor:K. Kiick, Newark, USA
Sibylle MeyerK. Kremer, Mainz, Germany
Administration:J.-F. Lutz, Strasbourg, France
H. E. H. Meijer, Eindhoven, Netherlands
Inge Dittmer
Petra Pinto
R. Mulhaupt, Freiburg, Germany
Production:Katja Kornmacher
Editorial Office:
T. P. Russell, Amherst, USA
A. J. Ryan, Sheffield, UK
J. B. P. Soares, Waterloo, Canada
B. Sumerlin, Gainesville, USA
N. Tirelli, Manchester, UK
B. Voit, Dresden, Germany
C. Wu, Hong Kong, China
B. Zhong Tang, Hong Kong, China
Macromolecular Symposia
is published 12 times a year
Annual subscription rate 2012
Europe Euro 2,408
Switzerland Sfr 3,812
All other areas US$ 3,171electronic only
Postage and handling charges included.
All Wiley-VCH prices are exclusive of VAT.
Prices are subject to change.
Print ISSN: 1022 – 1360
Online ISSN: 1521 – 3900
r USA and Canada: Macromolecular Symposia
r year by WILEY-VCH Verlag GmbH & Co. KGa
eight and mailing in the USA by Publications E
03, USA. Application to mail at Periodicals Pos
STMASTER please send address changes to:
rvices, John Wiley & Sons Inc., 350 Main St., M
ted on acid-free paper.
esetting: Thomson Digital (India) Ltd., India
ting: Strauss Offsetdruck, Morlenbach
ing: Litges & Dopf, Heppenheim
012 Wiley-VCH Verlag GmbH & Co. KGaA,
nheim
Copyright Permission:
Fax: þ49 (0) 62 01/6 06-332,
E-mail: [email protected]
Postage and handling charges included. All
Wiley-VCH prices are exclusive of VAT. Prices
are subject to change.
Contact: www.wileycustomerhelp.com
Cancellation of subscriptions: The publishers
must be notified not later than three months
before the end of the calendar year.
Order through your bookseller or directly at the
publisher:
www.wileycustomerhelp.com
(ISSN 1022-1360) is published with 12 volumes
A, Boschstr. 12, 69451 Weinheim, Germany. Air
xpediting Inc., 200 Meacham Ave., Elmont, NY
tage rate is pending at Jamaica, NY 11431, USA.
Macromolecular Symposia, Journal Customer
alden, MA 02148-5020.
Wiley’s Corporate Citizenship initiative seeks to
address the environmental, social, economic,
and ethical challenges faced in our business and
which are important to our diverse stakeholder
groups. We have made a long-term commit-
ment to standardize and improve our efforts
around the world to reduce our carbon footprint.
Follow our progress at:
www.wiley.com/go/citizenship
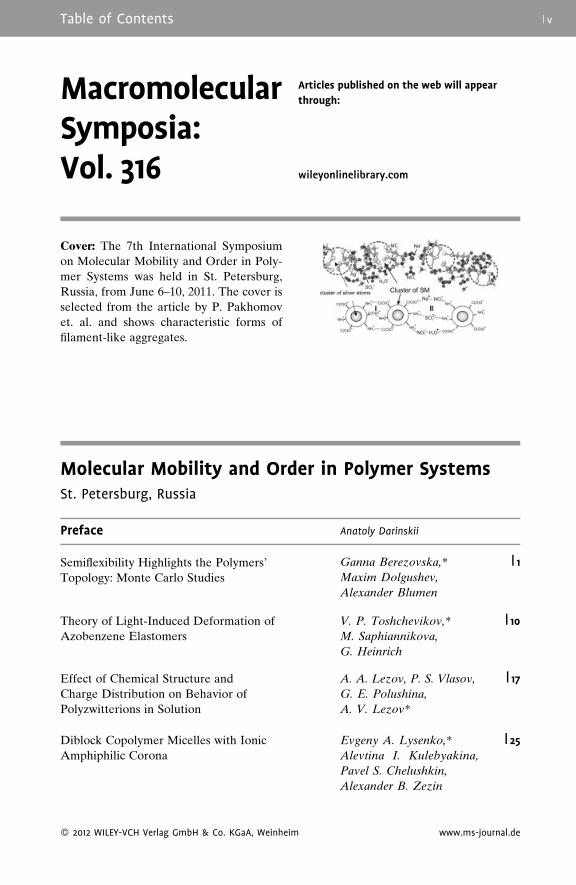
Table of Contents | v
MacromolecularSymposia:Vol. 316
Articles published on the web will appear
through:
wileyonlinelibrary.com
Cover: The 7th International Symposium
on Molecular Mobility and Order in Poly-
mer Systems was held in St. Petersburg,
Russia, from June 6–10, 2011. The cover is
selected from the article by P. Pakhomov
et. al. and shows characteristic forms of
filament-like aggregates.
Molecular Mobility and Order in Polymer SystemsSt. Petersburg, Russia
Preface Anatoly Darinskii
Semiflexibility Highlights the Polymers’
Topology: Monte Carlo Studies
� 2012 WILEY-VCH Verlag GmbH & Co. KGaA, Weinheim
Ganna Berezovska,*
Maxim Dolgushev,
Alexander Blumen
www.ms-j
| 1
Theory of Light-Induced Deformation of
Azobenzene Elastomers
V. P. Toshchevikov,*
M. Saphiannikova,
G. Heinrich
| 10
Effect of Chemical Structure and
Charge Distribution on Behavior of
Polyzwitterions in Solution
A. A. Lezov, P. S. Vlasov,
G. E. Polushina,
A. V. Lezov*
| 17
Diblock Copolymer Micelles with Ionic
Amphiphilic Corona
Evgeny A. Lysenko,*
Alevtina I. Kulebyakina,
Pavel S. Chelushkin,
Alexander B. Zezin
| 25
ournal.de

vi | Table of Contents
Synthesis and Solution Properties of Loose
Polymer Brushes Having Polyimide
Backbone and Methylmethacrylate Side
Chains
� 2012 WILEY-VCH Verlag GmbH & Co. KGaA, Weinheim
Anna Krasova,
Elena Belyaeva,
Elena Tarabukina,
Alexander Filippov,*
Tamara Meleshko,
Dmitry Ilgach,
Natalia Bogorad,
Alexander Yakimansky
www.ms-j
| 32
Hydrodynamic Properties of ‘‘Pseudo-
Dendrimer’’
Alexander P. Filippov,*
Alina I. Amirova,
Elena V. Belyaeva,
Elena B. Tarabukina,
Natalia A. Sheremetyeva,
Aziz M. Muzafarov
| 43
Modeling of Structure and Nonlinear
Optical Activity of Epoxy-Based
Oligomers with Dendritic
Multichromophore Fragments
Olga D. Fominykh,
Marina Yu. Balakina*
| 52
A New Approach to the Determination of
Adhesion Properties of Polymer Networks
Yulia G. Bogdanova,*
Valentina D. Dolzhikova,
Ilya M. Karzov,
Alexander Yu. Alentiev
| 63
Autoadhesion of Glassy Polymers
Yuri M. Boiko* | 712D Diffusion of Macromolecules Adsorbed
on Glass Microspheres
A. S. Malinin,*
A. A. Rakhnyanskaya,
A. A. Yaroslavov
| 79
Dynamic Mechanical Analysis and
Molecular Mobility of the R-BAPB Type
Polyimide
V. P. Toshchevikov,*
V. E. Smirnova,
V. E. Yudin,
V. M. Svetlichnyi
| 83
Thermostable Polycyanurate-Polyhedral
Oligomeric Silsesquioxane Hybrid
Networks: Synthesis, Dynamics and
Thermal Behavior
Olga Starostenko,
Vladimir Bershtein,*
Alexander Fainleib,
Larisa Egorova,
Olga Grigoryeva,
Alfred Sinani,
Pavel Yakushev
| 90
Supramolecular Hydrogels Based on Silver
Mercaptide. Self-Organization and
Practical Application
Pavel Pakhomov,*
Svetlana Khizhnyak,
Maxim Ovchinnikov,
Pavel Komarov
| 97
ournal.de

Table of Contents | vii
Comparative Study of the Quantity of
Volatile Organic Compounds in Water-
Based Paint and Solvent-Based Applied
Polyurethane
� 2012 WILEY-VCH Verlag GmbH & Co. KGaA, Weinheim
Ailton R. da Conceicao,*
Ednilson A. R. Pimenta,
Ronaldo S. Fujisawa,
Evandro L. Nohara
www.ms-j
| 108
Thermal Degradation of Adsorbed Bottle-
Brush Macromolecules: When Do Strong
Covalent Bonds Break Easily?
Jaroslaw Paturej,
Lukasz Kuban,
Andrey Milchev,
Vakhtang G. Rostiashvili,
Thomas A. Vilgis
| 112
ournal.de
viii | Author Index
Alentiev, Alexander Yu. | 63
Amirova, Alina I. | 43
Balakina, Marina Yu. | 52
Belyaeva, Elena | 32
Belyaeva, Elena V. | 43
Berezovska, Ganna | 1
Bershtein, Vladimir | 90
Blumen, Alexander | 1
Bogdanova, Yulia G. | 63
Bogorad, Natalia | 32
Boiko, Yuri M. | 71
Chelushkin, Pavel S. | 25
da Conceicao, Ailton R. | 108
Dolgushev, Maxim | 1
Dolzhikova, Valentina D. | 63
Egorova, Larisa | 90
Fainleib, Alexander | 90
Filippov, Alexander | 32
Filippov, Alexander P. | 43
Fominykh, Olga D. | 52
Fujisawa, Ronaldo S. | 108
Grigoryeva, Olga | 90
Heinrich, G. | 10
Ilgach, Dmitry | 32
Karzov, Ilya M. | 63
Khizhnyak, Svetlana | 97
Komarov, Pavel | 97
Krasova, Anna | 32
Kuban, Lukasz | 112
Kulebyakina, Alevtina I. | 25
Lezov, A. A. | 17
� 2012 WILEY-VCH Verlag GmbH & Co. KGaA, Weinheim
Lezov, A. V. | 17
Lysenko, Evgeny A. | 25
Malinin, A. S. | 79
Meleshko, Tamara | 32
Milchev, Andrey | 112
Muzafarov, Aziz M. | 43
Nohara, Evandro L. | 108
Ovchinnikov, Maxim | 97
Pakhomov, Pavel | 97
Paturej, Jaroslaw | 112
Pimenta, Ednilson A. R. | 108
Polushina, G. E. | 17
Rakhnyanskaya, A. A. | 79
Rostiashvili, Vakhtang G. | 112
Saphiannikova, M. | 10
Sheremetyeva, Natalia A. | 43
Sinani, Alfred | 90
Smirnova, V. E. | 83
Starostenko, Olga | 90
Svetlichnyi, V. M. | 83
Tarabukina, Elena | 32
Tarabukina, Elena B. | 43
Toshchevikov, V. P. | 83
Toshchevikov, V.P. | 10
Vilgis, Thomas A. | 112
Vlasov, P. S. | 17
Yakimansky, Alexander | 32
Yakushev, Pavel | 90
Yaroslavov, A. A. | 79
Yudin, V. E. | 83
Zezin, Alexander B. | 25
www.ms-journal.de
ix | Preface
The International Symposium on ‘‘Mole-
cular Mobility and Order in Polymer
Systems’’ was the seventh one in the
series of similar St. Petersburg IUPAC
meetings on macromolecules held in
1994, 1996, 1999, 2002, 2005 and 2008,
and organized by the Institute of Macro-
molecular Compounds of the Russian
Academy of Sciences (RAS). Symposiums
1996, 2002 and 2008 had a slightly title
‘‘Molecular Order and Mobility in Polymer
Systems’’ and were devoted mainly to
equilibrium properties of polymer systems.
The present Symposium was dedicated to
the International Year of the Chemistry
Co-organizers of the Symposium were
the Department of Chemistry and Material
Science of Russian Academy of Sciences
and the Polymer Council of Russian Acad-
emy of Sciences. The symposium was spon-
sored by the International Union of Pure and
Applied Chemistry (IUPAC) and sup-
ported by the Russian Foundation for Basic
Research (RFBR), St. Petersburg Scientific
Center of RAS, Intertech Corporation,
Bruker Company and L’Oreal Company.
21 plenary lectures, 69 oral communica-
tions and 216 posters were presented at the
Symposium. The overall number of authors
is 766 from 19 countries. Abstracts of all
presentations can be found in the Book of
Abstracts.
Among the Symposiums participants
were prominent scientists, in particular,
M. Ballauf, A. Blumen, A.H.E. Muller,
W. Paul (Germany) J. Klein (Israel), G. J.
Fleer, F.A.M. Leermakers (Netherlands),
H.-A. Klok and M. Textor (Switzerland),
F. Svec and S. Nazarenko (USA), C. M.
Marques (France), H. Tenhu (Finland),
A. Milchev (Bulgaria), T. Birshtein,
Yu. Gotlieb, A. Khokhlov, A. Lezov,
A. Ozerin (Russia) etc.
For many young scientists from Russia
the symposium was the unique possibility
to present their results for the international
community and to communicate with their
foreign colleagues.
This issue contains 15 papers written by
authors of some plenary and oral presenta-
� 2012 WILEY-VCH Verlag GmbH & Co. KGaA, Weinheim
tions at the Symposium which cover a
rather broad range of problems of modern
polymer science.
The issue starts with the theoretical
paper of G. Berezovska et al. Semiflex-
ibility Highlights the Polymers’ Topology:
Monte Carlo Studies where authors in the
framework of the bond fluctuation model
show that under semiflexible conditions the
topology is more pronounced for general
and local properties of polymers.
Authors of the paper of V. P. Toshche-
vikov et al. Theory of light-induced defor-
mation of azobenzene elastomers present
the theory predicting the dependence of
the response to the light of the polymer
network with chromophores on their
orientation distribution around the main
chains.
Two papers are devoted to ionizable
polymers in solution.
A. A. Lezov et al. Effect of Chemical
Structure and Charge Distribution on
Behavior of Polyzwitterions in Solution
consider the conformation of the interest-
ing type of polyzwitterions, namely, poly-
betaine where the anionic and cationic
groups are on the same monomer unit.
E. A. Lysenko et al., Diblock Copolymer
Micelles with Ionic Amphiphilic Corona
have presented results of the study of diblock
copolymer micelles with homogeneous
hydrophobic core and heterogeneous amphi-
philic corona.
Results for branched polymers are pre-
sented in three papers.
The subject of the paper of A. Krasova
et al. Synthesis and Solution Properties of
Loose Polymer Brushes Having Polyimide
Backbone and Methylmethacrylate Side
Chains is the solution behavior of a cylindrical
polymer brush where backbone and side
chains differ considerably in chemical nature
and, hence, thermodynamic properties.
In the paper of A. P. Filippov et al,
Hydrodynamic Properties of ‘‘Pseudo-den-
drimer’’ the conformation of nonregular
hyperbranched polymers in the solution is
compared with that of regular dendrimer of
the same chemical nature.
www.ms-journal.de
Preface | x
In the theoretical paper of O. D. Fomi-
nykh et al. Modeling of structure and
nonlinear optical activity of epoxy-based
oligomers with dendritic multichromo-
phore fragments the relationship between
structure and NLO activity is studied by the
computer simulation.
Two papers are devoted to adhesive
properties of polymers.
Authors of the paper of Yu. G. Bogda-
nova et al. New Approach to the Determi-
nation of Adhesion Properties of Polymer
Networks suggest to use the works of
adhesion of polymer to liquids simulating
polar or non-polar phases for prediction of
adhesive properties of network (binder,
coupling agent) and for the choice of
network provided the best tensile strength
of composite material.
In the paper of Yu. M. Boiko Autoadhe-
sion of Glassy Polymers.
The autoadhesion and adhesion (bonding
of one and the same material and of two
different materials, respectively) of two con-
tacting polymer pieces is related with the
mobility in the surface layers of polymers.
The paper of A. S. Malinin et al. 2D
diffusion of macromolecules adsorbed on
glass microspheres also concerns surface
phenomena. Authors have demonstrated
an example of 2D diffusion of macromole-
cules when adsorbed polycations migrate
from one colloidal particle to another
without desorption into the solution.
Two papers are devoted to mechanical
properties of polymers in bulk.
V. P. Toshchevikov et al. Dynamic
Mechanical Analysis and Molecular
Mobility of the R-BAPB Type Polyimide
present results of the dynamic mechanical
analysis of one of potential candidates
as high-performance thermoplastic matrix
for thermally stable fiber reinforced com-
posites as well as nanocomposites.
Olga Starostenko et al. Thermostable
Polycyanurate-Polyhedral Oligomeric Sil-
sesquioxane Hybrid Networks: Synthesis,
Dynamics and Thermal Behavior discuss
an unusually strong influence of low con-
tent of molecularly dispersed inorganic
nanoparticles (polyhedral oligomeric sil-
sesquioxane) on the glass transition char-
acteristics of the hybrid nanocomposite.
An example of a pseudo-polymeric system
is discussed in the paper of P. Pakhomov et al.
Supramolecular hydrogels based on silver
mercaptide. Self-organization and practical
application Authors demonstrate a novel
supramolecular system which is able to form
thixotropic hydrogels at very low concen-
trations of initial components.
The paper of A. R. da Conceicao et al.
Comparative Study of the Quantity of
Volatile Organic Compounds in Water-
Based Paint and Solvent-Based Applied
Polyurethane is an example of the work in
the applied polymer science. Authors
compare the VOC results and combust-
ibility of the paint based on solvents with
water-based paint.
Anatoly Darinskii
Macromol. Symp. 2012, 316, 1–9 DOI: 10.1002/masy.201250601 1
The
Her
E-m
Cop
Semiflexibility Highlights the Polymers’ Topology:
Monte Carlo Studies
Ganna Berezovska,* Maxim Dolgushev, Alexander Blumen
Summary: In this article we analyze in how far semiflexible behavior enhances the
differences in the properties of classes of polymers whose topological structure
varies. We focus on three pairs of macromolecular classes: stars vs. chains, unknotted
rings vs. rings with one knot (trefoils), and stars vs. unknotted rings. For this we
determine the mean-square radii of gyration and the bond-bond correlation func-
tions through Monte Carlo simulations which use the bond fluctuation model. We
show that introducing semiflexibility magnifies the differences between experimen-
tally measurable quantities and may even lead to qualitative changes. Our simulation
results are supported by theoretical studies which make use of the maximum entropy
principle.
Keywords: branched; Monte Carlo simulations; ring polymers; stiffness; theory
Introduction
The properties of polymers are influenced
both by their topology and also by the
degree of semiflexibility of their segments.
While recent analytical extensions of the
generalized Gaussian structures picture
(GGS)[1] to the case of semiflexible branched
polymers[2–5] and rings[5,6] give qualitative
clues to the behavior of polymers, numerical
simulation techniques allow to investigate the
role of the excluded volume and thus provide
a more realistic approach. For this we present
here a simulation study of different topolo-
gical structures by means of the bond
fluctuation model (BFM),[7,8] which allows
to account both for branching and/or pre-
sence of loops and also for semiflexible
behavior. In the analysis of our results we
focus on the mean square radius of gyration
(as a general static property of polymers) and
on the bond vector correlation function (as an
example of local properties). We compare
the simulation data with the theoretical
predictions based on the extended GGS
oretische Polymerphysik, Universitat Freiburg,
mann-Herder-Str. 3, D-79104 Freiburg, Germany
ail: [email protected]
yright � 2012 WILEY-VCH Verlag GmbH & Co. KGaA
approach[2–4] and on the maximum-entropy
principle (MEP).[5,6]
Now, a theoretical approach which was
recently shown to be very well suitable for
the description of semiflexible tree-like
polymers (STPs) as well as of semiflexible
rings is the MEP.[9,10] Being initially
applied to semiflexible chains in a dis-
crete[11] and in a continuous[12] framework,
it was implemented to STPs[2] and general-
ized to semiflexible rings.[5,6] An important
feature of the MEP method is that it
introduces constraints only on adjacent
bonds. Moreover, the treatment of STPs
with MEP was shown to be equivalent, and
hence an alternative, to the recently devel-
oped approach for STPs[2] done in the spirit
of Bixon and Zwanzig.[13]
An example where the theoretical
approaches mentioned above as well as
the numerical investigations turn out to be
helpful is the study of so-called cospectral
polymer (CP) structures.[14,15] These struc-
tures are important, since in the GGS
picture they have the same Laplacian
spectrum although being topologically dif-
ferent. Hence, in GGS, flexible polymers
whose structures are cospectral graphs are
predicted to be indistinguishable under the
usual static and dynamical measurements.
, Weinheim wileyonlinelibrary.com
Macromol. Symp. 2012, 316, 1–92
Taking into account that large tree-like
structures have (at least) one cospectral
counterpart,[16,17] the problem becomes of
much importance. Our recent mathemati-
cal-analytical study[18] shows that when the
polymers are semiflexible one can distin-
guish between cospectral structures. This is
qualitatively confirmed by our simulation
results on the smallest tree-like cospectral
pair.[18]
Discrete semiflexible rings provide
another example of analytical results
obtainable through MEP.[5,6] It turns out
that in the rigid limit, besides solutions
pertaining to unknotted rings, one obtains
other solutions related to knotted rings.[5,6]
To have a check of the theory, Monte Carlo
(MC) simulations are very helpful, and here
especially the BFM, which in its standard
form conserves the topology of the objects
but also permits to turn off and on the
excluded volume interactions.[5,6]
Having noticed that under semiflexible
conditions the topology is more pro-
nounced (as in the case of CP and of the
rings described above) and motivated by
recent achievements in theory based on the
MEP, we decided to study in detail the
influence of the semiflexibility on different
topologies. For this we start with simula-
tions on star polymers with functionality
f¼ 3 and f¼ 4, and continue by considering
unknotted rings and rings with one knot
(known as trefoils).
Our paper is structured as follows: In the
next section we describe the simulation
technique and present the quantities under
study. Then we proceed to present simula-
tion results on stars and rings, by focusing
on the role of semiflexibility; for this we
compare the behaviors of stars vs. chains, of
unknotted rings vs. trefoils and finally of
stars vs. rings. We end up our paper with
conclusions.
Simulation Method
We investigate here the properties of
semiflexible polymers in the framework
of the bond fluctuation model (BFM).[7,8] In
Copyright � 2012 WILEY-VCH Verlag GmbH & Co. KGaA
the BFM each monomer of a coarse-grained
polymer is represented by a cube of unit
length on the simple cubic lattice. The
excluded volume property is introduced by
requiring that each lattice site belongs to one
cube at most. Although the lengths of the
bonds are allowed to fluctuate, they have to
belong to the set of lengths 2,ffiffiffi5p
,ffiffiffi6p
, 3 orffiffiffiffiffi10p
. All spatial distances are measured in
units of the lattice spacing. Altogether, the
three-dimensional BFM allows 108 different
bond vectors and 87 different angles
between them. Applying the cubic point
group operations to the set of vectors {(2, 0,
0), (2, 1, 0), (2, 1, 1), (2, 2, 1), (3, 0, 0), (3, 1, 0)}
one obtains the complete set of allowed
bond vectors.
Starting from an initial configuration one
creates a new one through one local move:
First, one chooses at random a unit cube;
then one attempts to move it randomly by a
unit length in one of the six lattice
directions. The attempt is rejected if at
least one of the eight sites of the unit cube in
the new position lands on an occupied site
or if the new bond does not belong to the
allowed set. The restrictions on the bond
lengths are topology-preserving, since they
prevent the crossing of segments. One
Monte Carlo step (MCS) is achieved when
in average each bead has attempted one
trial move. The BFM scheme was originally
applied to chain-like structures, but it now
encompasses a large number of polymer
structures.[19–25] In Figure 1 we represent
schematically a branched polymer and some
of the allowed BFM moves.
Since we want to model semiflexible
objects we introduce an energy penalty for
moves which are allowed under the above
scheme, but which involve an energy change
of DU. For this we use the Metropolis
algorithm[26] to determine the transition
probability w
w ¼ min 1; exp � DU
kBT
� �� �(1)
for accepting an allowed local move.
Now, to be in line with the theoretical
calculations for semiflexible tree-like struc-
, Weinheim www.ms-journal.de
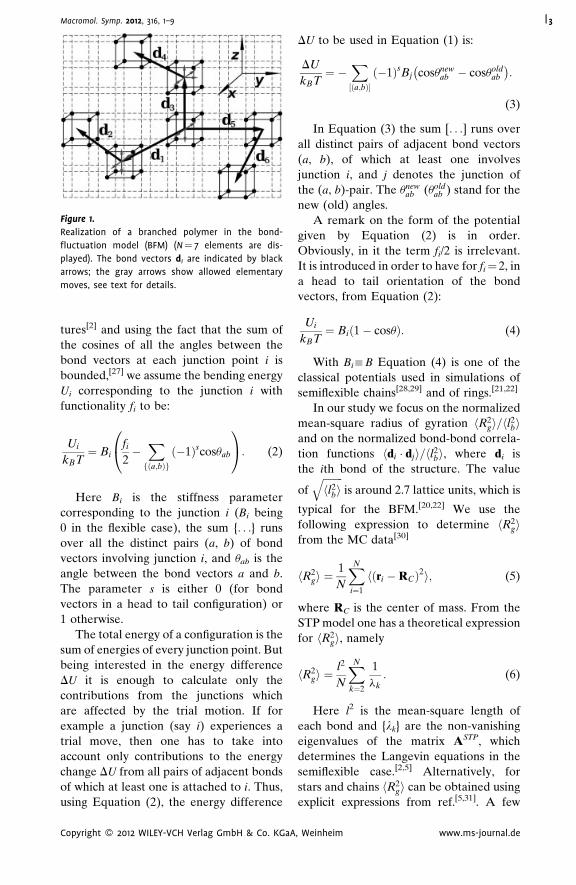
Figure 1.
Realization of a branched polymer in the bond-
fluctuation model (BFM) (N¼ 7 elements are dis-
played). The bond vectors di are indicated by black
arrows; the gray arrows show allowed elementary
moves, see text for details.
Macromol. Symp. 2012, 316, 1–9 3
tures[2] and using the fact that the sum of
the cosines of all the angles between the
bond vectors at each junction point i is
bounded,[27] we assume the bending energy
Ui corresponding to the junction i with
functionality fi to be:
Ui
kBT¼ Bi
fi
2�Xfða;bÞg
ð�1Þscosuab
0@
1A: (2)
Here Bi is the stiffness parameter
corresponding to the junction i (Bi being
0 in the flexible case), the sum {. . .} runs
over all the distinct pairs (a, b) of bond
vectors involving junction i, and uab is the
angle between the bond vectors a and b.
The parameter s is either 0 (for bond
vectors in a head to tail configuration) or
1 otherwise.
The total energy of a configuration is the
sum of energies of every junction point. But
being interested in the energy difference
DU it is enough to calculate only the
contributions from the junctions which
are affected by the trial motion. If for
example a junction (say i) experiences a
trial move, then one has to take into
account only contributions to the energy
change DU from all pairs of adjacent bonds
of which at least one is attached to i. Thus,
using Equation (2), the energy difference
Copyright � 2012 WILEY-VCH Verlag GmbH & Co. KGaA
DU to be used in Equation (1) is:
DU
kBT¼ �
X½ða;bÞ�
ð�1ÞsBj cosunewab � cosuold
ab
� �:
(3)
In Equation (3) the sum [. . .] runs over
all distinct pairs of adjacent bond vectors
(a, b), of which at least one involves
junction i, and j denotes the junction of
the (a, b)-pair. The unewab (uold
ab ) stand for the
new (old) angles.
A remark on the form of the potential
given by Equation (2) is in order.
Obviously, in it the term fi/2 is irrelevant.
It is introduced in order to have for fi¼ 2, in
a head to tail orientation of the bond
vectors, from Equation (2):
Ui
kBT¼ Bið1� cosuÞ: (4)
With Bi���B Equation (4) is one of the
classical potentials used in simulations of
semiflexible chains[28,29] and of rings.[21,22]
In our study we focus on the normalized
mean-square radius of gyration hR2gi=hl2
biand on the normalized bond-bond correla-
tion functions hdi � dji=hl2bi, where di is
the ith bond of the structure. The value
offfiffiffiffiffiffiffiffihl2
biq
is around 2.7 lattice units, which is
typical for the BFM.[20,22] We use the
following expression to determine hR2gi
from the MC data[30]
hR2gi ¼
1
N
XN
i¼1
hðri �RCÞ2i; (5)
where RC is the center of mass. From the
STP model one has a theoretical expression
for hR2gi, namely
hR2gi ¼
l2
N
XN
k¼2
1
lk: (6)
Here l2 is the mean-square length of
each bond and {lk} are the non-vanishing
eigenvalues of the matrix ASTP, which
determines the Langevin equations in the
semiflexible case.[2,5] Alternatively, for
stars and chains hR2gi can be obtained using
explicit expressions from ref.[5,31]. A few
, Weinheim www.ms-journal.de
Macromol. Symp. 2012, 316, 1–94
remarks concerning the stiffness parameters
used in simulations (namely Bi) and in the
theoretical studies (namely ti[5]) are now
required. In the simulations we will let
the semiflexibility parameter Bi to be the
same for all junction types, Bi���B, and
we will use B¼ 0 in the flexible case and
B¼ 6 in the semiflexible case. Given that in
the theoretical framework the mean-square
lengths of all bonds are equal, hl2bitheory ¼ l2,
the theoretical stiffness parameter ti can be
introduced through[2,5,6]
hda � dbi ¼ ð�1Þshl2biti; (7)
where da and db are adjacent bond vectors
connected through the bead i and s is the
same as in Equation 2. For chains and rings
we consider homogeneous situations, in
which all the bonds are connected head to
tail and ti��� t for all i. In the case of stars the
bonds have a head to tail orientation in the
arms and also for them we will set ti��� t.
Only the bonds directly attached to the
core have tail to tail orientations and, in
principle, another stiffness coefficient,
namely q ¼ t=ðf � 1Þ, where f is the func-
tionality of the core of the star. Based on
Equation (7) one can now readily connect
t to B. For chains and stars we can relate
in this way B¼ 0 and B¼ 6 to the values
t¼ 0.19 and t¼ 0.84, respectively. These
values are almost independent of the chain
or of the arm length.[5] For rings the t-values
for several N and for B¼ 0 and B¼ 6
are presented in Table 1.[5,6] One can
notice that in the case of rings the t-values
depend on the ring length; this is due to the
closure condition.[6] For ring lengths suffi-
ciently large the values of t are almost
constant.
Table 1.Theoretical stiffness parameters t for unknotted rings obtfor details. Data from ref.[5,6]
N¼ 16 N¼ 32 N¼ 64
B¼ 0 0.159 0.176 0.182B¼ 6 0.764 0.807 0.816
Copyright � 2012 WILEY-VCH Verlag GmbH & Co. KGaA
Objects of Investigation
Linear Chains and Stars
We start by investigating the role of a single
branching point. For this we consider stars
of functionality f¼ 3 and 4 and molecular
weight N ¼ fnþ 1, where n is the number of
beads in each arm. We will compare the
results for them with those for chains of size
N ¼ 2nþ 1 (these can be viewed as ‘‘two-
arm’’ stars, f¼ 2, with arm length 2n). In the
BFM-simulations we take n up to n¼ 50 and
for the chains we go with N up to N¼ 320.
As stiffness parameters we use B¼ 0 and
B¼ 6. The size of the simulation box varies
with the size of the object considered and
for the largest stars or chains it contains
700� 700� 700 lattice units. Each object is
equilibrated for some 109 MCS, after which
the conformations are saved every 1000
MCS. The averages are then taken over at
least 106 realizations. The radius of gyration
is obtained from the simulation data using
Equation (5).
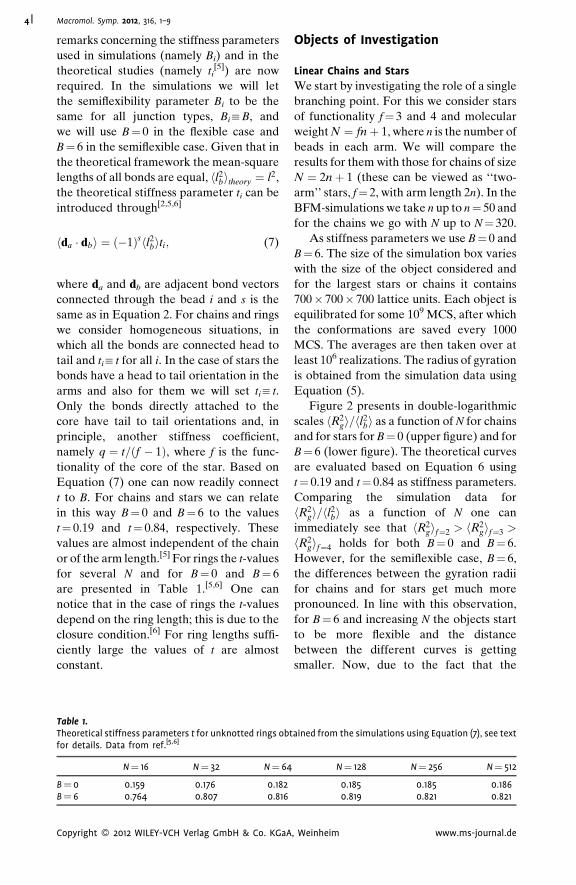
Figure 2 presents in double-logarithmic
scales hR2gi=hl2
bi as a function of N for chains
and for stars for B¼ 0 (upper figure) and for
B¼ 6 (lower figure). The theoretical curves
are evaluated based on Equation 6 using
t¼ 0.19 and t¼ 0.84 as stiffness parameters.
Comparing the simulation data for
hR2gi=hl2
bi as a function of N one can
immediately see that hR2gif¼2 > hR2
gif¼3 >
hR2gif¼4 holds for both B¼ 0 and B¼ 6.
However, for the semiflexible case, B¼ 6,
the differences between the gyration radii
for chains and for stars get much more
pronounced. In line with this observation,
for B¼ 6 and increasing N the objects start
to be more flexible and the distance
between the different curves is getting
smaller. Now, due to the fact that the
ained from the simulations using Equation (7), see text
N¼ 128 N¼ 256 N¼ 512
0.185 0.185 0.1860.819 0.821 0.821
, Weinheim www.ms-journal.de
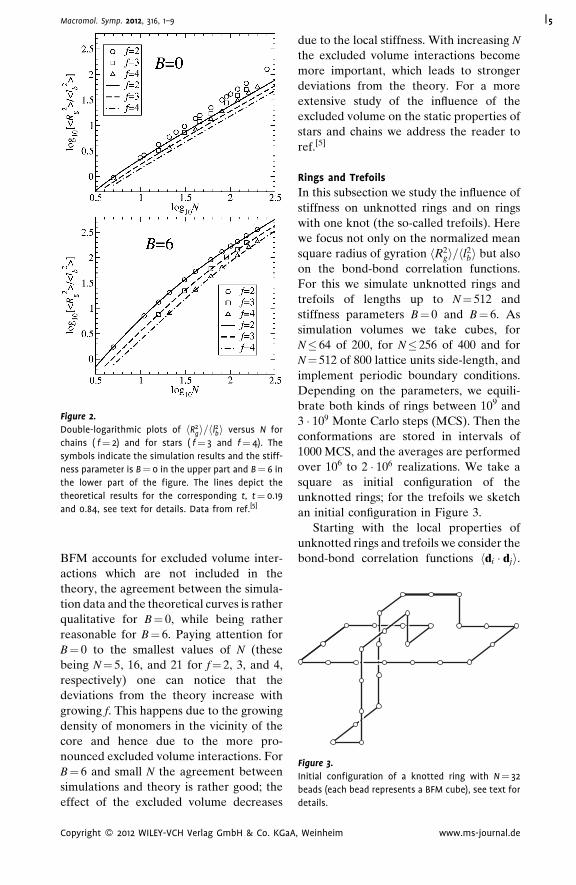
Figure 2.
Double-logarithmic plots of hR2gi=hl2bi versus N for
chains ( f¼ 2) and for stars ( f¼ 3 and f¼ 4). The
symbols indicate the simulation results and the stiff-
ness parameter is B¼ 0 in the upper part and B¼ 6 in
the lower part of the figure. The lines depict the
theoretical results for the corresponding t, t¼ 0.19
and 0.84, see text for details. Data from ref.[5]
Figure 3.
Initial configuration of a knotted ring with N¼ 32
beads (each bead represents a BFM cube), see text for
details.
Macromol. Symp. 2012, 316, 1–9 5
BFM accounts for excluded volume inter-
actions which are not included in the
theory, the agreement between the simula-
tion data and the theoretical curves is rather
qualitative for B¼ 0, while being rather
reasonable for B¼ 6. Paying attention for
B¼ 0 to the smallest values of N (these
being N¼ 5, 16, and 21 for f¼ 2, 3, and 4,
respectively) one can notice that the
deviations from the theory increase with
growing f. This happens due to the growing
density of monomers in the vicinity of the
core and hence due to the more pro-
nounced excluded volume interactions. For
B¼ 6 and small N the agreement between
simulations and theory is rather good; the
effect of the excluded volume decreases
Copyright � 2012 WILEY-VCH Verlag GmbH & Co. KGaA
due to the local stiffness. With increasing N
the excluded volume interactions become
more important, which leads to stronger
deviations from the theory. For a more
extensive study of the influence of the
excluded volume on the static properties of
stars and chains we address the reader to
ref.[5]
Rings and Trefoils
In this subsection we study the influence of
stiffness on unknotted rings and on rings
with one knot (the so-called trefoils). Here
we focus not only on the normalized mean
square radius of gyration hR2gi=hl2
bi but also
on the bond-bond correlation functions.
For this we simulate unknotted rings and
trefoils of lengths up to N¼ 512 and
stiffness parameters B¼ 0 and B¼ 6. As
simulation volumes we take cubes, for
N� 64 of 200, for N� 256 of 400 and for
N¼ 512 of 800 lattice units side-length, and
implement periodic boundary conditions.
Depending on the parameters, we equili-
brate both kinds of rings between 109 and
3 � 109 Monte Carlo steps (MCS). Then the
conformations are stored in intervals of
1000 MCS, and the averages are performed
over 106 to 2 � 106 realizations. We take a
square as initial configuration of the
unknotted rings; for the trefoils we sketch
an initial configuration in Figure 3.
Starting with the local properties of
unknotted rings and trefoils we consider the
bond-bond correlation functions hdi � dji.
, Weinheim www.ms-journal.de
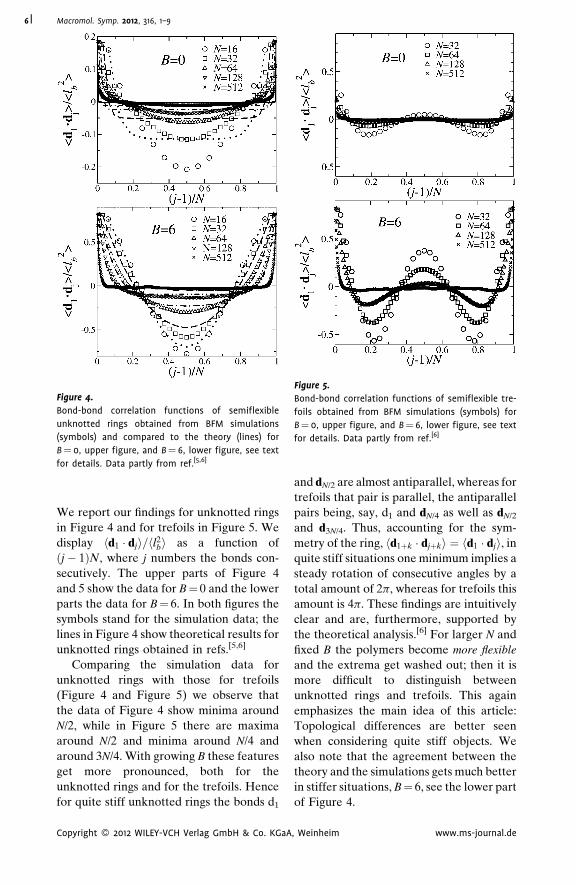
Figure 4.
Bond-bond correlation functions of semiflexible
unknotted rings obtained from BFM simulations
(symbols) and compared to the theory (lines) for
B¼ 0, upper figure, and B¼ 6, lower figure, see text
for details. Data partly from ref.[5,6]
Figure 5.
Bond-bond correlation functions of semiflexible tre-
foils obtained from BFM simulations (symbols) for
B¼ 0, upper figure, and B¼ 6, lower figure, see text
for details. Data partly from ref.[6]
Macromol. Symp. 2012, 316, 1–96
We report our findings for unknotted rings
in Figure 4 and for trefoils in Figure 5. We
display hd1 � dji=hl2bi as a function of
ðj� 1ÞN, where j numbers the bonds con-
secutively. The upper parts of Figure 4
and 5 show the data for B¼ 0 and the lower
parts the data for B¼ 6. In both figures the
symbols stand for the simulation data; the
lines in Figure 4 show theoretical results for
unknotted rings obtained in refs.[5,6]
Comparing the simulation data for
unknotted rings with those for trefoils
(Figure 4 and Figure 5) we observe that
the data of Figure 4 show minima around
N/2, while in Figure 5 there are maxima
around N/2 and minima around N/4 and
around 3N/4. With growing B these features
get more pronounced, both for the
unknotted rings and for the trefoils. Hence
for quite stiff unknotted rings the bonds d1
Copyright � 2012 WILEY-VCH Verlag GmbH & Co. KGaA
and dN/2 are almost antiparallel, whereas for
trefoils that pair is parallel, the antiparallel
pairs being, say, d1 and dN/4 as well as dN/2
and d3N/4. Thus, accounting for the sym-
metry of the ring, hd1þk � djþki ¼ hd1 � dji, in
quite stiff situations one minimum implies a
steady rotation of consecutive angles by a
total amount of 2p, whereas for trefoils this
amount is 4p. These findings are intuitively
clear and are, furthermore, supported by
the theoretical analysis.[6] For larger N and
fixed B the polymers become more flexible
and the extrema get washed out; then it is
more difficult to distinguish between
unknotted rings and trefoils. This again
emphasizes the main idea of this article:
Topological differences are better seen
when considering quite stiff objects. We
also note that the agreement between the
theory and the simulations gets much better
in stiffer situations, B¼ 6, see the lower part
of Figure 4.
, Weinheim www.ms-journal.de
100010010
N1
10
100
1000
<R
g2 >/<
l b2 >
ring; B=0ring; B=6trefoil; B=0trefoil; B=6
~N1.20
~N1.27
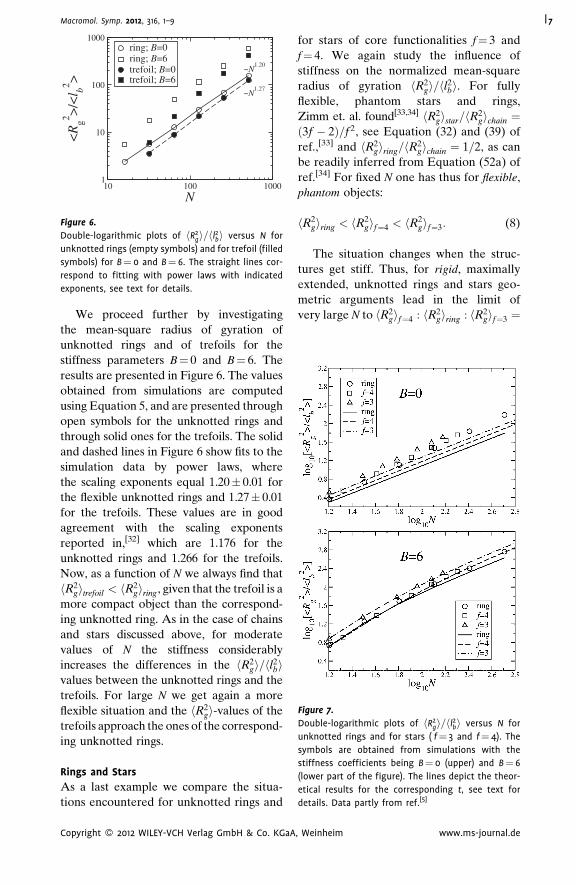
Figure 6.
Double-logarithmic plots of hR2gi=hl2bi versus N for
unknotted rings (empty symbols) and for trefoil (filled
symbols) for B¼ 0 and B¼ 6. The straight lines cor-
respond to fitting with power laws with indicated
exponents, see text for details.
Figure 7.
Double-logarithmic plots of hR2gi=hl2bi versus N for
unknotted rings and for stars ( f¼ 3 and f¼ 4). The
symbols are obtained from simulations with the
stiffness coefficients being B¼ 0 (upper) and B¼ 6
(lower part of the figure). The lines depict the theor-
etical results for the corresponding t, see text for
details. Data partly from ref.[5]
Macromol. Symp. 2012, 316, 1–9 7
We proceed further by investigating
the mean-square radius of gyration of
unknotted rings and of trefoils for the
stiffness parameters B¼ 0 and B¼ 6. The
results are presented in Figure 6. The values
obtained from simulations are computed
using Equation 5, and are presented through
open symbols for the unknotted rings and
through solid ones for the trefoils. The solid
and dashed lines in Figure 6 show fits to the
simulation data by power laws, where
the scaling exponents equal 1.20� 0.01 for
the flexible unknotted rings and 1.27� 0.01
for the trefoils. These values are in good
agreement with the scaling exponents
reported in,[32] which are 1.176 for the
unknotted rings and 1.266 for the trefoils.
Now, as a function of N we always find that
hR2gitrefoil < hR2
giring, given that the trefoil is a
more compact object than the correspond-
ing unknotted ring. As in the case of chains
and stars discussed above, for moderate
values of N the stiffness considerably
increases the differences in the hR2gi=hl2
bivalues between the unknotted rings and the
trefoils. For large N we get again a more
flexible situation and the hR2gi-values of the
trefoils approach the ones of the correspond-
ing unknotted rings.
Rings and Stars
As a last example we compare the situa-
tions encountered for unknotted rings and
Copyright � 2012 WILEY-VCH Verlag GmbH & Co. KGaA
for stars of core functionalities f¼ 3 and
f¼ 4. We again study the influence of
stiffness on the normalized mean-square
radius of gyration hR2gi=hl2
bi. For fully
flexible, phantom stars and rings,
Zimm et. al. found[33,34] hR2gistar=hR2
gichain ¼ð3f � 2Þ=f 2, see Equation (32) and (39) of
ref.,[33] and hR2giring=hR2
gichain ¼ 1=2, as can
be readily inferred from Equation (52a) of
ref.[34] For fixed N one has thus for flexible,
phantom objects:
hR2giring < hR2
gif¼4 < hR2gif¼3: (8)
The situation changes when the struc-
tures get stiff. Thus, for rigid, maximally
extended, unknotted rings and stars geo-
metric arguments lead in the limit of
very large N to hR2gif¼4 : hR2
giring : hR2gif¼3 ¼
, Weinheim www.ms-journal.de
Macromol. Symp. 2012, 316, 1–98
14 : 3
p2 : 49 and hence to
hR2gif¼4 < hR2
giring < hR2gif¼3; (9)
i.e. to a change in the order of the radii of
gyration.
For a more realistic picture we again
perform BFM-simulations and find a very
satisfactory agreement with the theory. To
show this we plot in Figure 7 the gyration
radii both for stars and for unknotted rings
for B¼ 0 (upper part) and B¼ 6 (lower part
of Figure 7). Here again the symbols
correspond to the simulation data and the
curves are the theoretical results. For stars
the values of hR2gi=hl2
bi were obtained using
Equation 6 with t¼ 0.19 and t¼ 0.84 for
B¼ 0 and for B¼ 6, respectively. The values
of t for rings are taken from Table 1. For
B¼ 0 we find for all N that Equation (8)
holds. Going to a more stiff situation, B¼ 6,
the behavior changes, and for N964 the
order of the radii of gyration is that of
Equation (9). Thus, we indeed find in the
simulations a crossover between fully
flexible and fully rigid situations; hence
by varying the stiffness coefficient one can
pinpoint the underlying topologies even on
a qualitative level.
Conclusion
We devoted this article to investigate how
changes in flexibility help in highlighting
the topology of polymers. For some
structures, such as CP, this question
becomes of major importance since fully
flexible, ideal CP are indistinguishable.[18]
We were encouraged by recent achieve-
ments in theory, namely by the ease with
which stiffness parameters can be taken
into account, for both in the MEP frame-
work[2,5,6] as well as in the GGS picture.[5]
Here we confronted the theoretical results
to findings from MC simulation studies, in
which the BFM technique was used. This
allowed us to investigate the influence of
semiflexibility under realistic conditions, by
also accounting for the excluded volume
interactions which are not taken into
Copyright � 2012 WILEY-VCH Verlag GmbH & Co. KGaA
account in the theoretical studies men-
tioned above.
In our study we focused on two groups of
topologies: simple branched structures such
as stars and chains (the latter can be viewed
as two-arm stars) and simple loop structures
such as unknotted rings and trefoils. By
comparisons within each of the groups (stars
vs. chains, unknotted rings vs. trefoils) and
between the groups (stars vs. unknotted
rings) we could investigate the influence of
semiflexibility on the static properties of
polymers, namely on the mean-square radii
of gyration and the bond-bond correlation
functions. For not-too-large N, both for stars
and chains, and for unknotted rings and
trefoils the differences between the mean-
square radii of gyration increase when the
semiflexibility parameter B gets larger. This
allows a differentiation between these poly-
mers within each of the groups. For
unknotted rings and trefoils the differences
in topologies manifest themselves even
stronger in their bond-bond correlation
functions: With growing B the extrema in
the bond-bond correlation functions become
more pronounced. Comparing different
stars vs. unknotted rings we observe quali-
tative changes: The simulations for B¼ 0
support the theoretical ordering hR2giring <
hR2gif¼4 < hR2
gif¼3 whereas for B¼ 6 and
small N the order is hR2gif¼4 < hR2
giring <
hR2gif¼3. Thus the simulation results are
in good agreement with the theoretical
findings.
Acknowledgements: The authors acknowledgethe support of the Deutsche Forschungsge-meinschaft (Bl 142/11-1) and of the Fonds derChemischen Industrie.
[1] A. A. Gurtovenko, A. Blumen, Adv. Polym. Sci. 2005,
182, 171.
[2] M. Dolgushev, A. Blumen, J. Chem. Phys. 2009, 131,
044905.
[3] M. Dolgushev, A. Blumen, Macromolecules 2009,
42, 5378.
[4] M. Dolgushev, A. Blumen, J. Chem. Phys. 2010, 132,
124905.
, Weinheim www.ms-journal.de
Macromol. Symp. 2012, 316, 1–9 9
[5] M. Dolgushev, G. Berezovska, A. Blumen, Macro-
mol. Theory Simul., in press DOI: 10.1002/mats.
201100049.
[6] M. Dolgushev, G. Berezovska, A. Blumen, J. Chem.
Phys., in press DOI: 10.1063/1.3631943.
[7] I. Carmesin, K. Kremer, Macromolecules 1988, 21,
2819.
[8] H. P. Deutsch, K. Binder, J. Chem. Phys. 1991, 94,
2294.
[9] E. T. Jaynes, Phys. Rev. 1957, 106, 620.
[10] H. Haken, Synergetik, Springer, Berlin, 1983.
[11] R. G. Winkler, P. Reineker, L. Harnau, J. Chem. Phys.
1994, 101, 8119.
[12] L. Harnau, R. G. Winkler, P. Reineker, J. Chem. Phys.
1995, 102, 7750.
[13] M. Bixon, R. Zwanzig, J. Chem. Phys. 1978, 68, 1896.
[14] K. Nitta, Entropy 2009, 11, 907.
[15] K. Nitta, Non-linearity in Polymers in Encyclopedia
of Complexity and Systems Science, 6833-6855,
Springer, New York, 2009.
[16] B. D. McKay, Ars Combin. 1979, 3, 219.
[17] E. R. van Dam, W. H. Haemers, Linear Algebra Appl.
2003, 373, 241.
[18] M. Dolgushev, G. Berezovska, A. Blumen, J. Chem.
Phys. 2010, 133, 154905.
[19] H.-P. Hsu, W. Paul, S. Rathgeber, K. Binder, Macro-
molecules 2010, 43, 1592.
[20] H.-P. Hsu, W. Paul, K. Binder, Macromolecules
2010, 43, 3094.
Copyright � 2012 WILEY-VCH Verlag GmbH & Co. KGaA
[21] M. Muller, J. P. Wittmer, M. E. Cates, Phys. Rev. E
1996, 53, 5063.
[22] M. Muller, J. P. Wittmer, M. E. Cates, Phys. Rev. E
2000, 61, 4078.
[23] R. Descas, J.-U. Sommer, A. Blumen, Macromol.
Theory Simul. 2008, 17, 429.
[24] J. S. Kl/os, J.-U. Sommer, Macromolecules 2009, 42,
4878.
[25] M. Werner, J.-U. Sommer, Eur. Phys. J. E 2010, 31,
383.
[26] N. Metropolis, A. W. Rosenbluth, M. N. Rosen-
bluth, A. H. Teller, E. Teller, J. Chem. Phys. 1953, 21,
1087.
[27] M. L. Mansfield, W. H. Stockmayer, Macromol-
ecules 1980, 13, 1713.
[28] J. A. Martemyanova, M. R. Stukan, V. A. Ivanov,
M. Muller, W. Paul, K. Binder, J. Chem. Phys. 2005, 122,
174907.
[29] D. Shirvanyants, S. Panyukov, Q. Liao, M.
Rubinstein, Macromolecules 2008, 41, 1475.
[30] M. Doi, S. F. Edwards, The Theory of Polymer
Dynamics, Clarendon Press, Oxford, 1986.
[31] M. Guenza, M. Mormino, A. Perico, Macromol-
ecules 1991, 24, 6168.
[32] M. L. Mansfield, J. F. Douglas, J. Chem. Phys. 2010,
133, 044903.
[33] B. H. Zimm, R. W. Kilb, J. Polym. Sci. 1959, 37, 19.
[34] B. H. Zimm, W. H. Stockmayer, J. Chem. Phys.
1949, 17, 1301.
, Weinheim www.ms-journal.de
Macromol. Symp. 2012, 316, 10–16 DOI: 10.1002/masy.20125060210
1 Le
H2 In
31
E-3 Te
sto
G
Cop
Theory of Light-Induced Deformation of Azobenzene
Elastomers
V.P. Toshchevikov,*1,2 M. Saphiannikova,1 G. Heinrich1,3
Summary: A microscopic theory is proposed to describe light-induced deformation of
photo-sensitive elastomers bearing azobenzene chromophores in their strands. We
use an orientation approach in which it is assumed that the light-induced defor-
mation is caused by reorientation of azobenzene chromophores with respect to the
electric vector of the linearly polarized light, E, due to the trans-cis-trans photo-
isomerizaion process whose efficiency depends on the orientation of the chromo-
phores with respect to the vector E. In the framework of the Gaussian approximation
for elasticity of network strands it is shown that the value of the light-induced
deformation depends on the chemical structure of network strands, namely, on the
orientation distribution of chromophores around the main chains which is related
to the length and elasticity of spacers. Depending on the chemical structure,
azobenzene elastomers can demonstrate expansion or uniaxial contraction along
the vector E, as well as non-monotonic deformation with increasing light intensity
(expansion at small light intensities and contraction at high ones).
Keywords: azobenzene elastomers; networks; photo-deformable polymers; statistical
mechanics; theory
Introduction
Azobenzene elastomers represent crosslinked
polymer systems containing photosensitive
azo-moieties in their chemical structure.[1–13]
These compounds belong to a class of smart
materials which are able to transform the light
energy into mechanical stress. Since the
deformation driven by the light can be
controlled rapidly, precisely and remotely,
azobenzene elastomers have a fascinating
potential for micro- and nano-technologies
serving as artificial muscles, sensors, micro-
robots, micropumps, actuators, etc.[1–13]
Light-induced deformation of azoben-
zene polymers is initiated by the photo-
isomerization process of azobenzene chro-
ibniz Institute of Polymer Research Dresden,
ohe Str. 6, 01069 Dresden, Germany
stitute of Macromolecular Compounds, Bolshoi pr.
, 199004 Saint-Petersburg, Russia
mail: [email protected]
chnische Universitat Dresden, Institut fur Werk-
ffwissenschaft, Helmholtz Str. 7, D-01069 Dresden,
ermany
yright � 2012 WILEY-VCH Verlag GmbH & Co. KGaA
mophores. The chromophores affected by
the light of a proper wavelength are able to
change their shape from the rod-like trans-
state to the bent cis-state.[14–16] One can
distinguish two types of photo-deformable
azobenzene elastomers. The systems of the
first type[3–10] are based on anisotropic
liquid crystalline nematic elastomers with
dispersed azobenzene chromophores in a
network matrix. The rod-like trans-isomers
of the chromophores stabilize the LC
phase, whereas the bent cis-isomers desta-
bilize it. Consequently, trans-cis photoi-
somerization caused by an ultraviolet
illumination induces a transition of the
LC-elastomer from the nematic to isotropic
state, this transition being accompanied by
a uniaxial deformation of a sample with
respect to the LC-director. Theoretical
description of the light-induced deforma-
tion in the materials of such a kind is based
on a modification of the theory of phase
transitions in nematic elastomers, with the
nematic-to-isotropic phase transition being
dependent now on the light intensity.[4,5]
, Weinheim wileyonlinelibrary.com
Macromol. Symp. 2012, 316, 10–16 11
Photo-deformable azobenzene elasto-
mers of the second type are based on
elastomeric matrices which are macroscopi-
cally isotropic.[8,11–13] Under influence of the
linearly polarized light, azobenzene elasto-
mers of this type are deformed along the
electric vector of the light E. Thus, in
contrast to azobenzene polymers based on
nematic elastomers whose direction of
deformation is restricted by the LC-direc-
tor,[3–10] the direction of deformation in
azobenzene elastomers based on isotropic
matrix can be varied by rotating the
polarization vector of the light.[8,11–13] Thus,
investigation of photo-deformable elasto-
mers with variable direction of deformation
is of a special interest. To our knowledge,
there are no theories in the literature which
describe light-induced deformation of iso-
tropic azobenzene elastomers with variable
direction of deformation.
In the present paper we propose a
microscopic statistical theory of light-
induced deformation of isotropic azoben-
zene elastomers affected by uniform linearly
polarized light. The theory is based on the
orientation approach[17–19] which was pro-
posed recently to describe photo-mechanical
properties of isotropic low-molecular-
weight glassy azobenzene polymers built
from short molecules (oligomers) bearing
azobenzene chromophores in side chains.
According to this approach, the light-
induced mechanical stress originates from
reorientation of chromophores with respect
to the polarization vector of the light E. This
reorientation is caused by an anisotropic
character of the trans-cis-trans photoisome-
rization process: maximal probability of the
transition from the rod-like trans-state to the
bent cis-state is achieved at such orientation
of the rod-like chromophore, when its long
axis is parallel to the electric vector of the
light E.[14–16] As a result, after multiple
trans-cis-trans photoisomerization cycles
the number of rod-like chromophores,
which are arranged parallel to the vector
E, becomes lower than the number of
chromophores which are oriented in per-
pendicular direction, i.e. orientation aniso-
tropy appears. The light-induced orientation
Copyright � 2012 WILEY-VCH Verlag GmbH & Co. KGaA
anisotropy can be described by introducing
an effective orientation potential acting on
each chromophore.[20] Recently, we have
shown[17–19] that orientation potential intro-
duced in ref.[20] provides the values of the
light-induced stress, s, higher than the
values of the yield stress typical for glassy
polymers sY � 50MPa at the light intensi-
ties Ip � 1W=cm2 which are usually used in
experiments. At stresses s > sY a polymer
demonstrates an irreversible deformation.
Irreversible light-induced deformation
of glassy azobenzene polymers opens up
the possibility for inscription of surface
relief gratings onto these materials.[21–26]
To explain this possibility some authors
have proposed a concept of the light-
induced softening.[27–33] In this concept it
is assumed that the light of intensity
Ip � 1W=cm2 is able to melt locally a glassy
azobenzene polymer and such a ‘‘molten’’
polymer can be then irreversibly deformed.
However, it was shown recently with the
help of three different experimental tech-
niques[23–26] that illumination with a visible
light does not affect material properties of
an azobenzene polymer such as bulk
compliance, Young modulus and viscosity,
i.e. an azobenzene polymer remains in the
glassy state. Hence, the theories which need
a concept of light-induced softening are not
able to describe correctly the phenomenon.
The orientation approach developed in
refs.[17–19] allowed us to explain for the first
time the possibility of inscription of surface
relief gratings onto glassy azobenzene
polymers avoiding a concept of the light-
induced softening. Moreover, the orienta-
tion approach[17–19] has illustrated that
photo-elastic behavior of azobenzene poly-
mers is very sensitive to their chemical
structure, namely, to orientation distribution
of chromophores around the main chains.
Depending on it, a sample can demonstrate
either expansion or uniaxial contraction
along the polarization direction of the
light. These results are in a qualitative
agreement with experiments[34–37] and com-
puter simulations[38–40] and demonstrate a
great potential strength of the orientation
approach[17–19] for describing the photo-
, Weinheim www.ms-journal.de
Macromol. Symp. 2012, 316, 10–1612
mechanical properties of azobenzene poly-
mers of different chemical structure. In
the present paper, we extend the orienta-
tion approach developed in refs.[17–19]
for glassy uncross-linked azobenzene poly-
mers to cross-linked azobenzene polymers
(elastomers).
Model of an Azobenzene Elastomer and
Main Equations
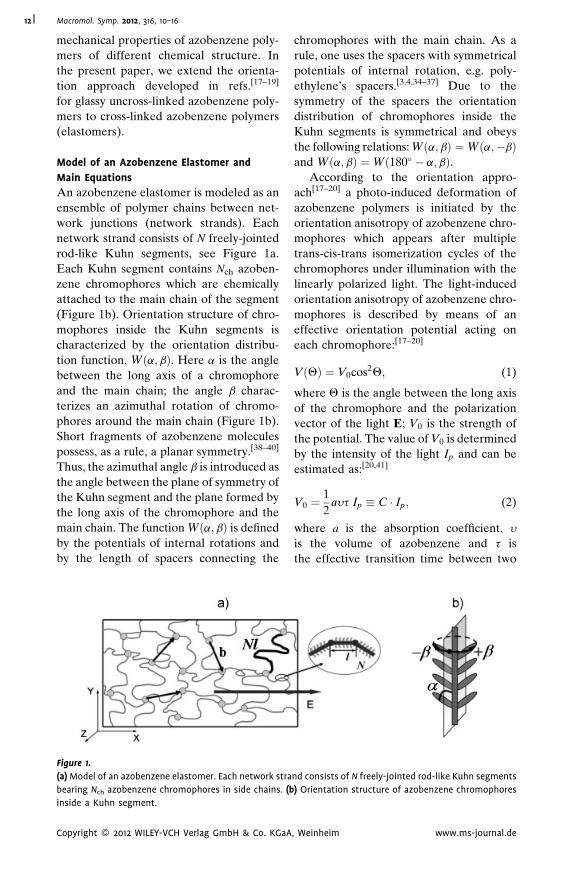
An azobenzene elastomer is modeled as an
ensemble of polymer chains between net-
work junctions (network strands). Each
network strand consists of N freely-jointed
rod-like Kuhn segments, see Figure 1a.
Each Kuhn segment contains Nch azoben-
zene chromophores which are chemically
attached to the main chain of the segment
(Figure 1b). Orientation structure of chro-
mophores inside the Kuhn segments is
characterized by the orientation distribu-
tion function, Wða; bÞ. Here a is the angle
between the long axis of a chromophore
and the main chain; the angle b charac-
terizes an azimuthal rotation of chromo-
phores around the main chain (Figure 1b).
Short fragments of azobenzene molecules
possess, as a rule, a planar symmetry.[38–40]
Thus, the azimuthal angle b is introduced as
the angle between the plane of symmetry of
the Kuhn segment and the plane formed by
the long axis of the chromophore and the
main chain. The function Wða;bÞ is defined
by the potentials of internal rotations and
by the length of spacers connecting the
Figure 1.
(a) Model of an azobenzene elastomer. Each network stra
bearing Nch azobenzene chromophores in side chains. (b
inside a Kuhn segment.
Copyright � 2012 WILEY-VCH Verlag GmbH & Co. KGaA
chromophores with the main chain. As a
rule, one uses the spacers with symmetrical
potentials of internal rotation, e.g. poly-
ethylene’s spacers.[3,4,34–37] Due to the
symmetry of the spacers the orientation
distribution of chromophores inside the
Kuhn segments is symmetrical and obeys
the following relations: Wða;bÞ ¼Wða;�bÞand Wða; bÞ ¼Wð180� � a;bÞ.
According to the orientation appro-
ach[17–20] a photo-induced deformation of
azobenzene polymers is initiated by the
orientation anisotropy of azobenzene chro-
mophores which appears after multiple
trans-cis-trans isomerization cycles of the
chromophores under illumination with the
linearly polarized light. The light-induced
orientation anisotropy of azobenzene chro-
mophores is described by means of an
effective orientation potential acting on
each chromophore:[17–20]
VðQÞ ¼ V0cos2Q; (1)
where Q is the angle between the long axis
of the chromophore and the polarization
vector of the light E; V0 is the strength of
the potential. The value of V0 is determined
by the intensity of the light Ip and can be
estimated as:[20,41]
V0 ¼1
2ayt Ip � C � Ip; (2)
where a is the absorption coefficient, y
is the volume of azobenzene and t is
the effective transition time between two
nd consists of N freely-jointed rod-like Kuhn segments
) Orientation structure of azobenzene chromophores
, Weinheim www.ms-journal.de
Macromol. Symp. 2012, 316, 10–16 13
isomer states. The value of the proportion-
ality constant C at the room temperature
has been estimated in previous works
as C � 10�19J � cm2=W.[20,41]
Under illumination with the linearly
polarized light each Kuhn segment reori-
ents due to the interaction of the chromo-
phores with the light wave. Thus, under
light illumination the network strands
change their conformations, and each
end-to-end vector b is transformed into a
new vector b(. As in a classical theory of
rubber elasticity,[42] we assume that net-
work strands deform affinely with the bulk
deformation of the elastomer because of
the constraints of the crosslinks. Taking
into account the incompressibility for
elastomers, one can write the condition of
affinity of deformation in the following
form:
b0x ¼ bxl; b0y ¼ by=ffiffiffilp
; and
b0z ¼ bz=ffiffiffilp
:(3)
We assume that the electric vector of the
light E is directed along the x-axis, see
Figure 1. Due to the axial symmetry with
respect to the vector E an azobenzene
elastomer demonstrates a uniaxial defor-
mation along the x-axis and l in Eq. (3) is
the elongation ratio of a sample along this
axis. We calculate the light-induced elonga-
tion l using the Gaussian approach for the
statistics of network strands. The distribu-
tion of the end-to-end vectors b0 of network
strands in a deformed elastomer can be
written in the framework of the Gaussian
approach as follows:
Pðb0Þ ¼ Cexp
"� ðb0xÞ
2
2hðb0xÞ2i
þðb0yÞ
2
2hðb0yÞ2iþðb0zÞ
2
2hðb0zÞ2i
!#;
(4)
where C is a normalization constant, and
hðb0xÞ2i; hðb0yÞ
2i and hðb0zÞ2i are the mean-
square projections of the network strands
on the x, y, and z-axes. Their values can be
expressed in terms of the averaged projec-
Copyright � 2012 WILEY-VCH Verlag GmbH & Co. KGaA
tions of the Kuhn segments on these
axes, hl2ai:
hðb0aÞ2i ¼ Nhl2
ai for a ¼ x; y; z: (5)
Now, it is a simple matter to find the
light-induced elongation l as a function of
the light intensity using the equation for the
free energy F (per a network strand):
FðlÞ ¼ �kT lnPðb0Þh i; (6)
where the averaging is performed over all
strands. Substituting Eq. (4) into Eq. (6)
and using the relationship between vectors
b and b( given by Eq. (3) we obtain the
following expression for FðlÞ:
FðlÞ ¼ kT
6
l2l2
hl2xiþ 2l2l�1
hl2yi
" #: (7)
Here we have used the axial symmetry
of an elastomer with respect to the vector
E: hl2yi ¼ hl2
zi, as well as the equality
hb2xi ¼ hb2
yi ¼ hb2zi ¼ Nl2=3 for an isotropic
elastomer at the absence of external fields.
The equilibrium value of the light-induced
elongation l is determined from the mini-
mum of the free energy, @F=@l ¼ 0, that
gives from Eq. (7):
l ¼ hl2xihl2
yi
!1=3
: (8)
Using Eq. (8) we have calculated the
value of l as a function of the strength of
the potential V0 which is proportional to
the light intensity, see Eq. (2). The aver-
aging in the right-hand side of Eq. 8
is performed over all orientations of the
rod-like Kuhn segments and takes into
account the contribution of the orientation
potential (1) acting on all chromophores
inside the Kuhn segments, as it was
calculated in refs.[17–19] for short rod-like
azobenzene oligomers. Below we show that
the photo-mechanical behavior depends
on the orientation distribution of the
chromophores inside the Kuhn segments
Wða;bÞ.
, Weinheim www.ms-journal.de
Macromol. Symp. 2012, 316, 10–1614
Photo-Mechanical Behavior of Azobenzene
Elastomers Depending on Their Chemical
Structure
Depending on the chemical structure, which
is defined in our approach by the orientation
distribution function of chromophores inside
the Kuhn segments Wða;bÞ, azobenzene
elastomers can demonstrate three types of
photo-mechanical behavior.
I. If 3 sin2a� �
W�2 < 0, the chromo-
phores lie preferably along the main chains.
Orientation of the chromophores perpen-
dicular to the electric field E of the light
results in the orientation of the Kuhn
segments also perpendicular to the vector
E and is accompanied by a uniaxial
contraction of an azobenzene elastomer
with respect to the vector E: l < 1. In this
case the function lðV0Þ decreases mono-
tonically.
II. If 3 sin2a� �
W�2 > sin2acos2b
� �W
�� ��,the chromophores are arranged preferably
perpendicular to the main chains. Orienta-
tion of the chromophores perpendicular to
the electric vector E under light illumina-
tion leads in this case to the orientation of
the Kuhn segments parallel to the vector E
and is accompanied by a uniaxial expansion
of an azobenzene elastomer along the
vector E: l > 1. In this case the function
lðV0Þ increases monotonically.
III. The intermediate case 0 < 3
sin2a� �
W�2 < sin2acos2b
� �W
�� �� corresponds
to the structures with non-monotonic
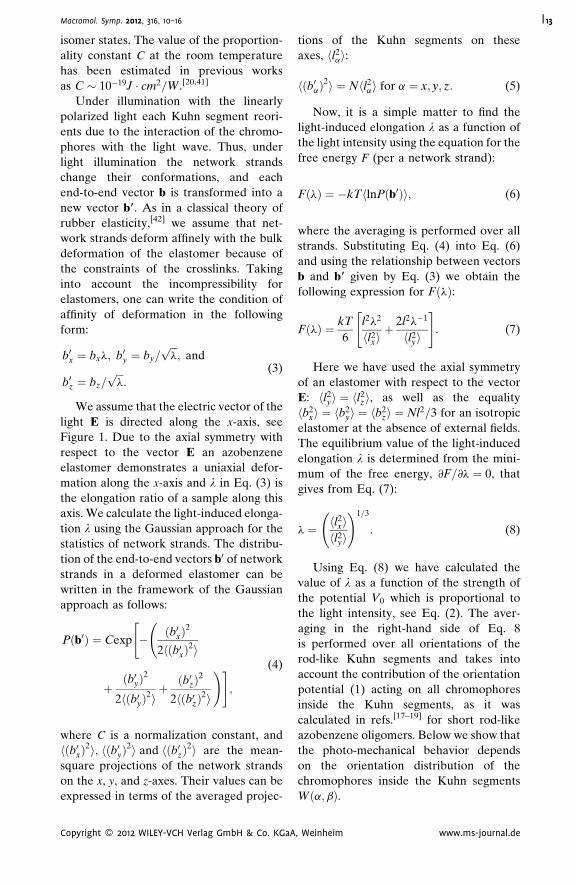
Figure 2.
Dependences of the elongation ratio l on the reduced str
the structural angles a� and b�: (a) b� ¼ 65� is fixed and a
is varied.
Copyright � 2012 WILEY-VCH Verlag GmbH & Co. KGaA
dependence of the light-induced elongation
as a function of the strength of the potential
V0: lðV0Þ increases at small values of V0
and decreases at large values of V0.
To illustrate these three types of photo-
mechanical behavior of azobenzene elasto-
mers, we have calculated the dependences
lðV0Þ for elastomers, whose structural angles
a and b are fixed at equiprobable values
b ¼ �b� and a ¼ a�; 180� � a�, the values
a� and b� being variables. The dependences
lðV0Þ have been calculated numerically by
means of Eq. (8). Figure 2a and 2b illustrate
the dependences lðV0Þ for different values
of a� and b�. The results of numerical
calculations show three types of photo-
mechanical behavior of azobenzene elasto-
mers in accordance with qualitative con-
siderations presented above:
I uniaxial contraction, l < 1 (open
symbols in Figure 2), II uniaxial expansion,
l > 1 (filled symbols in Figure 2) and III
non-monotonic dependence of l on V0
(semi-open symbols in Figure 2). Thus,
azobenzene elastomers, as low-molecular-
weight glassy azobenzene polymers,[17–19]
can demonstrate different signs of light-
induced deformation (expansion/contraction/
non-monotonical behavior). Conclusion
about different signs of light-induced defor-
mation of low-molecular-weight glassy
azobenzene polymers has been confirmed
experimentally[34–37] and by means of com-
puter simulations.[38–40]
ength of the potential, NchV0=kT, at different values of
� is varied, (b) a� ¼ 50� and a� ¼ 70� are fixed and b�
, Weinheim www.ms-journal.de
Macromol. Symp. 2012, 316, 10–16 15
We conclude by noting that at very large
degrees of deformation the finite extensi-
bility of network strands can strongly
influence the photo-mechanical behavior
of azobenzene elastomers. One can expect
that at high light intensities the elongation ltends to its limiting value which depends on
the length of network strands: the shorter
are the chains between junctions, the
smaller is the elongation l at the same
light intensity. The Gaussian approach used
here is not able to describe the effects of
finite extensibility of network strands.
More detailed analysis of the effects of
finite extensibility of network strands on
the photo-mechanical behavior of azoben-
zene elastomers can be a topic of further
generalizations.
Conclusion
Thus, we have proposed a theory of light-
induced deformation of azobenzene elasto-
mers under illumination with uniform and
linearly polarized light. The theory is based
on the orientation statistical approach, acco-
rding to which the photo-induced mechanical
stress originates from the preferable reor-
ientation of the azobenzene chromophores
perpendicular to the electric vector of the
light. Using the Gaussian approximation for
elasticity of network strands the light-induced
elongation has been calculated as a function
of the light intensity for elastomers of
different chemical structure, which is defined
in our model by the orientation distribution
of the chromophores around the main chains.
It is shown that depending on the chemical
structure azobenzene elastomers can demon-
strate either uniaxial contraction or expan-
sion along the polarization vector of the
light. For some chemical structures, elonga-
tion of a sample displays a non-monotonic
behavior with the light intensity and can even
change its sign: a stretched sample starts
to be uniaxially compressed. Thus, we have
extended the orientation approach devel-
oped in refs.[17–19] for uncrosslinked glassy
azobenzene polymer to crosslinked azoben-
zene elastomers.
Copyright � 2012 WILEY-VCH Verlag GmbH & Co. KGaA
Acknowledgements: The financial support ofthe DFG grant GR 3725/2-1 is gratefullyacknowledged.
[1] C. D. Eisenbach, Polymer 1980, 21, 1175.
[2] S. Xie, A. Natansohn, A. P. Rochon, Chem. Mater.
1993, 5, 403.
[3] H. Finkelmann, E. Nishikawa, G. G. Pereira,
M. Warner, Phys. Rev. Lett. 2001, 87, 015501.
[4] P. M. Hogan, A. R. Tajbakhsh, E. M. Terentjev, Phys.
Rev. E 2002, 65, 041720.
[5] M. Warner, E. Terentjev, Macromol. Symp. 2003,
200, 81.
[6] M.-H. Li, P. Keller, B. Li, X. Wang, M. Brunet, Adv.
Mater. 2003, 15, 569.
[7] T. Ikeda, M. Nakano, Y. Yu, O. Tsutsumi,
A. Kanazawa, Adv. Mater. 2003, 15, 201.
[8] Y. Yu, M. Nakano, T. Ikeda, Pure Appl. Chem. 2004,
76, 1467.
[9] Y. Yu, M. Nakano, A. Shishido, T. Shiono, T. Ikeda,
Chem. Mater. 2004, 16, 1637.
[10] M. Camacho-Lopez, H. Finkelmann, P. Palffy-
Muhoray, M. Shelley, Nature Mater. 2004, 3, 307.
[11] Y. Yu, M. Nakano, T. Ikeda, Nature 2003, 425, 145.
[12] Y. Yu, T. Ikeda, Macromol. Chem. Phys. 2005, 206,
1705.
[13] H. Jiang, S. Kelch, A. Lendlein, Adv. Mater. 2006, 18,
1471.
[14] T. Geue, A. Ziegler, J. Stumpe, Macromolecules
1997, 30, 5729.
[15] C. C. Jung, R. Rosenhauer, M. Rutloh, C. Kempe,
J. Stumpe, Macromolecules 2005, 38, 4324.
[16] C. Kullina, S. Hvilsted, C. Hendann, H. W. Siesler,
P. S. Ramanujam, Macromolecules 1998, 31, 2141.
[17] V. Toshchevikov, M. Saphiannikova, G. Heinrich,
Journal of Physical Chemistry B 2009, 113, 5032.
[18] V. Toshchevikov, M. Saphiannikova, G. Heinrich,
‘‘Theory of light-induced deformations in azobenzene
polymers: structure-property relationship’’, Proc. SPIE
2009, Vol. 7487, 74870B.1.
[19] M. Saphiannikova, V. Toshchevikov, J. Ilnytskyi,
Nonlinear Optics and Quantum Optics 2010, 41, 27.
[20] V. Chigrinov, S. Pikin, A. Verevochnikov,
V. Kozenkov, M. Khazimullin, J. Ho, D. D. Huang,
H. S. Kwok, Phys. Rev. E 2004, 69, 061713.
[21] P. Rochon, E. Batalla, A. Natansohn, Appl. Phys.
Lett. 1995, 66, 136.
[22] D. Y. Kim, S. K. Tripathy, L. Li, J. Kumar, Appl. Phys.
Lett. 1995, 66, 1166.
[23] M. Grenzer, ‘‘Photoinduced material transport in
amorphous azobenzene polymer films’’, Habilitation
thesis, Potsdam University, Potsdam 2007.
[24] N. Mechau, M. Saphiannikova, D. Neher, Macro-
molecules 2005, 38, 3894.
[25] N. Mechau, M. Saphiannikova, D. Neher, Appl.
Phys. Lett. 2006, 89, 251902.
, Weinheim www.ms-journal.de
Macromol. Symp. 2012, 316, 10–1616
[26] K. G. Yager, C. J. Barrett, Macromolecules 2006, 39,
9320.
[27] J. Kumar, L. Li, X. L. Jiang, D.-Y. Kim, T. S. Lee,
S. Tripathy, Appl. Phys. Lett. 1998, 72, 2096.
[28] C. J. Barrett, P. L. Rochon, A. L. Natansohn, J. Chem.
Phys. 1998, 109, 1505.
[29] P. Lefin, C. Fiorini, J.-M. Nunzi, Pure Appl. Opt.
1998, 7, 71.
[30] T. G. Pedersen, P. M. Johansen, N. C. R. Holme,
P. S. Ramanujam, S. Hvilsted, Phys. Rev. Lett. 1998, 80,
89.
[31] O. Baldus, S. J. Zilker, Appl. Phys. B 2001, 72,
425.
[32] Y. B. Gaididei, P. L. Christiansen, P. S. Ramanujam,
Appl. Phys. B 2002, 74, 139.
[33] J. D. Lee, M. J. Kim, T. Nakayama, Langmiur 2008,
24, 4260.
[34] D. Bublitz, M. Helgert, B. Fleck, L. Wenke,
S. Hvilstedt, P. S. Ramanujam, Appl. Phys. B 2000,
70, 863.
Copyright � 2012 WILEY-VCH Verlag GmbH & Co. KGaA
[35] S. Bian, J. M. Williams, D. Y. Kim, L. Li,
S. Balasubramanian, J. Kumar, S. Tripathy, J. Appl.
Phys. 1999, 86, 4498.
[36] T. Fukuda, H. Matsuda, T. Shiraga, T. Kimura,
M. Kato, N. K. Viswanathan, J. Kumar, S. K. Tripathy,
Macromolecules 2000, 33, 4220.
[37] F. Fabbri, D. Garrot, K. Lahlil, J. P. Boilot,
Y. Lassailly, J. Peretti, J. Phys. Chem. B. 2011, 115, 1363.
[38] J. Ilnytskyi, M. Saphiannikova, D. Neher, Cond.
Matter Phys. 2006, 9, 87.
[39] J. Ilnytskyi, D. Neher, M. Saphiannikova, M. R.
Wilson, L. Stimson, Mol. Cryst. Liq. Cryst. 2008, 496,
186.
[40] J. Ilnytskyi, D. Neher, M. Saphiannikova, J. Chem.
Phys. 2011, 135, 044901.
[41] P. U. Veer, U. Pietsch, P. L. Rochon,
M. Saphiannikova, Mol. Cryst. Liq. Cryst. 2008, 486,
1108.
[42] L. R. G. Treloar, ‘‘The Physics of Rubber Elasticity’’,
2nd edition, Clarendon press, Oxford 1958, p. 343.
, Weinheim www.ms-journal.de
Macromol. Symp. 2012, 316, 17–24 DOI: 10.1002/masy.201250603 17
Phys
Ulya
Fax:
E-m
Cop
Effect of Chemical Structure and Charge Distribution
on Behavior of Polyzwitterions in Solution
A. A. Lezov, P. S. Vlasov, G. E. Polushina, A. V. Lezov*
Summary: The hydrodynamic and conformational properties of polyelectrolyte
poly(N,N-diallyl-N,N-dimethylammonium chloride) and its corresponding polybetaine
poly(2-diallyl(methyl)ammonio)acetate) molecules in aqueous solutions with various
ionic strength and pH, were studied by viscometry, static and dynamic light
scattering methods. It was established that a 1 M NaCl solution is a thermo-
dynamically good solvent for poly(N,N-diallyl-N,N-dimethylammonium chloride). In
water solutions conformation of poly(2-diallyl(methyl)ammonio)acetate) molecules
corresponds to polymer coil under u–conditions. An increase in the concentration of
NaCl in water and 0.1M NaOH solutions from 0 to 1 mol/l brings about a sharp gain in
the intrinsic viscosity of the polymer and in the hydrodynamic radius of molecules.
This effect results from the decomposition of zwitterion pairs responsible for the
compact conformation of polymer molecules in water and 0.1 M NaOH. The Kuhn
segment length for poly(2-diallyl(methyl)ammonio)acetate) molecules A¼ 6.3 nm
determined in water and in 0.1 M NaOH solutions practically coincided with A value
6.6 nm, received in 1 M NaCl and in 0.1 M NaOH/1M NaCl. For poly(N,N-diallyl-N,N-
dimethylammonium chloride) molecules in 1 M NaCl solutions A¼ 3.9 nm.
Keywords: conformation; macromolecule; polyelectrolyte; polyzwitterion
Introduction
Ionic macromolecules have an ability to
change conformation as a response to
variations in the ionic strength and pH of
solution. Polymers containing ionic groups
may be divided into two classes, polyelec-
trolytes and polyzwitterions.[1–8] Polyelec-
trolytes contain anionic or cationic groups,
while polyzwitterions contain both anionic
and cationic groups.
Polyzwitterions includes both polyam-
pholytes and polybetaines.[1] Polyampho-
lyte contain the charged groups on different
monomer units, while polybetaine refers to
those polymers with the anionic and
cationic groups on the same monomer unit.
While the polyelectrolytes are usually
soluble in water, many from polyzwitter-
ical Faculty of Saint-Petersburg State University,
novskaya 1, 198504 Saint-Petersburg, Russia
(þ7)8124287598;
ail: [email protected]
yright � 2012 WILEY-VCH Verlag GmbH & Co. KGaA
ions to be insoluble in water due to the
strong electrostatic attraction between the
oppositely charged monomers that leads to
the collapsed coil conformation of the
molecules. The range of solubility in
different solvents is greater for phospho-
and carboxybetaines than it is for sulfobe-
taines. Polycarboxybetaines exhibit more
varied aqueous solution behavior because
of the weak acid nature of the carboxylic
acid group.[1,9,10]
The presence of an inorganic salt, which
screens the interactions and weakens
attractions, causes the dissolution of the
polymer. Thus, the solution behavior of
polyzwitterions is opposite that of poly-
electrolytes, exhibiting the so-called ‘‘anti-
polyelectrolyte’’ effect.[6,7] Polyzwitterions
have found applications in various fields
that include biosensors, ion exchange,
model for understanding the complex
behavior of proteins.
Recently a new type of pH- responsive
polymers containing amino acid residues
, Weinheim wileyonlinelibrary.com
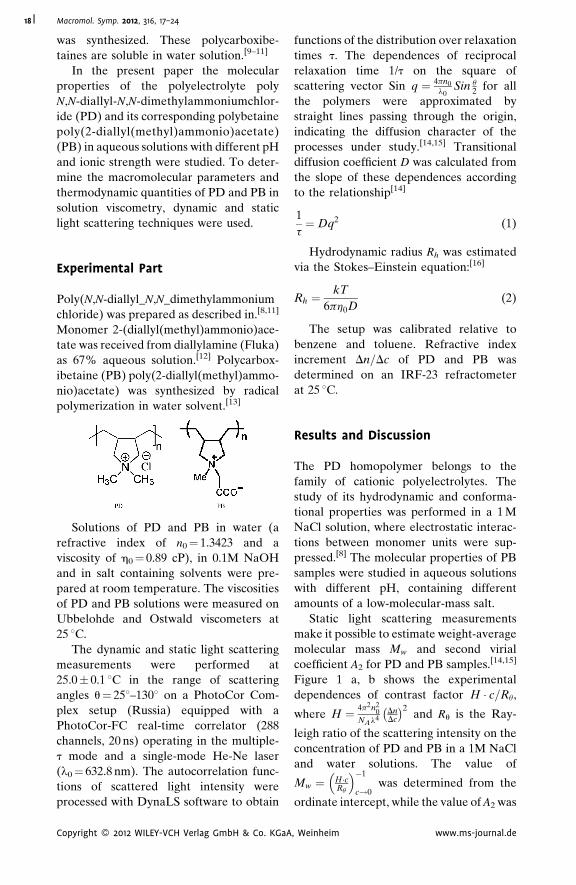
Macromol. Symp. 2012, 316, 17–2418
was synthesized. These polycarboxibe-
taines are soluble in water solution.[9–11]
In the present paper the molecular
properties of the polyelectrolyte poly
N,N-diallyl-N,N-dimethylammoniumchlor-
ide (PD) and its corresponding polybetaine
poly(2-diallyl(methyl)ammonio)acetate)
(PB) in aqueous solutions with different pH
and ionic strength were studied. To deter-
mine the macromolecular parameters and
thermodynamic quantities of PD and PB in
solution viscometry, dynamic and static
light scattering techniques were used.
Experimental Part
Poly(N,N-diallyl_N,N_dimethylammonium
chloride) was prepared as described in.[8,11]
Monomer 2-(diallyl(methyl)ammonio)ace-
tate was received from diallylamine (Fluka)
as 67% aqueous solution.[12] Polycarbox-
ibetaine (PB) poly(2-diallyl(methyl)ammo-
nio)acetate) was synthesized by radical
polymerization in water solvent.[13]
Solutions of PD and PB in water (a
refractive index of n0¼ 1.3423 and a
viscosity of h0¼ 0.89 cP), in 0.1M NaOH
and in salt containing solvents were pre-
pared at room temperature. The viscosities
of PD and PB solutions were measured on
Ubbelohde and Ostwald viscometers at
25 8C.
The dynamic and static light scattering
measurements were performed at
25.0� 0.1 8C in the range of scattering
angles u¼ 258–1308 on a PhotoCor Com-
plex setup (Russia) equipped with a
PhotoCor-FC real-time correlator (288
channels, 20 ns) operating in the multiple-
t mode and a single-mode He-Ne laser
(l0¼ 632.8 nm). The autocorrelation func-
tions of scattered light intensity were
processed with DynaLS software to obtain
Copyright � 2012 WILEY-VCH Verlag GmbH & Co. KGaA
functions of the distribution over relaxation
times t. The dependences of reciprocal
relaxation time 1/t on the square of
scattering vector Sin q ¼ 4pn0l0
Sin u2 for all
the polymers were approximated by
straight lines passing through the origin,
indicating the diffusion character of the
processes under study.[14,15] Transitional
diffusion coefficient D was calculated from
the slope of these dependences according
to the relationship[14]
1
t¼ Dq2 (1)
Hydrodynamic radius Rh was estimated
via the Stokes–Einstein equation:[16]
Rh ¼kT
6ph0D(2)
The setup was calibrated relative to
benzene and toluene. Refractive index
increment Dn=Dc of PD and PB was
determined on an IRF-23 refractometer
at 25 8C.
Results and Discussion
The PD homopolymer belongs to the
family of cationic polyelectrolytes. The
study of its hydrodynamic and conforma-
tional properties was performed in a 1 M
NaCl solution, where electrostatic interac-
tions between monomer units were sup-
pressed.[8] The molecular properties of PB
samples were studied in aqueous solutions
with different pH, containing different
amounts of a low-molecular-mass salt.
Static light scattering measurements
make it possible to estimate weight-average
molecular mass Mw and second virial
coefficient A2 for PD and PB samples.[14,15]
Figure 1 a, b shows the experimental
dependences of contrast factor H � c=Ru,
where H ¼ 4p2n20
NAl4DnDc
� �2and Ru is the Ray-
leigh ratio of the scattering intensity on the
concentration of PD and PB in a 1M NaCl
and water solutions. The value of
Mw ¼ H�cRu
� ��1
c!0was determined from the
ordinate intercept, while the value of A2 was
, Weinheim www.ms-journal.de
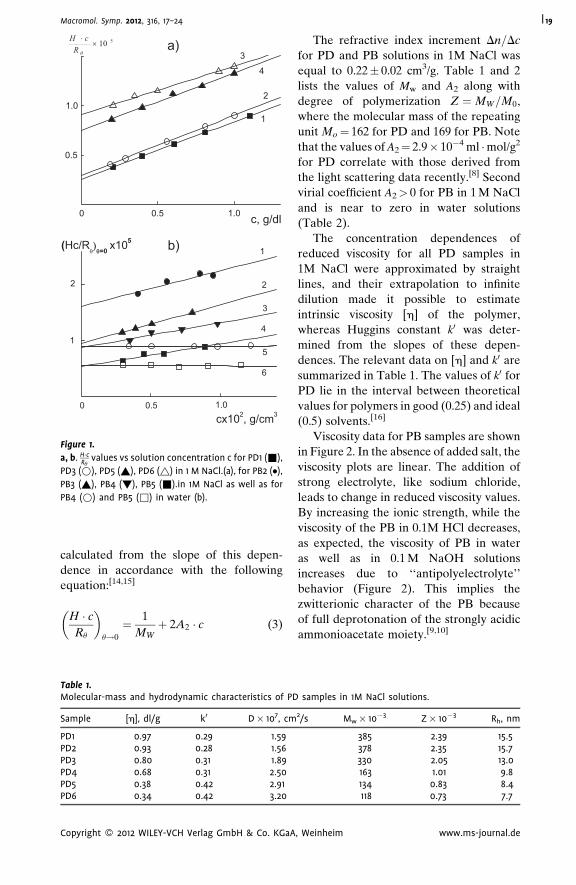
c, g/dl
510×⋅
θRcH
1.0
0.5
0.50 1.0
1
2
3
4
a)
(Hc/Rθ)
θ=0 x105
0.50 1.0
cx102, g/сm3
1
2
1
2
3
4
5
6
b)
Figure 1.
a, b. H�cRu
values vs solution concentration c for PD1 (&),
PD3 (*), PD5 (~), PD6 (~) in 1 M NaCl.(a), for PB2 (�),PB3 (~), PB4 (!), PB5 (&).in 1M NaCl as well as for
PB4 (*) and PB5 (&) in water (b).
Macromol. Symp. 2012, 316, 17–24 19
calculated from the slope of this depen-
dence in accordance with the following
equation:[14,15]
H � cRu
� �u!0
¼ 1
MWþ 2A2 � c (3)
Table 1.Molecular-mass and hydrodynamic characteristics of PD
Sample [h], dl/g k0 D� 107, cm
PD1 0.97 0.29 1.59PD2 0.93 0.28 1.56PD3 0.80 0.31 1.89PD4 0.68 0.31 2.50PD5 0.38 0.42 2.91PD6 0.34 0.42 3.20
Copyright � 2012 WILEY-VCH Verlag GmbH & Co. KGaA
The refractive index increment Dn=Dc
for PD and PB solutions in 1M NaCl was
equal to 0.22� 0.02 cm3/g. Table 1 and 2
lists the values of Mw and A2 along with
degree of polymerization Z ¼MW=M0,
where the molecular mass of the repeating
unit Mo¼ 162 for PD and 169 for PB. Note
that the values of A2¼ 2.9� 10�4 ml �mol/g2
for PD correlate with those derived from
the light scattering data recently.[8] Second
virial coefficient A2> 0 for PB in 1 M NaCl
and is near to zero in water solutions
(Table 2).
The concentration dependences of
reduced viscosity for all PD samples in
1M NaCl were approximated by straight
lines, and their extrapolation to infinite
dilution made it possible to estimate
intrinsic viscosity [h] of the polymer,
whereas Huggins constant k0 was deter-
mined from the slopes of these depen-
dences. The relevant data on [h] and k0 are
summarized in Table 1. The values of k0 for
PD lie in the interval between theoretical
values for polymers in good (0.25) and ideal
(0.5) solvents.[16]
Viscosity data for PB samples are shown
in Figure 2. In the absence of added salt, the
viscosity plots are linear. The addition of
strong electrolyte, like sodium chloride,
leads to change in reduced viscosity values.
By increasing the ionic strength, while the
viscosity of the PB in 0.1M HCl decreases,
as expected, the viscosity of PB in water
as well as in 0.1 M NaOH solutions
increases due to ‘‘antipolyelectrolyte’’
behavior (Figure 2). This implies the
zwitterionic character of the PB because
of full deprotonation of the strongly acidic
ammonioacetate moiety.[9,10]
samples in 1M NaCl solutions.
2/s Mw� 10�3 Z� 10�3 Rh, nm
385 2.39 15.5378 2.35 15.7330 2.05 13.0163 1.01 9.8134 0.83 8.4118 0.73 7.7
, Weinheim www.ms-journal.de
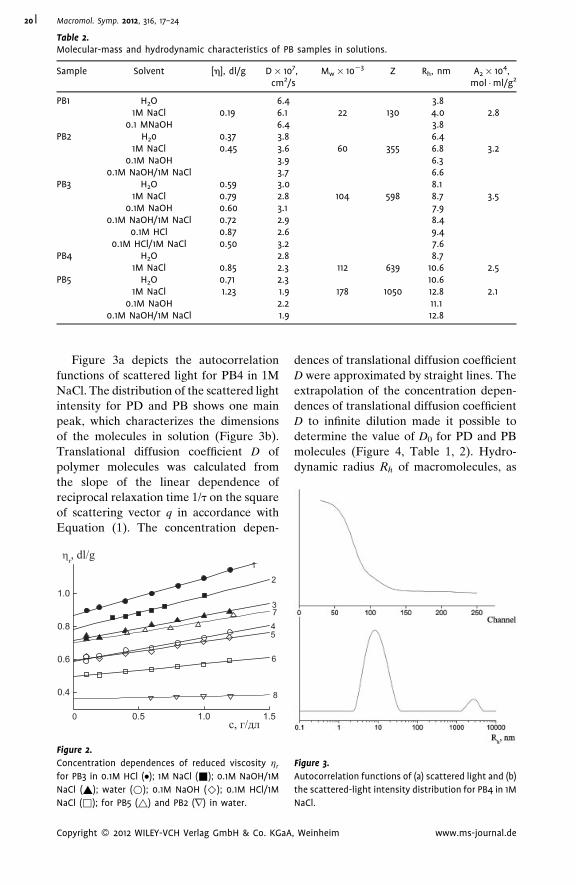
Table 2.Molecular-mass and hydrodynamic characteristics of PB samples in solutions.
Sample Solvent [h], dl/g D� 107,cm2/s
Mw� 10�3 Z Rh, nm A2� 104,mol �ml/g2
PB1 H2O 6.4 3.81M NaCl 0.19 6.1 22 130 4.0 2.8
0.1 MNaOH 6.4 3.8PB2 H20 0.37 3.8 6.4
1M NaCl 0.45 3.6 60 355 6.8 3.20.1M NaOH 3.9 6.3
0.1M NaOH/1M NaCl 3.7 6.6PB3 H2O 0.59 3.0 8.1
1M NaCl 0.79 2.8 104 598 8.7 3.50.1M NaOH 0.60 3.1 7.9
0.1M NaOH/1M NaCl 0.72 2.9 8.40.1M HCl 0.87 2.6 9.4
0.1M HCl/1M NaCl 0.50 3.2 7.6PB4 H2O 2.8 8.7
1M NaCl 0.85 2.3 112 639 10.6 2.5PB5 H2O 0.71 2.3 10.6
1M NaCl 1.23 1.9 178 1050 12.8 2.10.1M NaOH 2.2 11.1
0.1M NaOH/1M NaCl 1.9 12.8
Macromol. Symp. 2012, 316, 17–2420
Figure 3a depicts the autocorrelation
functions of scattered light for PB4 in 1M
NaCl. The distribution of the scattered light
intensity for PD and PB shows one main
peak, which characterizes the dimensions
of the molecules in solution (Figure 3b).
Translational diffusion coefficient D of
polymer molecules was calculated from
the slope of the linear dependence of
reciprocal relaxation time 1/t on the square
of scattering vector q in accordance with
Equation (1). The concentration depen-
1.51.00.5
0.4
0.6
0.8
1.0
7
8
6
54
3
c, г/дл
ηr, dl/g
0
1
2
Figure 2.
Concentration dependences of reduced viscosity hr
for PB3 in 0.1M HCl (�); 1M NaCl (&); 0.1M NaOH/1M
NaCl (~); water (*); 0.1M NaOH (^); 0.1M HCl/1M
NaCl (&); for PB5 (~) and PB2 (r) in water.
Copyright � 2012 WILEY-VCH Verlag GmbH & Co. KGaA
dences of translational diffusion coefficient
D were approximated by straight lines. The
extrapolation of the concentration depen-
dences of translational diffusion coefficient
D to infinite dilution made it possible to
determine the value of D0 for PD and PB
molecules (Figure 4, Table 1, 2). Hydro-
dynamic radius Rh of macromolecules, as
Figure 3.
Autocorrelation functions of (a) scattered light and (b)
the scattered-light intensity distribution for PB4 in 1M
NaCl.
, Weinheim www.ms-journal.de
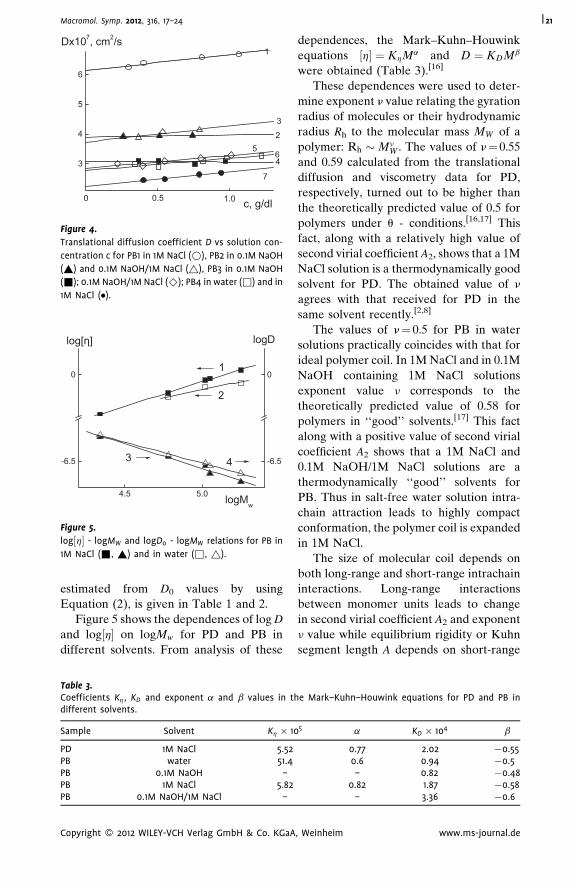
3
4
5
6
0 0.5 1.0 c, g/dl
Dx107, сm2/s1
2
3
45
6
7
Figure 4.
Translational diffusion coefficient D vs solution con-
centration c for PB1 in 1M NaCl (*), PB2 in 0.1M NaOH
(~) and 0.1M NaOH/1M NaCl (~), PB3 in 0.1M NaOH
(&); 0.1M NaOH/1M NaCl (^); PB4 in water (&) and in
1M NaCl (�).
5.04.5
-6.5
0
-6.5
01
2
3 4
logMw
log[η] logD
Figure 5.
log½h� - logMW and logD0 - logMW relations for PB in
1M NaCl (&, ~) and in water (&, ~).
Macromol. Symp. 2012, 316, 17–24 21
estimated from D0 values by using
Equation (2), is given in Table 1 and 2.
Figure 5 shows the dependences of log D
and log½h� on logMw for PD and PB in
different solvents. From analysis of these
Table 3.Coefficients Kh, KD and exponent a and b values in thdifferent solvents.
Sample Solvent Kh � 10
PD 1M NaCl 5.52PB water 51.4PB 0.1M NaOH –PB 1M NaCl 5.82PB 0.1M NaOH/1M NaCl –
Copyright � 2012 WILEY-VCH Verlag GmbH & Co. KGaA
dependences, the Mark–Kuhn–Houwink
equations ½h� ¼ KhMa and D ¼ KDMb
were obtained (Table 3).[16]
These dependences were used to deter-
mine exponent n value relating the gyration
radius of molecules or their hydrodynamic
radius Rh to the molecular mass MW of a
polymer: Rh �MnW . The values of n¼ 0.55
and 0.59 calculated from the translational
diffusion and viscometry data for PD,
respectively, turned out to be higher than
the theoretically predicted value of 0.5 for
polymers under u - conditions.[16,17] This
fact, along with a relatively high value of
second virial coefficient A2, shows that a 1M
NaCl solution is a thermodynamically good
solvent for PD. The obtained value of n
agrees with that received for PD in the
same solvent recently.[2,8]
The values of n¼ 0.5 for PB in water
solutions practically coincides with that for
ideal polymer coil. In 1M NaCl and in 0.1M
NaOH containing 1M NaCl solutions
exponent value n corresponds to the
theoretically predicted value of 0.58 for
polymers in ‘‘good’’ solvents.[17] This fact
along with a positive value of second virial
coefficient A2 shows that a 1M NaCl and
0.1M NaOH/1M NaCl solutions are a
thermodynamically ‘‘good’’ solvents for
PB. Thus in salt-free water solution intra-
chain attraction leads to highly compact
conformation, the polymer coil is expanded
in 1M NaCl.
The size of molecular coil depends on
both long-range and short-range intrachain
interactions. Long-range interactions
between monomer units leads to change
in second virial coefficient A2 and exponent
n value while equilibrium rigidity or Kuhn
segment length A depends on short-range
e Mark–Kuhn–Houwink equations for PD and PB in
5 a KD � 104 b
0.77 2.02 �0.550.6 0.94 �0.5– 0.82 �0.48
0.82 1.87 �0.58– 3.36 �0.6
, Weinheim www.ms-journal.de
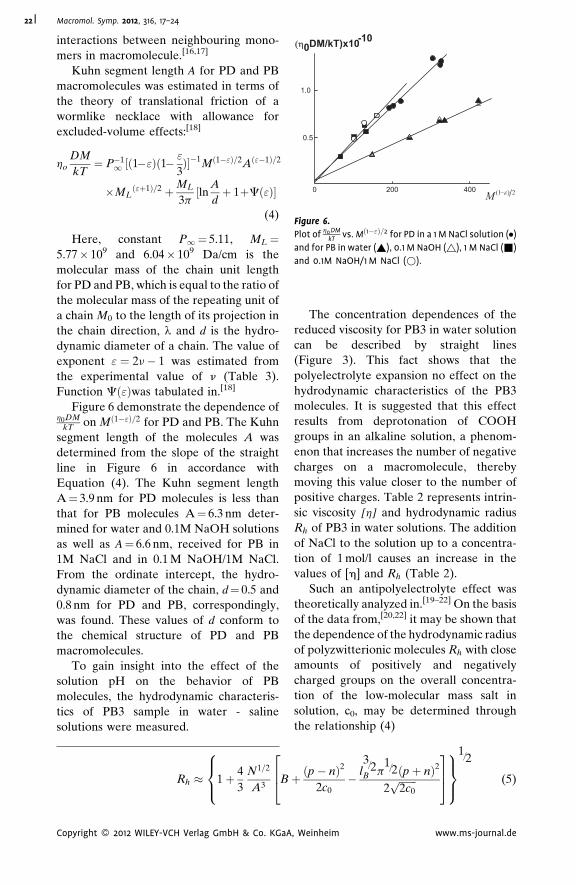
4002000 2)(1 ε−M
(η0DM/kT)x10-10
0.5
1.0
Figure 6.
Plot of h0DMkT
vs. Mð1�"Þ=2 for PD in a 1 M NaCl solution (�)and for PB in water (~), 0.1 M NaOH (~), 1 M NaCl (&)
and 0.1M NaOH/1 M NaCl (*).
Macromol. Symp. 2012, 316, 17–2422
interactions between neighbouring mono-
mers in macromolecule.[16,17]
Kuhn segment length A for PD and PB
macromolecules was estimated in terms of
the theory of translational friction of a
wormlike necklace with allowance for
excluded-volume effects:[18]
ho
DM
kT¼ P�1
1 ½ð1�"Þð1�"
3Þ��1Mð1�"Þ=2Að"�1Þ=2
�MLð"þ1Þ=2 þML
3p½ln A
dþ 1þCð"Þ�
(4)
Here, constant P1 ¼ 5.11, ML¼5.77� 109 and 6.04� 109 Da/cm is the
molecular mass of the chain unit length
for PD and PB, which is equal to the ratio of
the molecular mass of the repeating unit of
a chain M0 to the length of its projection in
the chain direction, l and d is the hydro-
dynamic diameter of a chain. The value of
exponent " ¼ 2n� 1 was estimated from
the experimental value of n (Table 3).
Function Cð"Þwas tabulated in.[18]
Figure 6 demonstrate the dependence ofh0DM
kT on Mð1�"Þ=2 for PD and PB. The Kuhn
segment length of the molecules A was
determined from the slope of the straight
line in Figure 6 in accordance with
Equation (4). The Kuhn segment length
A¼ 3.9 nm for PD molecules is less than
that for PB molecules A¼ 6.3 nm deter-
mined for water and 0.1M NaOH solutions
as well as A¼ 6.6 nm, received for PB in
1M NaCl and in 0.1 M NaOH/1M NaCl.
From the ordinate intercept, the hydro-
dynamic diameter of the chain, d¼ 0.5 and
0.8 nm for PD and PB, correspondingly,
was found. These values of d conform to
the chemical structure of PD and PB
macromolecules.
To gain insight into the effect of the
solution pH on the behavior of PB
molecules, the hydrodynamic characteris-
tics of PB3 sample in water - saline
solutions were measured.
Rh � 1þ 4
3
N1=2
A3B
264
8><>:
Copyright � 2012 WILEY-VCH Verlag GmbH & Co. KGaA
The concentration dependences of the
reduced viscosity for PB3 in water solution
can be described by straight lines
(Figure 3). This fact shows that the
polyelectrolyte expansion no effect on the
hydrodynamic characteristics of the PB3
molecules. It is suggested that this effect
results from deprotonation of COOH
groups in an alkaline solution, a phenom-
enon that increases the number of negative
charges on a macromolecule, thereby
moving this value closer to the number of
positive charges. Table 2 represents intrin-
sic viscosity [h] and hydrodynamic radius
Rh of PB3 in water solutions. The addition
of NaCl to the solution up to a concentra-
tion of 1 mol/l causes an increase in the
values of [h] and Rh (Table 2).
Such an antipolyelectrolyte effect was
theoretically analyzed in.[19–22] On the basis
of the data from,[20,22] it may be shown that
the dependence of the hydrodynamic radius
of polyzwitterionic molecules Rh with close
amounts of positively and negatively
charged groups on the overall concentra-
tion of the low-molecular mass salt in
solution, c0, may be determined through
the relationship (4)
þ ðp� nÞ2
2c0� l
3=2B p
1=2ðpþ nÞ2
2ffiffiffiffiffiffiffi2c0
p
3759>=>;
1=2
(5)
, Weinheim www.ms-journal.de
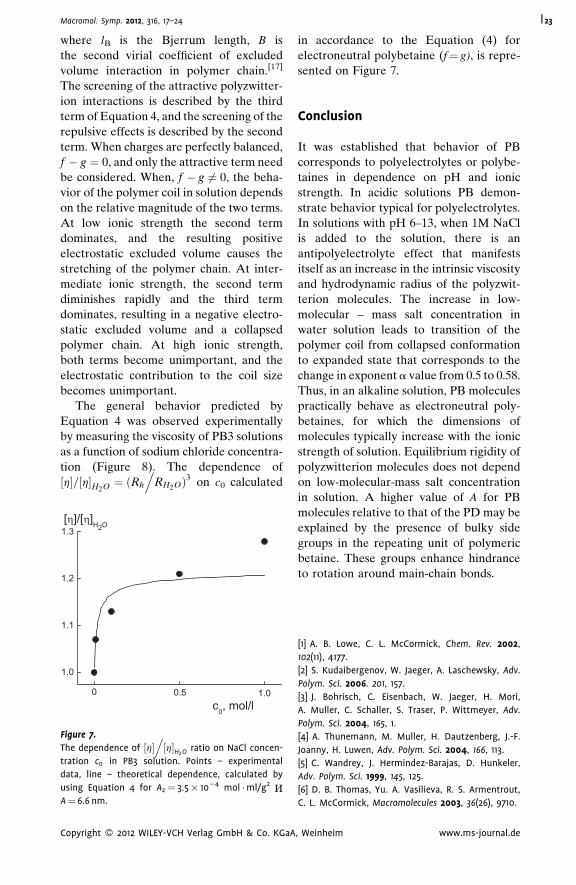
Macromol. Symp. 2012, 316, 17–24 23
where lB is the Bjerrum length, B is
the second virial coefficient of excluded
volume interaction in polymer chain.[17]
The screening of the attractive polyzwitter-
ion interactions is described by the third
term of Equation 4, and the screening of the
repulsive effects is described by the second
term. When charges are perfectly balanced,
f � g ¼ 0, and only the attractive term need
be considered. When, f � g 6¼ 0, the beha-
vior of the polymer coil in solution depends
on the relative magnitude of the two terms.
At low ionic strength the second term
dominates, and the resulting positive
electrostatic excluded volume causes the
stretching of the polymer chain. At inter-
mediate ionic strength, the second term
diminishes rapidly and the third term
dominates, resulting in a negative electro-
static excluded volume and a collapsed
polymer chain. At high ionic strength,
both terms become unimportant, and the
electrostatic contribution to the coil size
becomes unimportant.
The general behavior predicted by
Equation 4 was observed experimentally
by measuring the viscosity of PB3 solutions
as a function of sodium chloride concentra-
tion (Figure 8). The dependence of
½h�=½h�H2O ¼ ðRh
.RH2OÞ3 on c0 calculated
1.0
1.1
1.2
1.3
0 0.5 1.0c0, mol/l
[η]/[η]H2O
Figure 7.
The dependence of ½h�.½h�H2O ratio on NaCl concen-
tration c0 in PB3 solution. Points – experimental
data, line – theoretical dependence, calculated by
using Equation 4 for A2¼ 3.5� 10�4 mol �ml/g2
A¼ 6.6 nm.
Copyright � 2012 WILEY-VCH Verlag GmbH & Co. KGaA
in accordance to the Equation (4) for
electroneutral polybetaine (f¼ g), is repre-
sented on Figure 7.
Conclusion
It was established that behavior of PB
corresponds to polyelectrolytes or polybe-
taines in dependence on pH and ionic
strength. In acidic solutions PB demon-
strate behavior typical for polyelectrolytes.
In solutions with pH 6–13, when 1M NaCl
is added to the solution, there is an
antipolyelectrolyte effect that manifests
itself as an increase in the intrinsic viscosity
and hydrodynamic radius of the polyzwit-
terion molecules. The increase in low-
molecular – mass salt concentration in
water solution leads to transition of the
polymer coil from collapsed conformation
to expanded state that corresponds to the
change in exponent a value from 0.5 to 0.58.
Thus, in an alkaline solution, PB molecules
practically behave as electroneutral poly-
betaines, for which the dimensions of
molecules typically increase with the ionic
strength of solution. Equilibrium rigidity of
polyzwitterion molecules does not depend
on low-molecular-mass salt concentration
in solution. A higher value of A for PB
molecules relative to that of the PD may be
explained by the presence of bulky side
groups in the repeating unit of polymeric
betaine. These groups enhance hindrance
to rotation around main-chain bonds.
[1] A. B. Lowe, C. L. McCormick, Chem. Rev. 2002,
102(11), 4177.
[2] S. Kudaibergenov, W. Jaeger, A. Laschewsky, Adv.
Polym. Sci. 2006. 201, 157.
[3] J. Bohrisch, C. Eisenbach, W. Jaeger, H. Mori,
A. Muller, C. Schaller, S. Traser, P. Wittmeyer, Adv.
Polym. Sci. 2004, 165, 1.
[4] A. Thunemann, M. Muller, H. Dautzenberg, J.-F.
Joanny, H. Luwen, Adv. Polym. Sci. 2004, 166, 113.
[5] C. Wandrey, J. Hermindez-Barajas, D. Hunkeler,
Adv. Polym. Sci. 1999, 145, 125.
[6] D. B. Thomas, Yu. A. Vasilieva, R. S. Armentrout,
C. L. McCormick, Macromolecules 2003, 36(26), 9710.
, Weinheim www.ms-journal.de
Macromol. Symp. 2012, 316, 17–2424
[7] G. S. Georgiev, E. B. Kamenska, E. D. Vassilieva, I. P.
Kamenova, V. T. Georgieva, S. B. Iliev, I. A. Ivanov,
Biomacromolecules 2006, 7(4), 1329.
[8] H. Dautzenberg, E. Gornitz, W. Jaeger, Macromol.
Chem. Phys. 1998, 199(8), 1561.
[9] Sk. Asrof Ali, Aal-e-Ali Polymer. 2001, 42, 7961.
[10] H. A. Al-Muallem, M. I. M. Wazeek, Sk. Asrof Ali,
Polymer 2002, 43, 4285.
[11] P. S. Vlasov, S. N. Cherniy, N. S. Domnina, Russ. J.
Gen. Chem. 2010, 80(7), 1314.
[12] Ph. Favresse, A. Laschewsky, Macromol. Chem.
Phys. 1999, 200(4), 887.
[13] A. V. Lezov, P. S. Vlasov, A. A. Lezov, N. S. Domnina,
G. E. Polushina, Polymer Sci. 2011, 53(11), P.
[14] R. Pecora, Dynamic Light Scattering, Academic
Press, New York 1976.
Copyright � 2012 WILEY-VCH Verlag GmbH & Co. KGaA
[15] B. Chu, Laser Light Scattering, Plenum Press, New
York 1976.
[16] V. N. Tsvetkov, Rigid-Chain Polymers, Consultants
Bureau, New York 1989.
[17] A. Yu. Grosberg, A. R. Khokhlov, Statistical Physics
of Macromolecules (Nauka, Moscow 1989; American
Institute of Physics, Ithaca 1994).
[18] H. B. Gray, V. A. Bloomfield, J. E. Hearst, J. Chem.
Phys. 1967, 46(4), 1493.
[19] Y. Kantor, M. Kardar, Phys. Rev. E. 1995, 51(2), 1299.
[20] P. Higgs, J.-F. Joanny, J. Chem. Phys. 1991, 94(2),
1543.
[21] A. R. Khokhlov, S. G. Starodubtzev, V. V. Vasilevs-
kaya, Adv. Polym. Sci. 1993, 109, 125.
[22] A. V. Lezov, G. E. Polushina, A. A. Lezov, P. S.
Vlasov, N. S. Domnina, Polymer. Sci. A. 2011, 53(2), 93.
, Weinheim www.ms-journal.de
Macromol. Symp. 2012, 316, 25–31 DOI: 10.1002/masy.201250604 25
1 D
St
11
Fa
E-2 Ru
Ku3 In
A
19
Cop
Diblock Copolymer Micelles with Ionic Amphiphilic
Corona
Evgeny A. Lysenko,*1 Alevtina I. Kulebyakina,2 Pavel S. Chelushkin,3
Alexander B. Zezin1
Summary: Aqueous dispersions of diblock copolymer micelles with homogeneous
hydrophobic core (polystyrene) and heterogeneous amphiphilic corona from ionic
N-ethyl-4-vinylpyridinium bromide (EVP) and hydrophobic 4-vinylpyridine (4VP) units
have been prepared at pH 9. The structure and dispersion stability of micelles as
function of the ratio and distribution pattern of ionic and hydrophobic units in corona
have been systematically studied by means of transmission electron microscopy,
static and dynamic light scattering, UV-spectrophotometry techniques. It was shown
that gradual decrease of the quantity of EVP-units in corona had no impact on micelle
structure until its fraction was above 0.7. When EVP-fraction dropped below this point
noticeable changes in micelle mass and dimensions were observed. In the case of
random distribution of 4VP and EVP units these changes were moderate in value and
jump-like in character. In the case of mictoarm (starlike) distribution of 4VP and EVP
blocks changes were large in value and monotonous in character. The presented
results may be of certain use for design of polymer micelles with nanosegregated
corona.
Keywords: amphiphilic; diblock copolymers; micelles; polyelectrolytes; self-assembly
Introduction
Self-assembly is a process of spontaneous
reversible formation of organized struc-
tures via non-covalent interactions of the
system components. Ionic amphiphilic
diblock copolymers belong to self-assem-
bling polymers. In aqueous media they
spontaneously form micelles with insoluble
hydrophobic core and lyophilizing ionic
corona.[1] These micelles are regarded as
promising drug delivery vehicles and
nanoreactors for synthesis and stabilization
epartment of Chemistry, M.V. Lomonosov Moscow
ate University, Leninskie Gory 1/3, Moscow,
9991 Russia
x: (þ7) 495 9390174;
mail: [email protected]
ssian Research Center Kurchatov Institute, pl.
rchatova 1, Moscow, 123182 Russia
stitute of Macromolecular Compounds, Russian
cademy of Science, Bolshoi pr. 31, St. Petersburg,
9004 Russia
yright � 2012 WILEY-VCH Verlag GmbH & Co. KGaA
of various nanoparticles because of their
remarkable binding and solubilizing prop-
erties as well as enhanced disintegration
resistance towards dilution.[2,3]
In the simplest case polymer micelles
consist from chemically uniform core and
chemically uniform corona.[1,2] A challen-
ging task for polymer chemistry is creation
of hierarchically organized polymer micelles,
i.e. micelles with compartmentalized core
and/or corona consisting of smaller structural
units that differ in composition and proper-
ties. Such micelles would resemble globules
of natural proteins with their microheter-
ogeneous structure and may pave the way for
design of smart multifunctional nanostruc-
tures.[3] First examples of polymer micelles
with segregated core or corona can be found
in literature.[4–9] Three ways of creation
such micelles can be distinguished: synth-
esis of multiblock (primarily triblock)
copolymers,[4,5] synthesis of amphiphilic
copolymers with a mixed (static and block)
, Weinheim wileyonlinelibrary.com
Macromol. Symp. 2012, 316, 25–3126
distribution of units of various polarity[6,7]
and joint micellization (hybridization) of
several diblock copolymers with different
chemical nature.[8,9]
The present paper deals with two types
of polymer micelles in aqueous media.
Both types consist from hydrophobic
homogeneous polystyrene (PS) core and
heterogeneous corona formed by nonpolar
4-vinylpyridine (4VP) and charged N-ethyl-
4-vinylpyridinium bromide (EVP) units.
The first variable in our investigation is
mole fraction of EVP units in corona,
b¼ [EVP]/([EVP]þ [4VP])¼ 0� 1. The sec-
ond variable is distribution pattern of
charged and nonpolar units within corona.
The first type of micelles consists from
PS-block-poly(4-vinylpyridine-stat-N-ethyl-4-
vinylpyridinium bromide) (PS-P(EVP/
4VP)-b) block copolymers with random
distribution of EVP and 4VP units along
corona-forming block. Therefore, block
copolymer micelles of the first type possess
random distribution of EVP and 4VP units
in corona. The second type includes hybrid
(mixed) micelles from PS-block-poly(4-
vinylpyridine) (PS-P4VP[0]) and PS-block-
poly(N-ethyl-4-vinylpyridinium bromide)
(PS-PEVP) diblock copolymers. Here and
below such micelles will be designated as
PS-PEVP/PS-P4VP-b. Block copolymer
micelles of the second type possess mic-
toarm (starlike) distribution of PEVP and
P4VP blocks within corona. The purpose of
the investigation is to find the influence of
composition and distribution pattern of
ionic and hydrophobic units in corona on
micellar structure and properties. Micelle
characteristics (mass, dimensions and
aggregation stability) as a function of their
composition b and distribution pattern
have been systematically studied to find
such correlations.
Experimental Part
Polymers
Diblock copolymers of PS-P4VP, PS-PEVP
and PS-P(EVP/4VP)-b have been synthe-
sized as described elsewhere.[10] The
Copyright � 2012 WILEY-VCH Verlag GmbH & Co. KGaA
lengths of PS, P4VP, PEVP and P(EVP/
4VP) blocks were equal 100 units, the
polydispersity index for all diblock copoly-
mers was 1.12. For PS-P(EVP/4VP)-b
copolymers b¼ 0.3� 1.0. The initial PS-
P4VP sample was synthesized and gener-
ously provided to us by Prof. Adi Eisenberg
from McGill University, Montreal, Quebec,
Canada.
Preparation of Micelle Dispersions
Aqueous dispersions of individual PS-
P(EVP/4VP)-b micelles were prepared
using the dialysis technique. Initially, PS-
P(EVP/4VP)-b copolymers were dissolved
in a mixed DMF/methanol (80/20 v/v)
solvent and stirred for one day. After that,
water was added to the mixture dropwise
under vigorous stirring. When water con-
tent was 33 vol. %, the mixture was left for
one day to reach the equilibrium. Another
portion of water was added until it content
was 67 vol. %. The mixture was stirred
additionally for one day. Finally, the water-
organic mixture was dialyzed against
pure water during one week using mem-
brane tubing to remove organic solvents.
The concentration of PS-P(EVP/4VP)-b in
final dispersion was determined from
UV-spectrophotometry measurements at
l¼ 257 nm.[10]
To prepare aqueous dispersions of
PS-PEVP/PS-P4VP-b micelles, individual
PS-PEVP and PS-P4VP copolymers were
initially dissolved in DMF/methanol (80/
20 v/v) solvent and mixed at appropriate
ratio b¼ 0.05� 1.0. All other steps were
identical to that described above for PS-
P(EVP/4VP)-b micelles. In our recent
publication we have demonstrated the
formation of hybrid micelles with joint
PS-core and mixed PEVP/P4VP corona
upon addition of water into above men-
tioned diblock copolymers mixture in DMF/
methanol solvent. We have found that the
micelle composition coincided or appro-
ached closely to the composition of the
copolymer mixture.[11] The PS-core of hybrid
micelles ‘‘freezes’’ during the dialysis proce-
dure thus fixing the micelle aggregation
number and the structure of the core.[12]
, Weinheim www.ms-journal.de
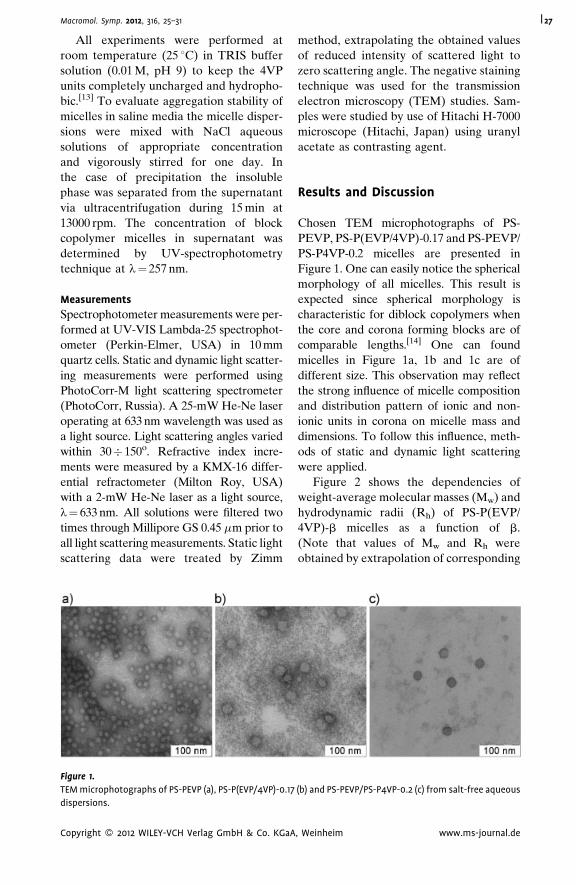
Macromol. Symp. 2012, 316, 25–31 27
All experiments were performed at
room temperature (25 8C) in TRIS buffer
solution (0.01 M, pH 9) to keep the 4VP
units completely uncharged and hydropho-
bic.[13] To evaluate aggregation stability of
micelles in saline media the micelle disper-
sions were mixed with NaCl aqueous
solutions of appropriate concentration
and vigorously stirred for one day. In
the case of precipitation the insoluble
phase was separated from the supernatant
via ultracentrifugation during 15 min at
13000 rpm. The concentration of block
copolymer micelles in supernatant was
determined by UV-spectrophotometry
technique at l¼ 257 nm.
Measurements
Spectrophotometer measurements were per-
formed at UV-VIS Lambda-25 spectrophot-
ometer (Perkin-Elmer, USA) in 10 mm
quartz cells. Static and dynamic light scatter-
ing measurements were performed using
PhotoCorr-M light scattering spectrometer
(PhotoCorr, Russia). A 25-mW He-Ne laser
operating at 633 nm wavelength was used as
a light source. Light scattering angles varied
within 30� 150o. Refractive index incre-
ments were measured by a KMX-16 differ-
ential refractometer (Milton Roy, USA)
with a 2-mW He-Ne laser as a light source,
l¼ 633 nm. All solutions were filtered two
times through Millipore GS 0.45 mm prior to
all light scattering measurements. Static light
scattering data were treated by Zimm
Figure 1.
TEM microphotographs of PS-PEVP (a), PS-P(EVP/4VP)-0.17
dispersions.
Copyright � 2012 WILEY-VCH Verlag GmbH & Co. KGaA
method, extrapolating the obtained values
of reduced intensity of scattered light to
zero scattering angle. The negative staining
technique was used for the transmission
electron microscopy (TEM) studies. Sam-
ples were studied by use of Hitachi H-7000
microscope (Hitachi, Japan) using uranyl
acetate as contrasting agent.
Results and Discussion
Chosen TEM microphotographs of PS-
PEVP, PS-P(EVP/4VP)-0.17 and PS-PEVP/
PS-P4VP-0.2 micelles are presented in
Figure 1. One can easily notice the spherical
morphology of all micelles. This result is
expected since spherical morphology is
characteristic for diblock copolymers when
the core and corona forming blocks are of
comparable lengths.[14] One can found
micelles in Figure 1a, 1b and 1c are of
different size. This observation may reflect
the strong influence of micelle composition
and distribution pattern of ionic and non-
ionic units in corona on micelle mass and
dimensions. To follow this influence, meth-
ods of static and dynamic light scattering
were applied.
Figure 2 shows the dependencies of
weight-average molecular masses (Mw) and
hydrodynamic radii (Rh) of PS-P(EVP/
4VP)-b micelles as a function of b.
(Note that values of Mw and Rh were
obtained by extrapolation of corresponding
(b) and PS-PEVP/PS-P4VP-0.2 (c) from salt-free aqueous
, Weinheim www.ms-journal.de
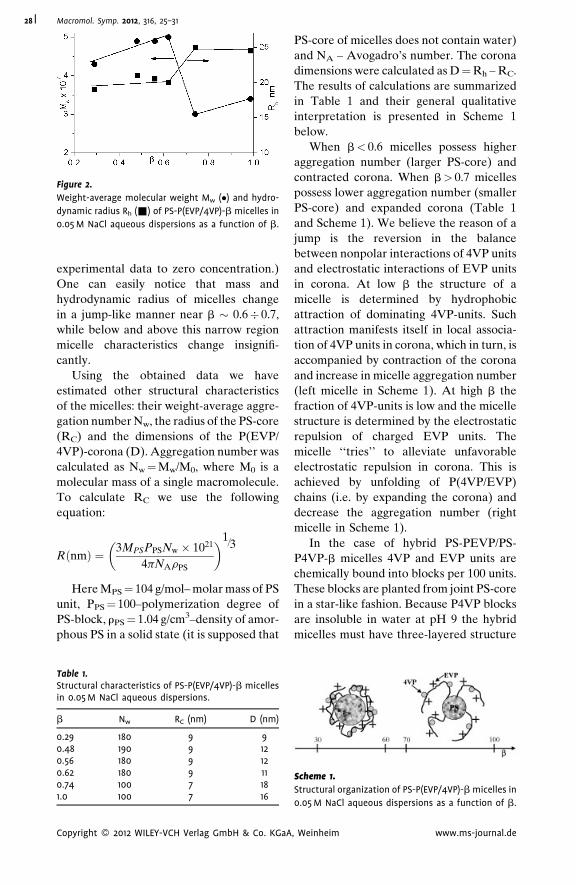
Figure 2.
Weight-average molecular weight Mw (�) and hydro-
dynamic radius Rh (&) of PS-P(EVP/4VP)-b micelles in
0.05 M NaCl aqueous dispersions as a function of b.
Macromol. Symp. 2012, 316, 25–3128
experimental data to zero concentration.)
One can easily notice that mass and
hydrodynamic radius of micelles change
in a jump-like manner near b � 0.6� 0.7,
while below and above this narrow region
micelle characteristics change insignifi-
cantly.
Using the obtained data we have
estimated other structural characteristics
of the micelles: their weight-average aggre-
gation number Nw, the radius of the PS-core
(RC) and the dimensions of the P(EVP/
4VP)-corona (D). Aggregation number was
calculated as Nw¼Mw/M0, where M0 is a
molecular mass of a single macromolecule.
To calculate RC we use the following
equation:
RðnmÞ ¼ 3MPSPPSNw � 1021
4pNArPS
� �1=3
Here MPS¼ 104 g/mol– molar mass of PS
unit, PPS¼ 100–polymerization degree of
PS-block, rPS¼ 1.04 g/cm3–density of amor-
phous PS in a solid state (it is supposed that
Table 1.Structural characteristics of PS-P(EVP/4VP)-b micellesin 0.05 M NaCl aqueous dispersions.
b Nw RC (nm) D (nm)
0.29 180 9 90.48 190 9 120.56 180 9 120.62 180 9 110.74 100 7 181.0 100 7 16
Copyright � 2012 WILEY-VCH Verlag GmbH & Co. KGaA
PS-core of micelles does not contain water)
and NA – Avogadro’s number. The corona
dimensions were calculated as D¼Rh – RC.
The results of calculations are summarized
in Table 1 and their general qualitative
interpretation is presented in Scheme 1
below.
When b< 0.6 micelles possess higher
aggregation number (larger PS-core) and
contracted corona. When b> 0.7 micelles
possess lower aggregation number (smaller
PS-core) and expanded corona (Table 1
and Scheme 1). We believe the reason of a
jump is the reversion in the balance
between nonpolar interactions of 4VP units
and electrostatic interactions of EVP units
in corona. At low b the structure of a
micelle is determined by hydrophobic
attraction of dominating 4VP-units. Such
attraction manifests itself in local associa-
tion of 4VP units in corona, which in turn, is
accompanied by contraction of the corona
and increase in micelle aggregation number
(left micelle in Scheme 1). At high b the
fraction of 4VP-units is low and the micelle
structure is determined by the electrostatic
repulsion of charged EVP units. The
micelle ‘‘tries’’ to alleviate unfavorable
electrostatic repulsion in corona. This is
achieved by unfolding of P(4VP/EVP)
chains (i.e. by expanding the corona) and
decrease the aggregation number (right
micelle in Scheme 1).
In the case of hybrid PS-PEVP/PS-
P4VP-b micelles 4VP and EVP units are
chemically bound into blocks per 100 units.
These blocks are planted from joint PS-core
in a star-like fashion. Because P4VP blocks
are insoluble in water at pH 9 the hybrid
micelles must have three-layered structure
Scheme 1.
Structural organization of PS-P(EVP/4VP)-b micelles in
0.05 M NaCl aqueous dispersions as a function of b.
, Weinheim www.ms-journal.de
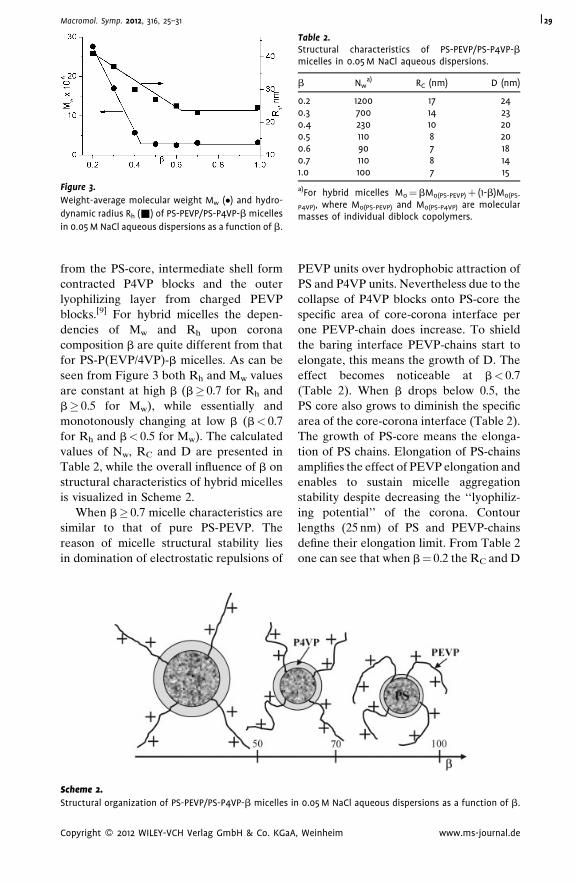
Figure 3.
Weight-average molecular weight Mw (�) and hydro-
dynamic radius Rh (&) of PS-PEVP/PS-P4VP-b micelles
in 0.05 M NaCl aqueous dispersions as a function of b.
Table 2.Structural characteristics of PS-PEVP/PS-P4VP-bmicelles in 0.05 M NaCl aqueous dispersions.
b Nwa) RC (nm) D (nm)
0.2 1200 17 240.3 700 14 230.4 230 10 200.5 110 8 200.6 90 7 180.7 110 8 141.0 100 7 15
a)For hybrid micelles M0¼bM0(PS-PEVP)þ (1-b)M0(PS-
P4VP), where M0(PS-PEVP) and M0(PS-P4VP) are molecularmasses of individual diblock copolymers.
Macromol. Symp. 2012, 316, 25–31 29
from the PS-core, intermediate shell form
contracted P4VP blocks and the outer
lyophilizing layer from charged PEVP
blocks.[9] For hybrid micelles the depen-
dencies of Mw and Rh upon corona
composition b are quite different from that
for PS-P(EVP/4VP)-b micelles. As can be
seen from Figure 3 both Rh and Mw values
are constant at high b (b� 0.7 for Rh and
b� 0.5 for Mw), while essentially and
monotonously changing at low b (b< 0.7
for Rh and b< 0.5 for Mw). The calculated
values of Nw, RC and D are presented in
Table 2, while the overall influence of b on
structural characteristics of hybrid micelles
is visualized in Scheme 2.
When b� 0.7 micelle characteristics are
similar to that of pure PS-PEVP. The
reason of micelle structural stability lies
in domination of electrostatic repulsions of
Scheme 2.
Structural organization of PS-PEVP/PS-P4VP-b micelles in
Copyright � 2012 WILEY-VCH Verlag GmbH & Co. KGaA
PEVP units over hydrophobic attraction of
PS and P4VP units. Nevertheless due to the
collapse of P4VP blocks onto PS-core the
specific area of core-corona interface per
one PEVP-chain does increase. To shield
the baring interface PEVP-chains start to
elongate, this means the growth of D. The
effect becomes noticeable at b< 0.7
(Table 2). When b drops below 0.5, the
PS core also grows to diminish the specific
area of the core-corona interface (Table 2).
The growth of PS-core means the elonga-
tion of PS chains. Elongation of PS-chains
amplifies the effect of PEVP elongation and
enables to sustain micelle aggregation
stability despite decreasing the ‘‘lyophiliz-
ing potential’’ of the corona. Contour
lengths (25 nm) of PS and PEVP-chains
define their elongation limit. From Table 2
one can see that when b¼ 0.2 the RC and D
0.05 M NaCl aqueous dispersions as a function of b.
, Weinheim www.ms-journal.de
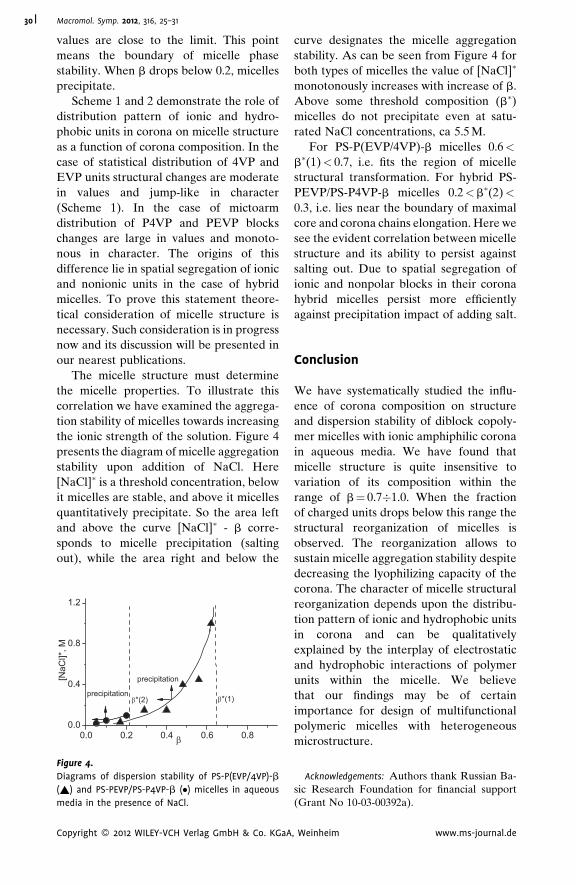
Macromol. Symp. 2012, 316, 25–3130
values are close to the limit. This point
means the boundary of micelle phase
stability. When b drops below 0.2, micelles
precipitate.
Scheme 1 and 2 demonstrate the role of
distribution pattern of ionic and hydro-
phobic units in corona on micelle structure
as a function of corona composition. In the
case of statistical distribution of 4VP and
EVP units structural changes are moderate
in values and jump-like in character
(Scheme 1). In the case of mictoarm
distribution of P4VP and PEVP blocks
changes are large in values and monoto-
nous in character. The origins of this
difference lie in spatial segregation of ionic
and nonionic units in the case of hybrid
micelles. To prove this statement theore-
tical consideration of micelle structure is
necessary. Such consideration is in progress
now and its discussion will be presented in
our nearest publications.
The micelle structure must determine
the micelle properties. To illustrate this
correlation we have examined the aggrega-
tion stability of micelles towards increasing
the ionic strength of the solution. Figure 4
presents the diagram of micelle aggregation
stability upon addition of NaCl. Here
[NaCl]� is a threshold concentration, below
it micelles are stable, and above it micelles
quantitatively precipitate. So the area left
and above the curve [NaCl]� - b corre-
sponds to micelle precipitation (salting
out), while the area right and below the
0.80.60.40.20.00.0
0.4
0.8
1.2
β*(1)precipitation
precipitation
β*(2)
β
[NaC
l]*, M
Figure 4.
Diagrams of dispersion stability of PS-P(EVP/4VP)-b
(~) and PS-PEVP/PS-P4VP-b (�) micelles in aqueous
media in the presence of NaCl.
Copyright � 2012 WILEY-VCH Verlag GmbH & Co. KGaA
curve designates the micelle aggregation
stability. As can be seen from Figure 4 for
both types of micelles the value of [NaCl]�
monotonously increases with increase of b.
Above some threshold composition (b�)
micelles do not precipitate even at satu-
rated NaCl concentrations, ca 5.5 M.
For PS-P(EVP/4VP)-b micelles 0.6<
b�(1)< 0.7, i.e. fits the region of micelle
structural transformation. For hybrid PS-
PEVP/PS-P4VP-b micelles 0.2<b�(2)<
0.3, i.e. lies near the boundary of maximal
core and corona chains elongation. Here we
see the evident correlation between micelle
structure and its ability to persist against
salting out. Due to spatial segregation of
ionic and nonpolar blocks in their corona
hybrid micelles persist more efficiently
against precipitation impact of adding salt.
Conclusion
We have systematically studied the influ-
ence of corona composition on structure
and dispersion stability of diblock copoly-
mer micelles with ionic amphiphilic corona
in aqueous media. We have found that
micelle structure is quite insensitive to
variation of its composition within the
range of b¼ 0.7�1.0. When the fraction
of charged units drops below this range the
structural reorganization of micelles is
observed. The reorganization allows to
sustain micelle aggregation stability despite
decreasing the lyophilizing capacity of the
corona. The character of micelle structural
reorganization depends upon the distribu-
tion pattern of ionic and hydrophobic units
in corona and can be qualitatively
explained by the interplay of electrostatic
and hydrophobic interactions of polymer
units within the micelle. We believe
that our findings may be of certain
importance for design of multifunctional
polymeric micelles with heterogeneous
microstructure.
Acknowledgements: Authors thank Russian Ba-sic Research Foundation for financial support(Grant No 10-03-00392a).
, Weinheim www.ms-journal.de
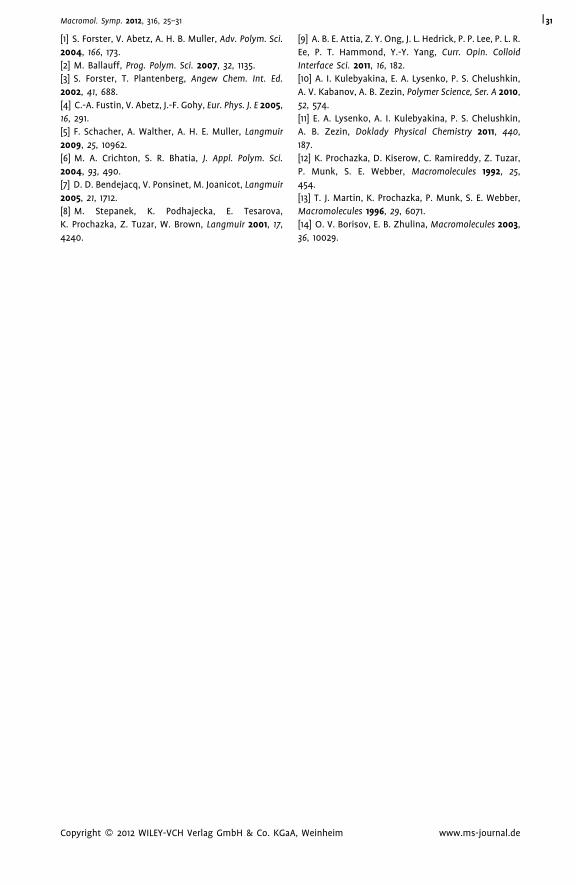
Macromol. Symp. 2012, 316, 25–31 31
[1] S. Forster, V. Abetz, A. H. B. Muller, Adv. Polym. Sci.
2004, 166, 173.
[2] M. Ballauff, Prog. Polym. Sci. 2007, 32, 1135.
[3] S. Forster, T. Plantenberg, Angew Chem. Int. Ed.
2002, 41, 688.
[4] C.-A. Fustin, V. Abetz, J.-F. Gohy, Eur. Phys. J. E 2005,
16, 291.
[5] F. Schacher, A. Walther, A. H. E. Muller, Langmuir
2009, 25, 10962.
[6] M. A. Crichton, S. R. Bhatia, J. Appl. Polym. Sci.
2004, 93, 490.
[7] D. D. Bendejacq, V. Ponsinet, M. Joanicot, Langmuir
2005, 21, 1712.
[8] M. Stepanek, K. Podhajecka, E. Tesarova,
K. Prochazka, Z. Tuzar, W. Brown, Langmuir 2001, 17,
4240.
Copyright � 2012 WILEY-VCH Verlag GmbH & Co. KGaA
[9] A. B. E. Attia, Z. Y. Ong, J. L. Hedrick, P. P. Lee, P. L. R.
Ee, P. T. Hammond, Y.-Y. Yang, Curr. Opin. Colloid
Interface Sci. 2011, 16, 182.
[10] A. I. Kulebyakina, E. A. Lysenko, P. S. Chelushkin,
A. V. Kabanov, A. B. Zezin, Polymer Science, Ser. A 2010,
52, 574.
[11] E. A. Lysenko, A. I. Kulebyakina, P. S. Chelushkin,
A. B. Zezin, Doklady Physical Chemistry 2011, 440,
187.
[12] K. Prochazka, D. Kiserow, C. Ramireddy, Z. Tuzar,
P. Munk, S. E. Webber, Macromolecules 1992, 25,
454.
[13] T. J. Martin, K. Prochazka, P. Munk, S. E. Webber,
Macromolecules 1996, 29, 6071.
[14] O. V. Borisov, E. B. Zhulina, Macromolecules 2003,
36, 10029.
, Weinheim www.ms-journal.de
Macromol. Symp. 2012, 316, 32–42 DOI: 10.1002/masy.20125060532
Inst
Aca
1990
Fax:
E-m
Cop
Synthesis and Solution Properties of Loose Polymer
Brushes Having Polyimide Backbone and
Methylmethacrylate Side Chains
Anna Krasova, Elena Belyaeva, Elena Tarabukina, Alexander Filippov,*
Tamara Meleshko, Dmitry Ilgach, Natalia Bogorad, Alexander Yakimansky
Summary: Graft-copolymers with polyimide backbone and PMMA side chains are
synthesized by ATRP of methylmethacrylate on the polyimide macroinitiator. The
obtained copolymers, macroinitiator, and cleaved side chains are investigated by1H NMR, SEC, static and dynamic light scattering, sedimentation, and viscosimetry
in solutions. The synthesized copolymer is relatively loose polymer brushes: the
average distance between grafted PMMA chains is �11 nm (4 repeat units of
the backbone). The hydrodynamic and conformational characteristics of graft-
copolymers change on passage from ethylacetate to chloroform due to difference
in the thermodynamic quality of the solvents with respect to the copolymer
components. The backbone is characterized more extended conformation than
individual polyimide macromolecule.
Keywords: atom transfer radical polymerization; conformational analysis; graft copolymers;
polyimide macroinitiator; solution properties
Introduction
In the last decade, intensive theoretical and
experimental studies of the properties of
cylindrical polymer brushes in solutions
were performed. Their regular multi-
branched structure leads to a significant
difference in solution behavior of comb-
like copolymers with densely grafted side
chains and the corresponding linear poly-
mers.[1–15] Cylindrical brushes have a high
density of polymer substance in the volume
occupied by macromolecules in solution,
this feature being indicative of their
relatively compact structure. In the case
of a long backbone, the conformation of
their macromolecules is extended wormlike
chain due to steric repulsion between
side chains, Kuhn segment length, A, being
itute of Macromolecular Compounds of Russian
demy of Sciences, Bolshoy pr., 31, Saint-Petersburg
04, Russia
(þ7) 812 3286869;
ail: [email protected]
yright � 2012 WILEY-VCH Verlag GmbH & Co. KGaA
one order of magnitude larger compared to
that of a linear chain with similar chemical
structure. If lengths of the backbone and
side chains are close, the conformational
and hydrodynamic properties of the den-
sely grafted copolymers are similar to those
of macromolecular stars. The longer are
side chains and the better is the solvent for
the side chains, the higher is the rigidity of
the backbone. Usually, temperature depen-
dence of the second virial coefficient, A2, for
cylindrical brushes is much weaker than
that for linear analogs and the magnitude of
dA2/dT at Q-point decreases with side chain
lengthening (T is temperature).
It should be emphasized that practically
all investigations mentioned above were
devoted to grafted copolymers with both
the backbone and side chains represented
by vinyl polymers, such as poly(meth)acryl-
ates, polystyrene, etc. It is interesting to
analyze the properties of regular grafted
copolymers having the backbone and
side chains which would differ considerably
in chemical nature and, hence, thermo-
, Weinheim wileyonlinelibrary.com
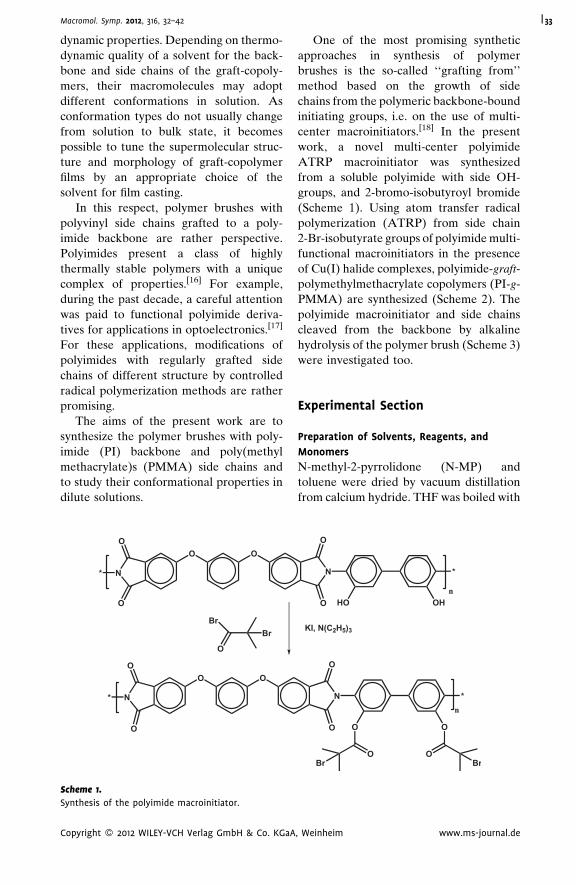
Macromol. Symp. 2012, 316, 32–42 33
dynamic properties. Depending on thermo-
dynamic quality of a solvent for the back-
bone and side chains of the graft-copoly-
mers, their macromolecules may adopt
different conformations in solution. As
conformation types do not usually change
from solution to bulk state, it becomes
possible to tune the supermolecular struc-
ture and morphology of graft-copolymer
films by an appropriate choice of the
solvent for film casting.
In this respect, polymer brushes with
polyvinyl side chains grafted to a poly-
imide backbone are rather perspective.
Polyimides present a class of highly
thermally stable polymers with a unique
complex of properties.[16] For example,
during the past decade, a careful attention
was paid to functional polyimide deriva-
tives for applications in optoelectronics.[17]
For these applications, modifications of
polyimides with regularly grafted side
chains of different structure by controlled
radical polymerization methods are rather
promising.
The aims of the present work are to
synthesize the polymer brushes with poly-
imide (PI) backbone and poly(methyl
methacrylate)s (PMMA) side chains and
to study their conformational properties in
dilute solutions.
O
O
* N
OO
Br
O
Br
O
N
OO
O
*
Scheme 1.
Synthesis of the polyimide macroinitiator.
Copyright � 2012 WILEY-VCH Verlag GmbH & Co. KGaA
One of the most promising synthetic
approaches in synthesis of polymer
brushes is the so-called ‘‘grafting from’’
method based on the growth of side
chains from the polymeric backbone-bound
initiating groups, i.e. on the use of multi-
center macroinitiators.[18] In the present
work, a novel multi-center polyimide
ATRP macroinitiator was synthesized
from a soluble polyimide with side OH-
groups, and 2-bromo-isobutyroyl bromide
(Scheme 1). Using atom transfer radical
polymerization (ATRP) from side chain
2-Br-isobutyrate groups of polyimide multi-
functional macroinitiators in the presence
of Cu(I) halide complexes, polyimide-graft-
polymethylmethacrylate copolymers (PI-g-
PMMA) are synthesized (Scheme 2). The
polyimide macroinitiator and side chains
cleaved from the backbone by alkaline
hydrolysis of the polymer brush (Scheme 3)
were investigated too.
Experimental Section
Preparation of Solvents, Reagents, and
Monomers
N-methyl-2-pyrrolidone (N-MP) and
toluene were dried by vacuum distillation
from calcium hydride. THF was boiled with
KI, N(C2H5)3
OOBrBr
OOO
O
*N
OHHOO
O
*N
n
n
, Weinheim www.ms-journal.de
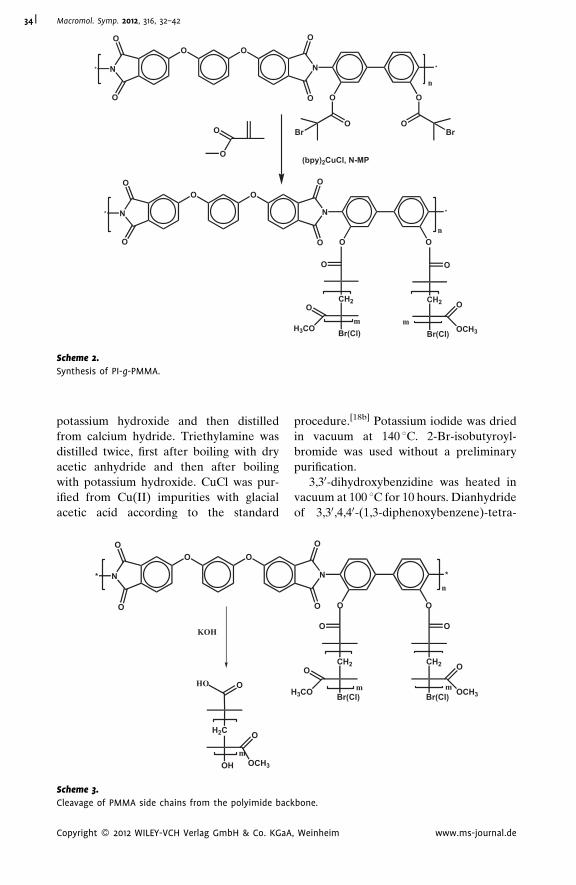
(bpy)2CuCl, N-MPO
O
Br(Cl)H3CO
OCH2
O
Br(Cl) OCH3
OCH2
O
OO
O
O
O
* *N N
OO
OOBrBr
OO
O
O
O
* *N N
OO
O
O
m m
n
n
Scheme 2.
Synthesis of PI-g-PMMA.
Macromol. Symp. 2012, 316, 32–4234
potassium hydroxide and then distilled
from calcium hydride. Triethylamine was
distilled twice, first after boiling with dry
acetic anhydride and then after boiling
with potassium hydroxide. CuCl was pur-
ified from Cu(II) impurities with glacial
acetic acid according to the standard
H2C
OCH3OH
O
O
* N
OO
O
O
m
KOH
HO
Scheme 3.
Cleavage of PMMA side chains from the polyimide bac
Copyright � 2012 WILEY-VCH Verlag GmbH & Co. KGaA
procedure.[18b] Potassium iodide was dried
in vacuum at 140 8C. 2-Br-isobutyroyl-
bromide was used without a preliminary
purification.
3,30-dihydroxybenzidine was heated in
vacuum at 100 8C for 10 hours. Dianhydride
of 3,30,4,40-(1,3-diphenoxybenzene)-tetra-
OOO
O
*N
Br(Cl) OCH3
OCH2
O
Br(Cl)H3CO
OCH2
O
m m
n
kbone.
, Weinheim www.ms-journal.de
Macromol. Symp. 2012, 316, 32–42 35
carboxylic acid was heated in vacuum at
140 8C for 10 hours. Methylmethacrylate
(MMA) was twice distilled in vacuum.
Synthesis of Multicenter Polyimide
Macroinitiator
In the first stage of the synthesis of the
initial polyimide, room temperature poly-
condensation between 3,30-dihydroxyben-
zidine and dianhydride of 3,30,4,40-(1,3-
diphenoxybenzene)-tetracarboxylic acid
was performed in NMP solution, producing
20 wt.% solution of the corresponding
polyamic acid. In the second stage, the
polyamic acid was cyclodehydrated in
solution at 170–180 8C, distilling off water
byproduct as its azeotropic mixture with
toluene.
3 g of thus obtained 20 wt.% polyimide
solution in N-MP was diluted with N-MP to
the concentration of 3 wt.%. Then, into this
diluted solution, 1.4 mL of triethylamine
and 0.8 g of KI were added. The reaction
mixture was cooled down on ice bath and
then solution of 0.6 mL of 2-Br-isobutyroyl-
bromide solution in 6 mL of THF was
slowly dropped. The reaction solution was
stirred under cooling for 4 hours, then it
was heated up to room temperature and
stirred for more 20 hours. The precipitated
salt Et3N �HBr was filtered off, and the
polymeric product was precipitated from
the filtrate into methanol. The polymeric
product was washed by ethanol until it
became colorless, and then several times
with warm water (40 8C). The multicenter
polyimide macroinitiator was finally repre-
cipitated from chloroform into petroleum-
ether, filtered off and dried at 50 8C at a
reduced pressure.
Synthesis of Polyimide-graft-PMMA
Atom transfer radical polymerization
(ATRP) of MMA from the multicenter
polyimide macroinitiator was carried out in
N-MP solution. 0.078 g of the macroinitia-
tor was dissolved in 13 mL of N-MP, and
then 2,20-bipyridine (0.0568 g) and CuCl
(0.012 g) were added. The obtained solution
was placed into a glass tube, then, MMA
was added into the tube. The reaction
Copyright � 2012 WILEY-VCH Verlag GmbH & Co. KGaA
solution was deoxygenated by triple freez-
ing and evacuation, then, the tube was
sealed and place in a thermostat at 80 8C for
20 hours. Then, in order to terminate the
ATRP process, the reaction solution was
quickly cooled down, open to air, and 50%
diluted with THF. After chromatographic
purification from the catalyst on an alumina
column, the solution was concentrated on a
rotary evaporator, and the polymer pro-
duct, polyimide-graft-PMMA, was precipi-
tated into methanol. The precipitate was
filtered off and dried at 50 8C at a reduced
pressure.
Cleavage of Side Chains of
Polyimide-graft-PMMA
0.1 g of polyimide-graft-PMMA was dis-
solved in 15 mL of THF, and 10 mL of KOH
solution in methanol (5 wt.%) was added.
The solution was kept in a round-bottom
flask with reflux condenser for 16 hours at
70 8C. Then, the solution was concentrated
on a rotary evaporator, and water was
added for complete polymer precipitation.
The polymer was filtered off and washed
with water until neutral pH. The isolated
polymer was dried at 50 8C at a reduced
pressure.
Polymer Characterization by 1H
NMR-Spectroscopy1H NMR-spectra were recorded on a
Bruker AC-400 (400.1 MHz) device, using
DMSO-d6 as the solvent.
Characterization of Cleaved PMMA Side
Chains by GPC
Gel permeation chromatography (GPC) of
cleaved PMMA side chains was performed
on an HPLC – Tower (vacuum degasser,
isocratic pump, autosampler, UV- and
RI-detector) from Agilent 1200 Series.
THF was used as the eluent at a flow rate
of 1 mL/min at 40 8C. PMMA standards
were used as the references.
Methods of Molecular Optics and
Hydrodynamics
The prepared samples were studied by the
methods of molecular optics and hydro-
, Weinheim www.ms-journal.de
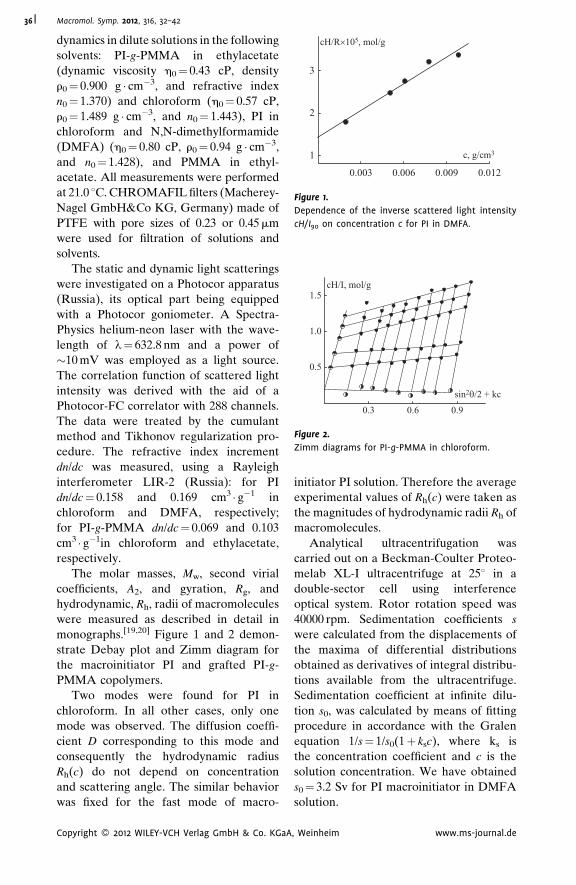
0.0120.0090.0060.003
1
2
3
cH/R×105, mol/g
c, g/cm3
Figure 1.
Dependence of the inverse scattered light intensity
cH/I90 on concentration c for PI in DMFA.
0.90.60.3
0.5
1.0
1.5
sin2θ/2 + kc
cH/I, mol/g
Figure 2.
Zimm diagrams for PI-g-PMMA in chloroform.
Macromol. Symp. 2012, 316, 32–4236
dynamics in dilute solutions in the following
solvents: PI-g-PMMA in ethylacetate
(dynamic viscosity h0¼ 0.43 cP, density
r0¼ 0.900 g � cm�3, and refractive index
n0¼ 1.370) and chloroform (h0¼ 0.57 cP,
r0¼ 1.489 g � cm�3, and n0¼ 1.443), PI in
chloroform and N,N-dimethylformamide
(DMFA) (h0¼ 0.80 cP, r0¼ 0.94 g � cm�3,
and n0¼ 1.428), and PMMA in ethyl-
acetate. All measurements were performed
at 21.0 8C. CHROMAFIL filters (Macherey-
Nagel GmbH&Co KG, Germany) made of
PTFE with pore sizes of 0.23 or 0.45 mm
were used for filtration of solutions and
solvents.
The static and dynamic light scatterings
were investigated on a Photocor apparatus
(Russia), its optical part being equipped
with a Photocor goniometer. A Spectra-
Physics helium-neon laser with the wave-
length of l¼ 632.8 nm and a power of
�10 mV was employed as a light source.
The correlation function of scattered light
intensity was derived with the aid of a
Photocor-FC correlator with 288 channels.
The data were treated by the cumulant
method and Tikhonov regularization pro-
cedure. The refractive index increment
dn/dc was measured, using a Rayleigh
interferometer LIR-2 (Russia): for PI
dn/dc¼ 0.158 and 0.169 cm3 � g�1 in
chloroform and DMFA, respectively;
for PI-g-PMMA dn/dc¼ 0.069 and 0.103
cm3 � g�1in chloroform and ethylacetate,
respectively.
The molar masses, Mw, second virial
coefficients, A2, and gyration, Rg, and
hydrodynamic, Rh, radii of macromolecules
were measured as described in detail in
monographs.[19,20] Figure 1 and 2 demon-
strate Debay plot and Zimm diagram for
the macroinitiator PI and grafted PI-g-
PMMA copolymers.
Two modes were found for PI in
chloroform. In all other cases, only one
mode was observed. The diffusion coeffi-
cient D corresponding to this mode and
consequently the hydrodynamic radius
Rh(c) do not depend on concentration
and scattering angle. The similar behavior
was fixed for the fast mode of macro-
Copyright � 2012 WILEY-VCH Verlag GmbH & Co. KGaA
initiator PI solution. Therefore the average
experimental values of Rh(c) were taken as
the magnitudes of hydrodynamic radii Rh of
macromolecules.
Analytical ultracentrifugation was
carried out on a Beckman-Coulter Proteo-
melab XL-I ultracentrifuge at 258 in a
double-sector cell using interference
optical system. Rotor rotation speed was
40000 rpm. Sedimentation coefficients s
were calculated from the displacements of
the maxima of differential distributions
obtained as derivatives of integral distribu-
tions available from the ultracentrifuge.
Sedimentation coefficient at infinite dilu-
tion s0, was calculated by means of fitting
procedure in accordance with the Gralen
equation 1/s¼ 1/s0(1þ ksc), where ks is
the concentration coefficient and c is the
solution concentration. We have obtained
s0¼ 3.2 Sv for PI macroinitiator in DMFA
solution.
, Weinheim www.ms-journal.de
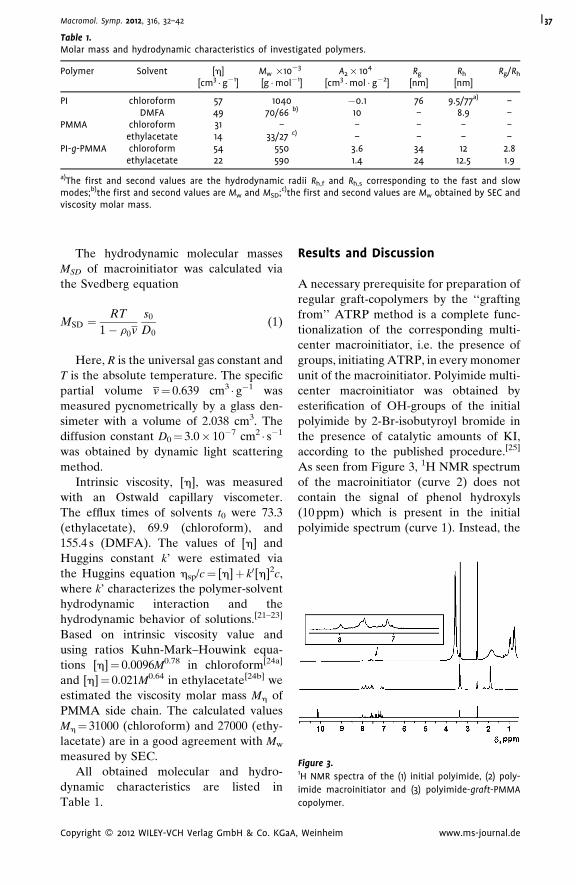
Table 1.Molar mass and hydrodynamic characteristics of investigated polymers.
Polymer Solvent [h][cm3 � g�1]
Mw �10�3
[g �mol�1]A2� 104
[cm3 �mol � g�2]Rg
[nm]Rh
[nm]Rg/Rh
PI chloroform 57 1040 �0.1 76 9.5/77a) –DMFA 49 70/66 b) 10 – 8.9 –
PMMA chloroform 31 – – – – –ethylacetate 14 33/27 c) – – – –
PI-g-PMMA chloroform 54 550 3.6 34 12 2.8ethylacetate 22 590 1.4 24 12.5 1.9
a)The first and second values are the hydrodynamic radii Rh,f and Rh,s corresponding to the fast and slowmodes;b)the first and second values are Mw and MSD;c)the first and second values are Mw obtained by SEC andviscosity molar mass.
Figure 3.1H NMR spectra of the (1) initial polyimide, (2) poly-
imide macroinitiator and (3) polyimide-graft-PMMA
copolymer.
Macromol. Symp. 2012, 316, 32–42 37
The hydrodynamic molecular masses
MSD of macroinitiator was calculated via
the Svedberg equation
MSD ¼RT
1� r0v
s0
D0(1)
Here, R is the universal gas constant and
T is the absolute temperature. The specific
partial volume v¼ 0.639 cm3 � g�1 was
measured pycnometrically by a glass den-
simeter with a volume of 2.038 cm3. The
diffusion constant D0¼ 3.0� 10�7 cm2 � s�1
was obtained by dynamic light scattering
method.
Intrinsic viscosity, [h], was measured
with an Ostwald capillary viscometer.
The efflux times of solvents t0 were 73.3
(ethylacetate), 69.9 (chloroform), and
155.4 s (DMFA). The values of [h] and
Huggins constant k’ were estimated via
the Huggins equation hsp/c¼ [h]þ k0[h]2c,
where k’ characterizes the polymer-solvent
hydrodynamic interaction and the
hydrodynamic behavior of solutions.[21–23]
Based on intrinsic viscosity value and
using ratios Kuhn-Mark–Houwink equa-
tions [h]¼ 0.0096M0.78 in chloroform[24a]
and [h]¼ 0.021M0.64 in ethylacetate[24b] we
estimated the viscosity molar mass Mh of
PMMA side chain. The calculated values
Mh¼ 31000 (chloroform) and 27000 (ethy-
lacetate) are in a good agreement with Mw
measured by SEC.
All obtained molecular and hydro-
dynamic characteristics are listed in
Table 1.
Copyright � 2012 WILEY-VCH Verlag GmbH & Co. KGaA
Results and Discussion
A necessary prerequisite for preparation of
regular graft-copolymers by the ‘‘grafting
from’’ ATRP method is a complete func-
tionalization of the corresponding multi-
center macroinitiator, i.e. the presence of
groups, initiating ATRP, in every monomer
unit of the macroinitiator. Polyimide multi-
center macroinitiator was obtained by
esterification of OH-groups of the initial
polyimide by 2-Br-isobutyroyl bromide in
the presence of catalytic amounts of KI,
according to the published procedure.[25]
As seen from Figure 3, 1H NMR spectrum
of the macroinitiator (curve 2) does not
contain the signal of phenol hydroxyls
(10 ppm) which is present in the initial
polyimide spectrum (curve 1). Instead, the
, Weinheim www.ms-journal.de

Macromol. Symp. 2012, 316, 32–4238
signal of initiating 2-Br-isobutyrate groups
appears at 1.9 ppm. Comparing its integral
intensity with the integral intensity of
aromatic protons at 6.0–8.5 ppm, the func-
tionalization of the macroinitiator is esti-
mated to be nearly complete.
The obtained polyimide macroinitiator
is insoluble in MMA. Therefore, ATRP of
MMA from this macroinitiator cannot be
carried out in bulk monomer. The most
effective solvents for polyimides are aprotic
amide solvents like N,N-dimethylforma-
mide, N,N-dimethylacetamide, and N-MP.
Earlier, we found that ATRP of MMA
from a polyimide macroinitiator effectively
proceeds in N-MP at 80 8C in the presence
of the complex of CuCl and 2,20-bipyridine.
The same conditions were used here for the
synthesis of the polyimide-graft-PMMA
copolymer. It is seen from Figure 3 that
in its 1H NMR spectrum (curve 3) there is
practically no signal of 2-Br-isobutyrate
groups at 1.9 ppm, but signals of �OCH3
(3.9 ppm) and�CH3 (0.9 ppm) groups of
MMA units are present.
In order to determine the molecular
weight characteristics of the grafted
PMMA side chains, they were cleaved
from the polyimide backbone by complete
degradation of the latter under alkaline
hydrolysis (Scheme 3). Sufficiently mild
conditions of this process were found in
which ester groups of PMMA side chains
are not hydrolyzed, as is evidenced by the
absence of vibration bands of carboxylic
groups (2800–3600 cm�1, 1700 cm�1, 1560–
1600 cm�1) in FTIR spectra of thus cleaved
PMMA side chains. The complete degrada-
tion of the polyimide backbone is also
proved by the absence of aromatic UV-
absorption at 260 nm in UV-spectra of the
cleaved PMMA side chains. Also, 1H NMR
spectrum of the cleaved PMMA side chains
does not contain signals of aromatic pro-
tons. Therefore, one may conclude that the
isolated polymer product of the alkaline
hydrolysis of polyimide-graft-PMMA is
indeed its PMMA side chains. Molar mass
characteristics of the cleaved PMAA side
chains were determined by SEC method,
using THF eluent and PMMA standards.
Copyright � 2012 WILEY-VCH Verlag GmbH & Co. KGaA
One can see from Table 1 that there is
a good agreement between molar masses
of grafted copolymers PI-g-PMMA deter-
mined in different solvents. The situation is
different for the macroinitiator PI. The
molar masses of PI estimated by static light
scattering in chloroform are more than an
order of magnitude higher than Mw in
DMFA. On the other hand, the Mw and
MSD values of PI determined in DMFA
practically coincide. The reason for such a
remarkable difference in the Mw values can
be ascertained by dynamic light scattering.
As was noted above, PI in chloroform
solutions is characterized by a bimodal
particle size distribution. In this case, the
hydrodynamic radii, Rh,s, corresponding to
the slow mode is more than six times higher
than the Rh,f values of species responsible
for the fast mode (Table 1). The Rh,f values
are close to the hydrodynamic radius Rh
measured in DMFA. These data lead us to
assume that species responsible for the fast
mode in chloroform are individual macro-
molecules of the macroinitiator PI. It is
large species responsible for the slow mode
that contribute mostly to Mw and radius of
gyration Rg obtained by static light scatter-
ing. These data could be explained by the
fact that chloroform, unlike DMFA, is not a
good solvent for polyimides. The macro-
initiator PI becomes soluble in chloroform
due to a-Br-isobutyrate side groups
attached to the polyimide backbone. How-
ever, obviously, supramolecular aggregates
of PI chains still do form in chloroform. It
should be noted here that although almost
every repeating unit of PI contains two
2-Br-isobutyrate side groups, unsubstituted
OH-groups of the original polyimide can
still be present in PI macromolecules,
enhancing aggregation in chloroform,
which, unlike DMFA, does not breaks
H-bonds effectively.
We estimated the rigidity of the macro-
initiator PI chains, using the values of
hydrodynamic radius Rh of its macromole-
cules in DMFA and chloroform. It is known
that for linear polydisperse polymers in a
good solvent the ratio r of gyration radius
Rg to hydrodynamic radius Rh is close to
, Weinheim www.ms-journal.de
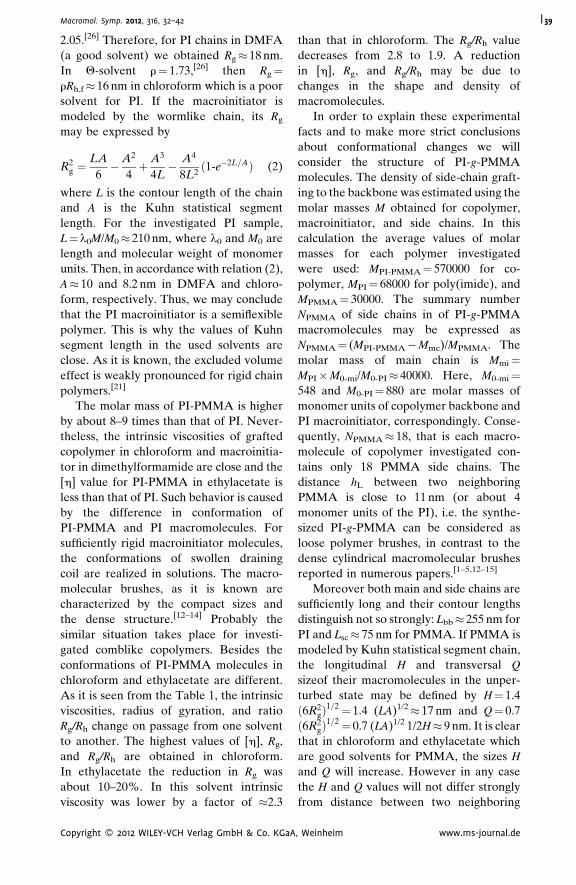
Macromol. Symp. 2012, 316, 32–42 39
2.05.[26] Therefore, for PI chains in DMFA
(a good solvent) we obtained Rg� 18 nm.
In Q-solvent r¼ 1.73,[26] then Rg¼rRh,f� 16 nm in chloroform which is a poor
solvent for PI. If the macroinitiator is
modeled by the wormlike chain, its Rg
may be expressed by
R2g ¼
LA
6�A2
4þ A3
4L� A4
8L2ð1-e�2L=AÞ (2)
where L is the contour length of the chain
and A is the Kuhn statistical segment
length. For the investigated PI sample,
L¼ l0M/M0� 210 nm, where l0 and M0 are
length and molecular weight of monomer
units. Then, in accordance with relation (2),
A� 10 and 8.2 nm in DMFA and chloro-
form, respectively. Thus, we may conclude
that the PI macroinitiator is a semiflexible
polymer. This is why the values of Kuhn
segment length in the used solvents are
close. As it is known, the excluded volume
effect is weakly pronounced for rigid chain
polymers.[21]
The molar mass of PI-PMMA is higher
by about 8–9 times than that of PI. Never-
theless, the intrinsic viscosities of grafted
copolymer in chloroform and macroinitia-
tor in dimethylformamide are close and the
[h] value for PI-PMMA in ethylacetate is
less than that of PI. Such behavior is caused
by the difference in conformation of
PI-PMMA and PI macromolecules. For
sufficiently rigid macroinitiator molecules,
the conformations of swollen draining
coil are realized in solutions. The macro-
molecular brushes, as it is known are
characterized by the compact sizes and
the dense structure.[12–14] Probably the
similar situation takes place for investi-
gated comblike copolymers. Besides the
conformations of PI-PMMA molecules in
chloroform and ethylacetate are different.
As it is seen from the Table 1, the intrinsic
viscosities, radius of gyration, and ratio
Rg/Rh change on passage from one solvent
to another. The highest values of [h], Rg,
and Rg/Rh are obtained in chloroform.
In ethylacetate the reduction in Rg was
about 10–20%. In this solvent intrinsic
viscosity was lower by a factor of �2.3
Copyright � 2012 WILEY-VCH Verlag GmbH & Co. KGaA
than that in chloroform. The Rg/Rh value
decreases from 2.8 to 1.9. A reduction
in [h], Rg, and Rg/Rh may be due to
changes in the shape and density of
macromolecules.
In order to explain these experimental
facts and to make more strict conclusions
about conformational changes we will
consider the structure of PI-g-PMMA
molecules. The density of side-chain graft-
ing to the backbone was estimated using the
molar masses M obtained for copolymer,
macroinitiator, and side chains. In this
calculation the average values of molar
masses for each polymer investigated
were used: MPI-PMMA¼ 570000 for co-
polymer, MPI¼ 68000 for poly(imide), and
MPMMA¼ 30000. The summary number
NPMMA of side chains in of PI-g-PMMA
macromolecules may be expressed as
NPMMA¼ (MPI-PMMA�Mmc)/MPMMA. The
molar mass of main chain is Mmi¼MPI�M0-mi/M0-PI� 40000. Here, M0-mi¼548 and M0-PI¼ 880 are molar masses of
monomer units of copolymer backbone and
PI macroinitiator, correspondingly. Conse-
quently, NPMMA� 18, that is each macro-
molecule of copolymer investigated con-
tains only 18 PMMA side chains. The
distance hL between two neighboring
PMMA is close to 11 nm (or about 4
monomer units of the PI), i.e. the synthe-
sized PI-g-PMMA can be considered as
loose polymer brushes, in contrast to the
dense cylindrical macromolecular brushes
reported in numerous papers.[1–5,12–15]
Moreover both main and side chains are
sufficiently long and their contour lengths
distinguish not so strongly: Lbb� 255 nm for
PI and Lsc� 75 nm for PMMA. If PMMA is
modeled by Kuhn statistical segment chain,
the longitudinal H and transversal Q
sizeof their macromolecules in the unper-
turbed state may be defined by H¼ 1.4
ð6R2gÞ
1=2¼ 1.4 (LA)1/2� 17 nm and Q¼ 0.7
ð6R2gÞ
1=2¼ 0.7 (LA)1/2 1/2H� 9 nm. It is clear
that in chloroform and ethylacetate which
are good solvents for PMMA, the sizes H
and Q will increase. However in any case
the H and Q values will not differ strongly
from distance between two neighboring
, Weinheim www.ms-journal.de
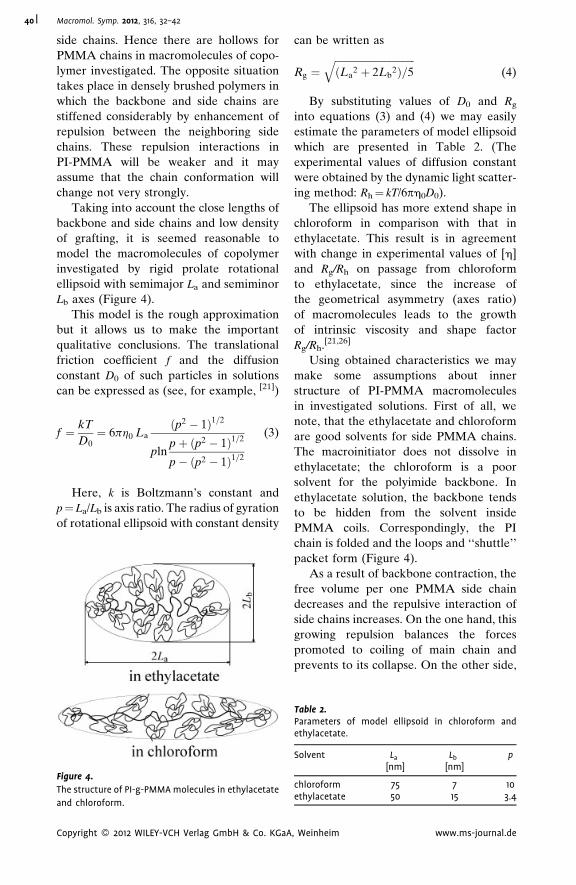
Macromol. Symp. 2012, 316, 32–4240
side chains. Hence there are hollows for
PMMA chains in macromolecules of copo-
lymer investigated. The opposite situation
takes place in densely brushed polymers in
which the backbone and side chains are
stiffened considerably by enhancement of
repulsion between the neighboring side
chains. These repulsion interactions in
PI-PMMA will be weaker and it may
assume that the chain conformation will
change not very strongly.
Taking into account the close lengths of
backbone and side chains and low density
of grafting, it is seemed reasonable to
model the macromolecules of copolymer
investigated by rigid prolate rotational
ellipsoid with semimajor La and semiminor
Lb axes (Figure 4).
This model is the rough approximation
but it allows us to make the important
qualitative conclusions. The translational
friction coefficient f and the diffusion
constant D0 of such particles in solutions
can be expressed as (see, for example, [21])
f ¼ kT
D0¼ 6ph0 La
ðp2 � 1Þ1=2
plnpþ ðp2 � 1Þ1=2
p� ðp2 � 1Þ1=2
(3)
Here, k is Boltzmann’s constant and
p¼ La/Lb is axis ratio. The radius of gyration
of rotational ellipsoid with constant density
Figure 4.
The structure of PI-g-PMMA molecules in ethylacetate
and chloroform.
Copyright � 2012 WILEY-VCH Verlag GmbH & Co. KGaA
can be written as
Rg ¼ffiffiffiffiffiffiffiffiffiffiffiffiffiffiffiffiffiffiffiffiffiffiffiffiffiffiffiffiffiffiffiffiðLa
2 þ 2Lb2Þ=5
q(4)
By substituting values of D0 and Rg
into equations (3) and (4) we may easily
estimate the parameters of model ellipsoid
which are presented in Table 2. (The
experimental values of diffusion constant
were obtained by the dynamic light scatter-
ing method: Rh¼ kT/6ph0D0).
The ellipsoid has more extend shape in
chloroform in comparison with that in
ethylacetate. This result is in agreement
with change in experimental values of [h]
and Rg/Rh on passage from chloroform
to ethylacetate, since the increase of
the geometrical asymmetry (axes ratio)
of macromolecules leads to the growth
of intrinsic viscosity and shape factor
Rg/Rh.[21,26]
Using obtained characteristics we may
make some assumptions about inner
structure of PI-PMMA macromolecules
in investigated solutions. First of all, we
note, that the ethylacetate and chloroform
are good solvents for side PMMA chains.
The macroinitiator does not dissolve in
ethylacetate; the chloroform is a poor
solvent for the polyimide backbone. In
ethylacetate solution, the backbone tends
to be hidden from the solvent inside
PMMA coils. Correspondingly, the PI
chain is folded and the loops and ‘‘shuttle’’
packet form (Figure 4).
As a result of backbone contraction, the
free volume per one PMMA side chain
decreases and the repulsive interaction of
side chains increases. On the one hand, this
growing repulsion balances the forces
promoted to coiling of main chain and
prevents to its collapse. On the other side,
Table 2.Parameters of model ellipsoid in chloroform andethylacetate.
Solvent La
[nm]Lb
[nm]p
chloroform 75 7 10ethylacetate 50 15 3.4
, Weinheim www.ms-journal.de
Macromol. Symp. 2012, 316, 32–42 41
the excluded-volume interaction between
the side chains leads to their straightening
and some increase in PI-PMMA macro-
molecule dimensions.
The investigated copolymers may be
considered as polymer brushes with the
chemical nature of the backbone and
side chains. The solution properties of
such systems are rather complicated. In
particular in solvent that is good for
the backbone and bad for side chain, the
macromolecules may have the pearl-
necklace structure.[3,27,28] However the
probability of similar configuration for
PI-PMMA molecules is not enough since
they are characterized by the low grafting
density and have relatively long side chains
in comparison with backbone. For realiza-
tion of the pearl-necklace structure it is
needed that length of backbone must be
much more than that of side chain.[27,28]
The shape and dimensions of the
PI-PMMA molecules in chloroform is
caused by the repulsive interaction of side
chains. The chloroform is thermodynami-
cally very good solvent for PMMA, and the
side chains rush to occupy the large volume
straightening backbone and increasing
the form asymmetry of comblike macro-
molecules. Correspondingly, the semimajor
axis length La of model ellipsoid in chloro-
form is higher by a factor of 1.5 than that in
ethylacetate.
In conclusion we note that in both
chloroform and ethylacetate the PI back-
bone is sufficiently strongly stretched. The
end to end distance h for PI individual
molecules in Q-solvent is equal to about
45 nm, because for long chain macromole-
cules �6 R2g and Rg� 18 nm for PI macro-
initiator. In the case of PI-PMMA, the
highest possible value hmax of the end
to end distance of PI backbone coincides
with length of model ellipsoid major axes.
Correspondingly, hmax� 150 nm in chloro-
form and 100 nm in ethylacetate. The
minimum value hmin may be estimated
using formula h¼ 2(La�H), where H is
longitudinal size of PMMA molecules.
Such situation takes place when the PMMA
molecules are situated on each end of
Copyright � 2012 WILEY-VCH Verlag GmbH & Co. KGaA
backbone. Taking into account the thermo-
dynamical quality of used solvents it will
not be serious mistake to assume that H
does not exceed 25 nm. Consequently, for
minimum end to end distance for backbone
we obtain hmin� 50 nm in ethylacetate and
hmin� 100 nm in chloroform. Thus, even in
the case of collapsed backbone in ethyl-
acetate, their linear dimensions are
comparable with those for individual PI
molecules due to the side chain interaction.
Conclusion
It was shown that ATRP of methylmetha-
crylate on the polyimide macroinitiator
may be used for the synthesis of relatively
loose polymer brushes with the strongly
different chemical natures of the backbone
and side chains. This difference is respon-
sible for their conformational and hydro-
dynamic properties. The rotation ellipsoid
model is used for the description of their
solution behavior. Size and shape of the
macromolecules depend on the thermody-
namic quality of the solvent with respect to
the backbone and side chains. The obtained
data make it possible to conclude that the
backbone of PI-g-PMMA is always more
extended than the PI macromolecule of the
same molar mass.
Acknowledgements: Work was supported by theRussian Foundation for Basic Researches (pro-ject 11-03-00353) and the Program No 3 ofDepartment of Chemistry and Material Scienceof Russian Academy of Sciences ‘‘Creation andstudy of macromolecules and macromolecularstructures of a new generation’’.
[1] N. Hadjichristidis, M. Pitsikalis, S. Pispas, H. Iatrou,
Chem. Rev. 2001, 101, 3747.
[2] K. Ishizu, K. Tsubaki, A. Mori, S. Uchida, Prog.
Polym. Sci. 2003, 28, 27.
[3] M. Zhang, A. H. E. Muller, J. Polym. Sci. Part A.
Polym. Chem. 2005, 43, 3461.
[4] S. S. Sheiko, B. S. Sumerlin, K. Matyjaszewski,
Prog.Polym.Sci. 2008, 33, 759.
[5] I. I. Potemkin, V. V. Palyulin, Polymer Science, Ser. A.
2009, 51, 123.
, Weinheim www.ms-journal.de
Macromol. Symp. 2012, 316, 32–4242
[6] T. M. Birshtein, O. V. Borisov, Ye. B. Zhulina, A. R.
Khokhlov, T. A. Yurasova, Polymer Science 1987, 29, 1293.
[7] G. H. Fredrickson, Macromolecules 1993, 26, 2825.
[8] E. B. Zhulina, T. A. Vilgis, Macromolecules 1995, 28,
1008.
[9] M. Saariaho, O. Ikkala, I. Szleifer, I. Erukhimovich,
G. ten Brinke, J. Chem. Phys. 1997, 107, 3267.
[10] N. A. Denisyuk, Phys. Rev. E. 2003, 67, 051803.
[11] H.-P. Hsu, W. Paul, K. Binder, Macromolecules
2007, 16, 660.
[12] a) K. Terao, Y. Takeo, M. Tazaki, Y. Nakamura,
T. Norisuye, Polym. J. 1999, 31, 193; b) K. Terao,
Y. Nakamura, T. Norisuye, Macromolecules 1999, 32,
711; c) K. Terao, T. Hokajo, Y. Nakamura, T. Norisuye,
Macromolecules 1999, 32, 3690.
[13] a) Y. Tsukahara, S. Kohjiya, K. Tsutsumi,
Y. Okamoto, Macromolecules 1994, 27, 1662; b) N.
Nemoto, M. Nagai, A. Koike, S. Okada, Macromolecules
1995, 28, 3854; c) M. Wintermantel, M. Gerle,
K. Fischer, M. Schmidt, I. Wataoka, H. Urakawa,
K. Kajiwara, Y. Tsukahara, Macromolecules 1996, 29,
978; d) B. Zhang, F. Grohn, J. S. Pedersen, K. Fischer,
M. Schmidt, Macromolecules 2006, 39, 8440.
[14] a) K. Fischer, M. Gerle, M. Schmidt, Polym Mater.
Sci Eng. 1999, 80, 133; b) K. Fischer, M. Schmidt,
Macromol. Rapid Commun. 2001, 22, 787.
[15] D. Lanson, M. Schappacher, A. Deffieux, R. Borsali,
Macromolecules 2006, 39, 7107.
[16] M. I. Bessonov, M. M. Koton, V. V. Kudryavtsev,
L. A. Laius, Polyimides: Thermally Stable Polymers;,
Plenum Press, New York, U.S.A 1987.
Copyright � 2012 WILEY-VCH Verlag GmbH & Co. KGaA
[17] G. I. Nosova, E. L. Aleksandrova, N. A. Solovskaya,
K. A. Romashkova, I. V. Gofman, V. A. Luk’yashina, E. V.
Zhukova, V. V. Kudryavtsev, Polymer Science, Ser. A.
2005, 47, 911.
[18] a) G. Cheng, A. Boker, M. Zhang, G. Krausch, A. H.
E. Muller, Macromolecules 2001, 34, 6883; b) H. G.
Borner, K. Beers, K. Matyjaszewski, S. S. Sheiko,
M. Moller, Macromolecules 2001, 34, 4375.
[19] V. E. Eskin, Light Scattering from Polymer
Solutions, Nauka, Leningrad, Russian 1986.
[20] P. Kratochvil, Classical Light Scattering from Poly-
mer Solution, Elsevier, Amsterdam, Netherlands 1987.
[21] V. N. Tsvetkov, Rigid-Chain Polymers, Plenum
Press, New York, USA 1989.
[22] H. Yamakawa, Modern Theory of Polymer
Solutions, Harper and Row, New York, USA 1971.
[23] C. J. Rueb, C. F. Zukoski, J. Rheol. 1998, 42, 1451.
[24] a) H.-G. Elias, E. Macnner, Macromol. Chem. 1960,
40, 207; b) T. A. Ritscher, H.-G. Elias, Macromol. Chem.
1959, 30, 40.
[25] T. K. Meleshko, D. M. Il’gach, N. N. Bogorad, N. V.
Kukarkina, E. N. Vlasova, A. V. Dobrodumov, I. I.
Malakhova, N. I. Gorshkov, V. D. Krasikov, A. V. Yaki-
manskii, Polymer Science, Ser. B. 2010, 52, 589.
[26] W. Burchard, Adv. Polym. Sci. 1999, 143, 113.
[27] A. A. Starostina, A. R. Khokhlov, A. A. Klochkov,
V. V. Vasilevskaya, Polymer Science, Ser. A. 2008, 50,
1008.
[28] P. Kosovan, J. Kuldova, Z. Limpouchova,
K. Prochazka, E. B. Zhulina, O. V. Borisov, Macro-
molecules 2009, 42, 6748.
, Weinheim www.ms-journal.de
Macromol. Symp. 2012, 316, 43–51 DOI: 10.1002/masy.201250606 43
1 In
A
bu
Fa
E-2 N.
M
so
Cop
Hydrodynamic Properties of ‘‘Pseudo-Dendrimer’’
Alexander P. Filippov,*1 Alina I. Amirova,1 Elena V. Belyaeva,1
Elena B. Tarabukina,1 Natalia A. Sheremetyeva,2 Aziz M. Muzafarov2
Summary: Hyperbranched polycarbosilane with terminal butyl groups is obtained by
chemical modification of hyperbranched polyallylcarbosilane using the reaction of
hydrosilylation with methyldichlorosilane, followed by treatment of the polychlor-
osilyl derivative with butyllithium. Its hydrodynamic and conformational properties
are studied by the methods of light scattering, sedimentation-diffusion analysis, and
viscosimetry in dilute solutions of methyl-tert-butyl ether, hexane, THF, chloroform,
and toluene. The results obtained are compared with the data for the initial
polyallylcarbosilane and carbosilane dendrimer with butyl terminal groups. It is
demonstrated that branching regularity is the decisive factor determining the
solution properties at fixed degree of the branching.
Keywords: hyperbranched polymers; light scattering; regularity of branching; solution
properties; viscosity
Introduction
The properties of hyperbranched polymers
at fixed chemical structure of monomer
units and molar mass (MM) are determined
by a number of structural parameters such
as the degree of branching DB,[1,2] the
Wiener index W,[3] and the regularity of
their structure. Variation in these para-
meters leads to change in molecular con-
formation which is responsible for the
essential difference in hydrodynamic beha-
vior of polymer in solution.
The degree of branching characterizes
the ratio of different types of monomer
units in macromolecule. Usually either
J.M.J. Frechet equation[1]
DB ¼ ðND þNTÞ=ðND þNL þNTÞ (1)
or H. Frey relation[2]
DB ¼ 2ND=ð2ND þNLÞ (2)
stitute of Macromolecular Compounds of Russian
cademy of Sciences, Bolshoy pr., 31, Saint-Peters-
rg 199004, Russia
x: (þ7) 812 3286869;
mail: [email protected]
S. Enikolopov Institute of Synthetic Polymeric
aterials of Russian Academy of Sciences, Prof-
yuznaya st., 70, Moscow 117393, Russia
yright � 2012 WILEY-VCH Verlag GmbH & Co. KGaA
are used for quantitative estimation of DB
of hyperbranched polymers synthesized
from AB2-type monomers, where NL, ND,
and NT are the number of linear, dendritic,
and terminal units, correspondingly. In
practice DB is controlled by the synthesis
conditions. In some cases reliable monitor-
ing of the process can be carried out based
on the data, e.g., of the NMR methods.[4–6]
Increase in the degree of branching leads to
decrease in the asymmetry of macromole-
cular shape and growth of the fraction of
polymer substance in the volume which the
macromolecule occupies in the solution. It
is accompanied by changes in hydrody-
namic properties. In particular, the expo-
nent a in the Mark-Kuhn equation for
intrinsic viscosity [h] increases from (0.1–
0.2) to a¼ 0.5 and even more.[7–9]
The Wiener index describes the spatial
arrangement of atoms of the macromole-
cule. Its value is determined as
W ¼ 1
2
XN
j
XN
i
dij (3)
where N is the number of monomer units
in the macromolecule (polymerization
degree) and dij is the number of bonds
separating i- and j-element (unit) of the
, Weinheim wileyonlinelibrary.com
Macromol. Symp. 2012, 316, 43–5144
structure along the shortest chain contour
between them. The Wiener index is a direct
measure of macromolecule compact-
ness.[10] In the case of the hyperbranched
macromolecule the W value is minimal
when the dendritic units are mainly located
in its center, to be more precise - near the
growth point (focal point), while at the
periphery mainly linear chains prevail. The
W index is maximal for hyperbranched
macromolecules with the ‘‘core’’ built
mainly from linear fragments and branch-
ing units concentrated in the ‘‘shell’’.
Theory predicts that conformational and
hydrodynamic properties of hyperbranched
polymers depend strongly on W.[11–16] For
example, at fixed MM intrinsic viscosity [h]
� Wa, with exponent a increasing with the
growth of polymerization degree. At pre-
sent it appears to be difficult to perform
controlled changing of the Wiener index
during the synthesis of hyperbranched
polymers and experimentally estimate the
W value. Though there are several works in
which polymers obtained by grafting of
hyperbranched blocks to ends of either star
arm[17,18] or linear chain,[19–22] it does not
seem quite correct to consider such systems
as hyperbranched polymers.
The regularity of branching means the
presence of certain patterns in the distribu-
tion of dendritic monomer units in macro-
molecule. Such patterns are a characteristic
feature of dendrimers, therefore they are
often called regular hyperbranched poly-
mers. In dendrimers the centers of branch-
ing are located at fixed distances from the
focal point. Moving from the growth center
along the chain contour in any direction, the
same set of structural elements at the same
distance can be found. It is the absence of
such branching pattern that is the main
differential feature of the hyperbranched
polymer as opposed to the dendrimer.
It seems difficult, if at all possible, to
synthesize a hyperbranched macromole-
cule with the degree of branching not equal
to 1, which is also characterized by regular
structure. On the other hand, as early as in
1998 H Fray reported synthesizing hyper-
branched polycarbosilane with DB � 1[23]
Copyright � 2012 WILEY-VCH Verlag GmbH & Co. KGaA
based on AB3-type monomer, though
detailed studies of its properties were not
made.
The important question is how the
behavior of hyperbranched systems with
DB¼ 1 differs from that observed for
dendrimers, on the one hand, and from
hyperbranched polymers with DB 6¼ 1, on
the other hand. Which of the factors,
branching regularity or branching degree,
is decisive in the formation of the branched
macromolecule properties? To answer this
question, we studied hyperbranched poly-
carbosilane with butyl terminal groups (PCS-
3-Bu) by the methods of molecular hydro-
dynamics and optics in dilute solutions.
The results obtained for PCS-3-Bu were
compared with the similar data for the
carbosilane dendrimers of sixth generation
with butyl groups in the surface layer of
their molecular structure (G6(Bu)) studied
earlier[24] and hyperbranched polymethy-
lallylcarbosilane (PCS-3-All)[25,26] modi-
fied into PCS-3-Bu.
Experimental Part
Preparation of Hyperbranched
Polymethylallylcarbosilane with
Methylchlorosilyl Groups
The mixture of 13.30 g (0.115 mol) of
methydichlorosilane, 8 cm3 of dry hexane,
4.5 g (0.036 mol) of polymethylallylcarbosi-
lane, and 30 ml of PC-072 catalyst was kept
in a sealed vessel under argon at ambient
temperature for 4 days, until, according to
the 1H NMR data, CH¼CH2 bonds com-
pletely disappeared. The reaction mixture
was maintained in vacuo for 2 hours to
obtain a transparent dense polymer used in
further reactions. 1H NMR spectrum
(250 MHz, CDCl3, d): -0.09 (m, 3H,
Si(CH3)), 0.59 (m, 6H, Si(CH3)CH2�),
0.80 (s, 3H, Si(CH3)Cl2), 1.29 (m, 4H,
�CH2�), 1.50 (m, 2H, �CH2Si(CH3)Cl2).
Synthesis of Hyperbranched Polymer with
Butyl groups
17 cm3 of dry THF was added to 86 cm3 of
2.5 mol butyllithium in hexane cooled
, Weinheim www.ms-journal.de
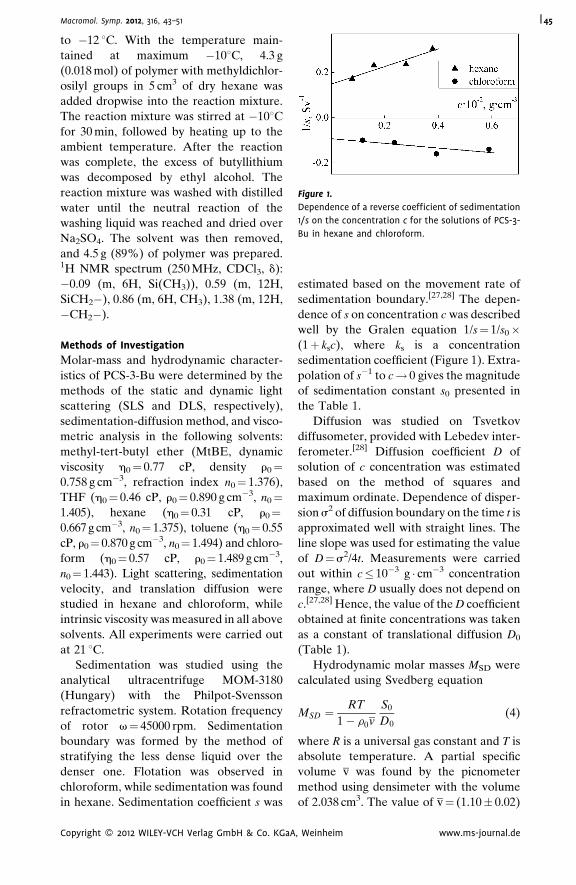
Figure 1.
Dependence of a reverse coefficient of sedimentation
1/s on the concentration c for the solutions of PCS-3-
Bu in hexane and chloroform.
Macromol. Symp. 2012, 316, 43–51 45
to �12 8C. With the temperature main-
tained at maximum �108C, 4.3 g
(0.018 mol) of polymer with methyldichlor-
osilyl groups in 5 cm3 of dry hexane was
added dropwise into the reaction mixture.
The reaction mixture was stirred at �108Cfor 30 min, followed by heating up to the
ambient temperature. After the reaction
was complete, the excess of butyllithium
was decomposed by ethyl alcohol. The
reaction mixture was washed with distilled
water until the neutral reaction of the
washing liquid was reached and dried over
Na2SO4. The solvent was then removed,
and 4.5 g (89%) of polymer was prepared.1H NMR spectrum (250 MHz, CDCl3, d):
�0.09 (m, 6H, Si(CH3)), 0.59 (m, 12H,
SiCH2�), 0.86 (m, 6H, CH3), 1.38 (m, 12H,
�CH2�).
Methods of Investigation
Molar-mass and hydrodynamic character-
istics of PCS-3-Bu were determined by the
methods of the static and dynamic light
scattering (SLS and DLS, respectively),
sedimentation-diffusion method, and visco-
metric analysis in the following solvents:
methyl-tert-butyl ether (MtBE, dynamic
viscosity h0¼ 0.77 cP, density r0¼0.758 g cm�3, refraction index n0¼ 1.376),
THF (h0¼ 0.46 cP, r0¼ 0.890 g cm�3, n0¼1.405), hexane (h0¼ 0.31 cP, r0¼0.667 g cm�3, n0¼ 1.375), toluene (h0¼ 0.55
cP, r0¼ 0.870 g cm�3, n0¼ 1.494) and chloro-
form (h0¼ 0.57 cP, r0¼ 1.489 g cm�3,
n0¼ 1.443). Light scattering, sedimentation
velocity, and translation diffusion were
studied in hexane and chloroform, while
intrinsic viscosity was measured in all above
solvents. All experiments were carried out
at 21 8C.
Sedimentation was studied using the
analytical ultracentrifuge MOM-3180
(Hungary) with the Philpot-Svensson
refractometric system. Rotation frequency
of rotor v¼ 45000 rpm. Sedimentation
boundary was formed by the method of
stratifying the less dense liquid over the
denser one. Flotation was observed in
chloroform, while sedimentation was found
in hexane. Sedimentation coefficient s was
Copyright � 2012 WILEY-VCH Verlag GmbH & Co. KGaA
estimated based on the movement rate of
sedimentation boundary.[27,28] The depen-
dence of s on concentration c was described
well by the Gralen equation 1/s¼ 1/s0�(1þ ksc), where ks is a concentration
sedimentation coefficient (Figure 1). Extra-
polation of s�1 to c! 0 gives the magnitude
of sedimentation constant s0 presented in
the Table 1.
Diffusion was studied on Tsvetkov
diffusometer, provided with Lebedev inter-
ferometer.[28] Diffusion coefficient D of
solution of c concentration was estimated
based on the method of squares and
maximum ordinate. Dependence of disper-
sion s2 of diffusion boundary on the time t is
approximated well with straight lines. The
line slope was used for estimating the value
of D¼s2/4t. Measurements were carried
out within c� 10�3 g � cm�3 concentration
range, where D usually does not depend on
c.[27,28] Hence, the value of the D coefficient
obtained at finite concentrations was taken
as a constant of translational diffusion D0
(Table 1).
Hydrodynamic molar masses MSD were
calculated using Svedberg equation
MSD ¼RT
1� r0v
S0
D0(4)
where R is a universal gas constant and T is
absolute temperature. A partial specific
volume v was found by the picnometer
method using densimeter with the volume
of 2.038 cm3. The value of v¼ (1.10� 0.02)
, Weinheim www.ms-journal.de
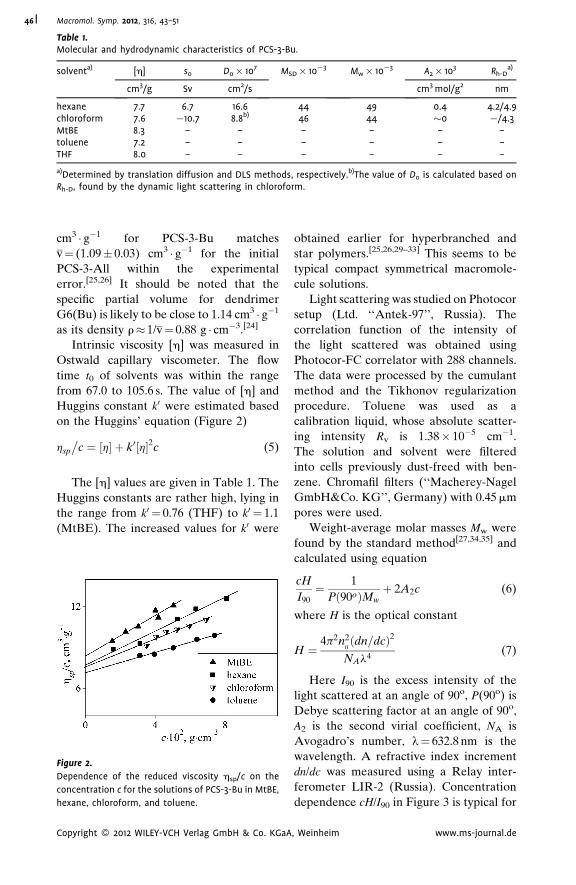
Table 1.Molecular and hydrodynamic characteristics of PCS-3-Bu.
solventa) [h] s0 D0� 107 MSD� 10�3 Mw� 10�3 A2� 103 Rh-Da)
cm3/g Sv cm2/s cm3 mol/g2 nm
hexane 7.7 6.7 16.6 44 49 0.4 4.2/4.9chloroform 7.6 �10.7 8.8b) 46 44 �0 �/4.3MtBE 8.3 – – – – – –toluene 7.2 – – – – – –THF 8.0 – – – – – –
a)Determined by translation diffusion and DLS methods, respectively.b)The value of D0 is calculated based onRh-D, found by the dynamic light scattering in chloroform.
Macromol. Symp. 2012, 316, 43–5146
cm3 � g�1 for PCS-3-Bu matches
v¼ (1.09� 0.03) cm3 � g�1 for the initial
PCS-3-All within the experimental
error.[25,26] It should be noted that the
specific partial volume for dendrimer
G6(Bu) is likely to be close to 1.14 cm3 � g�1
as its density r� 1/v¼ 0.88 g � cm�3.[24]
Intrinsic viscosity [h] was measured in
Ostwald capillary viscometer. The flow
time t0 of solvents was within the range
from 67.0 to 105.6 s. The value of [h] and
Huggins constant k0 were estimated based
on the Huggins’ equation (Figure 2)
hsp
�c ¼ h½ � þ k0 h½ �2c (5)
The [h] values are given in Table 1. The
Huggins constants are rather high, lying in
the range from k0 ¼ 0.76 (THF) to k0 ¼ 1.1
(MtBE). The increased values for k0 were
Figure 2.
Dependence of the reduced viscosity hsp/c on the
concentration c for the solutions of PCS-3-Bu in MtBE,
hexane, chloroform, and toluene.
Copyright � 2012 WILEY-VCH Verlag GmbH & Co. KGaA
obtained earlier for hyperbranched and
star polymers.[25,26,29–33] This seems to be
typical compact symmetrical macromole-
cule solutions.
Light scattering was studied on Photocor
setup (Ltd. ‘‘Antek-97’’, Russia). The
correlation function of the intensity of
the light scattered was obtained using
Photocor-FC correlator with 288 channels.
The data were processed by the cumulant
method and the Tikhonov regularization
procedure. Toluene was used as a
calibration liquid, whose absolute scatter-
ing intensity Rv is 1.38� 10�5 cm�1.
The solution and solvent were filtered
into cells previously dust-freed with ben-
zene. Chromafil filters (‘‘Macherey-Nagel
GmbH&Co. KG’’, Germany) with 0.45 mm
pores were used.
Weight-average molar masses Mw were
found by the standard method[27,34,35] and
calculated using equation
cH
I90¼ 1
Pð90oÞMwþ 2A2c (6)
where H is the optical constant
H ¼4p2n2
0ðdn=dcÞ2
NAl4(7)
Here I90 is the excess intensity of the
light scattered at an angle of 90o, P(90o) is
Debye scattering factor at an angle of 90o,
A2 is the second virial coefficient, NA is
Avogadro’s number, l¼ 632.8 nm is the
wavelength. A refractive index increment
dn/dc was measured using a Relay inter-
ferometer LIR-2 (Russia). Concentration
dependence cH/I90 in Figure 3 is typical for
, Weinheim www.ms-journal.de
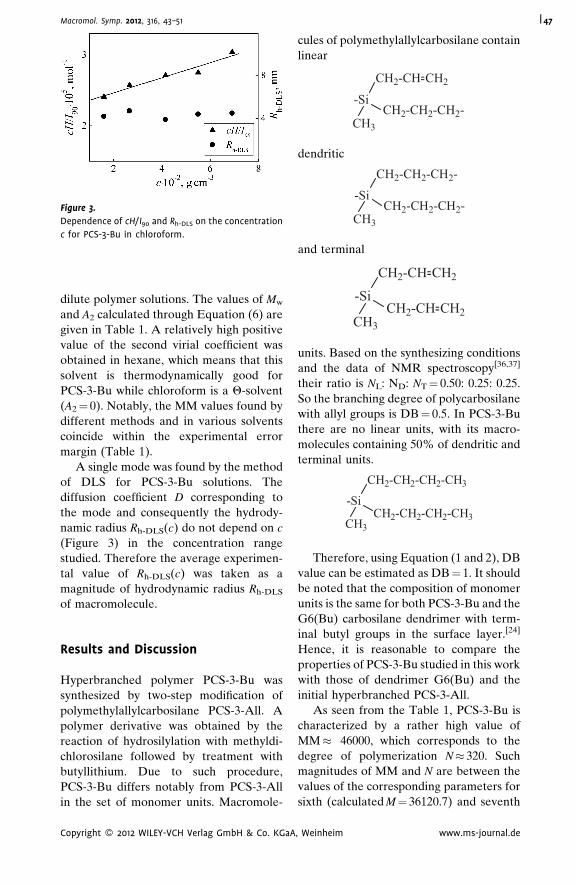
Figure 3.
Dependence of cH/I90 and Rh-DLS on the concentration
c for PCS-3-Bu in chloroform.
Macromol. Symp. 2012, 316, 43–51 47
dilute polymer solutions. The values of Mw
and A2 calculated through Equation (6) are
given in Table 1. A relatively high positive
value of the second virial coefficient was
obtained in hexane, which means that this
solvent is thermodynamically good for
PCS-3-Bu while chloroform is a Q-solvent
(A2¼ 0). Notably, the MM values found by
different methods and in various solvents
coincide within the experimental error
margin (Table 1).
A single mode was found by the method
of DLS for PCS-3-Bu solutions. The
diffusion coefficient D corresponding to
the mode and consequently the hydrody-
namic radius Rh-DLS(c) do not depend on c
(Figure 3) in the concentration range
studied. Therefore the average experimen-
tal value of Rh-DLS(c) was taken as a
magnitude of hydrodynamic radius Rh-DLS
of macromolecule.
Results and Discussion
Hyperbranched polymer PCS-3-Bu was
synthesized by two-step modification of
polymethylallylcarbosilane PCS-3-All. A
polymer derivative was obtained by the
reaction of hydrosilylation with methyldi-
chlorosilane followed by treatment with
butyllithium. Due to such procedure,
PCS-3-Bu differs notably from PCS-3-All
in the set of monomer units. Macromole-
Copyright � 2012 WILEY-VCH Verlag GmbH & Co. KGaA
cules of polymethylallylcarbosilane contain
linear
-Si
CH3
CH2-CH CH2
CH2-CH2-CH2-
--
dendritic
-Si
CH3
CH2-CH2-CH2-
CH2-CH2-CH2-
and terminal
-Si
CH3
CH2-CH CH2--
CH2-CH CH2--
units. Based on the synthesizing conditions
and the data of NMR spectroscopy[36,37]
their ratio is NL: ND: NT¼ 0.50: 0.25: 0.25.
So the branching degree of polycarbosilane
with allyl groups is DB¼ 0.5. In PCS-3-Bu
there are no linear units, with its macro-
molecules containing 50% of dendritic and
terminal units.
-Si
CH3
CH2-CH2-CH2-CH3
CH2-CH2-CH2-CH3
Therefore, using Equation (1 and 2), DB
value can be estimated as DB¼ 1. It should
be noted that the composition of monomer
units is the same for both PCS-3-Bu and the
G6(Bu) carbosilane dendrimer with term-
inal butyl groups in the surface layer.[24]
Hence, it is reasonable to compare the
properties of PCS-3-Bu studied in this work
with those of dendrimer G6(Bu) and the
initial hyperbranched PCS-3-All.
As seen from the Table 1, PCS-3-Bu is
characterized by a rather high value of
MM� 46000, which corresponds to the
degree of polymerization N� 320. Such
magnitudes of MM and N are between the
values of the corresponding parameters for
sixth (calculated M¼ 36120.7) and seventh
, Weinheim www.ms-journal.de
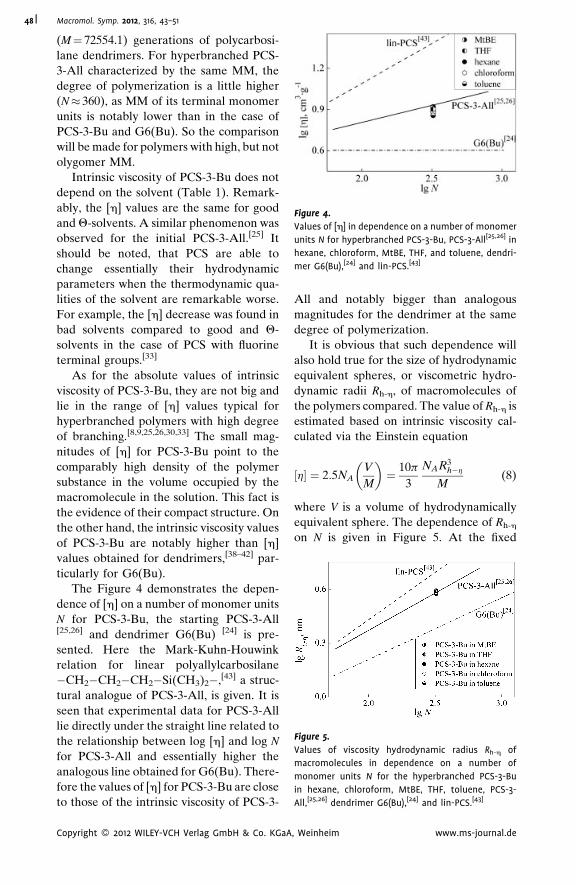
Figure 4.
Values of [h] in dependence on a number of monomer
units N for hyperbranched PCS-3-Bu, PCS-3-All[25,26] in
hexane, chloroform, MtBE, THF, and toluene, dendri-
mer G6(Bu),[24] and lin-PCS.[43]
Figure 5.
Values of viscosity hydrodynamic radius Rh-h of
macromolecules in dependence on a number of
monomer units N for the hyperbranched PCS-3-Bu
in hexane, chloroform, MtBE, THF, toluene, PCS-3-
All,[25,26] dendrimer G6(Bu),[24] and lin-PCS.[43]
Macromol. Symp. 2012, 316, 43–5148
(M¼ 72554.1) generations of polycarbosi-
lane dendrimers. For hyperbranched PCS-
3-All characterized by the same MM, the
degree of polymerization is a little higher
(N� 360), as MM of its terminal monomer
units is notably lower than in the case of
PCS-3-Bu and G6(Bu). So the comparison
will be made for polymers with high, but not
olygomer MM.
Intrinsic viscosity of PCS-3-Bu does not
depend on the solvent (Table 1). Remark-
ably, the [h] values are the same for good
and Q-solvents. A similar phenomenon was
observed for the initial PCS-3-All.[25] It
should be noted, that PCS are able to
change essentially their hydrodynamic
parameters when the thermodynamic qua-
lities of the solvent are remarkable worse.
For example, the [h] decrease was found in
bad solvents compared to good and Q-
solvents in the case of PCS with fluorine
terminal groups.[33]
As for the absolute values of intrinsic
viscosity of PCS-3-Bu, they are not big and
lie in the range of [h] values typical for
hyperbranched polymers with high degree
of branching.[8,9,25,26,30,33] The small mag-
nitudes of [h] for PCS-3-Bu point to the
comparably high density of the polymer
substance in the volume occupied by the
macromolecule in the solution. This fact is
the evidence of their compact structure. On
the other hand, the intrinsic viscosity values
of PCS-3-Bu are notably higher than [h]
values obtained for dendrimers,[38–42] par-
ticularly for G6(Bu).
The Figure 4 demonstrates the depen-
dence of [h] on a number of monomer units
N for PCS-3-Bu, the starting PCS-3-All[25,26] and dendrimer G6(Bu) [24] is pre-
sented. Here the Mark-Kuhn-Houwink
relation for linear polyallylcarbosilane
�CH2�CH2�CH2�Si(CH3)2�,[43] a struc-
tural analogue of PCS-3-All, is given. It is
seen that experimental data for PCS-3-All
lie directly under the straight line related to
the relationship between log [h] and log N
for PCS-3-All and essentially higher the
analogous line obtained for G6(Bu). There-
fore the values of [h] for PCS-3-Bu are close
to those of the intrinsic viscosity of PCS-3-
Copyright � 2012 WILEY-VCH Verlag GmbH & Co. KGaA
All and notably bigger than analogous
magnitudes for the dendrimer at the same
degree of polymerization.
It is obvious that such dependence will
also hold true for the size of hydrodynamic
equivalent spheres, or viscometric hydro-
dynamic radii Rh-h, of macromolecules of
the polymers compared. The value of Rh-h is
estimated based on intrinsic viscosity cal-
culated via the Einstein equation
h½ � ¼ 2:5NAV
M
� �¼ 10p
3
NAR3h�h
M(8)
where V is a volume of hydrodynamically
equivalent sphere. The dependence of Rh-h
on N is given in Figure 5. At the fixed
, Weinheim www.ms-journal.de
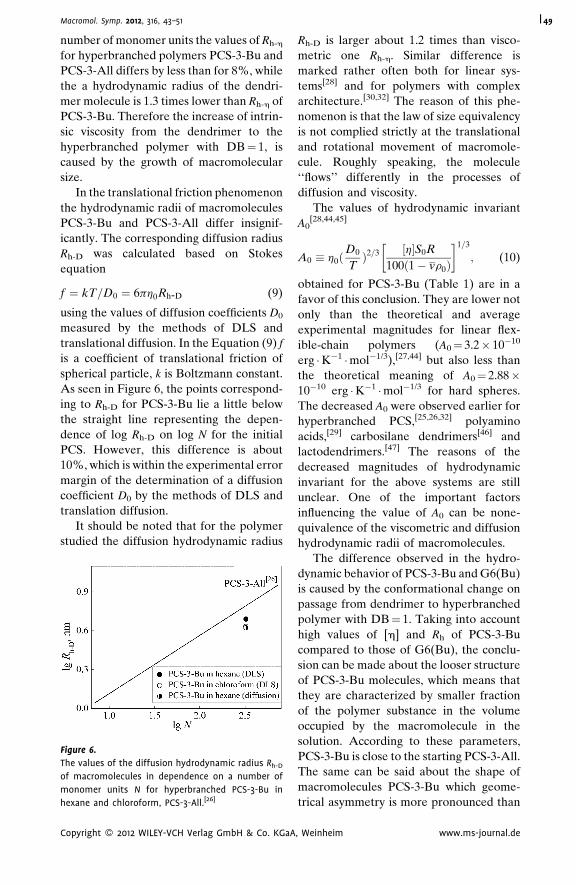
Macromol. Symp. 2012, 316, 43–51 49
number of monomer units the values of Rh-h
for hyperbranched polymers PCS-3-Bu and
PCS-3-All differs by less than for 8%, while
the a hydrodynamic radius of the dendri-
mer molecule is 1.3 times lower than Rh-h of
PCS-3-Bu. Therefore the increase of intrin-
sic viscosity from the dendrimer to the
hyperbranched polymer with DB¼ 1, is
caused by the growth of macromolecular
size.
In the translational friction phenomenon
the hydrodynamic radii of macromolecules
PCS-3-Bu and PCS-3-All differ insignif-
icantly. The corresponding diffusion radius
Rh-D was calculated based on Stokes
equation
f ¼ kT=D0 ¼ 6ph0Rh-D (9)
using the values of diffusion coefficients D0
measured by the methods of DLS and
translational diffusion. In the Equation (9) f
is a coefficient of translational friction of
spherical particle, k is Boltzmann constant.
As seen in Figure 6, the points correspond-
ing to Rh-D for PCS-3-Bu lie a little below
the straight line representing the depen-
dence of log Rh-D on log N for the initial
PCS. However, this difference is about
10%, which is within the experimental error
margin of the determination of a diffusion
coefficient D0 by the methods of DLS and
translation diffusion.
It should be noted that for the polymer
studied the diffusion hydrodynamic radius
Figure 6.
The values of the diffusion hydrodynamic radius Rh-D
of macromolecules in dependence on a number of
monomer units N for hyperbranched PCS-3-Bu in
hexane and chloroform, PCS-3-All.[26]
Copyright � 2012 WILEY-VCH Verlag GmbH & Co. KGaA
Rh-D is larger about 1.2 times than visco-
metric one Rh-h. Similar difference is
marked rather often both for linear sys-
tems[28] and for polymers with complex
architecture.[30,32] The reason of this phe-
nomenon is that the law of size equivalency
is not complied strictly at the translational
and rotational movement of macromole-
cule. Roughly speaking, the molecule
‘‘flows’’ differently in the processes of
diffusion and viscosity.
The values of hydrodynamic invariant
A0[28,44,45]
A0 h0ðD0
TÞ2=3 ½h�S0R
100ð1� vr0Þ
� �1=3
; (10)
obtained for PCS-3-Bu (Table 1) are in a
favor of this conclusion. They are lower not
only than the theoretical and average
experimental magnitudes for linear flex-
ible-chain polymers (A0¼ 3.2� 10�10
erg �K�1 �mol�1/3),[27,44] but also less than
the theoretical meaning of A0¼ 2.88�10�10 erg �K�1 �mol�1/3 for hard spheres.
The decreased A0 were observed earlier for
hyperbranched PCS,[25,26,32] polyamino
acids,[29] carbosilane dendrimers[46] and
lactodendrimers.[47] The reasons of the
decreased magnitudes of hydrodynamic
invariant for the above systems are still
unclear. One of the important factors
influencing the value of A0 can be none-
quivalence of the viscometric and diffusion
hydrodynamic radii of macromolecules.
The difference observed in the hydro-
dynamic behavior of PCS-3-Bu and G6(Bu)
is caused by the conformational change on
passage from dendrimer to hyperbranched
polymer with DB¼ 1. Taking into account
high values of [h] and Rh of PCS-3-Bu
compared to those of G6(Bu), the conclu-
sion can be made about the looser structure
of PCS-3-Bu molecules, which means that
they are characterized by smaller fraction
of the polymer substance in the volume
occupied by the macromolecule in the
solution. According to these parameters,
PCS-3-Bu is close to the starting PCS-3-All.
The same can be said about the shape of
macromolecules PCS-3-Bu which geome-
trical asymmetry is more pronounced than
, Weinheim www.ms-journal.de
Macromol. Symp. 2012, 316, 43–5150
that of molecules of dendrimer G6(Bu).
However, additional studies such as the
Mark-Kuhn dependence for the hydrody-
namic parameters are required to make
more valid conclusions about the shapes of
PCS-3-Bu macromolecules.
Conclusion
Analysis of the data obtained allows us to
conclude that, in terms of its hydrodynamic
and conformational behavior, the hyper-
branched PCS with the degree of branching
DB¼ 1 is closer to hyperbranched poly-
mers with DB¼ 0.5 than to dendrimers.
Hence, the statistical distribution of
branching points even at maximal DB¼ 1
results in a significant difference between
the hydrodynamic properties of such poly-
mer and those of the branched polymer
with regular structure (dendrimer).
Correspondingly, other conditions being
equal (the chemical composition and the set
of monomer units, MM, and the degree of
branching), hydrodynamic properties of
branched polymers are defined for the
most part by the regularity of branching.
Moreover, taking into account the obtained
values for hydrodynamic parameters for
PCS, an assumption can be made that the
behavior of hyperbranched polymers at the
high degrees of branching (DB 0.5) is
more sensitive to the change of the
regularity of their structure than to the
DB increase.
Acknowledgements: The work was supported bythe Russian Foundation for Basic Research(project 11-03-00353) and the Program No 3 ofDepartment of Chemistry and Material Scienceof the Russian Academy of Sciences ‘‘Creationand study of macromolecules and macromole-cular structures of a new generation’’.
[1] C. J. Hawker, R. Lee, J. M. J. Frechet, J. Am. Chem. Soc.
1991, 113, 4583.
[2] D. Holter, A. Burgath, H. Frey, Acta Polym. 1997, 48,
30.
[3] H. Wiener, J. Am. Chem. Soc. 1947, 69, 17.
Copyright � 2012 WILEY-VCH Verlag GmbH & Co. KGaA
[4] C. J. Hawker, F. Chu, Macromolecules 1996, 29,
4370.
[5] H. Magnusson, E. Malmstrom, A. Hult,
M. Johansson, Polymer 2002, 43, 301.
[6] D. P. Bernal, L. Bedrossian, K. Collins, E. Fossum,
Macromolecules 2003, 36, 333.
[7] A. Lederer, D. Voigt, S. Clausnitzer, B. Voit,
J. Chromatogr. A 2002, 976, 171.
[8] H. Mori, D. C. Seng, H. Lecher, M. Zhang, A. H. E.
Muller, Macromolecules 2002, 35, 9270.
[9] H. Mori, A. Walther, X. Andre, M. G. Lanzendorfer,
A. H. E. Muller, Macromolecules 2004, 37, 2054.
[10] D. Bonchev, N. Trinajstic, J. Chem. Phys. 1977, 67,
4517.
[11] A. H. Widmann, G. R. Davies, Comput. Theor. Polym.
Sci. 1998, 8, 191.
[12] A. V. Lyulin, D. B. Adolf, G. R. Davies, Macromol-
ecules 2001, 34, 3783.
[13] D. Bonchev, E. J. Markel, A. H. Dekmezian, Polymer
2002, 43, 203.
[14] K.-H. Nitta, J. Chem. Phys. 1994, 101, 4222.
[15] P. F. Sheridan, D. B. Adolf, A. V. Lyulin, I. Neelov,
G. R. Davies, J. Chem. Phys. 2002, 117, 7802.
[16] E. V. Reshetnikov, A. A. Darinsky, A. V. Lyulin, S. V.
Lyulin, Polymer Science, Ser. A., in press.
[17] K. Ishizu, D. Takahashi, H. Takeda, Polymer 2000,
41, 6081.
[18] T. Higashihara, K. Sugiyama, H.-S. Yoo,
M. Hayashi, A. Hirao, Macromol. Rapid Commun.
2010, 31, 1031.
[19] N. Hadjichristidis, M. Pitsikalis, S. Pispas, H. Iatrou,
Chem. Rev. 2001, 101, 3747.
[20] H. Iatrou, M. Pitsikalis, N. Hadjichristidis, In
Modification and Blending of Synthetic and Natural
Macromolecules, (Eds., F. Ciardelli, S. Penczek),
Springer, Berlin, Germany 2004, Ch. 5.
[21] E. R. Gasilova, M. A. Koblyakova, A. P. Filippov,
O. G. Zakharova, S. D. Zaitsev, Yu. D. Semchikov,
Polymer Science, Ser. A 2006, 48, 989.
[22] O. G. Zakharova, M. A. Simonova, E. V. Tarasova,
A. P. Filippov, Yu. D. Semchikov, Int. J. Polym. Anal.
Charact. 2009, 14, 460.
[23] C. Lach, H. Frey, Macromolecules 1998, 31, 2381.
[24] E. A. Tatarinova, E. A. Rebrov, V. D. Myakushev,
I. B. Meshkov, N. V. Demchenko, A. V. Bistrova, O. V.
Lebedeva, A. M. Muzafarov, Russian Chem. Bull. 2004,
53, 2591.
[25] E. B. Tarabukina, A. A. Shpyrkov, D. V. Potapova,
E. V. Tarasova, N. A. Shumilkina, A. P. Filippov, A. M.
Muzafarov, Polymer Science, Ser. A 2005, 47, 1304.
[26] E. B. Tarabukina, A. A. Shpyrkov, D. V. Potapova,
A. P. Filippov, N. A. Shumilkina, A. M. Muzafarov,
Polymer Science, Ser. A 2006, 48, 974.
[27] V. N. Tsvetkov, V. E. Eskin, S. Ya. Frenkel’, The
structure of macromolecules in solutions, Nauka,
Moscow, Russia 1964, (In Russian).
[28] V. N. Tsvetkov, Rigid-chain polymers, Plenum, New
York, USA 1986.
, Weinheim www.ms-journal.de
Macromol. Symp. 2012, 316, 43–51 51
[29] E. B. Tarabukina, A. A. Shpyrkov, E. V. Tarasova,
A. I. Amirova, A. P. Filippov, N. A. Sheremetyeva, A. M.
Muzafarov, Polymer Science, Ser. A 2009, 51, 150.
[30] A. A. Shpyrkov, I. I. Tarasenko, G. A. Pankova, I. E.
Ilyina, E. V. Tarasova, E. B. Tarabukina, G. P. Vlasov,
A. P. Filippov, Polymer Science, Ser. A 2009, 51, 250.
[31] L. V. Vinogradova, E. E. Kever, A. P. Filippov,
Polymer Science, Ser. A 2009, 51, 174.
[32] A. P. Filippov, O. A. Romanova, L. V. Vinogradova,
Polymer Science, Ser. A 2010, 52, 221.
[33] A. I. Amirova, E. V. Belyaeva, E. B. Tarabukina, N. A.
Sheremetyeva, A. M. Muzafarov, A. P. Filippov, Polymer
Science, Ser. C 2010, 52, 70.
[34] V. E. Eskin, Light scattering by polymer solutions,
Nauka, Leningrad, Russia 1986, (In Russian).
[35] P. Kratochvil, Classical light scattering from poly-
mer solution, Elsevier, Amsterdam, The Netherlands
1987.
[36] C. Drohmann, M. Moller, O. B. Gorbatsevich, A. M.
Muzafarov, J. Polym. Sci., Part A: Polym. Chem. 2000,
38, 741.
[37] A. M. Muzafarov, O. B. Gorbatsevich, E. A. Rebrov,
G. M. Ignatyeva, T. B. Chenskaya, V. D. Myakushev,
A. F. Bulkin, V. S. Papkov, Polymer Science, Ser. A 1993,
35, 1575.
Copyright � 2012 WILEY-VCH Verlag GmbH & Co. KGaA
[38] I. B. Rietveld, J. A. M. Smith, Macromolecules 1999,
32, 4608.
[39] R. Scherrenberg, B. Coussens, P. Vliet, G. Edouard,
J. Brackman, E. Brabander, Macromolecules 1998, 31,
456.
[40] M. Jeong, M. E. Mackay, R. Vestberg, C. J. Hawker,
Macromolecules 2001, 34, 4927.
[41] T. H. Mourey, S. R. Turner, M. Rubinstein, J. M. J.
Frechet, C. J. Hawker, K. L. Wooley, Macromolecules
1992, 25, 2401.
[42] A. V. Lezov, A. B. Mel’nikov, G. E. Polushina, E. A.
Antonov, M. E. Novitskaya, N. I. Boyko, S. A. Pono-
marenko, E. A. Rebrov, V. P. Shibaev, E. I. Ryumtsev,
A. M. Muzafarov, Doklady Chemistry 2001, 381, 313.
[43] G.-B. Zhang, J. Kong, X.-G. Fan, X.-G. Li, W. Tian,
M. R. Huang, Appl. Organomet. Chem. 2009, 29, 277.
[44] V. N. Tsvetkov, S. I. Klenin, Dokl. Akad. Nauk USSR
1953, 88, 49.
[45] V. N. Tsvetkov, P. N. Lavrenko, S. V. Bushin,
Russian Chem. Rev. 1982, 51, 975.
[46] E. A. Antonov, PhD Thesis, University of Saint-
Petersburg, December, 2004.
[47] G. M. Pavlov, E. V. Korneeva, S. A. Nepogodyev,
K. Jumel, S. E. Harding, Polymer Science, Ser. A 1998, 40,
1282.
, Weinheim www.ms-journal.de
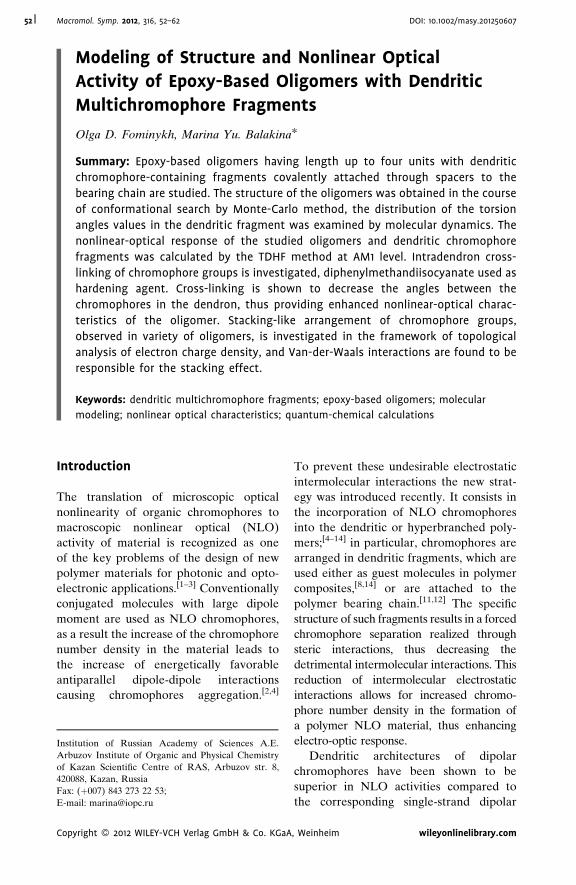
Macromol. Symp. 2012, 316, 52–62 DOI: 10.1002/masy.20125060752
Inst
Arb
of K
4200
Fax:
E-m
Cop
Modeling of Structure and Nonlinear Optical
Activity of Epoxy-Based Oligomers with Dendritic
Multichromophore Fragments
Olga D. Fominykh, Marina Yu. Balakina*
Summary: Epoxy-based oligomers having length up to four units with dendritic
chromophore-containing fragments covalently attached through spacers to the
bearing chain are studied. The structure of the oligomers was obtained in the course
of conformational search by Monte-Carlo method, the distribution of the torsion
angles values in the dendritic fragment was examined by molecular dynamics. The
nonlinear-optical response of the studied oligomers and dendritic chromophore
fragments was calculated by the TDHF method at AM1 level. Intradendron cross-
linking of chromophore groups is investigated, diphenylmethandiisocyanate used as
hardening agent. Cross-linking is shown to decrease the angles between the
chromophores in the dendron, thus providing enhanced nonlinear-optical charac-
teristics of the oligomer. Stacking-like arrangement of chromophore groups,
observed in variety of oligomers, is investigated in the framework of topological
analysis of electron charge density, and Van-der-Waals interactions are found to be
responsible for the stacking effect.
Keywords: dendritic multichromophore fragments; epoxy-based oligomers; molecular
modeling; nonlinear optical characteristics; quantum-chemical calculations
Introduction
The translation of microscopic optical
nonlinearity of organic chromophores to
macroscopic nonlinear optical (NLO)
activity of material is recognized as one
of the key problems of the design of new
polymer materials for photonic and opto-
electronic applications.[1–3] Conventionally
conjugated molecules with large dipole
moment are used as NLO chromophores,
as a result the increase of the chromophore
number density in the material leads to
the increase of energetically favorable
antiparallel dipole-dipole interactions
causing chromophores aggregation.[2,4]
itution of Russian Academy of Sciences A.E.
uzov Institute of Organic and Physical Chemistry
azan Scientific Centre of RAS, Arbuzov str. 8,
88, Kazan, Russia
(þ007) 843 273 22 53;
ail: [email protected]
yright � 2012 WILEY-VCH Verlag GmbH & Co. KGaA
To prevent these undesirable electrostatic
intermolecular interactions the new strat-
egy was introduced recently. It consists in
the incorporation of NLO chromophores
into the dendritic or hyperbranched poly-
mers;[4–14] in particular, chromophores are
arranged in dendritic fragments, which are
used either as guest molecules in polymer
composites,[8,14] or are attached to the
polymer bearing chain.[11,12] The specific
structure of such fragments results in a forced
chromophore separation realized through
steric interactions, thus decreasing the
detrimental intermolecular interactions. This
reduction of intermolecular electrostatic
interactions allows for increased chromo-
phore number density in the formation of
a polymer NLO material, thus enhancing
electro-optic response.
Dendritic architectures of dipolar
chromophores have been shown to be
superior in NLO activities compared to
the corresponding single-strand dipolar
, Weinheim wileyonlinelibrary.com
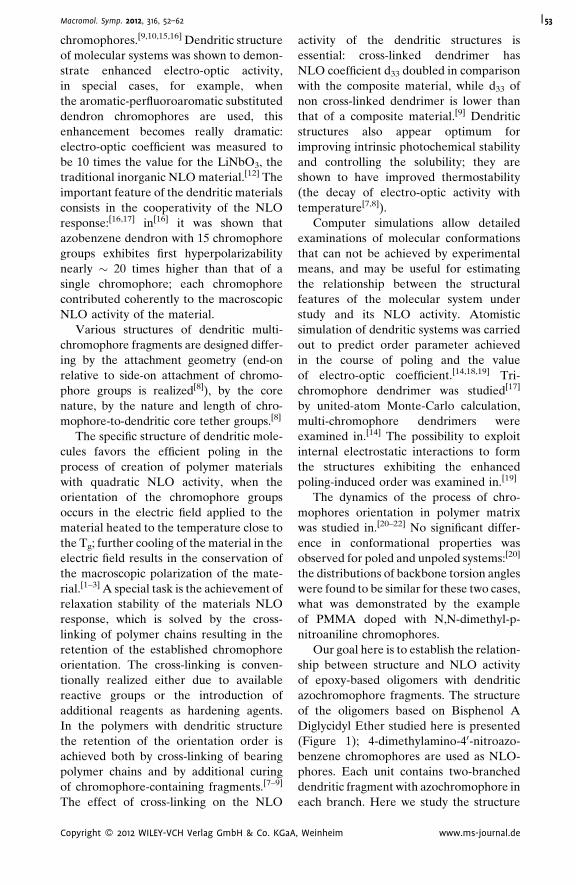
Macromol. Symp. 2012, 316, 52–62 53
chromophores.[9,10,15,16] Dendritic structure
of molecular systems was shown to demon-
strate enhanced electro-optic activity,
in special cases, for example, when
the aromatic-perfluoroaromatic substituted
dendron chromophores are used, this
enhancement becomes really dramatic:
electro-optic coefficient was measured to
be 10 times the value for the LiNbO3, the
traditional inorganic NLO material.[12] The
important feature of the dendritic materials
consists in the cooperativity of the NLO
response:[16,17] in[16] it was shown that
azobenzene dendron with 15 chromophore
groups exhibites first hyperpolarizability
nearly � 20 times higher than that of a
single chromophore; each chromophore
contributed coherently to the macroscopic
NLO activity of the material.
Various structures of dendritic multi-
chromophore fragments are designed differ-
ing by the attachment geometry (end-on
relative to side-on attachment of chromo-
phore groups is realized[8]), by the core
nature, by the nature and length of chro-
mophore-to-dendritic core tether groups.[8]
The specific structure of dendritic mole-
cules favors the efficient poling in the
process of creation of polymer materials
with quadratic NLO activity, when the
orientation of the chromophore groups
occurs in the electric field applied to the
material heated to the temperature close to
the Tg; further cooling of the material in the
electric field results in the conservation of
the macroscopic polarization of the mate-
rial.[1–3] A special task is the achievement of
relaxation stability of the materials NLO
response, which is solved by the cross-
linking of polymer chains resulting in the
retention of the established chromophore
orientation. The cross-linking is conven-
tionally realized either due to available
reactive groups or the introduction of
additional reagents as hardening agents.
In the polymers with dendritic structure
the retention of the orientation order is
achieved both by cross-linking of bearing
polymer chains and by additional curing
of chromophore-containing fragments.[7–9]
The effect of cross-linking on the NLO
Copyright � 2012 WILEY-VCH Verlag GmbH & Co. KGaA
activity of the dendritic structures is
essential: cross-linked dendrimer has
NLO coefficient d33 doubled in comparison
with the composite material, while d33 of
non cross-linked dendrimer is lower than
that of a composite material.[9] Dendritic
structures also appear optimum for
improving intrinsic photochemical stability
and controlling the solubility; they are
shown to have improved thermostability
(the decay of electro-optic activity with
temperature[7,8]).
Computer simulations allow detailed
examinations of molecular conformations
that can not be achieved by experimental
means, and may be useful for estimating
the relationship between the structural
features of the molecular system under
study and its NLO activity. Atomistic
simulation of dendritic systems was carried
out to predict order parameter achieved
in the course of poling and the value
of electro-optic coefficient.[14,18,19] Tri-
chromophore dendrimer was studied[17]
by united-atom Monte-Carlo calculation,
multi-chromophore dendrimers were
examined in.[14] The possibility to exploit
internal electrostatic interactions to form
the structures exhibiting the enhanced
poling-induced order was examined in.[19]
The dynamics of the process of chro-
mophores orientation in polymer matrix
was studied in.[20–22] No significant differ-
ence in conformational properties was
observed for poled and unpoled systems:[20]
the distributions of backbone torsion angles
were found to be similar for these two cases,
what was demonstrated by the example
of PMMA doped with N,N-dimethyl-p-
nitroaniline chromophores.
Our goal here is to establish the relation-
ship between structure and NLO activity
of epoxy-based oligomers with dendritic
azochromophore fragments. The structure
of the oligomers based on Bisphenol A
Diglycidyl Ether studied here is presented
(Figure 1); 4-dimethylamino-40-nitroazo-
benzene chromophores are used as NLO-
phores. Each unit contains two-branched
dendritic fragment with azochromophore in
each branch. Here we study the structure
, Weinheim www.ms-journal.de
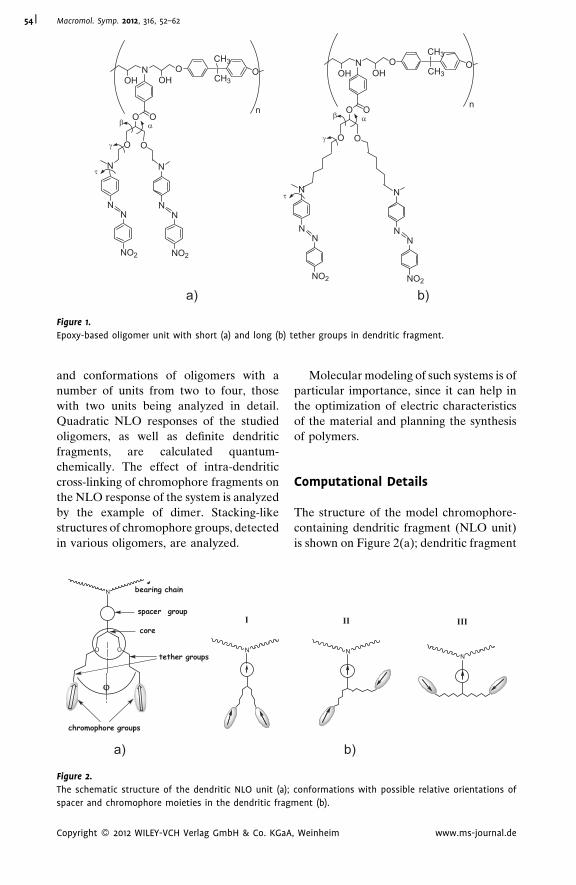
NCH3
CH3
OHO O
OH
nOO
O O
NN
NO2
NN
NO2
N N
αβ
γ
τ
NCH3
CH3
OHO O
OH
nOO
O O
NN
NO2
NN
NO2
N N
αβ
γ
τ
b) a)
Figure 1.
Epoxy-based oligomer unit with short (a) and long (b) tether groups in dendritic fragment.
Macromol. Symp. 2012, 316, 52–6254
and conformations of oligomers with a
number of units from two to four, those
with two units being analyzed in detail.
Quadratic NLO responses of the studied
oligomers, as well as definite dendritic
fragments, are calculated quantum-
chemically. The effect of intra-dendritic
cross-linking of chromophore fragments on
the NLO response of the system is analyzed
by the example of dimer. Stacking-like
structures of chromophore groups, detected
in various oligomers, are analyzed.
N
I
a)
ϕ ϕ
N
OO
chromophore groups
bearing chain
spacer group
core
tether groups
Figure 2.
The schematic structure of the dendritic NLO unit (a);
spacer and chromophore moieties in the dendritic frag
Copyright � 2012 WILEY-VCH Verlag GmbH & Co. KGaA
Molecular modeling of such systems is of
particular importance, since it can help in
the optimization of electric characteristics
of the material and planning the synthesis
of polymers.
Computational Details
The structure of the model chromophore-
containing dendritic fragment (NLO unit)
is shown on Figure 2(a); dendritic fragment
II III
NN
b)
conformations with possible relative orientations of
ment (b).
, Weinheim www.ms-journal.de
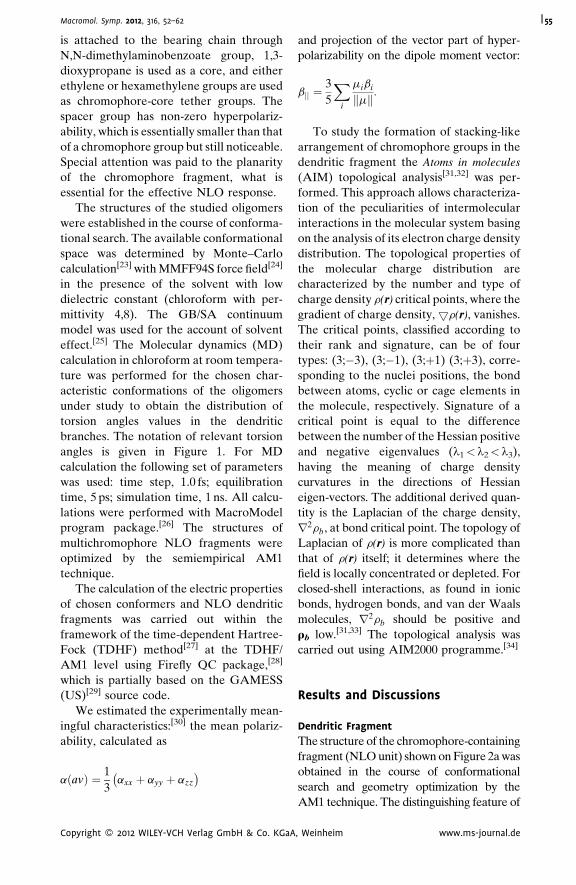
Macromol. Symp. 2012, 316, 52–62 55
is attached to the bearing chain through
N,N-dimethylaminobenzoate group, 1,3-
dioxypropane is used as a core, and either
ethylene or hexamethylene groups are used
as chromophore-core tether groups. The
spacer group has non-zero hyperpolariz-
ability, which is essentially smaller than that
of a chromophore group but still noticeable.
Special attention was paid to the planarity
of the chromophore fragment, what is
essential for the effective NLO response.
The structures of the studied oligomers
were established in the course of conforma-
tional search. The available conformational
space was determined by Monte–Carlo
calculation[23] with MMFF94S force field[24]
in the presence of the solvent with low
dielectric constant (chloroform with per-
mittivity 4,8). The GB/SA continuum
model was used for the account of solvent
effect.[25] The Molecular dynamics (MD)
calculation in chloroform at room tempera-
ture was performed for the chosen char-
acteristic conformations of the oligomers
under study to obtain the distribution of
torsion angles values in the dendritic
branches. The notation of relevant torsion
angles is given in Figure 1. For MD
calculation the following set of parameters
was used: time step, 1.0 fs; equilibration
time, 5 ps; simulation time, 1 ns. All calcu-
lations were performed with MacroModel
program package.[26] The structures of
multichromophore NLO fragments were
optimized by the semiempirical AM1
technique.
The calculation of the electric properties
of chosen conformers and NLO dendritic
fragments was carried out within the
framework of the time-dependent Hartree-
Fock (TDHF) method[27] at the TDHF/
AM1 level using Firefly QC package,[28]
which is partially based on the GAMESS
(US)[29] source code.
We estimated the experimentally mean-
ingful characteristics:[30] the mean polariz-
ability, calculated as
a avð Þ ¼ 1
3axx þ ayy þ azz
� �
Copyright � 2012 WILEY-VCH Verlag GmbH & Co. KGaA
and projection of the vector part of hyper-
polarizability on the dipole moment vector:
bjj ¼3
5
Xi
mibi
mk k:
To study the formation of stacking-like
arrangement of chromophore groups in the
dendritic fragment the Atoms in molecules
(AIM) topological analysis[31,32] was per-
formed. This approach allows characteriza-
tion of the peculiarities of intermolecular
interactions in the molecular system basing
on the analysis of its electron charge density
distribution. The topological properties of
the molecular charge distribution are
characterized by the number and type of
charge density r(r) critical points, where the
gradient of charge density,5r(r), vanishes.
The critical points, classified according to
their rank and signature, can be of four
types: (3;�3), (3;�1), (3;þ1) (3;þ3), corre-
sponding to the nuclei positions, the bond
between atoms, cyclic or cage elements in
the molecule, respectively. Signature of a
critical point is equal to the difference
between the number of the Hessian positive
and negative eigenvalues (l1< l2< l3),
having the meaning of charge density
curvatures in the directions of Hessian
eigen-vectors. The additional derived quan-
tity is the Laplacian of the charge density,
r2rb, at bond critical point. The topology of
Laplacian of r(r) is more complicated than
that of r(r) itself; it determines where the
field is locally concentrated or depleted. For
closed-shell interactions, as found in ionic
bonds, hydrogen bonds, and van der Waals
molecules, r2rb should be positive and
rb low.[31,33] The topological analysis was
carried out using AIM2000 programme.[34]
Results and Discussions
Dendritic Fragment
The structure of the chromophore-containing
fragment (NLO unit) shown on Figure 2a was
obtained in the course of conformational
search and geometry optimization by the
AM1 technique. The distinguishing feature of
, Weinheim www.ms-journal.de
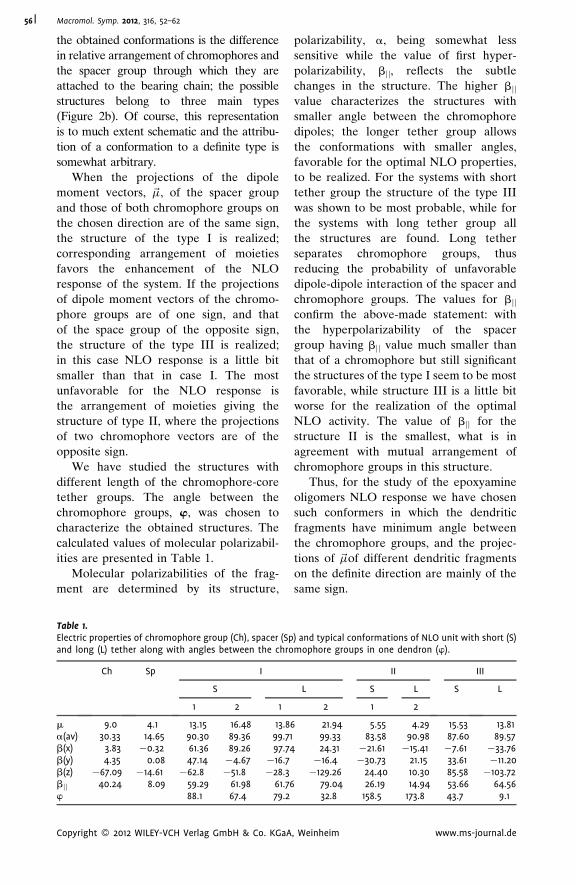
Macromol. Symp. 2012, 316, 52–6256
the obtained conformations is the difference
in relative arrangement of chromophores and
the spacer group through which they are
attached to the bearing chain; the possible
structures belong to three main types
(Figure 2b). Of course, this representation
is to much extent schematic and the attribu-
tion of a conformation to a definite type is
somewhat arbitrary.
When the projections of the dipole
moment vectors, ~m, of the spacer group
and those of both chromophore groups on
the chosen direction are of the same sign,
the structure of the type I is realized;
corresponding arrangement of moieties
favors the enhancement of the NLO
response of the system. If the projections
of dipole moment vectors of the chromo-
phore groups are of one sign, and that
of the space group of the opposite sign,
the structure of the type III is realized;
in this case NLO response is a little bit
smaller than that in case I. The most
unfavorable for the NLO response is
the arrangement of moieties giving the
structure of type II, where the projections
of two chromophore vectors are of the
opposite sign.
We have studied the structures with
different length of the chromophore-core
tether groups. The angle between the
chromophore groups, w, was chosen to
characterize the obtained structures. The
calculated values of molecular polarizabil-
ities are presented in Table 1.
Molecular polarizabilities of the frag-
ment are determined by its structure,
Table 1.Electric properties of chromophore group (Ch), spacer (Spand long (L) tether along with angles between the chro
Ch Sp I
S
1 2 1
m 9.0 4.1 13.15 16.48 13.8a(av) 30.33 14.65 90.30 89.36 99.71b(x) 3.83 �0.32 61.36 89.26 97.74b(y) 4.35 0.08 47.14 �4.67 �16.7b(z) �67.09 �14.61 �62.8 �51.8 �28.3bjj 40.24 8.09 59.29 61.98 61.76w 88.1 67.4 79.2
Copyright � 2012 WILEY-VCH Verlag GmbH & Co. KGaA
polarizability, a, being somewhat less
sensitive while the value of first hyper-
polarizability, bjj, reflects the subtle
changes in the structure. The higher bjjvalue characterizes the structures with
smaller angle between the chromophore
dipoles; the longer tether group allows
the conformations with smaller angles,
favorable for the optimal NLO properties,
to be realized. For the systems with short
tether group the structure of the type III
was shown to be most probable, while for
the systems with long tether group all
the structures are found. Long tether
separates chromophore groups, thus
reducing the probability of unfavorable
dipole-dipole interaction of the spacer and
chromophore groups. The values for bjjconfirm the above-made statement: with
the hyperpolarizability of the spacer
group having bjj value much smaller than
that of a chromophore but still significant
the structures of the type I seem to be most
favorable, while structure III is a little bit
worse for the realization of the optimal
NLO activity. The value of bjj for the
structure II is the smallest, what is in
agreement with mutual arrangement of
chromophore groups in this structure.
Thus, for the study of the epoxyamine
oligomers NLO response we have chosen
such conformers in which the dendritic
fragments have minimum angle between
the chromophore groups, and the projec-
tions of ~mof different dendritic fragments
on the definite direction are mainly of the
same sign.
) and typical conformations of NLO unit with short (S)mophore groups in one dendron (w).
II III
L S L S L
2 1 2
6 21.94 5.55 4.29 15.53 13.8199.33 83.58 90.98 87.60 89.5724.31 �21.61 �15.41 �7.61 �33.76�16.4 �30.73 21.15 33.61 �11.20�129.26 24.40 10.30 85.58 �103.72
79.04 26.19 14.94 53.66 64.5632.8 158.5 173.8 43.7 9.1
, Weinheim www.ms-journal.de
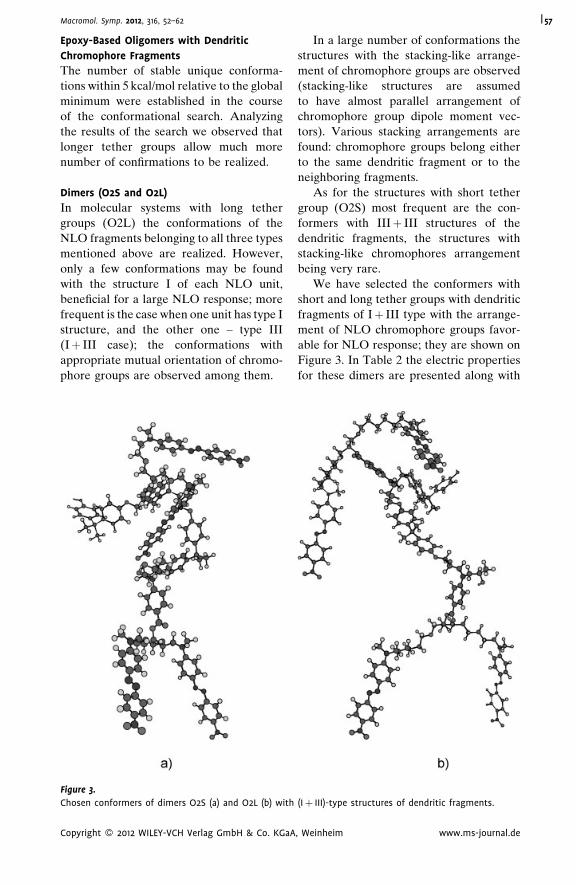
Macromol. Symp. 2012, 316, 52–62 57
Epoxy-Based Oligomers with Dendritic
Chromophore Fragments
The number of stable unique conforma-
tions within 5 kcal/mol relative to the global
minimum were established in the course
of the conformational search. Analyzing
the results of the search we observed that
longer tether groups allow much more
number of confirmations to be realized.
Dimers (O2S and O2L)
In molecular systems with long tether
groups (O2L) the conformations of the
NLO fragments belonging to all three types
mentioned above are realized. However,
only a few conformations may be found
with the structure I of each NLO unit,
beneficial for a large NLO response; more
frequent is the case when one unit has type I
structure, and the other one – type III
(Iþ III case); the conformations with
appropriate mutual orientation of chromo-
phore groups are observed among them.
Figure 3.
Chosen conformers of dimers O2S (a) and O2L (b) with
Copyright � 2012 WILEY-VCH Verlag GmbH & Co. KGaA
In a large number of conformations the
structures with the stacking-like arrange-
ment of chromophore groups are observed
(stacking-like structures are assumed
to have almost parallel arrangement of
chromophore group dipole moment vec-
tors). Various stacking arrangements are
found: chromophore groups belong either
to the same dendritic fragment or to the
neighboring fragments.
As for the structures with short tether
group (O2S) most frequent are the con-
formers with IIIþ III structures of the
dendritic fragments, the structures with
stacking-like chromophores arrangement
being very rare.
We have selected the conformers with
short and long tether groups with dendritic
fragments of Iþ III type with the arrange-
ment of NLO chromophore groups favor-
able for NLO response; they are shown on
Figure 3. In Table 2 the electric properties
for these dimers are presented along with
(Iþ III)-type structures of dendritic fragments.
, Weinheim www.ms-journal.de
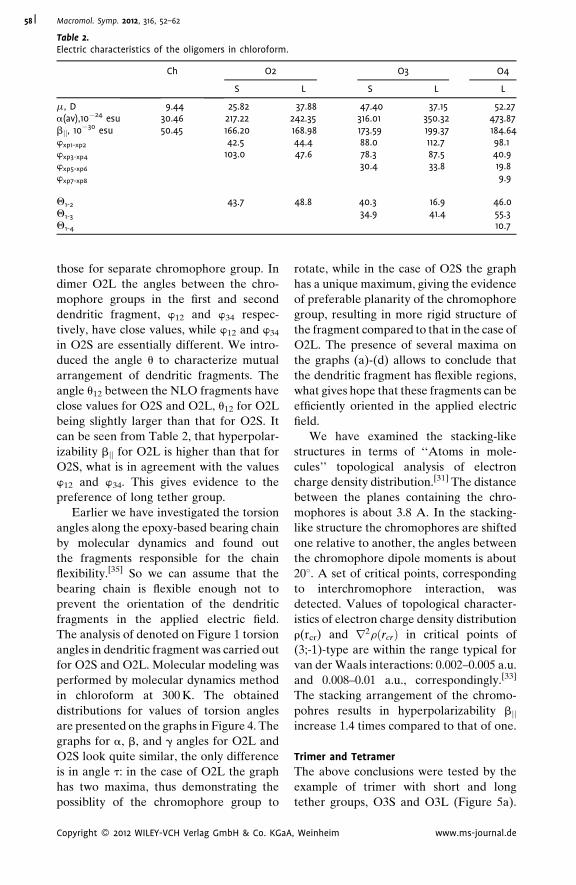
Table 2.Electric characteristics of the oligomers in chloroform.
Ch O2 O3 O4
S L S L L
m, D 9.44 25.82 37.88 47.40 37.15 52.27a(av),10�24 esu 30.46 217.22 242.35 316.01 350.32 473.87bjj, 10�30 esu 50.45 166.20 168.98 173.59 199.37 184.64wxp1-xp2 42.5 44.4 88.0 112.7 98.1wxp3-xp4 103.0 47.6 78.3 87.5 40.9wxp5-xp6 30.4 33.8 19.8wxp7-xp8 9.9
Q1-2 43.7 48.8 40.3 16.9 46.0Q1-3 34.9 41.4 55.3Q1-4 10.7
Macromol. Symp. 2012, 316, 52–6258
those for separate chromophore group. In
dimer O2L the angles between the chro-
mophore groups in the first and second
dendritic fragment, w12 and w34 respec-
tively, have close values, while w12 and w34
in O2S are essentially different. We intro-
duced the angle u to characterize mutual
arrangement of dendritic fragments. The
angle u12 between the NLO fragments have
close values for O2S and O2L, u12 for O2L
being slightly larger than that for O2S. It
can be seen from Table 2, that hyperpolar-
izability bjj for O2L is higher than that for
O2S, what is in agreement with the values
w12 and w34. This gives evidence to the
preference of long tether group.
Earlier we have investigated the torsion
angles along the epoxy-based bearing chain
by molecular dynamics and found out
the fragments responsible for the chain
flexibility.[35] So we can assume that the
bearing chain is flexible enough not to
prevent the orientation of the dendritic
fragments in the applied electric field.
The analysis of denoted on Figure 1 torsion
angles in dendritic fragment was carried out
for O2S and O2L. Molecular modeling was
performed by molecular dynamics method
in chloroform at 300 K. The obtained
distributions for values of torsion angles
are presented on the graphs in Figure 4. The
graphs for a, b, and g angles for O2L and
O2S look quite similar, the only difference
is in angle t: in the case of O2L the graph
has two maxima, thus demonstrating the
possiblity of the chromophore group to
Copyright � 2012 WILEY-VCH Verlag GmbH & Co. KGaA
rotate, while in the case of O2S the graph
has a unique maximum, giving the evidence
of preferable planarity of the chromophore
group, resulting in more rigid structure of
the fragment compared to that in the case of
O2L. The presence of several maxima on
the graphs (a)-(d) allows to conclude that
the dendritic fragment has flexible regions,
what gives hope that these fragments can be
efficiently oriented in the applied electric
field.
We have examined the stacking-like
structures in terms of ‘‘Atoms in mole-
cules’’ topological analysis of electron
charge density distribution.[31] The distance
between the planes containing the chro-
mophores is about 3.8 A. In the stacking-
like structure the chromophores are shifted
one relative to another, the angles between
the chromophore dipole moments is about
208. A set of critical points, corresponding
to interchromophore interaction, was
detected. Values of topological character-
istics of electron charge density distribution
r(rcr) and r2rðrcrÞ in critical points of
(3;-1)-type are within the range typical for
van der Waals interactions: 0.002–0.005 a.u.
and 0.008–0.01 a.u., correspondingly.[33]
The stacking arrangement of the chromo-
pohres results in hyperpolarizability bjjincrease 1.4 times compared to that of one.
Trimer and Tetramer
The above conclusions were tested by the
example of trimer with short and long
tether groups, O3S and O3L (Figure 5a).
, Weinheim www.ms-journal.de
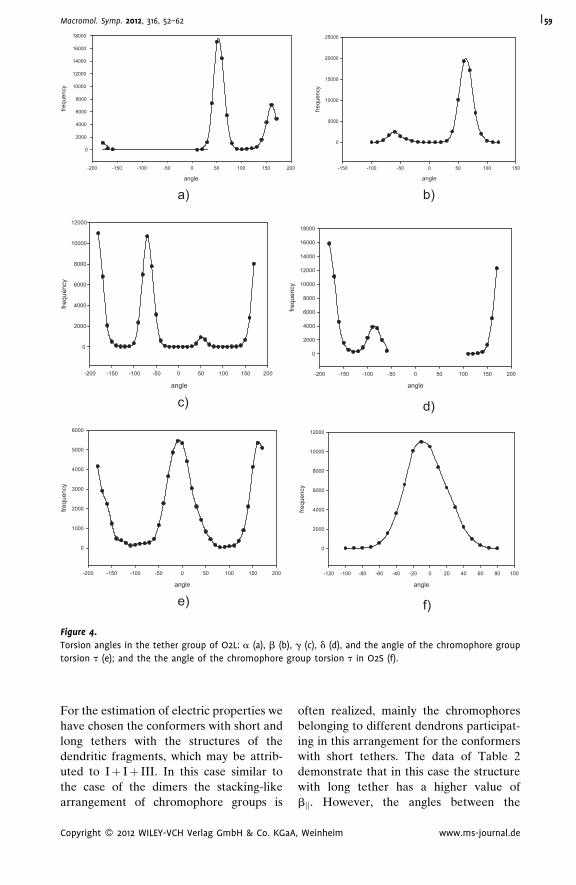
angle
200150100500-50-100-150-200
frequ
ency
0
2000
4000
6000
8000
10000
12000
14000
16000
18000
angle
150100500-50-100-150
frequ
ency
0
5000
10000
15000
20000
25000
a) b)
angle
200150100500-50-100-150-200
frequ
ency
0
2000
4000
6000
8000
10000
12000
angle
200150100500-50-100-150-200
frequ
ency
0
2000
4000
6000
8000
10000
12000
14000
16000
18000
d) c)
angle
200150100500-50-100-150-200
frequ
ency
0
1000
2000
3000
4000
5000
6000
angle
100806040200-20-40-60-80-100-120
frequ
ency
0
2000
4000
6000
8000
10000
12000
f) e)
Figure 4.
Torsion angles in the tether group of O2L: a (a), b (b), g (c), d (d), and the angle of the chromophore group
torsion t (e); and the the angle of the chromophore group torsion t in O2S (f).
Macromol. Symp. 2012, 316, 52–62 59
For the estimation of electric properties we
have chosen the conformers with short and
long tethers with the structures of the
dendritic fragments, which may be attrib-
uted to Iþ Iþ III. In this case similar to
the case of the dimers the stacking-like
arrangement of chromophore groups is
Copyright � 2012 WILEY-VCH Verlag GmbH & Co. KGaA
often realized, mainly the chromophores
belonging to different dendrons participat-
ing in this arrangement for the conformers
with short tethers. The data of Table 2
demonstrate that in this case the structure
with long tether has a higher value of
bjj. However, the angles between the
, Weinheim www.ms-journal.de
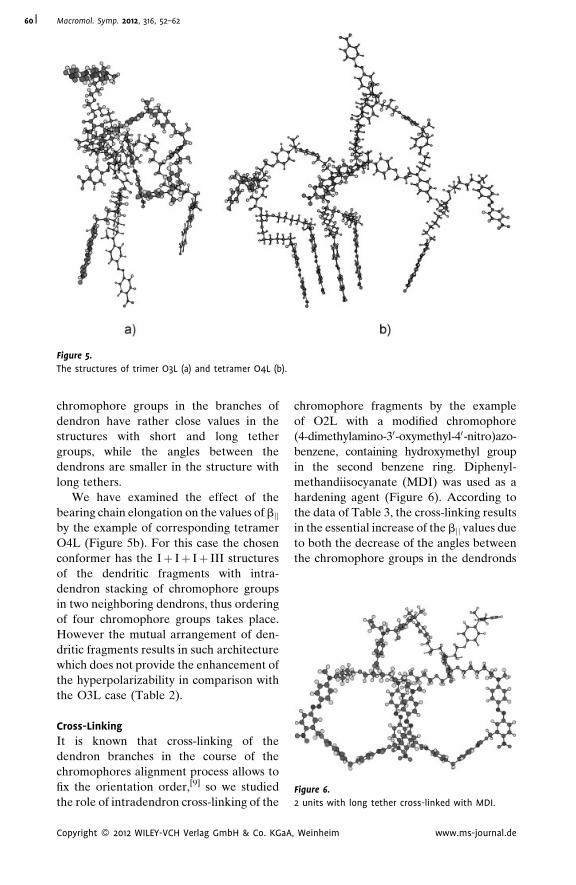
Figure 5.
The structures of trimer O3L (a) and tetramer O4L (b).
Figure 6.
2 units with long tether cross-linked with MDI.
Macromol. Symp. 2012, 316, 52–6260
chromophore groups in the branches of
dendron have rather close values in the
structures with short and long tether
groups, while the angles between the
dendrons are smaller in the structure with
long tethers.
We have examined the effect of the
bearing chain elongation on the values of bjjby the example of corresponding tetramer
O4L (Figure 5b). For this case the chosen
conformer has the Iþ Iþ Iþ III structures
of the dendritic fragments with intra-
dendron stacking of chromophore groups
in two neighboring dendrons, thus ordering
of four chromophore groups takes place.
However the mutual arrangement of den-
dritic fragments results in such architecture
which does not provide the enhancement of
the hyperpolarizability in comparison with
the O3L case (Table 2).
Cross-Linking
It is known that cross-linking of the
dendron branches in the course of the
chromophores alignment process allows to
fix the orientation order,[9] so we studied
the role of intradendron cross-linking of the
Copyright � 2012 WILEY-VCH Verlag GmbH & Co. KGaA
chromophore fragments by the example
of O2L with a modified chromophore
(4-dimethylamino-30-oxymethyl-40-nitro)azo-
benzene, containing hydroxymethyl group
in the second benzene ring. Diphenyl-
methandiisocyanate (MDI) was used as a
hardening agent (Figure 6). According to
the data of Table 3, the cross-linking results
in the essential increase of the bjj values due
to both the decrease of the angles between
the chromophore groups in the dendronds
, Weinheim www.ms-journal.de
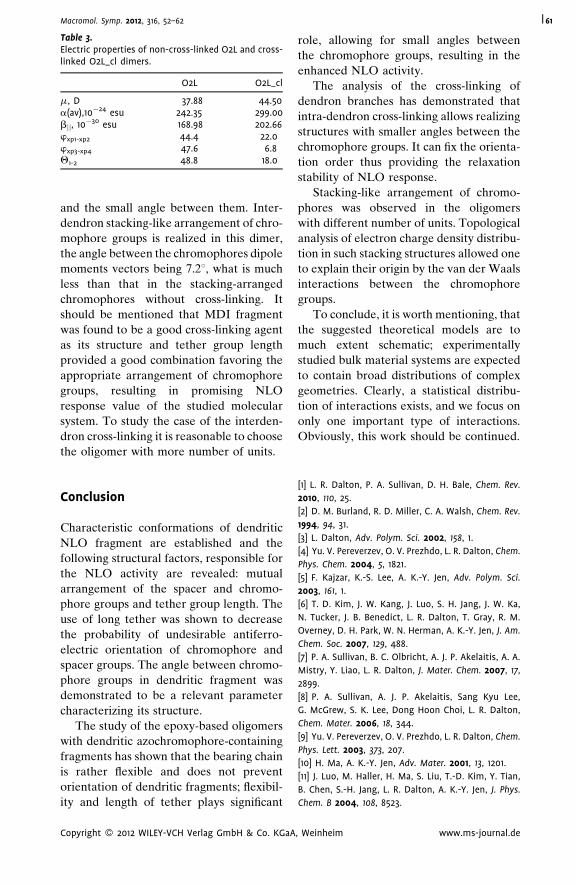
Table 3.Electric properties of non-cross-linked O2L and cross-linked O2L_cl dimers.
O2L O2L_cl
m, D 37.88 44.50a(av),10�24 esu 242.35 299.00bjj, 10�30 esu 168.98 202.66wxp1-xp2 44.4 22.0wxp3-xp4 47.6 6.8Q1-2 48.8 18.0
Macromol. Symp. 2012, 316, 52–62 61
and the small angle between them. Inter-
dendron stacking-like arrangement of chro-
mophore groups is realized in this dimer,
the angle between the chromophores dipole
moments vectors being 7.28, what is much
less than that in the stacking-arranged
chromophores without cross-linking. It
should be mentioned that MDI fragment
was found to be a good cross-linking agent
as its structure and tether group length
provided a good combination favoring the
appropriate arrangement of chromophore
groups, resulting in promising NLO
response value of the studied molecular
system. To study the case of the interden-
dron cross-linking it is reasonable to choose
the oligomer with more number of units.
Conclusion
Characteristic conformations of dendritic
NLO fragment are established and the
following structural factors, responsible for
the NLO activity are revealed: mutual
arrangement of the spacer and chromo-
phore groups and tether group length. The
use of long tether was shown to decrease
the probability of undesirable antiferro-
electric orientation of chromophore and
spacer groups. The angle between chromo-
phore groups in dendritic fragment was
demonstrated to be a relevant parameter
characterizing its structure.
The study of the epoxy-based oligomers
with dendritic azochromophore-containing
fragments has shown that the bearing chain
is rather flexible and does not prevent
orientation of dendritic fragments; flexibil-
ity and length of tether plays significant
Copyright � 2012 WILEY-VCH Verlag GmbH & Co. KGaA
role, allowing for small angles between
the chromophore groups, resulting in the
enhanced NLO activity.
The analysis of the cross-linking of
dendron branches has demonstrated that
intra-dendron cross-linking allows realizing
structures with smaller angles between the
chromophore groups. It can fix the orienta-
tion order thus providing the relaxation
stability of NLO response.
Stacking-like arrangement of chromo-
phores was observed in the oligomers
with different number of units. Topological
analysis of electron charge density distribu-
tion in such stacking structures allowed one
to explain their origin by the van der Waals
interactions between the chromophore
groups.
To conclude, it is worth mentioning, that
the suggested theoretical models are to
much extent schematic; experimentally
studied bulk material systems are expected
to contain broad distributions of complex
geometries. Clearly, a statistical distribu-
tion of interactions exists, and we focus on
only one important type of interactions.
Obviously, this work should be continued.
[1] L. R. Dalton, P. A. Sullivan, D. H. Bale, Chem. Rev.
2010, 110, 25.
[2] D. M. Burland, R. D. Miller, C. A. Walsh, Chem. Rev.
1994, 94, 31.
[3] L. Dalton, Adv. Polym. Sci. 2002, 158, 1.
[4] Yu. V. Pereverzev, O. V. Prezhdo, L. R. Dalton, Chem.
Phys. Chem. 2004, 5, 1821.
[5] F. Kajzar, K.-S. Lee, A. K.-Y. Jen, Adv. Polym. Sci.
2003, 161, 1.
[6] T. D. Kim, J. W. Kang, J. Luo, S. H. Jang, J. W. Ka,
N. Tucker, J. B. Benedict, L. R. Dalton, T. Gray, R. M.
Overney, D. H. Park, W. N. Herman, A. K.-Y. Jen, J. Am.
Chem. Soc. 2007, 129, 488.
[7] P. A. Sullivan, B. C. Olbricht, A. J. P. Akelaitis, A. A.
Mistry, Y. Liao, L. R. Dalton, J. Mater. Chem. 2007, 17,
2899.
[8] P. A. Sullivan, A. J. P. Akelaitis, Sang Kyu Lee,
G. McGrew, S. K. Lee, Dong Hoon Choi, L. R. Dalton,
Chem. Mater. 2006, 18, 344.
[9] Yu. V. Pereverzev, O. V. Prezhdo, L. R. Dalton, Chem.
Phys. Lett. 2003, 373, 207.
[10] H. Ma, A. K.-Y. Jen, Adv. Mater. 2001, 13, 1201.
[11] J. Luo, M. Haller, H. Ma, S. Liu, T.-D. Kim, Y. Tian,
B. Chen, S.-H. Jang, L. R. Dalton, A. K.-Y. Jen, J. Phys.
Chem. B 2004, 108, 8523.
, Weinheim www.ms-journal.de
Macromol. Symp. 2012, 316, 52–6262
[12] H. Ma, J. Luo, S. H. Kang, S. Wong, J. W. Kang,
A. K.-Y. Jen, R. Barto, C. W. Frank, Macromol. Rapid
Comm. 2004, 25, 1667.
[13] M. J. Choa, D. H. Choia, P. A. Sullivan, A. J. P.
Akelaitis, L. R. Dalton, Prog. Polym. Sci. 2008, 33, 1013.
[14] S. J. Benight, L. E. Johnson, R. Barnes, B. C.
Olbricht, D. H. Bale, P. J. Reid, B. E. Eichinger, L. R.
Dalton, P. A. Sullivan, B. H. Robinson, J. Phys. Chem. B
2010, 114, 11949.
[15] Y. Yamaguchi, Y. Yokomichi, S. Yokoyama,
S. Mashiko, J. Mol. Struct. (Theochem) 2001, 545, 187.
[16] S. Yokoyama, T. Nakahama, A. Otomo, S. Mashiko,
J. Am. Chem. Soc. 2000, 122, 3174.
[17] J. Holtmann, E. Walczuk, M. Dede, C. Wittenburg,
J. Heck, G. Archetti, R. Wortmann, H.-G. Kuball, Y.-H.
Wang, K. Liu, Y. Luo, J. Phys. Chem. B 2008, 112, 14751.
[18] P. A. Sullivan, H. L. Rommel, Y. Takimoto, S. R.
Hammond, D. H. Bale, B. C. Olbricht, Y. Liao, J. Rehr,
B. E. Eichinger, A. K. Y. Jen, P. J. Reid, L. R. Dalton, B. H.
Robinson, J. Phys. Chem. B 2009, 113, 15581.
[19] P. A. Sullivan, H. L. Rommel, Y. Liao, B. C. Olbricht,
A. J. P. Akelaitis, K. A. Firestone, J. W. Kang, J. Luo, J. A.
Davies, D. H. Choi, B. E. Eichinger, P. J. Reid, A. Chen,
A. K. Y. Jen, B. H. Robinson, L. R. Dalton, J. Am. Chem.
Soc. 2007, 129, 7523.
[20] W. K. Kim, L. M. Hayden, J. Chem. Phys. 1999, 111,
5212.
[21] M. Makowska-Janusik, H. Reis, M. G. Papadopoulos,
I. G. Economou, N. Zacharopoulos, J. Phys. Chem. B.
2004, 108, 588.
Copyright � 2012 WILEY-VCH Verlag GmbH & Co. KGaA
[22] H. Reis, M. Makowska-Janusik, M. G. Papadopou-
los, J. Phys. Chem. B. 2004, 108, 8931.
[23] G. Chang, W. C. Guida, W. C. Still, J. Am. Chem. Soc.
1989, 111, 4379.
[24] T. A. Halgren, J. Comput. Chem. 1996, 17, 490.
[25] D. Qiu, P. S. Shenkin, F. P. Hollinger, W. C. Still,
J Phys Chem A. 1997, 101, 3005.
[26] MacroModel, version 9.8, Schrodinger, LLC, New
York, 2010.
[27] S. P. Karna, M. Dupuis, J. Comp. Chem. 1991, 12, 487.
[28] Alex A. Granovsky, Firefly version 7.1.G, http://
classic.chem.msu.su/gran/firefly/index.html
[29] M. W. Schmidt, K. K. Baldridge, J. A. Boatz,
S. T. Elbert, M. S. Gordon, J. H. Jensen, S. Koseki,
N. Matsunaga, K. A. Nguyen, S. Su, T. L. Windus,
M. Dupuis, J. A. Montgomery, J. Comput. Chem.
1993, 14, 1347.
[30] P. Gunter, in ‘‘Nonlinear Optical Effects and
materials’’, Springer, Berlin/Heidelberg 2002, p. 495.
[31] R. F. W. Bader, ‘‘Atoms in Molecules: A Quantum
theory’’, Oxford University Press, New York 1990, p 435.
[32] R. J. Gillespie, P. L. A. Popelier, ‘‘Chemical bonding
and Molecular geometry: From Lewis to Electron
densities’’, Oxford University Press, NY 2001, p. 268.
[33] W. Nakanishi, S. Hayashi, K. Narahara, J. Phys.
Chem. A 2009, 113, 100050.
[34] F. Biegler-Konig, J. Schonbohm, D. Bayles, J. Comp.
Chem. 2001, 22, 545.
[35] M. Yu. Balakina, O. D. Fominykh, F. Rua,
V. Branchadell, Int. J. Quant. Chem. 2007, 107, 2398.
, Weinheim www.ms-journal.de
Macromol. Symp. 2012, 316, 63–70 DOI: 10.1002/masy.201250608 63
Lom
of C
Rus
Fax:
E-m
Cop
A New Approach to the Determination of Adhesion
Properties of Polymer Networks
Yulia G. Bogdanova,* Valentina D. Dolzhikova, Ilya M. Karzov,
Alexander Yu. Alentiev
Summary: A new approach for the determination and comparison of adhesion
properties of polymer networks was proposed. One permits to optimize the choice
of polymers for composite materials with inorganic fibers (at the absence of binder
diffusion to the fiber). For the first time the works of adhesion of polymer to liquids
simulating polar or non-polar phases were used for prediction of adhesive properties
of network (binder, coupling agent) and for the choice of network provided the best
tensile strength of composite material. The correctness of proposed approach was
experimentally proved by measuring of tensile strength micro plastics.
Keywords: adhesion; contact angle; micro plastic
Introduction
The regularities of support of polymer
composites strength are being investigated
in different fields of science. The phenom-
enon of adhesion occupies a central place in
these researches. The age of adhesion
problem is more than one hundred years
but the perspective of creation of unified
theory which describes this phenomenon
appears still rather shadowy. So, the
development of principals permitting to
optimize the choice of components for
creation of material with the best strength
characteristics, particulary, the choice of
matrix (binder, coupling agent) for definite
fiber, seems more real. Adhesion is tradi-
tional object of colloid chemistry. So the
colloid-chemical approach for composite
materials in terms of surface energy
characteristics is quite reasonable because
the interface between the solid substrate
and polymer network should be considered
as a full-fledged component of composite
material.[1]
onosov Moscow State University, Department
hemistry, Leninskie Gory 1/3, 119991, Moscow,
sia
(þ7) 495 9328846;
ail: [email protected]
yright � 2012 WILEY-VCH Verlag GmbH & Co. KGaA
Theory
It is commonly known that strength of
plastics (P) depends on adhesion strength
(to) on its low-level cell.[2] The general view
of the dependence P¼ f(to) for plastics
reinforced with fibers is presented at the
Figure 1. The situation when plastic
strength value is monotonic increasing with
adhesion strength increase (area I at the
P¼ f(to)) is in field of interest of present
investigation. The parameters for predic-
tion of the strength of plastics are usually
experimental values which were founded
from micro mechanical tests such as adhe-
sion strength of corresponding micro plastic
or critical fiber length.[3,4] In spite of the
statistical character of these values its
thermo dynamical echo is the work of
adhesion which is determined in terms of
surface energy characteristics of composite
components in micro plastics:
Wa ¼ gSð1Þ þ gSð2Þ � gð12Þ;
where gS(1) and gS(2) are the specific free
surface energy values of network/air and
fiber/air interfaces, g (12) is specific free
surface energy value of fiber/network inter-
face (interfacial free energy).[5] It is gen-
erally known that energetic characteristics
of surfaces can be successfully determined
, Weinheim wileyonlinelibrary.com
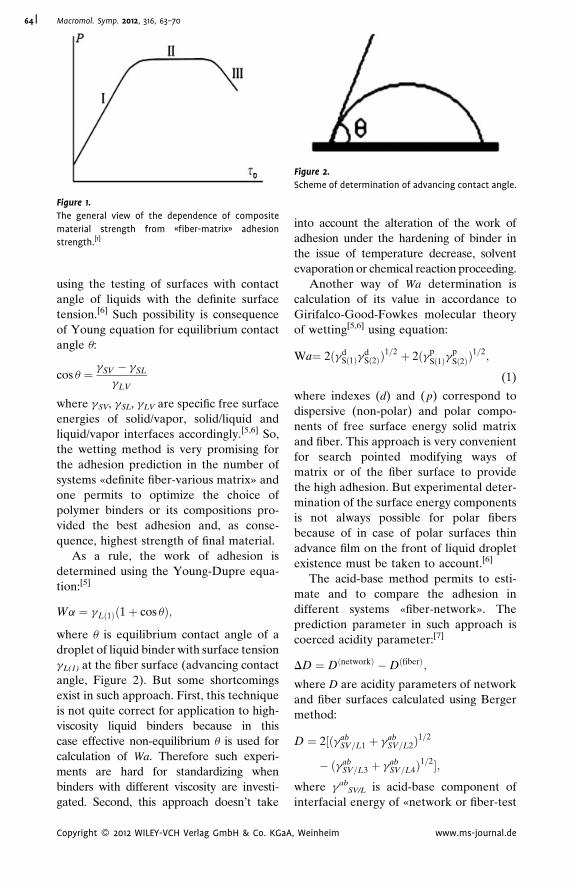
Figure 1.
The general view of the dependence of composite
material strength from «fiber-matrix» adhesion
strength.[1]
Figure 2.
Scheme of determination of advancing contact angle.
Macromol. Symp. 2012, 316, 63–7064
using the testing of surfaces with contact
angle of liquids with the definite surface
tension.[6] Such possibility is consequence
of Young equation for equilibrium contact
angle u:
cos u ¼ gSV � gSL
gLV
where gSV, gSL, gLV are specific free surface
energies of solid/vapor, solid/liquid and
liquid/vapor interfaces accordingly.[5,6] So,
the wetting method is very promising for
the adhesion prediction in the number of
systems «definite fiber-various matrix» and
one permits to optimize the choice of
polymer binders or its compositions pro-
vided the best adhesion and, as conse-
quence, highest strength of final material.
As a rule, the work of adhesion is
determined using the Young-Dupre equa-
tion:[5]
Wa ¼ gLð1Þð1þ cos uÞ;
where u is equilibrium contact angle of a
droplet of liquid binder with surface tension
gL(1) at the fiber surface (advancing contact
angle, Figure 2). But some shortcomings
exist in such approach. First, this technique
is not quite correct for application to high-
viscosity liquid binders because in this
case effective non-equilibrium u is used for
calculation of Wa. Therefore such experi-
ments are hard for standardizing when
binders with different viscosity are investi-
gated. Second, this approach doesn’t take
Copyright � 2012 WILEY-VCH Verlag GmbH & Co. KGaA
into account the alteration of the work of
adhesion under the hardening of binder in
the issue of temperature decrease, solvent
evaporation or chemical reaction proceeding.
Another way of Wa determination is
calculation of its value in accordance to
Girifalco-Good-Fowkes molecular theory
of wetting[5,6] using equation:
Wa¼ 2ðgdSð1Þg
dSð2ÞÞ
1=2 þ 2ðgpSð1Þg
pSð2ÞÞ
1=2;
(1)
where indexes (d) and ( p) correspond to
dispersive (non-polar) and polar compo-
nents of free surface energy solid matrix
and fiber. This approach is very convenient
for search pointed modifying ways of
matrix or of the fiber surface to provide
the high adhesion. But experimental deter-
mination of the surface energy components
is not always possible for polar fibers
because of in case of polar surfaces thin
advance film on the front of liquid droplet
existence must be taken to account.[6]
The acid-base method permits to esti-
mate and to compare the adhesion in
different systems «fiber-network». The
prediction parameter in such approach is
coerced acidity parameter:[7]
DD ¼ DðnetworkÞ �DðfiberÞ;
where D are acidity parameters of network
and fiber surfaces calculated using Berger
method:
D ¼ 2½ðgabSV=L1 þ gab
SV=L2Þ1=2
� ðgabSV=L3 þ gab
SV=L4Þ1=2�;
where gabSV/L is acid-base component of
interfacial energy of «network or fiber-test
, Weinheim www.ms-journal.de
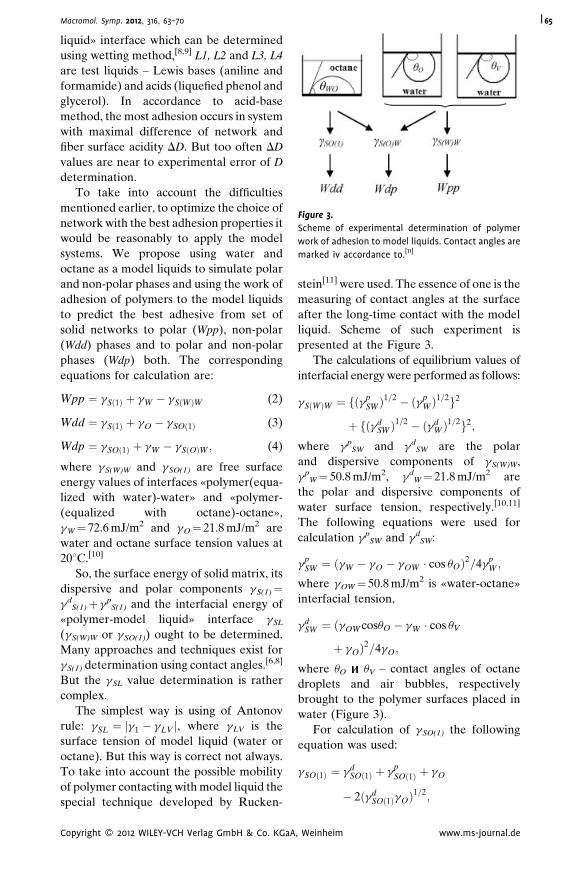
Figure 3.
Scheme of experimental determination of polymer
work of adhesion to model liquids. Contact angles are
marked iv accordance to.[11]
Macromol. Symp. 2012, 316, 63–70 65
liquid» interface which can be determined
using wetting method,[8,9] L1, L2 and L3, L4
are test liquids – Lewis bases (aniline and
formamide) and acids (liquefied phenol and
glycerol). In accordance to acid-base
method, the most adhesion occurs in system
with maximal difference of network and
fiber surface acidity DD. But too often DD
values are near to experimental error of D
determination.
To take into account the difficulties
mentioned earlier, to optimize the choice of
network with the best adhesion properties it
would be reasonably to apply the model
systems. We propose using water and
octane as a model liquids to simulate polar
and non-polar phases and using the work of
adhesion of polymers to the model liquids
to predict the best adhesive from set of
solid networks to polar (Wpp), non-polar
(Wdd) phases and to polar and non-polar
phases (Wdp) both. The corresponding
equations for calculation are:
Wpp ¼ gSð1Þ þ gW � gSðWÞW (2)
Wdd ¼ gSð1Þ þ gO � gSOð1Þ (3)
Wdp ¼ gSOð1Þ þ gW � gSðOÞW ; (4)
where gS(W)W and gSO(1) are free surface
energy values of interfaces «polymer(equa-
lized with water)-water» and «polymer-
(equalized with octane)-octane»,
gW¼ 72.6 mJ/m2 and gO¼ 21.8 mJ/m2 are
water and octane surface tension values at
208C.[10]
So, the surface energy of solid matrix, its
dispersive and polar components gS(1)¼gd
S(1)þ gpS(1) and the interfacial energy of
«polymer-model liquid» interface gSL
(gS(W)W or gSO(1)) ought to be determined.
Many approaches and techniques exist for
gS(1) determination using contact angles.[6,8]
But the gSL value determination is rather
complex.
The simplest way is using of Antonov
rule: gSL ¼ g1 � gLVj j, where gLV is the
surface tension of model liquid (water or
octane). But this way is correct not always.
To take into account the possible mobility
of polymer contacting with model liquid the
special technique developed by Rucken-
Copyright � 2012 WILEY-VCH Verlag GmbH & Co. KGaA
stein[11] were used. The essence of one is the
measuring of contact angles at the surface
after the long-time contact with the model
liquid. Scheme of such experiment is
presented at the Figure 3.
The calculations of equilibrium values of
interfacial energy were performed as follows:
gSðWÞW ¼ fðgpSWÞ
1=2 � ðgpWÞ
1=2g2
þ fðgdSWÞ
1=2 � ðgdWÞ
1=2g2;
where gpSW and gd
SW are the polar
and dispersive components of gS(W)W,
gpW¼ 50.8 mJ/m2, gd
W¼ 21.8 mJ/m2 are
the polar and dispersive components of
water surface tension, respectively.[10,11]
The following equations were used for
calculation gpSW and gd
SW:
gpSW ¼ ðgW � gO � gOW � cos uOÞ2=4g
pW ;
where gOW¼ 50.8 mJ/m2 is «water-octane»
interfacial tension,
gdSW ¼ ðgOWcosuO � gW � cos uV
þ gOÞ2=4gO;
where uO uV – contact angles of octane
droplets and air bubbles, respectively
brought to the polymer surfaces placed in
water (Figure 3).
For calculation of gSO(1) the following
equation was used:
gSOð1Þ ¼ gdSOð1Þ þ g
pSOð1Þ þ gO
� 2ðgdSOð1ÞgOÞ1=2;
, Weinheim www.ms-journal.de
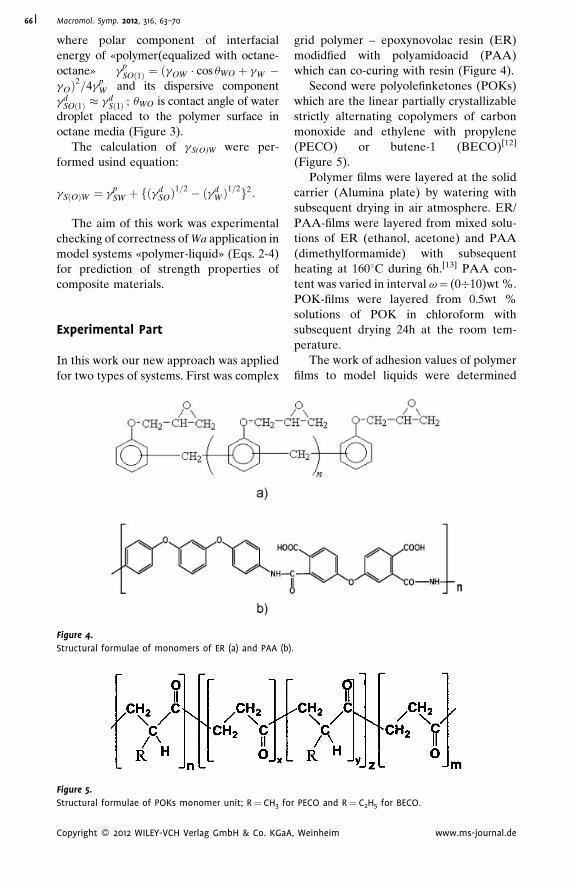
Macromol. Symp. 2012, 316, 63–7066
where polar component of interfacial
energy of «polymer(equalized with octane-
octane» gpSOð1Þ ¼ ðgOW � cos uWO þ gW �
gOÞ2=4gpW and its dispersive component
gdSOð1Þ � gd
Sð1Þ ; uWO is contact angle of water
droplet placed to the polymer surface in
octane media (Figure 3).
The calculation of gS(O)W were per-
formed usind equation:
gSðOÞW ¼ gpSW þ fðgd
SOÞ1=2 � ðgd
WÞ1=2g2:
The aim of this work was experimental
checking of correctness of Wa application in
model systems «polymer-liquid» (Eqs. 2-4)
for prediction of strength properties of
composite materials.
Experimental Part
In this work our new approach was applied
for two types of systems. First was complex
Figure 4.
Structural formulae of monomers of ER (a) and PAA (b)
Figure 5.
Structural formulae of POKs monomer unit; R¼ CH3 fo
Copyright � 2012 WILEY-VCH Verlag GmbH & Co. KGaA
grid polymer – epoxynovolac resin (ER)
modidfied with polyamidoacid (PAA)
which can co-curing with resin (Figure 4).
Second were polyolefinketones (POKs)
which are the linear partially crystallizable
strictly alternating copolymers of carbon
monoxide and ethylene with propylene
(PECO) or butene-1 (BECO)[12]
(Figure 5).
Polymer films were layered at the solid
carrier (Alumina plate) by watering with
subsequent drying in air atmosphere. ER/
PAA-films were layered from mixed solu-
tions of ER (ethanol, acetone) and PAA
(dimethylformamide) with subsequent
heating at 1608C during 6h.[13] PAA con-
tent was varied in interval v¼ (0�10)wt %.
POK-films were layered from 0.5wt %
solutions of POK in chloroform with
subsequent drying 24h at the room tem-
perature.
The work of adhesion values of polymer
films to model liquids were determined
.
r PECO and R¼ C2H5 for BECO.
, Weinheim www.ms-journal.de
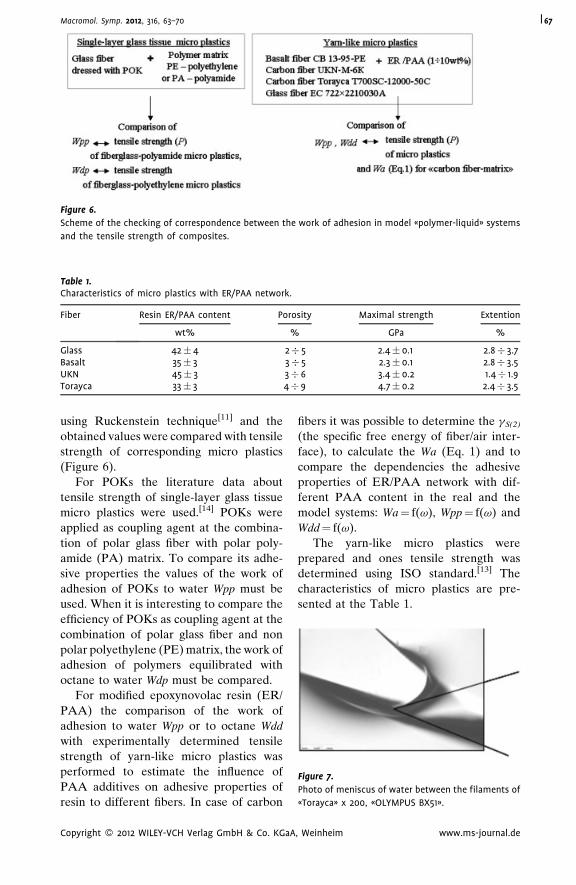
Figure 6.
Scheme of the checking of correspondence between the work of adhesion in model «polymer-liquid» systems
and the tensile strength of composites.
Table 1.Characteristics of micro plastics with ER/PAA network.
Fiber Resin ER/PAA content Porosity Maximal strength Extention
wt% % GPa %
Glass 42� 4 2� 5 2.4� 0.1 2.8� 3.7Basalt 35� 3 3� 5 2.3� 0.1 2.8� 3.5UKN 45� 3 3� 6 3.4� 0.2 1.4� 1.9Torayca 33� 3 4� 9 4.7� 0.2 2.4� 3.5
Figure 7.
Photo of meniscus of water between the filaments of
«Torayca» x 200, «OLYMPUS BX51».
Macromol. Symp. 2012, 316, 63–70 67
using Ruckenstein technique[11] and the
obtained values were compared with tensile
strength of corresponding micro plastics
(Figure 6).
For POKs the literature data about
tensile strength of single-layer glass tissue
micro plastics were used.[14] POKs were
applied as coupling agent at the combina-
tion of polar glass fiber with polar poly-
amide (PA) matrix. To compare its adhe-
sive properties the values of the work of
adhesion of POKs to water Wpp must be
used. When it is interesting to compare the
efficiency of POKs as coupling agent at the
combination of polar glass fiber and non
polar polyethylene (PE) matrix, the work of
adhesion of polymers equilibrated with
octane to water Wdp must be compared.
For modified epoxynovolac resin (ER/
PAA) the comparison of the work of
adhesion to water Wpp or to octane Wdd
with experimentally determined tensile
strength of yarn-like micro plastics was
performed to estimate the influence of
PAA additives on adhesive properties of
resin to different fibers. In case of carbon
Copyright � 2012 WILEY-VCH Verlag GmbH & Co. KGaA
fibers it was possible to determine the gS(2)
(the specific free energy of fiber/air inter-
face), to calculate the Wa (Eq. 1) and to
compare the dependencies the adhesive
properties of ER/PAA network with dif-
ferent PAA content in the real and the
model systems: Wa¼ f(v), Wpp¼ f(v) and
Wdd¼ f(v).
The yarn-like micro plastics were
prepared and ones tensile strength was
determined using ISO standard.[13] The
characteristics of micro plastics are pre-
sented at the Table 1.
, Weinheim www.ms-journal.de
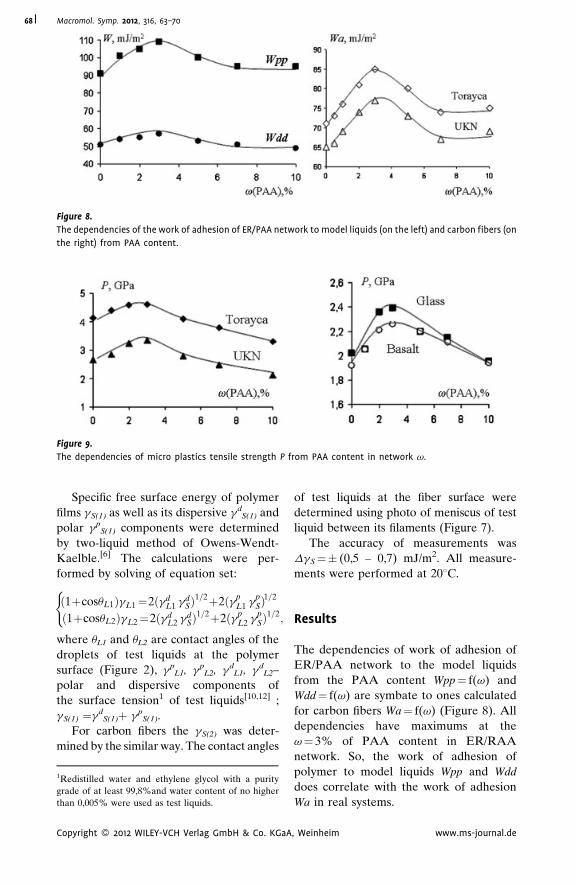
Figure 8.
The dependencies of the work of adhesion of ER/PAA network to model liquids (on the left) and carbon fibers (on
the right) from PAA content.
Figure 9.
The dependencies of micro plastics tensile strength P from PAA content in network v.
Macromol. Symp. 2012, 316, 63–7068
Specific free surface energy of polymer
films gS(1) as well as its dispersive gdS(1) and
polar gpS(1) components were determined
by two-liquid method of Owens-Wendt-
Kaelble.[6] The calculations were per-
formed by solving of equation set:
ð1þcosuL1ÞgL1¼2ðgdL1 gd
SÞ1=2þ2ðgp
L1 gpSÞ
1=2
ð1þcosuL2ÞgL2¼2ðgdL2 gd
SÞ1=2þ2ðgp
L2 gpSÞ
1=2;
(
where uL1 and uL2 are contact angles of the
droplets of test liquids at the polymer
surface (Figure 2), gpL1, gp
L2, gdL1, gd
L2–
polar and dispersive components of
the surface tension1 of test liquids[10,12] ;
gS(1) ¼gdS(1)þ gp
S(1).
For carbon fibers the gS(2) was deter-
mined by the similar way. The contact angles
1Redistilled water and ethylene glycol with a purity
grade of at least 99,8%and water content of no higher
than 0,005% were used as test liquids.
Copyright � 2012 WILEY-VCH Verlag GmbH & Co. KGaA
of test liquids at the fiber surface were
determined using photo of meniscus of test
liquid between its filaments (Figure 7).
The accuracy of measurements was
DgS¼� (0,5 – 0,7) mJ/m2. All measure-
ments were performed at 208C.
Results
The dependencies of work of adhesion of
ER/PAA network to the model liquids
from the PAA content Wpp¼ f(v) and
Wdd¼ f(v) are symbate to ones calculated
for carbon fibers Wa¼ f(v) (Figure 8). All
dependencies have maximums at the
v¼ 3% of PAA content in ER/RAA
network. So, the work of adhesion of
polymer to model liquids Wpp and Wdd
does correlate with the work of adhesion
Wa in real systems.
, Weinheim www.ms-journal.de
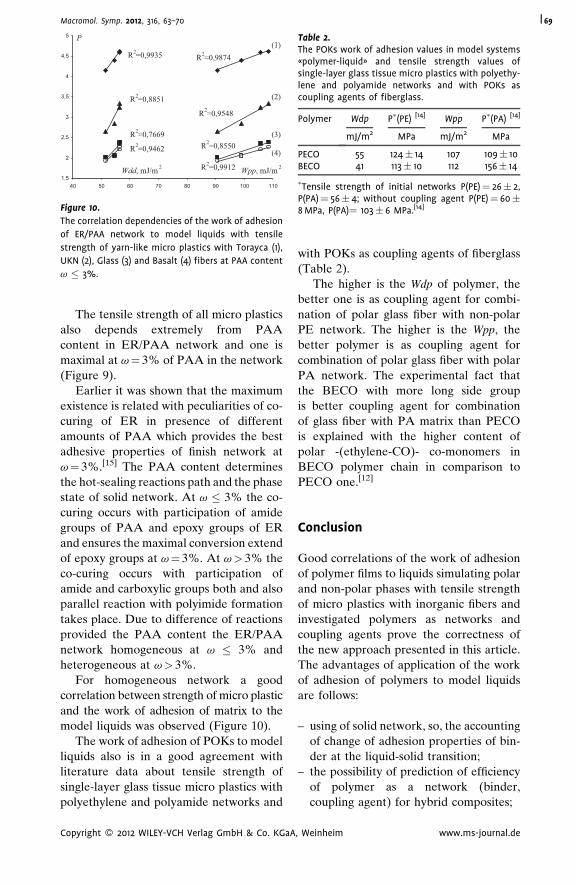
1,5
2
2,5
3
3,5
4
4,5
5
110100908070605040
Wdd, mJ/m 2 Wpp, mJ/m 2
P(1)
(2)
(3)
(4)
R2=0,9874
R2=0,9548
R2=0,8550
R2=0,9912
R2=0,9935
R2=0,8851
R2=0,7669
R2=0,9462
Figure 10.
The correlation dependencies of the work of adhesion
of ER/PAA network to model liquids with tensile
strength of yarn-like micro plastics with Torayca (1),
UKN (2), Glass (3) and Basalt (4) fibers at PAA content
v � 3%.
Table 2.The POKs work of adhesion values in model systems«polymer-liquid» and tensile strength values ofsingle-layer glass tissue micro plastics with polyethy-lene and polyamide networks and with POKs ascoupling agents of fiberglass.
Polymer Wdp P�(PE) [14] Wpp P�(PA) [14]
mJ/m2 MPa mJ/m2 MPa
PECO 55 124� 14 107 109� 10BECO 41 113� 10 112 156� 14
�Tensile strength of initial networks P(PE)¼ 26� 2,P(PA)¼ 56� 4; without coupling agent P(PE)¼ 60�8 MPa, P(PA)¼ 103� 6 MPa.[14]
Macromol. Symp. 2012, 316, 63–70 69
The tensile strength of all micro plastics
also depends extremely from PAA
content in ER/PAA network and one is
maximal at v¼ 3% of PAA in the network
(Figure 9).
Earlier it was shown that the maximum
existence is related with peculiarities of co-
curing of ER in presence of different
amounts of PAA which provides the best
adhesive properties of finish network at
v¼ 3%.[15] The PAA content determines
the hot-sealing reactions path and the phase
state of solid network. At v � 3% the co-
curing occurs with participation of amide
groups of PAA and epoxy groups of ER
and ensures the maximal conversion extend
of epoxy groups at v¼ 3%. At v> 3% the
co-curing occurs with participation of
amide and carboxylic groups both and also
parallel reaction with polyimide formation
takes place. Due to difference of reactions
provided the PAA content the ER/PAA
network homogeneous at v � 3% and
heterogeneous at v> 3%.
For homogeneous network a good
correlation between strength of micro plastic
and the work of adhesion of matrix to the
model liquids was observed (Figure 10).
The work of adhesion of POKs to model
liquids also is in a good agreement with
literature data about tensile strength of
single-layer glass tissue micro plastics with
polyethylene and polyamide networks and
Copyright � 2012 WILEY-VCH Verlag GmbH & Co. KGaA
with POKs as coupling agents of fiberglass
(Table 2).
The higher is the Wdp of polymer, the
better one is as coupling agent for combi-
nation of polar glass fiber with non-polar
PE network. The higher is the Wpp, the
better polymer is as coupling agent for
combination of polar glass fiber with polar
PA network. The experimental fact that
the BECO with more long side group
is better coupling agent for combination
of glass fiber with PA matrix than PECO
is explained with the higher content of
polar -(ethylene-CO)- co-monomers in
BECO polymer chain in comparison to
PECO one.[12]
Conclusion
Good correlations of the work of adhesion
of polymer films to liquids simulating polar
and non-polar phases with tensile strength
of micro plastics with inorganic fibers and
investigated polymers as networks and
coupling agents prove the correctness of
the new approach presented in this article.
The advantages of application of the work
of adhesion of polymers to model liquids
are follows:
– u
, W
sing of solid network, so, the accounting
of change of adhesion properties of bin-
der at the liquid-solid transition;
– th
e possibility of prediction of efficiencyof polymer as a network (binder,
coupling agent) for hybrid composites;
einheim www.ms-journal.de
Macromol. Symp. 2012, 316, 63–7070
– c
hance of prediction of adhesion of poly-mer to filler of any nature and form.
Of course, the case of tensile character-
istics prediction for plastics is more
complicated. But nevertheless, the thermo-
dynamic principals of choice of polymer
which provides the best adhesion to sub-
strate must be reflected even when the
complex of factors influences. That is why
the experimental evidence of choice the
best adhesive provided the best strength
properties of composite material was
obtained.
Acknowledgements: Dr. J.V. Kostina, TopchievInstitute of Petrochemical Synthesis, Moscow,Russia for IR-spectroscopy investigation of hot-co-sealing of ER and PAA, Dr. A.V. Shapagin,Frumkin Institute of Physical Chemistry andElectrochemistry, Moscow, Russia for the ASMphotos of ER/PAA surfaces, Prof. G.P. Belov,Institute of Problems of Physical Chemistry,Ghernogolovka, Russia for the synthetic sam-ples of POK, Russian Foundation for Basicresearch, project N 10-08-01303a for financialsupport.
[1] A. J. Kinloch, Adhesion and Adhesives Science and
Technology, London - New York Chapman and Hall,
1987, 441p.
1Redistilled water and ethylene glycol with a purity
grade of at least 99,8%and water content of no higher
than 0,005% were used as test liquids.
Copyright � 2012 WILEY-VCH Verlag GmbH & Co. KGaA
[2] Yu. A. Gorbatkina, Mechanics of Composite
Materials, 2000, 36(3), 29.
[3] M. L. Kerber, V. M. Vinogradov, G. S. Golovkin, et al.
Polymer Composites: Structure, Properties and Techno-
logy: Training Manual (Ed., A. A. Berlin, St. -Petersburg
Professiya, 2008, 556p. [in Russian].
[4] V. E. Yudin, V. M. Svetlichnyi, A. N. Shumakov,
R. Schechter, H. Harel, G. Marom, Composites: Part A,
2008, 39, 85.
[5] A. W. Adamson, Physical Chemistry of Surfaces, New
York John Wiley and Sons, 1976, 551p.
[6] J. Vojtechovska, L. Kvitek, Acta Univ. Palacki. Olo-
muc, 2005, Chemica 44, 25.
[7] I. A. Starostina, Y. I. Aleeva, E. V. Sechko, O. V.
Stoyanov, Encyclopedia of Polymer Composites: Proper-
ties, Performance and Applications, New York Nova
Publisers, 2009, 681–704
[8] C. J. Van Oss, M. K. Chaudhury, R. G. Good, Chem.
Rev., 1988, 88, 927.
[9] E. J. Berger, Acid-Base Interaction: Relevance to
Adhesion Science and Technology (Ed., K. L. Mittal,,
H. R. Anderson, Jr. Utrecht VSP, 1991, 207.
[10] L. H. Lee, Langmuir, 1996, 12, 1681.
[11] E. Ruckenstein, S. H. Lee, J. of Colloid and Int. Sci.,
1987, 120, 153.
[12] Yu. G. Bogdanova, V. D. Dolzhikova, A. G. Maguga,
Polymer Sci., Series D, 2011, 4(1), 8.
[13] ISO 10618, Carbon Fibre – Determination propertes
of resin-impregnated yarn, 2004.
[14] Yu. N. Smirnov, O. N. Golodkov, Yu. A. Ol’khov,
G. P. Belov, Polymer Sci., Series B, 2007, 49, 91.
[15] I. M. Karzov, A. Yu. Alentiev, Yu. G. Bogdanova,
Yu. V. Kostina, A. V. Shapagin, Moscow Univ. Chem.
Bul., 2010, 65(6), 384.
, Weinheim www.ms-journal.de
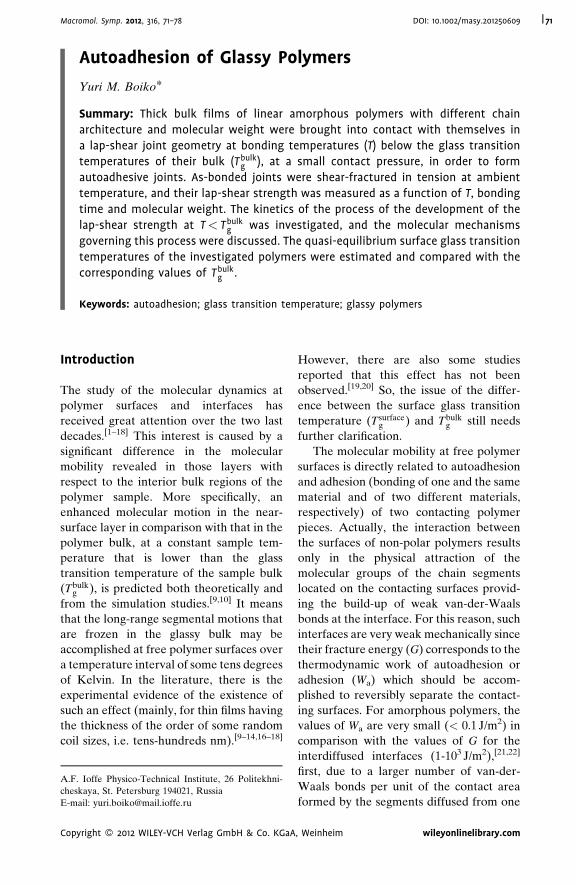
Macromol. Symp. 2012, 316, 71–78 DOI: 10.1002/masy.201250609 71
A.F
ches
E-m
Cop
Autoadhesion of Glassy Polymers
Yuri M. Boiko*
Summary: Thick bulk films of linear amorphous polymers with different chain
architecture and molecular weight were brought into contact with themselves in
a lap-shear joint geometry at bonding temperatures (T) below the glass transition
temperatures of their bulk (Tbulkg ), at a small contact pressure, in order to form
autoadhesive joints. As-bonded joints were shear-fractured in tension at ambient
temperature, and their lap-shear strength was measured as a function of T, bonding
time and molecular weight. The kinetics of the process of the development of the
lap-shear strength at T< Tbulkg was investigated, and the molecular mechanisms
governing this process were discussed. The quasi-equilibrium surface glass transition
temperatures of the investigated polymers were estimated and compared with the
corresponding values of Tbulkg .
Keywords: autoadhesion; glass transition temperature; glassy polymers
Introduction
The study of the molecular dynamics at
polymer surfaces and interfaces has
received great attention over the two last
decades.[1–18] This interest is caused by a
significant difference in the molecular
mobility revealed in those layers with
respect to the interior bulk regions of the
polymer sample. More specifically, an
enhanced molecular motion in the near-
surface layer in comparison with that in the
polymer bulk, at a constant sample tem-
perature that is lower than the glass
transition temperature of the sample bulk
(Tbulkg ), is predicted both theoretically and
from the simulation studies.[9,10] It means
that the long-range segmental motions that
are frozen in the glassy bulk may be
accomplished at free polymer surfaces over
a temperature interval of some tens degrees
of Kelvin. In the literature, there is the
experimental evidence of the existence of
such an effect (mainly, for thin films having
the thickness of the order of some random
coil sizes, i.e. tens-hundreds nm).[9–14,16–18]
. Ioffe Physico-Technical Institute, 26 Politekhni-
kaya, St. Petersburg 194021, Russia
ail: [email protected]
yright � 2012 WILEY-VCH Verlag GmbH & Co. KGaA
However, there are also some studies
reported that this effect has not been
observed.[19,20] So, the issue of the differ-
ence between the surface glass transition
temperature (T surfaceg ) and Tbulk
g still needs
further clarification.
The molecular mobility at free polymer
surfaces is directly related to autoadhesion
and adhesion (bonding of one and the same
material and of two different materials,
respectively) of two contacting polymer
pieces. Actually, the interaction between
the surfaces of non-polar polymers results
only in the physical attraction of the
molecular groups of the chain segments
located on the contacting surfaces provid-
ing the build-up of weak van-der-Waals
bonds at the interface. For this reason, such
interfaces are very weak mechanically since
their fracture energy (G) corresponds to the
thermodynamic work of autoadhesion or
adhesion (Wa) which should be accom-
plished to reversibly separate the contact-
ing surfaces. For amorphous polymers, the
values of Wa are very small (< 0.1 J/m2) in
comparison with the values of G for the
interdiffused interfaces (1-103 J/m2),[21,22]
first, due to a larger number of van-der-
Waals bonds per unit of the contact area
formed by the segments diffused from one
, Weinheim wileyonlinelibrary.com
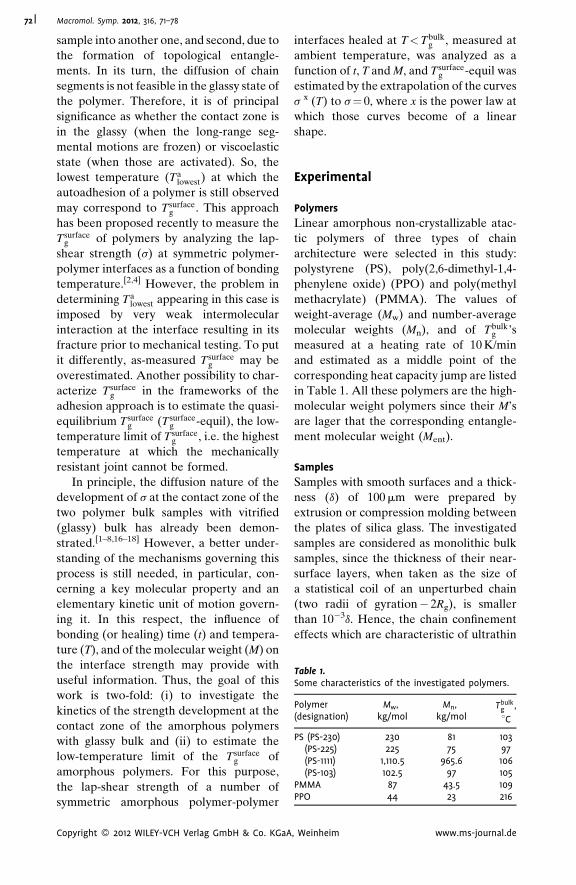
Table 1.Some characteristics of the investigated polymers.
Polymer(designation)
Mw,kg/mol
Mn,kg/mol
Tbulkg ,
8C
PS (PS-230) 230 81 103(PS-225) 225 75 97(PS-1111) 1,110.5 965.6 106(PS-103) 102.5 97 105
PMMA 87 43.5 109PPO 44 23 216
Macromol. Symp. 2012, 316, 71–7872
sample into another one, and second, due to
the formation of topological entangle-
ments. In its turn, the diffusion of chain
segments is not feasible in the glassy state of
the polymer. Therefore, it is of principal
significance as whether the contact zone is
in the glassy (when the long-range seg-
mental motions are frozen) or viscoelastic
state (when those are activated). So, the
lowest temperature (Talowest) at which the
autoadhesion of a polymer is still observed
may correspond to Tsurfaceg . This approach
has been proposed recently to measure the
Tsurfaceg of polymers by analyzing the lap-
shear strength (s) at symmetric polymer-
polymer interfaces as a function of bonding
temperature.[2,4] However, the problem in
determining Talowest appearing in this case is
imposed by very weak intermolecular
interaction at the interface resulting in its
fracture prior to mechanical testing. To put
it differently, as-measured T surfaceg may be
overestimated. Another possibility to char-
acterize Tsurfaceg in the frameworks of the
adhesion approach is to estimate the quasi-
equilibrium Tsurfaceg (T surface
g -equil), the low-
temperature limit of T surfaceg , i.e. the highest
temperature at which the mechanically
resistant joint cannot be formed.
In principle, the diffusion nature of the
development of s at the contact zone of the
two polymer bulk samples with vitrified
(glassy) bulk has already been demon-
strated.[1–8,16–18] However, a better under-
standing of the mechanisms governing this
process is still needed, in particular, con-
cerning a key molecular property and an
elementary kinetic unit of motion govern-
ing it. In this respect, the influence of
bonding (or healing) time (t) and tempera-
ture (T), and of the molecular weight (M) on
the interface strength may provide with
useful information. Thus, the goal of this
work is two-fold: (i) to investigate the
kinetics of the strength development at the
contact zone of the amorphous polymers
with glassy bulk and (ii) to estimate the
low-temperature limit of the Tsurfaceg of
amorphous polymers. For this purpose,
the lap-shear strength of a number of
symmetric amorphous polymer-polymer
Copyright � 2012 WILEY-VCH Verlag GmbH & Co. KGaA
interfaces healed at T< Tbulkg , measured at
ambient temperature, was analyzed as a
function of t, T and M, and T surfaceg -equil was
estimated by the extrapolation of the curves
s x (T) to s¼ 0, where x is the power law at
which those curves become of a linear
shape.
Experimental
Polymers
Linear amorphous non-crystallizable atac-
tic polymers of three types of chain
architecture were selected in this study:
polystyrene (PS), poly(2,6-dimethyl-1,4-
phenylene oxide) (PPO) and poly(methyl
methacrylate) (PMMA). The values of
weight-average (Mw) and number-average
molecular weights (Mn), and of Tbulkg ’s
measured at a heating rate of 10 K/min
and estimated as a middle point of the
corresponding heat capacity jump are listed
in Table 1. All these polymers are the high-
molecular weight polymers since their M’s
are lager that the corresponding entangle-
ment molecular weight (Ment).
Samples
Samples with smooth surfaces and a thick-
ness (d) of 100 mm were prepared by
extrusion or compression molding between
the plates of silica glass. The investigated
samples are considered as monolithic bulk
samples, since the thickness of their near-
surface layers, when taken as the size of
a statistical coil of an unperturbed chain
(two radii of gyration� 2Rg), is smaller
than 10�3d. Hence, the chain confinement
effects which are characteristic of ultrathin
, Weinheim www.ms-journal.de
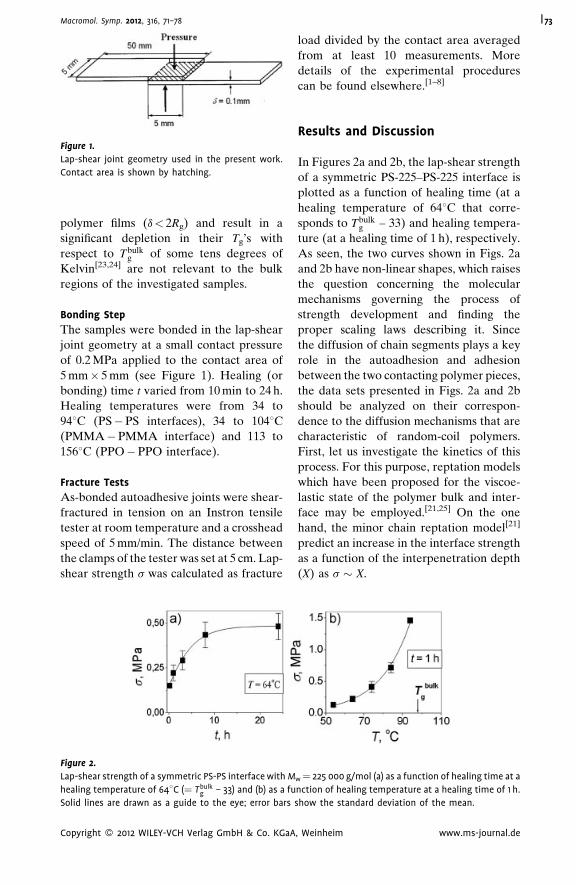
Figure 1.
Lap-shear joint geometry used in the present work.
Contact area is shown by hatching.
Macromol. Symp. 2012, 316, 71–78 73
polymer films (d< 2Rg) and result in a
significant depletion in their Tg’s with
respect to Tbulkg of some tens degrees of
Kelvin[23,24] are not relevant to the bulk
regions of the investigated samples.
Bonding Step
The samples were bonded in the lap-shear
joint geometry at a small contact pressure
of 0.2 MPa applied to the contact area of
5 mm� 5 mm (see Figure 1). Healing (or
bonding) time t varied from 10 min to 24 h.
Healing temperatures were from 34 to
948C (PS�PS interfaces), 34 to 1048C(PMMA�PMMA interface) and 113 to
1568C (PPO�PPO interface).
Fracture Tests
As-bonded autoadhesive joints were shear-
fractured in tension on an Instron tensile
tester at room temperature and a crosshead
speed of 5 mm/min. The distance between
the clamps of the tester was set at 5 cm. Lap-
shear strength s was calculated as fracture
Figure 2.
Lap-shear strength of a symmetric PS-PS interface with M
healing temperature of 648C (¼ Tbulkg – 33) and (b) as a fu
Solid lines are drawn as a guide to the eye; error bars
Copyright � 2012 WILEY-VCH Verlag GmbH & Co. KGaA
load divided by the contact area averaged
from at least 10 measurements. More
details of the experimental procedures
can be found elsewhere.[1–8]
Results and Discussion
In Figures 2a and 2b, the lap-shear strength
of a symmetric PS-225–PS-225 interface is
plotted as a function of healing time (at a
healing temperature of 648C that corre-
sponds to Tbulkg – 33) and healing tempera-
ture (at a healing time of 1 h), respectively.
As seen, the two curves shown in Figs. 2a
and 2b have non-linear shapes, which raises
the question concerning the molecular
mechanisms governing the process of
strength development and finding the
proper scaling laws describing it. Since
the diffusion of chain segments plays a key
role in the autoadhesion and adhesion
between the two contacting polymer pieces,
the data sets presented in Figs. 2a and 2b
should be analyzed on their correspon-
dence to the diffusion mechanisms that are
characteristic of random-coil polymers.
First, let us investigate the kinetics of this
process. For this purpose, reptation models
which have been proposed for the viscoe-
lastic state of the polymer bulk and inter-
face may be employed.[21,25] On the one
hand, the minor chain reptation model[21]
predict an increase in the interface strength
as a function of the interpenetration depth
(X) as s � X.
w¼ 225 000 g/mol (a) as a function of healing time at a
nction of healing temperature at a healing time of 1 h.
show the standard deviation of the mean.
, Weinheim www.ms-journal.de
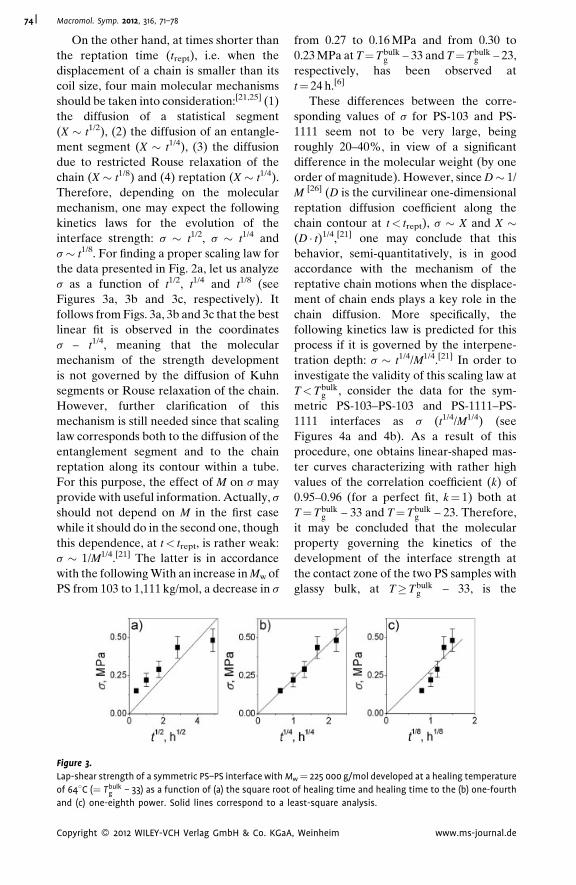
Macromol. Symp. 2012, 316, 71–7874
On the other hand, at times shorter than
the reptation time (trept), i.e. when the
displacement of a chain is smaller than its
coil size, four main molecular mechanisms
should be taken into consideration:[21,25] (1)
the diffusion of a statistical segment
(X � t1/2), (2) the diffusion of an entangle-
ment segment (X � t1/4), (3) the diffusion
due to restricted Rouse relaxation of the
chain (X � t1/8) and (4) reptation (X � t1/4).
Therefore, depending on the molecular
mechanism, one may expect the following
kinetics laws for the evolution of the
interface strength: s � t1/2, s � t1/4 and
s � t1/8. For finding a proper scaling law for
the data presented in Fig. 2a, let us analyze
s as a function of t1/2, t1/4 and t1/8 (see
Figures 3a, 3b and 3c, respectively). It
follows from Figs. 3a, 3b and 3c that the best
linear fit is observed in the coordinates
s – t1/4, meaning that the molecular
mechanism of the strength development
is not governed by the diffusion of Kuhn
segments or Rouse relaxation of the chain.
However, further clarification of this
mechanism is still needed since that scaling
law corresponds both to the diffusion of the
entanglement segment and to the chain
reptation along its contour within a tube.
For this purpose, the effect of M on s may
provide with useful information. Actually, s
should not depend on M in the first case
while it should do in the second one, though
this dependence, at t< trept, is rather weak:
s � 1/M1/4.[21] The latter is in accordance
with the following With an increase in Mw of
PS from 103 to 1,111 kg/mol, a decrease in s
Figure 3.
Lap-shear strength of a symmetric PS–PS interface with M
of 648C (¼ Tbulkg – 33) as a function of (a) the square root
and (c) one-eighth power. Solid lines correspond to a le
Copyright � 2012 WILEY-VCH Verlag GmbH & Co. KGaA
from 0.27 to 0.16 MPa and from 0.30 to
0.23 MPa at T¼ Tbulkg – 33 and T¼ Tbulk
g – 23,
respectively, has been observed at
t¼ 24 h.[6]
These differences between the corre-
sponding values of s for PS-103 and PS-
1111 seem not to be very large, being
roughly 20–40%, in view of a significant
difference in the molecular weight (by one
order of magnitude). However, since D� 1/
M [26] (D is the curvilinear one-dimensional
reptation diffusion coefficient along the
chain contour at t< trept), s � X and X �(D � t)1/4,[21] one may conclude that this
behavior, semi-quantitatively, is in good
accordance with the mechanism of the
reptative chain motions when the displace-
ment of chain ends plays a key role in the
chain diffusion. More specifically, the
following kinetics law is predicted for this
process if it is governed by the interpene-
tration depth: s � t1/4/M1/4.[21] In order to
investigate the validity of this scaling law at
T< Tbulkg , consider the data for the sym-
metric PS-103–PS-103 and PS-1111–PS-
1111 interfaces as s (t1/4/M1/4) (see
Figures 4a and 4b). As a result of this
procedure, one obtains linear-shaped mas-
ter curves characterizing with rather high
values of the correlation coefficient (k) of
0.95–0.96 (for a perfect fit, k¼ 1) both at
T¼ Tbulkg – 33 and T¼ Tbulk
g – 23. Therefore,
it may be concluded that the molecular
property governing the kinetics of the
development of the interface strength at
the contact zone of the two PS samples with
glassy bulk, at T� Tbulkg – 33, is the
w¼ 225 000 g/mol developed at a healing temperature
of healing time and healing time to the (b) one-fourth
ast-square analysis.
, Weinheim www.ms-journal.de
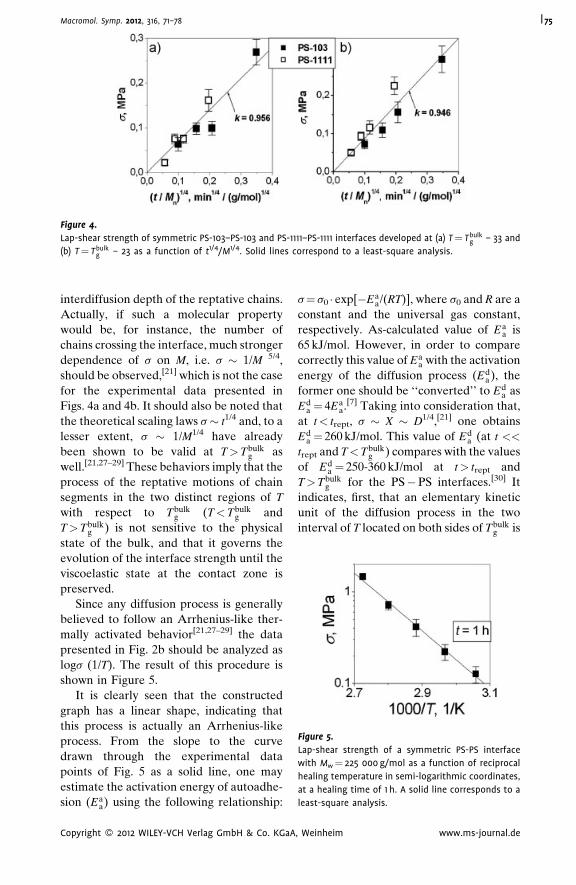
Figure 4.
Lap-shear strength of symmetric PS-103–PS-103 and PS-1111–PS-1111 interfaces developed at (a) T¼ Tbulkg – 33 and
(b) T¼ Tbulkg – 23 as a function of t1/4/M1/4. Solid lines correspond to a least-square analysis.
Figure 5.
Lap-shear strength of a symmetric PS-PS interface
with Mw¼ 225 000 g/mol as a function of reciprocal
healing temperature in semi-logarithmic coordinates,
at a healing time of 1 h. A solid line corresponds to a
least-square analysis.
Macromol. Symp. 2012, 316, 71–78 75
interdiffusion depth of the reptative chains.
Actually, if such a molecular property
would be, for instance, the number of
chains crossing the interface, much stronger
dependence of s on M, i.e. s � 1/M 5/4,
should be observed,[21] which is not the case
for the experimental data presented in
Figs. 4a and 4b. It should also be noted that
the theoretical scaling laws s� t1/4 and, to a
lesser extent, s � 1/M1/4 have already
been shown to be valid at T> Tbulkg as
well.[21,27–29] These behaviors imply that the
process of the reptative motions of chain
segments in the two distinct regions of T
with respect to Tbulkg (T< Tbulk
g and
T> Tbulkg ) is not sensitive to the physical
state of the bulk, and that it governs the
evolution of the interface strength until the
viscoelastic state at the contact zone is
preserved.
Since any diffusion process is generally
believed to follow an Arrhenius-like ther-
mally activated behavior[21,27–29] the data
presented in Fig. 2b should be analyzed as
logs (1/T). The result of this procedure is
shown in Figure 5.
It is clearly seen that the constructed
graph has a linear shape, indicating that
this process is actually an Arrhenius-like
process. From the slope to the curve
drawn through the experimental data
points of Fig. 5 as a solid line, one may
estimate the activation energy of autoadhe-
sion (Eaa) using the following relationship:
Copyright � 2012 WILEY-VCH Verlag GmbH & Co. KGaA
s¼ s0 � exp[�Eaa/(RT)], where s0 and R are a
constant and the universal gas constant,
respectively. As-calculated value of Eaa is
65 kJ/mol. However, in order to compare
correctly this value of Eaa with the activation
energy of the diffusion process (Eda), the
former one should be ‘‘converted’’ to Eda as
Eda ¼ 4Ea
a.[7] Taking into consideration that,
at t< trept, s � X � D1/4,[21] one obtains
Eda ¼ 260 kJ/mol. This value of Ed
a (at t <<
trept and T< Tbulkg ) compares with the values
of Eda ¼ 250-360 kJ/mol at t> trept and
T> Tbulkg for the PS�PS interfaces.[30] It
indicates, first, that an elementary kinetic
unit of the diffusion process in the two
interval of T located on both sides of Tbulkg is
, Weinheim www.ms-journal.de
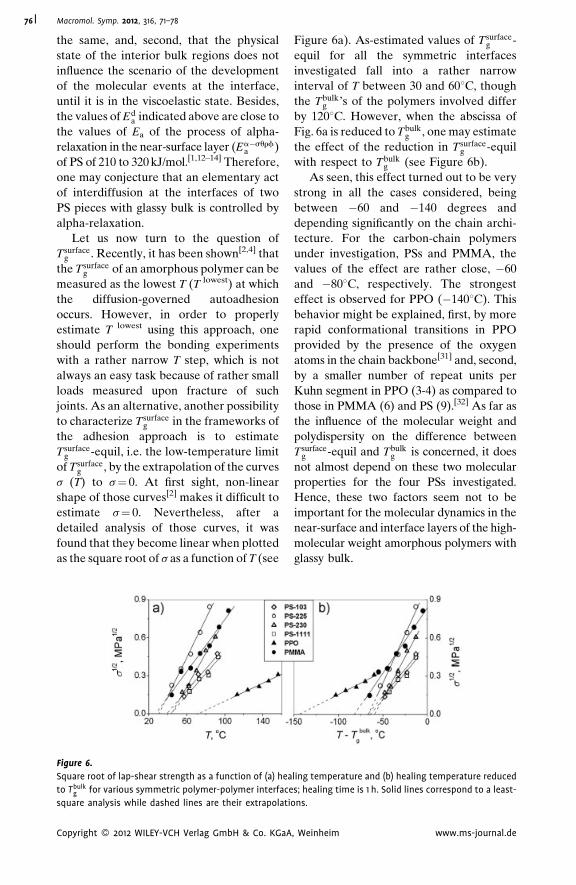
Macromol. Symp. 2012, 316, 71–7876
the same, and, second, that the physical
state of the interior bulk regions does not
influence the scenario of the development
of the molecular events at the interface,
until it is in the viscoelastic state. Besides,
the values of Eda indicated above are close to
the values of Ea of the process of alpha-
relaxation in the near-surface layer (Ea�surfa )
of PS of 210 to 320 kJ/mol.[1,12–14] Therefore,
one may conjecture that an elementary act
of interdiffusion at the interfaces of two
PS pieces with glassy bulk is controlled by
alpha-relaxation.
Let us now turn to the question of
Tsurfaceg . Recently, it has been shown[2,4] that
the Tsurfaceg of an amorphous polymer can be
measured as the lowest T (T lowest) at which
the diffusion-governed autoadhesion
occurs. However, in order to properly
estimate T lowest using this approach, one
should perform the bonding experiments
with a rather narrow T step, which is not
always an easy task because of rather small
loads measured upon fracture of such
joints. As an alternative, another possibility
to characterize Tsurfaceg in the frameworks of
the adhesion approach is to estimate
Tsurfaceg -equil, i.e. the low-temperature limit
of Tsurfaceg , by the extrapolation of the curves
s (T) to s¼ 0. At first sight, non-linear
shape of those curves[2] makes it difficult to
estimate s¼ 0. Nevertheless, after a
detailed analysis of those curves, it was
found that they become linear when plotted
as the square root of s as a function of T (see
Figure 6.
Square root of lap-shear strength as a function of (a) hea
to Tbulkg for various symmetric polymer-polymer interface
square analysis while dashed lines are their extrapolati
Copyright � 2012 WILEY-VCH Verlag GmbH & Co. KGaA
Figure 6a). As-estimated values of T surfaceg -
equil for all the symmetric interfaces
investigated fall into a rather narrow
interval of T between 30 and 608C, though
the Tbulkg ’s of the polymers involved differ
by 1208C. However, when the abscissa of
Fig. 6a is reduced to Tbulkg , one may estimate
the effect of the reduction in Tsurfaceg -equil
with respect to Tbulkg (see Figure 6b).
As seen, this effect turned out to be very
strong in all the cases considered, being
between �60 and �140 degrees and
depending significantly on the chain archi-
tecture. For the carbon-chain polymers
under investigation, PSs and PMMA, the
values of the effect are rather close, �60
and �808C, respectively. The strongest
effect is observed for PPO (�1408C). This
behavior might be explained, first, by more
rapid conformational transitions in PPO
provided by the presence of the oxygen
atoms in the chain backbone[31] and, second,
by a smaller number of repeat units per
Kuhn segment in PPO (3-4) as compared to
those in PMMA (6) and PS (9).[32] As far as
the influence of the molecular weight and
polydispersity on the difference between
Tsurfaceg -equil and Tbulk
g is concerned, it does
not almost depend on these two molecular
properties for the four PSs investigated.
Hence, these two factors seem not to be
important for the molecular dynamics in the
near-surface and interface layers of the high-
molecular weight amorphous polymers with
glassy bulk.
ling temperature and (b) healing temperature reduced
s; healing time is 1 h. Solid lines correspond to a least-
ons.
, Weinheim www.ms-journal.de
Macromol. Symp. 2012, 316, 71–78 77
One of the important fundamental
questions of the contemporary physics of
polymers is the question of the existence of
the enhanced molecular mobility at poly-
mer-polymer interfaces in comparison with
that in the polymer bulk. For instance, it has
been suggested by Sharp and Forrest[11]
that the effect of the lowering of T surfaceg
with respect to Tbulkg should vanish after the
surfaces are brought into contact. To put it
differently, according to this point of view,
the presence of the free polymer surface is a
necessary condition for this effect to show
up. However, the results reported in the
present study indicate that the long-range
segmental motions do exist at the contact
zone of the two polymer pieces with glassy
bulk, as it do at the contact zone of the two
polymer pieces with the viscoelastic state of
the bulk. This behavior may be explained as
follows. A decreased mass density and a
decreased concentration in the entangle-
ments at polymer surfaces and interfaces in
comparison with those in the polymer bulk
are believed to be the important factors of
the manifestation of this effect.[2,15] It is
obvious that these molecular properties
cannot immediately, upon the contact,
attain those that are characteristic of the
bulk, even at early stages of healing, though
a steady slowdown of this effect is expected
as healing progresses. Seemingly, that is
why the effect of the enhanced molecular
mobility existing on the free polymer
surface continues to exist at the early stages
of healing of polymer-polymer interfaces as
well.
Conclusion
It has been shown that the molecular
property governing the process of the
evolution of the strength at the contact
zone of the two amorphous polymer pieces
with glassy bulk is the interpenetration
depth of the reptating chains. The elemen-
tary kinetic unit of motion of this process is
Kuhn segment. The realization of this
molecular mechanism of the interface
healing is provided by the viscoelastic state
Copyright � 2012 WILEY-VCH Verlag GmbH & Co. KGaA
of the contact zone over a certain interval of
bonding temperatures wherein the long-
range segmental motions is activated,
despite the glassy state of the bulk wherein
this mode of the molecular motion is
frozen. The proposed adhesion approach
has been shown to be useful to estimate the
quasi-equilibrium surface glass transition
temperature of an amorphous polymer by
the extrapolation of the corresponding
curves ‘‘square root of lap-shear strength
versus bonding temperature’’ to zero
strength. It has been found that the effect
of the lowering of the quasi-equilibrium
Tsurfaceg with respect to Tbulk
g is characteristic
of non-crystallizable polymers. For the
high-molecular weight amorphous poly-
mers (M>Ment), this effect depends
strongly on the chain architecture and
weakly on the molecular weight and
polydispersity.
[1] Yu. M. Boiko, Colloid Polym. Sci. 2011, 289, 971.
[2] Yu. M. Boiko, J. Polym. Sci.: Part B: Polym. Phys.
2010, 48, 2012.
[3] Yu. M. Boiko, R. E. Prud’homme, J. Macromol. Sci.,
Part B�Phys. 2005, 44, 413.
[4] Yu. M. Boiko, Colloid Polym. Sci. 2010, 288, 1757.
[5] Yu. M. Boiko, A. Bach, J. Lyngaae-Jørgensen, J.
Polym. Sci.: Part B: Polym. Phys. 2004, 42, 1861.
[6] Yu. M. Boiko, J. Lyngaae-Jørgensen, Polymer 2004,
45, 8541.
[7] Yu. M. Boiko, J. Lyngaae-Jørgensen, Polymer 2005,
46, 6016.
[8] Yu. M. Boiko, Polym. Sci. A 2009, 51, 1040.
[9] K. F. Mansfield, D. N. Theodorou, Macromolecules
1991, 24, 6283.
[10] A. M. Mayes, Macromolecules 1994, 27, 3114.
[11] J. S. Sharp, J. F. Forrest, Phys. Rev. Lett. 2003, 91,
235701.
[12] J. Fu, B. Li, Y. Han, J. Chem. Phys. 2005, 123, 064713.
[13] T. Kajiyama, K. Tanaka, N. Satomi, A. Takahara,
Macromolecules 1998, 31, 5150.
[14] K. Akabori, K. Tanaka, T. Kajiyama, A. Takahara,
Macromolecules 2003, 36, 4937.
[15] H. R. Brown, T. P. Russell, Macromolecules 1996, 29,
798.
[16] Yu. M. Boiko, G. Guerin, V. A. Marikhin, R. E.
Prud’homme, Polymer 2004, 42, 8695.
[17] D. Kawaguchi, K. Tanaka, T. Kajiyama, A. Takahara,
S. Tasaki, Macromolecules 2003, 36, 1235.
, Weinheim www.ms-journal.de
Macromol. Symp. 2012, 316, 71–7878
[18] K.-I. Akabori, D. Baba, K. Koguchi, K. Tanaka,
T. Nagamura, J. Polym. Sci.: Part B: Polym. Phys.
2006, 44, 3598.
[19] A. Serghei, H. Huth, C. Schick, F. Kremer, Macro-
molecules 2008, 41, 3636.
[20] M. Tress, M. Erber, E. U. Mapesa, H. Huth,
J. Muller, A. Serghei, C. Schick, K.-J. Eichhorn,
B. Voit, F. Kremer, Macromolecules 2010, 43, 9937.
[21] R. P. Wool, ‘‘Polymer Interfaces: Structure and
Strength’’, Hanser Press, Munich 1995, 494 p.
[22] D. W. van Krevelen, ‘‘Properties of Polymers: Their
Correlation with Chemical Structure’’, 3rd ed. Elsevier,
Amsterdam 1997, 875 p.
[23] J. L. Keddie, R. A. L. Jones, R. A. Cory, Europhys. Lett.
1994, 27, 59.
Copyright � 2012 WILEY-VCH Verlag GmbH & Co. KGaA
[24] K. Dalnoki-Veress, J. A. Forrest, C. Murray,
C. Gigault, J. R. Dutcher, Phys. Rev. E 2001, 63, 031801.
[25] M. Doi, S. F. Edwards, ‘‘The Theory of Polymer
Dynamics’’, Clarendon Press, Oxford 1986, 391 p.
[26] P.-G. de Gennes, J. Chem. Phys. 1971, 55, 572.
[27] H.-H. Kausch, ‘‘Polymer Fracture’’, 2nd ed.,
Springer, Berlin 1987, 416 p.
[28] K. Jud, H. H. Kausch, J. G. Williams, J. Mater. Sci.
1981, 16, 204.
[29] D. B. Kline, R. P. Wool, Polym. Eng. Sci. 1988, 28, 52.
[30] S. J. Whitlow, R. P. Wool, Macromolecules 1991, 24,
5926.
[31] H. Feng, Z. Feng, H. Ruan, L. Shen, Macromolecules
1992, 25, 5981.
[32] S. M. Aharoni, Macromolecules 1983, 16, 1722.
, Weinheim www.ms-journal.de
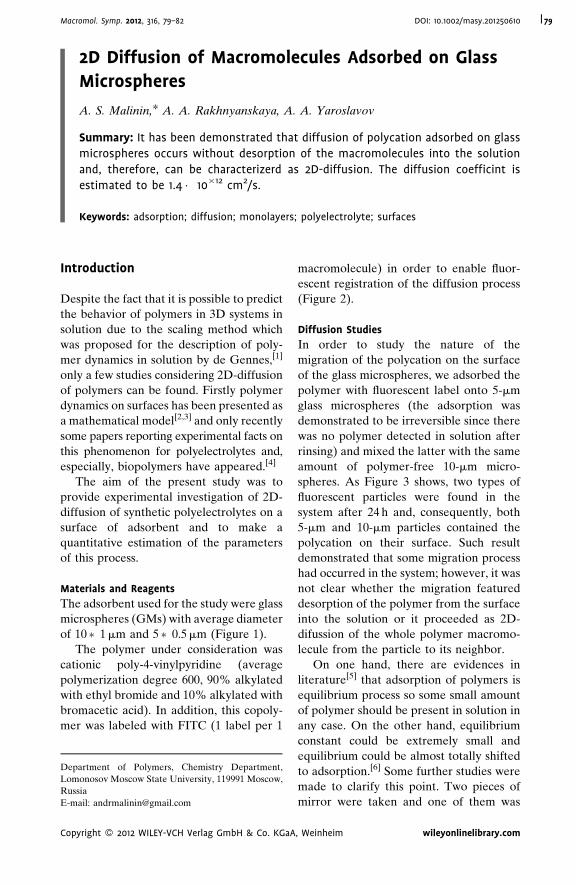
Macromol. Symp. 2012, 316, 79–82 DOI: 10.1002/masy.201250610 79
Dep
Lom
Rus
E-m
Cop
2D Diffusion of Macromolecules Adsorbed on Glass
Microspheres
A. S. Malinin,* A. A. Rakhnyanskaya, A. A. Yaroslavov
Summary: It has been demonstrated that diffusion of polycation adsorbed on glass
microspheres occurs without desorption of the macromolecules into the solution
and, therefore, can be characterizerd as 2D-diffusion. The diffusion coefficint is
estimated to be 1.4� 10�12 cm2/s.
Keywords: adsorption; diffusion; monolayers; polyelectrolyte; surfaces
Introduction
Despite the fact that it is possible to predict
the behavior of polymers in 3D systems in
solution due to the scaling method which
was proposed for the description of poly-
mer dynamics in solution by de Gennes,[1]
only a few studies considering 2D-diffusion
of polymers can be found. Firstly polymer
dynamics on surfaces has been presented as
a mathematical model[2,3] and only recently
some papers reporting experimental facts on
this phenomenon for polyelectrolytes and,
especially, biopolymers have appeared.[4]
The aim of the present study was to
provide experimental investigation of 2D-
diffusion of synthetic polyelectrolytes on a
surface of adsorbent and to make a
quantitative estimation of the parameters
of this process.
Materials and Reagents
The adsorbent used for the study were glass
microspheres (GMs) with average diameter
of 10� 1 mm and 5� 0.5 mm (Figure 1).
The polymer under consideration was
cationic poly-4-vinylpyridine (average
polymerization degree 600, 90% alkylated
with ethyl bromide and 10% alkylated with
bromacetic acid). In addition, this copoly-
mer was labeled with FITC (1 label per 1
artment of Polymers, Chemistry Department,
onosov Moscow State University, 119991 Moscow,
sia
ail: [email protected]
yright � 2012 WILEY-VCH Verlag GmbH & Co. KGaA
macromolecule) in order to enable fluor-
escent registration of the diffusion process
(Figure 2).
Diffusion Studies
In order to study the nature of the
migration of the polycation on the surface
of the glass microspheres, we adsorbed the
polymer with fluorescent label onto 5-mm
glass microspheres (the adsorption was
demonstrated to be irreversible since there
was no polymer detected in solution after
rinsing) and mixed the latter with the same
amount of polymer-free 10-mm micro-
spheres. As Figure 3 shows, two types of
fluorescent particles were found in the
system after 24 h and, consequently, both
5-mm and 10-mm particles contained the
polycation on their surface. Such result
demonstrated that some migration process
had occurred in the system; however, it was
not clear whether the migration featured
desorption of the polymer from the surface
into the solution or it proceeded as 2D-
difussion of the whole polymer macromo-
lecule from the particle to its neighbor.
On one hand, there are evidences in
literature[5] that adsorption of polymers is
equilibrium process so some small amount
of polymer should be present in solution in
any case. On the other hand, equilibrium
constant could be extremely small and
equilibrium could be almost totally shifted
to adsorption.[6] Some further studies were
made to clarify this point. Two pieces of
mirror were taken and one of them was
, Weinheim wileyonlinelibrary.com
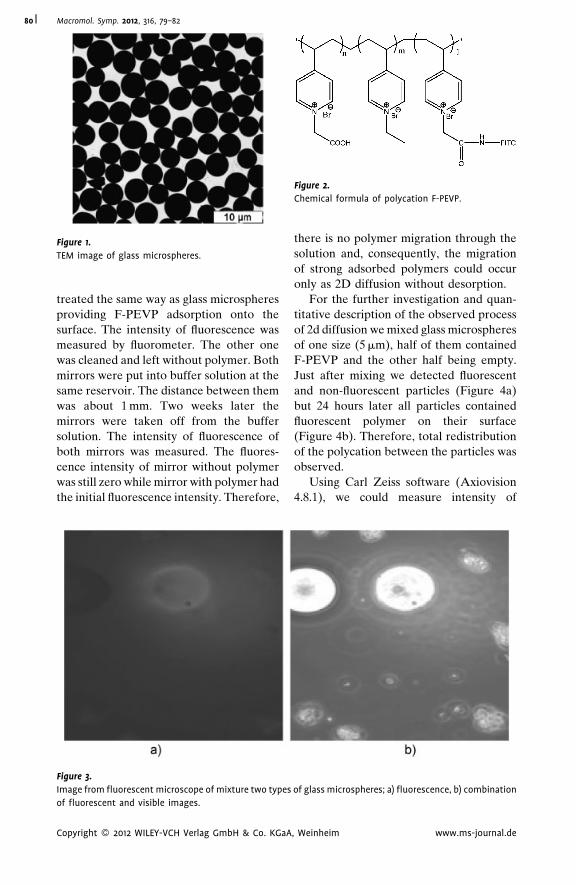
Figure 1.
TEM image of glass microspheres.
Figure 2.
Chemical formula of polycation F-PEVP.
Macromol. Symp. 2012, 316, 79–8280
treated the same way as glass microspheres
providing F-PEVP adsorption onto the
surface. The intensity of fluorescence was
measured by fluorometer. The other one
was cleaned and left without polymer. Both
mirrors were put into buffer solution at the
same reservoir. The distance between them
was about 1 mm. Two weeks later the
mirrors were taken off from the buffer
solution. The intensity of fluorescence of
both mirrors was measured. The fluores-
cence intensity of mirror without polymer
was still zero while mirror with polymer had
the initial fluorescence intensity. Therefore,
Figure 3.
Image from fluorescent microscope of mixture two types
of fluorescent and visible images.
Copyright � 2012 WILEY-VCH Verlag GmbH & Co. KGaA
there is no polymer migration through the
solution and, consequently, the migration
of strong adsorbed polymers could occur
only as 2D diffusion without desorption.
For the further investigation and quan-
titative description of the observed process
of 2d diffusion we mixed glass microspheres
of one size (5 mm), half of them contained
F-PEVP and the other half being empty.
Just after mixing we detected fluorescent
and non-fluorescent particles (Figure 4a)
but 24 hours later all particles contained
fluorescent polymer on their surface
(Figure 4b). Therefore, total redistribution
of the polycation between the particles was
observed.
Using Carl Zeiss software (Axiovision
4.8.1), we could measure intensity of
of glass microspheres; a) fluorescence, b) combination
, Weinheim www.ms-journal.de
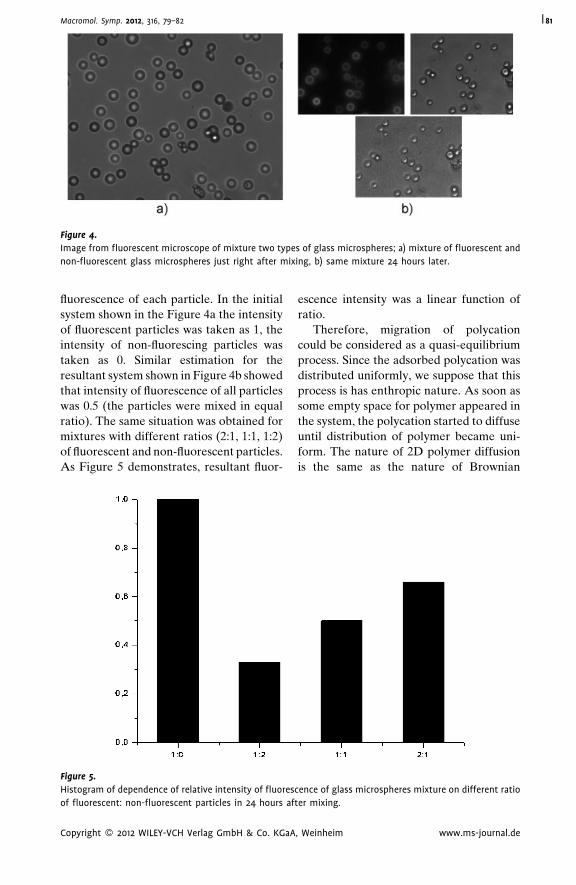
Figure 4.
Image from fluorescent microscope of mixture two types of glass microspheres; a) mixture of fluorescent and
non-fluorescent glass microspheres just right after mixing, b) same mixture 24 hours later.
Macromol. Symp. 2012, 316, 79–82 81
fluorescence of each particle. In the initial
system shown in the Figure 4a the intensity
of fluorescent particles was taken as 1, the
intensity of non-fluorescing particles was
taken as 0. Similar estimation for the
resultant system shown in Figure 4b showed
that intensity of fluorescence of all particles
was 0.5 (the particles were mixed in equal
ratio). The same situation was obtained for
mixtures with different ratios (2:1, 1:1, 1:2)
of fluorescent and non-fluorescent particles.
As Figure 5 demonstrates, resultant fluor-
Figure 5.
Histogram of dependence of relative intensity of fluores
of fluorescent: non-fluorescent particles in 24 hours af
Copyright � 2012 WILEY-VCH Verlag GmbH & Co. KGaA
escence intensity was a linear function of
ratio.
Therefore, migration of polycation
could be considered as a quasi-equilibrium
process. Since the adsorbed polycation was
distributed uniformly, we suppose that this
process is has enthropic nature. As soon as
some empty space for polymer appeared in
the system, the polycation started to diffuse
until distribution of polymer became uni-
form. The nature of 2D polymer diffusion
is the same as the nature of Brownian
cence of glass microspheres mixture on different ratio
ter mixing.
, Weinheim www.ms-journal.de
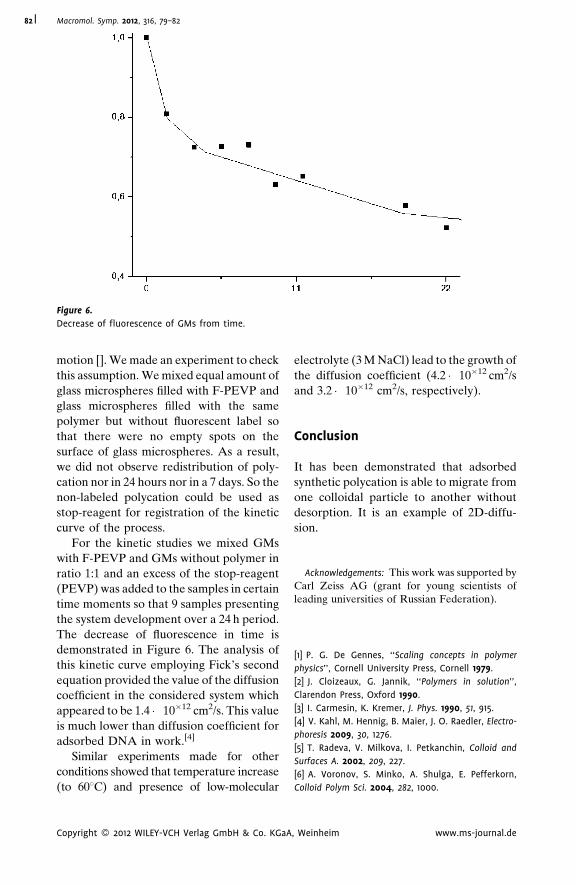
Figure 6.
Decrease of fluorescence of GMs from time.
Macromol. Symp. 2012, 316, 79–8282
motion []. We made an experiment to check
this assumption. We mixed equal amount of
glass microspheres filled with F-PEVP and
glass microspheres filled with the same
polymer but without fluorescent label so
that there were no empty spots on the
surface of glass microspheres. As a result,
we did not observe redistribution of poly-
cation nor in 24 hours nor in a 7 days. So the
non-labeled polycation could be used as
stop-reagent for registration of the kinetic
curve of the process.
For the kinetic studies we mixed GMs
with F-PEVP and GMs without polymer in
ratio 1:1 and an excess of the stop-reagent
(PEVP) was added to the samples in certain
time moments so that 9 samples presenting
the system development over a 24 h period.
The decrease of fluorescence in time is
demonstrated in Figure 6. The analysis of
this kinetic curve employing Fick’s second
equation provided the value of the diffusion
coefficient in the considered system which
appeared to be 1.4� 10�12 cm2/s. This value
is much lower than diffusion coefficient for
adsorbed DNA in work.[4]
Similar experiments made for other
conditions showed that temperature increase
(to 608C) and presence of low-molecular
Copyright � 2012 WILEY-VCH Verlag GmbH & Co. KGaA
electrolyte (3 M NaCl) lead to the growth of
the diffusion coefficient (4.2� 10�12 cm2/s
and 3.2� 10�12 cm2/s, respectively).
Conclusion
It has been demonstrated that adsorbed
synthetic polycation is able to migrate from
one colloidal particle to another without
desorption. It is an example of 2D-diffu-
sion.
Acknowledgements: This work was supported byCarl Zeiss AG (grant for young scientists ofleading universities of Russian Federation).
[1] P. G. De Gennes, ‘‘Scaling concepts in polymer
physics’’, Cornell University Press, Cornell 1979.
[2] J. Cloizeaux, G. Jannik, ‘‘Polymers in solution’’,
Clarendon Press, Oxford 1990.
[3] I. Carmesin, K. Kremer, J. Phys. 1990, 51, 915.
[4] V. Kahl, M. Hennig, B. Maier, J. O. Raedler, Electro-
phoresis 2009, 30, 1276.
[5] T. Radeva, V. Milkova, I. Petkanchin, Colloid and
Surfaces A. 2002, 209, 227.
[6] A. Voronov, S. Minko, A. Shulga, E. Pefferkorn,
Colloid Polym Sci. 2004, 282, 1000.
, Weinheim www.ms-journal.de
Macromol. Symp. 2012, 316, 83–89 DOI: 10.1002/masy.201250611 83
1 In
31
E-2 Le
H
Cop
Dynamic Mechanical Analysis and Molecular Mobility
of the R-BAPB Type Polyimide
V. P. Toshchevikov,*1,2 V. E. Smirnova,1 V. E. Yudin,1 V. M. Svetlichnyi1
Summary: Dynamic mechanical experiments are performed to study molecular
mobility of the R-BAPB type polyimide based on 1,3-bis-(3,30,4,40-dicarboxyphenoxy)-
benzene (R) and 4,40-bis-(4-aminophenoxy)biphenyl (BAPB) with a molecular weight
Mw � 80 000 g/mol. Frequency dependences of the storage and the loss tensile
moduli are measured within the temperature domain 1998C� T� 2118C that includes
the glass transition temperature of the compound, Tg¼ 2068C. It is shown that the
time-temperature superposition principle holds for the R-BAPB type polyimide. A
theoretical analysis of the master curves constructed at Tref¼ 2048C is performed on
the basis of the piecewise-power-type distribution function of the relaxation times.
Relaxation times for typical scales of motion inside polyimide macromolecules are
calculated and the molecular weights of the characteristic kinetic units (the Kuhn
segment and the chain fragment between entanglements) are estimated.
Keywords: dynamic modulus; mechanical properties; polyimides; theory
Introduction
Polyimides (PIs) are considered to be one of
the most important engineering plastics
which have a fascinating potential for
technical applications due to their excellent
thermal stability, mechanical properties, and
chemical resistance.[1–4] Nowadays, one of
the perspective topics is a design of the
PI-based nanocomposites which exhibit
increased modulus and strength, high heat
distortion temperature, decreased thermal
expansion coefficient, reduced gas perme-
ability, and increased solvent resistance
compared to pristine polymers.[5–11] For
understanding the physical mechanisms
which determine the practically important
properties of these compounds one needs to
know their molecular features, in particular,
the conformations and mobility of macro-
molecules that compose these materials.
One of the widely-used methods for inves-
stitute of Macromolecular Compounds, Bolshoi pr.
, 199004 Saint-Petersburg, Russia
mail: [email protected]
ibniz Institute of Polymer Research Dresden,
ohe Str. 6, 01069 Dresden, Germany
yright � 2012 WILEY-VCH Verlag GmbH & Co. KGaA
tigating the structure and molecular mobility
of polymers is the dynamic mechanical
analysis.[12–14]
The present paper is devoted to the
dynamic mechanical analysis of the R-
BAPB type PI (Figure 1) which can be a
potential candidate as high-performance
thermoplastic matrix for thermally stable
fiber reinforced composites as well as
nanocomposites.[9–11] The frequency and
temperature dependences of the dynamic
tensile moduli for the R-BAPB type PI are
measured and analyzed by means of a
theoretical method which allows us to
describe the molecular mobility within a
wide range of scale of motions.
Experimental Part
Poly(amic acid) (PAA) was obtained
by polycondensation of 1,3-bis(3,30,4,40-
dicarboxyphenoxy)benzene (R) and 4,40-
bis-(4-aminophenoxy)biphenyl (BAPB)
supplied by Wakayama Seika Co., Ltd.
(Japan) in a 20% solution of N-methyl-2-
pyrrolidone (NMP) at 258C. The average
molecular weight of R-BAPB type PAA,
, Weinheim wileyonlinelibrary.com
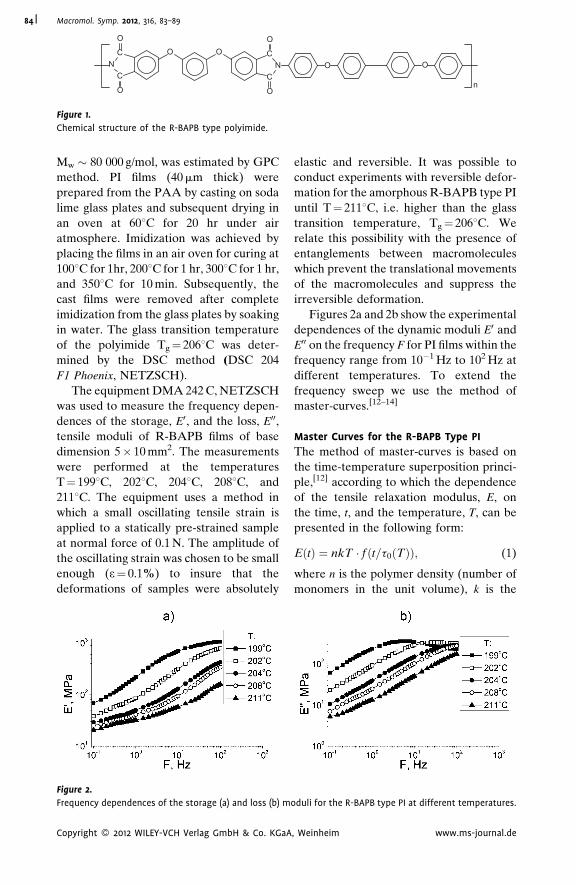
CN
C
O
O n
O OOO C
NC
O
O
Figure 1.
Chemical structure of the R-BAPB type polyimide.
Macromol. Symp. 2012, 316, 83–8984
Mw � 80 000 g/mol, was estimated by GPC
method. PI films (40 mm thick) were
prepared from the PAA by casting on soda
lime glass plates and subsequent drying in
an oven at 608C for 20 hr under air
atmosphere. Imidization was achieved by
placing the films in an air oven for curing at
1008C for 1hr, 2008C for 1 hr, 3008C for 1 hr,
and 3508C for 10 min. Subsequently, the
cast films were removed after complete
imidization from the glass plates by soaking
in water. The glass transition temperature
of the polyimide Tg¼ 2068C was deter-
mined by the DSC method (DSC 204
F1 Phoenix, NETZSCH).
The equipment DMA 242 C, NETZSCH
was used to measure the frequency depen-
dences of the storage, E0, and the loss, E00,
tensile moduli of R-BAPB films of base
dimension 5� 10 mm2. The measurements
were performed at the temperatures
T¼ 1998C, 2028C, 2048C, 2088C, and
2118C. The equipment uses a method in
which a small oscillating tensile strain is
applied to a statically pre-strained sample
at normal force of 0.1 N. The amplitude of
the oscillating strain was chosen to be small
enough (e¼ 0.1%) to insure that the
deformations of samples were absolutely
Figure 2.
Frequency dependences of the storage (a) and loss (b) m
Copyright � 2012 WILEY-VCH Verlag GmbH & Co. KGaA
elastic and reversible. It was possible to
conduct experiments with reversible defor-
mation for the amorphous R-BAPB type PI
until T¼ 2118C, i.e. higher than the glass
transition temperature, Tg¼ 2068C. We
relate this possibility with the presence of
entanglements between macromolecules
which prevent the translational movements
of the macromolecules and suppress the
irreversible deformation.
Figures 2a and 2b show the experimental
dependences of the dynamic moduli E0 and
E00 on the frequency F for PI films within the
frequency range from 10�1 Hz to 102 Hz at
different temperatures. To extend the
frequency sweep we use the method of
master-curves.[12–14]
Master Curves for the R-BAPB Type PI
The method of master-curves is based on
the time-temperature superposition princi-
ple,[12] according to which the dependence
of the tensile relaxation modulus, E, on
the time, t, and the temperature, T, can be
presented in the following form:
EðtÞ ¼ nkT � f ðt=t0ðTÞÞ; (1)
where n is the polymer density (number of
monomers in the unit volume), k is the
oduli for the R-BAPB type PI at different temperatures.
, Weinheim www.ms-journal.de
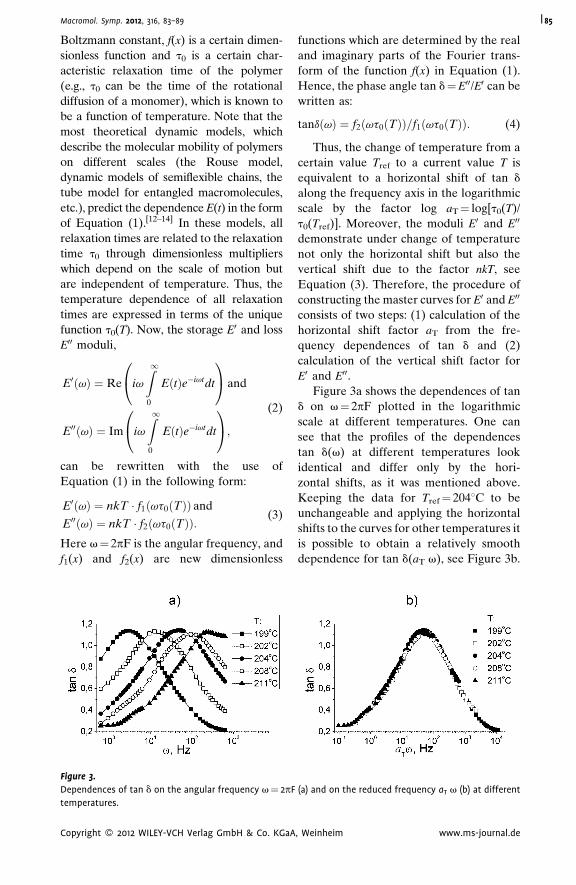
Macromol. Symp. 2012, 316, 83–89 85
Boltzmann constant, f(x) is a certain dimen-
sionless function and t0 is a certain char-
acteristic relaxation time of the polymer
(e.g., t0 can be the time of the rotational
diffusion of a monomer), which is known to
be a function of temperature. Note that the
most theoretical dynamic models, which
describe the molecular mobility of polymers
on different scales (the Rouse model,
dynamic models of semiflexible chains, the
tube model for entangled macromolecules,
etc.), predict the dependence E(t) in the form
of Equation (1).[12–14] In these models, all
relaxation times are related to the relaxation
time t0 through dimensionless multipliers
which depend on the scale of motion but
are independent of temperature. Thus, the
temperature dependence of all relaxation
times are expressed in terms of the unique
function t0(T). Now, the storage E0 and loss
E00 moduli,
E0ðvÞ ¼ Re iv
Z1
0
EðtÞe�ivtdt
0@
1A and
E00ðvÞ ¼ Im iv
Z1
0
EðtÞe�ivtdt
0@
1A;
(2)
can be rewritten with the use of
Equation (1) in the following form:
E0ðvÞ ¼ nkT � f1ðvt0ðTÞÞ and
E00ðvÞ ¼ nkT � f2ðvt0ðTÞÞ:(3)
Here v¼ 2pF is the angular frequency, and
f1(x) and f2(x) are new dimensionless
Figure 3.
Dependences of tan d on the angular frequency v¼ 2pF
temperatures.
Copyright � 2012 WILEY-VCH Verlag GmbH & Co. KGaA
functions which are determined by the real
and imaginary parts of the Fourier trans-
form of the function f(x) in Equation (1).
Hence, the phase angle tan d¼E00/E0 can be
written as:
tandðvÞ ¼ f2ðvt0ðTÞÞ=f1ðvt0ðTÞÞ: (4)
Thus, the change of temperature from a
certain value Tref to a current value T is
equivalent to a horizontal shift of tan d
along the frequency axis in the logarithmic
scale by the factor log aT¼ log[t0(T)/
t0(Tref)]. Moreover, the moduli E0 and E00
demonstrate under change of temperature
not only the horizontal shift but also the
vertical shift due to the factor nkT, see
Equation (3). Therefore, the procedure of
constructing the master curves for E0 and E00
consists of two steps: (1) calculation of the
horizontal shift factor aT from the fre-
quency dependences of tan d and (2)
calculation of the vertical shift factor for
E0 and E00.
Figure 3a shows the dependences of tan
d on v¼ 2pF plotted in the logarithmic
scale at different temperatures. One can
see that the profiles of the dependences
tan d(v) at different temperatures look
identical and differ only by the hori-
zontal shifts, as it was mentioned above.
Keeping the data for Tref¼ 2048C to be
unchangeable and applying the horizontal
shifts to the curves for other temperatures it
is possible to obtain a relatively smooth
dependence for tan d(aT v), see Figure 3b.
(a) and on the reduced frequency aT v (b) at different
, Weinheim www.ms-journal.de
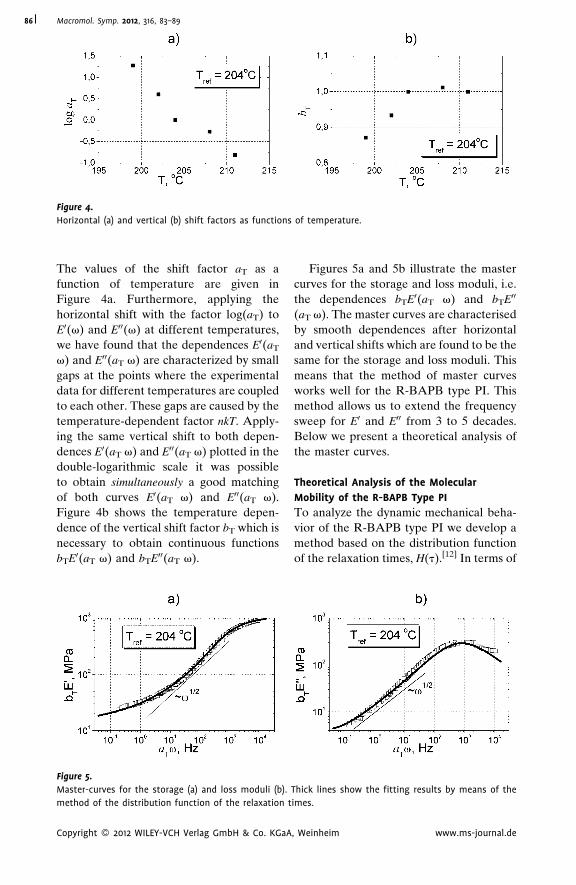
Figure 4.
Horizontal (a) and vertical (b) shift factors as functions of temperature.
Macromol. Symp. 2012, 316, 83–8986
The values of the shift factor aT as a
function of temperature are given in
Figure 4a. Furthermore, applying the
horizontal shift with the factor log(aT) to
E0(v) and E00(v) at different temperatures,
we have found that the dependences E0(aT
v) and E00(aT v) are characterized by small
gaps at the points where the experimental
data for different temperatures are coupled
to each other. These gaps are caused by the
temperature-dependent factor nkT. Apply-
ing the same vertical shift to both depen-
dences E0(aT v) and E00(aT v) plotted in the
double-logarithmic scale it was possible
to obtain simultaneously a good matching
of both curves E0(aT v) and E00(aT v).
Figure 4b shows the temperature depen-
dence of the vertical shift factor bT which is
necessary to obtain continuous functions
bTE0(aT v) and bTE00(aT v).
Figure 5.
Master-curves for the storage (a) and loss moduli (b).
method of the distribution function of the relaxation t
Copyright � 2012 WILEY-VCH Verlag GmbH & Co. KGaA
Figures 5a and 5b illustrate the master
curves for the storage and loss moduli, i.e.
the dependences bTE0(aT v) and bTE00
(aT v). The master curves are characterised
by smooth dependences after horizontal
and vertical shifts which are found to be the
same for the storage and loss moduli. This
means that the method of master curves
works well for the R-BAPB type PI. This
method allows us to extend the frequency
sweep for E0 and E00 from 3 to 5 decades.
Below we present a theoretical analysis of
the master curves.
Theoretical Analysis of the Molecular
Mobility of the R-BAPB Type PI
To analyze the dynamic mechanical beha-
vior of the R-BAPB type PI we develop a
method based on the distribution function
of the relaxation times, H(t).[12] In terms of
Thick lines show the fitting results by means of the
imes.
, Weinheim www.ms-journal.de
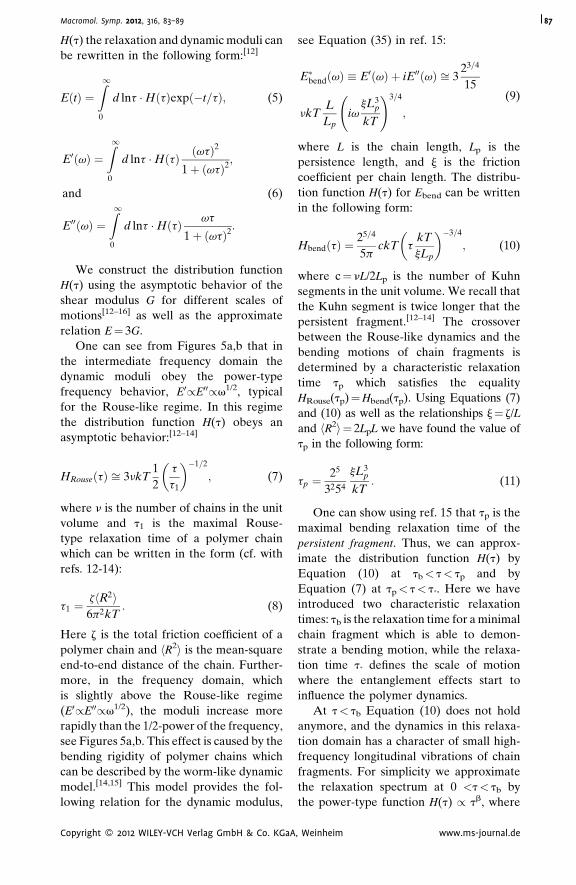
Macromol. Symp. 2012, 316, 83–89 87
H(t) the relaxation and dynamic moduli can
be rewritten in the following form:[12]
EðtÞ ¼Z1
0
d lnt �HðtÞexpð�t=tÞ; (5)
E0ðvÞ ¼Z1
0
d lnt �HðtÞ ðvtÞ2
1þ ðvtÞ2;
and
E00ðvÞ ¼Z1
0
d lnt �HðtÞ vt
1þ ðvtÞ2:
(6)
We construct the distribution function
H(t) using the asymptotic behavior of the
shear modulus G for different scales of
motions[12–16] as well as the approximate
relation E¼ 3G.
One can see from Figures 5a,b that in
the intermediate frequency domain the
dynamic moduli obey the power-type
frequency behavior, E0/E00/v1/2, typical
for the Rouse-like regime. In this regime
the distribution function H(t) obeys an
asymptotic behavior:[12–14]
HRouseðtÞ ffi 3nkT1
2
t
t1
� ��1=2
; (7)
where n is the number of chains in the unit
volume and t1 is the maximal Rouse-
type relaxation time of a polymer chain
which can be written in the form (cf. with
refs. 12-14):
t1 ¼zhR2i6p2kT
: (8)
Here z is the total friction coefficient of a
polymer chain and hR2i is the mean-square
end-to-end distance of the chain. Further-
more, in the frequency domain, which
is slightly above the Rouse-like regime
(E0/E00/v1/2), the moduli increase more
rapidly than the 1/2-power of the frequency,
see Figures 5a,b. This effect is caused by the
bending rigidity of polymer chains which
can be described by the worm-like dynamic
model.[14,15] This model provides the fol-
lowing relation for the dynamic modulus,
Copyright � 2012 WILEY-VCH Verlag GmbH & Co. KGaA
see Equation (35) in ref. 15:
E�bendðvÞ � E0ðvÞ þ iE00ðvÞ ffi 323=4
15
nkTL
Lpiv
jL3p
kT
!3=4
;
(9)
where L is the chain length, Lp is the
persistence length, and j is the friction
coefficient per chain length. The distribu-
tion function H(t) for Ebend can be written
in the following form:
HbendðtÞ ¼25=4
5pckT t
kT
jLp
� ��3=4
; (10)
where c¼ nL/2Lp is the number of Kuhn
segments in the unit volume. We recall that
the Kuhn segment is twice longer that the
persistent fragment.[12–14] The crossover
between the Rouse-like dynamics and the
bending motions of chain fragments is
determined by a characteristic relaxation
time tp which satisfies the equality
HRouse(tp)¼Hbend(tp). Using Equations (7)
and (10) as well as the relationships j¼ z/L
and hR2i¼ 2LpL we have found the value of
tp in the following form:
tp ¼25
3254
jL3p
kT: (11)
One can show using ref. 15 that tp is the
maximal bending relaxation time of the
persistent fragment. Thus, we can approx-
imate the distribution function H(t) by
Equation (10) at tb< t< tp and by
Equation (7) at tp< t< t�. Here we have
introduced two characteristic relaxation
times: tb is the relaxation time for a minimal
chain fragment which is able to demon-
strate a bending motion, while the relaxa-
tion time t� defines the scale of motion
where the entanglement effects start to
influence the polymer dynamics.
At t< tb Equation (10) does not hold
anymore, and the dynamics in this relaxa-
tion domain has a character of small high-
frequency longitudinal vibrations of chain
fragments. For simplicity we approximate
the relaxation spectrum at 0 <t< tb by
the power-type function H(t) / tb, where
, Weinheim www.ms-journal.de
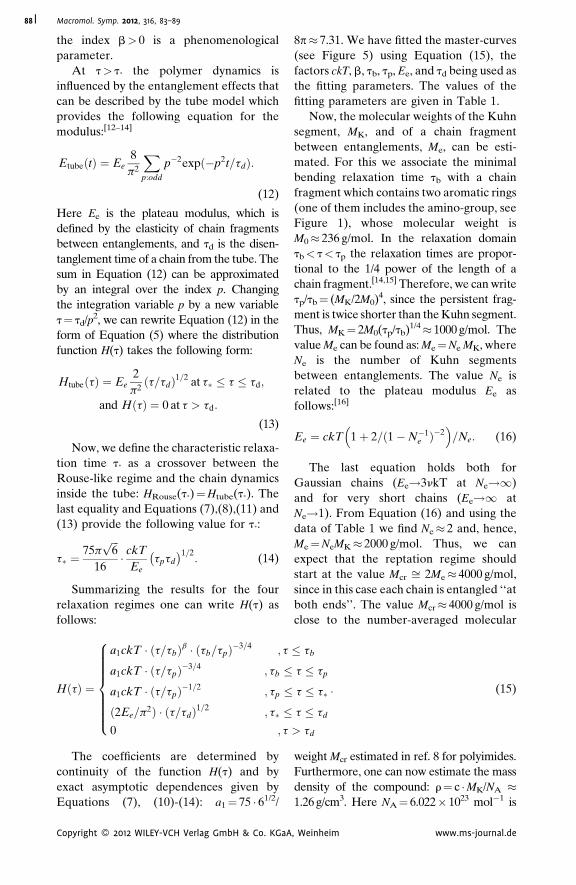
Macromol. Symp. 2012, 316, 83–8988
the index b> 0 is a phenomenological
parameter.
At t> t� the polymer dynamics is
influenced by the entanglement effects that
can be described by the tube model which
provides the following equation for the
modulus:[12–14]
EtubeðtÞ ¼ Ee8
p2
Xp:odd
p�2expð�p2t=tdÞ:
(12)
Here Ee is the plateau modulus, which is
defined by the elasticity of chain fragments
between entanglements, and td is the disen-
tanglement time of a chain from the tube. The
sum in Equation (12) can be approximated
by an integral over the index p. Changing
the integration variable p by a new variable
t¼ td/p2, we can rewrite Equation (12) in the
form of Equation (5) where the distribution
function H(t) takes the following form:
HtubeðtÞ ¼ Ee2
p2t=tdð Þ1=2 at t� � t � td;
and HðtÞ ¼ 0 at t > td:
(13)
Now, we define the characteristic relaxa-
tion time t� as a crossover between the
Rouse-like regime and the chain dynamics
inside the tube: HRouse(t�)¼Htube(t�). The
last equality and Equations (7),(8),(11) and
(13) provide the following value for t�:
t� ¼75p
ffiffiffi6p
16� ckT
Eetptd
� �1=2: (14)
Summarizing the results for the four
relaxation regimes one can write H(t) as
follows:
HðtÞ ¼
a1ckT � ðt=tbÞb � ðtb=tpÞ�3=4 ; t � tb
a1ckT � ðt=tpÞ�3=4 ; tb � t � tp
a1ckT � ðt=tpÞ�1=2 ; tp � t � t�
ð2Ee=p2Þ � ðt=tdÞ1=2 ; t� � t � td
0 ; t > td
8>>>>>>><>>>>>>>:
: (15)
The coefficients are determined by
continuity of the function H(t) and by
exact asymptotic dependences given by
Equations (7), (10)-(14): a1¼ 75 � 61/2/
Copyright � 2012 WILEY-VCH Verlag GmbH & Co. KGaA
8p 7.31. We have fitted the master-curves
(see Figure 5) using Equation (15), the
factors ckT, b, tb, tp, Ee, and td being used as
the fitting parameters. The values of the
fitting parameters are given in Table 1.
Now, the molecular weights of the Kuhn
segment, MK, and of a chain fragment
between entanglements, Me, can be esti-
mated. For this we associate the minimal
bending relaxation time tb with a chain
fragment which contains two aromatic rings
(one of them includes the amino-group, see
Figure 1), whose molecular weight is
M0 236 g/mol. In the relaxation domain
tb< t< tp the relaxation times are propor-
tional to the 1/4 power of the length of a
chain fragment.[14,15] Therefore, we can write
tp/tb¼ (MK/2M0)4, since the persistent frag-
ment is twice shorter than the Kuhn segment.
Thus, MK¼ 2M0(tp/tb)1/4 1000 g/mol. The
value Me can be found as: Me¼Ne MK, where
Ne is the number of Kuhn segments
between entanglements. The value Ne is
related to the plateau modulus Ee as
follows:[16]
Ee ¼ ckT 1þ 2=ð1�N�1e Þ�2
� �=Ne: (16)
The last equation holds both for
Gaussian chains (Ee!3nkT at Ne!1)
and for very short chains (Ee!1 at
Ne!1). From Equation (16) and using the
data of Table 1 we find Ne 2 and, hence,
Me¼NeMK 2000 g/mol. Thus, we can
expect that the reptation regime should
start at the value Mcr ffi 2Me 4000 g/mol,
since in this case each chain is entangled ‘‘at
both ends’’. The value Mcr 4000 g/mol is
close to the number-averaged molecular
weight Mcr estimated in ref. 8 for polyimides.
Furthermore, one can now estimate the mass
density of the compound: r¼ c �MK/NA 1.26 g/cm3. Here NA¼ 6.022� 1023 mol�1 is
, Weinheim www.ms-journal.de
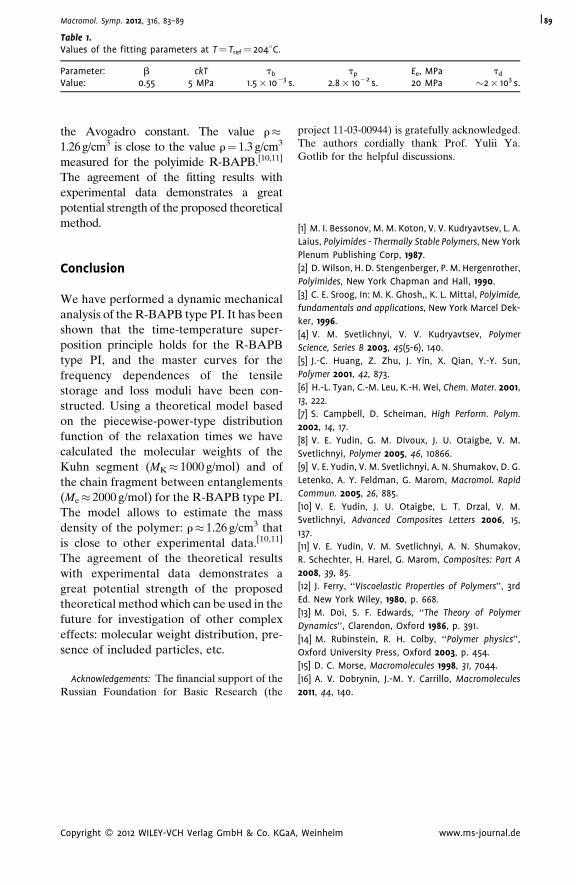
Table 1.Values of the fitting parameters at T¼ Tref¼ 2048C.
Parameter: b ckT tb tp Ee, MPa td
Value: 0.55 5 MPa 1.5� 10�3 s. 2.8� 10�2 s. 20 MPa �2� 103 s.
Macromol. Symp. 2012, 316, 83–89 89
the Avogadro constant. The value r1.26 g/cm3 is close to the value r¼ 1.3 g/cm3
measured for the polyimide R-BAPB.[10,11]
The agreement of the fitting results with
experimental data demonstrates a great
potential strength of the proposed theoretical
method.
Conclusion
We have performed a dynamic mechanical
analysis of the R-BAPB type PI. It has been
shown that the time-temperature super-
position principle holds for the R-BAPB
type PI, and the master curves for the
frequency dependences of the tensile
storage and loss moduli have been con-
structed. Using a theoretical model based
on the piecewise-power-type distribution
function of the relaxation times we have
calculated the molecular weights of the
Kuhn segment (MK 1000 g/mol) and of
the chain fragment between entanglements
(Me 2000 g/mol) for the R-BAPB type PI.
The model allows to estimate the mass
density of the polymer: r 1.26 g/cm3 that
is close to other experimental data.[10,11]
The agreement of the theoretical results
with experimental data demonstrates a
great potential strength of the proposed
theoretical method which can be used in the
future for investigation of other complex
effects: molecular weight distribution, pre-
sence of included particles, etc.
Acknowledgements: The financial support of theRussian Foundation for Basic Research (the
Copyright � 2012 WILEY-VCH Verlag GmbH & Co. KGaA
project 11-03-00944) is gratefully acknowledged.The authors cordially thank Prof. Yulii Ya.Gotlib for the helpful discussions.
[1] M. I. Bessonov, M. M. Koton, V. V. Kudryavtsev, L. A.
Laius, Polyimides - Thermally Stable Polymers, New York
Plenum Publishing Corp, 1987.
[2] D. Wilson, H. D. Stengenberger, P. M. Hergenrother,
Polyimides, New York Chapman and Hall, 1990.
[3] C. E. Sroog, In: M. K. Ghosh,, K. L. Mittal, Polyimide,
fundamentals and applications, New York Marcel Dek-
ker, 1996.
[4] V. M. Svetlichnyi, V. V. Kudryavtsev, Polymer
Science, Series B 2003, 45(5-6), 140.
[5] J.-C. Huang, Z. Zhu, J. Yin, X. Qian, Y.-Y. Sun,
Polymer 2001, 42, 873.
[6] H.-L. Tyan, C.-M. Leu, K.-H. Wei, Chem. Mater. 2001,
13, 222.
[7] S. Campbell, D. Scheiman, High Perform. Polym.
2002, 14, 17.
[8] V. E. Yudin, G. M. Divoux, J. U. Otaigbe, V. M.
Svetlichnyi, Polymer 2005, 46, 10866.
[9] V. E. Yudin, V. M. Svetlichnyi, A. N. Shumakov, D. G.
Letenko, A. Y. Feldman, G. Marom, Macromol. Rapid
Commun. 2005, 26, 885.
[10] V. E. Yudin, J. U. Otaigbe, L. T. Drzal, V. M.
Svetlichnyi, Advanced Composites Letters 2006, 15,
137.
[11] V. E. Yudin, V. M. Svetlichnyi, A. N. Shumakov,
R. Schechter, H. Harel, G. Marom, Composites: Part A
2008, 39, 85.
[12] J. Ferry, ‘‘Viscoelastic Properties of Polymers’’, 3rd
Ed. New York Wiley, 1980, p. 668.
[13] M. Doi, S. F. Edwards, ‘‘The Theory of Polymer
Dynamics’’, Clarendon, Oxford 1986, p. 391.
[14] M. Rubinstein, R. H. Colby, ‘‘Polymer physics’’,
Oxford University Press, Oxford 2003, p. 454.
[15] D. C. Morse, Macromolecules 1998, 31, 7044.
[16] A. V. Dobrynin, J.-M. Y. Carrillo, Macromolecules
2011, 44, 140.
, Weinheim www.ms-journal.de
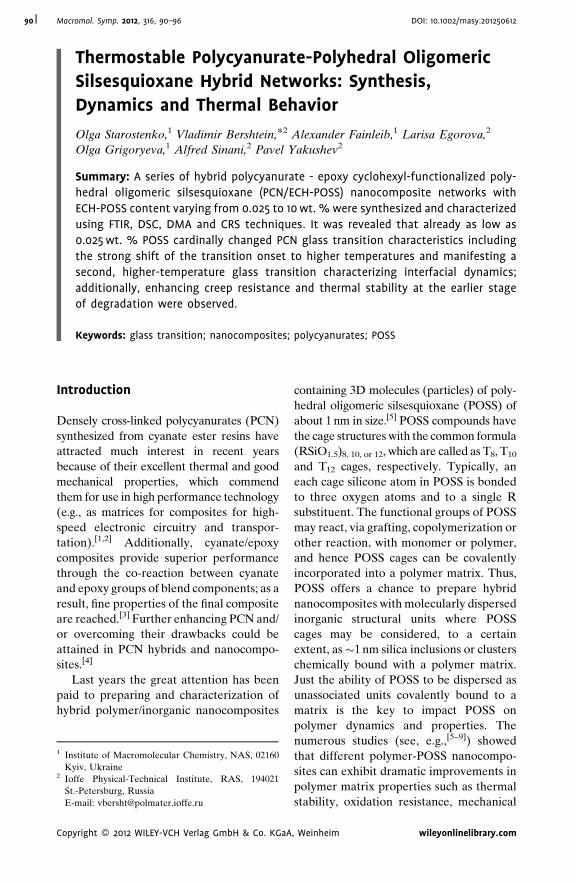
Macromol. Symp. 2012, 316, 90–96 DOI: 10.1002/masy.20125061290
1 In
K2 Io
St
E-
Cop
Thermostable Polycyanurate-Polyhedral Oligomeric
Silsesquioxane Hybrid Networks: Synthesis,
Dynamics and Thermal Behavior
Olga Starostenko,1 Vladimir Bershtein,*2 Alexander Fainleib,1 Larisa Egorova,2
Olga Grigoryeva,1 Alfred Sinani,2 Pavel Yakushev2
Summary: A series of hybrid polycyanurate - epoxy cyclohexyl-functionalized poly-
hedral oligomeric silsesquioxane (PCN/ECH-POSS) nanocomposite networks with
ECH-POSS content varying from 0.025 to 10 wt. % were synthesized and characterized
using FTIR, DSC, DMA and CRS techniques. It was revealed that already as low as
0.025 wt. % POSS cardinally changed PCN glass transition characteristics including
the strong shift of the transition onset to higher temperatures and manifesting a
second, higher-temperature glass transition characterizing interfacial dynamics;
additionally, enhancing creep resistance and thermal stability at the earlier stage
of degradation were observed.
Keywords: glass transition; nanocomposites; polycyanurates; POSS
Introduction
Densely cross-linked polycyanurates (PCN)
synthesized from cyanate ester resins have
attracted much interest in recent years
because of their excellent thermal and good
mechanical properties, which commend
them for use in high performance technology
(e.g., as matrices for composites for high-
speed electronic circuitry and transpor-
tation).[1,2] Additionally, cyanate/epoxy
composites provide superior performance
through the co-reaction between cyanate
and epoxy groups of blend components; as a
result, fine properties of the final composite
are reached.[3] Further enhancing PCN and/
or overcoming their drawbacks could be
attained in PCN hybrids and nanocompo-
sites.[4]
Last years the great attention has been
paid to preparing and characterization of
hybrid polymer/inorganic nanocomposites
stitute of Macromolecular Chemistry, NAS, 02160
yiv, Ukraine
ffe Physical-Technical Institute, RAS, 194021
.-Petersburg, Russia
mail: [email protected]
yright � 2012 WILEY-VCH Verlag GmbH & Co. KGaA
containing 3D molecules (particles) of poly-
hedral oligomeric silsesquioxane (POSS) of
about 1 nm in size.[5] POSS compounds have
the cage structures with the common formula
(RSiO1.5)8, 10, or 12, which are called as T8, T10
and T12 cages, respectively. Typically, an
each cage silicone atom in POSS is bonded
to three oxygen atoms and to a single R
substituent. The functional groups of POSS
may react, via grafting, copolymerization or
other reaction, with monomer or polymer,
and hence POSS cages can be covalently
incorporated into a polymer matrix. Thus,
POSS offers a chance to prepare hybrid
nanocomposites with molecularly dispersed
inorganic structural units where POSS
cages may be considered, to a certain
extent, as�1 nm silica inclusions or clusters
chemically bound with a polymer matrix.
Just the ability of POSS to be dispersed as
unassociated units covalently bound to a
matrix is the key to impact POSS on
polymer dynamics and properties. The
numerous studies (see, e.g.,[5–9]) showed
that different polymer-POSS nanocompo-
sites can exhibit dramatic improvements in
polymer matrix properties such as thermal
stability, oxidation resistance, mechanical
, Weinheim wileyonlinelibrary.com
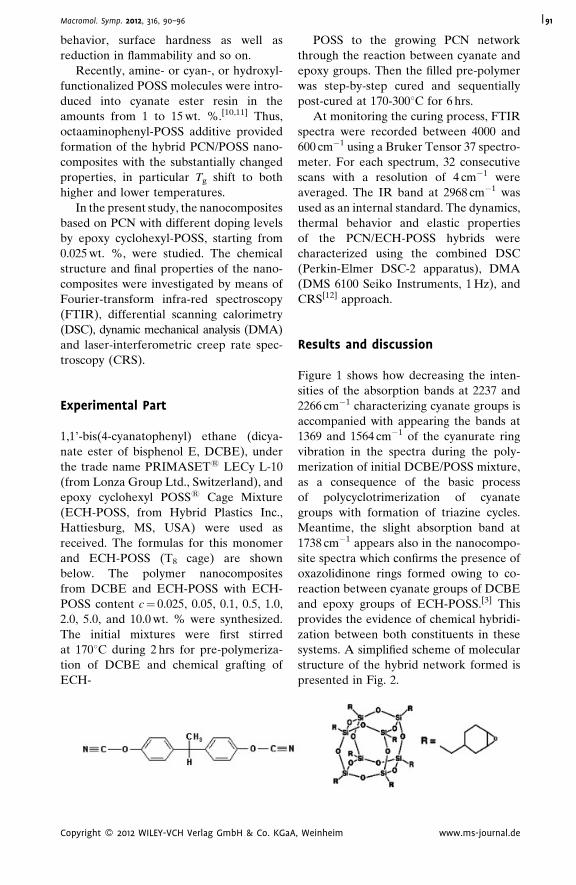
Macromol. Symp. 2012, 316, 90–96 91
behavior, surface hardness as well as
reduction in flammability and so on.
Recently, amine- or cyan-, or hydroxyl-
functionalized POSS molecules were intro-
duced into cyanate ester resin in the
amounts from 1 to 15 wt. %.[10,11] Thus,
octaaminophenyl-POSS additive provided
formation of the hybrid PCN/POSS nano-
composites with the substantially changed
properties, in particular Tg shift to both
higher and lower temperatures.
In the present study, the nanocomposites
based on PCN with different doping levels
by epoxy cyclohexyl-POSS, starting from
0.025 wt. %, were studied. The chemical
structure and final properties of the nano-
composites were investigated by means of
Fourier-transform infra-red spectroscopy
(FTIR), differential scanning calorimetry
(DSC), dynamic mechanical analysis (DMA)
and laser-interferometric creep rate spec-
troscopy (CRS).
Experimental Part
1,1’-bis(4-cyanatophenyl) ethane (dicya-
nate ester of bisphenol E, DCBE), under
the trade name PRIMASET1 LECy L-10
(from Lonza Group Ltd., Switzerland), and
epoxy cyclohexyl POSS1 Cage Mixture
(ECH-POSS, from Hybrid Plastics Inc.,
Hattiesburg, MS, USA) were used as
received. The formulas for this monomer
and ECH-POSS (T8 cage) are shown
below. The polymer nanocomposites
from DCBE and ECH-POSS with ECH-
POSS content c¼ 0.025, 0.05, 0.1, 0.5, 1.0,
2.0, 5.0, and 10.0 wt. % were synthesized.
The initial mixtures were first stirred
at 1708C during 2 hrs for pre-polymeriza-
tion of DCBE and chemical grafting of
ECH-
Copyright � 2012 WILEY-VCH Verlag GmbH & Co. KGaA
POSS to the growing PCN network
through the reaction between cyanate and
epoxy groups. Then the filled pre-polymer
was step-by-step cured and sequentially
post-cured at 170-3008C for 6 hrs.
At monitoring the curing process, FTIR
spectra were recorded between 4000 and
600 cm�1 using a Bruker Tensor 37 spectro-
meter. For each spectrum, 32 consecutive
scans with a resolution of 4 cm�1 were
averaged. The IR band at 2968 cm�1 was
used as an internal standard. The dynamics,
thermal behavior and elastic properties
of the PCN/ECH-POSS hybrids were
characterized using the combined DSC
(Perkin-Elmer DSC-2 apparatus), DMA
(DMS 6100 Seiko Instruments, 1 Hz), and
CRS[12] approach.
Results and discussion
Figure 1 shows how decreasing the inten-
sities of the absorption bands at 2237 and
2266 cm�1 characterizing cyanate groups is
accompanied with appearing the bands at
1369 and 1564 cm�1 of the cyanurate ring
vibration in the spectra during the poly-
merization of initial DCBE/POSS mixture,
as a consequence of the basic process
of polycyclotrimerization of cyanate
groups with formation of triazine cycles.
Meantime, the slight absorption band at
1738 cm�1 appears also in the nanocompo-
site spectra which confirms the presence of
oxazolidinone rings formed owing to co-
reaction between cyanate groups of DCBE
and epoxy groups of ECH-POSS.[3] This
provides the evidence of chemical hybridi-
zation between both constituents in these
systems. A simplified scheme of molecular
structure of the hybrid network formed is
presented in Fig. 2.
, Weinheim www.ms-journal.de
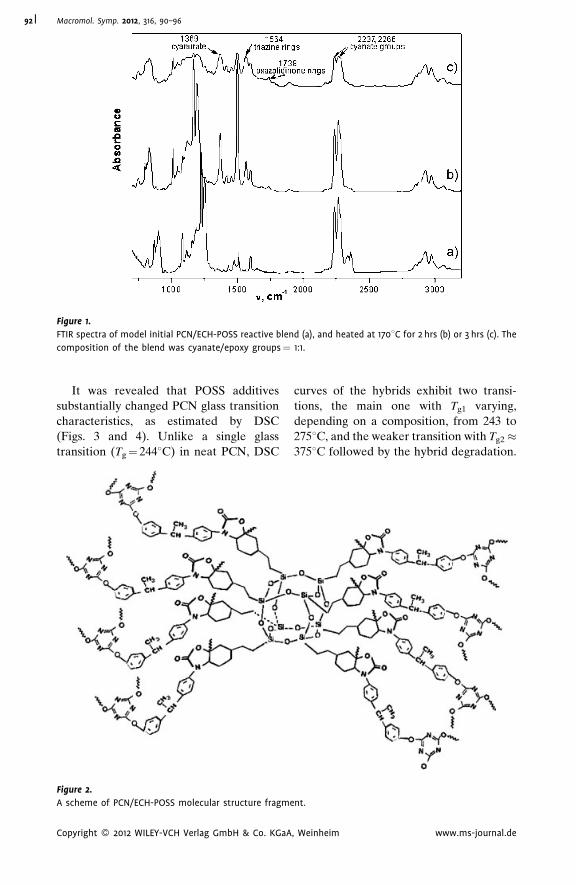
Figure 1.
FTIR spectra of model initial PCN/ECH-POSS reactive blend (a), and heated at 1708C for 2 hrs (b) or 3 hrs (c). The
composition of the blend was cyanate/epoxy groups¼ 1:1.
Macromol. Symp. 2012, 316, 90–9692
It was revealed that POSS additives
substantially changed PCN glass transition
characteristics, as estimated by DSC
(Figs. 3 and 4). Unlike a single glass
transition (Tg¼ 2448C) in neat PCN, DSC
Figure 2.
A scheme of PCN/ECH-POSS molecular structure fragme
Copyright � 2012 WILEY-VCH Verlag GmbH & Co. KGaA
curves of the hybrids exhibit two transi-
tions, the main one with Tg1 varying,
depending on a composition, from 243 to
2758C, and the weaker transition with Tg2�3758C followed by the hybrid degradation.
nt.
, Weinheim www.ms-journal.de
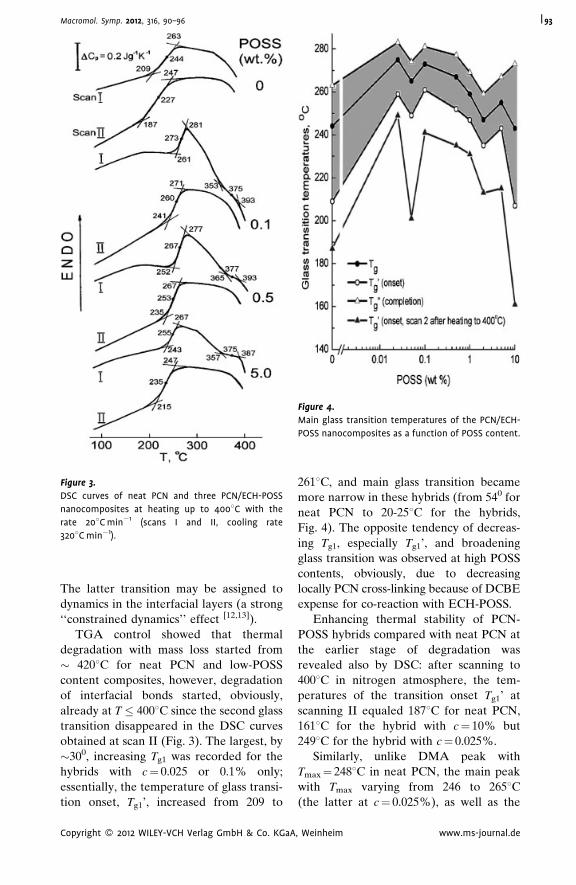
Figure 4.
Main glass transition temperatures of the PCN/ECH-
POSS nanocomposites as a function of POSS content.
Figure 3.
DSC curves of neat PCN and three PCN/ECH-POSS
nanocomposites at heating up to 4008C with the
rate 208C min�1 (scans I and II, cooling rate
3208C min�1).
Macromol. Symp. 2012, 316, 90–96 93
The latter transition may be assigned to
dynamics in the interfacial layers (a strong
‘‘constrained dynamics’’ effect [12,13]).
TGA control showed that thermal
degradation with mass loss started from
� 4208C for neat PCN and low-POSS
content composites, however, degradation
of interfacial bonds started, obviously,
already at T � 4008C since the second glass
transition disappeared in the DSC curves
obtained at scan II (Fig. 3). The largest, by
�300, increasing Tg1 was recorded for the
hybrids with c¼ 0.025 or 0.1% only;
essentially, the temperature of glass transi-
tion onset, Tg1’, increased from 209 to
Copyright � 2012 WILEY-VCH Verlag GmbH & Co. KGaA
2618C, and main glass transition became
more narrow in these hybrids (from 540 for
neat PCN to 20-258C for the hybrids,
Fig. 4). The opposite tendency of decreas-
ing Tg1, especially Tg1’, and broadening
glass transition was observed at high POSS
contents, obviously, due to decreasing
locally PCN cross-linking because of DCBE
expense for co-reaction with ECH-POSS.
Enhancing thermal stability of PCN-
POSS hybrids compared with neat PCN at
the earlier stage of degradation was
revealed also by DSC: after scanning to
4008C in nitrogen atmosphere, the tem-
peratures of the transition onset Tg1’ at
scanning II equaled 1878C for neat PCN,
1618C for the hybrid with c¼ 10% but
2498C for the hybrid with c¼ 0.025%.
Similarly, unlike DMA peak with
Tmax¼ 2488C in neat PCN, the main peak
with Tmax varying from 246 to 2658C(the latter at c¼ 0.025%), as well as the
, Weinheim www.ms-journal.de
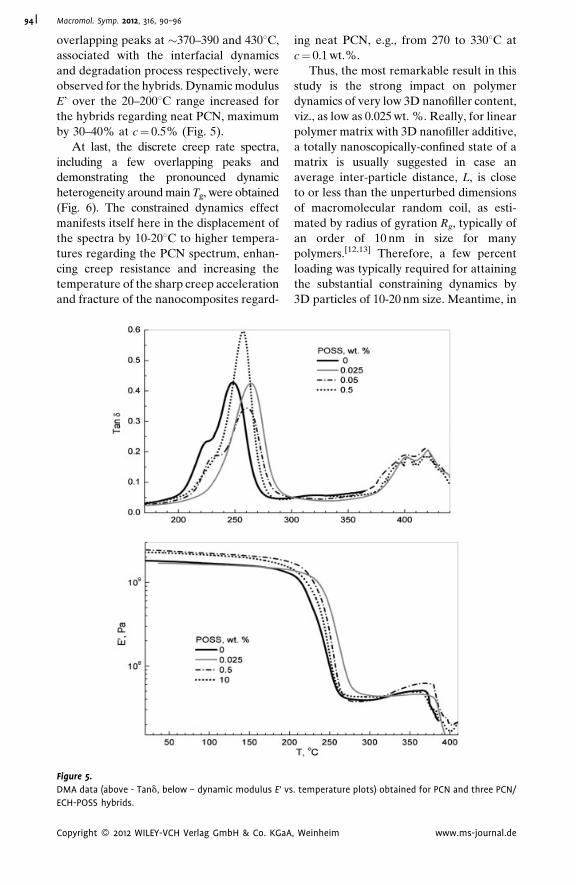
Macromol. Symp. 2012, 316, 90–9694
overlapping peaks at �370–390 and 4308C,
associated with the interfacial dynamics
and degradation process respectively, were
observed for the hybrids. Dynamic modulus
E’ over the 20–2008C range increased for
the hybrids regarding neat PCN, maximum
by 30–40% at c¼ 0.5% (Fig. 5).
At last, the discrete creep rate spectra,
including a few overlapping peaks and
demonstrating the pronounced dynamic
heterogeneity around main Tg, were obtained
(Fig. 6). The constrained dynamics effect
manifests itself here in the displacement of
the spectra by 10-208C to higher tempera-
tures regarding the PCN spectrum, enhan-
cing creep resistance and increasing the
temperature of the sharp creep acceleration
and fracture of the nanocomposites regard-
Figure 5.
DMA data (above - Tand, below – dynamic modulus E’ vs
ECH-POSS hybrids.
Copyright � 2012 WILEY-VCH Verlag GmbH & Co. KGaA
ing neat PCN, e.g., from 270 to 3308C at
c¼ 0.1 wt.%.
Thus, the most remarkable result in this
study is the strong impact on polymer
dynamics of very low 3D nanofiller content,
viz., as low as 0.025 wt. %. Really, for linear
polymer matrix with 3D nanofiller additive,
a totally nanoscopically-confined state of a
matrix is usually suggested in case an
average inter-particle distance, L, is close
to or less than the unperturbed dimensions
of macromolecular random coil, as esti-
mated by radius of gyration Rg, typically of
an order of 10 nm in size for many
polymers.[12,13] Therefore, a few percent
loading was typically required for attaining
the substantial constraining dynamics by
3D particles of 10-20 nm size. Meantime, in
. temperature plots) obtained for PCN and three PCN/
, Weinheim www.ms-journal.de
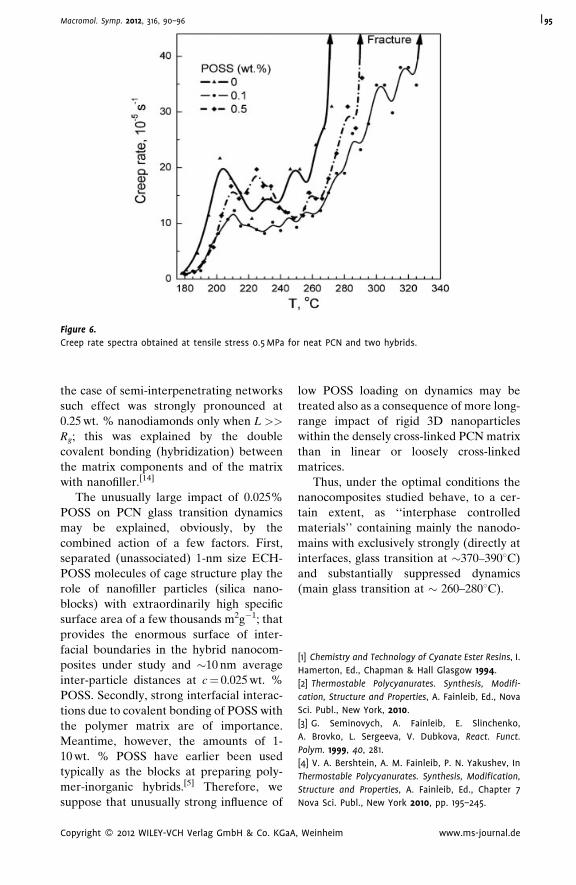
Figure 6.
Creep rate spectra obtained at tensile stress 0.5 MPa for neat PCN and two hybrids.
Macromol. Symp. 2012, 316, 90–96 95
the case of semi-interpenetrating networks
such effect was strongly pronounced at
0.25 wt. % nanodiamonds only when L >>
Rg; this was explained by the double
covalent bonding (hybridization) between
the matrix components and of the matrix
with nanofiller.[14]
The unusually large impact of 0.025%
POSS on PCN glass transition dynamics
may be explained, obviously, by the
combined action of a few factors. First,
separated (unassociated) 1-nm size ECH-
POSS molecules of cage structure play the
role of nanofiller particles (silica nano-
blocks) with extraordinarily high specific
surface area of a few thousands m2g�1; that
provides the enormous surface of inter-
facial boundaries in the hybrid nanocom-
posites under study and �10 nm average
inter-particle distances at c¼ 0.025 wt. %
POSS. Secondly, strong interfacial interac-
tions due to covalent bonding of POSS with
the polymer matrix are of importance.
Meantime, however, the amounts of 1-
10 wt. % POSS have earlier been used
typically as the blocks at preparing poly-
mer-inorganic hybrids.[5] Therefore, we
suppose that unusually strong influence of
Copyright � 2012 WILEY-VCH Verlag GmbH & Co. KGaA
low POSS loading on dynamics may be
treated also as a consequence of more long-
range impact of rigid 3D nanoparticles
within the densely cross-linked PCN matrix
than in linear or loosely cross-linked
matrices.
Thus, under the optimal conditions the
nanocomposites studied behave, to a cer-
tain extent, as ‘‘interphase controlled
materials’’ containing mainly the nanodo-
mains with exclusively strongly (directly at
interfaces, glass transition at �370–3908C)
and substantially suppressed dynamics
(main glass transition at � 260–2808C).
[1] Chemistry and Technology of Cyanate Ester Resins, I.
Hamerton, Ed., Chapman & Hall Glasgow 1994.
[2] Thermostable Polycyanurates. Synthesis, Modifi-
cation, Structure and Properties, A. Fainleib, Ed., Nova
Sci. Publ., New York, 2010.
[3] G. Seminovych, A. Fainleib, E. Slinchenko,
A. Brovko, L. Sergeeva, V. Dubkova, React. Funct.
Polym. 1999, 40, 281.
[4] V. A. Bershtein, A. M. Fainleib, P. N. Yakushev, In
Thermostable Polycyanurates. Synthesis, Modification,
Structure and Properties, A. Fainleib, Ed., Chapter 7
Nova Sci. Publ., New York 2010, pp. 195–245.
, Weinheim www.ms-journal.de
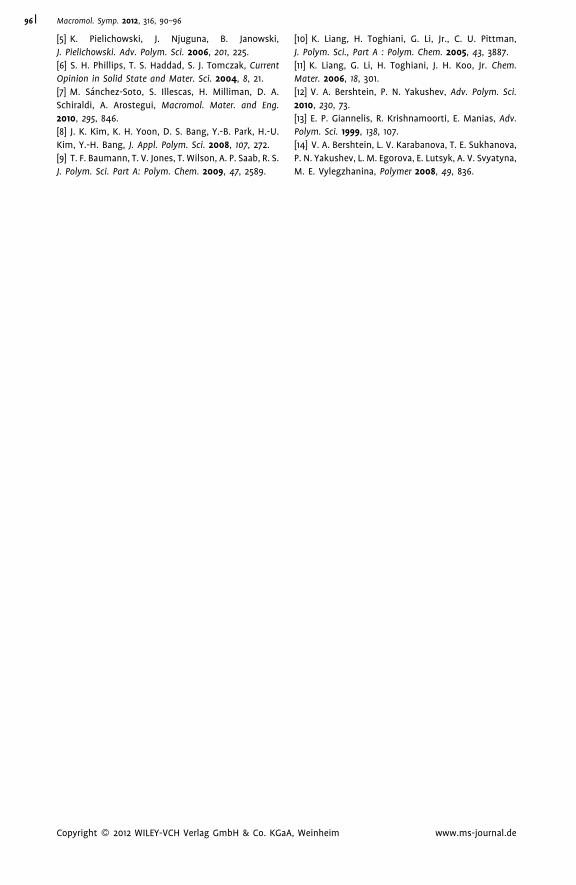
Macromol. Symp. 2012, 316, 90–9696
[5] K. Pielichowski, J. Njuguna, B. Janowski,
J. Pielichowski. Adv. Polym. Sci. 2006, 201, 225.
[6] S. H. Phillips, T. S. Haddad, S. J. Tomczak, Current
Opinion in Solid State and Mater. Sci. 2004, 8, 21.
[7] M. Sanchez-Soto, S. Illescas, H. Milliman, D. A.
Schiraldi, A. Arostegui, Macromol. Mater. and Eng.
2010, 295, 846.
[8] J. K. Kim, K. H. Yoon, D. S. Bang, Y.-B. Park, H.-U.
Kim, Y.-H. Bang, J. Appl. Polym. Sci. 2008, 107, 272.
[9] T. F. Baumann, T. V. Jones, T. Wilson, A. P. Saab, R. S.
J. Polym. Sci. Part A: Polym. Chem. 2009, 47, 2589.
Copyright � 2012 WILEY-VCH Verlag GmbH & Co. KGaA
[10] K. Liang, H. Toghiani, G. Li, Jr., C. U. Pittman,
J. Polym. Sci., Part A : Polym. Chem. 2005, 43, 3887.
[11] K. Liang, G. Li, H. Toghiani, J. H. Koo, Jr. Chem.
Mater. 2006, 18, 301.
[12] V. A. Bershtein, P. N. Yakushev, Adv. Polym. Sci.
2010, 230, 73.
[13] E. P. Giannelis, R. Krishnamoorti, E. Manias, Adv.
Polym. Sci. 1999, 138, 107.
[14] V. A. Bershtein, L. V. Karabanova, T. E. Sukhanova,
P. N. Yakushev, L. M. Egorova, E. Lutsyk, A. V. Svyatyna,
M. E. Vylegzhanina, Polymer 2008, 49, 836.
, Weinheim www.ms-journal.de
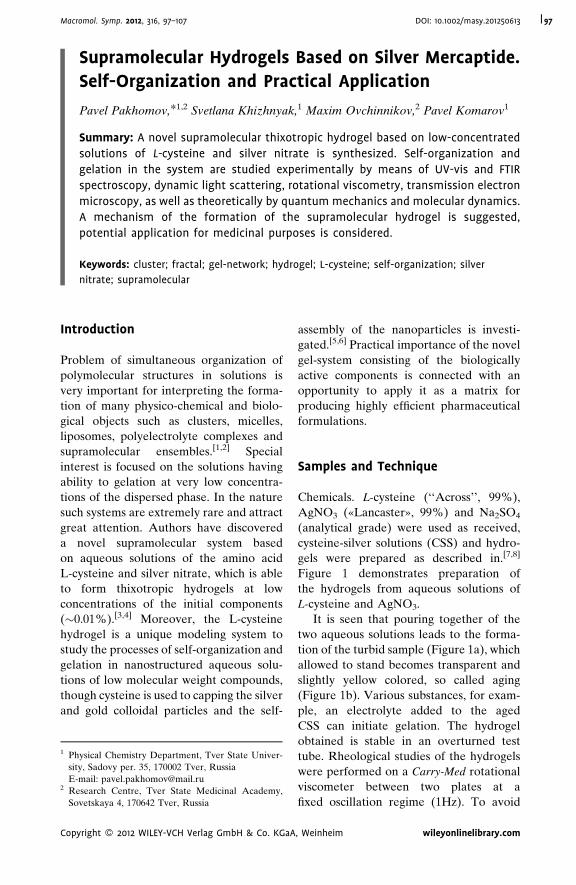
Macromol. Symp. 2012, 316, 97–107 DOI: 10.1002/masy.201250613 97
1 Ph
sit
E-2 Re
So
Cop
Supramolecular Hydrogels Based on Silver Mercaptide.
Self-Organization and Practical Application
Pavel Pakhomov,*1,2 Svetlana Khizhnyak,1 Maxim Ovchinnikov,2 Pavel Komarov1
Summary: A novel supramolecular thixotropic hydrogel based on low-concentrated
solutions of L-cysteine and silver nitrate is synthesized. Self-organization and
gelation in the system are studied experimentally by means of UV-vis and FTIR
spectroscopy, dynamic light scattering, rotational viscometry, transmission electron
microscopy, as well as theoretically by quantum mechanics and molecular dynamics.
A mechanism of the formation of the supramolecular hydrogel is suggested,
potential application for medicinal purposes is considered.
Keywords: cluster; fractal; gel-network; hydrogel; L-cysteine; self-organization; silver
nitrate; supramolecular
Introduction
Problem of simultaneous organization of
polymolecular structures in solutions is
very important for interpreting the forma-
tion of many physico-chemical and biolo-
gical objects such as clusters, micelles,
liposomes, polyelectrolyte complexes and
supramolecular ensembles.[1,2] Special
interest is focused on the solutions having
ability to gelation at very low concentra-
tions of the dispersed phase. In the nature
such systems are extremely rare and attract
great attention. Authors have discovered
a novel supramolecular system based
on aqueous solutions of the amino acid
L-cysteine and silver nitrate, which is able
to form thixotropic hydrogels at low
concentrations of the initial components
(�0.01%).[3,4] Moreover, the L-cysteine
hydrogel is a unique modeling system to
study the processes of self-organization and
gelation in nanostructured aqueous solu-
tions of low molecular weight compounds,
though cysteine is used to capping the silver
and gold colloidal particles and the self-
ysical Chemistry Department, Tver State Univer-
y, Sadovy per. 35, 170002 Tver, Russia
mail: [email protected]
search Centre, Tver State Medicinal Academy,
vetskaya 4, 170642 Tver, Russia
yright � 2012 WILEY-VCH Verlag GmbH & Co. KGaA
assembly of the nanoparticles is investi-
gated.[5,6] Practical importance of the novel
gel-system consisting of the biologically
active components is connected with an
opportunity to apply it as a matrix for
producing highly efficient pharmaceutical
formulations.
Samples and Technique
Chemicals. L-cysteine (‘‘Across’’, 99%),
AgNO3 («Lancaster», 99%) and Na2SO4
(analytical grade) were used as received,
cysteine-silver solutions (CSS) and hydro-
gels were prepared as described in.[7,8]
Figure 1 demonstrates preparation of
the hydrogels from aqueous solutions of
L-cysteine and AgNO3.
It is seen that pouring together of the
two aqueous solutions leads to the forma-
tion of the turbid sample (Figure 1a), which
allowed to stand becomes transparent and
slightly yellow colored, so called aging
(Figure 1b). Various substances, for exam-
ple, an electrolyte added to the aged
CSS can initiate gelation. The hydrogel
obtained is stable in an overturned test
tube. Rheological studies of the hydrogels
were performed on a Carry-Med rotational
viscometer between two plates at a
fixed oscillation regime (1Hz). To avoid
, Weinheim wileyonlinelibrary.com
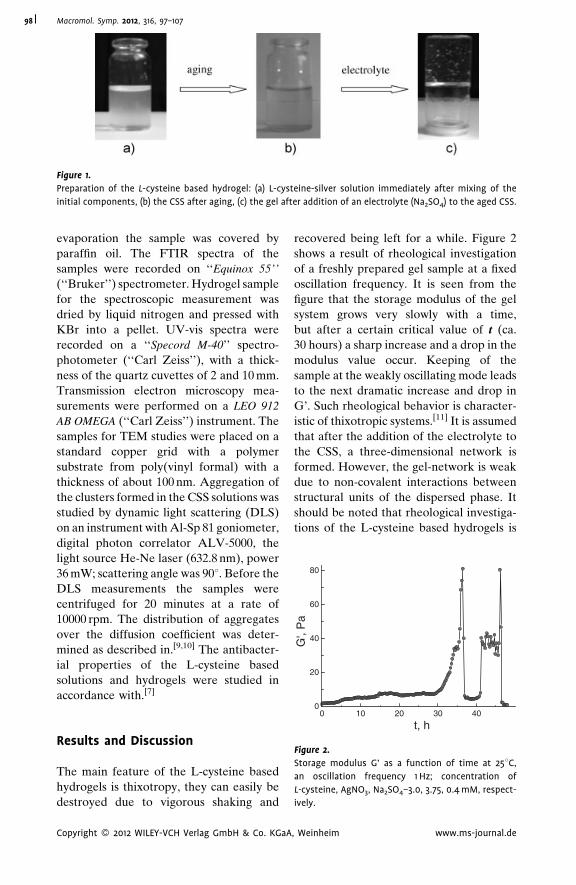
Figure 1.
Preparation of the L-cysteine based hydrogel: (a) L-cysteine-silver solution immediately after mixing of the
initial components, (b) the CSS after aging, (c) the gel after addition of an electrolyte (Na2SO4) to the aged CSS.
20
40
60
80
G',
Pa
Macromol. Symp. 2012, 316, 97–10798
evaporation the sample was covered by
paraffin oil. The FTIR spectra of the
samples were recorded on ‘‘Equinox 55’’
(‘‘Bruker’’) spectrometer. Hydrogel sample
for the spectroscopic measurement was
dried by liquid nitrogen and pressed with
KBr into a pellet. UV-vis spectra were
recorded on a ‘‘Specord M-40’’ spectro-
photometer (‘‘Carl Zeiss’’), with a thick-
ness of the quartz cuvettes of 2 and 10 mm.
Transmission electron microscopy mea-
surements were performed on a LEO 912
AB OMEGA (‘‘Carl Zeiss’’) instrument. The
samples for TEM studies were placed on a
standard copper grid with a polymer
substrate from poly(vinyl formal) with a
thickness of about 100 nm. Aggregation of
the clusters formed in the CSS solutions was
studied by dynamic light scattering (DLS)
on an instrument with Al-Sp 81 goniometer,
digital photon correlator ALV-5000, the
light source He-Ne laser (632.8 nm), power
36 mW; scattering angle was 908. Before the
DLS measurements the samples were
centrifuged for 20 minutes at a rate of
10000 rpm. The distribution of aggregates
over the diffusion coefficient was deter-
mined as described in.[9,10] The antibacter-
ial properties of the L-cysteine based
solutions and hydrogels were studied in
accordance with.[7]
4030201000
t, h
Figure 2.
Storage modulus G’ as a function of time at 258C,
an oscillation frequency 1 Hz; concentration of
L-cysteine, AgNO3, Na2SO4–3.0, 3.75, 0.4 mM, respect-
ively.
Results and Discussion
The main feature of the L-cysteine based
hydrogels is thixotropy, they can easily be
destroyed due to vigorous shaking and
Copyright � 2012 WILEY-VCH Verlag GmbH & Co. KGaA
recovered being left for a while. Figure 2
shows a result of rheological investigation
of a freshly prepared gel sample at a fixed
oscillation frequency. It is seen from the
figure that the storage modulus of the gel
system grows very slowly with a time,
but after a certain critical value of t (ca.
30 hours) a sharp increase and a drop in the
modulus value occur. Keeping of the
sample at the weakly oscillating mode leads
to the next dramatic increase and drop in
G’. Such rheological behavior is character-
istic of thixotropic systems.[11] It is assumed
that after the addition of the electrolyte to
the CSS, a three-dimensional network is
formed. However, the gel-network is weak
due to non-covalent interactions between
structural units of the dispersed phase. It
should be noted that rheological investiga-
tions of the L-cysteine based hydrogels is
, Weinheim www.ms-journal.de
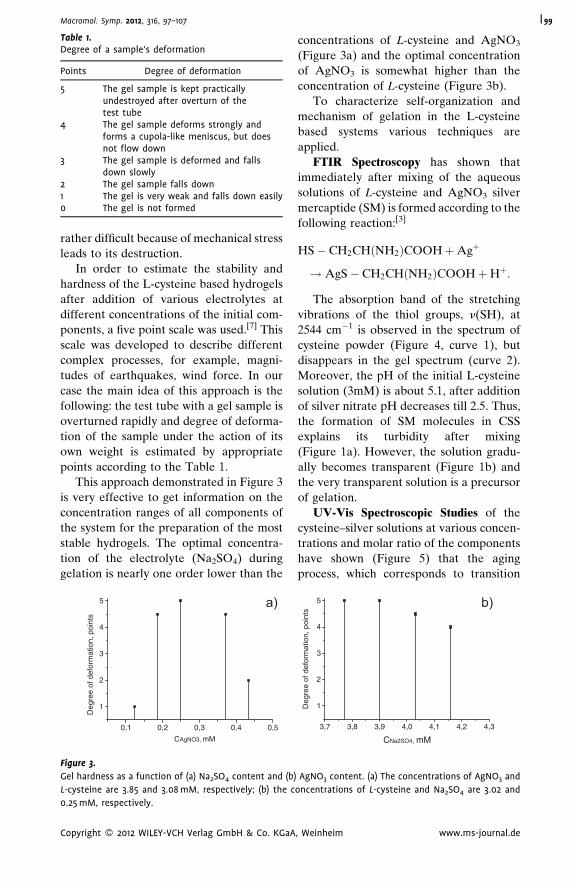
Table 1.Degree of a sample’s deformation
Points Degree of deformation
5 The gel sample is kept practicallyundestroyed after overturn of thetest tube
4 The gel sample deforms strongly andforms a cupola-like meniscus, but doesnot flow down
3 The gel sample is deformed and fallsdown slowly
2 The gel sample falls down1 The gel is very weak and falls down easily0 The gel is not formed
Macromol. Symp. 2012, 316, 97–107 99
rather difficult because of mechanical stress
leads to its destruction.
In order to estimate the stability and
hardness of the L-cysteine based hydrogels
after addition of various electrolytes at
different concentrations of the initial com-
ponents, a five point scale was used.[7] This
scale was developed to describe different
complex processes, for example, magni-
tudes of earthquakes, wind force. In our
case the main idea of this approach is the
following: the test tube with a gel sample is
overturned rapidly and degree of deforma-
tion of the sample under the action of its
own weight is estimated by appropriate
points according to the Table 1.
This approach demonstrated in Figure 3
is very effective to get information on the
concentration ranges of all components of
the system for the preparation of the most
stable hydrogels. The optimal concentra-
tion of the electrolyte (Na2SO4) during
gelation is nearly one order lower than the
0,50,40,30,20,1
1
2
3
4
5
Deg
ree
of d
efor
mat
ion,
poi
nts
CAgNO3, mM
a)
Figure 3.
Gel hardness as a function of (a) Na2SO4 content and (b)
L-cysteine are 3.85 and 3.08 mM, respectively; (b) the c
0.25 mM, respectively.
Copyright � 2012 WILEY-VCH Verlag GmbH & Co. KGaA
concentrations of L-cysteine and AgNO3
(Figure 3a) and the optimal concentration
of AgNO3 is somewhat higher than the
concentration of L-cysteine (Figure 3b).
To characterize self-organization and
mechanism of gelation in the L-cysteine
based systems various techniques are
applied.
FTIR Spectroscopy has shown that
immediately after mixing of the aqueous
solutions of L-cysteine and AgNO3 silver
mercaptide (SM) is formed according to the
following reaction:[3]
HS� CH2CHðNH2ÞCOOHþAgþ
! AgS� CH2CHðNH2ÞCOOHþHþ:
The absorption band of the stretching
vibrations of the thiol groups, n(SH), at
2544 cm�1 is observed in the spectrum of
cysteine powder (Figure 4, curve 1), but
disappears in the gel spectrum (curve 2).
Moreover, the pH of the initial L-cysteine
solution (3mM) is about 5.1, after addition
of silver nitrate pH decreases till 2.5. Thus,
the formation of SM molecules in CSS
explains its turbidity after mixing
(Figure 1a). However, the solution gradu-
ally becomes transparent (Figure 1b) and
the very transparent solution is a precursor
of gelation.
UV-Vis Spectroscopic Studies of the
cysteine–silver solutions at various concen-
trations and molar ratio of the components
have shown (Figure 5) that the aging
process, which corresponds to transition
4,34,24,14,03,93,83,7
1
2
3
4
5
Deg
ree
of d
efor
mat
ion,
poi
nts
CNa2SO4, mM
b)
AgNO3 content. (a) The concentrations of AgNO3 and
oncentrations of L-cysteine and Na2SO4 are 3.02 and
, Weinheim www.ms-journal.de
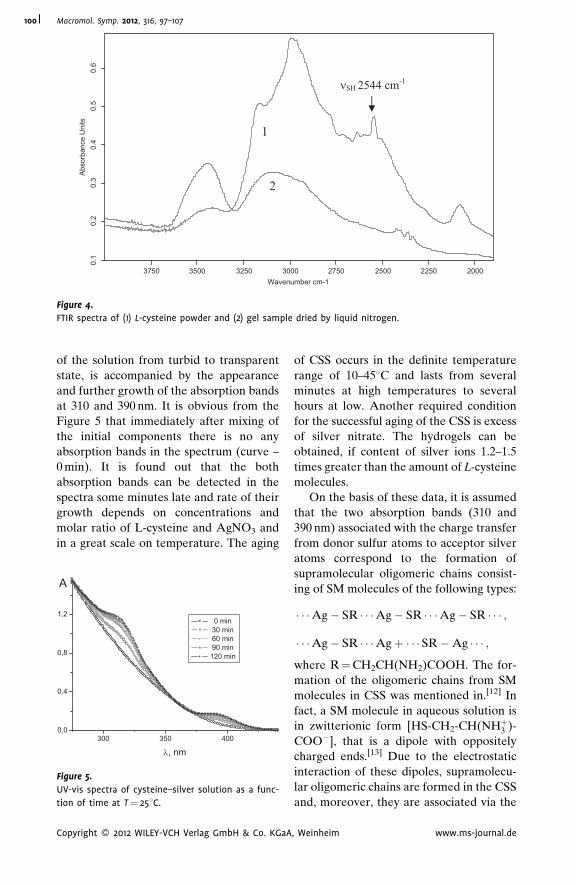
20002250250027503000325035003750Wavenumber cm-1
0.1
0.2
0.3
0.4
0.5
0.6
Abs
orba
nce
Uni
ts
νSH 2544 сm-1
2
1
Figure 4.
FTIR spectra of (1) L-cysteine powder and (2) gel sample dried by liquid nitrogen.
Macromol. Symp. 2012, 316, 97–107100
of the solution from turbid to transparent
state, is accompanied by the appearance
and further growth of the absorption bands
at 310 and 390 nm. It is obvious from the
Figure 5 that immediately after mixing of
the initial components there is no any
absorption bands in the spectrum (curve –
0 min). It is found out that the both
absorption bands can be detected in the
spectra some minutes late and rate of their
growth depends on concentrations and
molar ratio of L-cysteine and AgNO3 and
in a great scale on temperature. The aging
4003503000,0
0,4
0,8
1,2
A
λ, nm
0 min 30 min 60 min 90 min 120 min
Figure 5.
UV-vis spectra of cysteine–silver solution as a func-
tion of time at T¼ 258C.
Copyright � 2012 WILEY-VCH Verlag GmbH & Co. KGaA
of CSS occurs in the definite temperature
range of 10–458C and lasts from several
minutes at high temperatures to several
hours at low. Another required condition
for the successful aging of the CSS is excess
of silver nitrate. The hydrogels can be
obtained, if content of silver ions 1.2–1.5
times greater than the amount of L-cysteine
molecules.
On the basis of these data, it is assumed
that the two absorption bands (310 and
390 nm) associated with the charge transfer
from donor sulfur atoms to acceptor silver
atoms correspond to the formation of
supramolecular oligomeric chains consist-
ing of SM molecules of the following types:
� � �Ag� SR � � �Ag� SR � � �Ag� SR � � � ;
� � �Ag� SR � � �Agþ � � � SR�Ag � � � ;
where R¼CH2CH(NH2)COOH. The for-
mation of the oligomeric chains from SM
molecules in CSS was mentioned in.[12] In
fact, a SM molecule in aqueous solution is
in zwitterionic form [HS-CH2-CH(NHþ3 )-
COO�], that is a dipole with oppositely
charged ends.[13] Due to the electrostatic
interaction of these dipoles, supramolecu-
lar oligomeric chains are formed in the CSS
and, moreover, they are associated via the
, Weinheim www.ms-journal.de
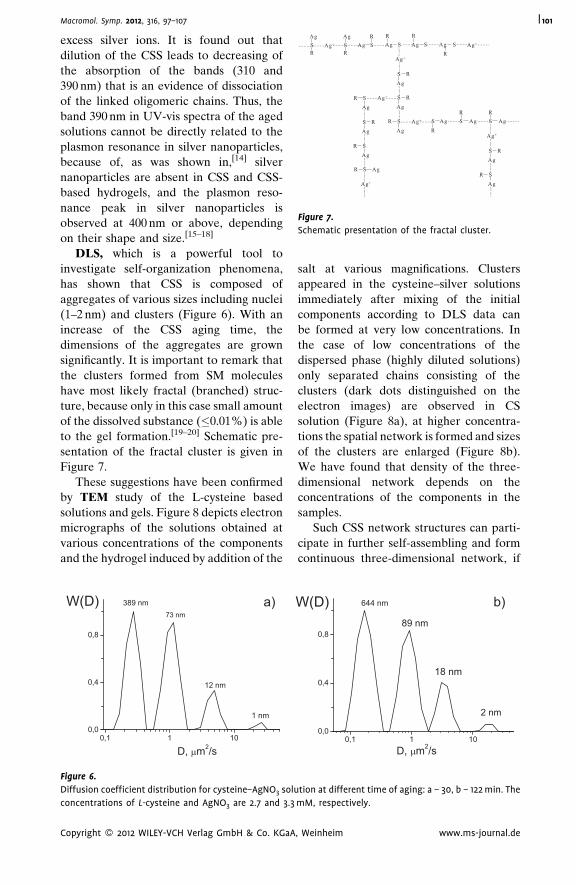
SAg
RSAg
RSR
Ag AgR
S AgR
S Ag SR
........
S RAg
........
........SAg
R
S RAg
........
........SAg
R
S AgR
........
........
S RAg........SAg
R S AgR
SR
Ag SR
Ag................S R
Ag........SAg
R
................
........Ag+........ ........ ........ ........ ........ ........Ag+........
Ag+
........Ag+........
Ag+
........Ag+........ ........ ........ ........
Ag+
........
Figure 7.
Schematic presentation of the fractal cluster.
Macromol. Symp. 2012, 316, 97–107 101
excess silver ions. It is found out that
dilution of the CSS leads to decreasing of
the absorption of the bands (310 and
390 nm) that is an evidence of dissociation
of the linked oligomeric chains. Thus, the
band 390 nm in UV-vis spectra of the aged
solutions cannot be directly related to the
plasmon resonance in silver nanoparticles,
because of, as was shown in,[14] silver
nanoparticles are absent in CSS and CSS-
based hydrogels, and the plasmon reso-
nance peak in silver nanoparticles is
observed at 400 nm or above, depending
on their shape and size.[15–18]
DLS, which is a powerful tool to
investigate self-organization phenomena,
has shown that CSS is composed of
aggregates of various sizes including nuclei
(1–2 nm) and clusters (Figure 6). With an
increase of the CSS aging time, the
dimensions of the aggregates are grown
significantly. It is important to remark that
the clusters formed from SM molecules
have most likely fractal (branched) struc-
ture, because only in this case small amount
of the dissolved substance (�0.01%) is able
to the gel formation.[19–20] Schematic pre-
sentation of the fractal cluster is given in
Figure 7.
These suggestions have been confirmed
by TEM study of the L-cysteine based
solutions and gels. Figure 8 depicts electron
micrographs of the solutions obtained at
various concentrations of the components
and the hydrogel induced by addition of the
a)
1010,10,0
0,4
0,8
D, µm2/s
W(D) 389 nm73 nm
12 nm
1 nm
Figure 6.
Diffusion coefficient distribution for cysteine–AgNO3 solu
concentrations of L-cysteine and AgNO3 are 2.7 and 3.3
Copyright � 2012 WILEY-VCH Verlag GmbH & Co. KGaA
salt at various magnifications. Clusters
appeared in the cysteine–silver solutions
immediately after mixing of the initial
components according to DLS data can
be formed at very low concentrations. In
the case of low concentrations of the
dispersed phase (highly diluted solutions)
only separated chains consisting of the
clusters (dark dots distinguished on the
electron images) are observed in CS
solution (Figure 8a), at higher concentra-
tions the spatial network is formed and sizes
of the clusters are enlarged (Figure 8b).
We have found that density of the three-
dimensional network depends on the
concentrations of the components in the
samples.
Such CSS network structures can parti-
cipate in further self-assembling and form
continuous three-dimensional network, if
b)
1010,10,0
0,4
0,8
D, µm2/s
W(D) 644 nm
89 nm
18 nm
2 nm
tion at different time of aging: a – 30, b – 122 min. The
mM, respectively.
, Weinheim www.ms-journal.de
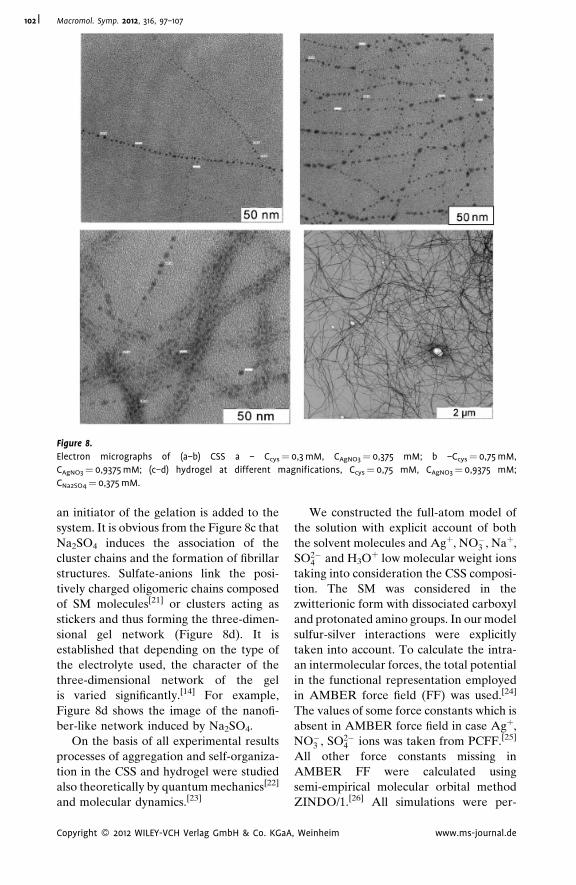
Figure 8.
Electron micrographs of (a–b) CSS a – Ccys¼ 0,3 mM, CAgNO3¼ 0,375 mM; b –Ccys¼ 0,75 mM,
CAgNO3¼ 0,9375 mM; (c–d) hydrogel at different magnifications, Ccys¼ 0,75 mM, CAgNO3¼ 0,9375 mM;
CNa2SO4¼ 0,375 mM.
Macromol. Symp. 2012, 316, 97–107102
an initiator of the gelation is added to the
system. It is obvious from the Figure 8c that
Na2SO4 induces the association of the
cluster chains and the formation of fibrillar
structures. Sulfate-anions link the posi-
tively charged oligomeric chains composed
of SM molecules[21] or clusters acting as
stickers and thus forming the three-dimen-
sional gel network (Figure 8d). It is
established that depending on the type of
the electrolyte used, the character of the
three-dimensional network of the gel
is varied significantly.[14] For example,
Figure 8d shows the image of the nanofi-
ber-like network induced by Na2SO4.
On the basis of all experimental results
processes of aggregation and self-organiza-
tion in the CSS and hydrogel were studied
also theoretically by quantum mechanics[22]
and molecular dynamics.[23]
Copyright � 2012 WILEY-VCH Verlag GmbH & Co. KGaA
We constructed the full-atom model of
the solution with explicit account of both
the solvent molecules and Agþ, NO�3 , Naþ,
SO2�4 and H3Oþ low molecular weight ions
taking into consideration the CSS composi-
tion. The SM was considered in the
zwitterionic form with dissociated carboxyl
and protonated amino groups. In our model
sulfur-silver interactions were explicitly
taken into account. To calculate the intra-
an intermolecular forces, the total potential
in the functional representation employed
in AMBER force field (FF) was used.[24]
The values of some force constants which is
absent in AMBER force field in case Agþ,
NO�3 , SO2�4 ions was taken from PCFF.[25]
All other force constants missing in
AMBER FF were calculated using
semi-empirical molecular orbital method
ZINDO/1.[26] All simulations were per-
, Weinheim www.ms-journal.de
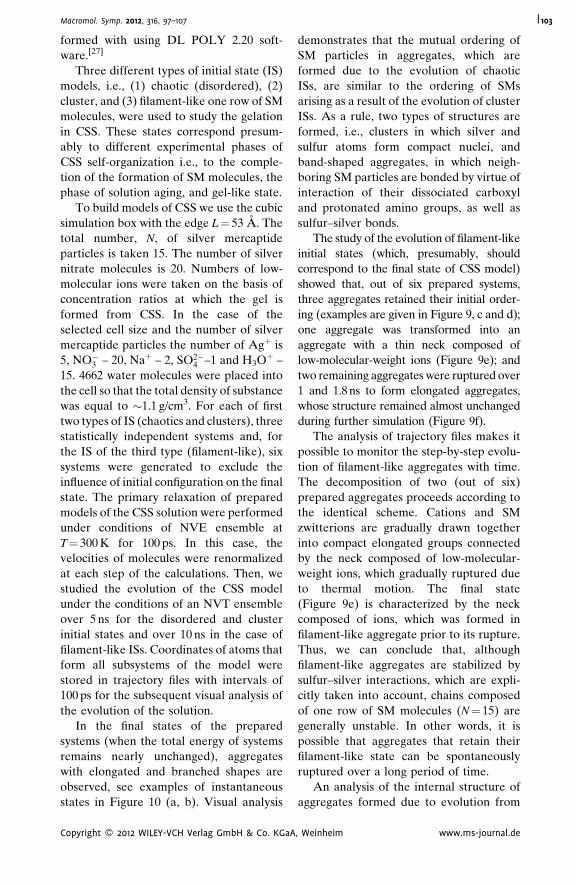
Macromol. Symp. 2012, 316, 97–107 103
formed with using DL POLY 2.20 soft-
ware.[27]
Three different types of initial state (IS)
models, i.e., (1) chaotic (disordered), (2)
cluster, and (3) filament-like one row of SM
molecules, were used to study the gelation
in CSS. These states correspond presum-
ably to different experimental phases of
CSS self-organization i.e., to the comple-
tion of the formation of SM molecules, the
phase of solution aging, and gel-like state.
To build models of CSS we use the cubic
simulation box with the edge L¼ 53 A. The
total number, N, of silver mercaptide
particles is taken 15. The number of silver
nitrate molecules is 20. Numbers of low-
molecular ions were taken on the basis of
concentration ratios at which the gel is
formed from CSS. In the case of the
selected cell size and the number of silver
mercaptide particles the number of Agþ is
5, NO�3 – 20, Naþ – 2, SO2�4 –1 and H3Oþ –
15. 4662 water molecules were placed into
the cell so that the total density of substance
was equal to �1.1 g/cm3. For each of first
two types of IS (chaotics and clusters), three
statistically independent systems and, for
the IS of the third type (filament-like), six
systems were generated to exclude the
influence of initial configuration on the final
state. The primary relaxation of prepared
models of the CSS solution were performed
under conditions of NVE ensemble at
T¼ 300 K for 100 ps. In this case, the
velocities of molecules were renormalized
at each step of the calculations. Then, we
studied the evolution of the CSS model
under the conditions of an NVT ensemble
over 5 ns for the disordered and cluster
initial states and over 10 ns in the case of
filament-like ISs. Coordinates of atoms that
form all subsystems of the model were
stored in trajectory files with intervals of
100 ps for the subsequent visual analysis of
the evolution of the solution.
In the final states of the prepared
systems (when the total energy of systems
remains nearly unchanged), aggregates
with elongated and branched shapes are
observed, see examples of instantaneous
states in Figure 10 (a, b). Visual analysis
Copyright � 2012 WILEY-VCH Verlag GmbH & Co. KGaA
demonstrates that the mutual ordering of
SM particles in aggregates, which are
formed due to the evolution of chaotic
ISs, are similar to the ordering of SMs
arising as a result of the evolution of cluster
ISs. As a rule, two types of structures are
formed, i.e., clusters in which silver and
sulfur atoms form compact nuclei, and
band-shaped aggregates, in which neigh-
boring SM particles are bonded by virtue of
interaction of their dissociated carboxyl
and protonated amino groups, as well as
sulfur–silver bonds.
The study of the evolution of filament-like
initial states (which, presumably, should
correspond to the final state of CSS model)
showed that, out of six prepared systems,
three aggregates retained their initial order-
ing (examples are given in Figure 9, c and d);
one aggregate was transformed into an
aggregate with a thin neck composed of
low-molecular-weight ions (Figure 9e); and
two remaining aggregates were ruptured over
1 and 1.8 ns to form elongated aggregates,
whose structure remained almost unchanged
during further simulation (Figure 9f).
The analysis of trajectory files makes it
possible to monitor the step-by-step evolu-
tion of filament-like aggregates with time.
The decomposition of two (out of six)
prepared aggregates proceeds according to
the identical scheme. Cations and SM
zwitterions are gradually drawn together
into compact elongated groups connected
by the neck composed of low-molecular-
weight ions, which gradually ruptured due
to thermal motion. The final state
(Figure 9e) is characterized by the neck
composed of ions, which was formed in
filament-like aggregate prior to its rupture.
Thus, we can conclude that, although
filament-like aggregates are stabilized by
sulfur–silver interactions, which are expli-
citly taken into account, chains composed
of one row of SM molecules (N¼ 15) are
generally unstable. In other words, it is
possible that aggregates that retain their
filament-like state can be spontaneously
ruptured over a long period of time.
An analysis of the internal structure of
aggregates formed due to evolution from
, Weinheim www.ms-journal.de
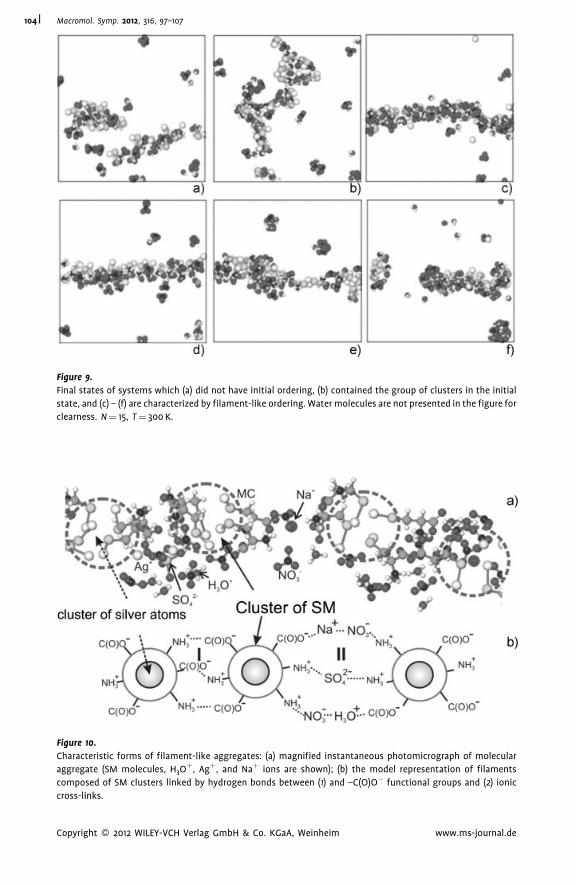
Figure 10.
Characteristic forms of filament-like aggregates: (a) magnified instantaneous photomicrograph of molecular
aggregate (SM molecules, H3Oþ, Agþ, and Naþ ions are shown); (b) the model representation of filaments
composed of SM clusters linked by hydrogen bonds between (1) and –C(O)O� functional groups and (2) ionic
cross-links.
Figure 9.
Final states of systems which (a) did not have initial ordering, (b) contained the group of clusters in the initial
state, and (c) – (f) are characterized by filament-like ordering. Water molecules are not presented in the figure for
clearness. N¼ 15, T¼ 300 K.
Copyright � 2012 WILEY-VCH Verlag GmbH & Co. KGaA, Weinheim www.ms-journal.de
Macromol. Symp. 2012, 316, 97–107104
Macromol. Symp. 2012, 316, 97–107 105
the initial disordered state, cluster state,
and after the rupture of filament-like state
demonstrates that SM molecules form
cluster structures due to numerous adjacent
sulfur–silver bonds and bonds between –
NHþ3 and –C(O)O� groups (Figure 10a).
The scheme of the structure of the formed
chains of clusters is shown in Figure 10b.
These chains represent a supramolecular
chain aggregates formed by clusters of SM
particles, which are linked by the adjacent
bonds formed between neighbor clusters
with the participation of (I) dissociated
carboxyl and protonated amino groups and
(II) low-molecular-weight ions coordinated
with –NHþ3 and –C(O)O� groups. Due to
the fact that –NHþ3 and –C(O)O� func-
tional groups are located primarily on the
surface of the aggregate, both chain and
branched structures can be formed in the
bulk of solution.
Because of the centers of clusters
formed by SM contain silver atoms
(Figure 10a), it can be assumed that the
filaments of the gel network (in real CSS)
can have a similar structure. Indeed, the
black dots on the electron micrographs
(Figure 8) are silver nanoparticles and
silver sulfide crystals, which emerged under
the action of the electron beam. The latter
event can occur, if SM particles are grouped
into the filaments of the gel network so that
silver atoms that comprise filaments form
compact structures. The presence of
absorption band at 390 nm in CSS confirms
this hypothesis because its appearance can
be associated with the presence of compact
clusters of silver atoms.[28]
Structures analogous to that shown in
Figure 9f (their average diameter is 16A)
demonstrate the tendency internal rearran-
gement over the long period of time. The
concentration of SM molecules in the unit
volume of such aggregates is two-fold
higher than that of filament-like aggregates
shown in Figure 9 (c and d). This analysis
suggests that aggregates constructed using a
doubled amount of SM molecules will be
stable. To verify this hypothesis, we con-
structed aggregates based on two parallel
chains composed of SM molecules. The
Copyright � 2012 WILEY-VCH Verlag GmbH & Co. KGaA
total number of zwitterions and SM cations,
N, is equal to 30 and; the size of simulation
cell L¼ 53 A. Four new variants of the
mutual ordering of SM molecules were
generated for performing calculations.
According to the completed simulation,
all constructed aggregates are stable at
the achieved simulation times 20 ns. An
increase in the temperature of the ensemble
above 340 K resulted in the fairly fast (for
2–3 ns) gradual rupture of filaments to form
several disordered clusters. The average
diameter of these filaments in the final state
is approximately 15.5 A, i.e., it corresponds
to the largest diameter of aggregates in
Figures 8 (a, b, and f). In the final state, all
filament-like aggregates compose of the
chain of clusters formed by SM particles,
which are connected to one another via the
interaction between –NHþ3 and –C(O)O�
groups of SM particles that belong to
neighboring clusters (Figure 9b, variant I
of clusters interaction). These clusters, in
turn, are formed due to noncovalent
interactions between sulfur and silver
atoms of neighboring silver mercaptide
zwitterions. A similar principle of self-
assembly at the expense of amino and
carboxyl groups was also described for
other systems[29] that evidences about the
universal character of the observed
mechanism of self-organization in CSS.
Thus, the theoretical investigations have
shown that the system involved show a
tendency toward self-assembling and the
formation of threadlike structures and
three-dimensional networks.
It should be remarked that the CSS and
hydrogels are attractive objects not only for
the study of mechanism of self-assembling
and gelation in diluted solutions, but also
for their potential applications. Its practical
importance is connected with an opportu-
nity to apply these systems consisting of
biologically active components as a matrix
for producing highly efficient pharmaceu-
tical formulations. In experiments it is
established that the matrix itself has
possessed not only antimicrobial proper-
ties, but has stimulated the cell division.
The data on the antibacterial activity of the
, Weinheim www.ms-journal.de
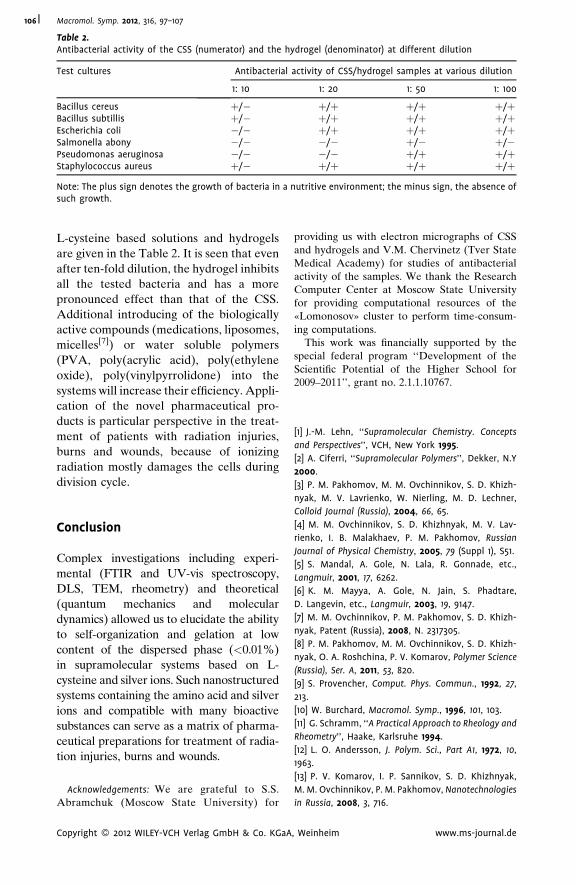
Table 2.Antibacterial activity of the CSS (numerator) and the hydrogel (denominator) at different dilution
Test cultures Antibacterial activity of CSS/hydrogel samples at various dilution
1: 10 1: 20 1: 50 1: 100
Bacillus cereus þ/� þ/þ þ/þ þ/þBacillus subtillis þ/� þ/þ þ/þ þ/þEscherichia coli �/� þ/þ þ/þ þ/þSalmonella abony �/� �/� þ/� þ/�Pseudomonas aeruginosa �/� �/� þ/þ þ/þStaphylococcus aureus þ/� þ/þ þ/þ þ/þ
Note: The plus sign denotes the growth of bacteria in a nutritive environment; the minus sign, the absence ofsuch growth.
Macromol. Symp. 2012, 316, 97–107106
L-cysteine based solutions and hydrogels
are given in the Table 2. It is seen that even
after ten-fold dilution, the hydrogel inhibits
all the tested bacteria and has a more
pronounced effect than that of the CSS.
Additional introducing of the biologically
active compounds (medications, liposomes,
micelles[7]) or water soluble polymers
(PVA, poly(acrylic acid), poly(ethylene
oxide), poly(vinylpyrrolidone) into the
systems will increase their efficiency. Appli-
cation of the novel pharmaceutical pro-
ducts is particular perspective in the treat-
ment of patients with radiation injuries,
burns and wounds, because of ionizing
radiation mostly damages the cells during
division cycle.
Conclusion
Complex investigations including experi-
mental (FTIR and UV-vis spectroscopy,
DLS, TEM, rheometry) and theoretical
(quantum mechanics and molecular
dynamics) allowed us to elucidate the ability
to self-organization and gelation at low
content of the dispersed phase (<0.01%)
in supramolecular systems based on L-
cysteine and silver ions. Such nanostructured
systems containing the amino acid and silver
ions and compatible with many bioactive
substances can serve as a matrix of pharma-
ceutical preparations for treatment of radia-
tion injuries, burns and wounds.
Acknowledgements: We are grateful to S.S.Abramchuk (Moscow State University) for
Copyright � 2012 WILEY-VCH Verlag GmbH & Co. KGaA
providing us with electron micrographs of CSSand hydrogels and V.M. Chervinetz (Tver StateMedical Academy) for studies of antibacterialactivity of the samples. We thank the ResearchComputer Center at Moscow State Universityfor providing computational resources of the«Lomonosov» cluster to perform time-consum-ing computations.
This work was financially supported by thespecial federal program ‘‘Development of theScientific Potential of the Higher School for2009–2011’’, grant no. 2.1.1.10767.
[1] J.-M. Lehn, ‘‘Supramolecular Chemistry. Concepts
and Perspectives’’, VCH, New York 1995.
[2] A. Ciferri, ‘‘Supramolecular Polymers’’, Dekker, N.Y
2000.
[3] P. M. Pakhomov, M. M. Ovchinnikov, S. D. Khizh-
nyak, M. V. Lavrienko, W. Nierling, M. D. Lechner,
Colloid Journal (Russia), 2004, 66, 65.
[4] M. M. Ovchinnikov, S. D. Khizhnyak, M. V. Lav-
rienko, I. B. Malakhaev, P. M. Pakhomov, Russian
Journal of Physical Chemistry, 2005, 79 (Suppl 1), S51.
[5] S. Mandal, A. Gole, N. Lala, R. Gonnade, etc.,
Langmuir, 2001, 17, 6262.
[6] K. M. Mayya, A. Gole, N. Jain, S. Phadtare,
D. Langevin, etc., Langmuir, 2003, 19, 9147.
[7] M. M. Ovchinnikov, P. M. Pakhomov, S. D. Khizh-
nyak, Patent (Russia), 2008, N. 2317305.
[8] P. M. Pakhomov, M. M. Ovchinnikov, S. D. Khizh-
nyak, O. A. Roshchina, P. V. Komarov, Polymer Science
(Russia), Ser. A, 2011, 53, 820.
[9] S. Provencher, Comput. Phys. Commun., 1992, 27,
213.
[10] W. Burchard, Macromol. Symp., 1996, 101, 103.
[11] G. Schramm, ‘‘A Practical Approach to Rheology and
Rheometry’’, Haake, Karlsruhe 1994.
[12] L. O. Andersson, J. Polym. Sci., Part A1, 1972, 10,
1963.
[13] P. V. Komarov, I. P. Sannikov, S. D. Khizhnyak,
M. M. Ovchinnikov, P. M. Pakhomov, Nanotechnologies
in Russia, 2008, 3, 716.
, Weinheim www.ms-journal.de
Macromol. Symp. 2012, 316, 97–107 107
[14] P. M. Pakhomov, S. S. Abramchuk, S. D. Khizhnyak,
M. M. Ovchinnikov, V. M. Spiridonova, Nanotechnol-
ogies in Russia, 2010, 5, 209.
[15] Y. Sun, Y. Xia, Analyst, 2003, 128, 686.
[16] Q. Wang, H. Yu, L. Zhong, et al., Chem. Mater.,
2006, 18, 1988.
[17] Y. M. Mohan, Th. Premkumar, K. Lee, K. E. Gecke-
ler, Macromol. Rapid Commun., 2006, 27, 1346.
[18] P. Billaud, J. R. Hautzinger, E. Cottancin, et al., Eur.
Phys. J., D, 2007, 43, 271.
[19] B. M. Smirnov, ‘‘Physics of fractal clusters’’,
Nauka, M., 1991.
[20] B. M. Smirnov, ‘‘Advances in physical sciences’’,
1992, 162, 43.
[21] M. M. Ovchinnikov, S. D. Khizhnyak, P. M. Pakho-
mov, J. Struct. Chem. (Russia), 2011, 52, 1200.
Copyright � 2012 WILEY-VCH Verlag GmbH & Co. KGaA
[22] P. V. Komarov, V. G. Alekseev, S. D. Khizhnyak,
M. M. Ovchinnikov, P. M. Pakhomov, Nanotechnologies
in Russia, 2010, 5, 165.
[23] P. V. Komarov, I. V. Mikhailov, V. G. Alekseev, S. D.
Khizhnyak, P. M. Pakhomov, Colloid Journal (Russia),
2011, 73, 482.
[24] W. D. Cornell, P. Cieplak, C. I. Bayly, et al., J. Am.
Chem. Soc., 1995, 117, 5179.
[25] H. Sun, Macromolecules, 1995, 28, 701.
[26] R. C. Bingham, M. J. S. Dewar, D. H. Lo, J. Am.
Chem. Soc., 1975, 97, 1285.
[27] W. Smith, T. R. Forester, J. Mol. Graph., 1996, 14,
136.
[28] B. G. Ershov, Ross. Khim. Zh., 2001, 45, 20.
[29] A. Yu. Men’shikova, Nanotechnologies in Russia,
2010, 5, 52.
, Weinheim www.ms-journal.de
Macromol. Symp. 2012, 316, 108–111 DOI: 10.1002/masy.201250614108
1 D
da
s/n
E-2 A
n8
Cop
Comparative Study of the Quantity of Volatile
Organic Compounds in Water-Based Paint and
Solvent-Based Applied Polyurethane
Ailton R. da Conceicao,*1,2 Ednilson A. R. Pimenta,1,2 Ronaldo S. Fujisawa,1,2
Evandro L. Nohara1
Summary: The concern about the environmental impacts generated in the production
of goods and services has increased last decades. The industry has used paints and
varnishes in the manufacturing process have been pressed to improve air pollution
prevention. Thus, the present work aims to identify the quantitative differences of
VOC’s and analyze the effect of VOC’s in the burning rate, in a solvent and water-based
paint, applied in the manufacture of automotive steering wheels. The results has
showed that the solvent-based paint contains nine times more VOC’s in your
formulation in relation to water-based paint, when compared liquid and volatile
organic compounds present in the solvent-based paint increase the speed of combus-
tion of the polyurethanes samples. These data indicate that a discussion on the subject
must be initiated in order to reduce these emissions that can harm society.
Keywords: combustibility; paint; polyurethane; volatile organic compound
Introduction
PUs are produced by the polycondensation
of an isocyanate reaction with a polyol
(several functions polymers with terminal
hydroxyl groups) and other reagents such
as: healing agents or chain extensors,
containing two or more reactive groups:
catalysts; expansion agents; surfactants and
loads.[1] Many of the additives change and
interfere the essential properties of fire
formation, as heat, fuel and oxygen.[2]
According to research about polymeric
materials combustion it is defined as physics
and chemical reactions in which the sub-
stances react with the oxygen releasing heat
and producing water and carbon dioxide.
Usually in the polyurethane steering-
wheels production it is applied the ‘‘in mold
coating’’ process of painting which consists in
epartamento de Engenharia Mecanica, Universi-
de de Taubate – UNITAU, Rua Daniel Danelli
, Jardim Morumbi, Taubate- SP
mail: [email protected]
utoliv do Brasil Ltda – Av. Roberto Bertoletti,
551, Taubate – SP
yright � 2012 WILEY-VCH Verlag GmbH & Co. KGaA
placing the paint over the mold surface that
is transferred to the part through a heat
transfer. The paints used are liquid, viscous,
consisting of one or more pigments dispersed
in a liquid binder which forms an opaque film
and adherent to the substrate when suffering
a healing process to an extended thin film.[5]
In a way the paints typically have volatile
organic compounds, also known by the
acronym VOC (Volatile Organic Com-
pound). The hydrocarbons of low molecular
weight are also important pollutants from
burning fossil fuel. These compounds are
known as volatile organic compounds
(VOC’s).[6] The VOC is defined by the
standard ASTM D 3960,[7] ‘‘Standard Practice
for Determining Volatile Organic Compound
(VOC) Content of Paints and Related Coat-
ings, ’’as any compound of carbon that joins in
atmospheric photochemical reactions.[8]
The term volatile organic compound is
used to describe materials in the organic
phase excluding steam methane.[9] Manu-
facturers of coatings (including paints) are
part of a strategy to reduce emissions of
VOC’s in many countries. Some alterna-
, Weinheim wileyonlinelibrary.com
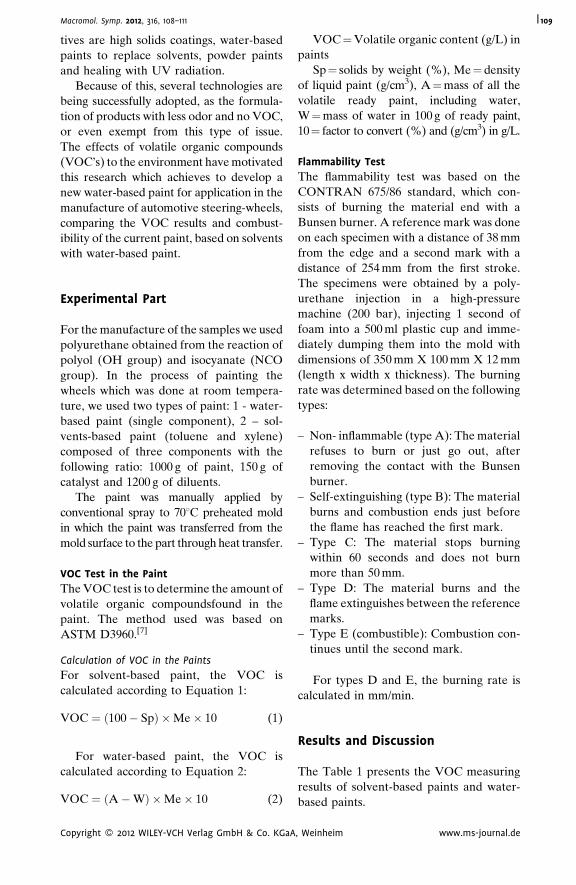
Macromol. Symp. 2012, 316, 108–111 109
tives are high solids coatings, water-based
paints to replace solvents, powder paints
and healing with UV radiation.
Because of this, several technologies are
being successfully adopted, as the formula-
tion of products with less odor and no VOC,
or even exempt from this type of issue.
The effects of volatile organic compounds
(VOC’s) to the environment have motivated
this research which achieves to develop a
new water-based paint for application in the
manufacture of automotive steering-wheels,
comparing the VOC results and combust-
ibility of the current paint, based on solvents
with water-based paint.
Experimental Part
For the manufacture of the samples we used
polyurethane obtained from the reaction of
polyol (OH group) and isocyanate (NCO
group). In the process of painting the
wheels which was done at room tempera-
ture, we used two types of paint: 1 - water-
based paint (single component), 2 – sol-
vents-based paint (toluene and xylene)
composed of three components with the
following ratio: 1000 g of paint, 150 g of
catalyst and 1200 g of diluents.
The paint was manually applied by
conventional spray to 708C preheated mold
in which the paint was transferred from the
mold surface to the part through heat transfer.
VOC Test in the Paint
The VOC test is to determine the amount of
volatile organic compoundsfound in the
paint. The method used was based on
ASTM D3960.[7]
Calculation of VOC in the Paints
For solvent-based paint, the VOC is
calculated according to Equation 1:
VOC ¼ ð100� SpÞ �Me� 10 (1)
For water-based paint, the VOC is
calculated according to Equation 2:
VOC ¼ ðA�WÞ �Me� 10 (2)
Copyright � 2012 WILEY-VCH Verlag GmbH & Co. KGaA
VOC¼Volatile organic content (g/L) in
paints
Sp¼ solids by weight (%), Me¼ density
of liquid paint (g/cm3), A¼mass of all the
volatile ready paint, including water,
W¼mass of water in 100 g of ready paint,
10¼ factor to convert (%) and (g/cm3) in g/L.
Flammability Test
The flammability test was based on the
CONTRAN 675/86 standard, which con-
sists of burning the material end with a
Bunsen burner. A reference mark was done
on each specimen with a distance of 38 mm
from the edge and a second mark with a
distance of 254 mm from the first stroke.
The specimens were obtained by a poly-
urethane injection in a high-pressure
machine (200 bar), injecting 1 second of
foam into a 500 ml plastic cup and imme-
diately dumping them into the mold with
dimensions of 350 mm X 100 mm X 12 mm
(length x width x thickness). The burning
rate was determined based on the following
types:
– N
, W
on- inflammable (type A): The material
refuses to burn or just go out, after
removing the contact with the Bunsen
burner.
– S
elf-extinguishing (type B): The materialburns and combustion ends just before
the flame has reached the first mark.
– T
ype C: The material stops burningwithin 60 seconds and does not burn
more than 50 mm.
– T
ype D: The material burns and theflame extinguishes between the reference
marks.
– T
ype E (combustible): Combustion con-tinues until the second mark.
For types D and E, the burning rate is
calculated in mm/min.
Results and Discussion
The Table 1 presents the VOC measuring
results of solvent-based paints and water-
based paints.
einheim www.ms-journal.de
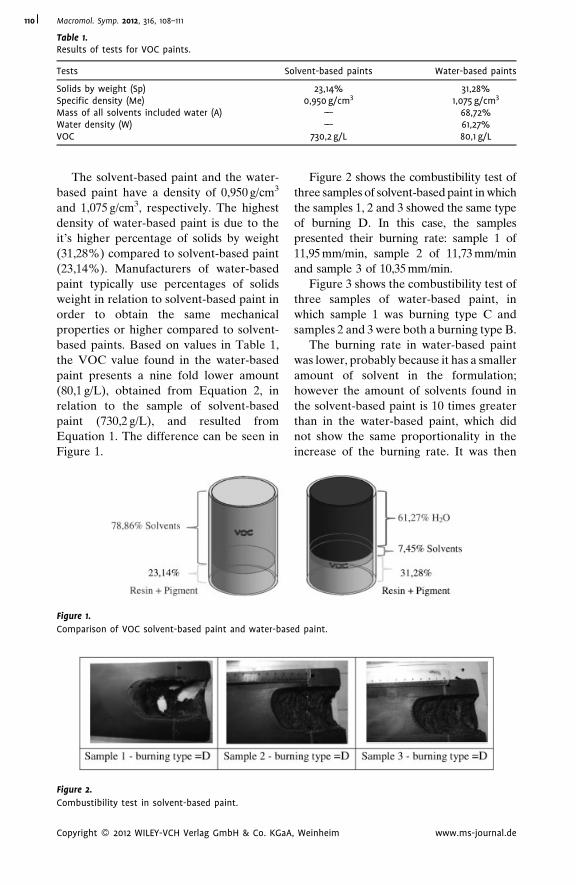
Table 1.Results of tests for VOC paints.
Tests Solvent-based paints Water-based paints
Solids by weight (Sp) 23,14% 31,28%Specific density (Me) 0,950 g/cm3 1,075 g/cm3
Mass of all solvents included water (A) –— 68,72%Water density (W) –— 61,27%VOC 730,2 g/L 80,1 g/L
Macromol. Symp. 2012, 316, 108–111110
The solvent-based paint and the water-
based paint have a density of 0,950 g/cm3
and 1,075 g/cm3, respectively. The highest
density of water-based paint is due to the
it’s higher percentage of solids by weight
(31,28%) compared to solvent-based paint
(23,14%). Manufacturers of water-based
paint typically use percentages of solids
weight in relation to solvent-based paint in
order to obtain the same mechanical
properties or higher compared to solvent-
based paints. Based on values in Table 1,
the VOC value found in the water-based
paint presents a nine fold lower amount
(80,1 g/L), obtained from Equation 2, in
relation to the sample of solvent-based
paint (730,2 g/L), and resulted from
Equation 1. The difference can be seen in
Figure 1.
Figure 1.
Comparison of VOC solvent-based paint and water-bas
Figure 2.
Combustibility test in solvent-based paint.
Copyright � 2012 WILEY-VCH Verlag GmbH & Co. KGaA
Figure 2 shows the combustibility test of
three samples of solvent-based paint in which
the samples 1, 2 and 3 showed the same type
of burning D. In this case, the samples
presented their burning rate: sample 1 of
11,95 mm/min, sample 2 of 11,73 mm/min
and sample 3 of 10,35 mm/min.
Figure 3 shows the combustibility test of
three samples of water-based paint, in
which sample 1 was burning type C and
samples 2 and 3 were both a burning type B.
The burning rate in water-based paint
was lower, probably because it has a smaller
amount of solvent in the formulation;
however the amount of solvents found in
the solvent-based paint is 10 times greater
than in the water-based paint, which did
not show the same proportionality in the
increase of the burning rate. It was then
ed paint.
, Weinheim www.ms-journal.de
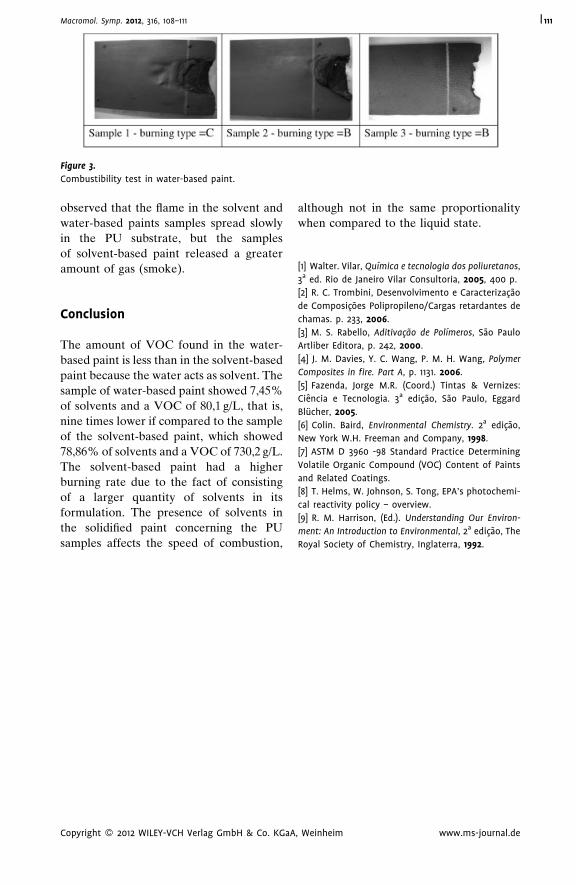
Figure 3.
Combustibility test in water-based paint.
Macromol. Symp. 2012, 316, 108–111 111
observed that the flame in the solvent and
water-based paints samples spread slowly
in the PU substrate, but the samples
of solvent-based paint released a greater
amount of gas (smoke).
Conclusion
The amount of VOC found in the water-
based paint is less than in the solvent-based
paint because the water acts as solvent. The
sample of water-based paint showed 7,45%
of solvents and a VOC of 80,1 g/L, that is,
nine times lower if compared to the sample
of the solvent-based paint, which showed
78,86% of solvents and a VOC of 730,2 g/L.
The solvent-based paint had a higher
burning rate due to the fact of consisting
of a larger quantity of solvents in its
formulation. The presence of solvents in
the solidified paint concerning the PU
samples affects the speed of combustion,
Copyright � 2012 WILEY-VCH Verlag GmbH & Co. KGaA
although not in the same proportionality
when compared to the liquid state.
[1] Walter. Vilar, Quımica e tecnologia dos poliuretanos,
3a ed. Rio de Janeiro Vilar Consultoria, 2005, 400 p.
[2] R. C. Trombini, Desenvolvimento e Caracterizacao
de Composicoes Polipropileno/Cargas retardantes de
chamas. p. 233, 2006.
[3] M. S. Rabello, Aditivacao de Polımeros, Sao Paulo
Artliber Editora, p. 242, 2000.
[4] J. M. Davies, Y. C. Wang, P. M. H. Wang, Polymer
Composites in fire. Part A, p. 1131. 2006.
[5] Fazenda, Jorge M.R. (Coord.) Tintas & Vernizes:
Ciencia e Tecnologia. 3a edicao, Sao Paulo, Eggard
Blucher, 2005.
[6] Colin. Baird, Environmental Chemistry. 2a edicao,
New York W.H. Freeman and Company, 1998.
[7] ASTM D 3960 -98 Standard Practice Determining
Volatile Organic Compound (VOC) Content of Paints
and Related Coatings.
[8] T. Helms, W. Johnson, S. Tong, EPA’s photochemi-
cal reactivity policy – overview.
[9] R. M. Harrison, (Ed.). Understanding Our Environ-
ment: An Introduction to Environmental, 2a edicao, The
Royal Society of Chemistry, Inglaterra, 1992.
, Weinheim www.ms-journal.de
Macromol. Symp. 2012, 316, 112–122 DOI: 10.1002/masy.201250615112
1 M
A2 In
po3 Cz
Th
Cz4 In
of
Cop
Thermal Degradation of Adsorbed Bottle-Brush
Macromolecules: When Do Strong Covalent Bonds
Break Easily?
Jaroslaw Paturej,1,2 Lukasz Kuban,3 Andrey Milchev,1,4 Vakhtang G. Rostiashvili,1
Thomas A. Vilgis1
The scission kinetics of bottle-brush molecules in solution and on an adhesive
substrate is modeled by means of Molecular Dynamics simulation with Langevin
thermostat. Our macromolecules comprise a long flexible polymer backbone with L
segments, consisting of breakable bonds, along with two side chains of length N,
tethered to segments of the backbone with grafting density sg. In agreement with
recent experiments and theoretical predictions, we find that bond cleavage is
significantly enhanced on a strongly attractive substrate even though the chemical
nature of the bonds remains thereby unchanged. Our simulation results indicate
that the mean life time hti of covalent bonds decreases by more than an order of
magnitude upon adsorption even for brush molecules with comparatively short
side chains N ¼ 1� 4. The distribution of scission probability along the bonds of
the backbone is found to change significantly when the length and/or the grafting
density of the side chains are varied. The tension, experienced by the covalent
bonds is found to grow steadily with increasing sg. The mean life time hti declines
with growing contour length L as hti/L�0:17, and also with growing side chain
length N. The probability distribution of fragment lengths at different times is
compatible with experimental observations and reveals a two-stage (initially fast,
then slow) process with different rates. The variation of the mean length L(t) of the
fragments with elapsed time characterizes the thermal degradation process as a
first order reaction.
Keywords: bottle-brush molecules; degradation and stabilization of polymers
Introduction
The study of degradation and stabilization
of polymers is important both from prac-
tical and theoretical viewpoints.[1] Disposal
of plastic wastes has grown rapidly to a
world problem so that increasing environ-
mental concerns have prompted researchers
ax Planck Institute for Polymer Research
ckermannweg 10, 55128 Mainz, Germany
stitute of Physics, University of Szczecin, Wielko-
lska 15, 70451 Szczecin, Poland
estochowa University of Technology, Institute of
ermal Machinery, Armii Krajowej 21, 42200
estochowa, Poland
stitute for Physical Chemistry, Bulgarian Academy
Science, 1113 Sofia, Bulgaria
yright � 2012 WILEY-VCH Verlag GmbH & Co. KGaA
to investigate plastics recycling by degrada-
tion as an alternative.[2] On the other hand,
degradation of polymers in different envir-
onment is a major limiting factor in their
application. Recently, with the advent of
exploiting biopolymers as functional materi-
als,[3,4] the stability of such materials has
become an issue of primary concern.
Most theoretical investigations of poly-
mer degradation have focused so far on
determining the rate of change of average
molecular weight.[5–14] The main assump-
tions of the theory are that each link in a
long chain molecule has equal tensile
strength and accessibility, that they break
at random, and that the probability of
rupture to happen within certain time
, Weinheim wileyonlinelibrary.com
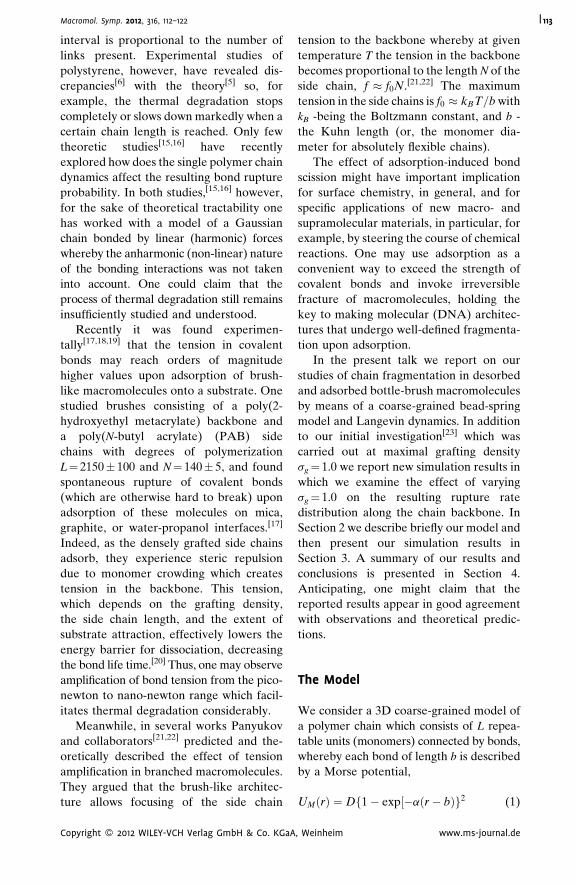
Macromol. Symp. 2012, 316, 112–122 113
interval is proportional to the number of
links present. Experimental studies of
polystyrene, however, have revealed dis-
crepancies[6] with the theory[5] so, for
example, the thermal degradation stops
completely or slows down markedly when a
certain chain length is reached. Only few
theoretic studies[15,16] have recently
explored how does the single polymer chain
dynamics affect the resulting bond rupture
probability. In both studies,[15,16] however,
for the sake of theoretical tractability one
has worked with a model of a Gaussian
chain bonded by linear (harmonic) forces
whereby the anharmonic (non-linear) nature
of the bonding interactions was not taken
into account. One could claim that the
process of thermal degradation still remains
insufficiently studied and understood.
Recently it was found experimen-
tally[17,18,19] that the tension in covalent
bonds may reach orders of magnitude
higher values upon adsorption of brush-
like macromolecules onto a substrate. One
studied brushes consisting of a poly(2-
hydroxyethyl metacrylate) backbone and
a poly(N-butyl acrylate) (PAB) side
chains with degrees of polymerization
L¼ 2150� 100 and N¼ 140� 5, and found
spontaneous rupture of covalent bonds
(which are otherwise hard to break) upon
adsorption of these molecules on mica,
graphite, or water-propanol interfaces.[17]
Indeed, as the densely grafted side chains
adsorb, they experience steric repulsion
due to monomer crowding which creates
tension in the backbone. This tension,
which depends on the grafting density,
the side chain length, and the extent of
substrate attraction, effectively lowers the
energy barrier for dissociation, decreasing
the bond life time.[20] Thus, one may observe
amplification of bond tension from the pico-
newton to nano-newton range which facil-
itates thermal degradation considerably.
Meanwhile, in several works Panyukov
and collaborators[21,22] predicted and the-
oretically described the effect of tension
amplification in branched macromolecules.
They argued that the brush-like architec-
ture allows focusing of the side chain
Copyright � 2012 WILEY-VCH Verlag GmbH & Co. KGaA
tension to the backbone whereby at given
temperature T the tension in the backbone
becomes proportional to the length N of the
side chain, f � f0N.[21,22] The maximum
tension in the side chains is f0 � kBT=b with
kB -being the Boltzmann constant, and b -
the Kuhn length (or, the monomer dia-
meter for absolutely flexible chains).
The effect of adsorption-induced bond
scission might have important implication
for surface chemistry, in general, and for
specific applications of new macro- and
supramolecular materials, in particular, for
example, by steering the course of chemical
reactions. One may use adsorption as a
convenient way to exceed the strength of
covalent bonds and invoke irreversible
fracture of macromolecules, holding the
key to making molecular (DNA) architec-
tures that undergo well-defined fragmenta-
tion upon adsorption.
In the present talk we report on our
studies of chain fragmentation in desorbed
and adsorbed bottle-brush macromolecules
by means of a coarse-grained bead-spring
model and Langevin dynamics. In addition
to our initial investigation[23] which was
carried out at maximal grafting density
sg¼ 1.0 we report new simulation results in
which we examine the effect of varying
sg¼ 1.0 on the resulting rupture rate
distribution along the chain backbone. In
Section 2 we describe briefly our model and
then present our simulation results in
Section 3. A summary of our results and
conclusions is presented in Section 4.
Anticipating, one might claim that the
reported results appear in good agreement
with observations and theoretical predic-
tions.
The Model
We consider a 3D coarse-grained model of
a polymer chain which consists of L repea-
table units (monomers) connected by bonds,
whereby each bond of length b is described
by a Morse potential,
UMðrÞ ¼ Df1� exp½�aðr � bÞg2 (1)
, Weinheim www.ms-journal.de
Macromol. Symp. 2012, 316, 112–122114
with a parameter a � 1. The dissociation
energy of such bonds is D, measured in units
of kBT, where kB denotes the Boltzmann
constant and T is the temperature. The
maximum restoring force of the Morse
potential, fmax ¼ �dUM=dr ¼ aD=2, is
reached at the inflection point,
r ¼ bþ a�1lnð2Þ. This force fmax determines
the tensile strength of the chain. Since the
bond extension r – b between nearest-
neighbor monomers along the polymer
backbone in our 3D-model is always
positive, the Morse potential Eq. (1) is
only weakly repulsive and segments could
partially penetrate one another at r< b.
Therefore, in order to allow properly for
the excluded volume interactions between
bonded monomers, we take the bond
potential as a sum of UM(r) and the so
called Weeks-Chandler-Anderson (WCA)
potential, UWCA(r), (i.e., the shifted and
truncated repulsive branch of the Lennard-
Jones potential);
UWCAðrÞ
¼ 4"s
r
� �12� s
r
� �6þ 1
4
� �Qð21=6s� rÞÞ
(2)
with Q(x)¼ 0 or 1 for x< 0 or x� 0, and
" ¼ 1. The non-bonded interactions
between monomers are also taken into
account by means of the WCA potential,
Eq. (2). Thus the interactions in our model
correspond to good solvent conditions. The
length scale is set by the parameter s¼ 1
whereby the monomer diameter
b ¼ 21=6s � 1:12s.
In our MD simulation we use a Langevin
equation, which describes the Brownian
motion of a set of interacting particles
whereby the action of the solvent is split
into slowly evolving viscous force and a
rapidly fluctuating stochastic force:
m _v
iðtÞ ¼ �z~vi þ ~Fi
MðtÞ þ ~Fi
WCAðtÞ þ ~RiðtÞ:(3)
The random force which represents the
incessant collisions of the monomers with
the solvent molecules satisfy the fluctua-
tion-dissipation theorem hRigðtÞR
jdðt0Þi ¼
2zkBTdijdgddðt � t0Þ. The friction coefficient
Copyright � 2012 WILEY-VCH Verlag GmbH & Co. KGaA
z of the Langevin thermostat, used for
equilibration, has been set at 0.25. The
integration step is 0.002 time units (t.u.) and
time is measured in units offfiffiffiffiffiffiffiffiffiffiffiffiffiffiffiffims2=D
pwhere m denotes the mass of the beads,
m¼ 1. We emphasize at this point that in
our coarse-grained modeling no explicit
solvent particles are included.
Two side chains of length N are grafted
to every s�1g -th repeatable unit of the
backbone (except for the terminal beads
of the polymer backbone where there are
three side chains anchored). In this way
a grafting density sg, which gives the
number of side chain pairs per unit length
is defined. Thus the total number of
monomers in the bottle-brush macro-
molecule is M ¼ Lþ 2N½ðL� 1Þsg þ 2�.Because of the high grafting density, we
use rather short side chains N ¼ 1� 4 in
our simulations - Figure 1.
For the bonded interaction in the side
chains we take the frequently used Kremer-
Grest potential, UKGðrÞ ¼ UWCAðrÞþUFENEðrÞ, with the so-called ‘finitely-exten-
sible non-linear elastic’ (FENE) potential,
UFENEðrÞ ¼ �1
2kr2
0ln 1� r
r0
� �2" #
: (4)
In Eq. (4) k¼ 30, r0¼ 1.5, so that the
total potential UKG(r) has a minimum at
bond length rbond � 0.96. Thus, the bonded
interaction, UKG(r), makes the bonds of the
side chains in our model unbreakable
whereas those of the backbone may and
do undergo scission.
The substrate in the present study is
considered simply as a structureless adsorb-
ing plane, with a Lennard-Jones potential
acting with strength "s in the perpendicular
z–direction, ULJðzÞ ¼ 4"ssz
� �12� s
z
� �6� �
.
In our simulations we consider as a rule
the case of strong adsorption,
"s=kBT ¼ 5:0� 10:0.
The initially created configurations,
Figure 1 (left panel), are equilibrated by
MD for a period of time so that the mean
square displacement of the polymer center-
of-mass moves a distance several (3� 5)
, Weinheim www.ms-journal.de
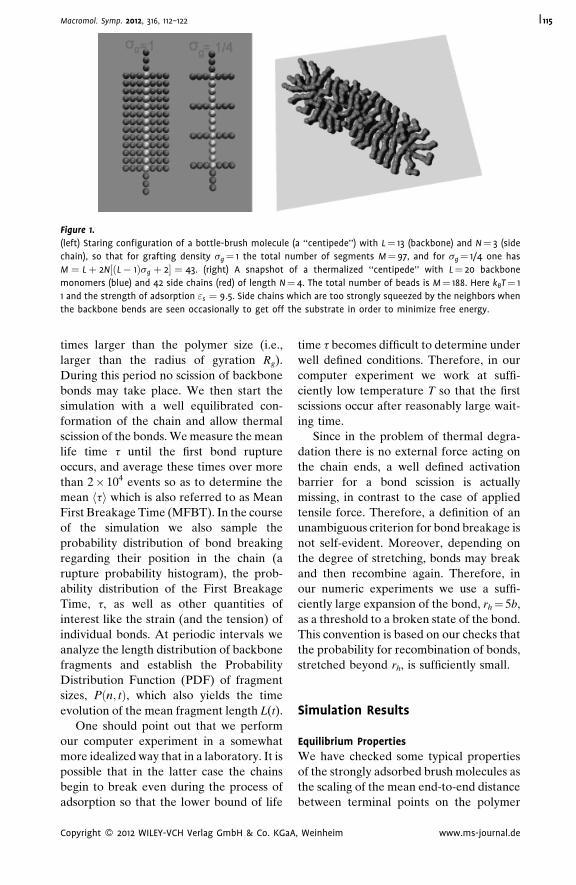
Figure 1.
(left) Staring configuration of a bottle-brush molecule (a ‘‘centipede’’) with L¼ 13 (backbone) and N¼ 3 (side
chain), so that for grafting density sg¼ 1 the total number of segments M¼ 97, and for sg¼ 1/4 one has
M ¼ Lþ 2N½ðL� 1Þsg þ 2� ¼ 43. (right) A snapshot of a thermalized ‘‘centipede’’ with L¼ 20 backbone
monomers (blue) and 42 side chains (red) of length N¼ 4. The total number of beads is M¼ 188. Here kBT¼ 1
1 and the strength of adsorption "s ¼ 9:5. Side chains which are too strongly squeezed by the neighbors when
the backbone bends are seen occasionally to get off the substrate in order to minimize free energy.
Macromol. Symp. 2012, 316, 112–122 115
times larger than the polymer size (i.e.,
larger than the radius of gyration Rg).
During this period no scission of backbone
bonds may take place. We then start the
simulation with a well equilibrated con-
formation of the chain and allow thermal
scission of the bonds. We measure the mean
life time t until the first bond rupture
occurs, and average these times over more
than 2� 104 events so as to determine the
mean hti which is also referred to as Mean
First Breakage Time (MFBT). In the course
of the simulation we also sample the
probability distribution of bond breaking
regarding their position in the chain (a
rupture probability histogram), the prob-
ability distribution of the First Breakage
Time, t, as well as other quantities of
interest like the strain (and the tension) of
individual bonds. At periodic intervals we
analyze the length distribution of backbone
fragments and establish the Probability
Distribution Function (PDF) of fragment
sizes, Pðn; tÞ, which also yields the time
evolution of the mean fragment length L(t).
One should point out that we perform
our computer experiment in a somewhat
more idealized way that in a laboratory. It is
possible that in the latter case the chains
begin to break even during the process of
adsorption so that the lower bound of life
Copyright � 2012 WILEY-VCH Verlag GmbH & Co. KGaA
time t becomes difficult to determine under
well defined conditions. Therefore, in our
computer experiment we work at suffi-
ciently low temperature T so that the first
scissions occur after reasonably large wait-
ing time.
Since in the problem of thermal degra-
dation there is no external force acting on
the chain ends, a well defined activation
barrier for a bond scission is actually
missing, in contrast to the case of applied
tensile force. Therefore, a definition of an
unambiguous criterion for bond breakage is
not self-evident. Moreover, depending on
the degree of stretching, bonds may break
and then recombine again. Therefore, in
our numeric experiments we use a suffi-
ciently large expansion of the bond, rh¼ 5b,
as a threshold to a broken state of the bond.
This convention is based on our checks that
the probability for recombination of bonds,
stretched beyond rh, is sufficiently small.
Simulation Results
Equilibrium Properties
We have checked some typical properties
of the strongly adsorbed brush molecules as
the scaling of the mean end-to-end distance
between terminal points on the polymer
, Weinheim www.ms-journal.de
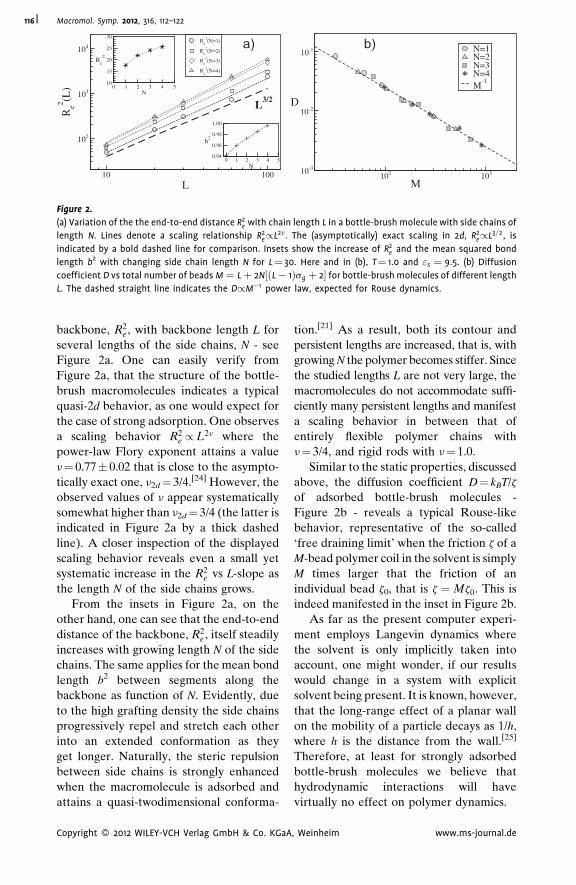
10 100L
102
103
104
Re2 (L
)
Re
2(N=1)
Re
2(N=2)
Re
2(N=3)
Re
2(N=4)
43210 5N
10
15
20
25
30
Re
2
43210 5N
0.94
0.96
0.98
1.00
b2
a) b)
L3/2
102 103
M10-3
10-2
10-1
D
N=1N=2N=3N=4M
-1
Figure 2.
(a) Variation of the the end-to-end distance R2e with chain length L in a bottle-brush molecule with side chains of
length N. Lines denote a scaling relationship R2e/L2n. The (asymptotically) exact scaling in 2d, R2
e/L3=2, is
indicated by a bold dashed line for comparison. Insets show the increase of R2e and the mean squared bond
length b2 with changing side chain length N for L¼ 30. Here and in (b), T¼ 1.0 and "s ¼ 9:5. (b) Diffusion
coefficient D vs total number of beads M ¼ Lþ 2N½ðL� 1Þsg þ 2� for bottle-brush molecules of different length
L. The dashed straight line indicates the D/M�1 power law, expected for Rouse dynamics.
Macromol. Symp. 2012, 316, 112–122116
backbone, R2e , with backbone length L for
several lengths of the side chains, N - see
Figure 2a. One can easily verify from
Figure 2a, that the structure of the bottle-
brush macromolecules indicates a typical
quasi-2d behavior, as one would expect for
the case of strong adsorption. One observes
a scaling behavior R2e /L2n where the
power-law Flory exponent attains a value
n¼ 0.77� 0.02 that is close to the asympto-
tically exact one, n2d¼ 3/4.[24] However, the
observed values of n appear systematically
somewhat higher than n2d¼ 3/4 (the latter is
indicated in Figure 2a by a thick dashed
line). A closer inspection of the displayed
scaling behavior reveals even a small yet
systematic increase in the R2e vs L-slope as
the length N of the side chains grows.
From the insets in Figure 2a, on the
other hand, one can see that the end-to-end
distance of the backbone, R2e , itself steadily
increases with growing length N of the side
chains. The same applies for the mean bond
length b2 between segments along the
backbone as function of N. Evidently, due
to the high grafting density the side chains
progressively repel and stretch each other
into an extended conformation as they
get longer. Naturally, the steric repulsion
between side chains is strongly enhanced
when the macromolecule is adsorbed and
attains a quasi-twodimensional conforma-
Copyright � 2012 WILEY-VCH Verlag GmbH & Co. KGaA
tion.[21] As a result, both its contour and
persistent lengths are increased, that is, with
growing N the polymer becomes stiffer. Since
the studied lengths L are not very large, the
macromolecules do not accommodate suffi-
ciently many persistent lengths and manifest
a scaling behavior in between that of
entirely flexible polymer chains with
n¼ 3/4, and rigid rods with n¼ 1.0.
Similar to the static properties, discussed
above, the diffusion coefficient D¼ kBT/z
of adsorbed bottle-brush molecules -
Figure 2b - reveals a typical Rouse-like
behavior, representative of the so-called
‘free draining limit’ when the friction z of a
M-bead polymer coil in the solvent is simply
M times larger that the friction of an
individual bead z0, that is z ¼Mz0. This is
indeed manifested in the inset in Figure 2b.
As far as the present computer experi-
ment employs Langevin dynamics where
the solvent is only implicitly taken into
account, one might wonder, if our results
would change in a system with explicit
solvent being present. It is known, however,
that the long-range effect of a planar wall
on the mobility of a particle decays as 1/h,
where h is the distance from the wall.[25]
Therefore, at least for strongly adsorbed
bottle-brush molecules we believe that
hydrodynamic interactions will have
virtually no effect on polymer dynamics.
, Weinheim www.ms-journal.de
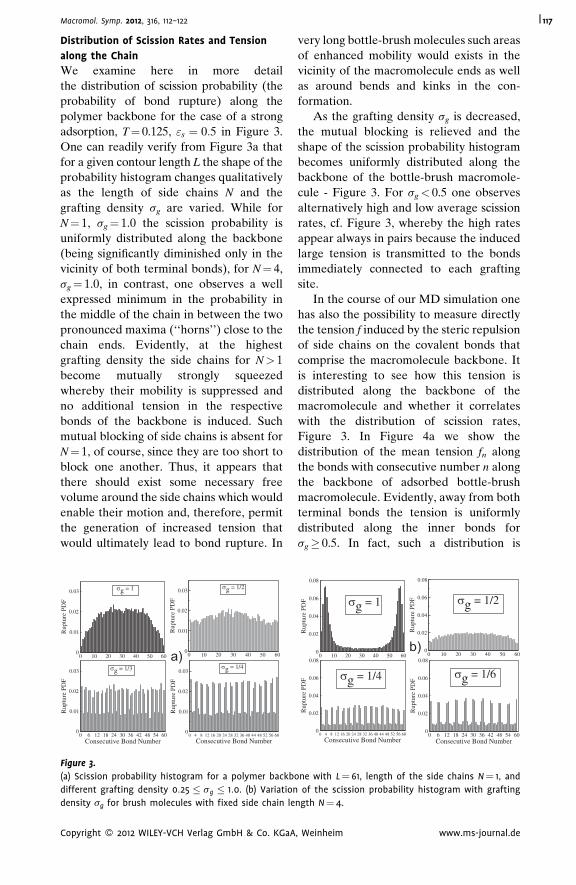
Macromol. Symp. 2012, 316, 112–122 117
Distribution of Scission Rates and Tension
along the Chain
We examine here in more detail
the distribution of scission probability (the
probability of bond rupture) along the
polymer backbone for the case of a strong
adsorption, T¼ 0.125, "s ¼ 0:5 in Figure 3.
One can readily verify from Figure 3a that
for a given contour length L the shape of the
probability histogram changes qualitatively
as the length of side chains N and the
grafting density sg are varied. While for
N¼ 1, sg¼ 1.0 the scission probability is
uniformly distributed along the backbone
(being significantly diminished only in the
vicinity of both terminal bonds), for N¼ 4,
sg¼ 1.0, in contrast, one observes a well
expressed minimum in the probability in
the middle of the chain in between the two
pronounced maxima (‘‘horns’’) close to the
chain ends. Evidently, at the highest
grafting density the side chains for N> 1
become mutually strongly squeezed
whereby their mobility is suppressed and
no additional tension in the respective
bonds of the backbone is induced. Such
mutual blocking of side chains is absent for
N¼ 1, of course, since they are too short to
block one another. Thus, it appears that
there should exist some necessary free
volume around the side chains which would
enable their motion and, therefore, permit
the generation of increased tension that
would ultimately lead to bond rupture. In
0 10 403020 50 600
0.01
0.02
0.03
Rup
ture
PD
F
4842363024181260 54 60Consecutive Bond Number
0
0.01
0.02
0.03
Rup
ture
PD
F
0 10 403020 50 600
0.01
0.02
0.03
Rup
ture
PD
F
60565248444036322824201612840
Consecutive Bond Number0
0.01
0.02
0.03
Rup
ture
PD
F
σg = 1 σg = 1/2
σg = 1/3 σg = 1/4a)
Figure 3.
(a) Scission probability histogram for a polymer backb
different grafting density 0:25 sg 1:0. (b) Variation
density sg for brush molecules with fixed side chain le
Copyright � 2012 WILEY-VCH Verlag GmbH & Co. KGaA
very long bottle-brush molecules such areas
of enhanced mobility would exists in the
vicinity of the macromolecule ends as well
as around bends and kinks in the con-
formation.
As the grafting density sg is decreased,
the mutual blocking is relieved and the
shape of the scission probability histogram
becomes uniformly distributed along the
backbone of the bottle-brush macromole-
cule - Figure 3. For sg< 0.5 one observes
alternatively high and low average scission
rates, cf. Figure 3, whereby the high rates
appear always in pairs because the induced
large tension is transmitted to the bonds
immediately connected to each grafting
site.
In the course of our MD simulation one
has also the possibility to measure directly
the tension f induced by the steric repulsion
of side chains on the covalent bonds that
comprise the macromolecule backbone. It
is interesting to see how this tension is
distributed along the backbone of the
macromolecule and whether it correlates
with the distribution of scission rates,
Figure 3. In Figure 4a we show the
distribution of the mean tension fn along
the bonds with consecutive number n along
the backbone of adsorbed bottle-brush
macromolecule. Evidently, away from both
terminal bonds the tension is uniformly
distributed along the inner bonds for
sg� 0.5. In fact, such a distribution is
0 10 403020 50 600
0.02
0.04
0.06
0.08
Rup
ture
PD
F
60565248444036322824201612840
Consecutive Bond Number0
0.02
0.04
0.06
0.08
Rup
ture
PD
F
0 10 403020 50 600
0.02
0.04
0.06
0.08
Rup
ture
PD
F
0 18126 3024 36 4842 54 60Consecutive Bond Number
0
0.02
0.04
0.06
0.08
Rup
ture
PD
F
σg = 1 σg = 1/2
σg = 1/4 σg = 1/6
b)
one with L¼ 61, length of the side chains N¼ 1, and
of the scission probability histogram with grafting
ngth N¼ 4.
, Weinheim www.ms-journal.de
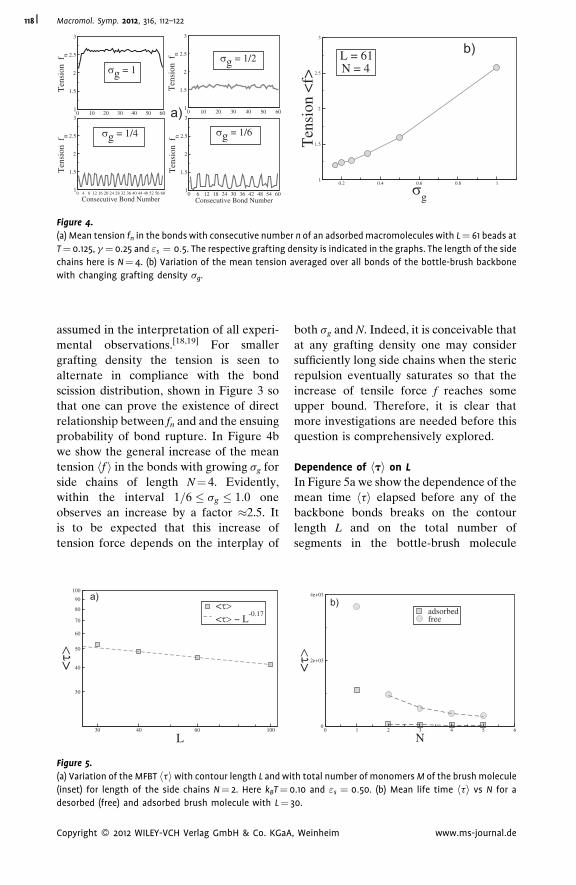
0 10 403020 50 601
1.5
2
2.5
3
Ten
sion
fn
60565248444036322824201612840
Consecutive Bond Number1
1.5
2
2.5
3
Ten
sion
fn
0 10 403020 50 601
1.5
2
2.5
3
Ten
sion
fn
0 18126 3024 36 4842 54 60Consecutive Bond Number
1
1.5
2
2.5
3
Ten
sion
fn
σg = 1σg = 1/2
σg = 1/4 σg = 1/6
a)
0.40.2 0.6 10.8
σg
1
1.5
2
2.5
3
Ten
sion
<f>
L = 61N = 4
b)
Figure 4.
(a) Mean tension fn in the bonds with consecutive number n of an adsorbed macromolecules with L¼ 61 beads at
T¼ 0.125, g ¼ 0.25 and "s ¼ 0:5. The respective grafting density is indicated in the graphs. The length of the side
chains here is N¼ 4. (b) Variation of the mean tension averaged over all bonds of the bottle-brush backbone
with changing grafting density sg.
Macromol. Symp. 2012, 316, 112–122118
assumed in the interpretation of all experi-
mental observations.[18,19] For smaller
grafting density the tension is seen to
alternate in compliance with the bond
scission distribution, shown in Figure 3 so
that one can prove the existence of direct
relationship between fn and and the ensuing
probability of bond rupture. In Figure 4b
we show the general increase of the mean
tension hf i in the bonds with growing sg for
side chains of length N¼ 4. Evidently,
within the interval 1=6 sg 1:0 one
observes an increase by a factor �2.5. It
is to be expected that this increase of
tension force depends on the interplay of
4030 60 100
L
30
40
50
60
70
80
90
100
<τ>
<τ><τ> ~ L
-0.17
a)
Figure 5.
(a) Variation of the MFBT htiwith contour length L and wi
(inset) for length of the side chains N¼ 2. Here kBT¼ 0
desorbed (free) and adsorbed brush molecule with L¼
Copyright � 2012 WILEY-VCH Verlag GmbH & Co. KGaA
both sg and N. Indeed, it is conceivable that
at any grafting density one may consider
sufficiently long side chains when the steric
repulsion eventually saturates so that the
increase of tensile force f reaches some
upper bound. Therefore, it is clear that
more investigations are needed before this
question is comprehensively explored.
Dependence of hti on L
In Figure 5a we show the dependence of the
mean time hti elapsed before any of the
backbone bonds breaks on the contour
length L and on the total number of
segments in the bottle-brush molecule
43210 65
N0
2e+03
4e+03
<τ>
adsorbedfree
b)
th total number of monomers M of the brush molecule
.10 and "s ¼ 0:50. (b) Mean life time hti vs N for a
30.
, Weinheim www.ms-journal.de
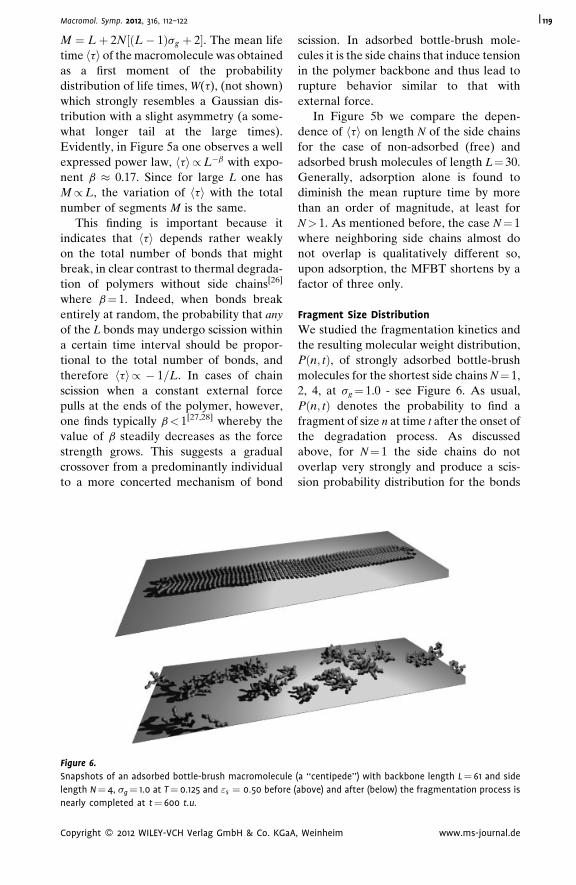
Macromol. Symp. 2012, 316, 112–122 119
M ¼ Lþ 2N½ðL� 1Þsg þ 2�. The mean life
time hti of the macromolecule was obtained
as a first moment of the probability
distribution of life times, W(t), (not shown)
which strongly resembles a Gaussian dis-
tribution with a slight asymmetry (a some-
what longer tail at the large times).
Evidently, in Figure 5a one observes a well
expressed power law, hti/L�b with expo-
nent b � 0.17. Since for large L one has
M/L, the variation of hti with the total
number of segments M is the same.
This finding is important because it
indicates that hti depends rather weakly
on the total number of bonds that might
break, in clear contrast to thermal degrada-
tion of polymers without side chains[26]
where b¼ 1. Indeed, when bonds break
entirely at random, the probability that any
of the L bonds may undergo scission within
a certain time interval should be propor-
tional to the total number of bonds, and
therefore hti/ � 1=L. In cases of chain
scission when a constant external force
pulls at the ends of the polymer, however,
one finds typically b< 1[27,28] whereby the
value of b steadily decreases as the force
strength grows. This suggests a gradual
crossover from a predominantly individual
to a more concerted mechanism of bond
Figure 6.
Snapshots of an adsorbed bottle-brush macromolecule
length N¼ 4, sg¼ 1.0 at T¼ 0.125 and "s ¼ 0:50 before (
nearly completed at t¼ 600 t.u.
Copyright � 2012 WILEY-VCH Verlag GmbH & Co. KGaA
scission. In adsorbed bottle-brush mole-
cules it is the side chains that induce tension
in the polymer backbone and thus lead to
rupture behavior similar to that with
external force.
In Figure 5b we compare the depen-
dence of hti on length N of the side chains
for the case of non-adsorbed (free) and
adsorbed brush molecules of length L¼ 30.
Generally, adsorption alone is found to
diminish the mean rupture time by more
than an order of magnitude, at least for
N> 1. As mentioned before, the case N¼ 1
where neighboring side chains almost do
not overlap is qualitatively different so,
upon adsorption, the MFBT shortens by a
factor of three only.
Fragment Size Distribution
We studied the fragmentation kinetics and
the resulting molecular weight distribution,
Pðn; tÞ, of strongly adsorbed bottle-brush
molecules for the shortest side chains N¼ 1,
2, 4, at sg¼ 1.0 - see Figure 6. As usual,
Pðn; tÞ denotes the probability to find a
fragment of size n at time t after the onset of
the degradation process. As discussed
above, for N¼ 1 the side chains do not
overlap very strongly and produce a scis-
sion probability distribution for the bonds
(a ‘‘centipede’’) with backbone length L¼ 61 and side
above) and after (below) the fragmentation process is
, Weinheim www.ms-journal.de
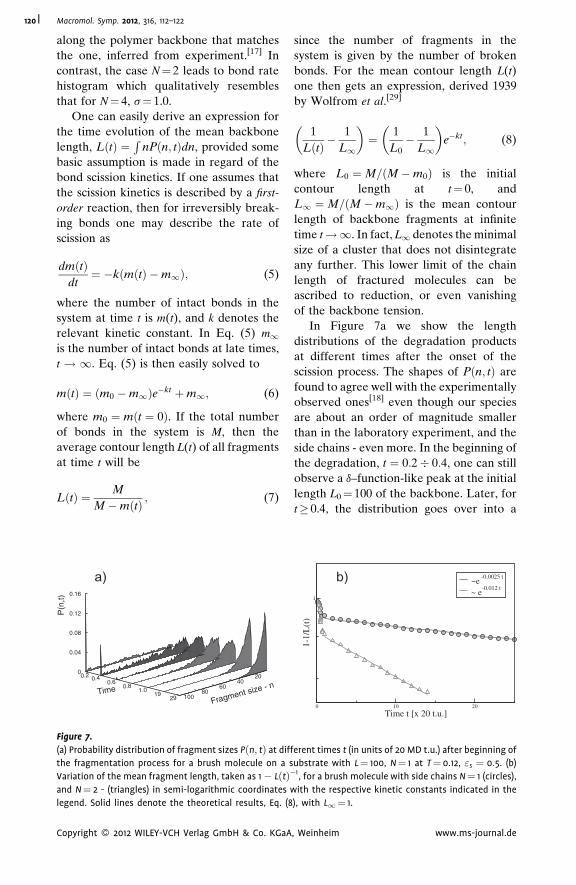
Macromol. Symp. 2012, 316, 112–122120
along the polymer backbone that matches
the one, inferred from experiment.[17] In
contrast, the case N¼ 2 leads to bond rate
histogram which qualitatively resembles
that for N¼ 4, s¼ 1.0.
One can easily derive an expression for
the time evolution of the mean backbone
length, LðtÞ ¼R
nPðn; tÞdn, provided some
basic assumption is made in regard of the
bond scission kinetics. If one assumes that
the scission kinetics is described by a first-
order reaction, then for irreversibly break-
ing bonds one may describe the rate of
scission as
dmðtÞdt¼ �kðmðtÞ �m1Þ; (5)
where the number of intact bonds in the
system at time t is m(t), and k denotes the
relevant kinetic constant. In Eq. (5) m1is the number of intact bonds at late times,
t ! 1. Eq. (5) is then easily solved to
mðtÞ ¼ ðm0 �m1Þe�kt þm1; (6)
where m0 ¼ mðt ¼ 0Þ. If the total number
of bonds in the system is M, then the
average contour length L(t) of all fragments
at time t will be
LðtÞ ¼ M
M �mðtÞ ; (7)
20 40
60 80
100
0
0.04
0.08
0.12
0.16
Fragment size - n
P(n
,t)
0.2 0.40.6
0.81.0
1929
Time
a)
Figure 7.
(a) Probability distribution of fragment sizes Pðn; tÞ at dif
the fragmentation process for a brush molecule on a s
Variation of the mean fragment length, taken as 1� LðtÞ�and N¼ 2 - (triangles) in semi-logarithmic coordinates
legend. Solid lines denote the theoretical results, Eq. (8
Copyright � 2012 WILEY-VCH Verlag GmbH & Co. KGaA
since the number of fragments in the
system is given by the number of broken
bonds. For the mean contour length L(t)
one then gets an expression, derived 1939
by Wolfrom et al.[29]
1
LðtÞ �1
L1
� �¼ 1
L0� 1
L1
� �e�kt; (8)
where L0 ¼M=ðM �m0Þ is the initial
contour length at t¼ 0, and
L1 ¼M=ðM �m1Þ is the mean contour
length of backbone fragments at infinite
time t!1. In fact, L1 denotes the minimal
size of a cluster that does not disintegrate
any further. This lower limit of the chain
length of fractured molecules can be
ascribed to reduction, or even vanishing
of the backbone tension.
In Figure 7a we show the length
distributions of the degradation products
at different times after the onset of the
scission process. The shapes of Pðn; tÞ are
found to agree well with the experimentally
observed ones[18] even though our species
are about an order of magnitude smaller
than in the laboratory experiment, and the
side chains - even more. In the beginning of
the degradation, t ¼ 0:2� 0:4, one can still
observe a d–function-like peak at the initial
length L0¼ 100 of the backbone. Later, for
t� 0.4, the distribution goes over into a
20100
Time t [x 20 t.u.]
1
1-1/
L(t
)
~e -0.0025 t
~ e-0.012 t
b)
ferent times t (in units of 20 MD t.u.) after beginning of
ubstrate with L¼ 100, N¼ 1 at T¼ 0.12, "s ¼ 0:5. (b)1, for a brush molecule with side chains N¼ 1 (circles),
with the respective kinetic constants indicated in the
), with L1¼ 1.
, Weinheim www.ms-journal.de
Macromol. Symp. 2012, 316, 112–122 121
rather flat one with a maximum around size
n � 20. Eventually, one ends up with a
rather sharply peaked Pðn; t ¼ 29Þ which
yields Lðt ¼ 600Þ � 7:5. At late times,
t> 600, the process goes steadily on until
finally the limit of L1¼ 1 is reached.
In Figure 7b we plot the evolution of the
mean fragment length L(t) by using the
quantity 1� LðtÞ�1 which is more appro-
priate in order to expose the true kinetics of
the fragmentation process. It is immedi-
ately seen from Figure 7b that the bottle-
brush fragmentation comprises a two-stage
process whereby an initial very short and
steep decay is followed by a much longer,
albeit slower, one.
In view of Figure 7b one might assume
that the maximum tension along the brush
backbone, f � f0N,[21] depends implicitly
on L too. The tension is quickly relaxed
below a threshold fthðL;NÞ when the
backbone fragments get short enough so
that below a critical length Lth the side
chains experience much weaker steric
repulsion. In our computer experiments
with an initial length L0¼ 100 this happens
at Lth=L0 � 20% when N¼ 1, and at
Lth=L0 � 10% when N¼ 2. As expected,
Lth steadily decreases when the length of the
side chains grows, as our data on N¼ 3, 4
(not shown) suggest. For L Lth, the
fragmentation proceeds with a significantly
smaller kinetic constant. Such an effect has
not been reported in the laboratory experi-
ments[18,17] but it cannot be ruled out that
the observations there refer to the lengthy
secondary fragmentation whereas the
initial quick drop of the mean length L(t)
lasts too short so as to be detected.
One should note, however, that the
initial and the secondary fragmentation
processes can be represented as nearly
perfect straight lines in both normal
and semi-log coordinates. It appears, there-
fore, that the observed fragmentation
kinetics cannot be unambiguously qualified
as a first-order chemical reaction. As
expected, the rate of fragmentation is, of
course, much higher for the longer side
chains with N¼ 2. Moreover, one may
conclude that recombination of bonds
Copyright � 2012 WILEY-VCH Verlag GmbH & Co. KGaA
plays a negligible role during the degrada-
tion process.
Conclusion
In this work we have used a Langevin MD
simulation to model the process of thermal
degradation in strongly adsorbed bottle-
brush molecules. Our results confirm the
strong effect of adsorption on chain scis-
sion, due to strong increase in backbone
tension, predicted recently theoretically.[21]
This has been indeed observed in recent
experiments.[17–19] Since the chemical nat-
ure of the bonding interactions remains
unchanged, the observed adsorption-
induced bond cleavage is of purely mechan-
ical origin and is due to the conformational
changes which a branched molecule under-
goes when the energy gain by contact with
the surface confines the molecule in a quasi-
2D shape.
Among the main results of our investi-
gation one should note
s
, W
tatic (R2g;R
2e) and dynamics (diffusion
coefficient D) properties of strongly
adsorbed bottle-brush molecules on a
substrate reveal a typical behavior of
quasi-2D objects with scaling exponent
n¼ 3/4, characteristic for the Rouse
behavior of a polymer.
T
he mean life time of a bond htidecreases by more than an order of mag-nitude upon adsorption of a free bottle-
brush molecules on an adhesive surface.
T
he mean time hti before a bond breaksdecreases weakly with growing contour
length L of the backbone, hti/L�0:17,
and faster with the length of the side
chains, N. However, the studied lengths
N of the side chains are too short for a
definite scaling law to be established.
T
he probability distribution for rupturedepends on both grafting density sg and
length of the side chains N. It is sensitive
to the degree of steric repulsion of the
side chains - the shape of the scission
probability distribution resembles the
experimentally established one only for
einheim www.ms-journal.de
Co
Macromol. Symp. 2012, 316, 112–122122
weaker repulsion when the side chains do
not mutually block one another.
T
he length distribution Pðn; tÞ and theaverage length of fragments, L(t), during
the degradation process are found to
agree well with the experimentally
observed albeit the accumulated tension
in the backbone is released in two stages.
A very short interval of fast breakage
down is to about 20% of the initial mean
length of the molecule is followed by a
considerably slower process which lasts
until the chain breaks down to fragments
of the size of individual repeat units.
T
he measured variation of the meanfragment size with time appears compa-
tible with first-order reaction kinetics.
Generally, the reported results may be
regarded as a first attempt to get a deeper
insight in the fascinating behavior of
adsorbed brush molecules during fragmen-
tation. Of course, many aspects of the
adsorption-induced thermal degradation
may and should be explored in much more
detail than in the present study. We plan to
report on such investigations in a future
work.
Acknowledgements: One of us, A. M., appreci-ates support by the Max-Planck Institute forPolymer Research, Mainz, during the time of thepresent investigation. We acknowledge supportfrom the Deutsche Forschungsgemeinschaft(DFG), Grant No. SFB 625-B4, BI 314/23 andFOR 597.
[1] N. S. Allen, M. Edge, Fundamentals of Polymer
Degradation and Stabilization, Elsevier Applied
Science, New York 1966.
[2] G. Madras, J. M. Smith, B. J. McCoy, Ind. Eng. Chem.
Res. 1996, 35, 1795.
[3] M. Sarikaya, C. Tamerler, A. K. Jen, K. Schulten,
F. Banyex, Nature Mater. 2003, 2, 577.
[4] T. H. Han, J. Kim, J. S. Park, C. B. Park, H. Ihee, S. O.
Kim, Adv. Mater. 2007, 19, 3924.
pyright � 2012 WILEY-VCH Verlag GmbH & Co. KGaA
[5] R. Simha, J. Appl. Phys. 1941, 12, 569.
[6] H. H. G. Jellinek, Trans. Faraday Soc. 1944, 1944,
266.
[7] M. Ballauff, B. A. Wolf, Macromolecules 1981, 14, 654.
[8] R. M. Ziff, E. D. McGrady, Macromolecules 1986,
19, 2513. E. D. McGrady, R. M. Ziff, Phys. Rev. Lett. 1987,
58, 892.
[9] Z. Cheng, S. Redner, Phys. Rev. Lett. 1988, 60,
2450.
[10] E. Blaisten-Barojas, M. R. Nyden, Chem. Phys. Lett.
1990, em 171, 499. M. R. Nyden, D. W. Noid, J. Phys.
Chem. 1991, 95, 940.
[11] T. P. Doerr, P. L. Taylor, J. Chem. Phys. 1994, 101,
10107.
[12] M. Wang, J. M. Smith, B. J. McCoy, AIChE Journal
1995, 41, 1521.
[13] B. C. Hathorn, B. G. Sumpter, D. W. Noid, Macro-
mol. Theory Simul. 2001, 10, 587.
[14] P. Doruker, Y. Wang, W. L. Mattice, Comp. Theor.
Polym. Sci. 2001, 11, 155.
[15] C. F. Lee, Phys. Rev. E 2009, 80, 031134.
[16] S. Fugmann, I. M. Sokolov, Phys. Rev. E 2010, 81,
031804.
[17] S. S. Sheiko, F. C. Sun, A. Randall, D. Shirvanyants,
M. Rubinstein, H.-I. Lee, K. Matyjaszewski, Nature Lett.,
2006, 440, 191–1194.
[18] N. V. Lebedeva, F. C. Sun, H.-I. Lee,
K. Matyjaszewski, S. S. Sheiko, J. Am. Chem. Soc.
2007, 130, 4228–4229.
[19] I. Park, S. S. Sheiko, A. Nese, K. Matyjaszewski,
Macromolecules, 2009, 42, 1805–1807.
[20] M. K. Beyer, H. Clausen-Schaumann, Chem. Rev.
205(105), 2921, -2948.
[21] S. Panyukov, E. B. Zhulina, S. S. Sheiko, G. C.
Randall, J. Brock, M. Rubinstein, J. Chem. Phys. B
2009, 113, 3750–3768.
[22] S. Panyukov, S. S. Sheiko, M. Rubinstein, Phys. Rev.
Lett. 2009, 102, 148301.
[23] A. Milchev, J. Paturej, V. G. Rostiashvili, T. A. Vilgis,
Macromolecules 2011, 44, 3981.
[24] Carlo. Vanderzande, Lattice Models of Polymers,
Cambridge University Press, Cambridge 1998, Chapter
2, page 22.
[25] J. Happel, H. Brenner, in: Low Reynolds Number
Hydrodynamics, Kluwer, Dordrecht 1991.
[26] J. Paturej, A. Milchev, V. Rostiashvili, T. Vilgis,
J. Chem. Phys. 2011, 134, 224901.
[27] A. Ghosh, D. I. Dimitrov, V. G. Rostiashvili,
A. Milchev, T. A. Vilgis, J. Chem. Phys. 2010, 132, 204902.
[28] J. Paturej, A. Milchev, V. Rostiashvili, T. Vilgis, EPL,
2011, 94, 48003.
[29] M. L. Wolfrom, J. C. Sowden, E. N. Lassetre, J. Am.
Chem. Soc. 1939, 61, 1072.
, Weinheim www.ms-journal.de