,, iiiiiii!iiiiii!!!!iii[iiiiiiiiiiiiiiiiii!!!!!i!i!iiii · PDF fileFAN BEAM NAVIGATION...
205
iiiiiii!iii_: '_ii!!i!iiiiiiii!!!!ii_, :_iiii!iiiiiiiiiiiiii!_: \ :_iiiiiiiiiiiiiii!iiii_: \ :_iiiiiiiiiiiiiiiiiiii_: SATELLITE .... ,' .:i!_!_!iii!! .::::::::!::::: _, :_ii!iiiiiiii!i _ \ :_!iiiiiiiiiiiiiiiiiii_: .:_iiiiiiiiiiiiiiiiiii_: \ ':!?!!!!!??!i_i_ii!!:. ...................... ======================= ,, iiiiiii!iiiiii!!!!iii[iii "(coo_---------_ STI PRICE_S) $-- 1 .... Hard copy (HC) "_" _ -I ":ii[iiii_!i_iiii[iii_: CONTRACT ":_iiiiiiiii!!iiiiii!ii_:. Micror,che{MF)-_-- '(_'_ii NUMB'R.R ":_iiiiiiiiiiiiiiiiiiiiii_:. ....... i!iii!!_' Submittedto _iii !iiii_ EADQUARTERS NATIONAL AERONAUTICS AND SPACE ADMINISTRATION !_ii .:::::::::::::: ";:::;;::::::::: _::_;:: WASHINGTON, D.C. , :_i_!!_!_ : P HI__ LC O: I w°L.= _u.'m.c__ - DIVISION HOuB'rON . TEXAE https://ntrs.nasa.gov/search.jsp?R=19670022150 2018-05-17T13:37:22+00:00Z
Transcript of ,, iiiiiii!iiiiii!!!!iii[iiiiiiiiiiiiiiiiii!!!!!i!i!iiii · PDF fileFAN BEAM NAVIGATION...

iiiiiii!iii_:
'_ii!!i!iiiiiiii!!!!ii_,
:_iiii!iiiiiiiiiiiiii!_:\ :_iiiiiiiiiiiiiii!iiii_:\ :_iiiiiiiiiiiiiiiiiiii_:
SATELLITE .........,' .:i!_!_!iii!!.::::::::!:::::
_, :_ii!iiiiiiii!iiii__
\ :_!iiiiiiiiiiiiiiiiiii_: .:_iiiiiiiiiiiiiiiiiii_:\ ':!?!!!!!??!i_i_ii!!:. ......................=======================
,, iiiiiii!iiiiii!!!!iii[iiiiiiiiiiiiiiiiii!!!!!i!i!iiii"(coo_---------_
STI PRICE_S) $-- 1 ....
Hard copy (HC) "_" _ -I ":ii[iiii_!i_iiii[iii_:CONTRACT ":_iiiiiiiii!!iiiiii!ii_:.
Micror,che{MF)-_-- '(_'_ii NUMB'R.R ":_iiiiiiiiiiiiiiiiiiiiii_:.
.......i!iii!!_' Submittedto
_iii!iiii_i':i_EADQUARTERS NATIONAL AERONAUTICS AND SPACE ADMINISTRATION !_ii .:::::::::::::::ii..
";:::;;:::::::::
_::_;:: WASHINGTON, D.C. , :_i_!!_!_
: P HI__LC O: Iw°L.=_u.'m.c__ -DIVISIONHOuB'rON . TEXAE
https://ntrs.nasa.gov/search.jsp?R=19670022150 2018-05-17T13:37:22+00:00Z

WDL TECHNICAL REPORT 2962
FAN BEAM NAVIGATION SATELLITE STUDY
Volume III
ANTENNA STUDIES
13 July 1966
Contract No. NASW-1368
Submitted to:
Headquarters
National Aeronautics and Space Administration
Washington, D.C.
Prepared by
PHILCO CORPORATION
A Subsidiary of Ford Motor CompanyWDL Division
Palo Alto, Callfornia
WDL DIVISION
WIL-TR2962(III)
TABLE OF CONTENTS
Section
1 I-I
1-1
NAVIGATION SATelLITE ANTENNA STRUCTURAL ANALYSES
1.1 Introduct ion and Summary
1.2 Stresses and Deflections of DeHavilland Extendable
Boom Antenna; Circular Cross-Section with S11t 1-2
1.2.1 Axial Stress and Elongation 1-3
1.2.2 Bending Stresses and Lateral Deflections 1-5
1.2.3 Discussion 1-13
1.3 Stresses and Deflections of Cantilevered
Rectangular Honeycomb Boom Antennas 1-16
1.3.1 Stresses and Deflections Due to Lateral
Loading on Constant Section Beam 1-17
1.3.2 Stresses and Elongation Due to Longitudinal
Loading on Constant Section Beam 1-21
1.3.3 Deflections Due to Lateral Loading on a
Tapered Beam 1-23
1.3.4 Stresses and Elongation Due to Longitudinal
Loading on a Tapered Beam 1-26
1.3.5 Investigation of Preliminary Design with
Constant Cross-Sectlon 1-27
1.4 Stresses and Deflections of Guyed Rectangular
Honeycomb Boom Antennas 1-44
1.4.1 Computer Solutlon for Optimum Placement of
Single Guywire
1.4.2 Computer Model "B" of Propped Antenna
ANTENNA ELECTRICAL ANALYSIS
2.1 Introduction
2.2 Circular Waveguides
2.3 Rectangular and Elliptical Waveguides
2.4 Extendable Wavegulde Arrays
2.5 Array of Arrays
2.6 Fan Beam Analysls
2.7 A Measurement-Verification Scheme
2.7.1 Introduction
2°7.2 Technical Plan
1-47
1-48
2-1
2-1
2-2
2-3
2-4
2-9
2-17
2-21
2-21
2-23
ii
WDL DIVISION

Section
Appendix A
Appendix IS
Appendix C
Appendix D
wm.- 2962(ixl)
TABLE OF CONlqENTS (Continued)
2.7.3
2.7.4
2.7.5
2.7.6
2.7.7
Deflection Curve and Array DesiKn
Array Desisn for Pattern Computation
Results of Pattern Computation
Array Deslsn for Fabrication
Range Geometry and Measurement Errors
COMPUT_ SIMULATION
3.1 Introduct ion
3.2 Theoretical Development
3.2.1 Antenna Deflection
3.2.2 Cantilever Antenna
3.2.3 Guyed Antenna
3.2.4 Antenna Pattern Equations
3.2.5 Co-ordinate Transformation
3.2.6 Beam Maximum
3.2.7 Beam Deflection
3.3 Simulation
3.3.1
3.3.2
3.3.3
3.3.4
3.3.5
Prosram Descr ipt ion
Simulated Antenna Pattern
Deflected Antenna Effects
Sinsle Antenna Study
Double Antenna Study
Pass2-25
2-26
2-27
2-31
2-31
3-1
3-1
3-1
3-1
3-3
3-4
3-5
3-6
3-9
3-10
3-11
3-11
3-14
3-22
3-22
3-24
CIRCULAR WAVEGUIDE ARRAY INVESTIGATION
EXPERIMENTAL STUDY OF PHASE SHIFT VS. BENDING OF
RECTANGULAR WAVEGUIDE
DEFLECTED ANTENNA PATTERNS
DOUBLE ANTENNA PATTERNS
A-I
S-1
C-1
D-1
iii
LCO. WDL DIVISION

w .- 2962(zii)
LIST OF ILLUSTRATIONS
Figure
I-i
1-2
1-3
1-4
1-7
1-8
1-9
i-I0
1-11
1-12
1-13
2-1
2-2
2-3
2-4
2-5
2-6
2-7
2-8
2-9
2-10
2-11
Antenna Lateral Deflection at Spin Rate D = 180 rpw 1-29
Antenna Lateral Deflection at Spin Rate _ = 150 rpm 1-30
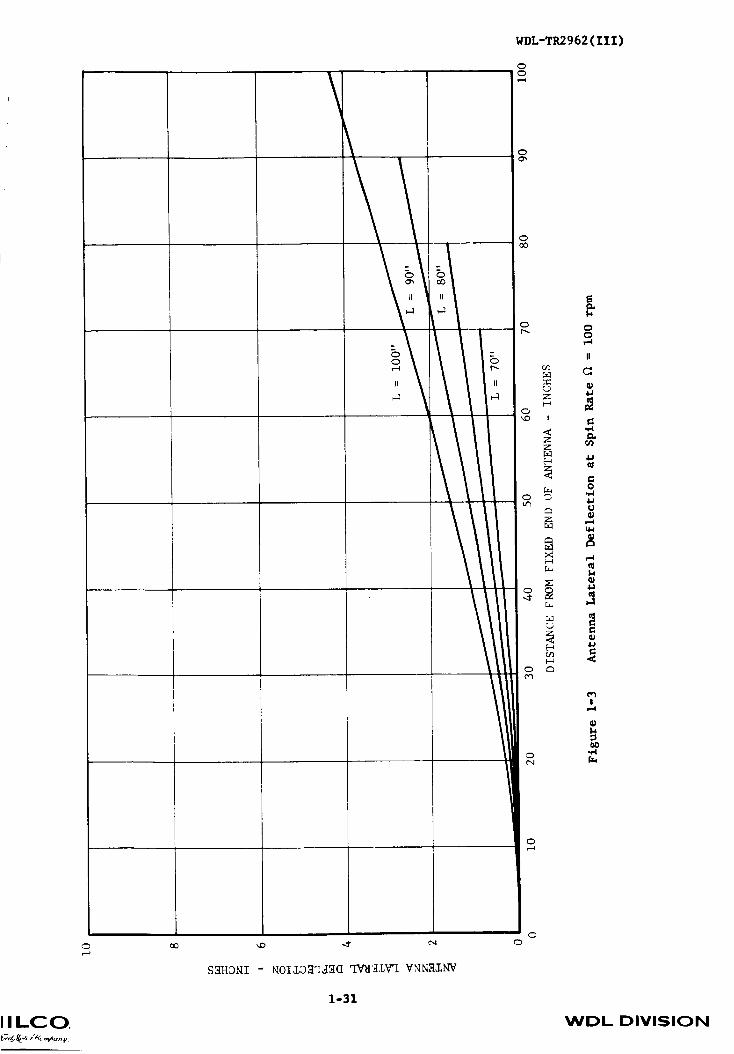
Antenna Lateral Deflection at Spin Rate D = 100 rpm 1-31
Maximum Lateral Deflection for Various Antenna Lengths 1-32and Spin Rates
Bending Stress vs Antenna Length 1-34
Deflected Shape for 100" Antennas Propped at 66, 70, 74, 1-49
78 inches, Spin Rate _ = 180 rpm
Deflected Shape for 90" Antennas Propped at 58, 62, 66, 1-5070, 74 inches, Spin Rate _ = 180 rpm
Deflected Shape for 80" Antennas Propped at 54, 58, 60 1-5162 inches, Spin Rate _ = 180 rpw
Deflected Shape for 70" Antennas Propped at 46, 50, 52, 1-5254 inches, Spin Rate _ = 180 rpm
Optimum Prop Locations for Minimum Deflectlonsp Spin 1-53
Rate _ = 180 rpm
Deflected Shape for 95.909" Antenna Propped at 1-55x = 72.421 inches, Spin Rate _ = 100 rpm
Shear Diagram for 95.909" Antenna Propped at x - 72.421 1-56inches, Spin Rate _ - 100 rpw
Moment Diagram for 95.909" Antenna Propped at x - 72.421 1-57inches, Spin Rate _ = i00 rpm
Telescoping Guides Cross Sections 2-7
Choke Joint Cross Sections 2-7
Telescoping Array 2-10
Center Feed Schematic 2-11
Linear Array Co-ordinates 2-13
Planar Array Co-ordinates 2-13
Planar Array of Arrays 2-16
Computation Co-ordinate System 2-18
0, (_ Angular Positions of Peak of Fan Beam, 2-22Undeflected (_ = 0) and Deflected Arrays(w-100,180 rpm)
Boresisht View from Source 2-24
Computed Voltage Patterns for Deflected and Undeflected 2-28
Arrays
iv
CO. WDL DIVISION

wm.- 2962(Ill)
2-12
2-13
2-14
2-15
3-1
3-2
3-3
3-4
3-5
3-6
3-7
3-8
3-9
3-10
3-11
3-12
3-13
3-14
3-15
3-16
3-17
3-18
3-19
3-20
A-1
A-2
A-3
A-4
LIST OF ILLUSTIt_TIONS (Continued)
Projection of Peak of Fan Beam on X-Z Plane
Deflection Curve for 100-Element Array (_- 100 rpm)and 40-Element Array
Fabrication Sketch-61otted Waveguide Antenna Array
Antenna Range Geometry
Position of Antenna Relative to Spin Axis
Antenna Co-ordinate System
System Geometric Relationships
Flow Chart of Beam Analysis ProEram
Broad Dimension View (5 - 90 °) of Undeflected Beam
Edge View of an Ideal Fan Beam
Contour Plot of Fan Beam
Beam Cross Section, Illustrating Defined Terms
"Top" View of Beam, Illustrating Defined Terms
Schematic View of a Beam Section
Relative Location of Various Beam "Centers" for
Undeflected Antenna
Diagonal (5 - 45 °) View of Broad Beam Profile
Dependence of Antenna Deflection on Spin Rate
Dependence of Antenna Deflection on Antenna Length
Dependence of Antenna Deflection on Mounting Angle
Deflection of a Guyed Antenna
Typical Plot Showing Residual Angular Deviation after
Best Linear Correction for Particular Minimum %
ResidualiA_ Due to Beam Non-Planarity Optimized
--8 (Synchronous Altltude)for Omtn
Resldual in ._ Due to Beam Non-Planarity Optimized
for 0ml n = 66 (5000 n. ml. Altltude)
Double Antenna Configuration Definition
Circular Wavegulde Slotted Line
Flanges
Slot Test Section
Rectangular to Circular Transition
v
2-29
2-30
2-32
2-34
3-2
3-7
3-8
3-12
3-15
3-16
3-17
3-19
3-19
3-20
3-21
3-23
3-25
3-26
3-27
3-28
3-29
3-30
3-31
3-33
A-2
A'3
A-4
A-5
WDL DIVISION

WDL-TE2962 (IXI)
A-5
A-6
B-la
B-Ib
B-2
C-1
throughC-24
C-25
C-26
C-27
9-1
]>-2
9-3
D-.4
9-5
]>-6
9-7
1>-8
I>-9
9-10
1),-11
9-12
]),,13
LIST OF ILLUSTRATIONS (Continued)
Probe Carriage
Circular WaveEuide Array Investigation Test Set-Up
Bendln 8 in E Plane
Bendin 8 in H Plane
Phase Shift Per Foot vs I/R for E and H Plane Bending
Unguyed Antenna Patterns
Guyed Antenna Patterns
Guyed Antenna Patterns
Guyed Antenna Patterns
Normal Cross Section Showin 8 Effects of Separation
and Misal igrenent
Normal Cross Section Showing Effects of Separation
and MisalIK_aent
Normal Cross Section Showing Effects of Separation
and Misalig_ment
Normal Cross Section Showing Effects of Separation
and Mlsaligmnent
Normal Cross Section Showing Effects of Separation
and MisaliEnment
Normal Cross Section Showing Effects of Separation
and Miaa118nment
Normal Cross Section Showing Effects of Separation
and Misal ignment
Normal Cross Section Showing Effects of Separation
and Misalismnent
Normal Cross Section Showin 8 Effects of Separation
and Misal Igmeent
Normal Cross Section Showing Effects of Separation
and Misa118nment
Normal Cross Section Showing Effects of Separation
and Misal ignment
Normal Cross Section Showing Effects of Separation
and Misalisnment
Normal Cross Section of Typical Interference Pattern
vi
A-6
A-8
B-5
B-5
B-7
C-2
throughC-25
C-26
C-27
C-28
])-.2
9-3
D-4
9-5
9-6
9-7
9-8
])-9
9-10
9-11
9-12
9-13
9-14
CO. WDL DIVISION

w-m.- 2962(zii)
F/_ure
D.-14
1)-15
D-16
D-17
D-18
D-19
D-20
D-21
1)-22
9,-23
D-24
LIST OF ILLUSTRATIONS (Continued)
Pa.e
Normal Cross Section of Typical Interference Pattern D-15
Normal Cross Section of Typical Interference Pattern D-16
Detail of Typical Interference Pattern D-17
Wide Range View Showing the Reference Envelope of the D-18Interference Pattern
Broad Beam Cross Section Showing How Misaligr_ent Causes D-19Interference in Long Dimensions
Broad Beam Cross Section of two Antennas with no D-20
Mlsalisrment
Normal Cross Section of Antenna Pattern with no D-21Misalismaent
Normal Cross Section of Antenna Pattern with no D-22
Misalisnment
Antenna Pattern Generated by a Sequence of Slot Pairs D-23
Antenna Pattern with Phase Shift at Midpoint D-24
Antenna Pattern with Phase Shift not at Midpoint D-25
Table
2-1
3-1
LIST OF TABLES
Slot Positions
Summary of Parametric Study
Data Summary
2-33
3-32
B-6
vii
WDL DIVISION

TWIK,-TR2962 (Ill)
The primary loads imposed on the boom antenna are due to the centrifugal
forces which occur during spinning of the satelllte. Structural analyses
were performed on several boom antenna configurations under consideration
for possible application in a navigation satelllte. For each configuration
stresses and deflectlons were determined for various lengths of antennas mounted
on satellltes spinning in the range of 100 to 180 rpm.
An extendlble DeHavilland boom structure was Inltlally considered because
of its simpliclty and compactness. Calculations shoed that very large
bending stresses and deflections and large torsional stresses and rotations
occur at the spin rates under consideration. In addition, it was also
shown that such a structure would have a local instability problem because
of the thinness of the tube Walls. This structure can only be used by
drastically reducing tb_ spin rate. Such a restriction is unwarranted
because of other considerations.
Next, a rectangular honeycomb sandwich beam cantilevered antenna was
examined. Such a section is inherently stronger and stiffer than a
DeHavilland beam. As one might expect, the most severe loads occur with
the longer antennas and the higher spin rates. Under the maximum loads
the stresses and deflections are rather high but they can be reduced by
considering slightly shorter antennas or lower spin rates. Hence, it was
judged that this structural configuration is feasible.
To improve the structural performance of the cantilever beam, the use of
intermediate supports in the form of g_y wires was investigated. Stresses
and deflections were greatly reduced from those of the pure cantilever,
but this configuration is mechanically more complicated.
viii
LCO. WDL DIVISION

WDL-TR2962 (III)
Thus, two feasible structural configurations were identified: the
cantilevered honeycomb beam and the guyed cantilevered beam. The choice
will naturally be determined by the electrical performance requirements of
the antenna. If a shorter antenna or lower spin rate is allowable, then
the cantilever beam would be the logical choice. On the other hand, if
deflections are large enough to cause excessive degradation in electrical
performance, then the guyed configuration must be used.
The electrical performance of deformed antennas was evaluated for several
antenna lengths and spin rates as well as the guyed and unguyed configurations.
It was found that for combinations of spin rate and antenna length such
that the antenna was deflected no more than 3 ° (defined as the arc tangent
of the deflection over the antenna length), an unguyed antenna performs as
well as a guyed antenna. This is due to the fact that although the fan
beam is deflected it remains substantially planar for small antenna
de fle ct ions.
A lower bound on spin rate is imposed by satellite stability considerations
and antenna deflection imposes an upper bound. Similarly, suitable beam
definition requires that an antenna be at least a minimum length and
deflection considerations impose a maximum length. The parametric
evaluation performed shows that an unguyed antenna between 40 and 100 inches
in length mounted on a satellite spinning between 100 and 120 rpm will
give satisfactory electrical performance.
ix
WDL DIVISION

W'DL-TR2962(III)
SECTION I
NAVIGATION SATELLITE ANTENNA STRUCTURAL ANALYSES
i.I INTRODUCTION AND SUMMARY
This section contains structural analyses performed on several configura-
tions of boom antennas for possible application in a navigation satellite
system. Antenna lengths up to I00 inches mounted on spacecrafts spinning
in the range of I00 to 180 rpm are investigated.
In Section 1.2 a DeHavilland extendible boom antenna with circular cross
section and lengthwise sllt is examined. Analysis shows that stresses and
deflections are several orders of magnitude too high.
A rectangular honeycomb cantilevered antenna is analyzed in Section 1.3.
Calculations show that deflections and stresses are somewhat high but this
configuration is structurally feasible.
To provide decreased deflections for electrical reasons, a guyed antenna is
considered in Section 1.4. Deflections and stresses are well within
allowable limits and it seems that this is the best theoretical solution.
However there are some mechanical problems associated with the deployment
of guyed structures. It appears that a detailed deployment study would
help to delineate the trade-offs involved.
1-1
WDL DIVISION

WI)L-TR2962(III)
1.2 STRESSES AND DEFLECTIONS OF DE HAVILLANDEXTENDABLE BOOM ANTENNA;
CIRCULAR CROSS-SECTION WITH SLIT
_ OJ, RAD/SEC
21rN
60
N, RPM
ANTENNA
x
The antenna will experience centrifugal forces due to the spacecraft spin
rate w, rad/sec.
SPIN AXIS
a_ NOTE: Loadin_ is equivalent to0.284 (N/100) z g's per inch ofdistance from the spin axis.
At 180 RPM this is 0.92 g/inch.
p = p(a + x sin ¢)_2
p is mass per unit length of antenna
_A Y = specific weight of material, lb/in 3
P = 386 A = area of cross-sectlon, in2
1-2
CO. WDL DIVISION
WDL-TP,2962(III)
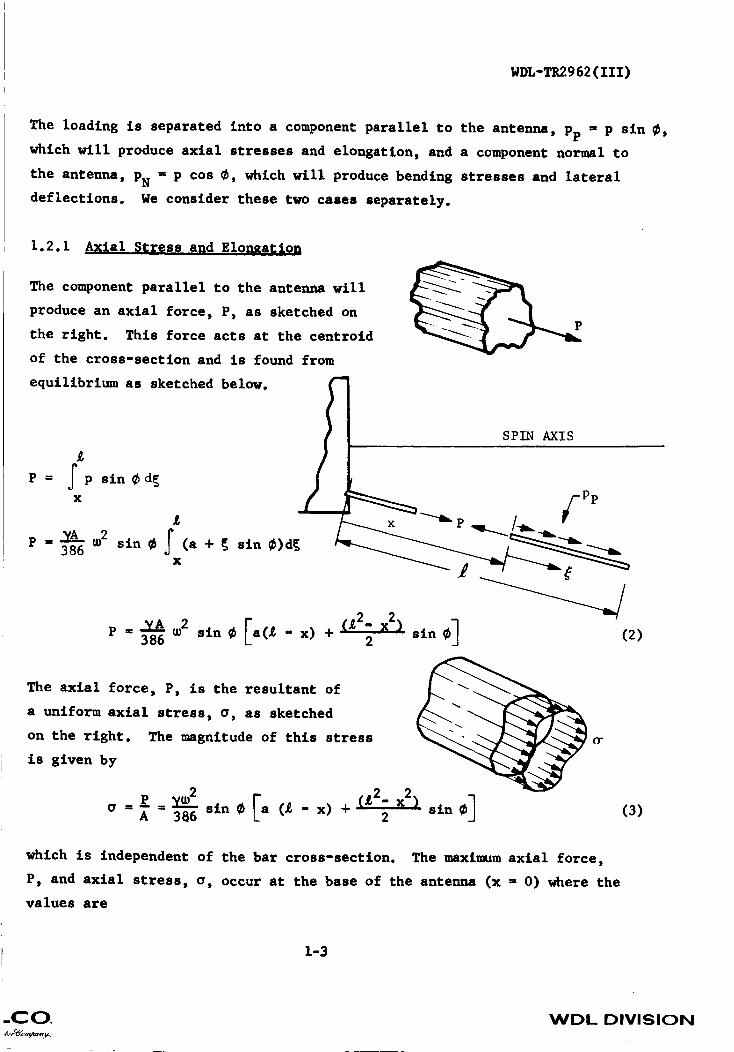
The loading is separated into a component parallel to the antenna, pp = p sin 0,
which will produce axial stresses and elongatlon, and a component normal to
the antenna, PN = p cos 0, which will produce bending stresses and lateral
deflectlons. We consider these two cases separately.
1.2.1 Axlal Stress and Elon2ation
The component parallel to the antenna will
produce an axial force, P, as sketched on
the right. This force acts at the centrold
of the cross-sectlon and is found from
equilibrium as sketched below.
P = _ p sin 0d_
X
p =YA ®2386 sin 0 (a + { sin 0)d{
= 386 sin 0 a(L - x) + (_2. x 2) sin 0 (2)2
The axial force, P, is the resultant of
a uniformaxial stress, a, as sketched
on the right. The magnitude of this stress
is given by
o = =z/sin0FaA 386 L
(it
- x) + (j2. x 2) sin 0]2 (3)
which is independent of the bar cross-section. The maximum axial force,
P, and axial stress, o, occur at the base of the antenna (x = 0) where the
values are
1-3
-COo WDL DIVISION

WDL-TR2962(III)
Pmax
omax
386(4)
(5)
EXAMPLE
= 0.285 Ib/In 3 (steel)
H
ffi 45 ° , a=0
U0 =_0 N
15,000
i0,000
5,000
max 386 2 0
_R_cy ffi 202 _max ,- I00 I00
0
f180 RPM
_/' 150 RPM
,i00 RPM
i00 200 300 400 500 INCHES
i0 20 30 40 FEET
BOOM LENGTH, L
(7The axial elongation, 6 is obtained by integrating the strain, ¢ = _, over
the length of the bar
Cr _ sin _ a (9. - x) + 2 sin _ dx6 _' _ dx ffi 386 E
s- _ si_ [ax(_- _ ) + _ (L2- _) sln_]386 E
(6)
The maximum elongation, which occurs at the outer end, (x = _), is given by
_max = 386 E 3
Note that, as for the stress, the axial elongation is independent of the
cross section.
1-4
,CO.
L__
WDL DIVISION

y = 0.285 ib/in 3
E = 30xlO 6 Ib/In 2(steel)
(6 = 45 °, a = 0
0.20
Z
0.I0H
r_
zo
0
max 386 _ N2_3 i (.707)2 0= 3-_x106 3 e
0
6 = .00045_)2_ _ ) 3max I00
i00
w
i0
WDL-TR2962(III)
_80 RPM
'150 RPM
i00 RPMP
200 300 400 500 INCHES
I I w
20 30 40 FEET
BOOM LENGTH, FEET
1.2.2 Bendln_ S$_esses a_d Lateral Deflections
The load component normal to the boom will produce moment and shear force
stress resultants as sketched below. These resultants may be found from
V
M
equilibrium wlth the result
L L
= 386 cos (6X X
(a + _ sin (6)_ dE
LCO.
1-5
WDL DIVISION

M _A_ _2 [a_+_3- _3= 386 cos _ 2 - 3 sin _]
tV = _ PN d_ = _A w2386 cos _ (a + _ sin _)dgX X
= 386 cos _ a (9, - x) + _2.2 x2 sin
WDL-TR2962(III)
(8)
(9)
At the base of the antenna, where these are maximum, we have
IsMmax 386 cos _ _ + 3 (to)
= 7A oo2j2 [ sin_ ]Vmax 386 cos _ _ + 2 (11)
We consider two cases for a circular tube with a sllt:
Case I The slit is in the plane
of the load.
Case 2 The slit is perpendicular
to the plane of the load.
.,
TD
SLIT
A = 7rDt = 71"I T D3t
_ase I Sl_t _n the plaBe of Loading
In this case the loading occurs in a
plane of symmetry for the section, hence
the moment and shear resultant act at
the centroid of the section as sketched
on the right. The slit is shown on the
outside, but may be on the inside with
the same results.
i-6
LeO. WDL DIVISION

WDL-TR2962 (III)
_e bending moment results from axial
:resses, G, as sketched on the right.
_e stress is a maximum at the base of
_e antenna and at the outer most points
=om the neutral axis. We have
max I
0"max
Mma x (D/2) = (D]2)
7T
g3t
®2L3 a386 cos _ _ + 3 2
= 386 D cos ¢ _ + (12)
)TE: Independent of the tube thickness t.
200,000
ruMPLE
y = 0.285 Ib/in3(steel) H
i ¢ = 450, a = O, D = I" b_
= 0_285_ 2_ 2 707)2 _max 386 _ N2_3(" 3
_ax = 54,000_-JN--_2_ L-_--) 3i00 I00
i
he shear force results from shear
tresses as sketched on the right.!
he stress is a maxlmumat the base
f the antenna and at the netrual axis.
i00,000
0
0
180 i00
-/J
///I00
i0
e have
q-max
2V
A = 386 cos ¢ _" +
EE: Independent of cross section dimensions.
RPM
50 RPM
/J
200 300 400
20 30
BOOM LENGTH
r20 RPM
/
(13)
i0 RPM
500 INCHES
w
40 FEET
1-7
WDL DIVISION

40,000
30,000
EXAMPLE H
20,000
y = 0.285 ib/in3(steel)
¢ = 45 °, a 0= I0,000
_. = 02.._.2_85 C 2.W )2N2_2 ( 707)2 0max 386 60 " --"
/ o 0ov = 405 < ..L • i
max lO0 I--_ 0 I0
WDL-TR2962 (III)
200 300 400 500
i w |
30 40 50
BOOM LENGTH
180
_M
150
/ _M
i00
RPM
INCHES
FEET
The bending deflection, y, is obtained from the equation
3
= -- = w cos ¢ a x + __ sin ¢
dx 2 EI 386 E _ D3t 2 3
dv
Integrating and noting the boundary conditionS_x = 0 and y = 0 at x = O,
we obtain
cos 3 2 " 2"0 )] (14)
The maximum deflection, at the outer end of the antenna x ffi_,
= 8y_2 _5 [ 5a 3 ]Ymax 386 E D2 cos _ _ +_ sin
NOTE: Independent of tube thickness.
is
(15)
1-8
ILCO. WDL DIVISION

, XAM E
Y = 0.285 lb/in 3 _ (steel)
E = 30 x 106 lb/in2J
¢ = 45 ° , a = 0, D = 1"
= __ 2_2 _2,5 (.707)2 6Ymax 386 60 30x106
Ymax 16.2 _ ___ _2_ , 5= lOO
Z50
0H
e. 40C.D
_ 30
i.-I
10
WDL-TR2962 (III)
./]/i00 200 300 400 500
i0 20 30 40
INCHES
FEET
BOOM LENGTH
For Case I, the loading occurs in a plane of symmetry of the cross section,
hence there will be no twisting or torslonal stresses.
End of Case I
Case 2 Sllt Perpendicular to the Plane of Load_n_
For Case 2 the loading occurs in a plane that is not a plane of symmetry
for the cross section. In this case the shear resultant, V, must act at
the "shear center" of the cross section in order to have pure bending without
twisting. However, the centrifugal loading provides a shear resultant which
acts at the centrold of the section. Transferring the shear resultant to the
1-9
LCOo WDL DIVISION

WDL-TR2962(III)
shear center, we introduce a torque T ffi Ve, which will produce torsional
shear stresses and twisting of the beam.
T = Ve
C represents centroid position
S represents shear center
For Case 2, the axial stresses and elongations are unchanged and remain as
given by Equations (2) through (7). The bending moment and shear force
expressions are unchanged and remain as given by Equations (8) through (11).
The torque resultant, T, is obtained easily as
386 cos _ a(_ - x) + _2. x22 sin # . (16)
At the base of the antenna T will be maximum and we have
Tmax = Vmax e =7Ae w2£ 2 E a si2_ _386 cos _ _ + (17)
The bending stresses and lateral deflections [Equations (12), (14) and (15)]
remain unchanged, but we must develop new equations for the shear stresses
and torsional deflections.
i-I0
WDL DIVISION

The bending shear stresses may be found from equilibrium of a small portion
of the beam as shown below.
8 X
From Force Equilibrium in the x-direction: 7 = - _2 frO _xb_dO
The bending stress, cr, is given by
= sin eI
Hence
0
sin 0 de
dM
Integrating and noting_x = -V, we have
2VT = ¥(1-cose)
This distribution is sketched to the
right. It is a maximum for V = V_BaX'
[Equation (II)] and 8 = 180 ° , in which
case we have
=_w2£ 2max 386
(18)
i-ii
WDL DIVISION
WDL-TR2962(III)
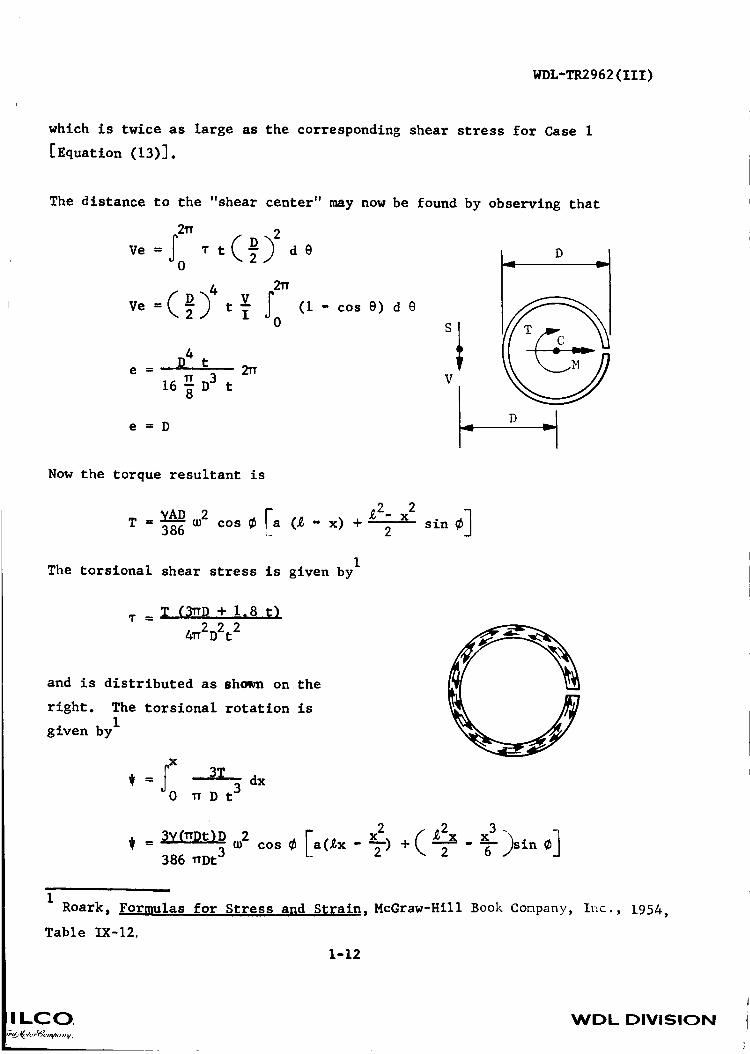
which is twice as large as the corresponding shear stress for Case 1
[Equation (13)].
The distance to the "shear center" may now be found by observing that
0
2_
(7 sD4 t
e -_- --
D316 t2_
e=D
(I - cos 8) d 8
Dv
V
Now the torque resultant is
T _ w2 F= 386 cos ¢ a (_ - x) + 2 sin ¢}
iThe torsional shear stress is given by
T (3_D + 1.8 t)
4_2D2t 2
and is distributed as shown on the
right. The torsional rotation is
igiven by
x
_=_'0 3T dx_Dt 3
# = 37(_Dt)D W2 cos ¢ a(£x - ) + - -- sin ¢
386 _Dt 3 2 6
IRoark, _ormulas for Stress and Strain , McGraw-Hill Book Company, Irlc., 1954,
Table IX-12.
1-12
I LCO. WDL DIVISION

WDL-TR2962 (III)
Atx=%
Smax ffi_ tv2_3 _386 t2 cos ¢ [ _-I- 3
The torsional stress and deflection formulas are valid only for small
displacements and neglect the effects of end constraint. Because the
boom is very flexible in torsion, a large deflection torsional theory
is needed. This is not developed since the results so far suggest that
the DeHavilland boom approach is not promising.
End of Case 2
1.2.3 Discussion
a. The results indicate very large bending stresses and deflections
and, although not fully developed, very large torsional stresses
and rotations, in the boom lengths of I0 to 40 feet. The
stresses and deflections are too large by several orders of
magnitude. It is concluded that the thln-walled DeHavilland
booms do not appear feasible for this application.
ha As expected, the longitudinal stresses and deflections are
small compared to the bending and torsional stresses and
deflections.
Co The theory and results presented here are based upon assumptions
of linear, small displacement theory. The results are inaccurate
for increasingly larger displacements. However, the results do
indicate trends and may be used as gross measures for feasibility.
For accurate results, improved theories must be used, especially
for torsion, which include the following effects:
1-13
WDL DIVISION

WDL-TR2962 (III)
de
e.
f.
l. The effect of structural deflections upon load. The load
will increase as the boom deflects outwardly.
2. The coupling between axial forces and bending moments. This
is the consideration of the familiar P bending moment term.Y
3. The effect of axial stresses to support torque loads under
large rotations.
. The effect of cross section distortion under load. This
effect is of particular importance for very thin tube walls.
It is expected that the mode of failure for the boom under the
centrifugal loading will be local buckling, or crippling of the
thin tube wall. Crippling stresses vary depending upon the type
of material and the ratio D/t. Crippling stresses are not
accurately predicted analytically; the designer must rely upon
empirical data, which is scarce, or, preferably, perform structural
tests on sample tubes to establish design criteria. For the
DeHavilland booms D/t may vary from I00 to 500 which is quite high.
For such high ratios, crippling stresses will tend to be low, say
50,000 psi at best. From the curve on the first example of Case i,
a stress level of 50,000 psi will restrict the spin rate to I0 to
20 rpm for boom lengths of I0 to 40 feet. This spin rate is much
lower than presently envisioned (150 to 180 rpm).
The deflection limitations are not well defined presently, but
assuming a limitation of a few inched, the graph in the third
example of Case I suggests that the spin rate must be I to i0
rpm for i0 to 40 foot booms. Again, this spin rate is much
longer than presently envisioned.
The numerical results given here were based upon a steel boom
of uniform thickness. The results were relatively independent
of the cross section dimensions. Examination of the equations
for stresses and deflections suggests the following changes to
make the booms more attractive:
1-14
LCO WDL DIVISION

Wl)L-T]_962(III)
i. Use a stiffer, lighter material. Beryllium, with
V = 0.067 Ib/in 3 and E = 43 x I06 ib/in 2, may be the best
choice. It wlll provide an advantage of "285 _= 6 I..067 " =u
. A decrease in the spin rate, w_ is mandatory if the booms are
to be used. The spin rate is established from attitude sta-
bility criteria where the product lapin w must be larger
than a specified value. It may be worthwhile examining the
feasibility of increasing lapin in order to decrease _.
(lapin is the moment of inertia about the satellite spin
axis.)
. It may be profitable to use a boom with a tapering wall-
thickness. This will decrease the load, but will also
decrease the material available to carry the stresses and
provide stiffness. It may be that the net result is improved
performance. At least this should be examined.
1-15
WDL DIVISION

WDL-TR2962 (Ill)
1.3 STRESSES AND DEFLECTIONS OF CANTILEVERED RECTANGULAR HONEYCOMB BOOM
ANTENNAS
a
RAD/SEC
N, RPM
f BOOM ANTENNA
L
The antenna will experience centrifugal forces due to the spacecraft spin
rate _ Rad/Sec.
LCO
SPIN AXIS
-
1-16
WDL DIVISION

WDL-TR2962(III)
p is mass per unit length of antenna
P 386= Specific weight of material, LB/IN 3
A = Area of cross section, IN 2
As in Section 1.2, the loading is separated into a component parallel to
the antenna axis pp = p sin _, which will produce axial stresses and elong-
ation, and a component normal to the antenna axis, PN = cos _ which will
produce bending stresses and lateral deflections.
1.3.1 Stresses and Deflections Due _o Lateral Loadin_ on Constant
Section Beam
As a start we will consider a beam of constant section. The linearly varying
lateral load can be separated into a uniformly distributed load, PNl, and
a triangular load,PN 2
PNPN i PN 2
Beam deflections may be found by using the method of virtual work.
1-17
CO WDL DIVISION

WDL-TR2962(III)
---d_ _ PN LB/IN
M = "'ii
REAL LOAD SYSTEM
m= I
The deflection _i at any point, x, along the length of the beam due to
pN I is
L
61 = _ EZX
L _2
Sl I__ _ PN__A__t= El 2 (g - x)dX
E = Youngs Modulus
l = Moment of Inertia
L = Length
= 2El = 4 " 3 xX
1-18
-II LCO.WDL DIVISION

WDL-TR2962(III)
PN I
61 = 2-_-_ [x4" 4L3x + 3L4 ] (20)
The rotation, 81, at any point, x, due to pNI is
L _2 L
01 =I _ PNI PNI I _2 d _2 (1)d_ --2_.--iX X
= PNI ]Ol _ [L3" x3 (21)
From Eq. (19) it is evident that
PN I
PN 2
n2= p a cos
= p(L - x)_ 2 sin ¢ cos
(22)
(23)
The triangular load, ."P_2'as shown is
PN2 = C(L - _)
where C is a constant
1-19
ILCO. WDL DIVISION

WDL-'r_-962(nl)
C = P n2 sine cos
The moment M is
M= 2 + 3
Check:
sl{=o= o ; MI{=L=
The deflection 62 at any point x due to PN2 is
L
X
X
L
62 = E-_ 8 " 30 " 6 24 x
62 = pC_2 sin@120ElCOS_ [IIL5" 15L4x + 5Lx4 " x5]
The rotation at any point x due to PN2 is
L
2 3 " 8 12 x
X
(24)
82 = p_2j sin24 @Elc°s @_ _3L 4. 4Lx3+ x4 ]
(25)
Finally, of course, the total deflections and rotations due to the lateral
load is obtained by superposition.
6 = 61+ 82
8 = 01+ 821-20
WDL DIVISION
ILCO.

WDL-TR2962(XXI)
The bending moment at any section x is
M = pa cos _ _2 22
+ _ sin _ cos @ _26 (3Lx2" x3) (26)
The shear is
2
V p f_2 x= cos _ (ax + Lx sing - -_ sin _) (27)
Stresses are given by standard beam formulas
Mc V0fY =-- ; V =
I Ib
1.3.2 Stresses and Elongatio n Due to Longitudinal Loading on
Constant Section Beam
I SPIN AXIS
PPp
= p sin_
The equations for stress and elongation due to longitudinal loading were
developed in Section 1.2. These equations will be rewritten here because
of the change in reference of _ and x.
1-21
LCO. WDL DIVISION

W'D_-TR2962(III)
X
P=[0
X
0
X
p = p_2 [a_ sin _ + L_ sln2_ - d sln2_]2 0
p = p_2 lax sin _ + x<L- 2) sin2_](28)
pThe axial
stresses are given by _ where A is the cross sectional area.
the case of a honeycomb beam, A is the facing area.
o ]
In
(29)
The axial elongation is given by
L L
8 =]" g dg = AEX X
X
(30)
The maximum deflection occurs at the free end, (x = 0), and is
= T sln¢ +max AE _- (31)
1-22
II LCO. WDL DIVISION

WDL-TR2962(III)
1.3.3 Deflections Due _o La_egal Loading on a Tapered Beam
We now move on to consider a tapered cantilever beam under lateral loading
similar to that investigated in Section 1.3.1. The large end of the
tapered beam will logically be placed at the fixed end. In the analysis
the tapered beam can be treated as a series of beam elements of increasing
size.
f
If
A = INCREMENTAL
ELEMENT LENGTH
m = NO. ELEMENTS
The deflection is obtained by s_ing the contribution due to each element
m (_i+ A)
= 24 E _ _ii=l
(32)
(33)
_2 -- _2si"_ cos _ _ _1120 E Iii=l
(34)
(35)
NOTE: The equations in thls section assumes a linear mass distribution.
This may or may not be true in the practlcal case depending on how thebeam is designed. However, in the configuration now under consideration, thelateral loadlng is almost llnearly varying.
1-23
LCO. WDL DIVISION

WDL-TR2962 (Ill)
Upon closer examination of Equations (32), (33), (34), and (35)one sees
that the deflections and rotations are dependent on the ratio of density
to moment of inertia for each element and some function of the beam length.
Hencem
i=l II
(36)
To get a feel for how deflections and rotations are influenced by the taper
consider a honeycomb beam of width b, height h, and skin thickness t.
b
t
_- HONEYCOMB CORE
For such a section the mass per unit length, p, is
P = Pskin + Pcore
p = Yskin(h + b)2t + Ycorebh (37)
If Pcore << Pskln and b _ h and if t is constant along the length of the
beam, we can say
O ffif2(h) (38)
where f2 is some function.
by
The moment of inertia of the section is given
2th3 + bth2 (39)
1-24
LILCO. WDL DIVISION

WDL-TR2962(III)
Again for b _ h, and constant t along the beam length
I ffi f3(h 3) (40)
Using Equations (36), (37), and (40) one can deduce from this approximation
that beam deflections and rotations vary as I/h 2.
(41)
gl is another function.
Let us take a closer look at functions fl(_,L) and gl(I/h2) in Eq. (41).
Consider for the moment, only the deflection 81 due to lateral load pN I.
Consider in particular, only the contribution to 81 of the j-th
element of the beam. Thus, if the limits are substituted into Eq. (32)
choosing A small,
af_2c°s @ -_ [3(j + A) 4- 3J 4- 4x(j + A) 3- 4xj 3 ] .61(J) - 24 E lj
At the free end of the cantilever x ffiO, and
61(J)lx__O = _ PJ 3[(j + 5) 4- j4 ]24 E I.
Expanding into binomlnal series
(j + A)4. j4 =/+ 4_0+ 6_220j2+ 4Aj3_ 4Aj3
Substituting this into Eq. (41) we find 61 at the free end due to the J-th
element a function of j3/h2.
1-25
LCO. WDL DIVISION

WDL-TR2962 (Ill)
61(J)Ixffi0--g<_)
Hence for optimum distribution of materlal in the beam to minimize deflec-
tion at the tip the depth of the beam h should increase as _3/2. Obviously
this would lead to a beam which is deeper than it is long. We could con-
tinue and develop a similar expression for 82, but at this point we will
not pursue the optlmumbeam any further because:
a. A "beam" of such proportlona no longer can be treated by
beam theory.
b. Such a structure would be impractical for our application.
We will pursue a practical tapered beam with reasonable proportions.
1.3.4 Stresses and Elon_ation Due to Lon21tudlnal Loadln2 on
Tapered Beam
n
ffi " 2 (42)i--I _i
A)n
dA i 2
i=l _i
(43)
where n = number of elements between section x and the free end
m = total number of elements
i=n i=l
. d) .n"01A)
2 _i
(44)
1-26
llLCO. WDL DIVISION

WDL-TR2962(III)
1.3.5 _nvest_ation of Prelimlnerv Desi=n with Constant Cross Section
As a first try at a cantilever boom antenna we chose a honeycomb beam of
constant cross section as shown in the sketch• This will serve as a check
on the equations derived in Sections 1.3 to 1•3.4 and will also indicate
whether reasonable stresses and deflectlons are possible with a structure
of this type for our particular application.
2.50
,,,,.,,,,
///////Allllllll!
- " r ....
IIIIIIII.4
,I/ll/llJ
......... C.G.
......... e! _ r-+ IJ
'IIII_
.J
_///////J 'lllllV-_lllllllh iv11_izllJ'lll_Jf'7
1.25v
_-. 040
_-- .012
1.25
_3.1 LB/FT 3 ALUM HONEYCOMB
Calculation of center of gravity
-•625(i•25)(_)(I)(•312) + 2(•625)(.040)(.i0)(•312) + (I•35)(.040)(•I0)(•625)C.G. =
•0287
.004262C.G. =
.02807= .152" measured from center line.
Calculation of section properties:
I = 024(1•25)(1.25)2+ •080(.625)(•625)2+ '024(2'5)3 +• 12
.080(1.25) 3
12
I = .II07 in4
1-27
I LCO. WDL DIVISION

WDL-TIt2962 (III)
Z = I_I07 = .0886 In3.125
Askln = .024(1.25 + 2.50) + .080(.625 + 1.25) = .240 in2
A ffi2.5(1.25) - .625(1.25) = 2.344 in2core
3w ffi .1(.240) +_-_ (2.344) = .02807 lb/in
= w-x- lb.sec 2P 386
The lateral deflection is given by Equations (20 and (24).
= pG2si n _ cos8 _a_2c°s _ (x4- 4L3x + 3L 4) + (IIL 5" 15L4x + 5Lx 4- x 5)24 El 120 EI
Assume _ = 45°; a = 15" and let E = 107
8 = '02807(15)('707)_2 (x 4- 4L3x + 3L 4)
386(24)(107)(.1107)
+ ,02807(,50) _2 (llL 5. 15L4x + 5Lx 4- x 5)
386(120)(107)(.1107)
8 = .2902 x i0"i0_ 2 (x4- 4L3x + 3L 4)
+ .2737 x IO'I2D2(IIL 5- 15L4x + 5Lx 4- x5) (45)
The maximum lateral deflection occurs at x = 0, and is
= i0-I0 _2(.8706 x 10"IOL 4 + .03011 x L 5)max
(46)
1-28
WDL DIVISION

WDL-TR2962(III)
-.T
\
oO
S_HONI - NOIID.WZ_G q%'_Ivq VNN_IN_
Em.
co,.4
c
m
$ C =
z ._
o
u
4_
7
CD
CDO
1-29
LCO WDL DIVISION

WDL-TR2962(IIZ)
QO
O
O00
1
O
O
C_
OLt_
O
I--4O".I"
_t3O _'4
O
OI--4
8eL
Oit3
II
t_
e.
e_tt_
*J
O,Pl
rJ
t_
eq!
t_
O0
Or_
CO ,.O -.I" e-_
1-30
O
O
WDL DIVISION
IILCO.
\WDL-TR2962 (III)
0 00
S3HDNI " NOIID_U_NG TV_I31Vq VNNNIN_
1-31
00
0
0cO
0 0
m C
z ,1_
_ s G
Z
te_ UU
"_ II1
M _
m G
0 e'_
I
O _
0
00
WDL DIVISION

WDL-TR2962 (III)
14
12
r_
10Z
!
8
OI.--I
,-.16
I-I
20
J
180 RPM/
40 60 80 i00
ANTENNA LENGTH - INCHES
Figure 1-4 Maximum Lateral Deflection for Various
Antenna Lengths and Spln Rates
1-32
_H I LC O.
iI
WDL DIVISION

WDL-TR2962(III)
The maximum bending stress occurs at the fixed end and is
= p cos _ L2f]2<2 L ¢)amax Z + _ sin
= ,02807(.707)L2_ 2 _ 15 + Lmax 386(.0886) 2 _ (.707)
The stress is shown in Figure I-5 for various antenna lengths and spin
rates.
The curves in Figure 1-5 shows that bending stresses are rather high. In
addition, axial stresses will be superimposed. To get an idea of an upper
bound we will calculate the axial stresses at three spin rates for an
antenna length of I00 inches.
L2
amax = _A sin ¢ (aL + _- sin ¢)
For a = 15; L ffiI00
a ,02087 Q2max = 386(.240) (.707)(1500 + 5000(.707))
ffi0.8019 _2max
For I00 rpm: _ = 87.9 psimax
For 150 rpm: _ = 197.8 psimax
For 180 rpm: G = 284.9 psimax
It is apparent that axial stresses are small compared to bending stresses.
Although bending stresses are high they can be reduced by making the cross
section deeper or wider.
1-33
='H I LCO. WDL DIVISION

WDL-TR2962(III)
H
!
o3
o3
H
Z
H
60,000
50,000
40,000
30,000
20,000
!0,000
0
0 20
18o /
f40 60
ANTENNA LENGTH - INCHES
150 RPM
80 i00
Figure ]-5 Bending Stress Versus Antenna Length
1-34
_HI LCO. WDL DIVISION

WDL-TR2962(III)
In general, shear stresses in honeycomb sandwich beams are normally
carried by the core. However, because of the odd shape of the cross
section under consideration we should take a closer look at shear stresses.
A
S .
A
B
We know that the shear stress, 7, is given by
_=G7
where
G = shear modulus
7 = shear strain
Hence the shear force is
F=GyA
If _ unit shear strain is applied to the cross section the shear forces
in the core and facing are an indication of the relative shear stlffnesses
of the two components. Representative values of shear modulus for 3.11b/ft 3
core of 5052 or 5056 aluminum are shown below.
W
Typical Minimum
L Direction 41,800 psi 32,000
W Direction 22,000 16,000
For an average value of shear modulus
choose G = 28,000 psiC
1-35
LCO. WDL DIVISION

WDL-TR2962(III)
For unit slice dx
Ffacing = GF7 _ = 3.85 x 10⁶(1)(.024 x i) = .0924 x 106 Ib/in
F core = GC> AC = 28,000(1)(1.25 x i) = .0350 x 106 ib/in
Sectio_ _'B For unit slice dx
Assume all facing shear stress is carried by outer skins.
Ffacing = 3.85 x 10⁶(1)(.052 x i) = .2002 x I06 Ib/in
F = 28,000(1)(.625 x I) = .0175 x 106 ib/incore
The above calculations assume a uniform distirbution of shear stress within
the facing and core. Actually there will be some warping of the cross
section thereby causing some deviation from uniformity. This actual distri-
bution cannot be predicted by elementry beam theory. However it is apparent
in Section B-B that all the shear is carried in the facing. In Section A-A
approximately 75 percent of the shear is carried in the facing. For these
preliminary calculations we will assume that all shear is carried by the
facings and that the core serves only to support the facings.
The maximum shear force is
L 2V x = p_2 cos _(aL +_- sin _)
For 180 rpm, O = 18.85 rad/sec, and L = i00"
(.02087)(18.85)2(.707)
max 386(1500 + 5000(.707))
V = 68.387 Iblnax
1-36
.C O. WDL DIVISION

WDL-TP,.2962(III)
As an approximation of the maximum bending shear stress we can assume
that all the shear force is carried in the side facings, This should
be an upper bound number
v = V_L = 68,387 = 1140 psiapprox 2htf 2(2.5)(.012)
The shear stresses will be examined in more detail below.
In the following paragraphs the shear distribution in the facings and the
shear center will be determined. 2 Shown below is the assumed shear flow
directions for the cut-back section.
qlb a
J '
,] AI
AI
AI------_ --_ ---Jl
d e
h
L--qlq 2
g
f
X Z
I-Y
V= 1.0
I = 0. 1107
Vy i.0 _ZAqx = _Z _Z A= 0.1107
2
q = 9.0334_.ZA
Bruhn, E.F., "Analysis and Design of Flight Vehicle Structures,"
Tri-State Offset Co., Cincinnati, Ohio.
1-37
WDL DIVISION

WDL-TR2962 (TIT)
Starting at point a,
% = 9.0334(1.25)(1.25x .012) - .1694 1b/in
qc = .1694 + 9.0334(.625)(1.25 x .012) = .2541 Ib/in
qa = .2541 + 9.0334(-.625)(1.25 x .012) - .1694 lb/in
qe = .1694 + 9.0334(-1.25)(1.25 x .012) = 0
qf = 0 + 9.0334(-.9375)(.625 x .012) - -.0635 Ib/In
Starting at point h,
qi ffi 9.0334(.625)(.625 x .040) = .1411
qj = .14U + 9.0334(.3125)(.625 x .040) = .2117 Ib/in
qk = .2117 + 9.0334(-.3125)(.625 + .040) = .1411 1b/in
qf = .1411 + 9.0334(-.625)(.625 x .040) = 0
qg - -.0635 + 9.0334(-.3125)(.625 x .052) - -.1552
qh " -.1552 + 9.0334(.3125)(.625 x .052 = -.0635
qa " -.0635 + 9.0334(.9375)(.625 x .012) - 0
a
0.0635
0.25410.1552
0.0635
'HILCO.1-38
WDL DIVISION

NDL-TR2962(XII)
This cut-back shear flow pattern is obtained by assuming zero shear flow
at points a and h so that the problem is reduced or cut-back to one
that is statically determinate. We must now determine the two redundant
shear flows and superimpose them on the shear flow above.
The equation for angular twist per unit length, B, is
Z L_2AGe= qt
_--- t,I t
A m_
G =
L ffi
t ffi
enclosed area
shear modulus
length of shear flow data
thickness
AI = 2.50 x 1.25 = 3.125
A2 = 1.25 x -625 = 0.78125
2 .012 " .012 3 .012
-°_-_._C_ ) - .o_C_). _-.o_,,(_) ]_.012 .012 3 .052
+,,,(_) +G,+,,2)(_ ).012 .052
2AIGB 1 - 53.3114 + 544.8718 ql + 24.0385 q2 (47)
2 9040 .040 .052
2X.091
3 •052 .040 .052
2A2G82 ffi1.8098 + 24.038 ql + 86.538 q2 (48)
1-39
LCOo WDL DIVISION

WDL-TR2962 (fiX)
If the load is applled through the shear center, e is zero and hence
Equations (47) and (48) reduce to
544.8718 ql + 24.0385 q2 = -53.3114 (49)
24.038 ql + 86.538 q2 = -1.8098 (50)
Solving Equations (49) and (50),
ql ffi-.0981 Iblin
q2 ffi.006342 ib/In
Check: 24.038(-.09812) + 86.538(.006342) = -1.8058
O. 1560 I c I
0.0713
O. 724" I
. _ r _oo_
0.1474 0.006 _ _ 0.1616
/-- I_ ,_o._/_o I_ 'X
o.1474J" _'°_'t_
• 0.0981
Acttml _ FIR l_eTm
1-40
-I I LCO WDL DIVISION

WDL-TR2962(III)
Check: EV
.0713(2.50) + .0847('_')(2.50) + .1474(1.25) + .0706(_')(1.25)
+ .0981(1.25) + .0635(½)(1.25) + .1553(1.25)
+ .0917(3_)(1.25) = .9954_ 1.0
The exact shear stress distribution has now been established for a unit
shear force. From Page 37 the maximum shear force for an antenna of
I00 inch spinning at 180 rpm is Vma x = 68.387 lb.
Hence, the maximum shear stress is
.1616(68.387)
7h = .012= 920.9 psi '_, max
= ,2470(68.3871g .052 = 324.8 psi
= ,2180(68.387)Tj .040 = 372.7 psi
The moment of the shear flows about an arbitrary point must be balanced by
the moment of the externally applied point g,
2(.1474)(½)(.625)(.625) + (.1843 + .0688)(.625) - 2(.0981)(½)(.724)(1.25)
+ 2(.0713)(½)(.526)(1.25) + .1783(1.25)
+(.1412)(1.25) = e'
e' = .5670"
1-41
H I LCQ WDL DIVISION

WDL-TR2962 (III)
g
Shear Center Location
From Page 27, C. G. is located at .473" from point g. Hence, inertial
loads on the antenna would be applied at an offset of (.567 - .473) or
approximately .10 inches. This offset causes torsional stresses and
deflections.
We will now determine the torsional stiffness of this section. Recall
Equations (47) and (48) which are rewritten below.
2G81 ffi 17.0596 + 174.359 ql + 7.6932 q2 (51)
2G02 ffi 2.3163 + 30.766 ql + 110.761 q2
But 81 ffi 82. Equating and solving,
14.7433 + 143.593 qlq2 ffi 103.069
(52)
Substituting into Eq. (51) yields
7.70 x 10⁶ B = 18.160 + 185.077 ql
1-42
WDL DIVISION

WDL-TR2962(III)
For a unit rotation
ql = 0.41604 x 10⁵
Now substitute into the torque equation
T ffi2Alq I + 2A2q 2
T ffi 2(3.125)(.4160 x 105 ) + 2(.7813) < 14.7433 + 143.593(.3150103.069 _; 105) )
T = 0.3505 x 10⁶ Ib-ln/radlin Torsional stiffness
As a rough check consider a simple rectangular section as shown
1.25
_-- O. 015
2t2(a't)2(b't)2 _& 2t; a2_ 2Kffi
at + bt - 2t 2 a + b
= 2('015)(1"25)2(2"50)2 = .078123.75
T ffiKG0 = .07812(3.85 x 10⁶)(1) ffi.3008 x 106
To get an idea of the magnitude of the torsional rotations, consider an
upper bound torque of
TU. B. effiVma x
TU.B.= 68.387(.10) = 6.8387 Ib-ln
If this torque is applied at the tip,
@ TL = 6.8387(i00_KG .3505 x i0-
ffi.001954 rad = .112 °
Hence, torsional distortions of the antenna are small compared to bending
deflections. We will not derive the exact torsional equations.
1-43
I LCQ WDL DIVISION

WDL-TR2962 (XIX)
1.4 STRESSES AND DEFLECTIONS OF GUYED RECTANGULAR HONEYCOMB BOOM ANTENNAS
In this section we will investlgat boom antennas which are fixed at one
end, free at the other, and supported at intermediate points by guy wires.
As a start, we will consider a beam guyed by a single cable which is rigid
compared to the beam. Hence the problem reduces to one of a propped beam.
' _
Y
We can solve this problem by superimposing upon the results obtained in
Section 1.3, those deflections and stresses due to a concentrated reaction
R.
Consider the cantilevered beam loaded with reaction R.
L
mf I
w
1-44
_LCQ WDL DIVISION

Wl)L-TR2962 (III)
For 0 _ x _ m:
L L
Ill Ill
L3 3 mL2 3 xL 2 2 m2x]_[---'----+'----8= 3 3 2 2 2 +-_-+_xL-
L
R(_ - m)d_ =m Ill
(53)
(54)
For Ill_ x < L:
R(_ - Ill)(_" x)d_ =
L
X X
L3 3
(55)
(56)
Superimposing results from Section 1.3.1, the deflections and rotations for
the propped beam are:
For 0 _ x _ m:
24 El(x4. 4L3x + 3L4) + O_2sin _ ¢:o¢ _ (IIL5. 15L4x + 5Lx4. x5)
120 E1
+ R (2L 3. 3mL2. 3xL2+ 6und., - 3rex2+ ml3)6EI (57)
1-45
'H I LCQ WDL DIVISION

WDL-TR2962(III)
0 Pa_2¢°s ¢ (L3- x3) + P_" ¢ cos ¢= 6 EI 24 EI
+ .,L _2. 2_ + 2)2El
OL4-_.x3+_)
(58)
For m _ x _ L:
8 - P'_2':°"* (4.4L3+ 3,.4)+ p_,_n * _o,¢ (11L5.24 El 120 ET
+ _L (2L3._.L2.3_2+ _. 3=2+ x3)6El
15L_+ 5L_- 5)
(59)
0 = paf_cos ¢6 El (L3" x3) ÷
,,jo_'stn @ cos ¢
24 gI
+-_- (L2- 2mL + 2_x - x2)2EI
(3L4- 4Lx3+ x 4)
(60)
The redundant R is obtained by requiring 6 = 0 at x = m in either of
Equations (57) or (61)
. p_sin 6 cos 5Ia4. 5)81,.,, - o,C_o,24zi _(_ _3 + 3L4)+ 120,.x 0(11L5"_L4" +
R I m
+ _ (2L3" 6mL2 + 6m2L 23 ) set6El - 0
o,_o../" .4-4,._+_"\L3._+ _:',.. P_
(61)
4ozl \L3. _,2+3JL - .3 ] (62)
1-46
-41 LCO. WDL DIVISION

r n
Deflected shape of propped beam
WDL-TR2962 (III)
We now have sufficient equations to determine the optimum distance m to
minimize the deflections in the antenna. If we desired we could effect a
solution by trial and error as follows:
a. Choose a distance m and determine redundant R from Eq. (62).
b. Determine distance n from Eq. (60) such that e = 0 and n _ L.
c. Solve for deflection 5n at n from Eq. (59).
d. Solve for deflection 8o at x - 0 from Eq. (57).
e. Compare 6n and 5o and pick a new m to adjust deflections so
that they are equal.
f. Repeat cycle.
In this fashion we could place the rigid guy wire to provide the least
deflection. However, these equations are somewhat unwieldy. Hence we
will solve this problem with the aid of a structural analysis program on
the digital computer in Section 1.4.1.
1.4.1 Com_uter Solution for Ootlmum Placement of Single _UTW_r e
In Section 1.4 a method was outlined for determining the optimum placement
of a prop by hand computation. With our present capability in automated
analysis, this problem was easily solved on the dlgltalcomputer. Four
lengths of propped antennas were investigated (100 inch, 90 inch, 80 inch,
and 70 inch). The computer models were made so that each antenna was
composed of a number of two-lnch elements as shown below. For convenience
the origin of x has been moved to the fixed end.
1-47
CO WDL DIVISION

WDL-TR2962(III)
2
L
Computer Model
Each antenna was analyzed for the centrifugal loading with the prop at
several locations along the length of the antenna. The resulting deflected
shapes are shown in Figures 1-6, 1-7, 1-8, and 1-9. Observe that the
deflected shapes are quite sensitive to location of the prop. In order
to determine the optimum placement of the prop for each antenna length,
Figure 1-10 was plotted. In this figure, the absolute maximum tip deflec-
tions and interior span deflections are shown as a function of prop
location. Hence the intersection of the two deflection curves would indi-
cate the optimum location of the prop for minimum deflectlons. Note that
in all four cases the optlmumprop location was very close to 75 percent
of the total length. Deflections are two orders of magnitude smaller than
those of the cantilevered antenna; all deflections are less than .i0 inch.
I. 4.2 Comvu_er Model "B" of Propped Anter_a
In Section 1.4.1 the optimum prop location was presented for several lengths
of antennas. However, the results in that form was inconvlent for J. Patmore
to use. In this section we will revise our structural model (B) so that the
joints in the model coincide with the center of the slots in the antenna.
Model "B" will have 98 elements of 0.97866 inch each to make up a total
length of 95.909 inches. Choosing the optlmumprop distance of _ 75 percent
of the length, the prop is placed at x - 72.421 inches.
72.421 -------DI
F 95. 909 =
1-48
WDL DIVISION

\
O
HILCO.
\
<1
/
1 I
O O O O
c; c; c; c;
I
O O_4
c;
Oc4
I
[
O
OI
S_IDNI - NOIXO_I_I_G q_l VNN_IN'V
O
I
I
O
I
1-49
0Q
0o_
O00
0p_
co
0 _J
I-.4
I
[-4
o_
,,q-
r._
L.)
0c',4
0
O
WDL-TR2962(III)
1'4"13_O_0
OW a
Cw
_Z
4-1
.,,4
0O "
0 0
HI1
.=
.or,-I1
I
I1
WDL DIVISION
O O
Q
/
O O O
I
S_]_NI - NOIIDX_(I _Xi_I YNN_N_
1-50
0
&I
0
0r_
WDL-TR2962(III)
O
O
O
ct3
L)Z
I
r.1X
I.zw
,{.z.,
rj
E'-'
I-.4
O,,_ao
•'_ II
D,,0
4.1
0 U
0",_
_r-.=
'_0
IIi_0,,-i
r_I
0
O
I LCO. WDL DIVISION

WDL_962(III)
\
\°
o
o
,,-4
Z
o o_U
IP
_ m
o
o
)HILCO.
o
0 0 0 0 o
I I
S_l_DNI - NOI_D_'I_ "I_Z_Y'I Yb_T.NV
1-51WDL DIVISION

WDL-TR2962 (III)
mLCO.
0t",i
0
c_
0 0
I
1-52
0O0
0
S4J _U
_O G CO_-_
0 g
m ii
o Ipu,3 a ,1_ cl
o
oF-4
o
o
i
|
WDL DIVISION

WDL-TR2962(IIZ)
O
e
o
I
o o
d d
0
I
/o
o
S_H3NI - NOIIDEIIZ_qVlE_Yq NUMIXqfMVNH_It_V
1-53_HILCO. WDL DIVISION

WDL-TR2962(III)
The resulting deflected shape, moment and shear diagrams for a spin rate
of i00 rpm are shown in Figures 1-11, 1-12, and 1-13. Maximum bending
and shear stresses calculated were
6 = 13,861 psimax
7 = 135 psimax
1-54
_H I LCO. WDL DIVISION

,
o
o
O00
CD
_3
C.)Z
O m
0
r_
lU0
(n
CD
CD_4
C_
WDL-TR2962(III)
o
tP IIIJ
tP
• Clu_,pI
t,I
_g
UNIPP'-
_x
1-4
I
L A I I I
C_ 0 CD 0 0 0 CD 0 0
0 0 0 0 0 0
6 6 d 6 6 _ 6 6I I I !
1-55
0
IILCO. WDL DIVISION

0
\
!i
(1) _11_ iFrml
0
000
0
I-I
0 m_D
0
la4
r_
I,-I
0
0
_O
0P,I
I
WDL-_962(III)
4.1m
I'oC
u._
w0 Q
m M
I
GI,i
1 .-56
HILCO. WDL DIVISION

o WDL-TR2962(III)
S
OOp_
Ou_
O Ou_!
OO
!
RIl_q - ;I,t_IWOWORIOt_IIg
1-57
O
(D00
O
O-.T
Oe_
O
Ov-4
O
I
Z
&rw
u_
G
_oO
a R
O
u_ e_
0 m
I'X
!
'HILCO. WDL DIVISION

WDL-TR2962(III)
SECTION 2
ANTENNA ELECTRICAL ANALYSIS
2. I INTRODUCTION
The Navigation Satellite concept requires an antenna which will produce
a fan beam with a very narrow beamwldth in one plane and a beamwldth in
the plane of the fan broad enough to give complete coverage over the
surface of the earth. Location accuracy is directly related to the narrow
beamwidth.
It is well known that the beamwidth in a given plane is inversely proportional
to the antenna aperture size in wavelengths in that plane. For a given
specified beamwidth a compromise must be made between frequency of operation
and practical physical dimensions. The upper limit of the latter is
dictated by the specific dynamics of the system or satellite. Furthermore,
the antenna must be such that it can be collapsed into a relatively small
package and unfurled or extended.
The simplest type of antenna which is capable of meeting all the require-
ments is the array antenna. The planar wavelength dimensions of the array
determine its beamwidths. The radiating elements of microwave arrays are
generally excited in cascade from a single transmission line because of the
restrictions placed on element spacing by the desired radiation pattern.
The spacing must not be more than 0.7 of the wavelength in the transmission
line if a single major beam is desired. A broadside beam, that is one
truly normal to the array, is acquired by forcing the phase difference between
adjacent elements to zero. This is the case for a resonant array for which
the element spacing is one-half guide wavelength and a short circuit one-
quarter guide wavelength from the last element. At half guide wavelength
spacings, the phase difference between adjacent elements is made zero by a
physical phase reversal. Any desired amplitude distribution may be assigned
to the array by appropriate selection of the radiating slot conductances. A
uniform amplitude distribution yields the narrowest beamwidth, the greatest
gain, and the steepest slope off the peak of the main beam and is therefore
the distribution which is most advantageous for application to the Navigation
Satellite Antenna. However, the side lobe level is also the hlghest, but
offers no problems to the detection scheme proposed.
)HILCO.2-1
WDL DIVISION

WDL-TR2962 (III)
Resonant arrays may be constructed on any of the transmission lines commonly
used for propagation of microwave energy. The limitations for a given llne
are determined by the conductive wall losses for the length and frequency
required to achieve a given beamwldth, and the manner of radiating the
energy in phase at half wave length spacings. In order to meet these
conditions in coaxial lines requires dipole radiators and frequencies lower
than about 4 GHz. The array then becomes more complex, longer and heavier.
The simplest type of radiator is a resonant slot which is positioned on the
line such that it cuts across the current lines which flow on the conductor
walls. The slot may be positioned such that it presents a pure conductance
of any desired value to the incident energy. Radiating slots on rectangular
wave guides is a subject which has been given considerable attention. The
design equations are well founded and proven and can be found in most of the
antenna literature.
This study is principally concerned with problem areas which may be forseen
to arise from the Navigation Satellite application and to investigate
extendable wave guide arrays.
2.2 CIRCULAR WAVEGUIDES
Circular wave guide arrays lend themselves readily to applications where
360 degree coverage is required for in this case circular symmetry of the
wave guide is maintained. However, if hemispherical or smaller angular
coverage is required to achieve greater directivity the radiating elements
are positioned such that circular symmetry is lost. This is important
because the plane of incident polarization for the lowest TEll mode of
propagation cannot be insured to be in a unique plane. Any change
in cross section, bending or warping of the guide, or any discontinuity which
lies in a plane other than that of the incident polarization may cause
coupling to and excite the orthogonal TEll mode. The first order TM01 mode
which excites only longitudinal currents as in coaxial lines could be used
more effectively to excite the slots except that without a TEll mode
suppresser there is always the possibility that the TEll mode may be excited.
2-2
:_H I LCO. WDL DIVISION

WDL-TR2962 (Ill)
The DeHavilland boom as an unfurable circular wave guide slotted array is not
readily acceptable for a Navigation Satellite application. The open seam of the
guide when extended will most likely experience some twisting which will cause
radiation when the seam and plane of incident polarization are misaligned.
It has been found that off axis displaced longitudinal slots cause coupling
to the orthogonal mode which in turn excites the radiating slot with a
different phase and amplitude. The investigations of longitudinal off axis
displaced shunt slots on a circular wavegulde are reported in Appendix A.
The DeHavi_and structure might be adaptable if it could be made to latch
about a ridge which would be inserted into the guide. The ridge would have
the two fold purpose of insuring that the seam and incident polarization
vector will not be misaligned. There are obvious problems of latching the
closing seam edges to the ridge and of extending the ridge itself.
2.3 RECTANGULAR AND ELLIPTICAL WAVEGUIDES
Elliptical wave guides make up the general category of which circular
guides are a special case. Eccentricities of greater than zero split the
degenerate modes of a circular guide into even and odd modes, the odd TEll
mode being dominant. The greater the eccentricity the greater the
separation between cut-off wave lengths of the even and odd dominant modes
The field distributions approximate that of rectangular wave guides and
therefore, slot radiators should perform in a like manner. Elliptical
wave guides have the low loss feature characteristic of circular wave
guides in their favor. However, considerable experimenting would have to
be done to develop design curves for resonant slots of arbitrary conductance
or at least to demonstrate similarities or dissimilarities to the existing
design curves for rectangular wave guide slots. Elliptical wave guides are
not then to be dismissed as a possible transmission line on which to build
a resonant slotted array.
Subsequent discussions and analysis will, however, be confined to
rectangular wave guides because of their popularity and familiarity.
2-3
PH I LCO WDL DIVISION

WDL-TR2 962 (III)
Appendix B describes an experiment on a long, II0 wave length, short
circuited section of rectangular waveguide which was subjected to various
degrees of constant curvature bending in both E and H planes. Measurement
of the change in null position of the standing wave pattern was made to
determine the change in phase velocity with bending. The experiment was
performed to investigate the tolerable upper limit on bending of a structurally
unsupported rectangular wave guide and to determine the phase change per
unit of length vs radius of curvature.
It was found that for E plane bending the velocity of propagation was
decreased. The opposite effect occurred for H plane bending but at a
much lower rate. In either case the effect was negligible in comparison
to equivalent effects caused by practical construction tolerances.
2.4 EXTENDABLE WAVEGUIDE ARRAYS
Several means of extending long wave guide arrays and their associated
inherent electrical problem areas and possible solutions are presented.
Any discontinuities in a wave guide resulting from an abrupt change in
the cross section, as in the case of telescoping sections, or a mis-
alignment of the mating of two identical guides, as in the case of a
hinged joint, will introduce an equivalent shunt or series impedance or
combination of both at the junction. The resultant impedance discontinuity,
because of its associated complex reflection and transmission coefficients,
will set up a different standing wave pattern on either side of the junction
than that for which the radiating slots were designed. The resultant constant
phase surface will no longer be parallel to the array as required for a
normal broadside beam.
The best means for eliminating the effect of the discontinuity is to
resonate it with its conjugate reactance at the plane of the discontinuity,
if such a unique plane and conjugate exist. An alternate matching method
is to place an identical equivalent reactance in the guide a quarter of
2-4
PHILCO. WDL DIVISION

WDL-TR2962(III)
the guide wave length from the plane of the discontinuity to be "tuned out".
In either case, the phase shift through the discontinuity will be unchanged.
For extendable arrays made up of either hinged sections or telescoping
sections an electrical choke joint will most likely be required to provide
electrical continuity and prevent radiation at the joint. The joint would
further maintain proper alignment of the sections. The complete design
would have to be determined empirically and could take the form of the
standard choke flanges for rectangular wave guides.
The design of telescoping guides is discussed in the following paragraphs.
The design is based upon matching the impedances of the two guide cross-
sections at the design frequency. Assuming rect regular wave guide and
single mode propagation only the guide impedance is, in general, given by
a
z (i)
where a and b are the inside wide and narrow dimensions of the guide
respectively, _ is the free space impedance = 120 _ ohms and %o is the
free space wave length.
The outer large guide will be numbered i, and the inside telescoping guide
Numbered 2. Then if
Z1 = Z2
(''b _i_2\_j'
v \ 2a I ,
b¸
Ao 2
2-5
,HILCO. WDL DIVISION

WDL-TR2962(III)
/b2 i- <>o .2
= _o . 2
.2
b 2 < 2a2; " _.o2(2)
a I and bl, the dimensions of the larger outer guide, are known and a2 is
designed to be somewhat smaller than (aI - 2ta2) where ta2 is the wall
thickness of the narrow sides of guide 2 as shown in Figure 2-I.
The value of b2 is found from Equation (2).
between guides, tb2 , is found from
bI - b2
tb2 - 2
The wall thickness plus tolerance
(3)
The choke section is designed such that a short circuit exists between the
guides at the plane of the junction. Two typical junctions might appear as
in Figure 2-2. The dielectric sleeve provides a good mechanical surface
for sliding and makes the choke section more effective electrically.
Some type of mechanism must obviously be included to stop and hold the
guide at the correct position.
The radiating elements either side of the junction where the change in
cross section occurs should not be closer than one-half of the respective
guide wave length in order that the higher order modes excited by the
junction be attenuated sufficiently. The spacing from the junction of the
first and last elements of adjoining sections should be multiples of the
corresponding half guide wave lengths, and positioned with respect to
the longitudinal center line such that the phase difference is zero.
2-6
_HILCO. WDL DIVISION

WDL-TR2962(III)
£ GUIDE I
b 2 GUIDE 2 ta F b
p a, _I
RADI AT I NG
S LOT
l 'L--'2 hgl
GUIDE I - )_gl
CHOKE
SECTIONRADIATING
._ Agl SLOT
' 1I 2 bt
I. r____j _ GUIDE 2- hg 2I DIELECTRIC
PLANE OF SLEEVEDISCONTINUITY
ihI__- gl hg 2
i r I
Figure 2-1 Telescoping Guide Cross-Sections
_'LOW Z LINE
Hi Z '.ERMINATION t_- _-_L ----_ _J_----__377_ 4 _ 4
__ OF SYMMETRY
Figure 2-2 Choke Joint Cross-Section
2-7
_HILCO. WDL DIVISION

WDL-TR2962 (TII)
If both sections have the same number of elements n, the radiation patterns
of each section will be nearly identical regardless of the small different
physical element spacings on each array. The resultant pattern is dependent
upon the spacing between arrays and differs only slightly from that of a
single long array of the same total number of elements, namely, 2n. If the
spacing is made less than 25 percent of the length of either array section,
the first side lobe will not exceed the -13 db level with respect to the
main beam, and the first zero position is reduced by about 20 percent from
that of an array of 2n elements.
However, the radiating energy from the smaller telescoping guide suffers
a phase lag with respect to the radiation from the larger guide on account
of the step in the narrow dimension. If the step is 0.05 inches, a wall
thickness, and the frequency is 8.0 GHz or %o -- 1.475", the phase lag is
found as follows :
.050 ffi 12.2o .0678 w radiansffi 360 1.47----_ ffi "
This will result in a beam shift from the normal by an amount given by
AB rad ians
2_ _
where p is the separation between the phase centers of the sources. Each
section may be considered a source with its phase center located at its
corresponding geometric center. If each section contains 50 elements, then
is nearly 50, and
2-8
PHILCO, WDL DIVISION

.0678 TT_ _ 2_x50
_ 0.041 °
= 0.678 mrad
WDL-TR2962(III)
This beam shift from the normal may be eliminated by making the telescoping
antenna symmetrical about its extended geometric center, such that there
are smaller telescoping sections either side of the larger enveloping
section. Such an arrangement is shown in the sketch of Figure 2-3. For the
system shown, the beam shift to the left of the extended array center is
equal to the beam shift to the right and the resultant is a somewhat
broader normal beam. The deflection of the array as a result of the
spinning satellite and the array angle to the spin axis may be controlled
by extending the telescoping sections into a channel with a cross section
of the honey-comb structure. This structure itself may be hinged at
convenient locations to fold into a package only slightly longer than one
third of the overall length of the array.
An alternate method of achieving a normal beam is to feed the array at its
geometric center. Such a feeding arrangement shown in Figure 2-4 uses a
short slot 3 db hybrid coupler and is less frequency sensitive than a
single long end-fed array. The system can be considered as two end fed
colinear arrays. The separation between the first elements of the two
arrays is a very small fraction of the length of either array so that the
beamwidth is broadened only slightly. Reflections from the two arrays
cancel at the input and add in phase at the terminated port.
2.5 ARRAYS OF ARRAYS
The radiation pattern in the Fraunhofer or far field region for a general
space array is an extension of the two element development as follows.
Consider two identically space oriented radiating elements which are
described by similar space radiation factors F I (Y, _), and F 2 (y, _).
2-9
,HILCO..- _r_'_
WDL DIVISION

WDL-TR2962(III)
\ i,\
\SATELLITE
_X_ PIN
S
]
Figure 2-3 Telescoping Array,
2-i0
PHILCO. WDL DIVISION

WDL-TR2962 (III)
mHILCO.2-11
0
,l,ae:
o
lb.,
IC',,,I
I.a
WDL DIVISION

WDL-TR2962 (III)
If the origin is taken as the midpoint of the line connecting the two
sources, then at the given spatial position shown in Figure 2-5, source I has
a phase lead and source 2 an equivalent phase lag given by--C _3 J ""_' (_"
In general source 2 may have a phase _ different from source i. At point
P then the total field is given by
P
+ F2(_, 0) e"j -_-_ " ar"
= ej _ [FI(_, 0) e+j " ar " Z
'>3+ F2(Y, 0) e"j _ " ar " _
(4a)
(4b)
FI (y, 0) and F 2 (_,_) may describe single or multiple arrays of elements
oriented in any manner whatsoever with respect to the given coordinates,
and with a phase reference at the points i and 2.
If source i is taken as the origin Equation (4) becomes
j(k d.a + V)E (7, 0) = F 1 (V, _) + F2 (V, I]) e r (5a)P
m _ m m
ej (kd.a + V)l/2 _ -n) e'J 1/2 (kd'a + _/)= r F I (V, r
ill2 (_.%+ v)+ F2 (V, 7]) e ] (5b)
If there are n sources having the same pattern factor F (_, 0) and different
only in amplitude, A, and phase _, the first of Equations (Sa) becomes:
n
E (V _)n F (V, o) _ A. e j (_i + ik d • a ), = r (6)p i
i = i
2-12
,HILCO. WDL DIVISION

p (_, 11)
IIIII
II
IIII
x
I
UNIT VECTOR IN
DIRECTION y,1]
2 r
i SOURCE 2
I /
I //I / PROJECTION
L// ON x-Y PLANE
Figure 2-5 Linear Array Coordinates
WDL-TR2962(III)
VE - I VECTOR __r
C__ ECT OR P
n,/ \ i \
o
PH I LCO.
Figure 2-6 Planar Array Coordinates
2-13
WDL DIVISION

WDL-TR2962 (III)
Equations (5) and (6) can then be incorporated to consider m number of
similar parallel arrays of elements spaced p apart as shown in Figure 2-6.
Then
n m
Ep (V, _)nm = F (y, 17) I L_ Aih e j (_ih + ki_.ar + k (h-l) _.%) (7)
i= Ik= I
m m
where d and p are vectors which in general make any angle to the x and y axes
respectively, that is, the locus of the i elements may describe any curve in
a plane or in space.
Equation (6) can be readily summed if the amplitude A I of all the elements
are made equal, and there is a linear phase progression from element to
element along the x axis. The result is
n-I
E (V, 77) = F (V, O) sin n w e j _- !'_ (8)p n sin _,_
where
_'_= _ +7- • a ) .r
If the phase is referred to the center point of the array equation (8)
becomes
sin n ,t:
E (V, 0) = F (_, 17) n sin _) (9)P
It can be shown that if the separation between end elements of two identical
colinear arrays is equal to the length of one array, the beamwidth of the main
beam is equal to that for an array of nearly four times the length of one array;
however, the first sidelobe is only four db down. If the separation is 25 per-
cent of the length of one array, the height of the highest side lobe does not
2-14
PHILCO. WDL DIVISION

WDL-TR2962 (III)
increase above the -13 db level with respect to the main lobe. The beam-
width is reduced by about 15 percent with respect to that for an array with
twice the number of elements of either array, that is, when the separation
between the end elements of the two equal length arrays is zero. Obviously,
there is no advantage for a given length of a single array to omit a certain
number of the center elements to obtain a narrower beam for then each section
contains less than half the total number of elements of the original array.
A given angular beamwidth and side lobe level achievable with a single array
of n elements and length nd can also be achieved by two identical colinear
in phase arrays of 0.4 n elements with a separation between first elements
of 0.i nd. For example, a i00 inch array can be replaced by two 40 inch
arrays if the separation between ends is i0 inches. Or, conversely, if
the separation must be at least 40 inches, each array length must be 160
inches and would be equivalent to a 400 inch array. There is, therefore,
a compromise to be made between overall length, separation, frequency,
beanrwidth and tolerable side lobe level.
If now the identical in-phase-arrays are restriced to be only parallel,
it can be shown using Equations (9) and (4) that the radiation pattern
factor is described by the following:
_Ep (V, T_) = F (y, _) cos (-_ p • at) cos
m
sin (n_ ._r)
n sin q ._r )
(IO)
If the phase reference is at the center of the system, then
Figure 2-7 illustrates the system.
2-15
:_H I LCO. WDL DIVISION

WDL-TR29 62 (III)
ARRAY I nd
P(y,, "n)
I
I
I
I
II
kRRAY 2nd
IIIIIIII
J
Figure 2-7 Planar Array of Arrays
2-16
=H I LCO. WDL DIVISION

WDL-TR2962(III)
m
If now we consider the separation in the y direction, p, and the pattern
in the z-y plane, r • a = 0, _ • a = 0 andr r
('Y'T-) = F cos ( p sln' )P
%
The optimum spacing is 2p = _ for then a single maximum occurs at Y = 0
providing F (_, _ ) = O. As the separation 2p becomes larger in integral
numbers of half wave lengths, there occur equal numbers of auxiliary major
lobes on both sides of the broadside main beam. For odd integers, t,there
occur ( t_ ) maxima either side of the normal beam to > = 90 ° at positions
given by
2 t-Isin > = t (i, 2, 3, ' 2 ), t odd
For even integers or integral numbers of wave lengths, m, there occur m
maxima either side of the main beam to 8 = 90 ° at positions given by
sin _ = ! (i, 2, 3, --- m)m
For either case there is always a major lobe or beam at 7 = 0°.
2.6 FAN BEAM ANALYSIS
Section 3.3 describes in more detail the programming of the computer
to analyze the distortion of a fan beam generated by a long resonant array
which has been deflected according to a predetermined analytical expression.
The general problem statement is as follows: determine the locus of points
defining the simulated detected peak of the fan beam for conical cuts about
the satellite spin axis for the satellite-antenna configuration shown in
Figure 2-8. Determine the deviation of these points from the linear in
order to arrive at a tolerable length and deflection of array to meet the
required location accuracy.
2-17
)HILCO. WDL DIVISION

WDL-TR2962 (III)
X
ARRAY
AXIS
x\\
\\
\
\\
SPIN
AX IS
Z
(0
PLANE OF FAN
CUT
ABOUT Z
y BORESIGHT
AXIS
_: 90
8-- 90
Figure 2-8 Computation Coordinate System
2-18
=_H I LCO. WDL DIVISION

, WDL-TR2962(III)
The array axis will be oriented at an angle 6 to the satellite spin axis.
The deflection of the array may be in general defined by parametric expres-
sions of x, the undeflected array axis, in both y and z planes. The element
spacing must be kept constant. The analysis will assume no variations in
element amplitudes or phases while the array is deflected and the frequency
does not change from resonance. An option will be available to change the
amplitudes and phases of the elements of the array. The element radiation
pattern will be that of a narrow rectangular resonant shunt slot in the
broadside of a rectangular wave guide.
The radiation pattern will be computed from the following expression
(Reference Section 2.5, Equation (7)):
n m
.... Afhe,|(Tih + ki_ " a= L ri-i h= i
+ k(h-l) _ " ar) (ii)
where F(0,_) is the element radiation pattern factor
k is the propagation constant = 2_/%g
is the guide wave lengthg
id is the vector to the i th element
(h-l)_ is the vector to the (h-l) th array
n is the number of elements of each array
m is the number of parallel arrays.
For the cases to be analyzed, the frequency of operation has been chosen
to be 8.000 GHz; the wave guide size WRII2, and the number of parallel
arrays, i. All Ai's are equal and all T i's are zero. F(8,_) is given
by
F(e,_) = [T] F (_,_()
2-19
)HILCO. WDL DIVISION

WDL-TR2962 ('rid
where
F(_,Y) = 1/2 (I + e cos y)
77cos (_ sinv)
2cos y
(12)
is the assumed radiation pattern of the slot radiators referenced to the
coordinate system coinciding with the array axis.
[T] is the transformation factor relating the coordinates of the array,
_, _ to those of the satellite, e, _ (reference Figure 2-8).
2-20
HILCO. WDL DIVISION

WDL-TR2962 (tT'r)
2,7 A MEASUREMENT-VERIFICATION SCHEME
2.7.1 Introduction
A measurement scheme is described which could be used to check
the computed beam distortions resulting from a bent array. The accuracy
obtainable from such measurements which involves the determination of the
position of the peak Of the fan beam is estimated to be .05 db in amplitude
and .06 ° in position.
The measurement of distortions in beam shape, asymmetries in side lobe
levels and null depths are not meaningful unless the asy_netries are of
much greater magnitude than the effects of measurement errors. The source
of the largest measurement error of a carefully designed antenna range is
the phase difference between the center of an aperture and the outermost
edge which is caused by the finite separation between source and test sites.
Secondary errors are introduced as a result of reflections of the source.
The computed patterns for the 100 element array deflected in accordance with
the 100 rpm spin rate curve do not show asymuetries of sufficient magnitude
to ignore the effects of measurement errors.
The measurable quantity is the angular deviation, _, between the peak of
the beam of the deflected array and that of the undeflected array.
Reference is made again to Figure 2-8. For a given 6, _ is varied
until the peak of the beam is located. Figure 2-9 is a plot of the
computed angular positions of the peak of the beam for i00 element
array, 100 inches long, which has spin rates of 0, 100, and 180 rpm
corresponding to various degrees of array deflection. The points are
plotted against 0 and ¢ which explains the curvature. The projection of
the peak onto the Z-X plane would plot very nearly as a straight line and
is indeed so for w = O.
2-21
I-I I LCO. WDL DIVISION

WDL-TR2962 (Ill)
100 INCH, 100 ELEMENT ARRAY t _ = 45 °
1 I I0 70 80
_c
90
.60 _ = 180 I00 0
70
IIA4)
| ! !
90 I00 I10 1204,
I00
I10
120
130
i
130
Figure 2-9 e, _ Angular Positions of Peak of Fan Beam
Undeflected (_-0) and Deflected Arrays (_e.lO0, 180 rpm)
2-22
PHILCO. WDL DIVISION

WDL-TR2962 (III)
2.7.2 Technical Plan
By using the _ rooftop track-mounted dual-axls tower and the 350-foot
range patterns may be obtained for direct comparison to those calculated
by the computer.
Referring to Figure 2-10_ the undeflected array axis would be oriented at an
angle of 45 ° to the horlzontal rotation axis of the tower. The base or
input end of the array would be rigidly supported at this angle and fixed
to the horlzontal rotary section of the tower. An auxilary rigid member
would be attached to the horizontal rotary section orthogonal to the
horizontal axis and parallel to the plane of the radiating slots. This
member would be used to support the tension llnes which would deflect the
guide in a direction away from the horizontal spin axis. Shown also in
Figure 2-10 are diagrams of the measurement and computer oriented coordinate
systems. The two systems are seen to be Identlcal by a simple rotation
of the axes of either.
Conical cuts about the spin axis for any given angle, 0,from the spin
axis are obtained by taking cuts about the horizontal axis for a given
angle 0 about the vertical axis. The angles may be read directly from
either the servo indicator or the chart paper to an accuracy of .06 ° .
However, a measurement error of 0.2 db in determination of the peak can
result in a position error of 0.3 °. By using a linear potentiometer in
the recording equipment an accuracy of .01 in power ratio may be achieved.
This is equivalent to .045 db which would still result in a position error
of 0.15 ° .
The procedure would be as follows: first locate the angular positions of
the main axis of the beam called the boreslght position to which all sub-
sequent positions will be referred. Then for a given angle, @, about the
vertlcal axis the new posltion, _, of the peak of the fan is determined by
rotating the array about the horlzontal axis. The procedure is repeated
for different 0 angles.
2-23
WDL DIVISION)HI LCO.

VERTICAL
AXIS
__ O_L _ -o
Z
z o
FIXTURE -__
TOWER
TENSION LINE
NYLON
TEST ARRAY
HORIZONTAL AXIS
_L-TR2962 (Ill)
VERTICAL
AXIS
Y
Z
BORESI
SPIN
AXIS
ARRAY I Z
/XIS ARRAY (_- 4_i
/r_ × _°_,_. "-4SPIN AX_
X
P
P
BORESIGHT
X,Y
Measurement Coordinates Computation Coordinates
Figure 2-10 Boresight View From Source
2-24
_HILCO. WDL DIVISION

WDL-TR2962 (lit)
This would be done first for the undeflected array and then for the de-
flected array, using the same % angle in each case. The angle _ for a
given 8 is obtained directly from the pattern recordings.
2.7.3 Deflection Curve and Array Deslgn
A laboratory experiment was performed on a section of wavegulde to
investigate a practlcal deflection curve which could be simulated on the
range. The waveguide had the same electrlcal characteristics as the
model given the computer and was deflected in the H plane. The results
of the experiment was an analytical expression for a reallzable deflecClon
curve for a prescribed length based upon the design of the mulCl-element
shunt-slot resonant array.
The deflection curve for a cantilever beam loaded by a force Q at the
unsupported end is given by
Qx2 (3_ - x)Y = 6EI (13)
where y is the deflection at a position x along the axis of the undeflected
beam. The load Q is applied at the end of the beam of length 4. I is the
moment of inertia about the neutral axis and E is the modulus of elasticity
of the materlal of the beam.
For aluminum alloys: E = 8.95 x 10⁵ psi
For the waveguide of O.D 1.250" x 0.625" and 0.064"wall thickness:
BA3 _ ba 3 in 4I = 12
where the capital letters refer to the outer d/menslons and the lower case
letters co the inner dimensions. A and B are respectively the broad and
narrow dimensions. The deflectlon is in a plane parallel to the broad
dimension, that is, in the H plane of the wavegulde. Then
I = .043 In4
2-25
)HILCO. WDL DIVISION

wm.-'n_.962(izD
For Q = 30 Ibs and _ = 40 inches the deflection y at x = £ is
QI3 = 1.665 inchesY = 3El
The following table shows the comparison between the calculated and
measured deflection of the waveguide for a vertical load of 30 lbs applied
at a distance of 40 inches from the rigidly supported end.
x (inches) y 1= 1.300 x 10"5x2.120-x. Measured Deflection
inches (inches)
10 0.143 .172
20 0.520 .525
30 1.052 1.050
40 1.665 1.653
2.7,4 Array.Design for Pattern C_nputation
For fo = 8 x 10⁹ cps., Xo = 1.4750 inches.
O. D. x O.06Awall thickness.
In waveguide size: 1.25 x 0.625
/
g/2 d.... 0.6635
o o
The element spacing d is then
d = 0.9787 inches
For n = 40,
and the position of the first element at x = 6.00" the length of the
guide will be
1 = (n - 1) d + 6.00"
= 44.168"
The deflection curve is then given by
y = 1.300 x 10 "5 x2 (132.504 - x) (14)
2-26
PH I LCO WDL DIVISION

WI_-TR2962(III)
The voltage amplitude associated with each slot is
1 1E i .... n 40
Ei = .025
The phase of each slot is
_i=O
2.7.5 Results of Pattern Computation
Figure 2-11 contains voltage plots of the computed patterns for the
deflected and undeflected arrays for angles of 80, 70, 60 and 50 degrees.
Figure 2-12 is a plot of the projection of the peak of the fan beam on the
X-Z plane; see Figure 2-8. The X coordinate is proportional to sin 8 sin
(_ - 90) and the z coordinate is proportional to cos 8. Figure 2-12 shows
that the plane of the fan makes an angle of 45 ° to the Y-Z plane for the
undeflected array as expected. When the array is deflected according to
the manner previously described the projection of the peak of the fan
beam on the X-Z plane still describes a straight line. The plane of the
fan now makes an angle of about 41.5 ° to the Y-Z plane.
For comparison the projection on the X-Z plane of the peak of the fan
beam produced by the 100 element array spinning at 100 rpm is also shown
in Figure 2-12. The straight line shown is only the linear portion of the
true projection. The deviations from this line are reported in a
subsequent section,
Figure 2-13 shows the deflection curves for the 40 element array and for the
100 element array "spinning at 100 rpm".
2-27
DH I LCO. WDL DIVISION

WDL-TR2962(III)
30. ez ° 3S. 22 °
8 = S0° ..
N=40 °
6 = 45 °
A_ = 4.4 °
--DEFLECTED
.... UND£FLECTED
Z0 --
.o_ \ , _,
, , ,, , : • I. 1o : , ,is IS 20 ZZ Z4 Z6 2e 30 3Z 44 46
70 --
60 --
so --
40 --
'°-A,/ilo --
',6 B l0 12 14 16 18
lg,es ° //21.3z °
"-,_ ,_III
II
0 = 7_
N = 4_
8- 4C
DEFLECTED
.... UND_FL_CTEO
I22 32 34
60
so
40
30
ZO
I0
0 = so °
N = 40 °
= aS o
_,_= a.7 °
-- DEFLECTED
.... UNDEFLECTED
48" I1°'_ 56 o ° "
I I Z I I I I I iT I i
34 36 38 40 4Z 44 46 4e 5o sz s4 ' ' 'o ".56 50
Figure 2-ii Computed Voltage Patterns for Deflected and Undeflected Arrays

W'DL-TR2962 (III)
u_OO
0.6
0°5
0o4
0.3
0.2
0°I
0
= 45 °
I)
CURVE i:: i =
-0o I -0o 2 -0. 3 -0o 4 "0, 5 -0. 6
SIN OSlN (_-90)
Figure 2-12 Projection of Peak of Fan Beam on X-Z Plane
2-29
HILCO.WDL DIVISION

Figure 2-13
I00 TH
ELEMENT
40 TH --
ELEMENT
y = 1.3 x 10-5 x2(132.5-x ) "'_
I x
-- 100"
II
-- 90 "
II-- 80"
I
IF 70"
I
L 60"
I
-- 50"
I
I-- 40"
I
I-- 30"
_R)L-Clt2962(III)
20" __/'/"
/-- 10" /
_ I ST ELEMENT
20" I0" /
y I I
Deflectlon Curve for lO0-glement Array (_.100 rlm) and 40-Element Array
2-30
'HILCO. WDL DIVISION

, WDL-TR2962(III)
2.7.6 Array Des/an for Fabrication
In order to eliminate the accumulation of tolerance errors in the position-
ing of each slot radiator of a resonant array, the longitudinal positions
are referrenced to the number 1 slot. A tolerance of _ 0.001" is placed
on the position such that between any slot and the first the maximum
phase error will be only e 0.18 °, and between any two slots, twice this.
Figure 2-14 is a fabrication sketch of the array. Table 2-1 gives the
position of each slot along the axis of the array with respect to the
first slot.
2.7.7 Range Geometry and Measurement Errors
The range geometry is as shown in Figure 2-15. The separation introduces only
a 17 ° phase error between the center and the outermost edge of a 4 foot
long array. This phase error results in a measurement error of about 0.5
db in side lobe level and negligible errors in gain or beamwidth. However,
nulls are filled in and the first null will appear only about -22 db in
depth for an undeflected array.
If the patterns are limited to -15 ° in ¢ defined in Figure 2-10 the amount
of reduction of the reflected energy will be greater than 20 db as a
result of the directivity of the test antenna.
If the source antenna has a total 3 db beamwidth in the vertical plane of
about 12 ° the amount of reduction of the reflected energy is also greater
than 20 db.
The total reduction of reflected energy over the direct energy is then
greater than 40 db over the restricted ranse of 6. The measurement error
introduced by the reflected energy is then less than 0.1 db.
2-31
=_H I LCO. WDL DIVISION

WDL-TR2962(Ill)
\I
I
I
i
I
i
,/I
i
-I o I
I +I I
_00"0-
000"0+ 9617'0
OlOOlO
OlO
+_1N
I
II
I i
. I
w
I
I
I
I
z
0
I_
U
0
I
.,44.1q
.1414
-,1"_4
Ir,I
I.i
.14
2-32
LCO. WDL DIVISION

WIL-TR2962(XII)
Table 2-1 Slot Positions (Tolerance: +.001")
Slot
i
2
3
4
5
6
7
8
9
I0
ii
12
13
14
15
16
17
18
19
20
Distance From
Slot No. 1El I
0.000
0.979
1.957
2.936
3.915
4.893
5.872
6.851
7.829
8.808
9.787
10.765
11. 744
12.723
13.701
14. 680
15.659
16.637
17.616
18.595
NO •
Distance From
Slot No. Slot No. 1i
21
22
23
24
25
26
27
28
29
3O
31
32
33
34
35
36
37
38
39
40
19.573
20.552
21.531
22.509
23.488
24.467
25.445
26.424
27.403
28.381
29.360
30.339
31.317
32.296
33,275
34.253
35.232
36.211
37.189
38.168
2-33
:_H I LCO WDL DIVISION

i,i0n,
oU)
J
\\
\\
\\
\
\\
\
\
\\
\
\
\
\
\
\
k'DL-TR2962(III)
QJ
cO
I
.,4
OW
WO
_Eo
_HILCO,
2-34
WDL DIVISION

SECTION 3
COMPUTER SIMULATION
w- - 29e2 (I i)
3.1 ZNTRODUCTION
An antenna mounted on a spinning satellite will, in general, be deformed
by the centrifugal force. This deformation may be expected to produce a
corresponding deformation of the antenna's radiation pattern. A digital
computer program was written to investigate and evaluate this effect. The
program allows for the variation of a large number of parameters, such as
antenna length, number of slots, spin rate, and mounting angle, 8. The
program considers either guyed or unguyed cantilever antennas.
3.2 THEORETICAL DEVELOPMENT
3.2.1 Antenna Deflectlon
The antenna radiation pattern is a vector function of the slot positions.
To determine these positions we solve the familiar differential equation
for small deflections of uniform elastic beams, i.e.,
where M is the bending moment, E is Young's modulus, I is the moment of
inertia of the cross section of the beam about a horizontal llne passing
through the centroid of the section and lying in the plane of the cross
section. The x-axls is along the undeflected antenna and the y-axis is
normal to the x-axis and in the plane of the deflectlonw_th positive
sense away from the spin axis. See Figure 3-1.
To determine M(x) we use the relations
d2M--= p(x)dx 2
where p(x) is the loading function. Let p be the mass per unit length,
w the spin rate and 6 the mounting angle, then the loading normal to the
antenna is given by
)HILCO. 3-1 WDL DIVISION

WDL-TR2962 (III)
SPIN
AXiS ANTENNA
a+ xSlN8
L
Y
Figure 3-I Position of Antenna Relative To Spln Axis
3-2
-! I LCO. WDL DIVISION

, WEL-TR2962(XII)
p(x) = P_2(a + x sin 8) cos 8
3.2.2 Cantilever Antenna
For the simple cantilever antenna these two differential equations, along
with the boundary conditions
y(O) = 0 M(L) = 0
y'(O) = 0 M'(L) = 0
yield the result:
p=2¢os8 2 [ sln____6 3 2 "_y(x) = 24 El x 5 x + ax - 2L(2a + L sin 8) x + 2L2(3a + 2L sin 6
(15)
y'(x) P=2 c°s 8 _ x3 ]= 24 EI x sin 6 + 4ax 2 - 6L(2a + sin 6) + 4L2(3a + 2L sin 8
However what we need to compute the radiation pattern is the position of
the ith slot as a function of i. Since adjacent slots are separated by a
constant distance As, which we may assume to be unchanged by small deflec-
tions, we may write
As /I +< AYi > 2= _ Axi
(16)
where Ax I = x i - xi. I and Ay i = Y(Xi) - Y(Xl.l). From the mean value
theorem for derivatives we know that
y(x i) - Y(Xl. I)
y'(_i) = xl - xi. 1
for some _ such that xl. I _ _i _ xi" Substituting y'(_i ) = (Ayl/Ax i) and
solving Equation (16) for _i we obtain
3-3
bH I LCO. WDL DIVISION

W'm..-TR2962(XXX)
Axi _- .a.s i (17)J I + y' ({i)2
Then, given an initial value of x, say Xo, we can solve for x i and Yi from
the recursion relations
x i = xi. 1 + Ax i
Yi = Yi-I + Y'({i)Axi
provided _i is known. In practice [i
sufficiently good results.
" xi. 1
(18)
+ 1/2 _xi. 1 is found to give
3.2.3 Guyed _ntenna
The guyed configuration is more complex but a closed form solution can still
be obtained by solving the differential equations separately for two sections
of the antenna. Let a guy wire be attached to the antenna at x = b, and
let Yi(X) be the solution on the interval (0 _ x _ b) and Yii(x) be the
solution on the interval (b _ x _ L). The boundary conditions may then be
stated as
I!
Yi(O) = 0 yi(b) = yli(b) = 0 Yli(L) = 0
I I I III
yi(0) = 0 Yl (b) = YII (b) Yll (L) = 0
I! 11
Yl (b) = yii(b)
These conditions lead to eight linear equations in the eight unknown con-
stants of integration.
After considerable amount of algebraic manipulation the following results
are obtained:
3-4
*H I LCO. WDL DIVISION

W_-TR2962 (11I)
x2 1 1 ]
' x2 xyL(x) = C _sln 6 x4 +HLI x3 + HL2 + H_3 + HL4
where
L = I or II
C = pw2' C,OS, 624 El
b 2
D = _ (5a + b sin 6)
E = bL(2a + L sin 6)
F = L2(3a + 2L sin 6)
HII = 4a
HI2 = 3(D - 3E + F)/b
HI3 = -6(D + E - F/3)
HI4 = 0
H21 = 4a
H22 = -6E/b
H23 = 4F
H24 = -3b(D - E + F)
3.2.4 Antenna Pattern Equations
Let the antenna lle in x y plane. We define a vector _i from the origin
0 to the ith slot. Also let e be a unit vector directed toward an observer
in the far field. The unit vector e may be expressed in terms of the
parametric angles _,7 as
3-5
HI LCO. WDL DIVISION

_(v,_) _ sin_ sin
_. cos 7
See Figure 3-2,
The resultant field is then given by
n
i;1
W_-TR2962 (HI)
(20)
where n is the number of slots, f(e) = f(7) is a factor describing the
pattern of a single slot (assumed to be the same for all slots), E i is the
amplitude and $i the phase (relative to slot 1) of the ith slot, and X is
the free space wavelength. The pattern factor f(e) is given by
f(_) = f(v) = ½ (1 + cos 7) 2L sin1- ),
where L is the slot length. The nominal slot length is L = X/2.
this substitution, f(7) simplifies to
f(_,) =(I + cos V) cos _" sin
2 cos 2 7
Making
3.2.5 Co- or dinate.Trans format ion
Let 6 be the angle between the spin axis and the undeflected antenna. We
can define another co-ordlnate system (XYZ) having the satellite spin axis
as its Z axis, with Y = z, and with X completing the orthogonal-right-
handed triad. See Figure 3-3.
The transformation T(6) from the XYZ co-ordinate system is given by
sin 6 0 cosT(6) =_ cos 6 0 -sin
\o 1 0
(22)
:_H ILCO.
3-6
WDL DIVISION

WDL-TR2962(III)
Z •
k
p
^ de
/
Yx
Figure 3-2 Antenna Coordinate System
3-7
)HI LCO. WDL DIVISION

WDL-TR2962(III)
ANTENNA
\\
\
SPIN
AXIS
FAN BEAM
Figure 3-3 System Geometric Relationships
3-8
:)HI LCO. WDL DIVISION

WEL-TR2962 (III)
In the XYZ system the unit vector e directed toward an observer is
given by
=cos _ sin Oe_in _ sincos e
where O is the angle between e and the spin axis, and _ is the angle from
the X-axis to the projection of _ on the XY-plane. It is convenient to
define another angle, C, also measured in the XY-plane, by the equation
= _ - _/2. See Figure 3-3 for illustration of these angles.
3.2.6 Beam Maxlmum
In the XYZ system rotation about the spin axis is measured by _, while
0 remains constant. Thus to evaluate the beam as it would appear to an
observer, a value of e is selected and then _ is varied over the range of
interest in the neighborhood of maxlmum field strength Ema x. Thus for a
given value of e and _ we have
_(7,_) = T(5) _(e,_) (23)
It can be shown that for an ideal undefhcted antenna the fan beam lles in
the yz-plane with absolute maximum in the z direction. Thus E is maxi-
mized with respect to _ when _ = - _/2 and the absolute maximum, Emax,
occurs at y ffi O. By expanding the transformation equation above we
obtain the zelations
cos _ sin 7 = cos _ sin 0 sin 6 + cos 0 cos 6
sin _ sin 7 = cos _ sin e cos 5 - cos 8 sin 6
cos V = sin _ sin e
3-9
HI LCO. WDL DIVISION

WDL-TR2962 (Ill)
Thus, for an ideal beam, the maximizing value of _ is given by
-1= cos (-cot 6 cot 0).
3.2.7 Beam Deflection
When the antenna undergoes a small deflection in the xy-plane the maxima
villj in general, no longer occur at _ ffi -_/2. However the beam may remain
substantially planar, in which case the maxima will occur at _ ffi const.
If a maximum occurs at (8,_), the corresponding value of _ is given by
= tan-l_ cos _ sin 0 COS8 - COS 0 8_ 8\ cos _ sin 0 sin6+ cos 0 cos 6 /
If A_/AO is small over the range of 0 it is useful to determine a mean value
of _, _' which then may be regarded as defining a reference plane which
closely approximates the almost planar beam. This reference plane can be
thought of as an ideal planar beam generated by an antenna mounted at an
angle 6' = 6 + ' + _ which will be referred to as the effective mounting
angle. Using this ideal planar beam as a model we have
_' = cos'l(-cot 6' cot 8)
and the residual is given by
&0(O) = _' -
whereK
= K 1_(0° - i Ao)
i=l
3-10
'HILCO. WDL DIVISION

W_L-TR2962 (III)
3.3. SIMULATION
3.3.1 Program I_scrlption
The philosophy in writlng this computer program was to make it as general
and versatile as possible within the scope of the study. Most separable
functions are written as subroutines to allow modular interchange and easy
modification. The entire program is written in FORTRAN IV and is thus
usable on any machlne with a FORTRAN IV compiler. However, a user's manual
is not as yet available.
The general flow of the program is illustrated in Figure 3-4. The data
consists of a set of physical parameters and a set of program control
parameters. The physlcal parameters considered are listed below.
w
E
I
W
L
a
xo
s
fix
ny
6
8O
A8
E t
satellite spin rate
Young's modulus for antenna material
antenna moment of inertia
antenna weight/length
antenna length
radial distance of antenna mount from spin axis
distance from antenna base to first slot center
slot spacing
free space wavelength
number of slots/row
number of rows
acute angle between antenna and spin axis
initial value of 8
step size in 8
step size in
detection threshold value of E
(The following parameters apply only to antenna pair.)
Xm
na
%
separation in x direction
number of slots in "A" antenna
number of slots on "B" antenna
The main control parameters are TAB, XTOL, YTOL, FKEY, PLOT, and PHS.
3-11
/o WDL DIVISION

READ DATA,
iNITIALIZE
ES
i_IL-TR2962 (_11.%)
ERRs0
YES
}FKEYI m I
FIND _M
sUCH THAT
E(_M) = EMA x
COMPUTE
_=1,100 OR
JNTIL E(¢)
PLOT_IPLOT E (_)
_= 0 - AO i
NO
FKEY < 0
COMPUTE
_' ,
RESIDUALS
NOEND=0
'HILCO.
YtSu, cQ 3-4 71me Chart of learn kulys/S Progr""
3-12
WDL DIVISION

WDL-TR2962 (Ill)
The TAB options are as follows:
(I) TAB = 0, do not compute new _i;
(2) TAB = I, compute _i with simple cantilever formula;
(3) TAB = 2, compute _i with guyed cantilever formula;
(4) TAB = 3, compute _ with a special subroutine.
At Present there are three special subroutines which may be used under
option (4);
(I) The values of _i and _I' are read in as data;
(2) The values of _i are computed for an antenna with
a single discreet applied force;
(3) The values of _i' Ei' and _i are set up for an antenna
pair.
The XTOL and YTOL options allow the simulation of random variation of each
slots x or y co-ordinate within specified tolerances. The errors may be
considered simultaneously or independently. The effect of these errors on
phase and amplitude is also considered. A uniformly distributed set of
pseudo random numbers on the unit interval is obtained using a recursion
generator which may be formally represented as R i = g(Ri.1) where R 1 = g(1).
A uniformly distributed set is used rather than a normally distributed set,
on the hypothesis that the uniform distribution will tend to show "worst
case" behavior whereas a normally distributed set would tend to demonstrate
the "most probable case." No attempt was made to prove this hypothesis.
If XTOL # 0, then
Ax i = (2R i - i) (XTOL) I
x i = x i + Ax i
2_
g
i = l,n
3-13
DH ILCO. WDL DIVISION

If YTOL _ O, then
Ay i = (2R i - i) (YTOL)
Yi Yi + AYi
FAi FAi + 5 Ay i
i = l,n
WDL-TR2962(TII)
The parameter FKEY serves in two capacities. First if [FKEY[ = I, the
value of _, _M' which maximlzes E (for a specified value of e) is deter-
mined numerically. If IFKEY I # i, then the theoretical value for an
-I
undeflected beam crossed normally is used, i.e., _M = cos (-cot 5 COS e).
Secondly, if FKEY is negative, the effective mounting angle 8 and residual
values of _p are determined.
The parameter PLOT (as one might suspect) controls the plotting option.
If PLOT = O, the set of values E(_), e = constant is processed for plotting
on the Philco-Calcomp plotter.
The parameter PHS is meaningful only when the antenna pair option is used.
If PHS = 0, the two antennas are driven in phase, otherwise they are driven
180 ° out of phase.
3.3.2. Simulated Antenna Pattern
First consider an ideal fan beam generated by an undeflected antenna.
Figure 3-5 shows a broad dimension view of the beam and Figure 3-6
shows an "edge" view of the beam, displaying normal (90 °) cross-sectlon
for several values of e. Figure 3-7 is a contour plot of the field.
Lines of constant field strength are plotted as functions of e and _. Some
care must be exercised in deriving information from this figure since it
resembles a mercator projection, and thus has certain inherent distortions,
(i.e., Greenland appears to be as large as South America).
3-14
'HILCO. WDL DIVISION
WDL-TR2962 (III)
1.0
I
(.9 0.8Zhl
aIILl 0.6
LL
QI,IN
J
:E 0.4E0Z
0.2
o I I I I I0 I0 50 90 130 170
(DEGREES)
Figure 3-5 Broad Dimension View (6"90 °) of UndeflecCed Fan Beam
3-15
HILCO.
i
WDL DIVISION

WDL-TR2962(III)
1.0
0.8T
0Zhln"
(n0.6
a.JbJ
,T
DUJN
0.4
o
0.2
:_ 90 °
80 °
_"--..._ 0 = 7oo
0 = 60 °
0 = 50 °
-2.0 -I.0 0 1.0 2.0
_, (DEGREES)
Figure 3-6 Edge View of An Ideal Fan Beam
3-16
'HILCO. WDL DIVISION

WDL-TR2962(III)
I]I]I[IIIrII11111
70. IIIIl,tlJ/!lllt 60 ' i
iJlllt Tllt/kkki;i' ',) //t'/tt
30 ' _ '
20 , j
0
-4 -3 -2 -I 0 I 2 3 4
(DEGREES)
Figure 3-7 Contour Plot of Fan Beam
3-17
'HILCO. WDL DIVISION

WII.-TR2962 (Ill)
Some definitions will be useful at this point.
(I) Geometric Maximum. The geometric maxima of an ideal fanmax
beam occurs at _ = - _/2, i.e., _ E (y,_) = E (y, - _/2).
More intuitively it is simply the center of a symmetric
beam.
(2) Cross-SectionMaximum. A cross-section maximum is defined
to be max E(_,8). The surprising (possibly) thing about
cross-section maxima is that they do not in general coincide
with geometric maxima for other than normal cross-sections
(6 = w/2). This result is due to the fact that E(y, - _/2)
decreases montonically as y increases, and to the finite
width of the fan beam. See Figures 3-8_ 3-9 and 3-10.
(3)Mean Threshold (or Detector) Maximum. First we define CPin as
the minimum value of _ such that E(O,¢p) > Et and _out as the
minimum value of _ such that _out _ _in and E(e,_) < Et, where
Et corresponds to a detector threshold. (In this study
Et = 0.6 Emax. ) The mean threshold maximum is then defined to
be E(e,_mean ) where _mean = (Win + _0out)/2. For the interval
(60 ° < e < 90 ° ), _mean < _geometric' due to the gradual narrow-
ing of the beam at the E = 0.6 E level.max
Figure 3-11 shows the relative position of geometric maxima, cross-
section maxima and mean threshold points for an undeflected fan beam cut
diagonally (6 = 45 °).
Also note that crossing the beam at an acute angle causes the apparent beam
width to increase as e decreases from_/2. This effect is due to the fact
that the crossing angle, equal to 6 at 8 = _/2, decreases to zero at
e = _/2 - 5. This makes the beam slightly asylmetric as well as increasing
the apparent beam width. However, these effects are small in the region of
interest (60 ° < % < 120°). All the effects mentioned so far have been for
an ideal undeflected antenna.
3-18
HILCO. WDL DIVISION

WDL-TR2962 (Ill)
-rI-0Z
I-{/)
D-Ib.l
F.13bJN
._I,(E
0Z
1.0
0.8
0.6
Figure 3-8
GEOMETRICBEAM CENTER
CROSS- I
SECTION
MAXIMUM
MEANTHRESHOLD
POINT
Beam Cross Section, Illustrating Defined Terms
E _0.6
E ,_ CON ST.
BEAM CENTER
MEAN THRESHOLD POINT
CROSS-SECTION MAXIMUM
Figure 3-9 "Top" View of Beam, Illustrating Defined Terms
3-19
-IILCO.WDL DIVISION

WDL-TR2962(III)
Figure 3-10 Schematic View of A Beam Section
3-20
3HILCO. WDL DIVISION

WI)L-TR2962 (III)
:OMETRIC BEAM CENTER
@ww
0wav
105
100
95
/
MEANTHRESHOLD
BEAM
CENTER CROSS-SECTION
MAXI MA
90
0
Figure 3-11
I I I I II0 20 30 40 50
BEAM CENTER DEVIATION (_RADIANS)
Relatlve Location of Various Beam "Centers" for Undeflected Antenna
3-21
I LCO WDL DIVISION

WDL-TR2962(III)
3.3.3 Deflected Antenna Effect-
Despite the fact that the array is no longer linear after the antenna is
deflected, it is found that the fan beam remains very nearly planar. The
primary effect is that the beam is turned through about the same angle as
the antenna. Thus the pattern generated by a deflected antenna, for de-
flections of a few degrees, can be closely approximated by a straight
antenna lying approximately along the deflected and bent antenna. This
is an important conclusion. The degree to which it holds under varying
conditions will be discussed later in this report.
The deflected beam is also found to be slightly asymmetric in cross-section.
This may be seen in many of the figures included in the Appendlx C of this
report. It is interesting to note that this asymmetry causes the mean
threshold and the cross-section maximum to reverse themselves, i.e., in
the deflected case the cross-section maximum is closer to the geometric
beam center, contrary to the undeflected case. Deflection also reduces
the broad beam beamwidth. See Figure 3-12.
3.3.4 Sinzle Antenna Study
There are so many parameters involved in simulating the antenna pattern
that it would be impractical to consider all possible combinations. In-
stead, all parameters except one were held at a nominal value while that
one was allowed to take on several values. The parameters considered in
this part of the study were antenna length (and number of radiators), spin
rate, antenna mounting angle, as well as guyed and unguyed antennas. The
cases considered are tabulated below. The nominal values of the parameters
are boxed.
L, antenna length, inches
n, number of radiators
w, spin rate, RPS
8, Mountin_ angle, degrees
support
83.8
80
2
45
None
44.7 64.2
40 60
I 3
30 60
guyed
103.4
I00
'HILCO.
3-22
WDL DIVISION

•,OL-TR2962 (III)
I.O
"rI-L9Z 0.8Ldn,I-O_
n.-IIdE 0.6
aIdN
..I
n,0 0.4Z
0.2
0
f DE_TED
BEAM
60 70 80 90
0 (DEGREES)
100 II0 120
(_45 °) View of Broad Beam ProfileFigure 3-12 Diagonal
3-23
)HILCO.WDL DIVISION

wDi,-z_ge2 (zlz)
The physical deflection of the antenna for the various cases is shown in
Figures 3-13, 3-14, 3-15 and 3-16.
The choice of effective mounting angle depends on how "far out" on the
beam one is trying to fit it. Thus a minimum value of 8 must be specified
before the best fit can be determined. The choice of 8ml n is also related
to the satellite altitude, i.e., the higher the satellite the miler the
portion of the beam used. Two values of 8mi n were used, 8mln = 81° corres-
ponding approximately to synchronous altitude, and 8min = 66 ° corresponding
to a 5000 n.ml. orbit.
Figure 3-17 is a plot of the difference, _p, between the value of
computed from the best fit linear approximation and the actual value _,
plotted versus 8. The figure shows _zp(8) for four values of 8mi n. Figure
3-18 shows (1_Pminl + A_max)/2 for the combinations of parameters con-
sidered and for 8mln = 81°. Figure 3-19 shows the same data for 8mln = 66 °.
Table 3-1 gives a stmnnary of _he results. Three beam cross-sections
were plotted for each case, at 8 = 90 ° , at 8 = 80 ° , and at
= 70 ° . These plots may be found in Appendix C of this report.
Two cases evaluating the effect of random error in slot location were also
run. The maximum error allowed in each case was 5/1000 inch. There was no
appreclable effect on the pattern, using the simple error model described
prevlously.
3.3.5 D_. ble Antenna Study
All the preceeding concerned itself with a single antenna of N elements all
driven in phase. Now we will consider two sets of M and N elements respec-
tlvelywhich may be
(i) In or 180 ° out of phase.
(2) Separated vertically be a distance V.
(3) Separated horizontally (mlsalllgned) by a distance H.
3-24
I LCO.
I
WDL DIVISION

WDL-TR2962(III)
U3
I
(S3HONI) IN3N3OV7clSIO VNN31NV '£
0
0
I1
I=
O
O
4Ju
,-4
4J
O
u
,-.4!
3-25
HILCO. WDL DIVISION

WI)L-TR2962 (III)
n," o
II li
oo_
f_O
e_
o
e_o
o
o
oo
_u
ql
(_'_HONI) NOIJ.C)'_7..,-I_O V'NN31NV _,,(
o
3-26
LCO. WDL DIVISION

NI)L-_962(III)
n
N
[I I!
J
II
j
i m
'or _ N M
(S3HONI) N011037_-130 ¥NN3.I.NV _/_
0
0
0_D
w"i"0Z
0It} _._
I-ZZ_0
_ zZIdl-Z<
0
Z<
N Q
o
0
e_o
e_o
.iJu
e_
e_
o
!
3-27
CO. WDL DIVISION

•-- (noon
IX) ¢q ,,,¢
II II II
_B)L-TR2962 (Ili)
ZzLdl-Z<
Dl.d)-
L9
I_ 0 l.n0
O O O
s d d
U)bJ"1-O
_ z_ ,_
× m
Z _kl
Z __ o
Z _0 _
U _Z
!
0
0
(S3HONI) N011037..-130 VNN':IINV '/_
3-28
t--I I LCO. WDL DIVISION

60
5O
40
WDL-TR2962 (III)
= 66 ° _ -- 54 °
rain i_
642.1 /j,R AT _=54 °
L . 44.7"
Z
5
:&
30
2O
I0
Io _o80 ° 70 ° 60 ° 50
-10
-20
Figure 3-17 Typical Plot Showing Residual Angular DeviationsAfter Best Linear Correction For Particular Minimum e.
3-29WDL DIVISION

WDL-_2962(zzz)
I00
9O
80
7O
6O
50
4O
30
2O
I0
9
8
7
6
5
4
(n
Z 3
<
< 2
1.0
,._ 0.9
0.8
::) 0.7a
0.6
ld 0.5[r
:_ 0.4
D
:_ 0,3
X
<
:_ o,2
0.1
0,09
0.08
0.07
0.06
0.05
0.04
0.03
0.02
0,01
6 = 30 °
Figure 3-18
_HILCO.
Residual In _ Due ¢o Be=_ Non-PlanariCy Op¢i=ized for %in-81 ° (Synchronous AltiCude)
3-30
WDL DIVISION

WDL-TR2962 (llI)
I000
900
800
700
600
500
400
300
200
I
0.9
0.8
0.7
0.6
0.5
0.4
0.3
0°1
I LCO.
Residual in _ Due to Beam Non-Planarity Optimized For 9Hin=66 ° (5000 n. mi. Altitude)
3-31
WDL DIVISION

Table 3-1 . Summary of Parametric Study
Parameter
Varied and
Its Value
Antenna
Mounting
Angle
Antenna
Length
Satellite
Spin
Ratei
Guyed
Antenna
30 °
45°L
s0o
45"
L
64"
103"
1 RPS
2 RPSm
3 RPS
Maximum Deviation of Spin Angle From
Nominal (Linear Approximation) _ radlan
5000 n.ml.
AltitudeSynchronous
Altitude
5 200 2°
1 20
I
Approximate
Angle ThroughWhich Beam Turned
•1 2°L
2 50 .2°
•5 20 1°
20 500 4°
•2 I0 .5°
1 20 2°
lo 200 4°
1 20 o°
3-32
LCO WDL DIVISION

WDL-TR2962(III)
(4) Overlaid in such a way as to form more complicated
patterns, such as two radlatorsp two missing, two
radiators, etc.
See Figure 3-20.
Appendix D consists of a number of double antenna pattern cross-sectlons.
On each plot the number of slots m and n: the horizontal and vertlcal
separation of the antennas H and V: the phase T = 0° or T = 180°_ and the
angle 0 as previously defined are given.
It should be noted that E(O,_) was evaluated at 201 evenly spaced points
to obtain the data for all cross-sectlons shown. In some cases where the
data is varying rapidly, minima and in some instances maxima are obvlously
missed or are not very well defined. This effect is illustrated to an
extreme extent in Figure D-17 where all local maxima should extend to
the envelope and all minima should actually be zero.
TV
ANTENNA "A" WITH M SLOTS__._ H -_
ANTENNA "B" WITH N SLOTS
Figure 3-20 Double Antenna Configuration Definition
3-33
,HILCO.WDL DIVISION

WIL-TR2962(III)
APPENDIX A
CIRCULAR WAVEGUIDE ARRAY INVESTIGATION
This experiment was performed to investigate the feasibility of using
a circular wavegulde as the transmission llne on whlch to build a very
long resonant array. The circular wavegulde slotted array was investigated
because of the attractiveness of the DeHavilland boom.
The unknown radiation characteristics of an array of relatively small
conductance slots in a waveguide can be made known by comparing the
radiation patterns against that of a single large conductance slot whose
characteristics are known. This is done by phasing the single slot and
the array of slots 180 degrees apart and measuring the position and depth
of the null in the difference pattern.
The objective of this first experiment was to determine by slotted line
techniques the admittance characteristics of a loosely coupled slot for
use as a reference.
It was found that for any loosely coupled longitudinal shunt slot in a
circular guide the plane of incident polarization was rotated. The reflec-
tions from the slot returned also rotated, thus causing the slotted line to
radiate. In brief, a circular waveguide with a simple circular cross
section cannot maintain a uniform plane of polarization when the propagation
is altered by the presence of displaced off-axis shunt slots. Because of
the rotation of the plane of polarization, the open slot of a DeHavilland
boom would radiate and further interfere with the propagation of energy.
A.2 TECHNICAL PLAN
Figures A-I through A-5 are Engineering Drawings of the special waveguide
slotted line, circular to rectangular guide transition, and circular guide
test section containing a number of longitudinal shunt slots.
A-I
il LCO. WDL DIVISION

WDL-TR2962(III)
u_C
n_
J
o
TC_C_
_L
_9I'
o
7
llLCO.
A-2
WDL DIVISION

Z
WI)L-TR2962(III)
dAl VKI
000 "0-OIO "0+ _I "_ __
dX,I.VICI
_ ooo._.q
VI t_vL_ _ _ "VKI_ --'_
_J_
_CD
f
| I
Ill
"VI(I --
I +Ii_gL "I oo
.¢Z
WIW
tM!
<
A-3
WDL DIVISION

HILCO.
WDL-TR2962 (III)
I t,.,,4Oo
00t_
t._C,
"-"'_ O
,,,..4
0
U
0
I
ql
A-4
WDL DIVISION

WDL-_,2962(nI)
i |
To
0
,,,4I
q
0
0u
II
Ill
!.¢I1
/ <,
I ILCO.
L__
A-5
WDL DIVISION

WN.,-'rP.2962 (III)
"t-I
¢,,]i,-I
<::;
+
¢_c;__H /_ 0. 750 DIA HOLE
.oo2.00
+,O0¢',1
+:
-"I
l
0.25 TY:P j,
8-32 UNC -2BONE SIDE ONLY
I I I! I II I
Figure A-5 Probe Carriage
A-6
-I I LCO. WDL DIVISION

WDL- TR2962 (][I I)
Measurements were made on each slot with all other slots shorted. The VSWR
and null shift from a short circuit at the plane of the slot determined the
addmittance of the slot. The admittance was determined as a function of the
angular displacement of the slot from the plane of the incident polariza-
tion. The frequency dependence was also determined. The design resonant
frequency was 9.0 GHz.
A,3 'TEST RESI%TS
The test set-up is shown in Figure A-6.
The test section of guide containing the slots, all of which were shorted
except the particular one under test, was rotated about its axis from the
vertical angle of 5 degrees. There was no apparent change either in amplitude
of the VSWR or position of the null. This VSWR was greater than 40:1, the
true null depth was masked by the noise level of the audio amplifier in the
indicator. Greater coupling is achieved by a greater angular displacement
from the vertical. However, at an angular displacement of i0 degrees, the
VSWR became very erratic. An investigation of the radiation fields indicated
that the slotted line was radiating. Removing the probe carriage reduced but
did not eliminate the radiation, indicating that neither the probe nor its
carriage was exciting the slotted line. A short tapered section of resistance
:ard was placed in the load end of the slotted line with the tapered end
toward the load. The resistance card was oriented along a diagonal plane
orthogonal to the plane of incident polarization, so as to absorb any polariza-
tion which might be reflected in all planes except the incident vertical
polarization. This eliminated the radiation from the slotted line. The VSWR
was now measured to be 3.0:1, but no indication can be made of the power
transmitted through the test slot by this measurement. The procedure was
repeated for all slots and at the expected resonant frequency 9.00 GHz
and minus i00, 200 and 500 MHz. No frequency within this design range was
found for any of the slots which did not cause the slotted line to radiate
for any angular displacement. The radiation intensity from the test slot
did increase as the angular displacement was increased. The radiation
intensity was measured always at the same distance along a radial line through
the axis of symmetry of the slot.
A-7
I LCO. WDL DIVISION

OZ
_0 mz,-.1_ mr.,.lI_ ©
0
r__z
0
0
M
t
A-8
ZO
Z_
o
Z
ZO
©Z_
m_
WDL-TR2962(III)
O
I
ILCO. WDL DIVISION

I¢DL-TR2962 (Ill)
A.4 CONCLUSIONS
Certain disadvantages of using circular waveguide are presented. Because
of the circular symmetry of circular guide s it is impossible to obtain
electromagnetic propagation characteristics analogous to the simple TEl0
propagation of rectangular guide. This is due to the fact that for the
lowest order of the roots of the cut-off equation (that is, for TEll mode
propagation only), there exist two characteristic forms for the same cut-
off frequency. In general, the solution of Maxwell's equations for the
field distributions in circular waveguide show that for any particular mode
of interest which has its unique cut-off wavelength, the expressions can
contain either a cosine or sine variation in the cylindrical coordinate 4.
Both may exist together and, depending upon the relative amplitude and phase
relationship, any form of elliptical polarization may result. Consequently,
a circular guide involves at least double propagation. Furthermore, any
departure of the cross section from exact circular form and symmetry may
cause coupling of the two modes of propagation and rotation of the plane of
polarization might occur, producing elliptic polarization.
This experiment has pointed out that radiation from longitudinal offset
shunt slots in circular guide may cause coupling between the two forms
of propagation of the TEll mode, and, unless the waveguide is made struc-
turally rigid 3 deformation of the cross section will be experienced as the
guide is bent or twisted, which also causes coupling of the two modes.
Mode purity may be insured by the insertion of a ridge in the plane of
polarization desired.
The open seam of the DeHavilland boom would certainly radiate as the
polarization plane rotated. This radiation would further interfere with
the propagation of energy in the gulde, causlng additional rotation of the
polarization plane and consequent additional mlsallgnment of the resonant
slot radiators.
A-9
WDL DIVISION

WDL-TR2962 (Ill)
APPENDIX B
EXPERIMENTAL STUDY OF PHASE SHIFT VS. BENDING OF RECTANGULAR WAVEGUIDE
B. i SUMMARY
It is anticipated that the rectangular waveguide array on the Navigational
Satellite will experience large deflections from its static position due to
the spinning of the satellite and the angle between the array and the spin
axis. The object of this analysis is to determine the effects of bending
a rectangular waveguide on the wave propagation factor. It is this factor
on which the spacings of the elements of a resonant array are dependent.
The results are normalized to the guide dimensions and wavelength and are
applicable for any wall thickness and any radius of curvature between
R = _ and R = i0 feet for E-plane bending, and between R = _ and R = 25
feet for H-plane bending. The phase shift for H-plane bending was
approximately one-third that for E-plane bending and occurred in the
opposite direction. That is, E-plane bending effectively increased the
length of the line, whereas H-plane bending effectively reduced the length
but only one-third as much for the same radius of curvature. The most
severe phase shift in the E-plane was 0.448 ° per foot occurring for R = i0
feet. This corresponds approximately to a phase shift of 0.037 ° per slot.
This same phase shift would be experienced if the slot were displaced from
its resonant position by 0.0001 inch.
B.2 TECHNICAL PLAN
In order to obtain meaningful information, the guide will be bent in such a
manner as to produce a uniformly distributed phase shift and a constant
propagation factor with length. The guide will therefore be formed about
three supports to conform to an arc of a circle of constant radius, and the
phase length measured with respect to that for the no-bending condition.
The effect on the loss with bending will also be measured. Both E-plane
and H-plane bending will be investigated.
B-I
I LCO. WDL DIVISION

An expression is derived below which relates the phase shift per unit
length to the guide dimensions, the frequency and the radius of curvature
of bending. The proportionality factor is experimentally determined.
The phase shift is a result of stresses which cause buckling or minor
deflections of the narrow dimension b of the rectangular waveguide which
effectively increases or decreases the wide dimension _ by _a. This
change is caused by a deflection of a thin wall of thickness, _, under
stresses causing buckling. As a first order approximation, the deflection
is proportional to the square of the ratio of the narrow dimension, b, to
the thickness, _. Expressed mathematlcally:
b
)2Aa = k (_ (B-l)
where k is a proportionality factor with feet as the dimension, and is a
function of the radius of curvature of bending.
The phase shift, A_, per length, L , in a rectangular waveguide due to an
incremental change, Aa, in the wide dimension, is found by differentiating
the expression for the propagation factor, _, with respect to a.
for a rectangular waveguide with wide dimension a_ is given by
2_ Ii lo_ I/2B = - (-Y&)
is related to the phase length by the following expression:
(B-2)
It follows that
(B-3)_=
B-2
II LCO. WDL DIVISION

WDL-TR2962(III)
Differentiating Equation (B-2) with respect to a gives for the incremental
change in R;
!)2A8 = rr ( )( a Aa (B-5)c
Substituting Equations (B-I) and (B-4)into (B-5) results in the following:
C
The dependence of the proportionality factor _ on R, the radius of curvature
of bending, is the relationship to be determined by experiment. Assume
is equal to some function of l/R, in order that k = 0 when R = _ (i.e., for
an undeflected waveguide); then the phase shift per foot for different wave-
guides and frequencies and radii of curvature is calculated from the formula:
I . _. )(b)2 1 2= f t__L ; (71L X (B-7)
c
B.3 TEST CONDITIONS
Due to the availability of test equipment and waveguide stock, the test
frequency was chosen at 15.0 GHz. The waveguide was brass RG(91)/u, with
inside dimensions 0.622 inch x 0.311 inch, 0.040 inch in wall thickness
and 9.33 feet in length. The guide wavelength is calculated to be 1.016
inches. The test waveguide then contains
9.33 x 12
1.016= II0 guide wavelengths.
The waveguide was shorted at one end and the VSWR at the input was measured.
The VSWR was measured for each different radius of curvature, and the one-
way loss calculated from the following expression:
((vs a+ i))Loss (i way) db = i0 IogI0\(VSWR . I)
B-3
41LCO. WDL DIVISION

WDL-TR2962 (Ill)
The null position was measured on the slotted line with the aid of a I0
revolution dial indicator for which one revolution corresponds to 0.0100
inch and with divisions every 0.0001 inch.
The constant-radius curvatures were accomplished by forming the guide about
supports whose spacings and lengths are given by the expression:
2 = R 2x + (y + R) 2
where x is the distance along the line of the undeflected guide to the
support, _ is the deflection, and _ is the radius of the circle.
B.4 TEST RESULTS
Figure B-la and B-ib illustrate the experimental arrangement showing the
position and lengths of the support about which the waveguide was formed
for each of the constant-radius curves.
Table B-I tabulates the data from the original data sheets.
Figure B-2 is a graphical representation of the data. The ordinate is phase
shift per foot of length and the abcissa is the inverse of the radius of
curvature.
The VSWR was unchanged from 9.7:1 for all cases of bending. The insertion
loss was calculated to be 0.90 db using the equation of Section B.3. The
theoretical calculated value is 0.94 db.
B.5 CONCLUSION
The results of the experiment are shown graphically in Figure B-2. This graph
shows that- _ is a linear function of _ It follows then that the proportionalityR"i
factor _ of equation (B-6) also is linearly dependent on _. Equation (B-7)
then becomes k
40 (m) _(k-_c)(_)2 (_)2iTM (B-8)
R
B-4
LCO. WDL DIVISION

WDL-TR2962(III)
Y
E AttenuatorSIGNAL
GENERATOR
(HP-625A) Slotted
Line
fo = 15 GHz
1/2"
Positions
of
Support
1/4"
X
Figure B-la Bending in g Plane
HP
626 A
Z
IS.L.Attenuator
3/4,,2 1/8,'_ _J.------v::1,... 7 1/4- '
' ' _/_ !
3' 6' 8 t X
Figure B-lb Bending in H Plane
B-5
! I LCO. WDL DIVISION

WI)L-TR2962 (Ill)
Table B-I Data Summary
fo = 15.0 GC, Waveguide: RG (91) he, Brass: ID: 0.622" x 0.311"
Ig = 1.023"Wall Thickness: t = 0.040"
L = 0.33 feet
b 2 1..2
_o y= I.o23 311 2 2= 128.9 (in "2)
E Plane
iR
R
15 ' .0667
i0' .i00
L
.268
.448
H Plane
IR -- A_
R
30' .0333 -0.40 °
25 ' .040 -0.60 °
L
.0429
.0644
B-6
WDL DIVISION

WI)L-TR2962 (III)
Ad °Lft
O. 48
0.32
0.16
-0.08
-0.16
f
O.04
1_--- x 2.32x
0.06
104 O/in 2
0.08 0.10
ME : 1.93x10 -4 in 2 - E PLANE
M H = 0.694x10 -4in 2 - HPLANE
Figure B-2 Phase Shift Per Foot Vs. I/R for E and H Plane Bending
B-7
! LCO. WDL DIVISION

WDL-TR2962(III)
where m is a constant with dimensions of inches 2. m is the slope of theE
llne of Figure B-2 if the ordinate of the curve is normalized to the follow-
ing factor evaluated for the test guide and frequency:
X
c
o 22.32 x 10⁴ /inches
For E-plane bending:
m _ L
c
(R)
.448°/ft.
2.32 x 10⁴°/in 2
m = 1.93 x 10 -4 in2
(I0 ft.)
For H-plane bending:
.0644
m = (" ) (25) in 2
2.32 x 10⁴
m = 6.94 x 10 -5 in2
The resulting equations are then:
E-plane
H-Plane
X
b 2.1.2 1A___ = (19.3 x i0 -5) TT (k--_--)(a ) t_) ( )L c
R > I0 feet
LA---_-_= (6.94 x I0"5)_ (_)(_)2 (I)2 (I)
c
R > 25 feet
(B-9)
(B-10)
B-8
I LCO. WDL DIVISION

WDL-TR2962(III)
These results are useful for rectangular waveguides which have
mechanical bending and flexure properties equivalent to the test waveguide
and subject to the radius of curvature limits indicated.
The phase shift associated with bending can be explained by a mechanical
deformation of the wavegulde cross section. For H-plane bending,
deformation of the waveguide occurs principally by buckling of the wide
dimension instead of the narrow dimension as in the case for E-plane
bending. This buckling will result in a change in impedance only, unless
the deflecting broad sides reduce the _ dimension, which appears to be
the case. The resulting phase shift is of such small consequence as to
be considered negligible.
B-9
WDL DIVISION

WDL-TR2962(III)
APPENDIX C
DEFLECTED ANTENNA PATTERNS
This appendix contains a set of fan beam profiles for each deflected antenna
configuration studied. Three cuts of each beam is shown, at 0 = 90° , 80 ° ,
and 70 ° respectively, where e = 90° corresponds to the subsatellite point.
The cross-sectlons are not normal to the fan beam but instead correspond
to an actual observation for the indicated mounting angle 6. Figures
C-I through C-24 are for a simple cantilever antenna (unguyed), Figures
C-25 through C-27 are for an antenna guyed at three-fourths of its length.
The angle, _ the abscissa in Figures C-i through C-27, is defined by the
equation _= _ - _/2 and is illustrated in Figure 3-3, page 3-8.
In this appendix the spin rate was designated by _ although it was referred
to as (, throughout most of the text.
C-I
I LCO. WDL DIVISION

WDL-TR2962(III)
Il-0zwn_P
0J[d
E
0bJNN
J<
n,'Oz
1.0
0.8
0.6
0.4
0.2
FAN BEAM CROSS SECTION
fI= 2RPS 0 = 90 °
L = 83.8" _M= 0 °
8 : 45 °[
t_
_M _M+s° _+1o °
Figure C-1 Unguyed Antenna Pattern
C-2
I LCO. WDL DIVISION

WDL-TR2962(III)
,1-POz_J
P
OJWE
ObJN
_E
0Z
1.0
0.8
0,6
0.4
0.2
FAN BEAM CROSS SECTION
f_= 2RPS 0 -- 80 °
L = 83.8" _M= 9.4822 __
= 45 °
Z;M-S° Z;M {M +s° _M+I0 °
Figure C-2 Unguyed Antenna Pattern
C-3
ILCO. WDL DIVISION

WDL-TR2962(ZZI)
P
zhl
O.JbJ,T
0bJN
]
n_oz
1.0
0.8
0.6
0.4
0.2
/
F._N BEAM CROSS SECTION _
= 2P.PS 0 = 70 °
L = 83.8" _M = 19.8792 °
8 = 45 °
Figure C-3 Unguyed Antenna Pattern
C-4
ILCOo WDL DIVISION

WDL-TR2962 (III)
"l-t--t9Ztd
I.-.
0._IbJ
,T
r_wN3
a_oz
1.0
0.8
0.6
0.4
0.2
FAN BEAM CROSS SECTION
fI= 2RPS 0 = 90 °
L = 83.8" _M = 00
8 = 30 °
¢-Io" _ -s ° _. _.+s ° _M+io°
Figure C-4 Unguyed Antenna Pattern
C-5
_HILCO. WDL DIVISION

_rDL-CP,2962(m)
1.0
0.8
"l-P(3ZI.d
P(n 0.6
Q.JI.Im
b.
mIdN 0.43<
IZ0z
0.2
FAN BEAM CROSS SECTION
_,= 2R9S 0 -- 80 °
L = 83.8" _M = 16.4902 °
8 = 30 °
_M
i
{M+s° {M+io°
Figure C-5 Unguyed Antenna Pattern
C-6
H ILCO. WDL DIVISION

WDL-TR2962 (III)
1.0
FAN BEAM CROSS SECTION
P.= 2EPS _ = 70 °
L : 83.8" {M---- 35.8617 u
8 = 30°!
0.8
"l-F-(3ZhiEI-
0.6
aJhi
IL
{3hiN 0.4.3<:En,oz
0.2
Figure C-6 Unguyed Antenna Pattern
C-7
,'H I LCO WDL DIVISION

WDL-TR2962(_II)
"rhL_ZWn,m-
aJw
,'7
wN
J
0Z
1.0
0.8
0.6
0.4
0.2
i
FAN BEAM CROSS SECTION
= 2RPS 0 = 90 °
L = 83.8" _M = 00
8 = 60 °
Figure C-7 Unguyed Antenna Pattern
C-8
_HILCO. WDL DIVISION

WDL-TR2962(III)
1.0
0.8
-1-h
zhiEPU) 0.6
C]JhiEc]hiN 0.4J
=EE0Z
0.2
_M-10° _M-5 °
A
m
FAN BEAM CROSS SECTION
= 21_S 0 = 80 °
L = 83.8" _M = 5.46790
= 60 °
II_M _M +5° {M +10°
Figure C-8 Unguyed Antenna Pattern
C-9
PHILCO. WDL DIVISION

NDL-TR2962(III)
I.O
FAN BEAM CROSS SECTION
= 2RPS 8 = 70 °t,I•L = 83.8" _M 1.1. 3432
8 = 60°
"1-I-¢3zLdn,'h(n
OJIdE
13hiN3<_
Iz0Z
0.8
0.6
0.4
0.2
Figure C-9 Unguyed Antenna Pattern
C-lO
aHILCO.-.-. ,..._._j_,_,-_L,,_,_
WDL DIVISION
WDL-TR2962 (Ill)
IPOzhin_P
0.Jhi,T
O,,iN
.J
n_OZ
!.0
0.8
0.6
0.4
0.2
FAN BEAM
= 2RPS
L = 44.7"
8 = 45 °
CROSS SECTION
0 = 90 °
_M = 0 °
_M
Figure C-10 Unguyed Antenna Pattern
C-ll
_HILCO. WDLDIVISION
WDL-TR2962(III)
"1"I-(.9Zwn,I-
C]JhlN
b.
ObJN
-I
n,0Z
1.0
0.8
0.6
0.4
0.2
FAN BEAM CROSS SECTION
= 2KPS _ = 80 °
L = 44,7" _M = 10.0777 °
= 45 °
Figure C-ll Unguyed Antenna Pattern
C-12
mHILCO. WDL DIVISION

WDL-TR2962(III)
"rp.QZwEP
OJhi
h
QhiN"i
E0Z
1.0
0.8
0.6
0.4
0.2
FAN BEAM
_, = 2t_S
/
M
CROSS SECTION
8 = 70 °
{M = 21. 1721 °
Figure C-12 Unguyed Antenna Pattern
C-13
'HILCO. WDL DIVISION

_q_L-TR2962 (III)
1.0
FAN BEAM CROSS SECTION
(
_l= 2R£S 8 = 90
L = 64.2" _M = 0 °
8 = 45 e
"1-I-(3zIdn,I--(n
o_1iJ.Im
IJ.
oidN
.J
.<
IrOZ
0.8
0.6
0.4
0.2
{M+i0 °
Figure C-13 Unguyed Antenna Pattern
C-14
'HILCO WDL DIVISION

WDL-TR2962(III)
1.0
iFAN BEAM CROSS SECTION
= 2RPS 0 : 80 _
L = 64.2' {M : 9.8963 ''
= 45 °
0.8
"l-
OZhi
(/) 0.6
C]JLdr,QhiN 0.4
3<
n,OZ
0.2
_M-10° -5 °M _M
Figure C-14 Unguyed Antenna Pattern
C-15
=HILCO WDL DIVISION

WDL-TR2962(III)
I.O
0.8
"1-I-0zhin,I-(1) 0.6
13-IbJb.
13hiN 0.4
<
IZ0z
0.2
FAN BEAM CROSS SECTION
= 2R/'S (9 = 70"
L = 64.2" {M= 20. 7780 °
8 = 45 °
_M
Figure C-15 Unguyed Antenna Pattern
C-16
_HILCO. WDL DIVISION

WDL-TR2962(III)
1.0
FAN BEAM CROSS SECTION
= 2RPS 8 : 90 °
L = 103.4" _M = On
8 : 45 °
"1"
Ozhin,
U)
aJw
E
QWN
J
OZ
0.8
0.6
0.4
0.2
-5 ° {M M
M-I- 5 o _ M-l" I 0 °
Figure C-16 Unguyed Antenna Pattern
C-17
PHILCO. WDL DIVISION

WDL-TR2962(III)
1.0
FAN BEAM CROSS SECTION
= 2RPS 0 = 80 _o
L : 103.4" _M: 8.7328
8 : 45 °
0.8
2:
zhin,
0.6
0JhiE
ohiN 0.43<
n,0Z
0.2
{M-IO° t_-5 ° t:. {M+5 ° {M+I0 °
Figure C-17 Unguyed Antenna Pattern
C-18
'HILCO. WDL DIVISION

WDL-TR2962(III)
1.0
FAN BEAM CROSS SECTION
O= 2E9S 0 : 70
L = 103.4" {M = 18.2486 °
8 = 45 °I
"i"I-L9Zi,in,
u)
GJi,i
LL
ni,1N
J<
EOZ
0.8
0.6
0.4
0.2
+5 °-s° _M _M_M-IO° _ {M+I0 °
Figure C-18 Unguyed Antenna Pattern
PHILCO.
C-19
WDL DIVISION

WDL-TR2962(ITI)
I.O
FAN BEAM CROSS SECTION
= IRPS 8 = 90 °
L = 83.8" _M= 0 °
6 = 45 °
0.8
-rhQZLdE
(/) 0.6
QJhiE
r_hiN 0.4"i,(=EEOZ
0.2
_M Z;M+S° Z;M+IO°
Figure C-19 Unguyed Antenna Pattern
C-20
PHILCO.,--. _-,_,._,,_,_
WDL DIVISION

WDL-I?.2962(III)
-rI-(3Zhin.'b-
r_.-IbJ
b.
nbJN
<IE
0z
!.0
0.8
0.6
0.4
0,2
FAN BEAM CROSS SECTION
(_= tRPS 0 = 80 °
L = 80.8' _M= 9.98]6 °
8 = 45 °
Figure C-20 Unguyed Antenna Pattern
C-21
HILCO. WDL DIVISION

WDL-TR2962(ZTI)
IPOxhlrt
0ihl
,7ahlN
I<mr_OX
1.0
0.8
0.6
0.4
0.2
FAN BEAM CROSS SECTION
= IRPS 0 = 70 °
L =83.8- _M= 20.9639 °
8 = 45 °
MM +5 {M +10°
Figure C-21 Unguyed Antenna Pattern
C-22
WDL DIVISION

WDL-TR2962(III)
-rPOZi,iEPU)
0JhiITOi,IN3<=EEOz
1.0
0.8
0.6
0.4
0.2
FAN BEAI_I CROSS SECTION
_l= 3RPS 8 = 90 °
L =83.8- _M= 0 °
8 = 45 °
,I
Figure C-22 Unguyed Antenna Pattern
C-23
PHILCO WDL DIVISION
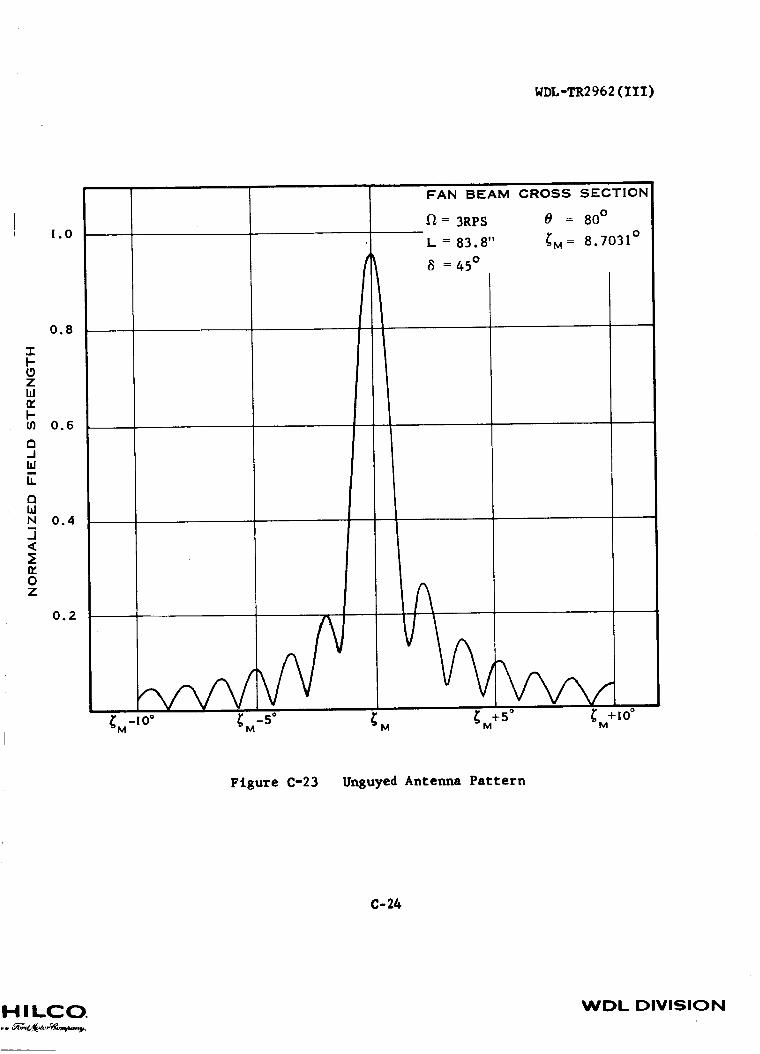
WDL-TR2962(III)
IPOZhln,
oi
0.Jhlm
h
awN
J<
0Z
1.0
0.8
0.6
0.4
0.2
FAN BEAM CROSS SECTION
= 3RPS _ = 80 °O
L = 83.8" _M = 8.7031
= 45 °
Figure C-23 Unguyed Antenna Pattern
C-24
HILCOo WDL DIVISION

WDL-TR2962(III)
IPL_ZbJn,l-
0.JbJE
QWN
3
0z
1.0
0.8
0.6
0.4
0.2
1
F'AN BEAM CROSS SECTIONI
CM-IO° CM-5° Z;M
= 3R9S 8 = 70 °
L = 83.8" {M = 18"19200
8 = 45 °
Figure C-24 Unguyed Antenna Pattern
C-25
=_HILCO. WDL DIVISION

WDL-TR2962(III)
1.0
0.8
"1-I-_3zIdIZI-
0.6
Q_1Id,T
QIdN 0.4..I.<
n,OZ
0.2
FAN BEAM CROSS SECTION
f_= 2RPS 8 = 90 °
L = 83.8" _M= 0 °
8 = 45 °
Figure C-25 Guyed Antenna Pattern
C-26
PHILCO..,..... _,_,._,_
WDL DIVISION

WDL-TR2962 (III)
Tb-
zbJrrb-
r_.JbJ
E
OWN
.<
0Z
1.0
0.8
0.6
0.4
0.2
FAN BEAM CROSS SECTION
= 2RPS 0 = 80 °
L = 83.8" _M = 10.1545 °
8 = 45 °
Figure C-26 Guyed Antenna Pattern
C-27
PH I LCO WDL DIVISION
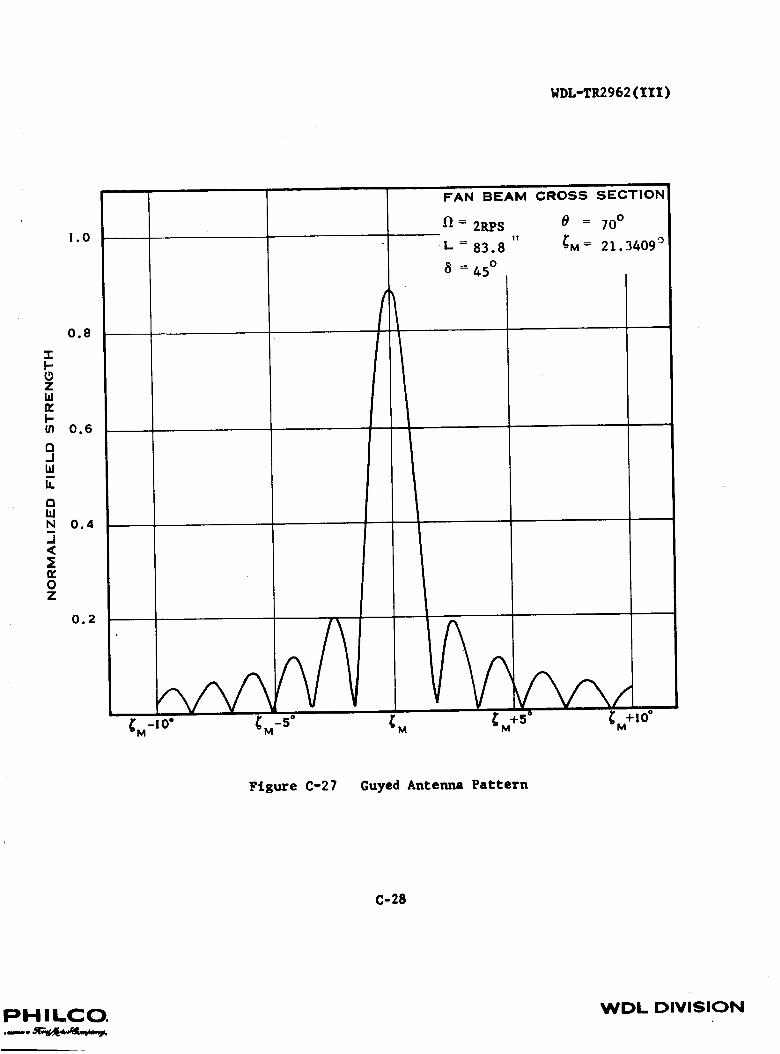
W'DL-TR2962(III)
P
zw
P
O
W
I,
ObJN
3
0Z
1.0
0.8
0.6
0.4
0.2
f
FAN BEAM CROSS SECTIONi
-- 2RPS # = 70 °It
• L =83.8 _M= 21.34090
= 45 °
_M+|O °
FtEure C-27 Guyed Antenna Pattern
C-28
PHILCO..__. _,_,_,r_,.._._
WDL DIVISION

WDL-TR2962 (III)
APPENDIX D
DOUBLE ANTENNA PATTERNS
This appendix contains a representative sampling of the profiles generated
in the double antenna pattern evaluation. On each plot the number of
slots M and N, the horizontal and vertical separation of the antennas
H and V, the phase (¥ = 0 ° or ¥ = 180°), and the angle O (as defined in
the text) are given. Note that these patterns are not for deflected
antennas.
Figures D-1 through D-7 show normal cross sections of a beam in 10 ° steps
from the subsatelllte point.
Figures D-8 through D-12 show similar cross sections with the number of
slots, the antenna separation, and the phase varied.
Figures D-13 through D-18 show some typical pattern generated by a small
number of elements widely separated.
Figures D-19 through D-21 give three different aspects of the same pattern.
Figure D-22 illustrates a pattern generated by a series of pairs of slots.
The slots are spaced as though the antenna consisted of 40 slots of which
slots 3, 4; 7, 8;, 11, 12; etc. were not operating.
Figure D-23 is the pattern formed by a 40 element antenna with a phase
reversal at the midpoint.
Figure D-24 is the pattern formed by a 40 element antenna with a phase
reversal at approximately I/3 of the antenna length.
D-1
PHILCO. WDL DIVISION

1.0
'JDL-TR2962(III)
FAN BEAM CROSS SECTION
M ffi 40 0 = 90 °
N ffi 30 H = 57.7"
¥ = 0° V = 11.8"
"1"I-(3ZIdIZI-(n
Q.JId
QI.IN
IE
0Z
0.8
0.6
0.4
0.2
Figure D-1 Normal Cross Section Showing Effects
of Separation and Misallpment
I)-2
PHILCO._o ,,_=,_,-_,,,p_
WDL DIVISION
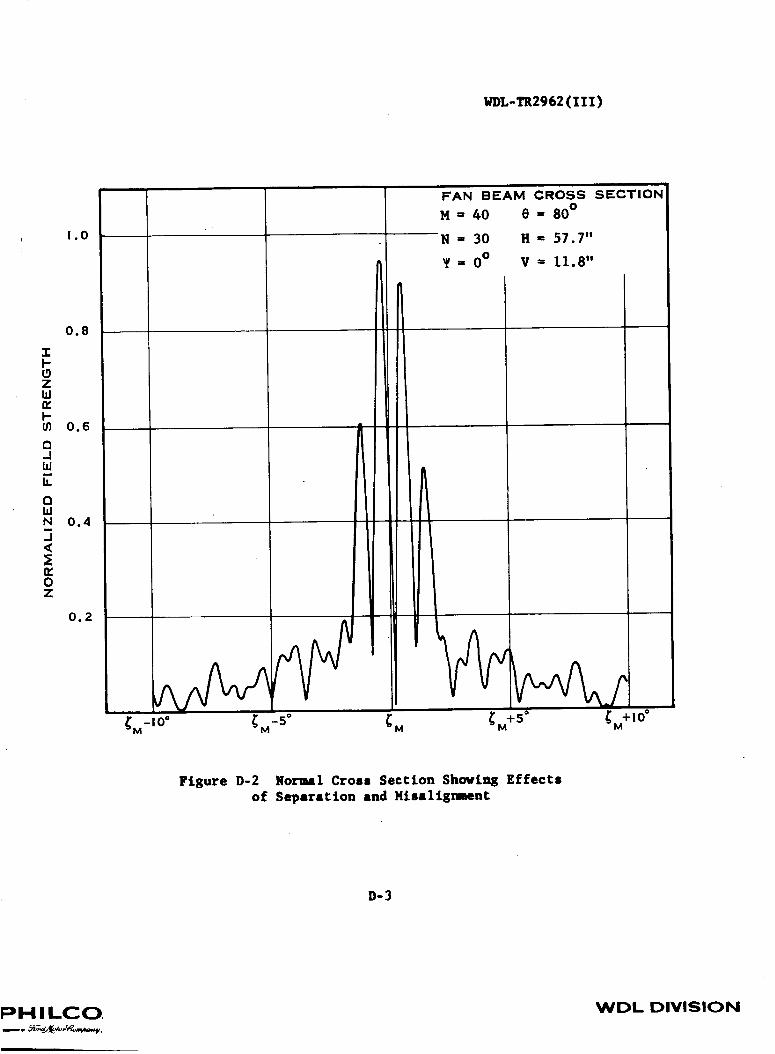
k'DL-TR2962 (III)
-rp-t9ZhirVI"(n
O.Jhi,TOwN
<:E
0z
1.0
0.8
0.6
0.4
0.2
_M-5 ° M
FAN BEAM CROSS SECTION
H " 40 e = 80 °
•N = 30 H = 57.7"
¥ = 0 ° V = 11.8"
Figure D-2 Norawl Cross Section Showing E££ects
of Separation and Hisallgnsmnt
I)-3
PHILCO. WDL DIVISION

WDL-TR2962 (III)
1.0
0.8
"l-PL9ZIdIZP
0.6
O..IId,TQIdN 0.4...i<
n,OZ
0.2
I
_M-10° _M-5 °
FAN BEAM CROSS SECTION
M = 40 0 = 70 °
N = 30 l'l = 57.7"
= 0 ° V = 11.8"
M _ M+5° _M+l°°
Figure D-3 Normal Cross Section Showing Effects
of Separation and Misallgnment
D-4
=_HILCO. WDL DIVISION

Wl)L-TR2962 (Ill)
-rI--0ZI,In,P(/)
Q..iId,TClbJN3.<
IZ0z
1.0
0.8
0.6
0.4
0.2
FAN BEAM CROSS SECTION
M = 40 0 = 60 °
I_l ffi 30 H = 57.7"
ffi 00 V = 11.8"
Figure D-4 Normal Cross Section Showing Effects
of Separation and Mlsallgnment
IPHILCO.._. _._._
WDL DIVISION

_DL-TR2962 (III)
!.0
0.8
"I-I-(3zhin,I-(/) 0.6
C]_1hi
h
abJN 0.4.J<
n,0Z
0.2
II
/
A
_:_-I°° C_-s° CM
FAN BEAM CROSS SECTION
M = 40 0 = 50 °
N = 30 H ffi 57.7"
T = 0° V = 11.8"
M+5 ° _M+IO °
Figure D-5 Normal Cross Section Showing Effects
of Separation and Misallgnment
D-6
)HILCO. WDL DIVISION

k'l)L-TR2962 (III)
1.0
FAN BEAM CROSS SECTION
H = 40 e = 40 °
N = 30 H = 57.7"
¥ = 0 ° V = 11.8"
0.8
-rhL_ZhiEP
0.6
QJhim
h
0hiN 0.43<
n,OZ
0.2
_M-lO° (;M-s° (_ (_ +s° 4;M+io°
Figure D-6 Norsal Cross Section Showing Effects
of Separation and Hisallgnment
I)-7
:_H I LCO. WDL DIVISION

_DL-TR2962(III)
1.0
FAN BEAM CROSS SECTION
M ffi 40 e = 30 °
•N = 30 H = 57.7"
¥ = 0 ° V = 11.8"
P
zhin,I-
O..Jld
LI.
OhiNm
.J,<
IZ0z
0.8
0.6
0.4
0.2
1A
_M _M
I
+5 ° _M+I0 °
Figure D-7 Normal Cross Section Showing Effects
of Separation and Misallgnment
D-8
PHILCO. WDL DIVISION

k'i)L-TR2962 (III)
1.0
0.8
-i-POZIdn_I..-
0.6
Q_1Id
h
Q[dN 0.4.J,<
IZ0Z
0.2
_M
FAN BEAM CROSS SECTION
H = 30 e = 90 °
N = 30 ]'[ = 57.7"
¥ = 0° V = 11.8"
J|
_M+5 ° _M+]0 °
Fisure D-8 Normal Cross Section Showing Effects
of Separation and Nisallgnment
D-9
)HILCO. WDL DIVISION

k'l)L-'rR2962 (1_II)
.1-I--0ztdn,I-U_
0JIdE0bJN
0Z
1.0
0.8
0.6
0.4
0.2
H= 30
Nffi 30
¥= 0 °
A
' /
(; -Io" _M-s ° _
FAN BEAM CROSS SECTION
0 ffi 70 °
H = 57.7"
V _' 11.8"
!_M+s° !;M+IO°
Figure D-9 Normal Cross Section Shoving Effectsof Separation and Hlsallgnment
D-IO
PHILCO. WDL DIVISION

W1)L-TR2962 (III)
P
Zhl
P
QJbJ
EQi,iN
3
0z
1.0
0.8
0.6
0.4
0.2
_-Io" _M-S°
L'LI
'1M
FAN BEAM CROSS SECTION
M = 30 0 = 90 °
N = 30 H = 77.4"
¥ = 0° V = 11.8"
I,
M+5 ° _M+I0 °
Figure P-lO Normal Cross Section Showing Effects
of Separation and Misalignment
0-ii
=_HILCO. WDL DIVISION

k'DL-'l"lt2962(III)
TP
ZW
P
O.Jw
,T
a
N
]
0Z
1.0
0.8
0.6
0.4
0.2
FAN BEAM CROSS SECTION I
'1II
M
M= 40
N= 40
T= 0 °
A " 90 °
H = 77.4"
V = 11.8"
I
Figure D-II Norual Cross Section Showing Effects
of Separation and Hisallgrment
D-12
PHILCO. WDL DIVISION

WI)L-TR2962 (III)
1.0
0.8
Xh
z
EP
0.6
a_1
EnhiN 0.4
E0Z
0.2
_M-10°
A
-5 °M
i
M
FAN BEAM CROSS SECTION
H-- 30 _ = 90 °
N = 30 I,I -- .57.7"
I' = 180 ° V = 11.8"
Figure I)-12 Normal Cross Section Showlng Effects
of Separation and Nisallgra_nt
D-13
HILCO. WDL DIVISION

WDL-TR2962(ZZI)
M = 3 e = 90 °
N = 2 H = 96.9"
¥ = 180 ° V = 11.8"
1.0
0.8
-rI--L9ZIdIZI'-
0.6
13-IId,TQbJN 0.4_3<C
Iz0z
0.2
Figure D-13 Normal Cross Section of Typical Interference Pattern
D-14
)HILCO. WDL DIVISION

IF0zbJ
F
O.JbJ
ObJN
3<
0Z
1.0
0.8
0.6
0.4
0.2
WDL-TP,2962 (III)
Figure D-14 Normal Cross Section of Typical Interference Pattern
D-15
_PHILCO WDL DIVISION

WDL-TR2962 (III)
M= 1 0=90 °
N = 1 H = 96.9"
¥ = 180 ° V = 11.8"
1.0
0.8
"1"I..-(.9ZLdn,I-(/) 0.6
C)JbJE
QIdN 0.43<
n,'0Z
0.2
Figure D-15 Normal Cross Section of Typical Interference Pattern
D-16
PHILCO. WDL DIVISION

k'I)L-TR29 62 (Ill)
1.0
0.8
"l-P13ZhirvP(Jr) 0.6
{3Jhi
h
nhiN 0.43.<:ErvOZ
0.2
{M--I.O °
FAN BEAM CROSS SECTION
H = 3 8 = 90 °
M+ I. 0 °
Figure D-16 Detall of Typlcal Interference Pattern
D-17
)HILCO. WDL DIVISION
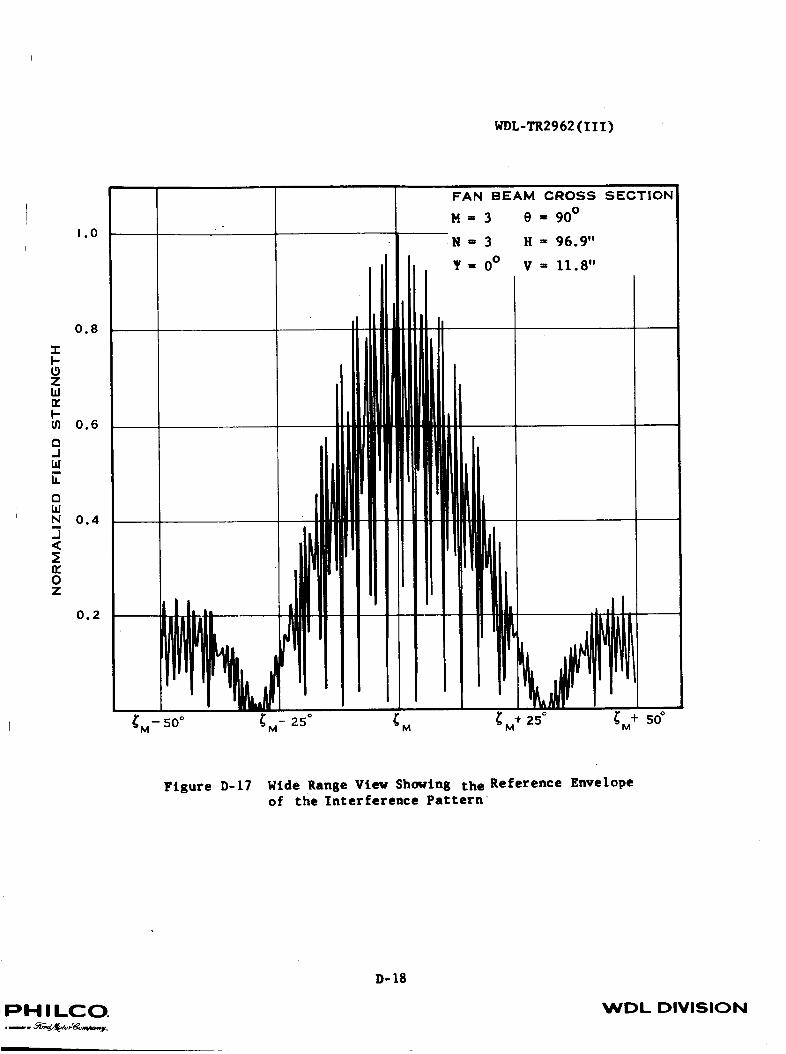
WDL-TR2962 (III)
"1"I-OZhin,I"O
0JIdh
QhiN
.¢
n,OZ
1.0
0.8
0.6
0.4
0.2
_M--
11 :0oII il ,,,
,iIIU III1,
FAN BEAM CROSS SECTION!
H = 3 0 = 90 °
R = 96.9"
V = 11.8"
Figure D-L7 Wide Range View Showing the Reference Envelopeof the Interference Pattern
_PHILCO.
D-18
WDL DIVISION

WDL-TR2962(III)
.l-t--t9zbJn,
0.JbJ
nLt]N
.J
n,OZ
1.0
0.8
0.6
0.4
0.2
A JLi1 rl
LI
!
I- vV
FAN BEAM CROSS SECTION
Mffi 3 Offi90 °
Ni3¥ 0 (
i
H = 96.9"
V ffi 11.8"
' r
,J!
{M- 50o _M- 25° _M {M + 250 M + 50 °
Figure D-18 Broad _eam Cross Section Showlng How
Mlsallgnment Causes Interference in Long Dimensions
D-19
_HILCO. WDL DIVISION

tn)L-TR2962 (III)
1.0
0.8
-l-P0Zwn_P
O.G
o.JW
b.
oWN 0.4-I,<
n,0Z
0.2
i
FAN BEAM CROSS SECTION
M = 20 0 = 90 °
_M -sO° _M- 25° _M _M "25° _M"1-sO°
Figure D-19 Broad Beam Cross Section of Two Antenfias With No Misallgmnent
D-20
PHILCO. WDL DIVISION

1.0
WDL-TR2962 (III)
' FAN BEAM CROSS• N ffi 20 p = 90 °
•N = 20 H ffi 9.8"
¥ = 0 ° V = 0"
SECTION
"1"I-
ZIdn,I--U_
OJIdEQI,IN3<
n,0z
0.8
0.6
0.4
0.2
li
IIJ 1,
{;M-s°° rM- 25° rM rM+ 2_ _M+ so°
Figure D-20 Normal Cross Section of Antenna Pattern With No Misallgrnnent
1)-21
_HILCO. WDL DIVISION

k'DL-TP,2962(IZI)
1.0
FAN BEAM CROSS SECTION
H = 20 () = 90 °
H = 20 H = 9.8"
¥ = 0 ° V = O"
I.-
ZLdn,I-(n
Q.JId,TQI,IN5,<IE
0Z
0.8
0.6
0.4
0.2
(:-lo ° ¢-s ° ¢. CM+s° (:M+lO°
Figure D-21 Normal Cross Section of Antenna Pattern With No Hlsallgrment
D-22
PHILCO.._o _.,,ej_,-_,_.,_..y.
WDL DIVISION

WDL-TR2962 (III)
1.0
0.8
"rI--Ozhin,
U) 0.6
a.J
h
OI,IN 0.4J<:En,0Z
0.2
FAN BEAM CROSS SECTION
H = 10 O ffi 90 °
N ffi 10 H ffi 25.4"
¥ = 0 ° V = 0"
Figure D-22 Antenna Pattern Generated by a Sequence of Slot Pairs
D-23
PHILCO. WDL DIVISION

WDL-TR2962(III)
1.0
FAN BEAM CROSS SECTION
H = 20 0 = 90 °
R = 20 H ffi .98"
¥ = 180 ° V = 0"
h0zhi
h
O
hiEQhiN
<
0Z
0.8
0.6
0.4
0.2
\_M-10= [M+S° [M+'O°
Figure D-23 Antenna Pattern With Phase Shift at Midpoint
D-24
_HILCO. WDL DIVISION

WDL-_2962 (III)
1.0
FAN BEAM CROSS SECTION
M = 26 _ = 90 °
N ffi 14 H = .98"
¥ ffi 180 ° V = 0"
0.8
IPOzhi
P0.6
Q
hi,T
QhiN 0.4.3<C
n,0z
0.2
_;M-I°" Z_M-S° _M Z_M+S° M+ I0°
Figure D-24 Antenna Pattern With Phase Shift Not At Midpoint
D-25
mHILCO.. ,._-.,,_,_,_,-_..,¢,_
WDL DIVISION