
اهییابیز قلاخ مان هب - iacld.ir -1-2-96.pdf · Case study A four-year-old female...
39
نام خالق زیباییها به
-
Upload
nguyenxuyen -
Category
Documents
-
view
213 -
download
0
Transcript of اهییابیز قلاخ مان هب - iacld.ir -1-2-96.pdf · Case study A four-year-old female...

به نام خالق زیباییها

Principle of flowcytometry
&
diagnostic applications

Principle of flow cytometer
Diagnostic applications
Introduction of BriCyte E6

Principle of flow cytometer
Principle of sheath flow
Principle of fluorescence
Principle of optical filter
Principle of signal detection
Reaction of antigen and antibody
Principle of fluorescence staining
Data analysis
Leakage and compensation of fluorescence

Principle of sheath flow
Laminar flow
Turbulent flow
Fluid motion
Laminar flow
Turbulent flow
A fluid flows in parallel layers, with no disruption between the layers
The fluid flows are no longer keep laying and the layers are confused
Sheath flow
Sample flow
Flow cell
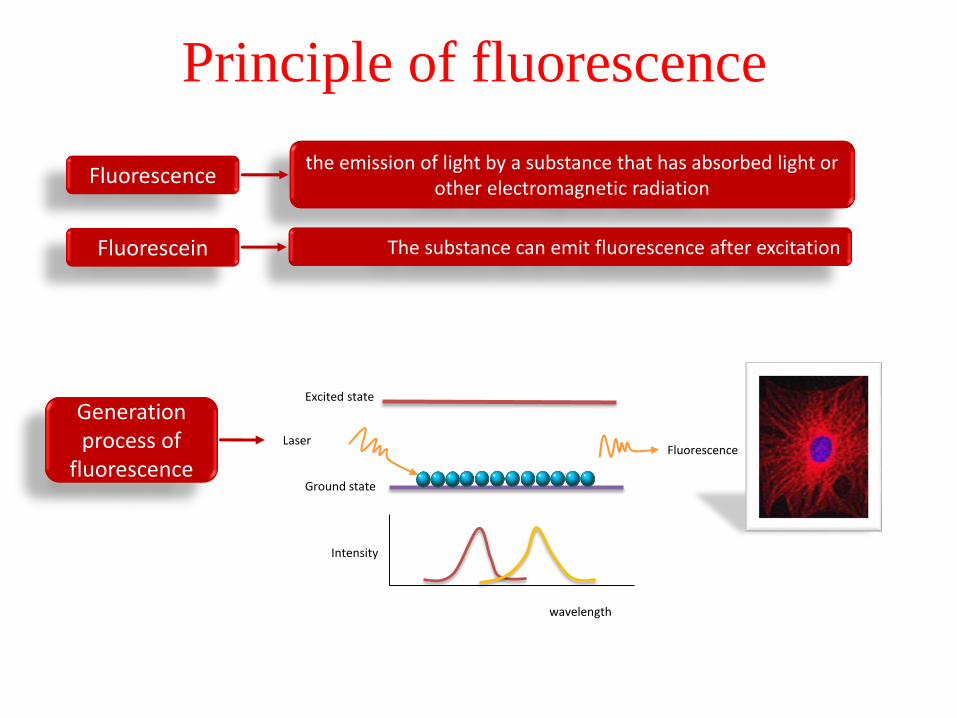
Principle of fluorescence
the emission of light by a substance that has absorbed light or other electromagnetic radiation
Fluorescence
The substance can emit fluorescence after excitationFluorescein
Generation process of
fluorescence
Excited state
Ground state
Laser Fluorescence
wavelength
Intensity

Principle of optical filter
480 535 580 480 535 580
530LP 530LP 530/30LP
480535 580
Optical filter
Long pass filter(LP)
Short pass filter(SP)
Band pass filter(BP)

Principle of signal detection
Forward scatter(FSC)
Side scatter(SSC)
fluorescence(FL)
FSC detector
FSC detector
SSC detector SSC detector
t
v
Height (H)
Width (W)
Area (A)
Signal detection

Principle of fluorescence staining
Fluorescent probe
Role of fluorescein
Fluorescence label
Fluorescein
fluorescein antibody Cell with antigen
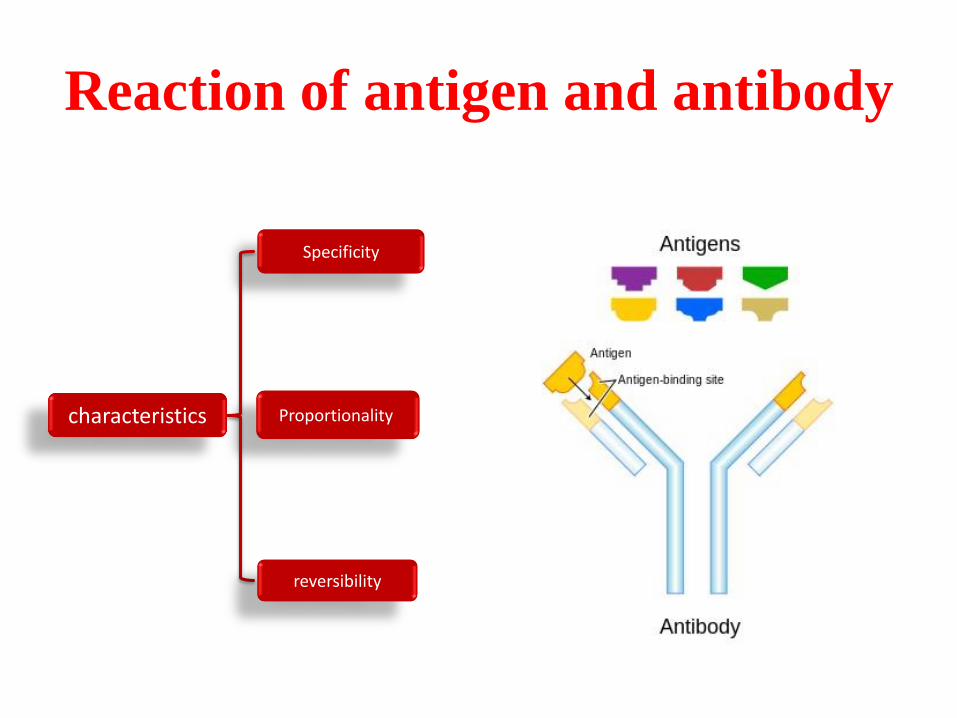
Reaction of antigen and antibody
Specificity
Proportionality
reversibility
characteristics

Principle of measuring
FL4
FL6
FL5(PE-cy7)
FL3(PerCP)
FL2(PE)
FL1(FITC)
SS
488/10
530/30
FS
488/10
585/40
670LP
785/60
491/LP
550LP
645LP660/20
785/60740LP
488/10
反光镜
t
v
FL6(APC-cy7)
FL4(APC)
反光镜
t
vt
v
t
v
t
v
t
v
t
v
t
v
FSC
SSC
FL1
FL2
FL3
FL5

Lasers and fluorescein
488nm:– FITC
– PE
– PerCP
– PerCP-Cy5.5
– PE-Cy7
– PE-Cy5
– PE-Texas Red
638nm:– APC
– APC-Cy7

Data analysis—Graphs
Histogram
Data Presentation
Dot plot
Contour plot
Density plot
3-D plot

Data analysis—Gate
Polygonal gate & Quadrant gate
Interval gate & Bifurcated gate

Data analysis—statistics
Percentage 、absolute number
mean、SD、CV……
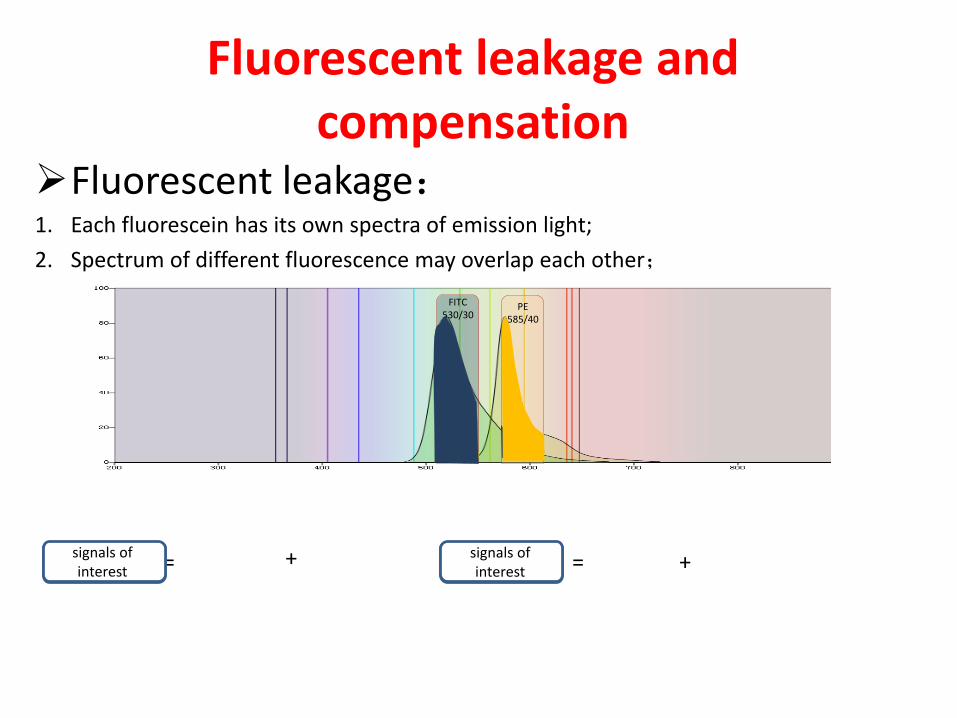
Fluorescent leakage and compensation
FITC530/30
PE585/40
+ += =
Fluorescent leakage:1. Each fluorescein has its own spectra of emission light;
2. Spectrum of different fluorescence may overlap each other;
Signals in FITC channel
signals of interest
Signals in PE channel
signals of interest

Fluorescent leakage and compensation
FL1
FL2
Q1 Q2Q3 Q4
FL1
FL2
FL1
FL2
FL1
FL2
Eliminate the signals in FL2 from FL1
Eliminate the signals in FL1 from FL2
Y-medianQ3=Q4
X-medianQ1=Q3
Q1 Q2Q3 Q4
Q1 Q2Q3 Q4
Q1 Q2Q3 Q4

Diagnostic applications
Leukaemia diagnosis
Immune deficiency diagnosis
Predicting response to mono clonal
antibody therapy
Rare event detection
Screening for genetic disease

Case studyA four-year-old female
Lethargic for three weeks without clear cause.
petechiae on her arms and legs
low platelet count
Examination of a blood film immature cell (blast).
A bone marrow slide A large population of small blasts with scanty cytoplasm
samples of anticoagulated bone marrow.
Flow cytometryCD2 (pan T-cell) and CD7 (pan T-cell)
CD10 (precursor B-cells) and CD19 (pan B-cells)
CD33 (myeloid cells) and CD45 (pan leukocyte)
Cytoplasmic CD3 (pan T-cells), cytoplasmic CD79a (pan B-cells) and
cytoplasmic myeloperoxidase (pan myeloid cells)
precursor B-cell acute lymphoblastic leukaemia (ALL)
Leukaemia diagnosis

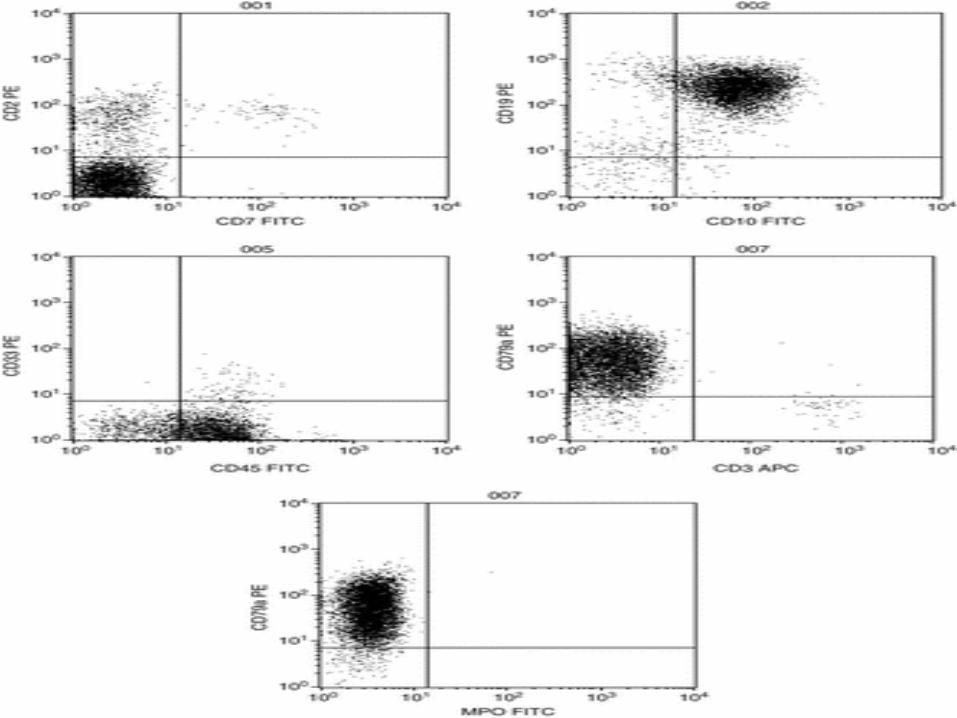

Interpretation
The cells were positive (>20% expression) for CD19, CD10 and cytoplasmic CD79a
Interpretation of leukemia immunophenotyping data: expression of non-lineage markers(CD13 in a case of B precursor ALL = aberrant expression
The specificity of different markers in the assignment of lineage is recognized in a scoring system which allows distinction between leukemia cases with aberrant expression of a marker from the far rarer cases where two distinct lineages are involved in the leukemic process (mixed phenotype acute leukemia)

Immune deficiency diagnosis
Case study A four-year-old male with recurrent ear infections
a full blood count and immunoglobulin are requested.
The immunoglobulin results are as follows:
IgG = 0.97 g/L (reference range 5.9–15.5 g/L);
IgA = 0.06 g/L (reference range 0.4–2.0 g/L);
IgM = 0.08 g/L (reference range 0.5–2.1 g/L).
Flow cytometry is requested to enumerate T, B and NK cells.
Flow cytometry
Total lymphocyte count = 3.1 × 10⁹/L (normal)
CD3 (total T-cells) = 89%, absolute count 2.76 × 10⁹/L (reference range 1.8–3.0 × 10⁹/L)
CD4 (T helper cells) = 65%, absolute count 2.02 × 10⁹/L (reference range 1.0–1.8 × 10⁹/L)
CD8 (T suppressor/cytotoxic cells) = 24%, absolute count 0.75 × 10⁹/L (reference range
0.8–1.5 × 10⁹/L)
CD19 (B-cells) = <1%, absolute count <0.01 × 10⁹/L (reference range 0.7–1.3 × 10⁹/L)
CD16+CD56+ (NK cells) = 11%, absolute count 0.34 × 10⁹/L (reference range 0.2–0.6 ×
109/L)

Interpretation
Hypogammaglobulinaemia and absent B-cells suggestive of a primary immune deficiency associated with defects in Bruton's tyrosine kinase (Btk).
This can be confirmed by Western blotting for Btk protein and genetic analysis.
Other causes of absent B-cells with hypogammaglobulinaemia include thymoma, common variable immune deficiency, related to therapeutic drugs or other rare congenital defects in the B-cell development pathway.

Predicting response to monoclonal
antibody therapy
Humanized monoclonal antibodies therapeutic
use
Rituximab :anti-CD20 present on B-cells
Gemtuzumab :anti-CD33 present on myeloid
cells
Alemtuzumab :anti-CD52 present on lymphoid
cells

Case study A 48 -year-old female with a diagnosis of CLL has had a poor response to
first-line chemotherapy.
the addition of immunotherapy with Alemtuzumab.
Prior to commencing treatment, assess the expression of CD52 on the patient's tumor cells.
Flow cytometry
The following antibody combination is used:
CD52 (binding site for Alemtuzumab), CD19 (pan B-cells), CD5 (pan T-cells and B CLL cells) and CD3 (pan T-cells).
The expression of CD52 is assessed on these cells. The expression of normal T-cells within the sample (CD3-positive) acts as a control confirming the activity of the CD52 antibody. (All normal T-cells highly express CD52).
Interpretation
The malignant cells express CD52. This confirms that it would be reasonable to use Alemtuzumab in this patient.

Rare event detection
High-speed analysis coupled with multicolour staining essential for rare events
Detect residual leukaemic cells after the initiation of therapy (MRD)
Rh(D)-positive fetal red cells transferred to an Rh(D)-negative mother across the placenta at birth
estimating the progenitor cell content in bone marrow transplantation
enumeration of contaminating white cells in filtered blood
detection of abnormal red and white blood cells in patients with bone marrow failure disorders (subclinical PNH clone detection)

Case study
A 56-year-old male who is being treated for B-cell non-Hodgkin's lymphoma
peripheral blood stem cell (PBSC) collection following his fourth course of chemotherapy
The stem cells will be stored to allow an autologous PBSC transplant as part of his future therapy.
To allow the collection to be timed to ensure the efficient collection of PBSCs
peripheral blood progenitor cell count is measured from the first day of neutrophil recovery.
Flow cytometry
Peripheral blood CD34 count (progenitor cells) enumeration

A graphical representation of absolute CD34 count in cells per microlitre is shown for
consecutive days
Peripheral blood CD34+ cell counts measured on consecutive days following
chemotherapy in a patient with non-Hodgkin's lymphoma
Reliable counting of rare events needs large numbers of events
To achieve an intra-assay coefficient of variation of 10%, 100 positive events need
to be collected.
In practice, this means that between 500,000 and 1 million cells need to be
acquired.

Screening for genetic disease
Some genetic diseases result in the failure to
express a protein on the surface of cells
This methodology is employed in the
investigation of platelet disorders
(Glanzmann's thrombasthaenia and Bernard–
Soulier syndrome)
leukocyte adhesion deficiency
X-linked hyper IgM syndrome

Case study
A nine-month-old male with respiratory distress.
There is no history of HIV in the family and the child tests negative for HIV.
PCP is confirmed by culture
The lymphocyte count and T- and B-cell subsets are normal.
Immunoglobulins show undetectable IgG and IgA with a normal IgM.
X-linked hyper IgM syndrome is suspected and samples are sent to check for normal expression of CD40 ligand

Flow cytometry
Whole blood from the patient and control are incubated for six hours at 37°C with phorbolmyristate acetate and calcium ionophore to activate the cells. Aliquots of activated whole blood are stained with the following combinations:
CD3 (pan T-cells) and CD154 (CD40 ligand)
CD3 (pan T-cells) and CD69 (activation marker).


Introduction of BriCyte E6
Characteristics
Characteristics
Carrousel mode& Single tube mode
Compatible for more tubes
Convenient voltage adjusting
Automatic compensating
More suitable for clinical application
Support LIS

Configuration
Loading mode
Manual loading
Auto loading
Optical system
2-laser,4-color
2-laser,5-color
2-laser,6-color

Characteristics
Flow Rate
Low rate:~ 10μL/min
Mid rate:~ 50μL/min
High rate:~ 100μL/min
Data Format : FCS3.0/export built-in data
format
Dynamic Range :20 Bit
Workstation Resolution:2 ^ 20

Parameters
Types: FSC, SSS and FL1-FL6, each channel includes peak value (Height), pulse integration(area), pulse width, time and self-defined parameters (including ratio etc.), with the enumeration of CD3/4/8 absolute number and percentage
Quantity: 8×4+N (8 is the number of channels: FSC, SSS, FL1-FL6; 4 is the parameter quantity of each channel: H、A、W and T; N represents the number of self-defined parameters)

Characteristics
• Minimum Sample Volume :100 μL
• Max Acquisition Rate :12,000 events/sec

Thank you


![Mycology - Dr. Hashemi.ppt - iacld.ir · A yeastA yeast--like dematiaceus fungus, ... Erythrasma Definition: ... Mycology - Dr. Hashemi.ppt [Compatibility Mode] Author: bathaei](https://static.fdocuments.us/doc/165x107/5ad803fa7f8b9ab8378cd5eb/mycology-dr-iacldir-yeasta-yeast-like-dematiaceus-fungus-erythrasma.jpg)
![Teske - Anaemia [Compatibiliteitsmodus] · • bleeding (petechiae, ecchymoses, melena, hematuria, hematomas) • fever • splenomegaly Additional Clinical Symptoms: Anaemia Non-Regenerative](https://static.fdocuments.us/doc/165x107/5c8c870a09d3f2804e8c0316/teske-anaemia-compatibiliteitsmodus-bleeding-petechiae-ecchymoses.jpg)


