;~ I ; i l-----------------~~------------------------ nCJrs · age ra.n.ae with eo_ identifyil1l...
18
'I 1 I i National Criminal Justice Reference Service __________________________ __ Ii· nCJrs This microfiche was produced from documents received for inclu:::ion in the NCJRS data base. Since NCJRS cannot exercise control over the physical condition of the documents submitted, the individual frame quality will vary. The resolution chart on this frame may be used to evaluate the quality. ""'1.0 2.0 ""'1.25 11111 1.4 "'" 1.6 MICROCOPY RESOLUTION TEST CHART NATIONAL BUREAU OF STANDARDS-1963-A Microfilming procedures used to create this fiche comply with the standards set forth in 41CFR Points of view or opinions stated in this document are those of the author(s) and do not represent the official position or policies of the U. S. Department of Justice. National Institute of Justice United States Department of Justice Washington, D. C. 2ofi31 15/3)./85 I ij H i I ; , j \ U.S. Department of Justice National Institute of Justice This document has been reproduced exactly as received from the person or organization originating it. Points of View or opinions stated In this document are those of the authors and do not necessarily represent the official position or pOlicies of the National Institute of Justice. Permission to reproduce material has been granted by Public Danain Bureau of Justice Statistics to the National Criminal Justice Reference Service (NCJRS). Further reproduction outside of the NCJRS system requires permis- sion of owner. • , Jl . OF INCARCERATION RATES: Explaining the Pattern of Incarceration Between and 1979 1/ Charles F. Wellford Laure Weber Brooks ... Institute of Criminal Justice & Criminology University of Maryland April, 1984 *The research reported in this paper was supported by the Bureau of Justice Statis- tics. Points of view or opinions stated in this document are those of the authors and do not necessarily represent the official points or policies of the Bureau of Justice Statistics. 4
Transcript of ;~ I ; i l-----------------~~------------------------ nCJrs · age ra.n.ae with eo_ identifyil1l...

'I ;~
1
I
i National Criminal Justice Reference Service l-----------------~~------------------------__________________________ __
Ii· nCJrs This microfiche was produced from documents received for inclu:::ion in the NCJRS data base. Since NCJRS cannot exercise control over the physical condition of the documents submitted, the individual frame quality will vary. The resolution chart on this frame may be used to evaluate the docum~nt quality.
""'1.0
""~ 2.0
""'1.25 11111 1.4 "'" 1.6
MICROCOPY RESOLUTION TEST CHART NATIONAL BUREAU OF STANDARDS-1963-A
Microfilming procedures used to create this fiche comply with the standards set forth in 41CFR 101~11.504.
Points of view or opinions stated in this document are those of the author(s) and do not represent the official position or policies of the U. S. Department of Justice.
National Institute of Justice United States Department of Justice Washington, D. C. 2ofi31
15/3)./85
I ij H i
I ; , j
\
U.S. Department of Justice National Institute of Justice
This document has been reproduced exactly as received from the person or organization originating it. Points of View or opinions stated In this document are those of the authors and do not necessarily represent the official position or pOlicies of the National Institute of Justice.
Permission to reproduce thiS~ted material has been granted by
Public Danain Bureau of Justice Statistics
to the National Criminal Justice Reference Service (NCJRS).
Further reproduction outside of the NCJRS system requires permission of !he~t owner.
• , Jl .
CORRELA~ OF INCARCERATION RATES:
Explaining the Pattern of Incarceration Between ~970 and 1979 1/
Charles F. Wellford Laure Weber Brooks
~, ... ~
Institute of Criminal Justice & Criminology University of Maryland
April, 1984
*The research reported in this paper was supported by the Bureau of Justice Statistics. Points of view or opinions stated in this document are those of the authors and do not necessarily represent the official points or policies of the Bureau of Justice Statistics.
4

~~~_'_. _________ ~ __________________ ~-r ____________________ __ ...
A. Problem
Recently, a Bureau of Justice Statistic'S Bulletin disclosed that
-" "state prison populations have risen at an alarming rate of 18% since
1979 and this increase was not accompanied by a commensurate increase in
prison capacity. As a result, prison overcrowd~ng has become a major
concern to criminal justice policy makers and the public. The rapid
increase in prison populations that we as a nation have recently
experienced suggests that attention should be paid to what factors or
characteristics of the population are associated with incarceration
rates. The present research identifies and examines possible indicators
o~ incarceration rates in an attempt to explain, in a statistical sense,
recent increases in prison populations. This research may provide a-base-
line of expected levels of imprisonment against which various states can
compare their prison populations.
B. Literature Review
This section will examine the literature on the impact on incarcer-
ation rates of certain structural variables (age composition, unemployment
rates, regional location), crime variables (crime reports and arrests
for violent and property crime), and legal variables (sentencing policies,
use of alternatives to incarceration, and increases in prison capacity).
In recent years considerable iittention has been given to the patterns
of rates of imprisonment. In a series of landmark articles, Blumstein et.
al~ observed that over a forty-year period the trends in prison rates
were relatively stable (Blumstein and Cohen: 1973; Blumstein, Cohen and
Nagin: 1979; Blumstein and Maitra: 1979; Blumstein, Cohen and Nagin:
1981). Although Rauma, among others, has questioned these findings (Rauma:
Page 1
«
." ." .....
IM1). the B1U1M1tein von: ball focUlMlil eou1derable attet10a OIl the 1uue of
prison population growth. While observing that • "stability theory" but
eharacterizes a considerable amount of the history of prison rates, Bl~
stein et al (1981) state:
t~e are surprised, for example that no attention was paid to the significant growth of 40 percent in the United States imprisonment rate from 1971 to 1978. It is entirely possible that American society is becoming inherently more punitive... Alternatively the increase might reflect the demographic consequences of aging the post-war baby boom ••• " (1807-1808)
Blumstein et a1 (1981) suggested other elements that might influence im
prisonment rates as did Rauma (unemployment levels) and Blumstein and
Moi-tra (region). In short, while over .10ng periods of time imprisonment
rates may show stability, in the 1970's they experienced rapid rates of
increase. It has been suggested that these increases can be accounted for
by changes produced in the structural, crime and legal factors noted above.
The suggested sources of the increase in prison populations to be analyzed
in this research are age composition, unemployment, regional location, crime
and arrest rates, changes in sentencing policy, the use of alternatives to
1 incarceratjon. and increases in prison capacity.
1. Age Co~position. Research has suggested that the age structure
of society and the changing age composition is a factor that must be considered
when examining crime rates and crime rate fluctuations (Sagi and Wellford:l967).
Examinations of official arrest statistics and prison population statistics
reveal a deftnite age range which appears to incorporate the majority of
offenders and inmates. In a survey of state prisoners, it was found that the
majority of state prisoners fell between the ages of 18-29 (BJS Bulletin:
1983). Other studies have also examined this idea of a high. crime-prone
age ra.n.ae with eo_ identifyil1l the ranle of 18-25 (Carroll and Doubet:
Pase 2
",

" ... p
1983; Joubert et al:1981) ~thin others noting that criminal behavior be-
gins early, increases in early 20's ~nd tends to decline th~reafter until age
30 when the majority of criminal car~ers terminate (Petersilia, Greenwood, and
Lavin:1978). If age composition or high rates qf individuals in the 18-29
year old age range is associated with higher total crime and ~prjsonment rates, . . than we would expect that areas with a large percentage of their total popula-
tion falling within this age range would have higher rates of imprisonment.
2. Unemployment. Unemployment rates can be thought to be indicative
of the economic status of an area. Economic conditions may playa role in
levels of crime and levels of imprisonment directly by encouraging indiv-
iduals to engage in criminal behavior and thus increasing one's risk of
imprisonment, or indirectly, by a~fecting the overall economic status of an
area and the resources the area has to deal with law violators (police de
ployment, prison capacity~ etc.). Freeman (1983) concluded from his review
of several studies on unemployment and crime rates, that rises in unemploy
ment and/or labor participation rates are associated with rises in the crime
rate. Blumstein et al (1983) have suggested that unemployment may have a
direct effect on prison populations through its role in individual sentencing
decisions. It is contended by Blumstein et al (1983) that since employ-
ment history is a consideration ip determining rehabilitative potential
of offenders, lack of stable employment might increase the likelihood of
offenders receiving incarceration as their sentence. In lieu of this,
these scholars argue that general unemployment rates should be considered
in any research on imprisonment rate.. Joubert et al (1981) also recognized
the need to consider .ocioeconomic conditione in their Btudy of prison
'ap3
......... ' ...... "'." ... '- ... ,. .. ~
, , ,
admissions but they have heen criticized by Carroll and Doubet (1983) for
using per capita income rather than unemployment rates as their measure
of economic conditions.
3. Geographic Location. Regional Variation may effect sentencing
policies and thus effect imprisonment rates. ", Southern states. haye fre-
quently been cited as having higher rates of incarceration than states in
other geographic locations (Blumstein and MOitra:1979). Carroll and
Doubet (1983), in their study of prison admissions, found that region
(dummy variable for South) was the variable which had the strongest direct
effect on the prison admission rate, with location in the South associated
with high levels of imprisonment. Explanations for this relationship include
the notion of the Gastil-Hackney hypothesis which-characterizes the South
as having a cultural tradition of violence that is independent of situa-
tional factors (Gastil:197l). While Loftin and Hill (1974) have demonstrated
the weaknesses of the research testing this proposition, the observation that
imprisonment rates and cr~e rates vary by region is uncontested.
4. ~ Report ~ and Arrest Rates. High leyele of crime might
affect incarceration rater, either by increasing the number cf people at
risk to incarceration or by acting as a consciousness-raising factor for
the justice system. Previous research on crime and crime rates found that
reports of increased crime had strong effects on prison admissions (Joubert
et al:1981; Carroll and Doubet:1983). Carroll and Doubet (1983) found that
reported property crime itself did not significantly effect prison admissions
but the rate of reported violent crime had a strong positive effect (B-.53 on
rates of prison admission. To aggregate both property crime and violent crime (as
Page 4
L-__________________________ ~ ______ ~~ ______ ~~~~.,~ __ ~_~_

did Joubert et al: 1981) is, according to Carroll and Doubet (1983), to
ignore the different effects that these two very different types of crime
may have on prison admissions and to underestimate the effect that re-
ported violent crime has on the prison admission rate. Reports of crime
may indeed affect incarceration rates but it seems that arrests for crime
might also be important in predicting prison rates. Arrests are even one
s~ep closer to an end product of incarceration than a report of a crime.
Therefore, it is expected that arrests for violent crime and for property
crime should more positively associate with incarceration rates than the
rates of Violent, property or total crime.
5. Sentencing Policy. The type of sentencing policy an area has
(mandatory, determinate, indeterminate, presumpti~e) may playa role in
incarceration rates. Sentencing policy, especially the existence of a
mandatory and/or determinate sentence law could be expected to directly
OL~fect both the number of offenders sent to prison and the length of time
an offender serves before release from prison (BJS Bulletin:1983). Under
determinate sentencing, parole boards can not release prisoners until their
sentences have expired (~nus good time) and mandatory sentence provisions
requ~re a specific prison terms for every person convicted of a certain
offense. Thus, it seems likely that. offenders who are convicted and
sentenced under these laws would spend longer time in prison due to
the "no release" policy. It is also possible,· though, that the existence
Qf a mandatory and/or determinate sentence policy will have a deterrent
·effect and therefore less crime will be committed. resulting in fewer
commituents to prison i~ general.
Page 5
"
__ znn
6. Parole Use. Heavy reliance on parole should decrease the in-
carceration rate and conversely, areas in which parole is rarely relied
on would be expected to have higher rates of incarceration simply because
options are more limited.
7. Increases in Prison Capacity Due to the Construction of New State
Prisons. "Periods of prison construction", as Blumstein et al (1983) term
the increases in prison capacity due to the opening of new faCilities, may
be associated with prison populations. Prison capacity and its effect on
prison populations has been a subject of some debate. There are those who
argue that capacity is a major factor in predicting increases in prison
populations, while others suggest that increases in prison capacity might
be just one of the many factors which predict incarceration rates and it
is not a dominant factor. Increases in prison capacity might lessen the
concerns of judges about sentencing offenders to already overcrowded
institutions and thus could lead to increases in incarceration rates
(Blumstein et al:1983). Therefore, increases in prison population due to
the building of new facilities could be a variable that may explain prison
population fluctuations.
C. Methodology
The present research is an analysis of annual data collected on the
50 states during the period of 1970-1979. This involved utilizing a wide
variety of data bases with the aim of predicting annual incarceration
rates. Each variable included in the analysis is discussed in turn.
1. Dependent Variable--State Incarceration Rates. An incarceration
rate for each state for each year in question was calculated by dividing
the total number of persons in custody of the state correctional facil-
ities on the last day of the year by the total annual population figure of
Page 6

..
the state.2
Alternative denominators were used in preliminary analyses
but as they produced BP substantial differences in results the more
frequently utilized denominator of total population is used in the re
mainder of the paper. This rate includes only those prisoners who have
sentences of at least one year and one day. Additionally, inmates who were
housed in local jails due to overcrowding of state facilities were included
in this rate.
2. Independent Variables. The factors noted above were operationa1ized
in a very straight forward manner. The percentage of each state's total
population that falls within the 18-29 age range was used as the indicator
of age composition. Annual unemployment rates were collected for each state.
4 . A dummy variable for region (South =1) was created. Reported crime rates
were created by dividing the total number of crimes reported each year in
the Uniform Crime Reports by the total population of each state. Property
and violent report rates were examined separately. Annual arrest data were
obtained for each state by offense, by property and violent subtotals and
for all offenses and were divided by the total population of the state.
Adjustments to these rates were made to account for the fact that there was
some variation in the number of agencies that reported arrest data each
year.5
The existence of. any mandatory sentencing policy and an underly.ing
determinate sentencing policy were dummy coded into two separate variables
(Mandatory=l and Determinate =1) because it is possible to have one without
the other. Parole use was measured by the number of parole releases
(defined as state inmates Who are granted discretionary conditional
release followed by a time of supervision in the community) divided by the
number of total releases. Parole data were unavailable for the first four
~age 7
<
years of analysis (1970 -1973). Fin~lly, a prison capacity increase
variable was calculated by Summing the incr.eases in capacity due to the
opening of new facilities. The estimated number of inma,tes that could be
housed in these new facilities was counted as the capacity increase
and zero capacity increase scores were assigned to stat7
s and years
of specific data sources.)
during which no few facility was built. (See Appendix A for a listing
3. Statistical Technique. The statistical technique utilized was
multiple regression. For the analyses involving all the independent
variables with the exception of the parole data, the total number of
cases utilized is 496 (there were four miSSing data points). For the
1973 and the miSSing data for one state in 1974. In some cases the
to 298 due to the unavailability of this data for the years of 1970-
aggregate analysis involving the parole data, the number of cases shrinks
analYSis. included a dummy variable for year to account for the effect of
variables not ,included in the analysis which correlate with year.
D. Data Analysi.
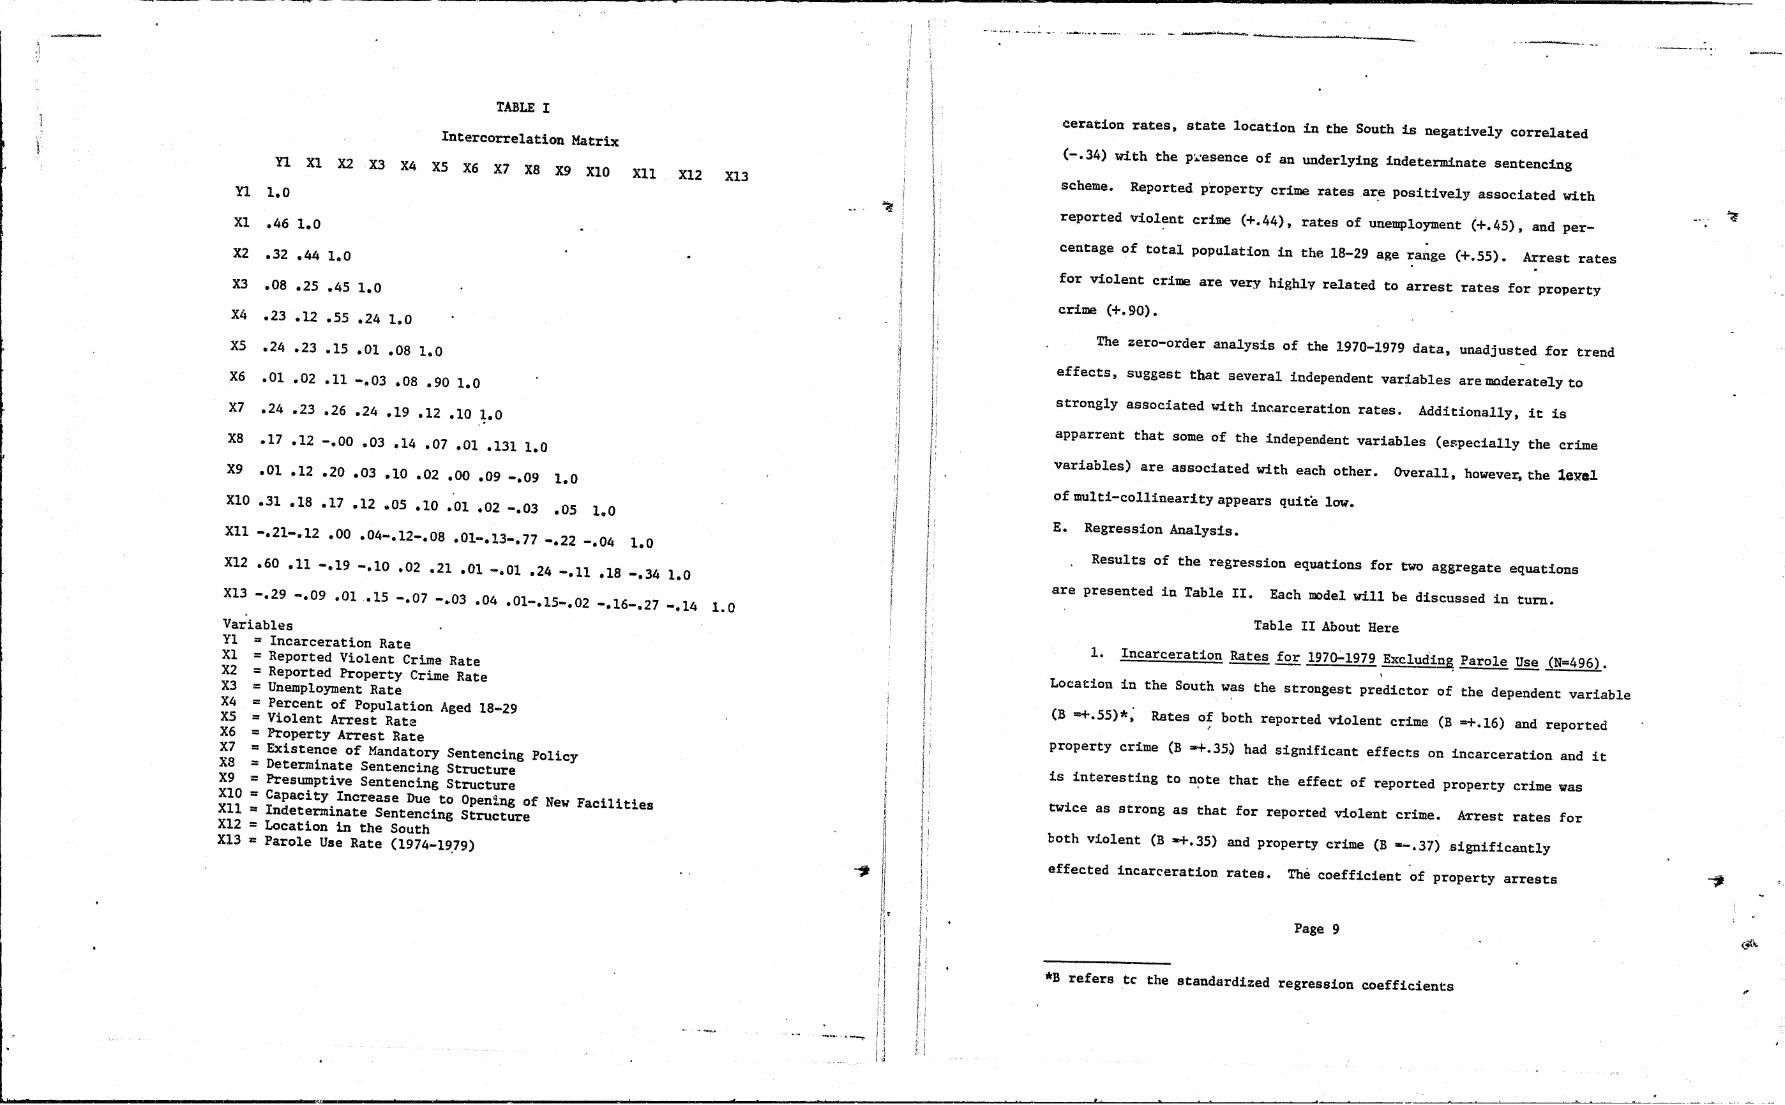
The zero-order correlations of all the variables in the present
analysis are displayed in Table I.
Table I About Here
Correlations between the dependent variable and the independent variables
of .3 or greater include positive correlations between the incarceration
In addition to the strong correlation between southern region and incar-
variables are associated with high values on rates of incarceration.
and reported property crime (+.32). High values on these independent
rate and: location in the South (+.60), reported violent crime (+.46),
Page 8
... .,.....
TABLE I
Intercorre1ation Matrix
n Xl X2 X3 X4 X5 X6 X7 X8 X9 XIO XU X12 X13
n 1.0
Xl .46 1.0
X2 .32 .44 1.0
X3 .08 .25 .45 1.0
X4 .23 .12 .55 .24 1.0
X5 .24 .23 .15 .01 .08 1.0
X6 .01 .02 .11 -.03 .08 .90 1.0
X7 .24 .23 .26 .24 .19 .12 .10 1.0
X8 .17 .12 -.00 .03 .14 .07 .01 .131 1.0
X9 .01 .12 .20 .03 .10 .02 .00 .09 -.09 1.0
XIO .31 .18 .17 .12 .05 .10 .01 .02 -.03 .05 1.0
XII -.21-.12 .00 .04-.12-.08 .01-.13-.77 -.22 -.04 1.0
X12 .60 .11 -.19 -.10 .02 .21 .01 -.01 .24 -.11 .18 -.34 1.0
X13 -.29 -.09 .01 .15 -.07 -.03 .04 .01-.15-.02 -.16-.27 -.14 1.0
Variables Yl = Incarceration Rate Xl = Reported Violent Crime Rate X2 = Reported Property Crime Rate X3 = Unemployment Rate X4 = Percent of Population Aged 18-29 X5 = Violent Arrest Rate X6 = Property Arrest Rate X7 = Existence of Mandatory Sentencing POlicy X8 = Determinate Sentencing Structure X9 = Presumptive Sentencing Structure XIO = Capacity Increase Due to Opentng of New Facilities XII = Indeterminate Sentencing Structure X12 = Location in the South X13 z: Parole Use Rate (1974-19,79)
L-_________ ., «
;
i ~ '-,. i I
i ,I I .J
.... " .. ~, _ .,.Iiiro4~~_ ... ~'_"'_~_ .~ __
ceration rates, state location in the South is negatively correlated
(-.34) with the p>';'esence of an underlying indeterminate sentencing
scheme. Reported property crime rates ar.e positively associated with
reported violent crime (+.44), rates of unemployment (+.45), and per-.
centage of total population in the 18-29 age range (+.55). Arrest rates
for violent crime are very highly related to arrest rates for property
crime (+.90).
The zero-order analysis of the 1970-1979 data, unadjusted for trend
effects, suggest that several independent variables are moderately to
strongly associated with incarceration rates. Additionally, it is
apparrent that some of the independent variables (especially the crime
~ariables) are associated with each other. Overall, howeve~ the leyel
of multi-collinearity appears quite low.
E. Regression Analysis.
Results of the regression equations for two aggregate equations
are presented in Table II. Each model will be discussed in turn.
Table II About Here
1. Incarceration ~ for 1970.:.1979 Excludi~ Parole Use (N=496).
Location in the South was the strongest predictor of the dependent variable
(B =+.55)*~ Rates of both reported violent crime (B =+.16) and reported
property crime (B =-+.35~ had significant effects on incarceration and it
is interesting to note that the effect of reported property crime was
twice as strong as that for reported violent crime. A~rest rates for
both violent (B -+.35) and property crime (B z-.37) significantly
effected incarceration rates. The coefficient of property arrests
Page 9
*B refers tc the standardized regression coefficients

..
TABLE II
Structural Equations (Beta Weights) Predicting Incarceration Rates
Independent Variables
Reported Violent Crime Rate Reported Property Crime Rate Violent Arrest Rate Property Arrest Rate Unemployment Rate Percentage of Total Population
Aged 18-29 Existance of Mandatory Sentence
POlicy (MANDATORY=l) Indeterminate Sentencing
Structure (INDETERMINATE=1) Determinate Sentencing
Structure (DETERMINATE=l) Presumptive Sentencing
Structure (PRESUMPTIVE=l) Capacity Increases Due to
Opening of New State Facilities Parole Use Rate Location in the South
(SOUTH=l)
Total Adjusted R 2
Total R 2
* P .05 *'l: p .01
1970-1979 (N=49.6)
.i6 **
.34 **
.35 ** -.37 ** -.13 **
.02
• 15 **
• 05
-.02
-.04
.11 **
N/A .55 **
.64
.65
1974-1.979 (N=298)
•• 43 ** .14 **
-.03 -.04 -.16 **.
.07
.10 ** .06
.00
-.06 * .10 **
-.04 .58 **
.70
.71
I;
:rli'tes is in the negative direction meaning that increases in property
arrest rates result in decreases in prison rates. Unemployment rates
negatively effected incarceration (B =.-13) and a positive effect of
capacity increase (B =+.11) was found. The existence of a mandatory
sentencing policy had a positive ~ffect on incarceration rates (B =+.15).
Variables insignificant in the analysis included percentage of population
18-29, and underlying sentencing scheme. A total of Sixty-five percent
of the variance in incarcerction rates was explained by the 5.ndependent
variables in the model •
2. Incarceration Rates for 1974-1979,,, Including Parole Use (N=298) •
This equaU.on estimates the effects of the various independent \'s.riables
including parole use data. Location in the South was the strongest pre-
dictor of incarceration rates (E =+.58). Rates of reported violent crime
again had strong significant effects on the dependent variable (B -+.43).
Property crime reports were also significant in predicting rates of
imprisonment but the magnitude of this effect (B =+.14) was less than that
found in the equation excluding parole data (N=496). Unemployment rates . had a negative effect on imprisonment (B :'-.16) as was the case in the
previous equation. Increases in pripon capacity were associated with .
increases in incarceration rates although the effect was weak (B =+.10),
and presence of a mandatory sentence had a weak but positive effect on
incarceration (B =+.10). The remaining independent variables were
insignificant in predicting incarceration rates. The total R2 for this
equation was 71%.
3. Additional Regression Analysis. As noted earlier, the results of
the analYSis of time series data can be confounded by the effect of
Page 10
.... --..-_.,,--

... •
variables not included in the e.nalysis that are associated with year. To
estimate such effects the regressions discussed above were run with year
as a series of dummy variables. Results of these analyses are presented
in Table III.
Table III About HE!re .
As is evident from the above table, the strongest effect on.incar-
ceration rates for both equations is~ again, location in the South
CB =+.56 and B = +.57). In the model jl.;st examining the years 1974-
1979 (N=298), the next strongest predictor is the reported violent crime
rate (B =+.44). Reported property crime (B =+.09), existence of a
mandatory sentence policy ( =+.09), and increases in prison capacity
due to the opening of new state penal facilities (B =+.09) all have
positive effects on the dependent variable. Significant negative effects
include the unemployment rate (B m-.20), an underlying presumptive
sentencing scheme CB =-.18), and the dummy variable created for the year
of 1974 (B =-.16). The total R2 for the equation is 68%.
For the equation involving the entire time period (N=496) and the
dummy variables for year, the second strongest predictor is property
arrest rates with the effect in the negative direction (B =-.42).
Violent arrest rates significantly effect incarceration rates (B =+.39),
as well as do both violent and property reported crime rates (B =+.15 and
B =+.38 respectively). The effects of mandatory sentence and indeterminate
sentence policy were also significant and positive (B =+.14 and B ~+.06).
Capacity increase significantly predicted incarceration rates CB =+.09)
as did the unemployment rate (B =-.17). In the model, the years of 1973
and 1974 both had significant negative effects on incarceration rates
CD --.~3 for each). The total R2 for this equation was 73%. Overall,
Page 11
\ l
I \ II Ii
Ii Ii II Ii ii I;
I ,I
~
II II ~
Ii
Ii II I) " l! I' ji
11 I
I, I'
\, I: Ii II Jl Ii I: Ii I' I' i ~
TABLE III
Structural Equations (Beta Weights) Predicting Incarceration Rates
(With Dummy Variables For Year)
Independent Variables
Reported Violent Crime Rate Reported Property Crime Rate Violent Arrest Rate Property Arrest Rate Unemployment Rate Percentage of Total Population
Aged 18-29 Existance of Mandatory Sentence
Policy (MANDATORY=l) Indeterminate Sentencing
Structure'(INDETERMINATE=1) Determinate Sentencing
Structure (DETERMINATE=1) Presumptive SentenCing
Structure (PRESUMPTIVE=l) Capacity Increases Due to
Opening of New State Facilities Parole Use Rate Location in South (SOUTH=l) 1970 1971 1972 1973 1974 1975 1976 19.77 1978 1979
Total Adjusted R 2
Total R 2
** P .01 * p .05
1970-1979 . (N=496)
.15 .. 'rl:
.38 **
.39 ** -.42 ** -.17**
.00
.14 **
.06 * .07
-.05
.09 ** N/A .57 ** .02 .01
-.05 -.13 ** -.13 ** -.OS .00 .02 .01 .02
.67
.68
1974-1979 . (N=298)
.44 **
.15 ** -.04 -.05 -.20 **
.02
.09 * .04
.00
-.08 * .09 *
-.06 .56 ** N/A N/A N/A N/A
-.16. oJrl;
-.04 .02 .02 .01
-.02
.72
.73

..
beta's did not change significantly but due to the significance of the dummies
created for 1973 and 1974 and thf. possibility of trend some effects, the previous
equations were re-estimated excluding the years of 1973 arid 1974. Results are
presented in Table IV.
Table IV About Here-
As is e,·ident from comparing Table III and Table IV, when the years
1973 and 1974 are excluded from the analysis, little change occurs in
terms of the effect of the independent variables on incarceration rates.
The overall R2 decreases slightly and the magnitudes 'of the regression
coefficients are slightly altered. The direction of the coefficients are
consistent in both sets of equations and although one variable approaches
significance in the new estimates (indeterminate sentence policy), the
overall results remain essentially comparable. Se, although they are
apparently some "year" effects, they do not appear to radically change the
estimates of the variables in the model.
Additionally, separate models were estimated for each year to deter-
mine if the predictors of incarcer~tion rates differed in a year by year .
analysis with fewer cases than in the overall, aggregate model. The sig-
nifi.cant predictors ""'ere essentially the same as those which were found to
be associated witr. incarceration rates in the previous models. Although a
few independent variables significant in the aggregate analysis were in-
significant in the smaller samples, the most consistent predictors of the
dependent variable were southern location, reported violent and property
crime rates, violent arrest rates and unemployment rates. Property crime
arrest rates and existence of a mandatory sentence policy, although si.gnificant
Page 12
<
ij
I .;
TABLE IV
Independent
Structural Equations (Beta Weights) Predicting Incarceration Rates
(Excluding 1973 and 1974 Due To Year Effects)
Variables
Reported Violent Crime Reported Property Crime Violent Arrest Rate Property Arrest Rate Unemployment Rate Percentage of Population
Aged 18-29 Existance of Mandatory Sentencing
Policy (MANDATORY=1) Indeterminate Sentencing
Structure (INDETERMINATE=l) Determinate Sentencing
Structure (DETERMINATE=I) Presumptive SentenCing
Structure (PRESm1PTlVE=1) Capacity Increases Due to the
Opening of New Facilities Parole Use Rate Regional Location
South (SOUTH=1)
Adjusted R2
R 2
**p * p
.01
.05
in the
1970-72, 1975-1979 1975-1979 (N=397) (N=250)
.16 ** .52 ** .40 ** .14 -A-k .32 ** -.04 -.38 ** -.05 -.18 *'It
-.2.2 ** -.03 .01
.15 ** .07
.07 * .04
.07 .00
-.05 -.08 *
.10 *'It .07 *
N/A -.06 .59 ** .59 **
.67 .72 067 .72

'" ....
in the aggregate, were 1Dsignificant at t e. year eve. . h" "1 1
F. Regression With Lagged Independent Variables
In order.to determine whether or not there is a time interval between
fluctuations in the structural, crime or legal variables a~d resulting
changes in the rate of prison populations, the' independent variables in
this analysis were lagged one year so as to allow sufficient time for the
prison populations to reflect changes in the above menticned predictors. The
time peried of one year was chosen because it seemed to be n reasonable time
to expect concomitant ch.:,nges in the dependent variables due to changes in
the independent variables. Essentially, each case's prison population
rate for a specific year was regressed on the predictors of the previous year.
Obv5.ously, lagging variables reduces our original t:f.me interval of ten years
to nine years. Again, models were estimated for the entire time period
excluding the independent variables of parole release (due to the unavaila-
bility of these data for certain years) and for the time period durin~ which
these release data were available (1975-1979 for the lagged model). Results
are presented in Table V •
Table V About Here
As is evident from a comparison of Table V and Table II, the results
appear quite similar for both the lagged and uniagged aggregate eqtu1tions.
In many situations the coefficients are pratically identical but a few differ
ences do emerge. For the lagged model without parole data (1971-1979), the
impact of the violent arrest rate (B -+.21) decreases from that of the unlagged
model (B =+.35), although still significant and in the same direction. Also,
the effect of the property arrest rate (B --.14) decreased in strength in the
Page 13
g
TABLE V
Structural Equations (Beta Weights) Predicting Incarceration Rates (Lagged Independent'Variables)
Independent Variables
Reported Violent Crime Reported Property Crime Violent Arrest Rate Property Arrest Rate Unemployment Rate Percentage of Population
Aged 18-29 Existance of Mandatory Sentencing
Policy (MANDATORY=l) Indeterminate Sentencing
Structure (INDETERMINATE=l) Determinate Sentencing
Structure (DETERMINATE=l) Presumpt-i ve Sentencing
Structure (PRESUMPTIVE=1) Capacity Increases Due to the
Opening of New Facilities Parole Use Rate Regional Location in the
South (SOUTH=1)
Adjusted R 2
R2
**p * p
.01
.05
1971-1979 (N=449)
.·15 ** .39 ** .21 ** -.14 ** -.11 ** -.03
.. 14 ** .04
-.01
-.04
.12 ** N/A .57 **
.67
.68
1975-1979 (N=248)
.39 ** .16 ** -.04 .01
-.14 ** .04
.11
.06
.00
-.05
.12 ** -.12 **
.55 **
.72
.73

.. -
lagged model from that of the model without time lags (B --.37). This
suggests that prison population fluctuations are more sensitive to current year
arrest rates than arrest rFtes of the preceeding year. The remainder of the
independent variables had approximately equal effects for this model. The
variance explained was also similar in quanti~y.. For the 1IlOde:,l. in\Oolving parole
data, again a comparison of the lagged and unlagged results yields similar
findings with the exception of the 10S8 of statistical significance of two
variables in the lagged model whicb had just approached s:f.gnificance in the
unlagged model (probably due to the decrease in sample F.ize due to lagging) and
the differential ilrpact of one variable. The impact of the parole use rate
increased in the lagged model from an insignificant coefficent of -.04
(unlagged) to a weak but significant coefficient of -.12 (lagged). While
parole use did not affect prison population rates when predicting in the same
year, fluctuations in parole use appear to require some time in order appreciate
their full effect. Again, the R2,s in the lagged and unlagged models are
quite similar. Obviously, longer timP periods of analysis and different
lagged structures could lead to different conclusions. For the period 1970-
1979 our anal sis of two year lags suggests that alternative lag structures
should not alter this conclusion.
The lagged models (Table V) were also re-estimated excluding the regi.on
variable (Table VI). (See Section G for ~ discussion of why region was
excluded) • In this analysis the variable of reported propert, cr1.me
displayed confusing behavior and the coefficient for violent arrests
rates more than doubled in the present ~quation. The effect of the
percent of the population aged 18-29 increased as did the presence of pre-
Pa.. 14
......... , ............ -. . ... - .. ~ ----
TABLE VI
Structural Equations (Beta Weights) Predicting Incarceration Rates
Excluding Region (Lagged Independent Variables)
Independent Variables
Reported Violent Crime Reported Property Crime Violent Arrest Rate Property Arrest Rate Unemployment Rate Percentage of Population
Aged 18-29 Existance of Mandatory Sentencing
Policy (MANDATORY=l) Indeterminate Sentencing
Structure (INDETERMINATE=1) Determinate Sentencing
Structure (DETERMINATE=l) Presumptive Sentencing
Structure (PRESUMPTIVE=1) Capacity Increases Due to the
Opening of New Facilities Parole Use Rate Regional Location in the
South (SOUTH=l)
Adjusted R2
R2
**p * p
.01
.05
1971-1'979 (N=449)
.15 ** .17 ** .49 ** -.15 ** -.14 **
.12 **
.13 ** -.10 ** -.08
-.10 ** .21 ** N/A N/A
.48
.49
1975-1979 {N=248)
.36 ** -.07
.28 ** .04 -.12 ** .07
.13 ** -.07
.06
-.10 * .20 **
-.22 ** N/A
.55
.56

sumptive sentencing, prison capacity increases, and parole use. 2 ThE~ R 's of
the lagged equa~ion excluding region were.49 and .56 compared with .68 and
.73 (lagged with region).
Table VI About Here
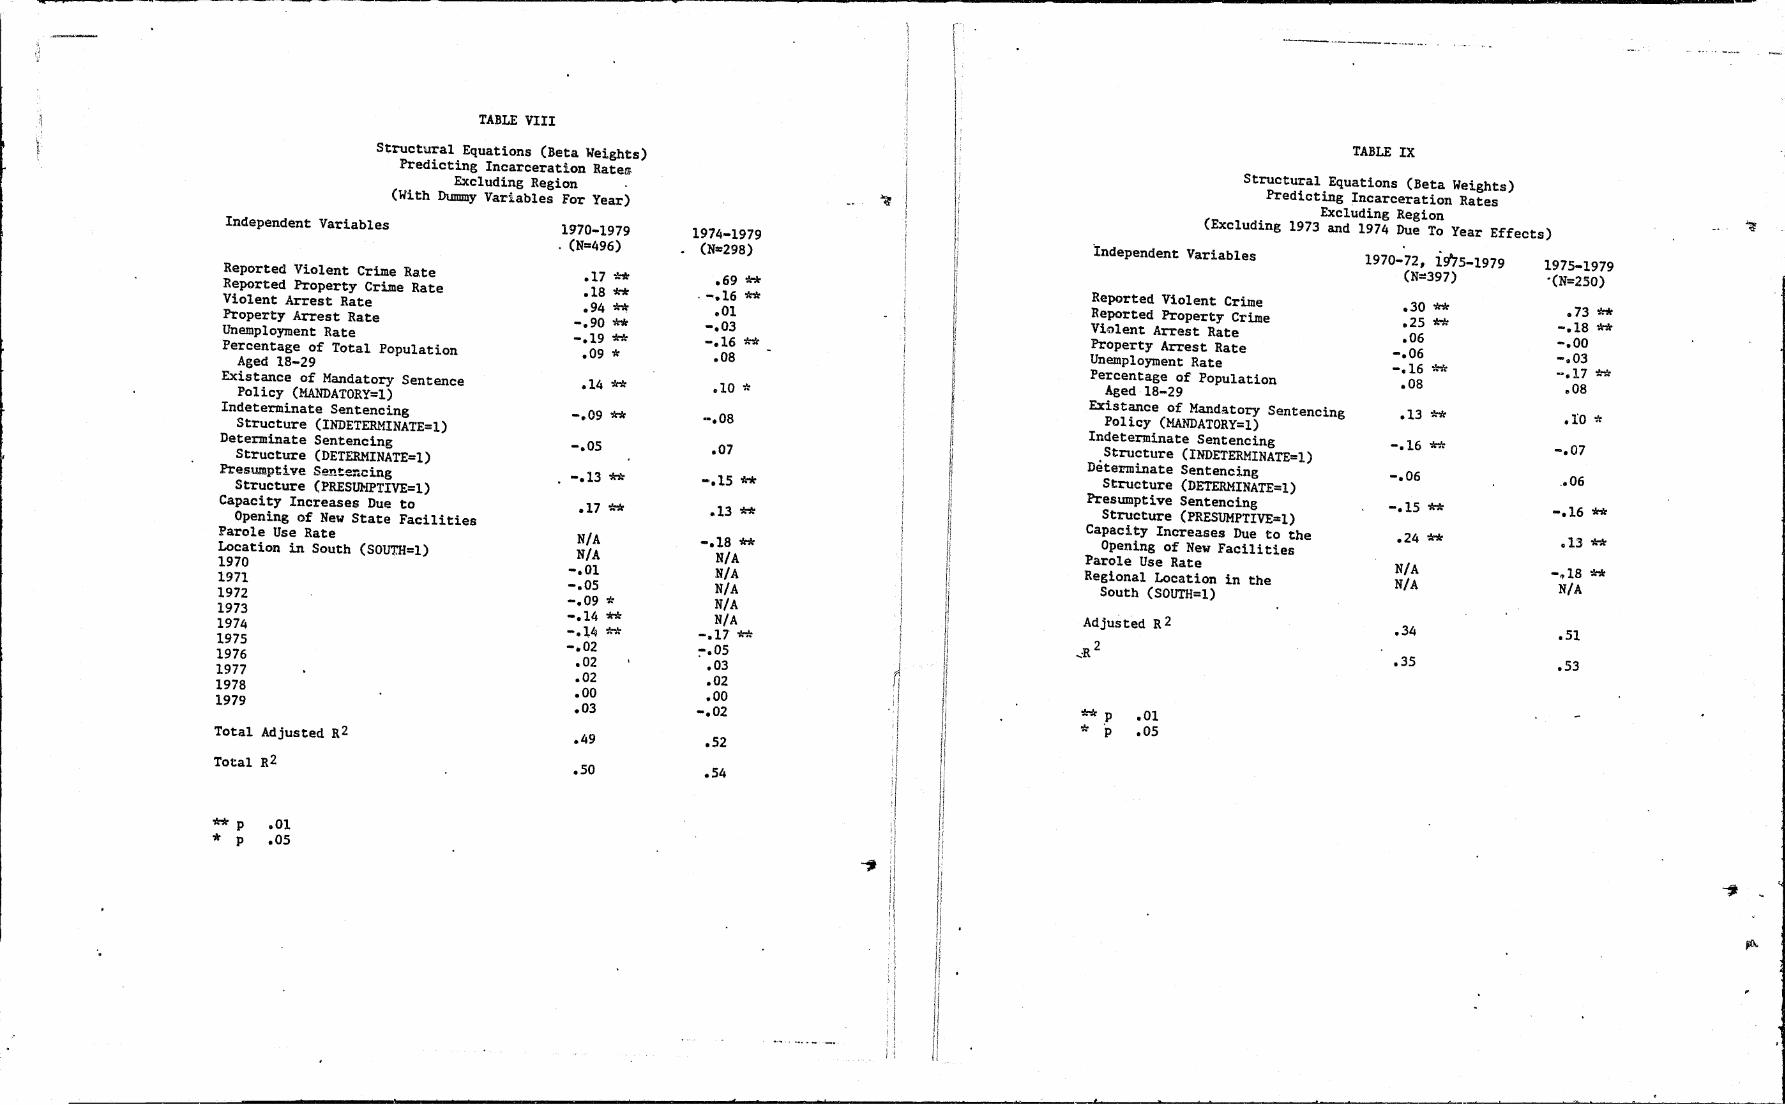
G. Regression Excluding Location in the South
All of the regression'equations were re-estimated excluding the indepen~
dent variable of location in the South. Obviously a variable indicatirig
geographical region is an aggregate indicator of some unmeasured and un-
specified- set of region correlates. For this reason the concept of region
as an explanation of crime or criminal justice is controversial. The results
reported in Tables VII - IX repeat the results of Our analyses when region is
excluded. As would be anticipated from the zero-order correla~ the
eltmindtion of region has a substantial effect on the estimates of the effects
of all variables included in the equations.
Tabl~ VII About Here
Table VIII About Hete
Table IX About Here
Rather than discuss each specific model excluding eouthern location, the
£eneral findings across models will be presented. Overall, there were many
differences in the models which included a dummy variable for South (Tables
II-IV) and those that did not (Tables VII-IX). The strength of the coefficients,
as well as the directions of some independent variables changed. In terms of
reports of violent crime, the ~trength of the coefficients, in general, in-
creased in the models exclud:!x~~ region and the direction was consistent. The
variable of property crime reports had inconsistent effects when compared
Page 15
TABLE VII
Structural Equations (Beta Weights) Predicting Incarceration Rates
Excluding Region
Independent Variables
Reported Violent Crime Rate Reported Property Crime Rate Violent Arrest Rate Property Arrest Rate Unemployment Rate Percentage of Total Population
Aged 18-29 EXistance of Mandatory Sentence
Policy (MANDATORY=l) Indeterminate Sentencing
Structure (INDETERMINATE=1) Determinate Sentencing
Structure (DETERMINATE=l) Presumptive Sentencing
Structure (PRESUMPTIVE=1) Capacity Increases Due to
Opening of New State Facilities Parole Use Rate Location in the South
(SOUTH=1)
Total Adjusted R 2
Total R 2
'/I: P **p
.05 .01
1970-1979 (N=496)
.17 *"It
.16 **
.91 ** .-.87 ** -.15 **
.12 **
.15 ** -.09 ** -.05
-.11 ** .19 ** N/A N/A
.46
.47
~
1974-1979 (N=298)
.70 ** -.20 ** .01 -.02 -.12 **
.12 ** .11 **
-.07
.05
-.13 ** .16 **
-.18 ** N/A
.. 51
.52
we: • p
TABLE VIII
Structural Equations (Beta Weights) Predicting Incarceration Rate~
Excluding Region (With Dummy Variables For Year)
Independent Variables
Reported Violent Crime Rate Reported Property Crime Rate Violent Arrest Rate Property Arrest Rate Unemployment Rate Percentage of Total Population
Aged 18-29 Existance of Mandatory Sentence
Policy (MANDATORY=l) Indeterminate Sentencing
Structure (INDETERMINATE=l) Determinate Sentencing
Structure (DETERMINATE=l) Presumptive Sentencing
Structure (PRESUMPTIVE=l) Capacity Increases Due to
Opening of New State Facilities Parole Use Rate Location in South (SOUTH=l) 1970 1971 1972 1973 1974 1975 1976 1977 1978 1979
Total Adjusted R2
Total R2
** p .01 * p .05
1970-1979 (N=496)
.17 **
.18 **
.94 ~ -.90 ** -.19 **
.09 *
.14 ** -.09 ** -.05
-.13 ** .17 ** N/A N/A
-.01 -.05 -.09 * -.14 ** -.14 ** -.02
.02
.02
.00
.03
.49
.50
1974-1979 . (N=298)
.69 ** . -.16 **
.01 -.03 -.16 ** .08
.10 * ··.08
.07
-.15 ** .. 13 **
-.18 ** N/A N/A N/A N/A N/A
-.17 ** :-.05
.03
.02
.00 -.02
.52
.54
i j
g
r i I 1 I
\ 1. ! 1 I 1 ;
f: I:
1: j,
r I
II i
I; ,j
I: ~ I
~ ~
ff ji Ii /1 ,I
II Ii Ii Ii i! N l' I d IJ " Ii 'i J' Ii 11 /! Ii [I 11 Ii r/
/I )1 'I !i ( ,J Ij Ii I' II
I; r "
II Ii U H j1 " t! II ii Ii " )1
II
Ii
h __ • __ --. ____ ••••• _ .....
TABLE IX
Structural Equations (Beta Weights) Predicting Incarceration Rates
Excluding Region (Excluding 1973 and 1974 Due To Year Effects)
Independent Variables
Reported Violent Crime Reported Property Crime Violent Arrest Rate Property Arrest Rate Unemployment Rate Percentage of Population
Aged ,18-29 Existance of Mandatory Sentencing
Policy (MANDATORY=1) Indeterminate Sentencing
Structure (INDETERMINATE=1) Determinate Sentencing
Structure (DETERMINATE=l) Presumptive Sentencing
Structure (PRESUMPTIVE=l) Capacl.ty Increases Due to the
Opening of New Facilities Parole Use Rate Regional Location in the
South (SOUTH=l)
Adjusted R2
.. :R 2
**p * . p
.01
.05
1970-72, igl]5-1979 (N=397)
.30 **
.25 **
.06 -.06 -.16 ** .08
.13 ** -.16 ** -.06
-.15 ** .24 ** N/A NtA
.34
.35
1975-1979 -(N=250)
.73 ** -.18 ** -.00 -003 -.17 ** ~08
.10 * -.07
.• 06
-.16 ** .13 **
-,,18 ** NtA
.51
.53

•
to the results of models which included x:egion. In half of the equations,
the coefficient switched from Positive to ~egative and in som~ other equations
the coefficient decreased in strength though remaining positive. Arrest rates
for both violent and property crime appeared to be very different in equations
excluding the region vari~le. In many model~ excluding the :egion variable, the
strength of both coefficients doubled or more than doubled wh~n compared with
~hose of equations including this independent variable. The percent of the
population aged 18-29, although insignificant in many equations including
South, became significant or increased in strength when region was excluded.
The coefficients of both indeterminate and presumptive sentencing structures
became significant and negative in the new equations. The effect of capacity
increase, although usually positive and significant in prevj.ous models, in
creased in strength in every equation excluding the region variable. The coef
ficient of parole use, in general, increased in strength while remaining
negative. In summary, equations including a region variable yielded very
different results from those without this independent variable. The mest
dramatic changes occurred with the arrest, reported crime and the capacity
variables, although oth~r·. independent variables were alao effected.
2, Obviously, the explained variance is less in th~ present models but the R s
are still quite high (35%-54% compared to 65%-73%). nlese results strongly
suggest that future research attempt to disentangle the effect.s of those
variables aggre~ted in a region variable.
H. Summary and Conclusions
The growth in the imprisonment rate during the 1970's is strongly
associated with changes in demographic, structural and legal characteristics.
Page 16
--·-........... ,.,.T ...... _______ .. ~, .... £ ....
<
(
The level of crime and arre.sts (by type), percentage of the populati0!l aged
18-29, unemployment, sentenCing practices, prison capacity changes, and parole use
were found to be significantly associated wi.th imprisonment rates. These vari
ables accounted for 34 to 58% (depending on whether trend was considered and
These whether parole use was included) of the variance in imprjsonment rates.
results suggest that the growth in imprisonment rates, in pari, reflects
chang.es in the characteristics of cril::te, society, and the· criminal justice
system that theory and good sense suggest should produce larger prison
populations. If data on the length of sentence and proportion of sentences
served were available, it is anticipated that imprisonment rates would be
even more understandable.
Obviously, substantial unexplained variation exists in these analyses.
The variation associated with location in the South represents variation we
can attribute to a regional effect even if we cannot describe what that
regional effect is or how it .ffects levels of impr:l.socunent. The persistence
of an association between imprisonmen4 (and in other research) crime and region
suggests that additional research shOuld be conducted to better understand
"regional affects". Even with this shadow variable included, between 32
and 27% of -{he variation in imprisc;nment rates s unexp a .... n . i 1 4 ed Itseems reasonable
to hypothesize that better explanation of imprisonment rates requires data
on changes in criminal just:r.ce policies that impact on time servec1, sentence ,
lengths and parole release criteria. Our future research will pay close .
attention to tbis possibility.
The distinction between policy changes and other c.orrellates of incc,rceration
'rates must not mask the fact tru:.t while. SOme characterietics may be less
Page 17
~ .. _",,--._-,, ".- .. _------.' ~ .. -

Rffected by policy decisions in the criminal justice system, the effects of
all variables can be altered by policy decisions~ For example, while now we
tend to incarcerate individuals in their late twenties to thirties, adoption
of a selective incapacitation model might result in higher rates of incarcer-
ation for 18-22 year olds. Thus, demographic .effects could b~ dramatically
altered. While our year by year analysis suggests stability in estimates of
demographic and other variables, we must not begin to think that only some
variables are policy dependent -- all can be. A rational policy for use of
prison capacity is one that first understands how and why imprisonment is being
used -- only then can policy choices be debated, made and implemented.
Page 18
d
i •
1 Data are not available other obvious variable, sentences or changes in of prison populations. greater detail.
NOTES
on a national level for this time period for one changes in time served in prison. Longer parole decision-making could also affect the size Our current research is addressing this issue in
2 Due to the desire to obtain the most accurate measure of incarceration rates, some corrections to reported rates were necessary to account for changes in reporting requirements by NPS, for inability of states to comply with these changes, and for inmates who were under state jurisdiction but housed in local jails due to overcrowding and Who should have been included in a state incarceration rate. These corrections will be discussed in turn as well as any known problems with the incarceration rates.
1970 Incarceration Rates-Source: Prisoners in State and Federal Institutions 1970. Data was missing for Alaska, Arkansas, and Rhode Island. There is no mention of any state prisoners housed in local jail~ rlue to cvcrcro.~ing that were fiot included in the count and no indication of the number of prisoners, if any, who were included in the count but who had sentences of less than a year and a day.
1971 Incarceration Rates-Source: Prisoners in State and Federal Institutions on December 31, 1971,1972,1973. (1974) Certain percentages of prisoners was suotracted for four states due to our exclusion of prisoners included in the counts who had sentences of less than one Year and one day (Colorado, Maryland, Massachusettes, Oregon). Additionally, t..'le number of incarcerated prisoners for the state .of Vermont is an overestimate due to an unknown percentage of prisoners wit;'~ sentences of less than one year and one day who were included in the total. There was no indication that prisoners were housed in local jails due to overcrowding.
1972 Incarceration Rates - Source: same as 1971 rates. Percentages of prisoners were subtracted from four states (Colorado, Maryland, Massachusettes, Oregon) due to included prisoners with inappropriate sentence lengths. There was no indication of any prisoners housed in local jails due to overcrowding that were not included.
1973 Incarceration Rates - Source: same as 1971 rates. Corrections for sentence length were made for four states (Colorado, Maryland, Massachusettes, Oregon) and there was no indication of any prisoners housed in local jails due to overcrowding that were not included.
1974 Incarceration Rates - Source: Prisoners in State and Federal Institutions on December :31, 1975. Corrections were made for four states (Mal7land, Massachusettes, Mississippi t South Carolina) due to the inclusion of inappropriate sentence lengths in the total counto A unknown percentage of prisoners with sentences of less than one year and one day was included in the rate for Pennsylvania. There was no indication of any prisoners housed in local jail~ due to overcrowding that were not included in the counts.
1975 Incarceration Rates - Source: Prisoners in State and Federal Institutions on December 31, 1976. Corrections were again made for two states that included inappropriate sentence lengths (Maryland, MiSSissippi). Pennsylvania's incarceration rate may be an overestimate due to ~in unknown percentage of priJoners included in the rate with
..

"
sentences of less than one year and one day. The 1975 estimates included those inmates, due to overcrowding, who were housed in local jails with one exception. It is known that some Alabama state prisoners were housed in local jails due to overcrowding but the actual number of these inmates is unknown.
1976 Incarceration Rates - Source: Prisoners in State and Federal Institutions on December 31, 1977. Incarcer~tion data for 1976 was adjusted to include the state inmates housed in local jails due to overcrowding and corrections for the inclu5ion of inmates with sentences of less than one year and one day were made (Maryland, Mississippi, Oregon).
1977 Incarceration Rates - Source: Prisoners in State and Federal Institutions on December 31, 1978. 'Adjustments were made for states who housed state inmates in local jails. Corrections for sentence length were made for Arkansas, Florida, Maine and Maryland. The incarceration rate for Tennessee may be an overestimate due to an unknown percentage of inmates who had a sentence of exactly one year.
1978 Incarceration Rates - Source: Prisoners in State and Federal Institutions on December 31, 1979. Adjustments were made for several states who had a known number of state inmates housed in local jails due to overcrowding and corrections for sentence length WE!.!,~ ~,de fer Mar-jlcmd ar.d Oklahoma.
1979 Incarceration Rates - Source: Prisoners in State and Federal Institutions on December 31, 1980~ Adjustments were made for states with known numbers of inmates housed in local jails due to overcrowding and corrections were made to Maryland and Oklahoma for their inclusion of inmates with sentences of less than one year and one day.
It should be noted that several states (Alaska, Connecticut, Delaware,Hawaii, Rhode Island, and Vermont) have an integrated system without separate jail/prison facilities.
3Several different popUlation bases were tested in the calculation of state incarceration rates (e.g. 18-44, 18-29, 25-44, etc.) and the zeroorder correlations between these rates were at least .98. The base of 18-29 was eventually selected due to theoretical considerations.
4States defined as Southern include: Alabama, Arkansas, Florida, Georgia, Kentucky, LouiSiana, Maryland, Mississippi, North Carolina, Oklahoma, South Carolina, Tennessee, Texas, Virginia, and West Virginia.
5The formUla used to correct for nonreporting of police agencies of arrest data is as fOllows:
Arrest Rate Estimate = Total State Population Population Covered by X Reporting AgenCies
To rate this variable we divided the above estimate by population in the state.
Arrest Rate of Particular Offense
the total
REFERENCES
Blumstein, Alfred and Jacqueline Cohen. 1973. itA Theory of the Stability of Punishment." Journal of Criminal Law and Criminology 64 (June):198-207.
, Jacqueline Cohen and Daniel ·Nagin. 1977. "The ----~Dyn---am~i-c-s--of a Homeostatic Punishment Process." Journ~l of Criminal~ and Criminology 67 (September):317-334.
and Soumyo Moitra. 1979. "An Analysis of the !me ----~S-e-r~i-e-s--o~f-the Imprisonment Rate in the States of the United States: A Further Test of the Stability of PuniShment Hypotheis • .!. Journal of Criminal Law and Criminology 70 (September) :376-390. - - -
• 1980. "Growing or Stable Incarceration Rates: A ----~C-omm---en--t-o-n- Cahalan's 'Trends in Incarceration in the United States Since 1880. '" Crime and Delinquency :26 (J:.!U.:ary).n=74.
, Jacqueline Cohen, Soumyo Moitra and Daniel Nagin. ----~1~9~8~1~.--~ .. ~On- Testing the Stability of Punishment Hypothesis: A Reply." Journal of Criminal Law and Criminology 72 (Winter): 1799-1808. ---_
, Jacqueline Cohen and William Gooding. 1983. "The ----~I-n~f~lu--en-c-e--of Capacity on Prison Population." Crime and Delinquency (January): 1-51.
Bureau of Justice Statistics, Department of Justice. 1983. "Setting Prison Terms." Bulletin NCJ-76218 (August).
• ---:(II':F:-e":"b-ru-a-r-y~) • 1982. "Prisons and Prioners. t. Bulletin NCJ-8069-7
Carroll, Leo and Mary Beth Doubet. 1983. "U.S. Social Structure and Imprisonment: A Comment ... , Criminology 21 (August) :,449-456.
Freeman, Richard. 1983. "Crime and Unemployment." Policy Edited By James Q. Wilson : 89-106. In Crime and Public -----
GasUl, Raymond. 1971. Homicide and a Regional Culture of Violence." American Sociological Review 36:412-427.
Joubert, Paul E., J. Steven Picou and W. Alex McIntosh. 1981. "U.S. Social Structure and Imprisonment." Criminology 19 (November): 344-349.
Loftin, Colin and Robert H. Hill. 1974. "Regional SUbculture and Homicide: An Examination of the Gastil-Hackney Thesis." Americ~ Sociological Review 39 (October):714-724.

•
Peters ilia, Joan, Peter Greenwood, and Marvin Lavin. 1978. Criminal Careers of Habitual Felons. Washington, D.C. U.S. Government Printing Office.
Rauma, David. 1981. "Crime anG Punishment Reconsidered: Some Comments on Blumstein's Stability of Punishment Hypothesis." Journal of Criminal Law and Criminology.72 (Winter):1772-1798~
Sagi, Philip and Charles Wellford. 1968. '''Age Composition and Patterns of Change in Criminal Statistics." The Journal of Criminal Law. Criminology and Police Sciences 59 :29-36.
<
I ,)
,
il J l
1 I ~ , I n,
I
I , t\
••

r
____ ~~~----------~-----------------~---------------------------------------------v .. --------------__ --______________________________________________________ ~ ______ .. --------------__________ --------____ -----------
, ,. ~
i
o
~Nn .. 111 Y
•