-i HDFC...HDFC Capital Advisors Market capitalisation*: US$ 55 bn 21.3% • Incorporated in 1977 as...
50
Ref. No.: SE/2019-20/ August 21 , 2019 BSE Limited P. J. Towers Dalal Street Mumbai 400 001 r Kind Attn: Sr. General Manager DCS - Listing Department · Dear Sirs, -i HDFC HOUSING DEVELOPMENT FINANCE CORPORATION LIMITED www.hdfc.com National Stock Exchange of India Limited Exchange Plaza, Plot No. C/1, G Block Bandra-Kurla Complex Bandra (East), Mumbai 400 051 Kind Attn: Head- Listing Sub: Disclosure under Regulation 30 of the SEBI (Listing Obligations and Disclosure Requirements) Regulations, 2015 Pursuant to the above-mentioned regulations, we wish to inform you that the Corporation participated in the investor conference as given below: Date Organised by Type of Meeting/Event Location August 21, 2019 Motilal Oswal Financial Investor Conference Mumbai Services Ltd "15'" Annual Global investor Conference" A copy of the investor presentation is enclosed for your reference and is place:i on the Corporation's website. We request you to kindly take the same on record. Thank you. Yours faithfully, For Housing Development Finance Corporation Limited V. Srinivasa Rangan Executive Director Encl. a/a Corporate Office: HDFC House, HT Parekh Marg, 165-166, Backbay Reclamation, Churchgate, Mumbai 400 020. Tel.: 66316000, 22820282. Fax: 022-22046834, 22046758. Regd. Office: Ramon House, HT Parekh Marg, 169, Backbay Reclamation, Churchgate, Mumbai 400 020. INDIA. Corporate Identity Number: L701OOMH1977PLC019916
Transcript of -i HDFC...HDFC Capital Advisors Market capitalisation*: US$ 55 bn 21.3% • Incorporated in 1977 as...

Ref. No.: SE/2019-20/ r~~
August 21, 2019
BSE Limited P. J. Towers Dalal Street Mumbai 400 001
r
Kind Attn: Sr. General Manager DCS - Listing Department
·Dear Sirs,
-i HDFC HOUSING DEVELOPMENT FINANCE CORPORATION LIMITED
www.hdfc.com
National Stock Exchange of India Limited Exchange Plaza, Plot No. C/1, G Block Bandra-Kurla Complex Bandra (East), Mumbai 400 051
Kind Attn: Head- Listing
Sub: Disclosure under Regulation 30 of the SEBI (Listing Obligations and Disclosure Requirements) Regulations, 2015
Pursuant to the above-mentioned regulations, we wish to inform you that the Corporation participated in the investor conference as given below:
Date Organised by Type of Meeting/Event Location August 21, 2019 Motilal Oswal Financial Investor Conference Mumbai
Services Ltd "15'" Annual Global investor Conference"
A copy of the investor presentation is enclosed for your reference and is place:i on the Corporation's website.
We request you to kindly take the same on record.
Thank you.
Yours faithfully, For Housing Development Finance Corporation Limited
_ v.~~ ~· V. Srinivasa Rangan Executive Director
Encl. a/a
Corporate Office: HDFC House, HT Parekh Marg, 165-166, Backbay Reclamation, Churchgate, Mumbai 400 020. Tel.: 66316000, 22820282. Fax: 022-22046834, 22046758.
Regd. Office: Ramon House, HT Parekh Marg, 169, Backbay Reclamation, Churchgate, Mumbai 400 020. INDIA. Corporate Identity Number: L701OOMH1977PLC019916

Housing Development Finance
Corporation Limited

CONTENTS
• HDFC Snapshot
• Mortgage Market in India
• Operational and Financial Highlights: Mortgages
• Valuation and Shareholding
• Financials: Standalone
• Key Subsidiaries and Associates
• Financials: Consolidated2

HDFC SNAPSHOT

WHO WE ARE…
HDFC Capital
Advisors
Market capitalisation*:
US$ 55 bn
21.3%
• Incorporated in 1977 as the first
specialised mortgage company in India
• Now a Financial Conglomerate with
interests beyond mortgages
• 75% shares held by Foreign Investors
Market capitalisation*:
US$ 97 bn
ADRs listed on NYSE
Market capitalisation*:
US$ 14 bn
Largest AMC with total AUM of
US$ 52 bn
Key player in the general
insurance industry through
organic and inorganic growth
51.5% 52.8% 50.5%
100%
Financial services distribution
company
Sources more than half of
HDFC’s home loans
100%
India's first dedicated education
loan company with outstanding
loan book of US$ 739 mnAffordable housing finance
company#
90.8% 47.4%
Market capitalisation*:
US$ 3 bn
HDFC Snapshot
*As at June 30, 2019
US$ amounts converted based on exchange rate of US$ 1 = Rs. 69.12
Property funds with AUM of
~US$ 2.2 bn; of which US$
1.1 bn is committed for
development of affordable
housing
Ranks amongst top 3 private
players in individual and
group segment
Market capitalisation*:
US$ 6 bn
4# Gruh to be merged into Bandhan Bank, subject to regulatory
approvals.
HDFC Capital
Advisors

BUSINESS SUMMARY• Loans Outstanding (Gross loans) : Rs. 4,759.33 bn
(As at June 30, 2019) : US$ 68.86 bn
• Individual Loans Originated CAGR (5 years) : 17%
(FY19)
• Cumulative Housing Units Financed : 7.2 million
• Cumulative loan write offs since inception : 9 basis points
(of cumulative disbursements)
• Cost to Income Ratio : 8.5%
• Unaccounted gains on listed investments : Rs. 2,077.25 bn
in subsidiary and associate companies : US$ 30.05 bn
(As at June 30, 2019)
• Consolidated Profit After Tax CAGR (5 years) : 16%
(FY19)
HDFC Snapshot
5

MORTGAGE MARKET IN INDIA

DRIVERS OF MORTGAGE GROWTH
• Improved Affordability
• Low Penetration
• Government Incentives
• Enhanced Fiscal Benefits
• Credit Linked Subsidy Scheme
• Other Demand Drivers
Mortgage Market in India
7

IMPROVED AFFORDABILITY
22.0
15.6
11.1
8.3 6.65.9 5.3 5.1 4.7 4.3 4.7 5.0 5.1 5.1 4.5 4.7 4.8 4.6 4.7 4.6 4.4 4.1
3.8 3.7 3.5
0.00
2.00
4.00
6.00
8.00
10.00
12.00
14.00
16.00
0
10
20
30
40
50
60
An
nu
al
Inc
om
e (
Rs
. 1
00
,00
0)
Pro
pe
rty V
alu
e (
Rs
. 1
00
,00
0)
&A
ffo
rda
bilit
y
Property Cost Affordability Annual Income
Mortgage Market in India
Representation of property price estimates Affordability equals property prices by annual income
Based on customer data
Best affordability in over two decades.
Government support towards housing likely to further improve
affordability.
8

0%
20%
40%
60%
80%
100%
10%
20%26%
32% 33%38%
42%
50%
66% 67%
86%91%
LOW PENETRATION IMPLIES ROOM FOR GROWTH MORTGAGES AS A PERCENT OF NOMINAL GDP
Mortgage Market in India
Source: European Mortgage Federation, Hofinet & HDFC estimates for India 9

GOVERNMENT INITIATIVES
Fiscal Incentives
Tax incentives on interest and principal
amount for home loan borrowers
Interest Subvention
Scheme
Interest rate subsidy under the Credit Linked Subsidy Scheme (CLSS)
widened to include middle-income groups
Extension of timeframe and
rationalisation of conditions under the
CLSS
Supply Side Incentives
Incentives to developers to build affordable housing
‘Infrastructure’ status accorded to affordable
housing
External Commercial Borrowings/Rupee
Denominated Bonds Issued Overseas
Mortgage Market in India
10

TAX INCENTIVES & THE CREDIT LINKED SUBSIDY
SCHEME (CLSS) HAVE LOWERED THE EFFECTIVE
RATES ON MORTGAGES
Mortgage Market in India
FY 2020 FY 2002 FY 2000
Loan amount (Rs) 2,780,000 2,780,000 2,780,000
Less: Subsidy under CLSS 230,156 - -
Revised loan amount 2,549,844 2,780,000 2,780,000
Nominal Interest Rate(%) 8.60% 10.75% 13.25%
Max deduction for interest allowed 200,000 150,000 75,000
Deduction on principal 150,000 20,000 20,000
Tax rate 30.90% 31.50% 34.50%
Tenor (years) 20 20 20
Total amount paid per year 369,287 328,944 385,380
Interest component 219,287 298,850 368,350
Principal repaid 150,000 30,094 17,030
Tax amount saved 108,150 53,550 32,775
Effective interest paid on home loan 111,137 245,300 335,575
Effective interest on home loan 4.0% 8.8% 12.1%
11
The Union Budget 2019-20 provided further tax incentives for homebuyers. Section 80 EEA of the Income Tax Act provides
an additional deduction of up to Rs. 1,50,000 in respect of interest payment on a home loan for a first-time homebuyer,
provided the property cost is less than Rs. 4.5 million and the loan is sanctioned between April 1, 2019 to March 31, 2020.
The will be w.e.f. April 1, 2020.

• The Credit Linked Subsidy Scheme (CLSS) is one of the key components under the
government’s flagship programme, ‘Housing for All by 2022.’
• The interest subsidy on the home loan is paid to the beneficiary upfront, thereby reducing the
amount of the equated monthly instalment (EMI).
• The eligible beneficiary family should not own a home,
• Applicable for home loans disbursed after January 1, 2017.
• HDFC ranked as the top performing primary lending institution in the EWS & LIG segment and
the second best in the MIG segment of the CLSS
KEY FEATURES OF THE CLSS SCHEME
CREDIT LINKED SUBSIDY SCHEME – AN ENABLER
Mortgage Market in India
Economically Weaker/
Low Income GroupMiddle Income Group -I Middle Income Group-II
Household Income p.a. Up to Rs 600,000
(US$ 8,700)
Rs > 600,000 up to
1,200,000
(>US$ 8,700 to 17,400)
> Rs 1,200,000 to
1,800,000
(>US$ 17,400 to
26,000)
Property size (sq mtrs) 60 160 200
Maximum amount of loan
qualifying for subsidy
Rs 600,000
(US$ 8,700)
Rs 900,000
(US$ 13,000)
Rs 1,200,000
(US$ 26,000)
Interest Subsidy (% per annum) 6.50% 4% 3%
Subsidy under CLSS* Rs 267,280
(US$ 3,900)
Rs 235,068
(US$ 3,400)
Rs 230,156
(US$ 3,300)
*NPV discount rate at 9% for 20 years 12

OTHER DEMAND DRIVERS
• Favourable Demographics: 66% of India’s population is below 35 years of age, hence large potential for home loans
• Nuclear Households: Rise in the number of households with a shift towards nuclear families
• Urbanisation: Currently 32% of the Indian population reside in cities; estimated to be 50% by 2030
• Interest Rates: Improved affordability through rising disposable incomes and affordable interest rates on home loans
Mortgage Market in India
13

OPERATIONAL & FINANCIAL
HIGHLIGHTS: MORTGAGES

INDIVIDUAL LOANS
– Home Loans
• Fixed rate loans
• Floating rate loans
– Home Improvement
Loans
– Home Extension Loans
– Home Equity Loans
– Rural Home Loans
– Loans to NRIs
CORE BUSINESS – LENDING(As at June 30, 2019: Gross Loans - US$ 69 bn)
Operational & Financial Highlights: Mortgages
Individuals 74%
Corporate 5%
Construction Finance 12%
Lease Rental Discounting 9%
As at June 30, 2019
Rs. bn US$ bn % Growth Rs. bn US$ bn % Growth Rs. bn US$ bn % Growth
Individuals 2,975 43 15% 3,202 46 24% 3,561 52 17%
Non-Individuals 1,191 17 2% 1,191 17 2% 1,198 17 2%
Total 4,166 60 11% 4,393 63 17% 4,759 69 13%
Loan Book Outstanding
(After Sell Down)
Loan Book o/s Before Sell Down
in last 12 months
Assets Under Management
Individual loans sold (outstanding): Rs. 586 bn (US$ 8.5 bn) 15

AFFORDABLE HOUSINGHousing Loan Approvals Based on Income Slabs: Q1FY20
EWS 2%
LIG 15%MIG 45%
HIG 38%
In Number termsIn Value terms
EWS 6%
LIG 29%
MIG 48%
HIG 17%
Economically Weaker Section: Up to Rs 0.3 mn p.a Low Income Group: Above Rs 0.3 mn to Rs 0.6 mn p.a.
Middle Income Group: Above Rs 0.6 mn to Rs 1.8 mn p.a. High Income Group: Above Rs 1.8 mn p.a.
Increase in Housing Loans to EWS & LIG Segments – Volume Driven Business
• 35% of home loan approvals in volume terms has been to the EWS & LIG segments and 17% in value terms
• Approving ~8,700 loans monthly in EWS/LIG segment; monthly average approvals: Rs 14.15 bn• Average home loan – EWS: Rs 1.02 mn, LIG: Rs 1.75 mn
Operational & Financial Highlights: Mortgages
16

HDFC Bank 26%
HDFC Sales Private Limited
54%
Direct Walk-ins 3%
Other Direct Selling Agents
17%
83% OF OUR MORTGAGES ARE SOURCED BY
OURSELVES OR THROUGH OUR AFFILIATES
Operational & Financial Highlights: Mortgages
June 30, 2019
Deposit & loan products offered at several locations through outreach programmes.
Total number of offices: 557 which is inclusive of 196 outlets of HDFC’s wholly owned distribution company.17

INDIVIDUAL LOANS*: Q1FY20
* Based on value of approvals
Based on Employment
37%
27%
3% 33%
Geographic Spread
West
South
North
East
8%
57%
35%
Acquisition Mode
Re-sale
First Purchase
Self-Construction
81%
19%
Self –Employed (incl: professionals)
Employed
Operational & Financial Highlights: Mortgages
18

OUR CONSERVATIVE LOAN PROFILE
UNDERLIES OUR HIGH CREDIT QUALITY
• Average Loan Size : Rs. 27.8 mn (US$ 40,220)
• Average Loan to Value : 70% (at origination)
• Average Loan Term : 13 years
• Average Age : 39 years
• Primary Security : Mortgage of property financed
• Repayment Type : Amortising
Operational & Financial Highlights: Mortgages
19

NON-PERFORMING LOANS (NPLs) &
PROVISIONS CARRIED
Operational & Financial Highlights: MortgagesP
erc
en
tag
e
As at June 30, 2019
(Rs. in bn)
NPLs (3 months): 53.15
Provisions Carried: 64.70
Regulatory Provisioning: 33.66
NPLs as % of the loan portfolio:
Individual Loans: 0.72%
Non-individual Loans: 2.68%
Total: 1.29%
20
0.00%
0.50%
1.00%
1.50%
2.00%
Jun-18 Mar-19 Jun-19
1.18% 1.18% 1.29%1.27%1.44%
1.55%
GROSS NPLs PROVISIONS CARRIED AS % OF EAD*
*EAD: Exposure at Default
Total loan write offs since inception is 9 basis points of cumulative disbursements.

EXPECTED CREDIT LOSS (ECL) BASED ON
EXPOSURE AT DEFAULT (EAD)
As per IND AS Jun-19 Mar-19
Gross Stage 3 62.28 57.43
ECL Provision Stage 3 24.76 24.99
Net Stage 3 37.52 32.44
Coverage Ratio% Stage 3 40% 44%
Gross Stage 1 & 2 4,100.96 4,013.89
ECL Provision Stage 1 & 2 39.94 33.79
Net Stage 1 & 2 4,061.02 3,980.10
ECL Provision % Stage 1 & 2 0.97% 0.84%
ECL/EAD 1.55% 1.44%
Rs bn
21
Operational & Financial Highlights: Mortgages

MULTIPLE SOURCES OF BORROWINGS(As at June 30, 2019: Total Borrowings - US$ 54.06 bn)
Total Borrowings: Rs. 3,736.29 bn (US$ 54.06 bn)
Operational & Financial Highlights: MortgagesP
erc
en
tag
e
22
30% 30% 31%
8% 14% 18%
59%54% 47%
3% 2% 4%
0%
20%
40%
60%
80%
100%
Jun-17 Jun-18 Jun-19
External Commercial Borrowings
Debentures & Securities
Term Loans
Deposits

9.76%10.29% 10.45%
7.47%7.99% 8.20%
2.29%
2.30%
2.25%
2.10%
2.15%
2.20%
2.25%
2.30%
2.35%
2.40%
0.00%
2.00%
4.00%
6.00%
8.00%
10.00%
12.00%
FY18 FY19 Apr-Jun-19
Return on Loans Cost of Borrowings Spread
LOAN SPREADS
Operational & Financial Highlights: Mortgages
Apr-Jun 2019
Spread earned on:
Individual Loans 1.91%
Non-individual Loans 3.07%
Loan Book 2.25%23

963
1,949 1,734
934
2,121
1,591
0
500
1,000
1,500
2,000
2,500
Up to 1 yr >1-5 yrs Over 5 yrs
Assets Liabilities
Rs
. in
billio
n
MATURITY PROFILE(As at March 31, 2019)
The above graph reflects adjustments for prepayments and renewals in accordance with the
guidelines issued by National Housing Bank.
Operational & Financial Highlights: Mortgages
24

PRODUCTIVITY RATIOS
Operational & Financial Highlights: Mortgages
FY19 FY18
Number of employees 2,840 2,575
Number of outlets 361 326
Profit per employee (US$ '000)* 452 408
Assets per employee (US$ mn) 22.5 21.6
Admin costs/assets (%) 0.25 0.26
Cost income ratio (%) 8.5 9.2
25
*To make ratios comparable, profit on sale of strategic investments have not been considered.
*
*

KEY FINANCIAL METRICS
Operational & Financial Highlights: Mortgages
FY19 FY18
Net Interest Margin(%)* 3.3 3.3
Pre Tax RoAA (%)^ 3.0 2.7
Post Tax RoAA (%)^ 2.1 2.1
Return on Equity (%)^$ 14.2 20.4
Capital Adequacy (%) 18.8 19.2
Of which Tier I 17.3 17.3
Tier II 1.5 1.9
26
*Income on loans sold included in Net Interest Margin calculations
^Adjusted for profit on sale of investments of strategic investments
$The Corporation raised equity of Rs 130 bn in FY18. During FY19, warrants were converted into equity
shares amounting to Rs 53 bn.
#As at June 30, 2019, after adjusting for final dividend for FY19.
#

VALUATION & SHAREHOLDING

VALUATION – METHOD 1
Rs bn US$ bn
Net Worth 813 11.8
Add: Unaccounted gains on listed
investments
2,083 30.1
Add: Unaccounted gains on unlisted
investments
113 1.6
Adjusted Networth 3,009 43.5
Market Capitalisation 3,782 54.7
Adjusted Price to Book Ratio 1.3 1.3
Total
• Number of shares outstanding: 1.725 bn
• Share Price as at June 30, 2019: Rs. 2,192
• Market Capitalisation: Rs. 3,782 bn (~US$ 55 bn)
Valuation and Shareholding
28
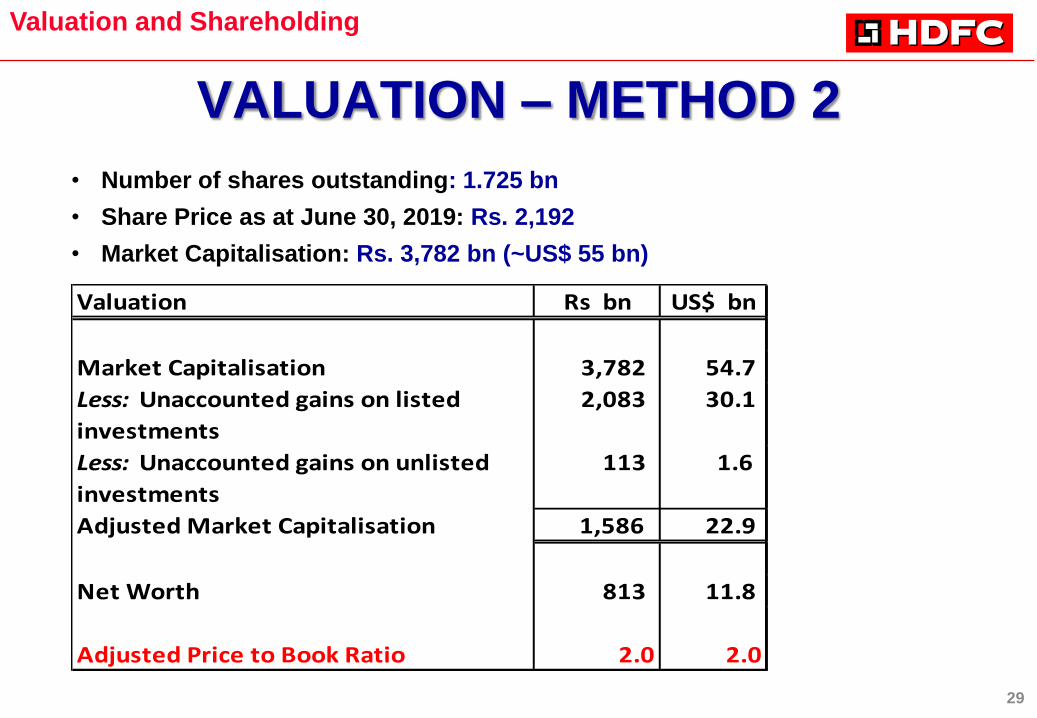
VALUATION – METHOD 2
Valuation Rs bn US$ bn
Market Capitalisation 3,782 54.7
Less: Unaccounted gains on listed
investments
2,083 30.1
Less: Unaccounted gains on unlisted
investments
113 1.6
Adjusted Market Capitalisation 1,586 22.9
Net Worth 813 11.8
Adjusted Price to Book Ratio 2.0 2.0
Valuation and Shareholding
29
• Number of shares outstanding: 1.725 bn
• Share Price as at June 30, 2019: Rs. 2,192
• Market Capitalisation: Rs. 3,782 bn (~US$ 55 bn)

SHAREHOLDING PATTERN
75%
9%
8%7%1%
Foreign Shareholders - 75%
Individuals - 9%
Mutual Funds - 8%
Financial Institutions, Banks & Insurance Companies - 7%
Companies - 1%
Valuation and Shareholding
30

FINANCIALS Standalone
(Based on Indian Accounting Standards)

STATEMENT OF PROFIT AND LOSS – Q1FY20Apr-Jun-19 Apr-Jun-18 Growth (Rs in billion) (Rs in billion) (%)
Interest & Other Operating Income 108.00 91.99 17%
Interest Expenses 77.39 63.53 22%
Add: Net gain on derecognised (assigned) loans 2.96 1.41
Net Operating Income 33.57 29.87 12%
Add: Fees 1.78 1.42
Less: Commission 1.79 1.21
33.56 30.08 12%
Less: Non Interest Expenses 3.24 2.87
Less: Amortisation of ESOS and CSR Expenses 0.58 2.22
Add: Other Income 0.06 0.05
Profit Before Sale of Investments, Dividend & Provisions 29.80 25.04 19%
Add: Dividend 0.01 5.86
Add: Profit on Sale of Investments 18.94 -
Less: Provisions 8.90 0.20
Profit Before Tax 39.85 30.70
Provision for Tax 7.82 8.80
Profit after tax Before Other Comprehensive Income 32.03 21.90
Other Comprehensive Income 2.62 (0.29)
Total Comprehensive Income 34.65 21.61
Effective tax rate (%) 19.6% 28.7%
32
Financials: Standalone
Note: Net Interest Income is not comparable with the previous year. The Corporation had raised equity in the months of February and March
2018 amounting to Rs 130 bn. Of the capital raised, an amount of Rs 85 bn was invested in HDFC Bank in July 2018. Accordingly, for the
quarter ended June 30, 2018, the Corporation earned income on deployment of these funds. Further, given the environment on liquidity, the
Corporation as matter of prudence has been carrying a considerably higher level of liquidity since September 2018. Accordingly, the amount
invested in high quality liquid assets in the first quarter of the current year is significantly higher than the corresponding period in the previous
year.

BALANCE SHEET – FY19
Financials: Standalone
Mar-19 Mar-18 Growth
(Rs. in billion) (Rs. in billion) (%)
Sources of Funds
Shareholders' Funds 773.55 652.65
Borrowings 3,652.66 3,197.16 14%
Current Liabilities & Provisions 161.57 139.29
4,587.78 3,989.10 15%
Application of Funds
Loans1 4,066.07 3,628.11 12%
Investments 462.40 307.17
Current/ Fixed Assets 59.31 53.82
4,587.78 3,989.10 15%
33
1Net of individual loans sold during the preceding 12 months amounting to Rs 251.50 bn. If these loans were included, the growth in loans would have been 19%.

STATEMENT OF PROFIT AND LOSS – FY19
Apr-Mar-19 Apr-Mar-18 Growth (Rs in billion) (Rs in billion) (%)
Interest & Other Operating Income 399.78 332.93 20%
Interest Expenses 278.38 234.98 18%
Add: Net gain on derecognised (assigned) loans 8.60 5.34
Net Operating Income 130.00 103.29 26%
Add: Fees 7.46 6.74
Less: Commission 5.78 5.00
131.68 105.03 25%
Less: Non Interest Expenses 11.18 9.67
Less: Amortisation of ESOS and CSR Expenses 3.69 9.38
Add: Other Income 0.30 0.18
Add: Dividend 11.31 10.79
Profit Before Sale of Investments & Provisions 128.42 96.95 32%
Add: Profit on Sale of Investments 12.12 56.09
Less: Provisions 9.35 21.15
Profit Before Tax 131.19 131.89
Provision for Tax 34.86 22.30
Profit after tax Before Other Comprehensive Income 96.33 109.59
Other Comprehensive Income (1.32) (0.72)
Total Comprehensive Income 95.01 108.87
Effective tax rate (%) 26.6% 16.9%34
Financials: Standalone

KEY ASSOCIATES AND
SUBSIDIARIES

HDFC BANK• 21.3% owned by HDFC
• ADRs listed on NYSE
• 5,130 branches, 13,395 ATMs
• Key business areas
– Wholesale banking Retail banking Treasury operations
• Financials (as per Indian GAAP) for the quarter ended June 30, 2019
– Advances as at June 30, 2019, stood at Rs. 8,297 bn – an increase of 17% over the
previous year
– Total deposits stood at Rs. 9,546 bn – an increase of 18% over the previous year
– PAT (Indian GAAP): Rs. 55.7 bn – an increase of 21% over the previous year
• Arrangement between HDFC & HDFC Bank
– HDFC Bank sources home loans for a fee
– Loans originated in the books of HDFC
– HDFC offers a part of the disbursed loans for assignment to HDFC Bank (up to 70% of loans
sourced by HDFC Bank)
– HDFC retains a spread on the loans that have been assigned
• Market Capitalisation (June 30, 2019): ~US$ 97 bn
Associates and Subsidiaries
36

HDFC LIFE INSURANCE COMPANY LIMITED
(HDFC LIFE)• 51.5% owned by HDFC and Standard Life (Mauritius Holdings) 2006 Limited holds 23.0% of the
equity of HDFC Life.
• Total premium income for the quarter ended June 30, 2019 stood at Rs. 65 bn – growth of 29% over
the previous year
• For the quarter ended June 30, 2019, HDFC Life had a market share of 25% in terms of total new
business received premium (private sector)
• Financial Highlights
– New Business Margin for the quarter ended June 30, 2019 (post overrun): 29.8% (PY: 24.2%)
– Indian Embedded Value stood at Rs. 192 bn as at June 30, 2019 (PY: Rs. 157 bn)
– Operating Return on Embedded Value for the quarter ended June 30, 2019 stood at 19.9% (PY: 18.4%)
– Assets Under Management as at June 30, 2019 stood at Rs. 1,296 bn (PY: Rs. 1,096 bn)
– PAT for the quarter ended June 30, 2019 (Indian GAAP): Rs. 4.3 bn (PY: Rs. 3.8 bn)
• Product mix - Unit Linked: 26%, Non-Par Savings: 63%, Non-Par Protection: 5%, Traditional Par:
6%
• Market capitalisation (June 30, 2019): ~US$ 14 bn
Associates and Subsidiaries
37

HDFC ASSET MANAGEMENT• 52.8% owned by HDFC and Standard Life Investments holds 29.9% of the equity of HDFC
Asset Management.
• Total Assets under Management (AUM) as at June 30, 2019, stood at Rs. 3.57 trillion (US$ 52
bn)
• Equity-oriented assets of HDFC MF as a proportion of total AUM was 48%
• India’s largest mutual fund as at June 30, 2019 (Source: AMFI)
• Overall market share: 14.7%
• Market share of equity oriented funds: 16.2%
• Individual accounts of HDFC MF as at June 30, 2019
• 9.2 million live accounts
• 59% of total monthly average AUM of HDFC MF is contributed by individuals
• Market share of 15.7% of individual monthly average AUM
• PAT for the quarter ended June 30, 2019 (as per Ind AS): Rs. 2.9 bn – an increase of 42% over
the previous year
• Market capitalisation (June 30, 2019): ~US$ 6 bn
Associates and Subsidiaries
38

HDFC ERGO GENERAL INSURANCE COMPANY LTD.• HDFC holds 50.5% and ERGO holds 48.3% of the equity of HDFC ERGO
• Gross direct premium for the quarter ended June 30, 2019 stood at: Rs. 17.8 bn – a growth of
15% (excluding weather/ crop business)
• Products: Motor, health, travel, home and personal accident in the retail segment; property,
marine, aviation and liability insurance in the corporate segment and crop insurance in the rural
segment
‒ Retail accounts for 64% of the total business
• Market share of 7.6% (private sector) and 4.3% (overall) in terms of gross direct premium for the
quarter ended June 30, 2019 (Source: GI Council)
• As at June 30, 2019: Combined Ratio - 106.8%, Solvency Ratio - 170% (as against regulatory
requirement of 150%)
• Profit After Tax for the quarter ended June 30, 2019 (Indian GAAP): Rs. 0.75 bn
Acquisition of Apollo Munich Health Insurance Company Limited
• In June 2019, HDFC Limited entered into an agreement to acquire 51.2% stake in Apollo Munich
for a total consideration of Rs 13.47 bn from Apollo Hospitals Group and stake held by a few
employees
• Initially, Apollo Munich will be held as a subsidiary of HDFC and post the acquisition, the
company will be merged with HDFC ERGO
• Immense potential in health insurance given low penetration levels
Associates and Subsidiaries
39

GRUH FINANCE LIMITED (GRUH)• 47.4% owned by HDFC
• Registered housing finance company offering loans to individuals for purchase, construction
and renovation of dwelling units
• Also offers loans to the self-employed segment where formal income proofs are not
available.
• Retail network of 196 offices across 11 states in India
• Financials for the quarter ended June 30, 2019
• Loan portfolio as at June 30, 2019, stood at Rs. 177.4 bn – an increase of 11% over the
previous year
• PAT (as per Ind AS): Rs. 1.16 bn (PY: Rs. 1.15 bn)
• In January 2019, the Board of Directors of GRUH approved the merger of GRUH into Bandhan
Bank, subject to regulatory approvals.
• Share Exchange Ratio: 568 equity shares of face value of Rs. 10 each of Bandhan Bank to be
issued for every 1,000 equity shares of face value of Rs. 2 each of Gruh.
• In April 19, RBI granted its final approval for HDFC to acquire up to 9.9% of the paid-up voting
equity capital of Bandhan Bank upon the effective date of the scheme.
• The scheme of amalgamation remains subject to the approval of the National Company Law
Tribunal
• Market capitalisation (June 30, 2019): ~US$ 3 bn
Associates and Subsidiaries
40
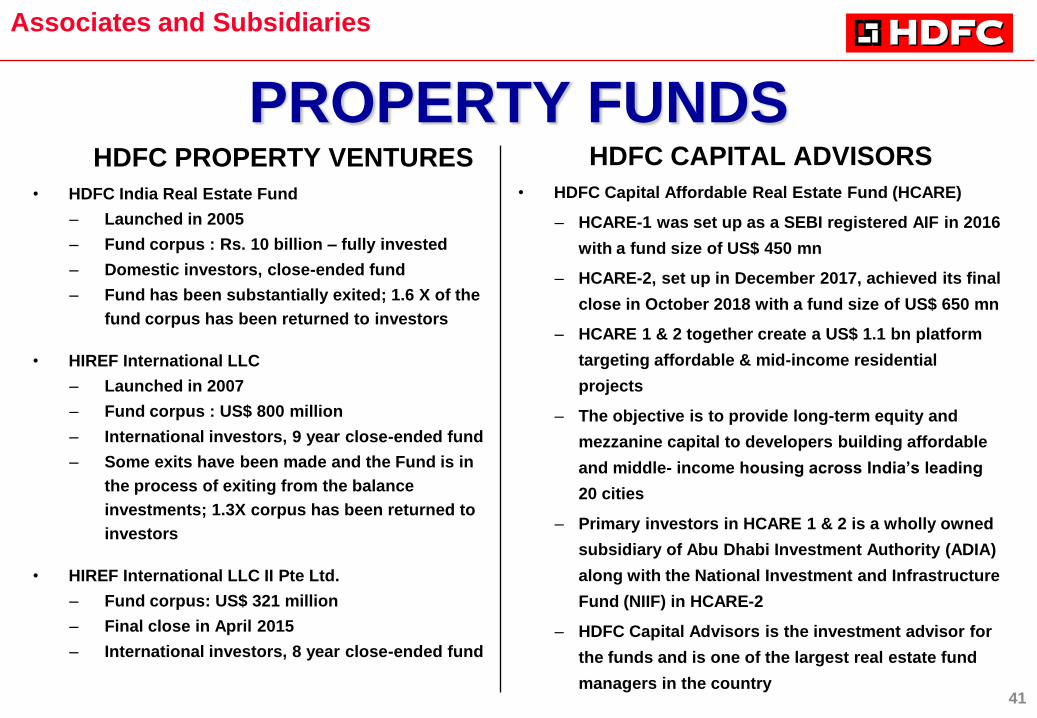
PROPERTY FUNDSHDFC PROPERTY VENTURES
• HDFC India Real Estate Fund
– Launched in 2005
– Fund corpus : Rs. 10 billion – fully invested
– Domestic investors, close-ended fund
– Fund has been substantially exited; 1.6 X of the
fund corpus has been returned to investors
• HIREF International LLC
– Launched in 2007
– Fund corpus : US$ 800 million
– International investors, 9 year close-ended fund
– Some exits have been made and the Fund is in
the process of exiting from the balance
investments; 1.3X corpus has been returned to
investors
• HIREF International LLC II Pte Ltd.
– Fund corpus: US$ 321 million
– Final close in April 2015
– International investors, 8 year close-ended fund
HDFC CAPITAL ADVISORS
• HDFC Capital Affordable Real Estate Fund (HCARE)
– HCARE-1 was set up as a SEBI registered AIF in 2016
with a fund size of US$ 450 mn
– HCARE-2, set up in December 2017, achieved its final
close in October 2018 with a fund size of US$ 650 mn
– HCARE 1 & 2 together create a US$ 1.1 bn platform
targeting affordable & mid-income residential
projects
– The objective is to provide long-term equity and
mezzanine capital to developers building affordable
and middle- income housing across India’s leading
20 cities
– Primary investors in HCARE 1 & 2 is a wholly owned
subsidiary of Abu Dhabi Investment Authority (ADIA)
along with the National Investment and Infrastructure
Fund (NIIF) in HCARE-2
– HDFC Capital Advisors is the investment advisor for
the funds and is one of the largest real estate fund
managers in the country
Associates and Subsidiaries
41
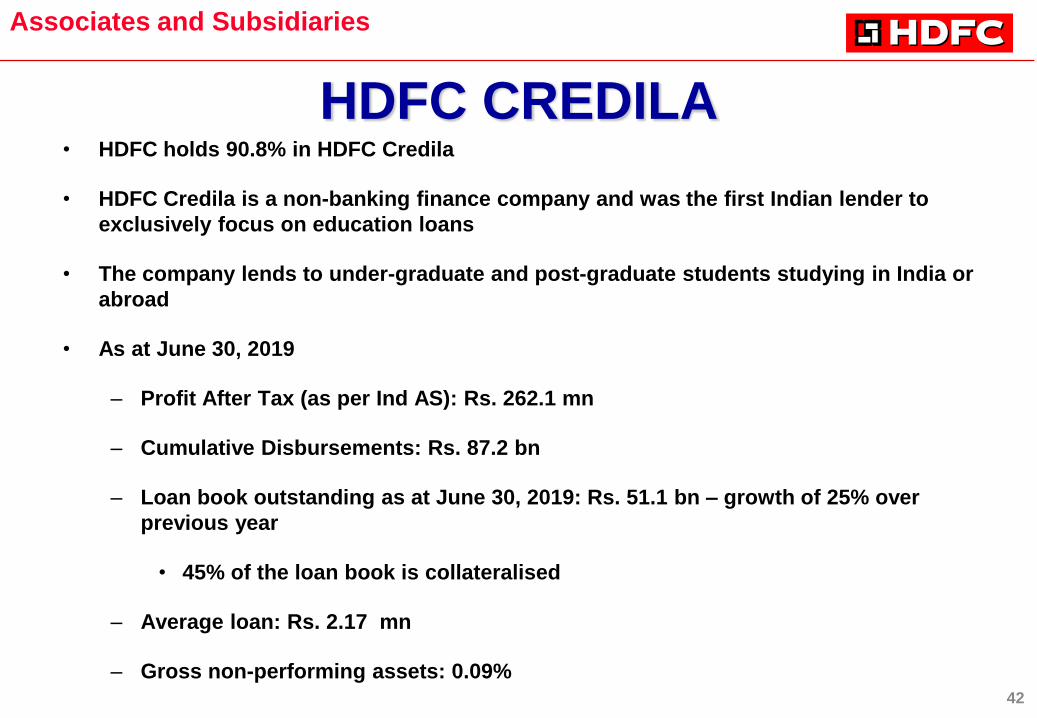
HDFC CREDILA• HDFC holds 90.8% in HDFC Credila
• HDFC Credila is a non-banking finance company and was the first Indian lender to
exclusively focus on education loans
• The company lends to under-graduate and post-graduate students studying in India or
abroad
• As at June 30, 2019
– Profit After Tax (as per Ind AS): Rs. 262.1 mn
– Cumulative Disbursements: Rs. 87.2 bn
– Loan book outstanding as at June 30, 2019: Rs. 51.1 bn – growth of 25% over
previous year
• 45% of the loan book is collateralised
– Average loan: Rs. 2.17 mn
– Gross non-performing assets: 0.09%
Associates and Subsidiaries
42

FINANCIALS Consolidated
(Based on Indian Accounting Standards)

PROFIT AND LOSS ACCOUNT – Q1FY20
Financials: Consolidated
Jun-19 Jun-18 Growth(Rs. in billion) (Rs. in billion) (%)
Interest & Other Operating Income 139.45 122.99 13%
Income from Insurance Business 88.80 72.12
Profit on Sale of Investments 0.03 0.02
Net gain on derecognised (assigned) loans 2.97 1.41
Other Income 1.15 1.19
Total Income 232.40 197.73 18%
Finance Costs 82.07 66.99 23%
Expense from Insurance Business 92.39 79.36
Non-Interest Expenses 15.94 16.58
Provisions 8.96 0.24
Total Expenses 199.36 163.17 22%
Share of profit of associates (equity method) 12.76 9.02
Profit before tax 45.80 43.58 5%
Total tax expense 10.40 10.63
Net Profit after tax 35.40 32.95 7%
Other Comprehensive Income 5.43 (4.64)
Total Comprehensive Income 40.83 28.31 44%
Profit attributable to the Corporation 30.94 29.4244

Mar-19 Mar-18 Growth(Rs. in billion) (Rs. in billion) (%)
Sources of Funds
Shareholders' Funds 1,179.79 968.68 22%
Liabilities pertaining to Insurance Business 1,365.19 1,163.46
Loan Funds 3,867.55 3,364.16 15%
Current Liabilities & Provisions 196.22 169.79
6,608.75 5,666.09 17%
Application of Funds
Loans1 4,283.85 3,817.44 12%
Investments 766.34 535.04
Assets pertaining to Insurance Business 1,410.91 1,187.14
Current Assets, Advances & Fixed Assets 141.40 120.22
Goodwill on Consolidation 6.25 6.25
6,608.75 5,666.09 17%
BALANCE SHEET – FY19
Financials: Consolidated
45
1Net of individual loans sold during the preceding 12 months amounting to Rs 251.50 bn. If these loans were included, the growth in loans would have been 19%.

PROFIT AND LOSS ACCOUNT – FY19
Financials: Consolidated
Mar-19 Mar-18 Growth(Rs. in billion) (Rs. in billion) (%)
Interest & Other Operating Income 506.30 423.69 19%
Income from Insurance Business 441.82 361.78
Profit on Sale of Investments 0.22 3.93
Net gain on derecognised (assigned) loans 8.60 5.34
Other Income 5.01 3.46
Total Income 961.95 798.20 21%
Finance Costs 295.25 247.18 19%
Expense from Insurance Business 442.52 362.03
Non-Interest Expense 65.43 64.84
Provisions 11.66 21.44
Total Expenses 814.86 695.49 17%
Share of profit of associates (equity method) 73.90 59.36
Profit before tax 220.99 162.07 36%
Total tax expense 45.18 30.96
Net Profit after tax 175.81 131.11 34%
Other Comprehensive Income 0.81 (6.06)
Total Comprehensive Income 176.62 125.05 41%
Profit attributable to the Corporation 162.32 119.8046

Mar-19 Mar-18
(Rs. in billion) (Rs. in billion)
HDFC Profit After Tax 96.33 109.59
HDFC Life 6.13 5.46
HDFC ERGO 1.64 1.81
GRUH 2.39 2.21
HDFC Bank 46.70 38.58
HDFC-AMC 4.64 3.69
Others 2.80 2.94
Adjustments:
Profit on Sale of Investments in subsidiaries (14.27) (53.87)
Adjustment on account of dilution of stake
in associates
21.10 20.79
Dividend and Other Adjustments (5.14) (11.40)
Net Profit Attributable to the Corporation 162.32 119.80
CONSOLIDATED PROFIT AFTER TAX – FY19
Financials: Consolidated
47

CONSOLIDATED EARNINGS(As at March 31, 2019)
HDFC Consolidated
Return on Equity 14.2% 15.0%
Return on Average Assets 2.1% 2.5%
Earnings per share (Rs) 57 95
Profit After Tax (Rs in bn) 96.33 162.32
Total Assets (Rs in bn) 4,588 6,609
Financials
48

Thank You
August 5, 2019