- Home | ACT EDUCATION RESEARCH DIGEST. ... (Chen, 2009; Chen & Ho, 2012) Leaky STEM Pipeline. 8 ......
40
www.act.org/epc JULY 17―19, 2017 | SWISSOTEL CHICAGO
Transcript of - Home | ACT EDUCATION RESEARCH DIGEST. ... (Chen, 2009; Chen & Ho, 2012) Leaky STEM Pipeline. 8 ......
www.act.org/epc J U L Y 1 7 ― 1 9 , 2 0 1 7 | S W I S S O T E L C H I C A G O

2
Research Focus II: Insights in Higher Education Research
for Enrollment Managers
Justine Radunzel and Krista MatternACT

3
HIGHER EDUCATION RESEARCH DIGEST
This new ACT publication is an annual report offering meaningful research insights for some of the most pressing questions impacting admissions and enrollment practice.
In the first release of this report, ACT research sheds light on the following topics:
• the practice of super-scoring• STEM major choice• factors impacting retention and transfer• test optional admission policy• benefits for students who opt in to the ACT Educational
Opportunity Service (EOS)
4
• Who will declare a STEM major?
• Retention, Transfer, and Drop Out: Oh My!
• Enrollment Management Dashboard Prototype
Roadmap
5
Who will declare a STEM major?The Role of Achievement and Interests
6
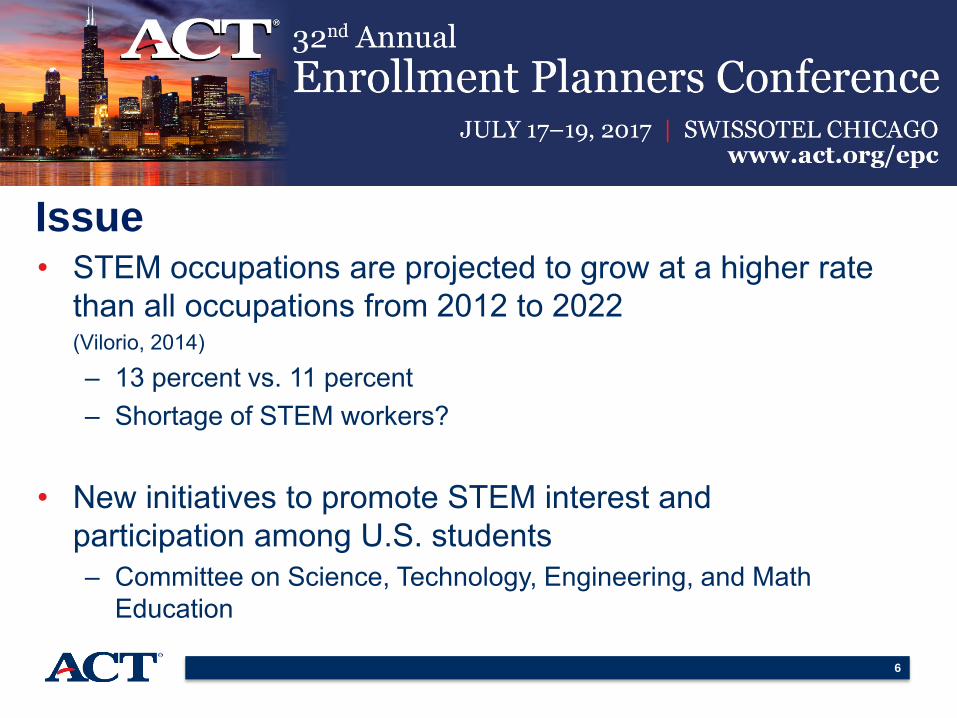
• STEM occupations are projected to grow at a higher rate than all occupations from 2012 to 2022 (Vilorio, 2014)
– 13 percent vs. 11 percent– Shortage of STEM workers?
• New initiatives to promote STEM interest and participation among U.S. students– Committee on Science, Technology, Engineering, and Math
Education
Issue

7
• Interest in STEM is high– 50% of 2016 ACT-tested high school graduates expressing
interest in majoring in STEM or having measured interests in STEM (ACT, 2016)
• STEM enrollment is significantly lower– Fewer than 30% of students actually declare a STEM major in
college (Chen, 2009; Chen & Ho, 2012)
Leaky STEM Pipeline
8
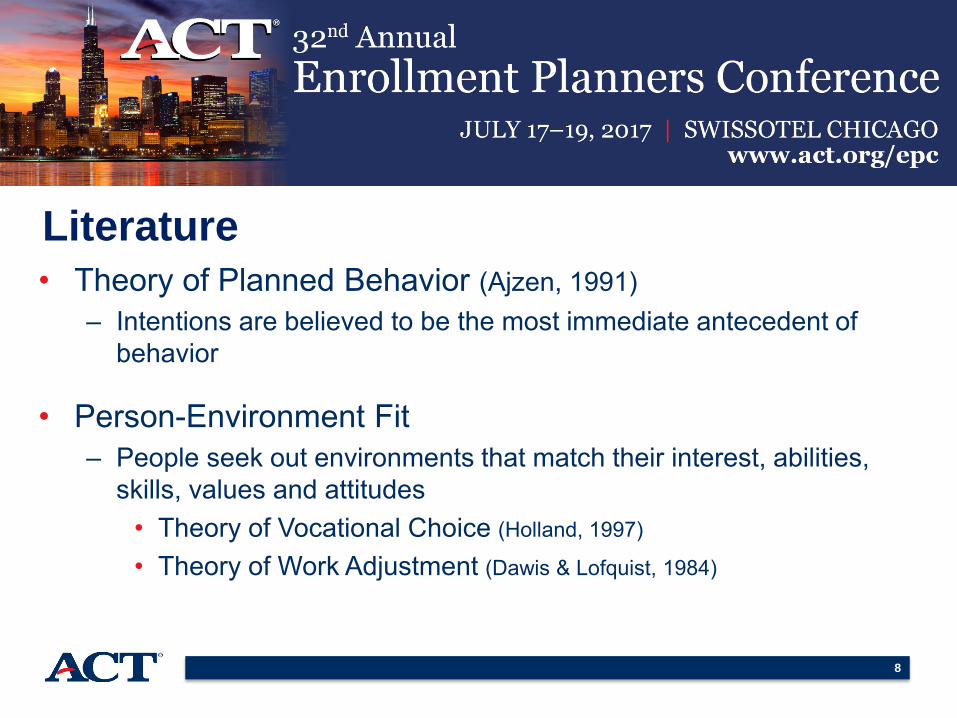
• Theory of Planned Behavior (Ajzen, 1991)– Intentions are believed to be the most immediate antecedent of
behavior
• Person-Environment Fit – People seek out environments that match their interest, abilities,
skills, values and attitudes• Theory of Vocational Choice (Holland, 1997)
• Theory of Work Adjustment (Dawis & Lofquist, 1984)
Literature

9
Academic Fit: STEM Benchmark
Probability of achieving specific first-year college GPAs by ACTSTEM score for STEM majors at a typical four-year institution
(Radunzel et al., 2015)
10
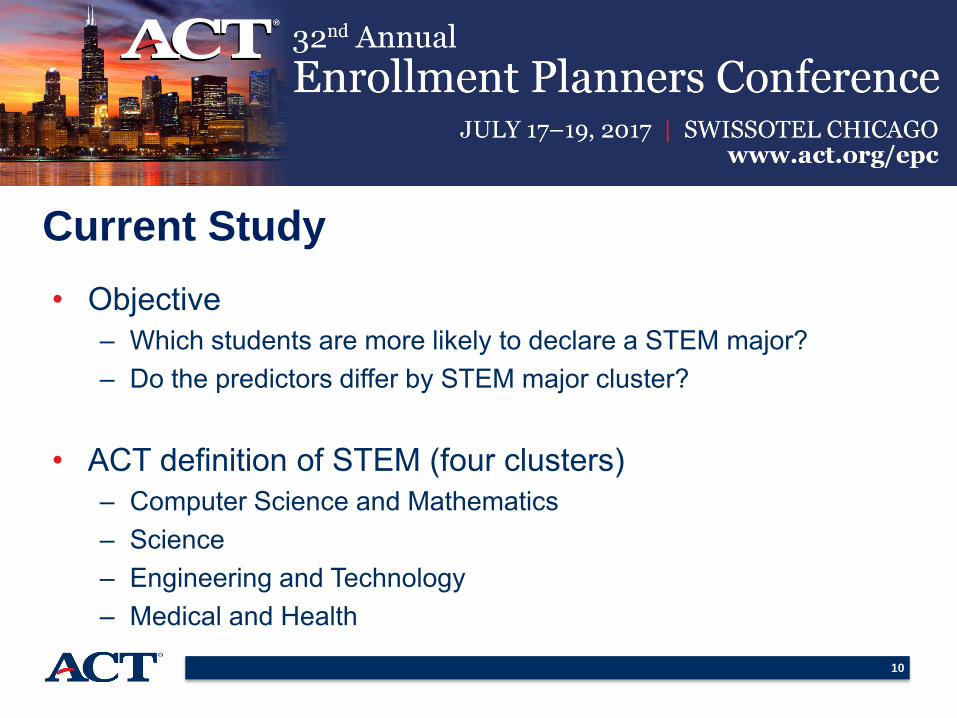
• Objective– Which students are more likely to declare a STEM major?– Do the predictors differ by STEM major cluster?
• ACT definition of STEM (four clusters)– Computer Science and Mathematics– Science – Engineering and Technology– Medical and Health
Current Study
11
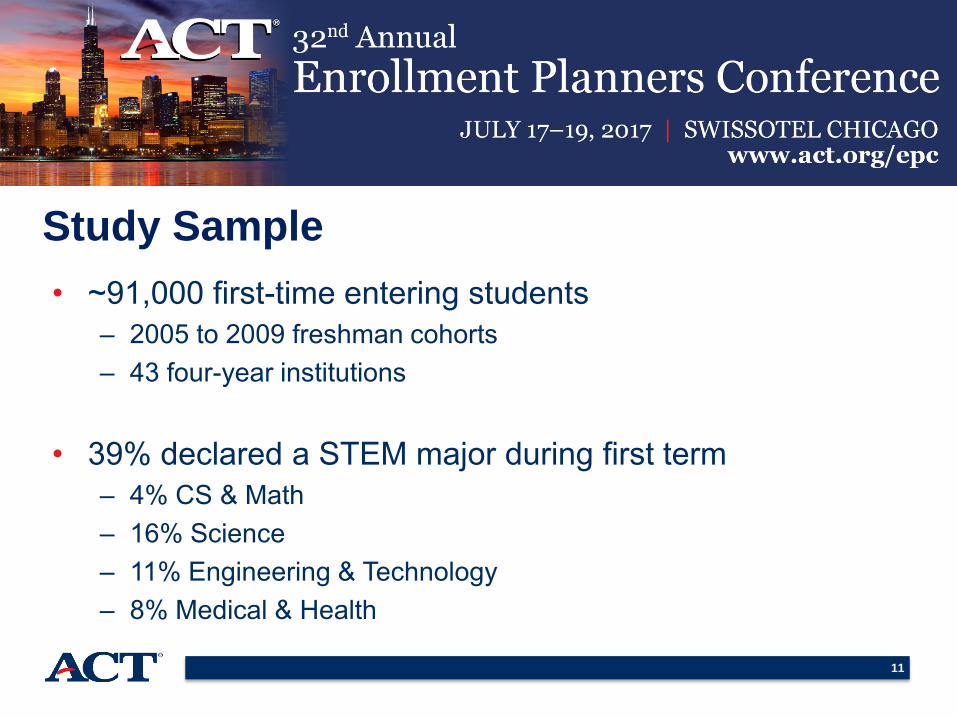
• ~91,000 first-time entering students – 2005 to 2009 freshman cohorts– 43 four-year institutions
• 39% declared a STEM major during first term– 4% CS & Math– 16% Science – 11% Engineering & Technology – 8% Medical & Health
Study Sample
12
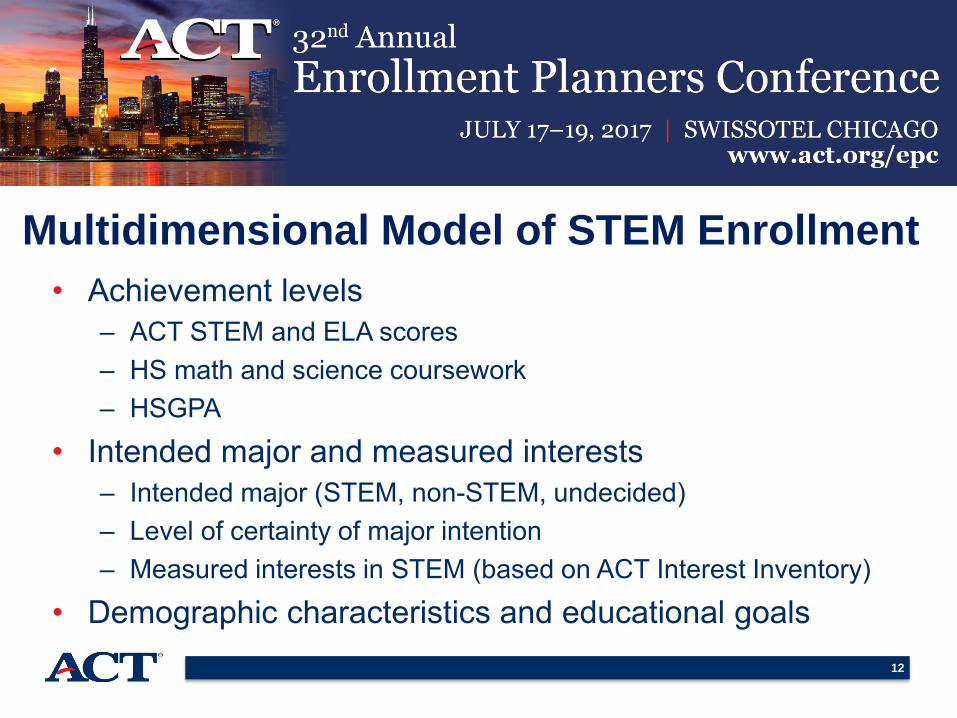
• Achievement levels – ACT STEM and ELA scores– HS math and science coursework– HSGPA
• Intended major and measured interests– Intended major (STEM, non-STEM, undecided) – Level of certainty of major intention– Measured interests in STEM (based on ACT Interest Inventory)
• Demographic characteristics and educational goals
Multidimensional Model of STEM Enrollment

13
STEM Major Choice by Intended Major and Major Sureness
14
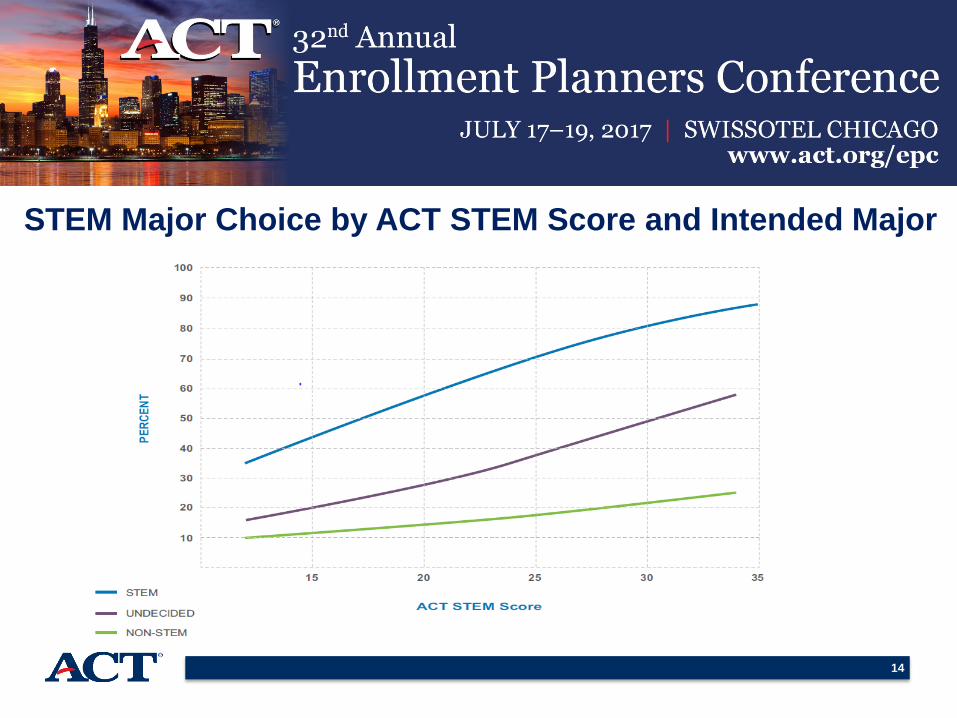
STEM Major Choice by ACT STEM Score and Intended Major

15
The Power of
Three
Probabilities range from 0.78 to 0.92

16
STEM Major Choice by Intended Major and STEM Interest
For students who are very sure about their major intentions

17
Predictors of STEM Major Choice by Cluster (vs. Non-STEM)
Characteristic Sci CS & Math
Eng &Tech
Med & Hlth
Demographic characteristicsFemale ─ ─ +Minority + +HS academic preparation/achievement in mathematics and scienceCalculus + + +ACT STEM score + + +Intended major, interests and educational plansIntended STEM major + + + +Measured STEM interest + + +Beyond bachelor's degree + ─ ─+ indicates more likely, ─ indicates less likely
18
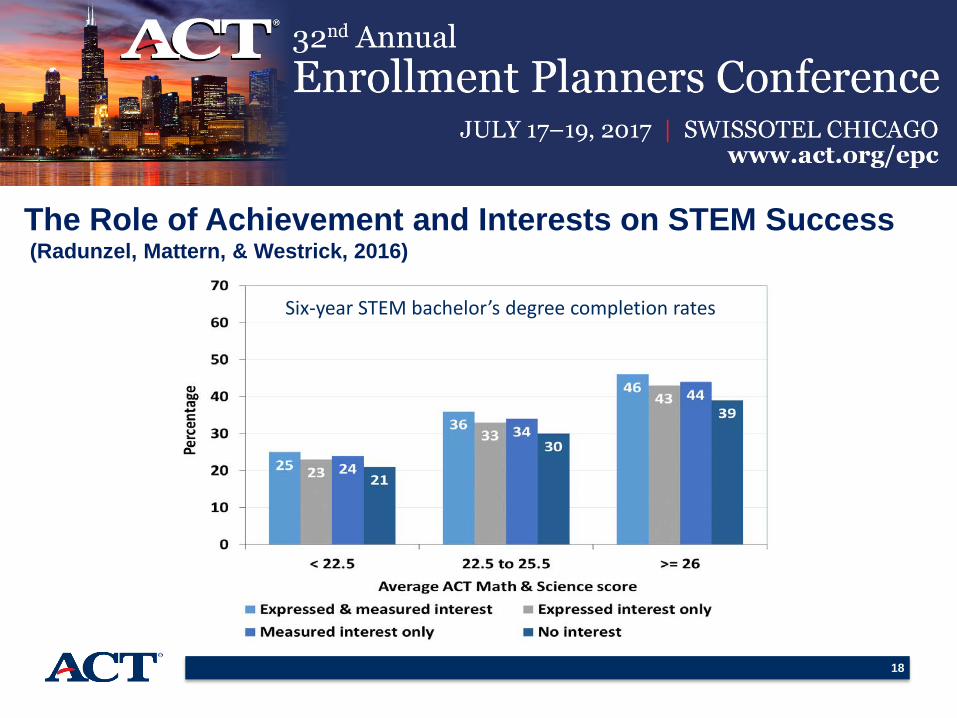
The Role of Achievement and Interests on STEM Success(Radunzel, Mattern, & Westrick, 2016)
Six-year STEM bachelor’s degree completion rates

19
• Institutions can use this information to– Recruit and admit STEM students
• ACT EOS (Equal Opportunity Service) selection to identify specific types of prospective students
• Undecided students with high STEM scores
– Determine resource needs • Lab space, course offerings, etc.
• Foster STEM exploration, interests, and readiness
STEM Major Choice Study Implications
20
Retention, Transfer, and Drop Out:Oh my!
21
• Recent study suggests that only– 60% of four-year students complete a degree from initial
institution within six years (Kena et al., 2016)
– 28% of two-year students complete a degree from initial institution within three years
• Largest share leave initial institution during their first two years (Bradburn, 2002; Tinto, 2012)
Background
22
• Pre-entry attributes– Academic readiness ─ Demographics
• Academic goals and commitments• Institutional experiences• Academic and social integration into college environment
– Living on campus ─ Enrolling full-time– Participating in activities ─ Attending closer to home– Attending institution that matches preferences
• External commitments (Tinto, 1975; 1993)
Factors Related to Student Retention

23
• Early identification of at-risk students in need of institutional services and supports (Tampke, 2013)
– Identify those that may not return in year 2 • Academic jeopardy• Difficult assimilating into college environment
– Based on holistic view of student readiness and needs
Early Alert/Warning Systems
24
• Objective – Examine the use of incoming student information from ACT
record for early identification of at-risk students– Determine where transfer students are going
• Study Sample– More than 630,000 first-time entering students
• 2014 freshman cohort• Nearly 1,150 two- and four-year institutions with at least 50% ACT-tested
– Tracked through fall 2015 using NSC data
Current Study
25
• Fall-to-fall retention at year 2 – multinomial outcome• Returned to initial institution• Transferred to another institution• Dropped out (not enrolled in college)
• Type of institution transferred to year 2 – binary outcome• Four-year sample: reverse vs. lateral transfer
– “Transferred down” from 4-year to 2-year (vs. 4- to 4-year)
• Two-year sample: vertical vs. lateral transfer– “Transferred up” from 2-year to 4-year (vs. 2- to 2-year)
Study Outcomes

26
Retention and Attrition Rates
27
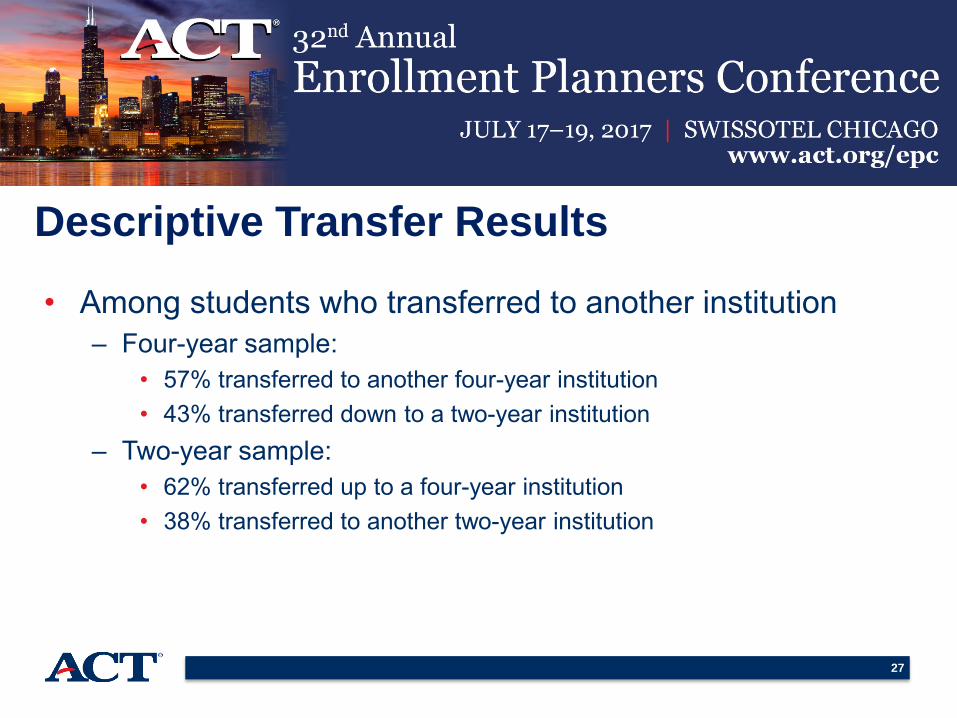
• Among students who transferred to another institution– Four-year sample:
• 57% transferred to another four-year institution• 43% transferred down to a two-year institution
– Two-year sample:• 62% transferred up to a four-year institution• 38% transferred to another two-year institution
Descriptive Transfer Results
28
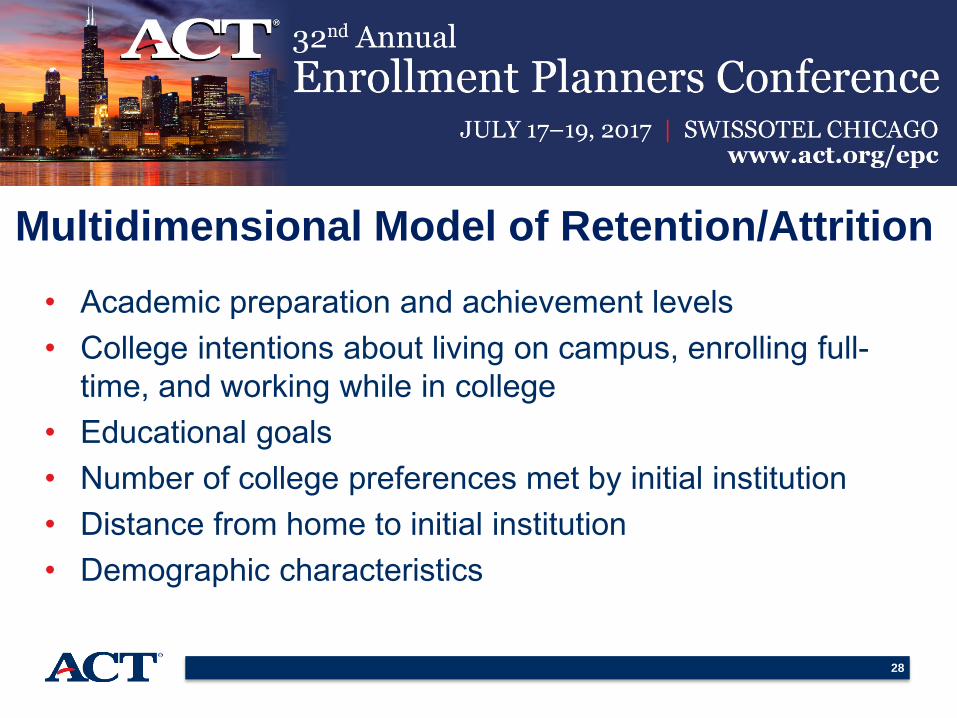
• Academic preparation and achievement levels • College intentions about living on campus, enrolling full-
time, and working while in college• Educational goals• Number of college preferences met by initial institution• Distance from home to initial institution• Demographic characteristics
Multidimensional Model of Retention/Attrition

29
Retention and Attrition Rates by ACT Score
30
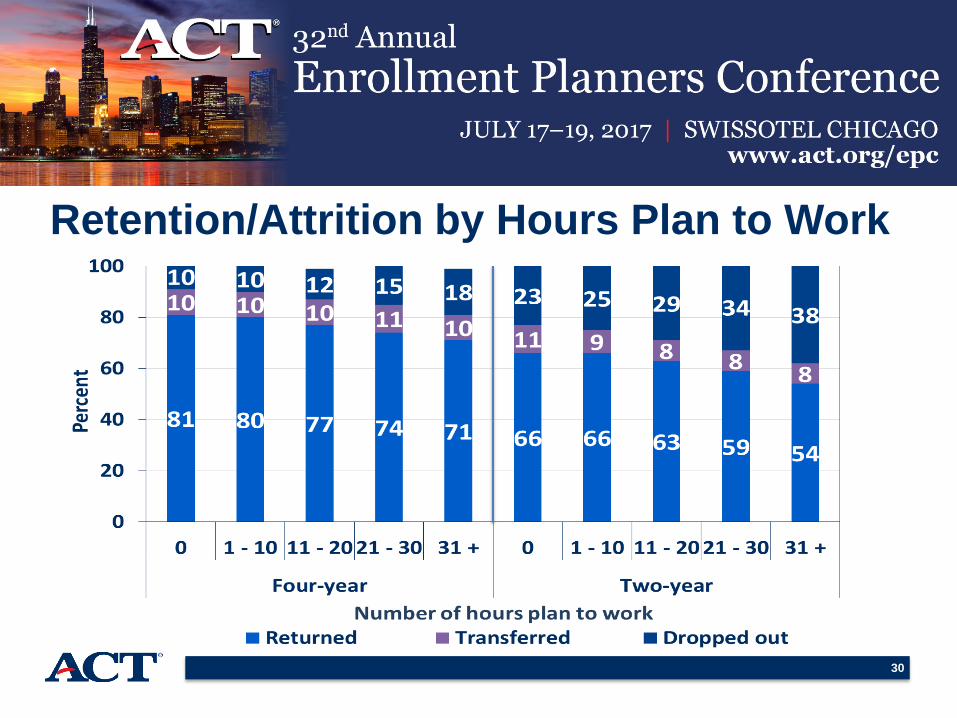
Retention/Attrition by Hours Plan to Work

31
Retention/Attrition by College Preferences

32
Retention/Attrition Rates by Distance from HomeFour-year institutions Two-year institutions
33
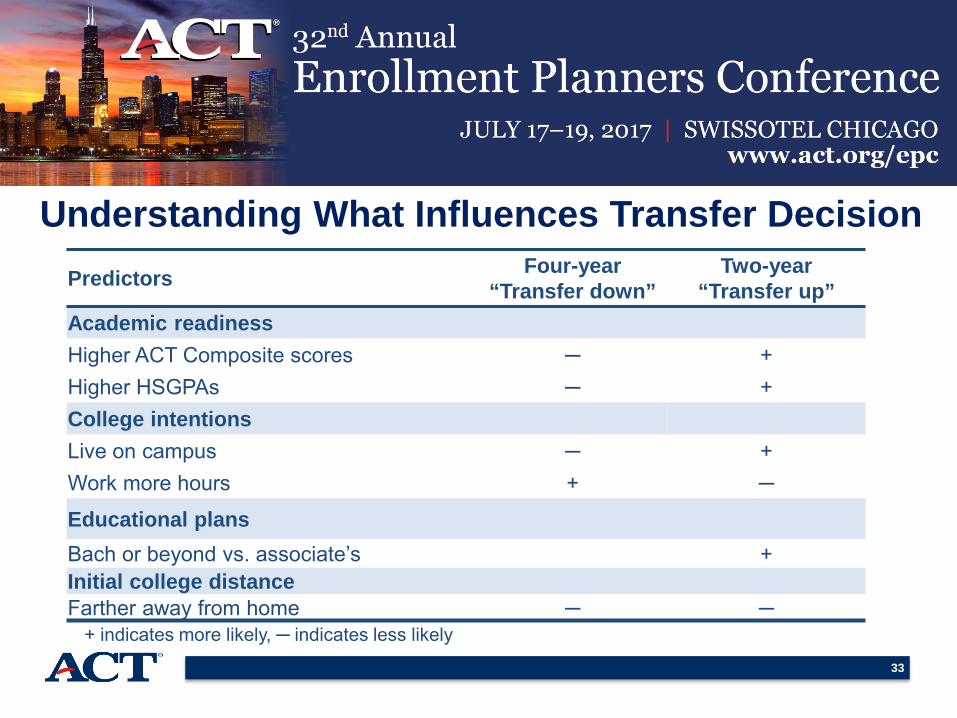
Understanding What Influences Transfer DecisionPredictors Four-year
“Transfer down”Two-year
“Transfer up”Academic readinessHigher ACT Composite scores ─ +Higher HSGPAs ─ +College intentionsLive on campus ─ +Work more hours + ─
Educational plansBach or beyond vs. associate’s +Initial college distanceFarther away from home ─ ─
+ indicates more likely, ─ indicates less likely

34
Understanding What Influences Transfer DecisionDemographic characteristics Four-year
“Transfer down”Two-year
“Transfer up”GenderMale vs. female +Race/ethnicityHispanic vs. White + ─Median household incomeLow vs. high + ─Medium vs. high ─Parents’ education levelNo college vs. graduate degree + ─Some college vs. graduate degree + ─Bach degree vs. graduate degree + ─+ indicates more likely, ─ indicates less likely
35
• Among students who transferred to another institution– Four-year sample:
• Fewer college preferences typically met by second institution• Typically transferred closer to home
– Two-year sample:• More college preferences typically met by second institution• Typically transferred farther from home
– Primarily for those who transferred up to a four-year institution
Descriptive Transfer Results
36
• Institutions can use this information to– Augment their early alert/warning systems– Incorporate it into student-level dashboards– Inform their retention strategies– Learn more about incoming students using other data available on
the ACT student record– Inform/implement transfer strategies/policies that help students
achieve their educational goals
Retention Study Implications

37
Enrollment Management Dashboard Prototype

38
• National College Success Research Partnership Opportunity
• ELA and Writing Scores Research Opportunity
• International Student College Success Initiative– Contact Justine Radunzel at [email protected]
ACT Research Partnership Opportunities

39
ACT. (2016). The Condition of STEM 2016. Iowa City, IA: ACT, Inc.Ajzen, I. (1991). "The theory of planned behavior". Organizational Behavior and Human Decision
Processes, 50 (2): 179–211. Bradburn, E. M. (2002). Short-term enrollment in postsecondary education: Student background
and institutional differences in reasons for early departures, 1996-98. (NCES 2003-153). Washington, DC: National Center for Education Statistics.
Chen, X. (2009). Students Who Study Science, Technology, Engineering, and Mathematics (STEM) in Postsecondary Education. (NCES 2009-161). National Center for Education Statistics, Institute of Education Sciences, U.S. Department of Education. Washington, DC.
Chen, X., & Ho, P. (2012). STEM in postsecondary education: Entrance, attrition, and course taking among 2003-2004 beginning postsecondary students. (NCES Report No. 2013-152). National Center for Education Statistics, U.S. Department of Education. Washington, DC.
Dawis, R. V., & Lofquist, L. H. (1984). A psychological theory of work adjustment. Minneapolis: University of Minnesota Press.
Holland, J. L. (1997). Making vocational choices: A theory of vocational personalities and work environments. (3rd ed.). Odessa, FL: Psychological Assessment Resources.
Kena, G., Hussar W., McFarland J., de Brey C., Musu-Gillette, L., Wang, X., …, Dunlop Velez, E. (2016). The Condition of Education 2016 (NCES 2016-144). Washington, DC: U.S. Department of Education, National Center for Education Statistics.
References

40
Radunzel, J. Using incoming student information to identify students at-risk of not returning to their initial institution in year two. (ACT Working Paper No. 2016-4). Iowa City, IA: ACT, Inc.
Radunzel, J., Mattern, K., Crouse, J., & Westrick, P. (2015). Development and validation of a STEMbenchmark based on the ACT STEM score. (ACT Technical Brief). Iowa City, IA: ACT, Inc.
Radunzel, J., Mattern, K., & Westrick, P. (2016). The role of academic preparation and interest in STEM success (ACT Research Report No. 2016-8). Iowa City, IA: ACT, Inc.
Radunzel, J., Mattern, K., & Westrick, P. (2017). Who will declare a STEM major? The role of achievement and interests (ACT Research Report No. 2017-4). Iowa City, IA: ACT, Inc.
Tampke, D.R. (2013). Developing, implementing, and assessing an early alert system. Journal of College Student Retention: Research, Theory, and Practice, 14(4), 523-532.
Tinto, V. (1975). Dropout from higher education: A theoretical synthesis of recent research. Review of Educational Research, 45, 89–125.
Tinto, V. (1993). Leaving college: Rethinking the cause and cures of student attrition (2nd ed.). Chicago: The University of Chicago Press.
Tinto, V. (2012). Completing college: Rethinking institutional action. Chicago: The University of Chicago Press.
Vilorio, D. (2014). STEM 101: Intro to tomorrow’s jobs. Occupational Outlook Quarterly, 58(1), 2–12.
References continued