Historical Review of External Impacts On the University - Vision III Funding Plan - 1995 - MHEC...
15
-
Upload
roger-bates -
Category
Documents
-
view
213 -
download
0
Transcript of Historical Review of External Impacts On the University - Vision III Funding Plan - 1995 - MHEC...


Historical Review of External Impacts On the University
- Vision III Funding Plan - 1995
- MHEC Accountability Report - 1996
- Maryland Higher Education Commission MFR- 1999
- Peer Funding Guidelines – 2000 SU Enrollment Trends
- Headcount, age, residence, part-time/full-time, diversity,
graduate programs Funding Issues
- Guideline Funding, Financial Aid Enrollment Projections, Undergraduate and Graduate
- Application and Acceptance Rates
- Enrollment Potential from HS and CC’s

Salisbury UniversityFall Headcount 1989-2002
607
551575
625 633650 674 653
631546 524
538
622645
6,2065,883
5,5365,5345,3915,2945,3365,3985,3235,3975,3095,183
4,840
6,060
3,500
4,000
4,500
5,000
5,500
6,000
6,500
7,000
1989 1990 1991 1992 1993 1994 1995 1996 1997 1998 1999 2000 2001 2002
Undergraduate Graduate

Undergraduates by AgeFall 2002
51%
38%
5%
6%
<20
21-24
25-29
30+
Undergraduates by Residence Fall 2002
Western Shore
51%
International
1%Out-of-State
17%Eastern Shore
31%
Undergraduates by Attendance Status
Fall 1998 - Fall 2002
0
1000
2000
3000
4000
5000
6000
1998 1999 2000 2001 2002
UG
He
ad
cou
nt
81.0%82.0%83.0%84.0%85.0%86.0%87.0%88.0%
Full-time
Part-time
% Full-time

Salisbury UniversityUG Financial Aid by Type & Percent of UG Receiving Aid
AY1996-97 through AY2000-01
$0
$5
$10
$15
$20
1996-19971997-19981998-19991999-20002000-2001
Fin
anci
al A
id $
(in
m
illio
ns
)
0%10%20%30%40%50%60%70%80%90%100%
% U
G r
ece
ivin
g
fin
anci
al a
id
Grants Loans Scholarships % of UG Receiving Aid
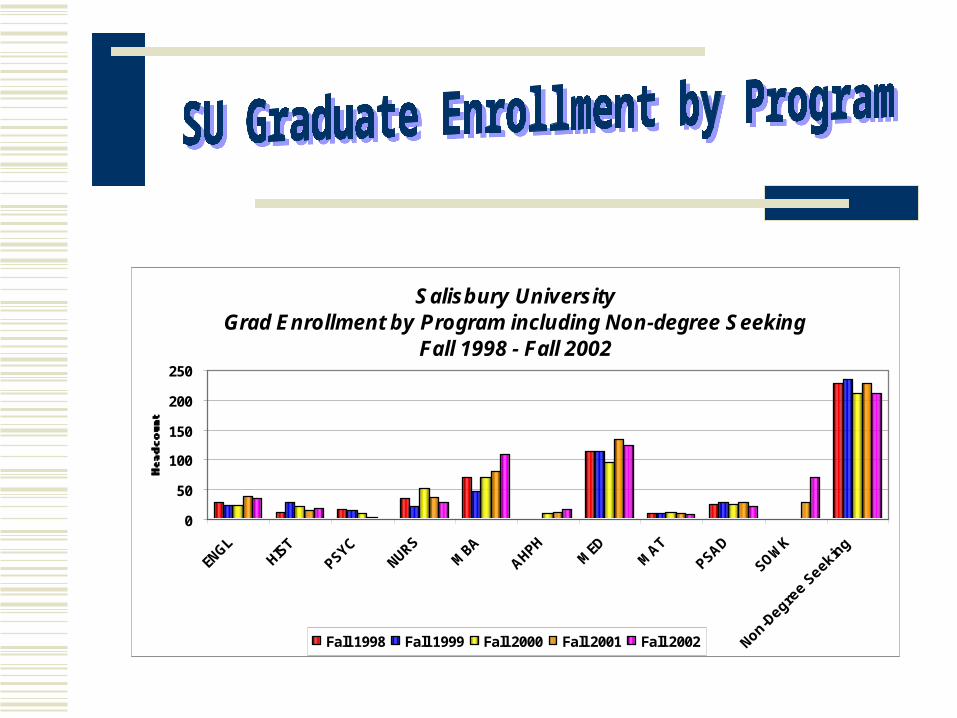
Salisbury UniversityGrad Enrollment by Program including Non-degree Seeking
Fall 1998 - Fall 2002
0
50
100
150
200
250
ENGL
HIST
PSYCNURS
MBA
AHPHM
EDM
AT
PSAD
SOWK
Non-Degre
e Seekin
g
Degree ProgramFall 1998 Fall 1999 Fall 2000 Fall 2001 Fall 2002

Mandated by Governor Parris N. Glendening and administrated by the Department of Budget and Management
A mission-driven list of goals and objectives, some mandated and others chosen by SU
Contains core indicators from the MHEC Accountability Report
Not currently tied to funding, but could have negative repercussions if goals are not met

From the 2002 Update of the Maryland State Plan for Postsecondary Education…
- “Minority students at Maryland campuses has soared 50% in the last 10 years and represents all of the enrollment
growth in the state during this period.”
- “Currently, minorities constitute 35% of Maryland college students, compared to 25% nationally.”
Minority Enrollments at SU…
- Fall 2002 minority enrollment…12.6% (MFR)
- Fall 2002 African-American enrollment…8.4% (MFR)

Introduced by the Maryland Higher Education Commission Although not practiced equitably, funding awarded to institutions
based on A target appropriation of the 75th percentile of funding peers.
If fully funded, institutions would be at 100% of guideline. Enrollment-relevant indicators include
SAT 25th and 75th percentiles Percent of minority and African-American undergraduates Retention and graduation rates of African-American,
minority, and all students Acceptance rates Average high school GPA Student to faculty ratio

Salisbury UniversityComparison of Guideline Funding Among USM Institutions and
Percent of Gudieline ReceivedFY2003
$29,
477
$13,
342
$8,4
70
$7,6
82
$7,5
86
$7,2
28
$6,8
92
$6,5
79
$5,0
75
$5,0
61
$1,2
43
81%
69%78%
86%
76%
63%
86%
69%
54%
74%
85%
$0
$5,000
$10,000
$15,000
$20,000
$25,000
$30,000
UMB UMCP UMBC UB UMES CSC BSU FSU TU SU UMUC
USM Institution
Gu
ide
lin
e
Fu
nd
ing
pe
r F
TE
S
0%10%20%30%40%50%60%70%80%90%100%
Pe
rce
nt
of
Gu
ide
lin
e
Approp/FTES % of guideline
Ave = 75%

Fall Enrollment Projected Headcount
Salisbury University
10-Year Enrollment Projec tions as Submitted to USM in May 2002
6,060 6,206 6,471 6,661 6,851 7,011 7,171 7,311 7,431 7,550 7,669
622 645 655 673 691 715 739 769 794 814 814
5,0005,5006,0006,5007,0007,5008,0008,5009,000
2001 2002 2003 2004 2005 2006 2007 2008 2009 2010 2011
Hea
dcou
nt E
nrol
lmen
t
Graduate Undergraduate

Salisbury UniversityApplications for First-time Enrollment and Acceptance Rate
Fall 1998 through Fall 2002
4,000
4,500
5,000
5,500
1998 1999 2000 2001 2002
Appl
icat
ions
45%
50%
55%
60%
65%
Acce
ptan
ce
Rate
Applications Acceptance Rate

State of MarylandActual and Projected High School Seniors
Fall 2001 through Fall 2010
48,000
50,000
52,000
54,000
56,000
58,000
60,000
62,000
2001 2002 2003 2004 2005 2006 2007 2008 2009 2010
Stu
de
nts
Actual
Projected
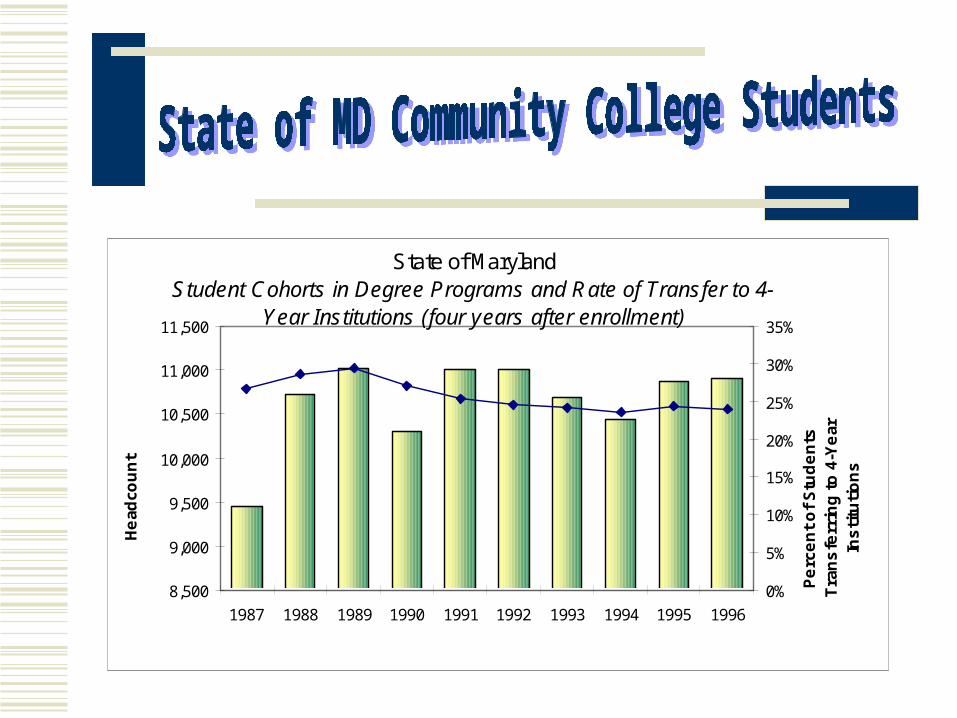
State of MarylandStudent Cohorts in Degree Programs and Rate of Transfer to 4-
Year Institutions (four years after enrollment)
8,500
9,000
9,500
10,000
10,500
11,000
11,500
1987 1988 1989 1990 1991 1992 1993 1994 1995 1996
He
adco
un
t
0%
5%
10%
15%
20%
25%
30%
35%
Pe
rce
nt
of
Stu
de
nts
T
ran
sfe
rrin
g t
o 4
-Ye
ar
Ins
titu
tio
ns

State of Maryland Community College Enrollment Projections
Fall 2001 through Fall 2011
100,000
105,000
110,000
115,000
120,000
125,000
130,000
Fall2001
Fall2002
Fall2003
Fall2004
Fall2005
Fall2006
Fall2007
Fall2008
Fall2009
Fall2010
Fall2011
Stu
de
nts
Actual
Projected